farmers' perception and adaptation strategies to
103
FARMERS’ PERCEPTION AND ADAPTATION STRATEGIES TO CLIMATE CHANGE: THE CASE OF WOREILLU DISTRICT OF AMHARA REGION, NORTHEASTERN ETHIOPIA MSc THESIS BEWUKETU MINWUYE NOVEMBER 2017 HARAMAYA UNIVERSITY, HARAMAYA
-
Upload
khangminh22 -
Category
Documents
-
view
3 -
download
0
Transcript of farmers' perception and adaptation strategies to

FARMERS’ PERCEPTION AND ADAPTATION STRATEGIES TO
CLIMATE CHANGE: THE CASE OF WOREILLU DISTRICT OF
AMHARA REGION, NORTHEASTERN ETHIOPIA
MSc THESIS
BEWUKETU MINWUYE
NOVEMBER 2017
HARAMAYA UNIVERSITY, HARAMAYA

Farmers’ Perception and Adaptation Strategies to Climate Change: The
Case of Woreillu District of Amhara Region, Northeastern Ethiopia
A Thesis Submitted to the School of Agricultural Economics and
Agribusiness, Postgraduate Program Directorate
HARAMAYA UNIVERSITY
In Partial Fulfillment of the Requirements for the Degree of
COLLABORATIVE MASTER IN AGRICULTURAL AND APPLIED
ECONOMICS
Bewuketu Minwuye
November 2017
Haramaya University, Haramaya

ii
APPROVAL SHEET
POSTGRADUATE PROGRAM DIRECTORATE
HARAMAYA UNIVERSITY
We hereby certify that we have read and evaluated this Thesis entitled “Farmers’ perception
and adaptation strategies to climate change: The case of Woreillu district of Amhara
Region, Northeastern Ethiopia” prepared under our guidance by Bewuketu Minwuye Zeru.
We recommend that it be submitted as fulfilling the thesis requirement.
Degye Goshu (PhD) _____________________ _______________________
Major Advisor Signature Date
Mengistu Ketema (PhD) ______________________ _______________________
Co-advisor Signature Date
As a member of the Board of Examiners of the M.Sc. Thesis Open Defense Examination, we
certify that we have read and evaluated the Thesis prepared by Bewuketu Minwuye Zeru and
examined the candidate. We recommended that the thesis be accepted as fulfilling the Thesis
requirements for the Degree of Collaborative Master in Agricultural and Applied Economics.
__________________ ______________________ ________________
Chairperson Signature Date
___________________ _______________________ ________________
Internal Examiner Signature Date
___________________ ________________________ ________________
External Examiner Signature Date

iii
DEDICATION
I dedicated this thesis manuscript to my father Minwuye Zeru who devoted his entire life for
his children’s success but unlucky to see their victory. He was an amazing farmer who was a
bright minded and highly encouraged to enroll his children’s even though he himself did not
attend any formal education. Dad, your visionary spirit is always with us and became strength
to us to realize your dreams. May God put your soul in heaven.
iv
STATEMENT OF THE AUTHOR
By my signature below, I declare and affirm that this Thesis is my own work. I have followed
all ethical and technical principles of scholarship in preparation, data collection, data analysis
and compilation of this Thesis. Any scholarly matter that is included in the Thesis has been
given recognition through citation.
This Thesis is submitted in partial fulfillment of the requirements for a Collaborative Master in
Agricultural and Applied Economics at the Haramaya University. The Thesis is deposited in
the Haramaya University Library and is made available to borrowers under the rules of the
Library. I solemnly declare that this Thesis has not been submitted to any other institution
anywhere for the award of any academic degree, diploma or certificate.
Brief quotations from this Thesis may be made without special permission provided that
accurate and complete acknowledgement of the source is made. Requests for permission for
extended quotations from or reproduction of this Thesis in whole or in part may be granted by
the Head of the school or Department when in his or her judgment the proposed use of the
material is in the interest of scholarship. In all other instances, however, permission must be
obtained from the author of the Thesis.
Name: Bewuketu Minwuye Signature: _________________
Date: ________________

v
BIOGRAPHICAL SKETCH
The author was born in 1988 in Hullet Ejju Enessie District, East Gojjam Zone of Amhara
Region of Ethiopia. He attended his elementary education at Adasha and Motta elementary
Schools. He also attended his secondary and preparatory education at Motta preparatory and
Senior Secondary School. After successful completion of his preparatory school education, he
joined Jimma University in 2007/2008 and graduated with BSc degree in Agricultural
Economics in June 2010 with distinction. After his graduation, he joined Bench Maji Zone
Marketing and Cooperatives Department as cooperatives organization and promotion expert
and served from 2010 to March 2012. During this time he got the chance to work with
different governmental and non-governmental organizations serving as a focal person and
projects coordinator at zonal level. He then joined Wollo University as Graduate Assistant in
March 2012. He also served as head department of Agricultural economics in the same
University. After two year of service in Wollo University, he joined Haramaya University in
2015 to pursue his MSc degree in Agricultural and Applied Economics.

vi
ACKNOWLEDGEMENTS
First and foremost, my special thank deserved to Almighty God with his mother Saint Virgin
Mary for his mercy, benevolence, absolute love and care throughout all dimensions of my life.
I would like to extend my sincere and deepest thank to my major advisor Dr. Degye Goshu for
his skillful advice, enthusiastic encouragement and invaluable comments beginning from the
inception of the proposal to the final write up of this thesis. I have also learnt many things
from him in addition to the concern of this thesis. I am grateful for all that he did for me. My
unreserved thank also goes to my co-advisor Dr. Mengistu Ketema for his constructive
comments, intimate follow up, patience and unconditional devotion of his time. I am indebted
for his tremendous supports he made for me. I am also grateful for all staff members of
Haramaya University School of Agricultural Economics and Agribusiness for all generous
cooperation they offer me in all circumstances.
My special gratefulness deserves to my mother Workie Chekol who is the base for all my
achievements in my life. She put the milestone and made untold sacrifices for today‟s success
of me. I am also highly indebted to my brothers Tsegaw Minwuye and Mequannint Minwuye
for their guidance, intimate follow up and encouragement. They in fact took over the
responsibility of nurturing me following the death of my father. They always worry and live
for me than I do. They are normally the spice of my life without them life seems impossible. I
just cannot thank you enough.
I am grateful to African Economic Research Consortium (AERC) for the provision of financial
grant for this thesis. I am also thankful to Wollo University for allowing me to pursue my MSc
study. Besides, I owe special thank to my enumerators, Ato Moges Meshesha and the 155
respondents for devoting their time during data collection.
Last, but not least, I am very much thankful to my friends Simeneh, Wubshet, Moges,
Antehungn, Temesgen, Lamesgin, Seble, Maru and Samuel for sharing academic lessons and
for all memorable times we have spent together.

vii
ACRONYMS AND ABBREVIATIONS
AEO African Economic Outlook
CRGE Climate Resilient Green Economy
CSA Central Statistics Agency
EPCC Ethiopia Policy for Climate Change
FAO Food and Agriculture Organization
GHGs Greenhouse Gases
GTP Growth and Transformation Plan
IIA Independence of Irrelevant Alternatives
IPCC Intergovernmental Panel on Climate Change
MNL Multinomial Logit
MVP Multivariate Probit
MoA Ministry of Agriculture
MSL Maximum Simulated Likelihood
NBE National Bank of Ethiopia
NGO Non-Governmental Organization
NMA National Meteorological Agency
PANE Poverty Action Network Ethiopia
SWC Soil and Water Conservation
TLU Tropical Livestock Unit
WDADO Woreillu District Agriculture Development Office

viii
TABLE OF CONTENTS
STATEMENT OF THE AUTHOR iv
BIOGRAPHICAL SKETCH v
ACKNOWLEDGEMENTS vi
ACRONYMS AND ABBREVIATIONS vii
LIST OF TABLES xi
LIST OF FIGURES xii
LIST OF TABLES IN THE APPENDICES xiii
ABSTRACT xiv
1. INTRODUCTION 1
1.1. Background of the Study 1
1.2. Statement of the Problem 3
1.3. Research Questions 5
1.4. Objectives of the Study 5
1.5. Significance of the Study 5
1.6. Scope and Limitations of the Study 6
1.7. Organization of the Thesis 6
2. LITERATURE REVIEW 8
2.1. Definitions and Basic Concepts 8
2.2. Overview of Climate Change 10
2.2.1. Cause of climate change 11
2.2.2. Climate change impact 12
2.3. Climate Change in Ethiopia 12
2.3.1. Climate change and agricultural sector in Ethiopia 13
2.3.2. Projected climate change in Ethiopia 15

ix
TABLE OF CONTENTS (Continued)
2.4. Perception and Adaptation to Climate Change 16
2.4.1. Climate change perception 16
2.4.2. The basics of adaptation and adaptation strategies to climate change 17
2.5. Review of Empirical Literature 19
2.5.1. Farmers‟ perception to climate change 19
2.5.2. Adaptation strategies to climate change and their determinants 20
2.6. Conceptual Framework of the Study 26
3. RESEARCH METHODOLOGY 28
3.1. Description of the Study Area 28
3.2. Sampling Techniques 29
3.3. Methods of Data Collection 31
3.4. Methods of Data Analysis 31
3.4.1. Analysis of perception to climate change and adaptation options 31
3.4.2. Determinants of choice of adaptation strategies 32
3.5. Definition and Measurement of Variables and Working Hypothesis 34
4. RESULTS AND DISCUSSION 43
4.1. Characteristics of Sample Households 43
4.2. Farmers’ Perception to Climate Change 48
4.2.1. Perception on temperature changes 48
4.2.2. Perception on rainfall changes 50
4.2.3. Likert rating scale result of climate change perception of farmers 51
4.3. Climate Change Adaptation Strategies 53
4.4. Determinants of Farmers’ Choice of Adaptation Strategies 56
5. SUMMARY, CONCLUSIONS AND RECOMMENDATIONS 63
5.1. Summary and Conclusions 63

x
TABLE OF CONTENTS (Continued)
5.2. Recommendations 65
6. REFERENCES 67
7. APPENDICES 76
7.1. Appendix I: Appendix Tables 76
7.2. Appendix II: Questionnaire for Interview Schedule 77
7.3. Appendix III: Guiding Questions for Focus Group Discussion 87

xi
LIST OF TABLES
Table Page
1: Distribution of sample households across sample kebeles in the district 30
2: Summary of definition, measurement and hypothesis of explanatory variables 42
3: Summary of household characteristics 43
4: Institutional characteristics of sample households 44
5: Comparison for household characteristics amongst adaptation strategies 46
6: Comparison for institutional characteristics amongst adaptation strategies 47
7: Perception of farmers on annual average temperature during the last 24 years 49
8: Perception of farmers on annual average rainfall during the last 24 years 51
9: Climate change perception index of farmers for the last 24 years (%) 53
10: Summary of adaptation strategies used by farmers 54
11: Correlation matrix of adaptation strategies from the MVP model 55
12: Multivariate probit results of farmers‟ climate change adaptation decisions 57

xii
LIST OF FIGURES
Figure Page
1: Conceptual framework 27
2: Map of the Woreillu District 29
3: Trend of average annual temperature (0C) in Woreillu District from 1993-2016 49
4: Trend of average annual rainfall (mm) in Woreillu District from 1993-2016 50

xiii
LIST OF TABLES IN THE APPENDICES
Appendix Table Page
1: Conversion factors used to calculate Tropical Livestock Units (TLU) 76
2: Conversion factor used to calculate man-equivalent (ME) 76
3: Long-term climate data of Woreillu District from 1993-2016 77

xiv
Farmers’ Perception and Adaptation Strategies to Climate Change: The Case of
Woreillu District of Amhara Region, Northeastern Ethiopia
ABSTRACT
Climate change has adversely affected the livelihoods of people in developing countries where
a large proportion of the population is heavily dependent on agriculture. Severe and repeated
rise in temperature and rainfall failures caused loss of crops and livestock which resulted in
food insecurity in Ethiopia. This study aims to investigate farmers’ perception and adaptation
strategies to climate change in Woreillu District. Both qualitative and quantitative data
obtained using primary and secondary sources. The primary data were collected from 155
randomly selected respondents through interview while the qualitative data using five focus
group discussions. Secondary data on temperature and rainfall for the period 1993-2016 were
also gathered from National Meteorological Agency Kombolcha sub-office. Descriptive
statistics and Likert scale measurement were used to analyze perception of farmers and
identify adaptation strategies to climate change. Multivariate Probit (MVP) model was
estimated to identify factors affecting farmers’ choice of these strategies to climate change.
The descriptive statistics result showed that 87.74% and 83.22% of the respondents perceived
the existence of climate change with its attributes, temperature and rainfall, respectively. The
result of MVP model revealed that the likelihood of farmers to adopt adjustment of planting
date, agro-forestry, drought tolerant varieties, soil and water conservation practices, and
irrigation were 54.1%, 38.9%, 47.8%, 63.4%, and 59.6%, respectively. It also showed that the
joint probability of adopting and failure to adopting all adaptation strategies were 9.9% and
6.3%, respectively. Agro-ecological setting, sex, education level, landholding, farm income,
non-farm income, livestock ownership, access to credit, extension visit, farmer-to-farmer
extension, access to climate information and average distance from home to the farm have
significant influence on the choice of climate adaptation strategies. Consequently, the future
policy focus should target improving the level of perception of farmers to climate change and
adaptation strategies using extension service, encouraging farmer-to farmer extension and
using different sources of climate information like media. It is also necessary to focus on
improving literacy status, widening the sources and amount of farm and non/off farm income
and enhancing accessibility of credit to improve the adaptive capacity of farmers.
Keywords: Adaptation, climate change, Likert scale, multivariate probit, perception, Woreillu

1. INTRODUCTION
1.1. Background of the Study
The mean global temperature has been increasing since the 1850s, mainly due to the
accumulation of greenhouse gases (GHGs) in the atmosphere. The main causes are the burning
of fossil fuels to meet increasing energy demand, and the expansion of intensive agriculture to
meet increasing food demand, which is often accompanied by deforestation. This process of
global warming shows no signs of abating and is expected to bring about long-term changes in
weather conditions (FAO, 2009).
Climate change has been adversely affecting the livelihoods of people in developing countries
where a large proportion of the population is overwhelmingly dependent on agriculture. It has
exacerbated poverty, food insecurity and vulnerability of agrarian communities in Sub-
Saharan Africa (Akponikpè et al., 2010; Bryan et al., 2009).
Agriculture has a multiple roles in the economy of Ethiopia. Food security, 73% of
employment, 36.7% of the GDP of the country and 70% of the raw material requirements of
local industries are drawn from this sector (NBE, 2016; AEO, 2016). Since Ethiopia‟s
agriculture is tremendously rainfall dependent, it greatly suffers from the risks associated with
a decrease and a high variability in rainfall. It is a major threat to the sustainability of growth
of the country due to its negative impact on agricultural output. Long-term records indicate
that there have been severe and repeated rise in temperature and rainfall failures resulting in
severe food insecurity, including famines in Ethiopian due to significant loss of crops and
livestock. The frequency and severity of these natural shocks are also increasing (Mahoo et al.,
2013). The 2015 El Niño is a recent history which severely hit Ethiopia (FAO, 2016).
The speed of climate change is inducing and modifying known variability patterns beyond the
coping capacity of systems (FAO, 2008). The increasing frequency and magnitude of extreme
weather events coupled with unprecedented changes in the climate is also imposing new and
potentially overwhelming pressure on the capacity of existing adaptation strategies (Ziervogel
et al., 2008). Therefore, deliberate and conscious adaptation that can cope with these evolving
impacts is an immediate concern in agriculture. Particularly in countries like Ethiopia, where
agriculture is highly tied with climate, adaptation is a priority measure.

2
As agricultural production remains the main source of income for most rural communities,
adaptation of the agricultural sector to the adverse consequences of climate change is essential
to safeguard the livelihoods of the poor and to ensure food security. It can greatly reduce
vulnerability to climate change by making rural communities better able to adjust to climate
change and variability, moderating potential damages, and helping them cope with adverse
effects. Adaptation also require the involvement of multiple stakeholders, including
policymakers, extension agents, NGOs, researchers, communities, and farmers. A better
understanding of how farmers‟ perceive climate change, existing adaptation measures, and the
factors influencing the decision to adapt farming practices is needed to craft policies and
programs aimed at promoting successful adaptation of the agricultural sector (IPCC, 2001).
Despite the low adaptive capacity to climate change of Africa in general and Ethiopia in
particular, farmers have developed traditional adaptation strategies to withstand the great
climate inter-annual variability and extreme events. They have been trying, testing, and
adopting different types of coping strategies. An unusually persistent drought may also
increase farmers‟ vulnerability in the short term; but, it may encourage adaptation in the
medium to long-term. These practical coping mechanisms are particularly true for the drought
prone areas in Ethiopia and in the African Sahel region, which is susceptible to frequent
climatic hazards (Elasha et al., 2006).
Ethiopia has developed and implemented a range of legal, policy and institutional frameworks
to address climate change, environmental protection and the sustainable utilization of natural
resources. The Ethiopian Growth and Transformation Plan (GTP) I and II also gave prior
emphasis to the environment for sustainable development which focuses on improving
watershed management, afforestation, and soil conservation. The vision of the country to
becoming a middle-income and carbon-neutral economy by 2025 is also through the
implementation of the Climate-Resilient Green Economy (CRGE) strategy developed in 2011.
Despite these plans and policy frameworks, Ethiopia still faces serious challenges from
changing climate conditions, which calls for a continuous adaptation and support to develop
on a low carbon trajectory (AEO, 2016).
Perceiving climate change is the leading step in the process of adapting agriculture to climate
change (Temesgen et al., 2011). Knowing of farmers‟ concerns and the manner in which they

3
perceive climate change is crucial to offer effective policies for supporting successful
adaptation of the agricultural sector. Further, it is also important to have precise knowledge
about the type and extent of adaptation methods being taken up by farmers and the need for
further advances in existing adaptation set ups. Hence, understanding how farmers perceive
changes in climate and what factors shape their adaptive behavior is useful (Mertz et al., 2009;
Weber, 2010).
A wide range of adaptation options that are thought to reduce agriculture‟s vulnerability to
climate change are pursued both at macro- and micro-levels. The government of Ethiopia has
also taken up the issue of climate change, and adaptation in particular, as a priority agenda in
the transformation of the nation‟s agriculture. In line with the national food security macro-
level initiatives, the government is pursuing different adaptation strategies such as
operationalizing of agro-weather advisory service extension and response mechanism, safety
net programs and natural resource management (EPCC, 2015). The natural resource
management and SWC practices which are being undertaken in Woreillu District are
indicators of the concern of government to climate change with its limitations.
1.2. Statement of the Problem
The overdependence of agriculture on rainfall and temperature makes overwhelming reliance
of the economy on agriculture a serious problem which is by no means immune to climate
change. This calls for the essentiality of agricultural adaptation to climate change. According
to IPCC (2007), unless effective adaptation strategies are carried out timely, some African
countries could lose up to 50% of yield from rain-fed agriculture by the year 2020 and access
to food will be severely confronted in many African countries. Thus, Ethiopia cannot be an
exception given its overdependence on climate driven economy. Climate change impacts that
significantly undermine the prominent role of agriculture in food production and economic
growth chiefly signify the criticality of adaptation. Although Ethiopia has made some efforts
to adapt and mitigate climate change risks, the efforts are still low especially when compared
with the impending calamity.
Woreillu is one of the most vulnerable districts to climate change in South Wollo Zone.
Climate change posed a huge threat to farmers in the district due to their overwhelming
reliance on small-scale agriculture. According to information obtained from Woreillu District

4
Agriculture Development Office, it is the most severely affected district by drought and
agricultural production in the district is frequently affected by climate change related shocks
(WDADO, 2016).
Understanding perception and adaptation strategies to climate change and identifying
determinants is thus highly vital for Ethiopia in general and Woreillu district in particular as it
allows policy makers to formulate a host of strategies and instruments towards reducing
climate change danger. Without having sufficient information about the perception, adaptation
strategies and their determinants, implementation of appropriate policy in the area for the
potential increment in output, food self-sufficiency as well as sustainability of the required
development could not be possible.
Earlier studies on climate change in different parts of Ethiopia cannot be implied for other
specific areas. It is because adaptation strategies vary contextually and spatially within
communities and even among individuals so that identified adaptation measures do not
necessarily translate from one area to another area (Temesgen et al., 2009; Belaineh et al.,
2013). The capacity to adapt to climate change is unequal across and within societies.
Adaptation responses are also underpinned by common enabling factors. These include
effective institutions and governance, innovation and investments in environmentally sound
technologies and infrastructure, sustainable livelihoods and behavioral and lifestyle choices
(IPCC, 2014). There are individuals and groups within all societies that have insufficient
capacity to adapt to climate change. The agro-ecological setting of farmers also influences the
perception of farmers to climate change (Diggs, 1991). According to Füssel (2007), addressing
adaptation practices to specific societies or communities may make it possible to offset the
adverse impact of climate change.
There is also a methodological gap in addressing the issue of identifying factors that affect
choice of adaptation strategies. Majority of previous studies used multinomial logit (MNL)
model to identify factors affecting choice of adaptation strategies to climate change. This
model assumes that a farmer faces a set of discrete, mutually exclusive adaptation options
from which a farmer chose exactly one adaptation strategy. However, a farmer may choose
more than one adaptation strategy at a time and identified adaptation option can be
interdependent.

5
Therefore, there was a need to undertake a research at household or farm level in different
areas of Ethiopia which are very essential to know micro level farmers‟ perception to climate
change, identifying adaptation strategies and identifying determinants using multivariate
probit (MVP) model. This helps to design appropriate policies and strategies in that local
context. Such information was in fact scant in Woreillu District in particular.
In this regard, no empirical study has been conducted to examine the perception of farmers to
climate change, identify adaptation choices and their determinants in the study area to date to
the best of the researchers‟ knowledge. Consequently, the primary motive to embark on this
research was to investigate and fill the existing gap of knowledge on farmers‟ perception and
adaptation strategies to changing climate and their determinants in the area.
1.3. Research Questions
The pertinent questions that guided this research were:
1. Did farmers perceive the existing climate change?
2. What are the major adaptation strategies to climate change adopted by farmers?
3. What are the factors determining choice of adaptation strategies?
1.4. Objectives of the Study
The general objective of this study was to investigate farmers‟ perception and adaptation
strategies to climate change in Woreillu district.
The specific objectives were:
1. To analyze farmers‟ perception to climate change;
2. To identify farmers‟ adaptation strategies to climate change; and
3. To identify factors affecting choice of adaptation strategies in the study area.
1.5. Significance of the Study
Farmers‟ perception to climate change and adaptation strategies differs from district to district
and hence it needs detail study to identify the adaptation methods that fits with specific place.
This study has been conducted at micro level and thus considered particular adaptation
strategies in the study area. It revealed the perception level of the smallholder farmers about
climate change at local level and their reaction to the change in order to adapt the situation

6
which could help to look at better alternatives for effectiveness in adaptation practices. Hence,
it enables to understand climate change perception and identifies the most commonly used
adaptation strategies among the set of options and verifies factors that significantly influence
adaptation strategies.
The study provides information about household level perception and adaptation strategies
with their determinants in the area. It would assist local policy makers and development
practitioners in designing and formulating policies that seeks to capitalize the farmers‟
dominant adaptation strategies to reduce climate change danger in the study area in their
development intervention and build climate change resilient economy at the national level.
Finally, the study can be used as a base for further studies in the area of climate change. It will
serve as source of information and reference material for studies that will be conducted on
adaptation strategies against climate change impacts.
1.6. Scope and Limitations of the Study
This study was limited to Woreillu district, South Wollo Zone of Amhara Region. It also
focused on analyzing smallholder farmers‟ perception and identifying adaptation strategies to
climate change and their determinants considering time limitations. It made a comprehensive
analysis of the smallholder farmers‟ perception and adaptation strategies to climate change and
determinant of farmer‟s adaptation choice in Woreillu district. The study identified the major
adaptation mechanisms which are most frequently used by the farmers and the determinants
for the farmers‟ decision to take adaptation measures to climate change.
The major limitation of this study is that it identified only five major adaptation strategies in
the choice set for the MVP model and aggregates some of others in each category to avoid
convergence problem in running the model. However, there are a large number of adaptation
measures that could be taken by farmers in the area. It is also limited to crop production and
adaptation strategies related to animal production are not included. Furthermore, the impact of
each adaptation strategy is not considered in this study.
1.7. Organization of the Thesis
This thesis is structured into five main chapters. Chapter two presents the theoretical and
empirical review of literature to climate change, perception and adaptation strategies in

7
response to climate change. Chapter three describes the methodology used in the study. It
consists of the description of the study area, sampling technique, methods of data collection
and analysis. Chapter four wholly devoted to present and thoroughly discuss the results of the
study. Finally, the summary, conclusions and recommendations of the study are offered in
chapter five.

8
2. LITERATURE REVIEW
2.1. Definitions and Basic Concepts
Weather: The behavior of the atmosphere on a day-to-day basis in a relatively local area is
known as weather. A description of the weather would include daily temperatures, relative
humidity, sunshine, wind and rainfall (Ramamasy et al., 2007).
Climate: Climate in a narrow sense is usually defined as the average weather, or more
rigorously, as the statistical description in terms of the mean and variability of relevant
quantities over a period of time ranging from months to thousands or millions of years. The
classical period for averaging these variables is 30 years, as defined by the World
Meteorological Organization. The relevant quantities are most often surface variables such as
temperature, rainfall, and wind (IPCC, 2012).
Climate change: Climate change refers to a variation in the state of the climate that can be
identified by changes in the mean and/or the variability of its properties and that persists for an
extended period, typically decades or longer. It refers to any change in climate over time,
whether due to natural variability or as a result of human activity (IPCC, 2007). Climate
change may be due to natural internal processes or external forcing such as modulations of the
solar cycles, volcanic eruptions, and persistent anthropogenic changes in the composition of
the atmosphere or in land use (IPCC, 2014).
Climate change refers to ongoing changes in the global climatic system resulting primarily
from anthropogenic global warming as a consequence of the increased and continuing
emissions of greenhouse gases, and the loss of vegetation cover and other carbon sinks (FAO,
2008). It can also be defined as gradual changes in climate norms, notably temperature and
changes in the frequency, extent and severity of climate and weather extremes, explained as a
persistent change in the mean and variability of climate variables such as temperature, rainfall,
humidity and soil moisture (Krishna, 2011).
Greenhouse gases: The atmospheric gases which are responsible for causing global warming
and climate change. The major GHGs are carbon dioxide (CO2), methane (CH4), nitrous oxide
(N2O), chlorofluorocarbons (CFCs), and ozone (O3). Less prevalent but very powerful

9
greenhouse gases are hydroflurocarbons (HFCs), periflurocarbons (PFCs) and sulphur
hexafluoride (SF6) (Kiehl and Trenberth, 1997).
Perception: It is the process by which people receive information or stimuli from our
environment and transform it into psychological awareness (Van and Hawkins, 2000). People
infer about a certain situation or phenomenon differently using the same or different sets of
information. The knowledge, interest, culture and many other social processes shape the
behavior of an actor who uses the information and tries to influence a particular situation or
phenomenon (Banjade, 2003).
Saarinen (1976) also expressed perception as an extremely complex concept and confines
social perception which is concerned with the effects of social and cultural factors on cognitive
structuring of our physical and structural environment. This varies with the individual„s past
experiences and present sets or attitudes acting through values, needs, memories, moods,
social circumstances, and expectations.
Adaptation: Adaptation is the adjustment in natural or human systems in response to actual or
expected climatic stimuli or their effects, which moderates harm or exploits beneficial
opportunities (IPCC, 2007). In human systems, adaptation seeks to moderate or avoid harm or
exploit beneficial opportunities. In some natural systems, human intervention may facilitate
adjustment to expected climate and its effects (IPCC, 2014).
Adaptation is a process by which strategies to moderate, cope with and take advantages of the
consequences of climatic events are enhanced, developed, and implemented (UNDP, 2007). It
is an adjustment in ecological, social or economic systems in response to actual or expected
stimuli and their effects or impacts. The term refers to changes in processes, practices and
structures to moderate potential damages or to benefit from opportunities associated with
climate change (IPCC, 2007).
Vulnerability: Vulnerability is the extent to which a natural system or human society is
unable to cope with the negative impacts of climate change, variability and extremes. It
depends on changes in climate as well as the sensitivity and adaptive capacity of the system or
society (Pittock, 2003). Vulnerability is a function of the character, magnitude, and rate of
climate variation to which a system is exposed, its sensitivity, and its adaptive capacity (IPCC,
2001).

10
Disaster: Disaster is a serious disruption of the functioning of a community or a society
causing widespread human, material, economic or environmental losses which exceed the
ability of the affected community or society to cope using its own resources (ISDR, 2004).
Exposure: The degree of climate stress upon a particular unit analysis is known as exposure.
It may be represented as either long-term change in climate conditions or by changes in
climate variability including the magnitude and frequency of extreme events or people,
property, systems or other elements present in hazard zones that are thereby subject to
potential losses or the nature and degree to which a system is exposed to significant climatic
variations is known as exposure. Measures of exposure can include the number of people or
types of assets in an area (IPCC, 2001).
Coping: It is the use of available skills, resources, and opportunities to address, manage, and
overcome adverse conditions, with the aim of achieving basic functioning in the short to
medium-term during and immediately after a climate-induced hazard (IPCC, 2012).
Mitigation: Mitigation is a human intervention to reduce the sources or enhance the sinks of
greenhouse gases. Examples include using fossil fuels more efficiently for industrial processes
or electricity generation, switching to solar energy or wind power, improving the insulation of
buildings and expanding forests and other sinks to remove greater amount of carbon dioxide
from the atmosphere. In climate change policy, mitigation is defined differently, being the
term used for the reduction of greenhouse gas emissions that are the source of climate change.
Tackling climate change by limiting greenhouse gas emissions is known as mitigation (IPCC,
2001).
2.2. Overview of Climate Change
Climate change is a multifaceted biological and physical process. It is impossible to precisely
predict future climate conditions, but the scientific consensus is that global land and sea
temperatures are warming under the influence of greenhouse gases, and will continue to warm
regardless of human intervention for at least the next two decades (IPCC, 2007). According to
Joel et al. (1998), the climate has changed, is changing, and will continue to change regardless
of what investments in mitigation is made.

11
Africa is also highly stressed, has low adaptive capacity and easy vulnerable to climate
change. The main consequences of negative impact of climate change or climatic hazards are
poverty, unequal access to resources, food insecurity, social and political conflicts and
incidences of diseases. This impact of climate change presents a considerable challenge to
regional agricultural development. The Sub-Saharan African countries in particular have low
adaptation mechanism and are vulnerable to the widespread effect of climate change. With this
bid serious problem, GDP is predicted to lost in the coming 2100 in most part of the continent.
For instance, 2-7% in part of Sub-Saharan Africa, 2-4.5% in West and Central Africa, and 0.4-
1.3% in North and Southern Africa (FAO, 2009).
According to IPCC (2007), increase in global average temperature above the range of 1.5-
2.50C will negatively influences species distribution and survival. In most developing
countries where the majority of the population is dependent on natural resources based
livelihoods, it has an impact on socio-economic and threat to overall sustainable development.
It was predicted that during 21th
century, greenhouse gases mission will increase by 25-90%.
This will be continuing for future periods.
Climate change affects many sectors, including water resources, agriculture and food security,
infrastructures, ecosystems and biodiversity, human health and coastal zones. Because of its
innate link to natural resources, agricultural production is at the mercy of uncertainties driven
by climate variation, including extreme events such as flooding and drought (Kurukulasuriya
and Rosenthal, 2013).
2.2.1. Cause of climate change
Climate change is caused by the emission of greenhouse gases into the earth‟s atmosphere
through both natural processes and human activities; though growing evidence demonstrates
the largest contribution is from the latter. The burning of fossil fuels, largely as a result of
transportation, is the primary contributor to the emission of carbon dioxide while processes
such as deforestation and industrial agriculture are the main contributors to the emission of
methane and nitrous oxide compounds into the atmosphere. Despite constituting less than 15%
to total GHG emissions, methane is a very strong greenhouse gas which is 23 times stronger
than CO2 (IPCC, 2007).

12
2.2.2. Climate change impact
Agriculture is ranked as the most susceptible sector to climate change impacts and so do the
livelihoods of subsistence farmers and pastoralists. Climate change exerts multiple stresses on
the biological, physical, social and institutional environments that affect agricultural
production. Its impacts disproportionately affected Sub-Saharan African countries including
Ethiopia because of the higher dependency of their economies on climate-sensitive activities
such as rain-fed agriculture. Some of the induced changes are expected to be immediate, while
others involve gradual shifts in temperature, vegetation cover and species distributions.
Climate change is expected to and in parts of Africa has already begun to alter the dynamics of
drought, rainfall and heat waves, and trigger secondary stresses such as the spread of pests,
increased competition for resources, and biodiversity losses (Christensen et al., 2007).
It is difficult to predict the impact of climate change on complex biophysical and socio-
economic systems that constitute agricultural sectors. Warmer climates and changes in rainfall
seem to destabilize agricultural production in many parts of Africa. Total agricultural
production significantly declines due to the unexpected change in climate. This is anticipated
to challenge the systems that provide food security. As a result, it could threaten the efforts to
improve food security. The projected impact of climate change on agricultural productivity
differs per region and per agricultural activity. Typically, mixed farming or crop farming is
practiced in the highlands while the lowlands are characterized by nomadic pastoralism
(Gregory et al., 2005).
There is growing evidence that climate change has had negative effects on agriculture.
Agriculture, mainly in developing countries, is commonly agreed to be the sector which is
most negatively affected by climate change. Moreover, Africa‟s agriculture is hardly hit with
impacts of climate change due to its low level of economic development and adaptive capacity
(IPCC, 2007; Lobell et al., 2011).
2.3. Climate Change in Ethiopia
Climate change is a key concern to Ethiopia and need to be tackled in a state of emergency. It
has brought an escalating burden to already existing environmental concerns of the country
including deforestation, serious soil erosion and loss of top soil and land degradation which in
turn have adversely impacted agricultural productivity (MoA, 2011).

13
2.3.1. Climate change and agricultural sector in Ethiopia
The economy of Ethiopia is mainly based on rain-fed agriculture which is the source of
livelihood for the majority of its population (CSA, 2007). The country exhibits different agro-
ecological zones attributed to varied microclimates within which different growing seasons
existed and different agricultural activities practiced. There are different ways of classifying
the climatic systems of Ethiopia, including the traditional and the agro-climatic zone in
classification systems (Yohannes, 2003). Among the different ways of classifying the climatic
systems of the country, the traditional and agro-ecological classifications are the most
common ones (Temesgen et al., 2010). The agro-ecological zone classification system
combining growing periods with temperature and moisture regimes has 18 major agro-
ecological zones which are further sub-divided into 49 agro-ecological zones. According to
MoA (2000), these agro-ecological zones can be grouped into six major categories which
include Arid zone (31.5%), Semi-arid (3.5 %), Sub-moist (19.7%), Moist (25%), Sub-humid
and humid (19.3%) and Per-humid which covers close to 1 % of the Country.
The traditional classification, based on altitude and temperature, shows the presence of 5
climatic zones (NMA, 2007). Based on traditional classifications, agro-climatic zones of
Ethiopia could be divided as Wurch (upper highlands), Dega (highlands), Weyna Dega
(midlands), Kola (low lands) and Berha (desert) (MoA, 2000).
Climate is the main determinant of Ethiopian economic growth due to the fact that agriculture
sector is continued to be the engine of the country‟s economic growth. Agriculture includes
crop production, livestock husbandry, forestry, fishery and others. Out of 39% of contribution
of agriculture to the country‟s GDP, crop production is estimated to contribute to the
agriculture sector on average about 70.2%, livestock sub-sector accounts around 20.3% and
forestry and other subsectors around 9.5% of the total agricultural value in the country at the
end of 2014/15 (FDRE, 2016).
The mean annual distribution in Ethiopia is characterized by large spatial variation which
ranges from about 2000 mm over some pocket areas in the southwest to less than 250 mm over
in Afar and Ogaden lowlands‟ (Kurukulasuriya and Mendelsohn, 2008). The problems cause
by climate change on agriculture and for which MoA is responsible to take actions against are
land degradation, biodiversity loss, animal diseases, crop diseases and pests, factors that

14
reduce agricultural production, shortage of food and feed, intensified disasters and increased
environmental refugees (MoA, 2011).
The heavy dependence of Ethiopia‟s economy on rain-fed agriculture exacerbated its
vulnerability to climate change impact. In addition, its geographical location and topography
in combination with low adaptive capacity entail a high vulnerability to the impacts of climate
change. Historically, the country has been prone to extreme weather variability. Rainfall is
highly erratic, most rainfalls with high intensity, and there is a high degree of variability in
both time and space. Since the early 1980s, the country has suffered 11 major drought years
(Masih et al., 2014).
Even in recent years, Ethiopian farmers and systems experienced one of the worst droughts in
50 years which was comparable to the 1983-5 drought in large part due to El Niño. The 2015
El Niño was the most severe drought in half a century. Significant rainfall deficits severely
impacted the lives and livelihoods of farmers and herders throughout the country. Following
two consecutive poor rainy seasons; belg and kiremt, harvests were well below average, with
some areas experiencing between 50 and 90 percent crop loss. The livestock sector has also
seen extreme mortality and morbidity rates and abnormal migration in search of pasture and
water. Many families dependent on agriculture have become indebted and dependent on
humanitarian assistance. At the start of 2016, more than 10.2 million people were in need of
emergency food aid, 1.7 million households were seed insecure and 2.4 million households in
need of livestock support (FAO, 2016).
Rainfall failure, floods, drought and other changes in the country‟s natural and environmental
system due to climate change intimidate the performance of the economy as a whole and cause
severe malnutrition and loss of livelihoods for households mainly in marginal and less
productive lands in the country (PANE, 2009). This effect is attributed to the fact that those
changes can seriously depress agricultural production in the country. This clearly demonstrates
that, economic growth in general and households` welfare in particular are significantly
influenced by changes in rainfall, temperature and other climate variables (World Bank, 2006).
This shows that the impact of climate change in the country can be felt not only on agricultural
output but also on other sectors of the economy.

15
Many studies have concluded that the agriculture sector of the country is the most affected
sector by climate change. The trends in the contribution of agriculture to the country‟s total
GDP clearly explain the relationship between the performance of agriculture, climate and the
total economy.
2.3.2. Projected climate change in Ethiopia
The models predicting future climate change scenario in Ethiopia put conclusion that
temperature will increase in the coming decades. However, there is conflicting results
concerning the predicted level of rainfall (Tadele et al., 2013). There are constant, decreasing
and increasing levels of projected rainfall levels which were generated using different models.
According to Mahoo et al. (2013), the frequency and severity of natural shocks in Ethiopia is
increasing because of severe and repeated rainfall failures which strengthens the scenario that
rainfall is decreasing time to time. According to NMA (2007), temperature will increase in the
range of 1.7-2.10C by the year 2050 and 2.7-3.4
0C by the year 2080 over Ethiopia. The
country will experience an increasing level of temperature and rainfall in the coming decades.
However, it stated that a small increase in rainfall can be expected.
Studies also indicated that Ethiopia in the coming years will face a decrease in agricultural
production due to the adverse impact of climate change and variability‟s (Tadele et al., 2013).
In addition, World Bank (2007) stated that climate change is projected to reduce yields of the
wheat staple crop by 33% in Ethiopia .This suggests that agricultural production as the
dominant contributor of growth and development of the country is highly vulnerable to climate
change and climate variability which further seriously threaten food security of citizens. While
the more pronounced effects on crops and livestock are likely to materialize in later decades,
efforts to enhance the resilience to climate shocks of crop yields and livestock production
should be improved. This will enable to secure an increment in agricultural output and lead to
achieve the overall economic performance and objective of Ethiopian growth and
transformation plan for the coming periods.

16
2.4. Perception and Adaptation to Climate Change
2.4.1. Climate change perception
In agrarian communities, the linkage between agriculture and climate is much more complex
than others, and farmers are able to identify specific and important weather patterns. Farmers
usually base their crop and other production decisions using local knowledge systems which
are developed from years of observations and experiences. Local knowledge forecasts provide
more than just information about the forecast. They provide a set of behavioral rules that
households and communities follow when certain indicators are or are not observed.
Predicting climate is also an important cultural component for farmers (Burton et al., 1992).
According to Maddison (2007), perceiving change and then deciding whether or not to adopt a
particular measure is process in climate change adaptation. Whenever they have the
opportunity, farmers tend to adopt new variety of measures or technologies in response to the
perceived changes of weather conditions. The supports from extension workers, information
gained and technologies available to them will highly influence their adaptation and response
capacity. For instance, farmers use water conservation techniques whenever the rainfall
patterns are changed and amounts of rain are reduced. They tend to plant different crop
varieties and use short term crops with adjustment of planting dates. These adjustments are
done when they perceive reduction in rainfall and changes in the onset and offset of rainy
seasons.
For poor farmers, adaptation strategies to climate change are vital because failure to take
adaptation measures could lead to social problems and displacement (Downing et al., 1997).
To approach the issues of climate change appropriately, the local communities‟ or farmers
understanding and level of awareness about climate change is determinant factor. Farmers
perceive climate change as having a strong spiritual, emotional, and physical dimension
(Apata et al., 2009).
The study by Benedicta et al. (2010) showed that farmers are well aware of climate change,
but few seem to actively take steps toward adjusting their farming activities. According to
Temesgen et al. (2011), majority of farmers were able to recognize that temperatures have
increased and there has been a reduction in the volume of rainfall, still few farmers‟ lack the

17
perception of change in climatic condition of their area to take steps to adjust their farming
activities. The degree of farmers‟ perception on climate change also depends on its impact on
farmers‟ livelihood, their social, institutional and economic background. It is different and
depends mainly on level of education, livelihood activity, location and age.
2.4.2. The basics of adaptation and adaptation strategies to climate change
Over the coming decades, climate change impacts on agriculture are likely to increase due to
greater climate variability, and increased frequency and intensity of extreme events.
Policymakers have largely focused on tackling climate change through mitigation of human-
induced emissions of greenhouse gases and sequestration of carbon in order to address the
expected pressures on the agricultural as well as other economic sectors. However, it is
becoming widely accepted that mitigation alone is implausible to be sufficient as a climate
policy (Pielke, 1998).
Adaptation and mitigation are two different policy responses to the issue of climate change.
They are however inherently linked. Since mitigation measures alone will not be able to
immediately avoid global warming, adaptive measurements are needed to avert the negative
consequences of climate change at the short-term. On the long-term, mitigation measures will
be able to avoid further warming or even reduce the effect (Parry et al., 2007).
A plenty of studies have consequently emphasized the need to take adaptation in addition to
mitigation strategies. The goal of an adaptation measure should be to increase the capacity of a
system to survive external shocks or changes. The IPCC (2001) noted that adaptation through
changes in processes, practices or structures is an essential element in reducing adverse
impacts or enhancing beneficial impacts of climate change. Adaptation strategies are also
required to overcome the expected adverse impacts from higher temperature and changing
rainfall patterns (Kurukulasuriya and Mendelsohn, 2007). The main aspect of climate change
adaptation constitutes building resilience which is the capacity of a system to tolerate
disturbance without collapsing into a qualitatively different state that is controlled by a
different set of processes (FAO, 2003).
There are many different strategies that the farmers can implement to reduce the risk of
climate change impacts. Farmers use different adaptation strategies that fit with the types of
the problems caused by climate change they faced. This is due to the fact that impact of the

18
climate change is unevenly distributed over different geographic areas and hence the
adaptation mechanisms also vary with types and level of the impact of climate change (IPCC,
2007).
A number of adaptation strategies that the farmers used to reduce the impact of climate change
are identified in different literatures. These include; changing planting dates, changing crop
variety, mix crop and livestock production, planting short season crop, planting trees, decrease
livestock, moving animals or temporary migration, change livestock feeds, soil and water
management, change from livestock to crop production, change animal breeds, irrigation or
water harvesting, and seek off-farm employment are among some of the several strategies
available to enhance social resilience in the face of climate change (Bradshaw et al., 2004;
Nhemachena and Hassan, 2007).
Studies carried out independently by Temesgen et al. (2009), the World Bank (2010), and
Mengistu (2011) also showed that diversification, using different crop varieties, changing
planting dates, planting trees, adoption of drought tolerant and early maturing crop varieties,
changing cropping densities, water harvesting techniques, increased use of soil and water
conservation techniques or soil erosion prevention programs, increased use of irrigation and or
use of irrigation techniques, changing fertilizer application, pesticide application, applying
different feed techniques, the pastoral system or the herd composition, improvement or
rehabilitation of terraces, home-garden agriculture are among the common adaptation
strategies farmers carry out in response to climate change.
Even though there are a wide range of adaptation options, there is no assurance that a
particular farmer will undertake adaptive response. The extent to which adaptation strategies
are implemented varies among individual farmers depending on their capacity and willingness
to adopt (Crimp et al., 2010).
There are factors that are restricting adaptive capacity and willingness to adopt as a potential
source of limits and barriers to adaptation. A complex mix of conditions determines the
capacity of systems to adapt. The main features of communities or regions that seem to
determine adaptive capacity are biophysical, economic, social, technological, information,
skills, infrastructure, and institutional characteristics (Munasinghe and Swart, 2005).
19
2.5. Review of Empirical Literature
Different researches have been undertaken by scholars to understand farmers‟ perception to
climate change, to explore adaptation strategies in response to these changes, and to
investigate the determinants of perception and choice of adaptation methods. Results of these
researches provided varied verification about farmers‟ perception and choice of adaptation
strategies in their respective study areas.
2.5.1. Farmers’ perception to climate change
Fosu-Mensah et al. (2012) conducted study on farmers‟ perception and adaptation to climate
change in Sekyedumase district in Ghana. Results showed that about 92% of the respondents
perceived increases in temperature, while 87% perceived decrease in rainfall over the years.
Even though the communities are highly aware of climate issues, only 44.4% of farmers have
adjusted their farming practices to reduce the impacts of increasing temperature and 40.6% to
decreasing rainfall, and mentioned that lack of funds as the main barrier to implementing
adaptation measure.
A research was undertaken by Bryan et al. (2009) on adaptation to climate change in Ethiopia
and South Africa which examined farmers‟ perceptions of climate change in Ethiopia and
South Africa. The result showed that even though farmers perceived changes in temperature
and rainfall, a large percentage of farmers did not make any adjustments to their farming
practices. Belaineh et al. (2013) also found that there are nearly unified perceptions of climate
variability and change among gender and social groups.
Abid et al. (2015) studied farmers‟ perceptions of and adaptation strategies to climate change
and their determinants in Punjab province of Pakistan. The results demonstrated that
awareness of climate change is widespread throughout the area, and farm households make
adjustments to adapt their agriculture in response to climatic change.
A study has been conducted by Nega et al. (2015) on perception of climate change and its
impact by smallholders in pastoral/agro pastoral systems of Borana, South Ethiopia. The
results suggested that most participants perceived climatic change and its negative impact on
agriculture and considered climate change as a salient risk to their future livelihoods and
economic development. Different levels of perception were expressed in terms of climate

20
change and the impact on traditional rain-fed agriculture. Age, education level, livestock
holding, access to climate information and extension services significantly affected perception
levels. Solomon et al. (2016) also undertook a research on perception and adaptation models
of climate change by the rural people of Lake Tana Sub-basin, Ethiopia by employing
Heckman probit and MNL models. The farmers‟ perceptions to climate change found to be
statistically and significantly related to factors such as marital status, farm size, climate change
information access and the level of income generations.
Gadédjisso-Tossou (2015) conducted a study on understanding farmers‟ perceptions of and
adaptations to climate change and variability the case of the Maritime, Plateau and Savannah
Regions of Togo. The analysis of farmers‟ perception to climate change revealed high increase
in temperature and decrease in rainfall. These results were in accordance with the trend
analysis of climate data records in the study area particularly on the temperature.
Adeoti et al. (2016) examined farmers‟ vulnerability, perception and adaptation to climate
change in Kwara State using descriptive statistics and MNL model. The study revealed that
majority (84%) of the farmers believed that temperature had increased while about 65.8%
noticed that rainfall had declined. Abrham et al. (2017) also investigated smallholder farmers‟
adaptation to climate change and determinants of their adaptation decisions in the Central Rift
Valley of Ethiopia using a descriptive statistics and MNL model. The result showed that 90%
of farmers have already perceived climate change and 85% made attempted to adapt.
Wondimagegn and Lemma (2016) conducted a study on climate change perception and choice
of adaptation strategies base on empirical evidence from smallholder farmers in east Ethiopia.
According to this study, majority of farmers in the study area are aware of climate change
patterns and their adverse effect on income, food security, diversity, forest resources, food
prices and crop and livestock diseases. Results showed that, from the sample households, more
than 95% perceived the rise in average temperature and about 86% perceived the decrease in
precipitation over the years.
2.5.2. Adaptation strategies to climate change and their determinants
Burton et al. (1992) presented that adaptation to climate change and risks takes place in a
dynamic social, economic, technological, biophysical, and political context that varies over

21
time, location, and sector and determines the capacity of systems to adapt. Adaptive capacity
varies considerably among regions, countries, and socio-economic groups. The ability to adapt
and cope with climate change impacts was also a function of wealth, technology, information,
skills, infrastructure, institutions and equity.
A research was conducted by Nhemachena and Hassan (2007) on micro-level analysis of
farmers‟ adaptation to climate change in Southern Africa using a multivariate discrete choice
model to identify the determinants of farm-level adaptation strategies. The results confirmed
that access to credit, extension, and awareness of climate change are some of the important
determinants of farm-level adaptation.
Hassan and Nhemachena (2008) examined determinants of African farmers‟ strategies for
adapting to climate change using a multinomial choice analysis. The results indicated that
warming poses the highest risk and encourages irrigation, multiple cropping and integration of
livestock. Increased precipitation reduces the probability of using irrigation and will benefit
most African farms, especially in drier areas. Better access to markets, extension and credit
services, technology and farm assets (labor, land and capital) found to be critical for helping
African farmers to adapt to climate change.
Temesgen et al. (2009) identified the major methods used by farmers to adapt to climate
change in the Nile Basin of Ethiopia, the factors that affected their choice of methods and the
barriers to adaptation by employing multinomial logit (MNL) model. Based on their findings,
the level of education, gender, age, and wealth of the head of household; access to extension
and credit, information on climate, social capital, agro-ecological settings, and temperature
found to influence farmers‟ choices.
A research conducted by Bryan et al. (2009) on adaptation to climate change in Ethiopia and
South Africa which examined farmers‟ perceptions of climate change, the extent of adaptation,
barriers to adaptation, and the factors influencing adaptation and adaptation choices in
Ethiopia and South Africa by employing a probit model. The research found that the most
common adaptation strategies include use of different crops or crop varieties, planting trees,
soil conservation, changing planting dates, and irrigation. The results of the probit model
revealed that wealth and access to extension, credit, and climate information are factors that
22
influenced farmers‟ decision to adapt in Ethiopia. Food aid, extension services, and
information on climate change were found to facilitate adaptation among the poorest farmers.
Gbetibouo et al. (2010) conducted a research on climate adaptation strategies of farmers in the
Limpopo Basin of South Africa. The results showed that even though many farmers noticed
long-term changes in temperature and precipitation, most could not take remedial action. The
common adaptation responses reported included diversifying crops, changing varieties and
planting dates, using irrigation, and supplementing livestock feed. A MNL analysis of climate
adaptation responses noted that access to water, credit, extension services, off-farm income,
employment opportunities, tenure security, farmers‟ asset base, and farming experience are the
key that enhanced farmers‟ adaptive capacity.
A study has been conducted by Gutu et al. (2012) on econometric analysis of local level
perception, adaptation and coping strategies to climate change induced shocks in North
Shewa, Ethiopia using two steps process of Heckman model to analyze adaptation to climate
change. Perception to climate change found to be the prime determinant for adaptation.
Farmers found to follow different coping mechanisms where some of them negatively affected
the future development of the community and immediate recovery from climate change
impacts. The result concluded that awareness creation on climate change, facilitation of credit
availability, investment on non-farm engagement, improve good mix of livestock holding,
encourage adult education, dissemination of indigenous early warning information,
diversifying crops to perennial trees, and improved frequencies of agricultural extension
contact enabled farmers well perceived climate change and then adapted to the changes.
A study has conducted by Fosu-Mensah et al. (2012) on farmers‟ perception and adaptation to
climate change in Sekyedumase district in Ghana. The major adaptation strategies identified
included crop diversification, planting of short season varieties, change in crops species, and a
shift in planting date. Results of logit regression analysis indicated that the access to extension
services, credit, soil fertility, and land tenure are the four most important factors that
influenced farmers‟ perception and adaptation. The main barriers included lack of information
on adaptation strategies, poverty, and lack of information about weather.
Aemro et al. (2012) investigated climate change adaptation strategies of smallholder farmers
in Babilie District, East Harerghe Zone of Oromia Regional State of Ethiopia. The results from

23
the MNL analysis showed that sex, age, and education of the household head; family size,
livestock ownership, household farm income, non/off farm income, access to credit, distance
to the market center, access to farmer-to-farmer extension, agro-ecological zones, access to
climate information, and extension contact found to have a significant impact on climate
change adaptation strategies.
Belaineh et al. (2013) examined smallholder farmers‟ perceptions and adaptation to climate
variability and climate change in Doba District, West Hararghe Ethiopia. The adaptation
strategies used in MNL model were crop diversification and the use of soil and water
conservation practices, integrated crop and livestock diversification, engaging in off-farm
income activities and rainwater harvesting. It was found that agro-ecological locations, sex,
family size, plot size, off-farm income, livestock holding, frequency of extension contact and
training were the determining factors influencing adaptation strategies.
Temesgen et al. (2014) analyzed climate change adaptations of smallholder farmers in
Southeast Ethiopia using a descriptive statistics and MNL model. The model result depicted
the strong and positive association between the combined measures of agronomic practices
and use of agricultural inputs with education, access to weather information, access to credit
and farm income. Similarly, sex of the household head and access to weather information
were found to significantly affect the choice decision of inputs and agronomic practices like
use of drought tolerant crop species and crop diversification measures.
A research done by Gebru et al. (2015) on farmers‟ climate change adaptation options and
their determinants in Tigray Region, North Ethiopia in which descriptive statistics were
employed to assess adaptation options while the MNL model was used to identify factors
influencing households choices. The results revealed that farmers use change in crop type/
variety, soil and water conservation practices, crop diversification, change in planting date and
irrigation practices as climate change adaptation options. Educational level, age, sex of the
household head; farm income, access to extension service, access to credit, access to climate
information and agro-ecological settings were the most important determinant factors that
significantly affected the choice of farmers to climate change adaptations.
A research has been conducted by Abid et al. (2015) on farmers‟ perceptions of and adaptation
strategies to climate change and their determinants in Punjab province of Pakistan. Changing

24
crop varieties, changing planting dates, planting of shade trees and changing fertilizers were
the main adaptation methods implemented by farm households in the study area. The results
from the binary logistic model revealed that education, farm experience, household size, land
area, tenancy status, ownership of a tube well, access to market information, information on
weather forecasting and agricultural extension services influenced farmers‟ choices of
adaptation measures. The results also indicated that adaptation to climate change is
constrained by several factors such as lack of information, lack of money, resource constraints
and shortage of irrigation water in the study area.
Gadédjisso-Tossou (2015) conducted a study on understanding farmers‟ perceptions of and
adaptations to climate change and variability the case of the Maritime, Plateau and Savannah
Regions of Togo. Descriptive statistics and MNL were used to analyze data obtained from a
cross-sectional survey. The results also showed that crop diversification, change in crops, find
off-farm jobs, change of the amount of land, change of the planting date and plant short season
variety found to be the adaptation methods employed by the farmers. The MNL analysis
showed that education level, farming experience, access extension services, access to credit
and access to climate information were the factors that enhanced farmers‟ adaptive capacity to
climate change and variability.
Solomon et al. (2016) undertook a research on perception and adaptation models of climate
change by the rural people of Lake Tana Sub-basin, Ethiopia by employing Heckman probit
and MNL models. The MNL model results revealed that age, educational level, wealth status,
agricultural extension services, and distance to the nearest health center are found to be
significant for determining climate change adaptation.
A study by Adeoti et al. (2016) examined farmers‟ vulnerability, perception and adaptation to
climate change in Kwara State using descriptive statistics and MNL model. The econometric
investigation revealed that education of household head, farming experience, land ownership,
rainfall and temperature were the most relevant and significant factors that determined the
farmers‟ choice of adaptation strategies to climate change in the study area. The major barriers
to adaptation include lack of information on adaptation methods, land tenure problem and
inaccessibility to credit.

25
Wondimagegn and Lemma (2016) conducted a study on climate change perception and choice
of adaptation strategies base on empirical evidence from smallholder farmers in east Ethiopia.
The study found that the major adaptation strategies used by farmers in response to adverse
effects of climate change include cultivating different crops, planting different crop varieties,
changing planting dates, use of soil and water conservation techniques, conservation
agriculture practices and engaging in non-farm income activities. The MVP model result
revealed that the choice of adaptation strategies are influenced by gender of household head,
household size, farm size, distance from market and number of farm plots.
Abrham et al. (2017) investigated smallholder farmers‟ adaptation to climate change and
determinants of their adaptation decisions in the Central Rift Valley of Ethiopia using a
descriptive statistics and MNL model. It is found that farmers made attempted to adapt using
practices like crop diversification, planting date adjustment, soil and water conservation and
management, increasing the intensity of input use, integrating crop with livestock, and tree
planting. The econometric model result indicated that education, family size, gender, age,
livestock ownership, farming experience, frequency of contact with extension agents, farm
size, access to market, access to climate information and income were the key factors
determining farmers‟ choice of adaptation practice.
In summary, most of the studies regarding climate change in Ethiopia focused in basins,
pastoral and severely drought affected areas repeatedly. Nevertheless, for farmers to perceive
and adapt for the changing climate, agro-ecological setting, socio-economic conditions and
way of living of the community matter at most. In connection to this, some areas which are
highly productive but gradually affected by climate change have been left unconsidered. Given
the need for agro-ecologically based policy measures for climate change, it is impossible to
aggregate these findings as evidence for the country. Thus, studying climate change perception
and adaptation at micro level in different areas with different socio-economic and institutional
characteristics is worthwhile to suggest policy options conditioning on the context of a specific
area. In addition, most of these studies used MNL model to identify factors affecting choice of
adaptation strategies to climate change. However, adaptation strategies are interdependent by
nature and employing this model is inappropriate.

26
2.6. Conceptual Framework of the Study
In this study, farmers‟ adaptation process at the farm level described as a three-step procedure.
First, there is an increasing level of emission of greenhouse gasses to the environment which
caused climate change. The changes in climatic conditions were manifested by an increase in
temperature and decrease in rainfall availability so that emergence of unfavorable situation for
agricultural practices. Climate change thus causes adverse impacts on livelihood of farmers.
Farmers then have to perceive climate change and its adverse impacts on their agricultural
production and their livelihood in order to respond to the change so that capable to lessen side
effects. There is also an awareness creation and some other intervention from government and
non-government organizations to enable farmers to perceive climate change and to take
adaptation measures. Secondly, farmers then took certain measures to adapt to climate change
based on their perception and intervention from governmental and non-governmental
organizations. In fact, there are a number of adaptation options from which farmers made a
choice. Finally, farmers‟ adoption of particular adaptation measures was subject to various
household and institutional factors. The following analytical framework depicted the most
important variables expected to influence the farmers‟ choice of adaptation strategies to
climate change the case of Woreillu District (Figure 1).

27
Figure 1: Conceptual framework
Source: Own synthesis based on literature reviews
Climate Change
Perceptions for
Climate Change
Increase in
temperature
Decrease in
rainfall
Choice of Adaptation
strategies to Climate
Change
Institutional
Characteristics
Access for
information
Extension visit
Farmer-to-farmer
extension
Access to credit
Farm level
Interactions
Access to credit
Household
Characteristics
Sex
Age
Education level
Household size
Land holding
Income
Livestock
ownership
Impacts of Climate Change:
Shortage of food and feed
Land degradation
Reduction in production
Biodiversity loss
Pests and diseases
Adaptation strategies
Adjusting planting
dates
Agro-forestry
Use of Irrigation
SWC practice
Drought tolerant
Varieties
Environment
Intervention from
government and non-
government
organizations

28
3. RESEARCH METHODOLOGY
3.1. Description of the Study Area
The study was conducted in Woreillu district, South Wollo Zone of Amhara Regional State.
Woreillu is found at 492 km in the North direction from Addis Ababa, 571 km from Bahir Dar
and 91 km from Dessie. It is bordered by Jama in the southwest, Legahide in the west,
Legambo in the northwest, Dessie zuria in north, Albuko in the east and Wanchet in the
southeast. The district has 20 peasant associations (kebeles) with a total land area of 740.96
square-kilometers. It is situated between 10036‟N and 39
026‟E latitude and longitude
respectively. Its‟ altitude ranges from 1700 to 3200 meters above sea level (WDADO, 2016).
According to the agriculture office of the district, agro-ecologically the district is classified as
dega (highland) accounting 82%, and woinadega (midland) accounting the rest 18%. Most
kebeles produce crops in meher season while a few kebeles produce also in belg season. The
annual rainfall ranges from 414.2 mm to 1250 mm which is usually inadequate, poorly
distributed and highly variable in inter and intra seasons. The population of the district is
estimated to be 128,603 out of which 63,861 are male and 64,742 are female, with population
density of 173.6 per square. The farming system that the community practicing are mixed
farming systems in which both crop cultivation and rearing livestock are practiced. Cereals
like wheat, barley, and teff and pulses like field pea, rare lentils, and beans are some of the
dominant crops grown in the area. The major livestock reared in the district are cattle, sheep
and poultry. The average land holding of the household is 1.3 hectares per household. Out of
the districts‟ total area, 48% is arable land, 5% is grazing land, 22 % vegetation and bushy, 7%
settlement, and 18% waste land. According to the information from Agriculture office, the
district is repeatedly and severely affected by climate change induced hazards (WDADO,
2016). The location map of the study area is depicted below (Figure 2).

29
Figure 2: Map of the Woreillu District
Source: Extracted from Arc GIS software
3.2. Sampling Techniques
The study was undertaken in Woreillu district because of the severity of the effect of climate
change in the area. A two-stage stratified random sampling technique was applied to select
sample households. According to Kothari (2004), if the population from which a sample is to
be drawn does not constitute a homogeneous group, then stratified sampling technique is
applied so as to obtain a representative sample. In this technique, the population is stratified
into a number of non-overlapping sub-populations or strata that are individually more
homogeneous than the total population and sample items are selected from each stratum to

30
constitute a sample. The strata are formed on the basis of common characteristic of the items
to be put in each stratum so that ensure elements being most homogeneous within stratum.
In the first stage, the kebeles in the district have been stratified into two as dega and
woinadega. Farmers within the same agro-ecology have homogenous characteristic in different
aspects. They have similar agricultural practices, traditional knowledge and skills. There are a
total of 20 kebele administrations in the district out of which 16 kebeles are dega (highland)
and 4 kebeles are woinadega (midland). Then four kebele administrations from dega and one
kebele from woinadega have been randomly selected proportionate to number of kebeles in
each agro-ecological zone because of homogeneity of kebeles within the identified agro-
ecologies. The formula provided by Yamane (1967) was used to determine the required
sample size at 95% confidence level and 8% level of precision.
n =N
1 + N(e)2=
21627
1 + 21627(0.08)2= 155
Where: n = Sample size N = Size of population e = Level of precision
In the second stage, a total of 155 sample households have been selected randomly using
probability proportional to number of household heads size sampling technique from sample
kebeles.
Table 1: Distribution of sample households across sample kebeles in the district
Sample kebeles Total number of
households
Sample size
Number Percent (%)
Highland 5282 119 76.77
Werebayasu 1433 32 20.64
Dolu 1250 28 18.06
Gatira 1327 30 19.36
Batel 1272 29 18.71
Midland 1612 36 23. 23
Kuyu 1612 36 23.23
Total 6894 155 100
Source: Own computation from secondary data, 2017

31
3.3. Methods of Data Collection
The study used both primary and secondary data sources to collect qualitative and quantitative
data. The primary data on demographic, socio-economic and institutional factors were
collected from 155 sample households of Woreillu District using semi-structured
questionnaire and five focus group discussions (FGD) involving 8-10 purposively participants
selected in each group. The FGDs included model farmers, development agents, district
officials and elders. A pilot study was first undertaken for pre-testing the questionnaire and the
questionnaire has been revised in light of the results of the pilot study. Secondary data were
collected from documents of different offices in South Wollo Zone and Woreillu District. In
addition, a 24 years rainfall and temperature data for the period 1993-2016 have been collected
from the National Meteorological Agency (NMA) branch office in Kombolcha.
3.4. Methods of Data Analysis
Descriptive statistics, Likert scale measurement and multivariate probit (MVP) regression
analysis were the main analytical techniques that are used to analyze the data.
3.4.1. Analysis of perception to climate change and adaptation options
In order to get essential information and insight into farmers‟ adaptation to climate change,
looking at their perception on each climate attributes were quite important. Descriptive
statistic and Likert scale measurement were used to characterize farmers‟ perception on
changes in long-term temperature, rainfall and other aspects.
To analyze smallholder farmers‟ perception to change in climate, further comparison were
made correspondence with climate data recorded in Kombolcha Meteorological Sub-station
(KMS) for 24 years for the period (1993-2016 G.C) by fitting a linear trend of annual means
of temperature and rainfall. Making this trend in annual average temperature and rainfall a
base for comparison, the perception of farmers were analyzed whether it was in line with or
opposite to the linear trend fitted from KMS data. This has been done by asking household
heads questions about their opinion on the direction of climate change and using a five level
Likert scale measurement on some attributes of climate change. Percentages were used to
analyze the proportion of respondent in each level. Farmers who strongly agree and who

32
simply agree were considered perceived the change while others not. Percentages were also
used to identify adaptation options used by farmers.
3.4.2. Determinants of choice of adaptation strategies
The analytical approach that was commonly used by earlier studies in an adoption decision
involving more than two categories is the multinomial logit (MNL) model. For example,
Temesgen et al. (2009), Aemro et al. (2012), Gebru et al. (2015), Gadédjisso-Tossou (2015),
Solomon et al. (2016), Adeoti et al. (2016), and Abrham et al. (2017) used MNL model to
identify factors influencing households‟ choices of adaptation strategies to climate change.
The advantage of using a MNL model is its‟ computational simplicity in calculating the choice
probabilities that are expressible in analytical form (Tse, 1987). This model provides a
convenient closed form for underlying choice probabilities, with no need of multivariate
integration, making it simple to compute choice situations characterized by many alternatives.
In MNL model, it is assumed that each farmer faces a set of discrete, mutually exclusive
choices of adaptation measures from which a person chooses exactly one adaptation strategy.
There is an assumption of the independence of irrelevant alternatives (IIA) property, which
states that the ratio of the probabilities of choosing any two alternatives is independent of the
attributes of any other alternative in the choice set (Hausman and McFadden, 1984; Tse,
1987). However, in real situations, a farmer might choose more than one adaptation strategy at
a time and each adaptation strategy could be interdependent to each other. Hence, MNL
model could not be appropriate for such cases and another model which can resolve these
limitations is required.
The multivariate probit (MVP) model is an appealing model of choice behavior because it
allows a flexible correlation structure for the unobservable variables (Huguenin et al., 2009). It
is a generalization of the probit model used to estimate several correlated binary outcomes
jointly. The MVP is one form of a correlated binary response regression model that can
simultaneously estimate the influence of the set of explanatory variables on each of the
different practices, while allowing for the potential correlation between unobserved
disturbances as well as the relationship between the adoptions of different practices (Belderbos
et al., 2004). The model is based on the multivariate normal distribution and is recommended
in cases of interdependence among the irrelevant alternatives (Greene, 2003).

33
According to Belderbos et al. (2004), complementarities (positive correlation) and
substitutabilities (negative correlation) between different options may be the source of the
correlation between error terms. Another source of positive correlation is the existence of
unobservable household specific factors that affect choice of several adaptation options but are
not easily measurable such as indigenous knowledge. The correlations are taken into account
in the MVP model. This study, therefore, used a MVP econometric technique to overcome the
shortfalls of using the MNL model to assess determinants of adaptation measures.
The judgment of whether or not to use any adaptation option could fall under the general
framework of its value and production improvement capacity. Consider a rational farmer who
pursues to improve agricultural productions over a specific time and must choose among a set
of ‘𝑗’ adaptation options. Hence, the farmer ‘𝑖’ decides to use ‘𝑗’ adaptation options if the
perceived benefit from option ‘𝑗’ is greater than the utility from other options (say, ‘𝑘’ ) stated
as:
𝑈𝑖𝑗 𝛽𝑗′𝑋𝑖 + 𝜀𝑗 > 𝑈𝑖𝑘 𝛽𝑘
′ 𝑋𝑖 + 𝜀𝑘 , 𝑘 ≠ 𝑗
Where 𝑈𝑖𝑗 and 𝑈𝑖𝑘 are the perceived values by farmer 𝑖 of adaptation options 𝑗 and 𝑘 ,
respectively; 𝑋𝑖 is a vector of explanatory variables that influence the choice of the adaptation
option: 𝛽𝑗 and 𝛽𝑘 are parameters to be estimated and ɛ𝑗 and ɛ𝑘 are the error terms.
Under the revealed preference assumptions, the farmer practices an adaptation option that
generates net benefits and does not practice an adaptation option otherwise; we can relate the
observable discrete choice of practices to the unobservable continuous net gain variable as
𝑌𝑖𝑗 = 1 if 𝑈𝑖𝑗 > 0 and 𝑌𝑖𝑗 = 0 if 𝑈𝑖𝑗 < 0. In this formation, 𝑌 is a dichotomous dependent
variable taking the value of 1 when the farmer chooses an adaptation option in question and 0
otherwise (Nhemachena and Hassen, 2007).
According to Lin et al. (2005) and Nhemachena and Hassen (2007), the MVP econometric
approach that was used for this study is characterized by a set of five binary dependent
variables like adjusting planting date, using agro-forestry, using drought tolerant variety, using
SWC practices, and using irrigation such that:

34
𝑦𝑖𝑗∗ = 𝑥𝑖𝑗
′𝛽𝑗 + 𝜀𝑖𝑗 , 𝑗 = 1, 2,3, 4, 𝑎𝑛𝑑 5
and
𝑦𝑖𝑗 = 1 𝑖𝑓 𝑦𝑖𝑗
∗ > 0
0 𝑜𝑡𝑒𝑟𝑤𝑖𝑠𝑒𝑠.
Where 𝑦1 = adjusting planting date, 𝑦2 = using agro-forestry, 𝑦3 = using drought tolerant
variety, 𝑦4 = using SWC practices, and 𝑦5 = using irrigation, 𝑥 is a vector of explanatory
variables, 𝛽1, 𝛽2, … . . , 𝛽5 are conformable parameter vectors, and random error
terms 𝜀1, 𝜀2, … . , 𝜀5 are distributed as multivariate normal distribution with zero means, unitary
variance and an 5 × 5 contemporaneous correlation matrix 𝑅 = 𝜌𝑖𝑗 , with density
∅ 𝜀1, 𝜀2, …… , 𝜀5; 𝑅 . The likelihood contribution for an observation is the 5-variate standard
normal probability:
𝑃𝑟 𝑦1 , 𝑦2 , … , 𝑦5|𝑥 = … 2𝑦2−1 𝑥 ′ 𝛽2
−∞
2𝑦1−1 𝑥 ′ 𝛽1
−∞
× ∅ 𝜀1 , 𝜀2 , … , 𝜀5; 𝑍′𝑅𝑍 𝑑𝜀5 … 2𝑦5−1 𝑥 ′ 𝛽5
−∞
𝑑𝜀2𝑑𝜀1
Where 𝑍 = 𝑑𝑖𝑎𝑔 2𝑦1 − 1, … 2𝑦5 − 1 .
The maximum likelihood estimation maximizes the sample likelihood function, which is a
product of probabilities across sample observations as shown above (Nhemachena and Hassan,
2007).
3.5. Definition and Measurement of Variables and Working Hypothesis
Dependent variables
The dependent variables for MVP model of this study were the adaptation options that the
sample households employed in response to climate change. The choice of adaptation
strategies were based on the actions the sample households take to counteract the negative
impact of climate change. From previous researches, different climate change adaptation
methods have been identified. The researcher asked numerous alternative adaptation strategies
to the sample respondents and finally identified five major adaptation methods most
commonly used in the area as dependent variable for the multivariate probit model. These
included adjusting planting dates, use of agro-forestry, use of drought tolerant varieties, use of
water and soil conservation (SWC) practices, and use of irrigation.

35
Adjusting planting dates (y1): It involves the adjustment of planting time better suit to the
shifts in growing season by delaying or undertaking early planting/sowing. Hassan and
Nhemachena (2008) also identified that changing planting dates is one among farmers‟
perceived adaptation strategies.
Agro-forestry (y2): Includes growing eucalyptus tree, spice trees, incense trees, coffee,
rosemary, avocado, mango, papaya and other fruits and trees used for timber production and
has a multi-purpose (as a sources of income and means of keeping climate balance). It also
constitutes trees used for energy consumption and prevents deforestation. Temesgen et al.
(2009) also used planting trees as a common adaptation strategy.
Use of drought tolerant variety (y3): It involves using varieties better fitting to the new
climate such as the use of stress tolerant crops or varieties that have a shorter growing period
and pest and disease resistance crops. It also includes cultivating crops which are suitable to
the new climate and growing conditions. Elasha et al. (2006) mentioned planting of drought
resistant varieties of crops as one of adaptation measures. World Bank (2010) also identified
that planting disease and drought-resistant short period varieties is one measure of adaptation
to climate change.
Soil and water conservation practice (y4): Includes the adoption of soil and water
conservation practices such as soil/stone bending, terracing, mulching, and runoff diversion to
prevent erosion, improve soil fertility, and conserve soil moisture. Hassan and Nhemachena
(2008) and Solomon et al. (2016) also used this measure as one adaptation strategies to
climate change.
Use of irrigation (y5): It involves the adoption of farmers to build water, harvesting schemes
such as traditional hand dug or shallow open wells for the abstraction of groundwater for
irrigation, diversion and pumping of spring water to practice irrigation. Temesgen et al. (2008)
and Solomon et al. (2016) identified use of irrigation as one strategy for climate change
adaptation.
Independent variables
To identify the independent variables to be used in the study, different literatures were
reviewed regarding the factors that affect farmers‟ choices of adaption strategies to climate

36
change. Based on most of the previous studies, the following are commonly identified
independent variables.
Agro-ecological setting (AE): It comprises the condition of climate and soil type (growing
period, temperature and moisture) in the area. It is a dummy variable nominated 0 for
Woinadega (midland) and 1 for Dega (highland). A study by Gebru et al. (2015) demonstrated
that agro-ecological setting affected the use of irrigation, SWC practices, and changing
variety. Temesgen et al. (2009) also noted that agro-ecology significantly affected the use of
irrigation, planting trees, improved variety, and adjusting planting date. Besides, Solomon et
al. (2016) found that difference in agro-ecology significantly affected use of irrigation and
climate change resilient variety in response to climate change. This implied that farmers living
in different agro-ecological zones have different perceptions and make use of different
adaptation methods. This variable was therefore hypothesized to either positively or negatively
affects choice of adaptation strategy.
Sex of the household head (SEX): It is a state of being male or female. This is a dummy
variable taking a value of 1 if the household head is male and 0 otherwise. According to
Temesgen et al. (2009), being male has a positive effect on the use of SWC practices, planting
trees, and using different crop variety. This implies that male-headed households are more
likely to take these adaptation strategies. However, Nhemachena and Hassan (2007) found that
female-headed households are more likely to take up SWC practices, irrigation, different crop
variety and adjusting planting dates than male-headed households. The authors explain that
females are engaged in more farm activities than males and have better farm experience and
information. In addition, Abrham et al. (2017) found that male-headed houses are less likely to
adapt climate change using planting trees. Therefore, this variable was expected to have either
a positive or negative influence on choice of adaptation strategy.
Age of the household head (AGE): Age is a continuous variable that indicates the length of
time that household head has existed. This variable is measured in years. According to a
research by Gebru et al. (2015), age has a positive effect on the use of different crop variety,
irrigation, and SWC practices. Temesgen et al. (2009) also found that age has a positive
influence on the use of irrigation, adjusting planting date, and planting trees while Aschalew
(2014) found negative influence of age on the same adaptation strategies. In addition, Abrham

37
et al. (2017) established that an increase in age has a negative influence on the practice of
planting trees. Thus, the older the farmer, the more experienced in farming he/she will be and
the more he/she will recognize the past and present climatic conditions so that able to choose
the best among alternative adaptation strategies. The variable was hypothesized to have either
a positive or negative effect on choice of adaptation strategy.
Education level of the household head (EDU): It is the completed education level of head of
the household for formal education. It is a discrete variable and measured through completed
years in school. According to Solomon et al. (2016), education improves the level of
understanding about climate change adaptation so that increases the likelihood of using
drought tolerant variety. Adeoti et al. (2016) found that education increases the use of drought
tolerant variety and adjusting planting dates. The result of Temesgen et al. (2009) also found
that the use of irrigation, SWC practice, drought tolerant variety, planting trees and adjusting
planting date increase whenever education level increases. Abrham et al. (2017) and Abid et
al. (2015) stated that education has a positive influence on the SWC and adjusting planting
date because it is likely to enhance farmers‟ ability to receive, interpret and comprehend
information relevant to make innovative decision in the farms. Generally, possession of higher
level of formal education increases farmers‟ propinquity for new information and the
probability of perceiving and adapting to climate change. Therefore, it was expected to have a
positive negative influence on choice of adaptation strategy.
Family size (FAMSIZE): Family size indicates the number of individuals under a household
in man-equivalent and it is a continuous variable. The research result found by Belaineh et al.
(2013) stated that increase in family size reduces crop diversification and the use of SWC as
adaptation strategy. On the other hand, Gbetibouo et al. (2010) and Abid et al. (2015) stated
that family size positively affected the use of irrigation as an adaptation strategy. Abid et al.
(2015) also added that the increase in family size increases the likelihood of using SWC
practice and agro-forestry. As the size of the family increase, the farmers‟ ability for taking
some climate change adaptation measures increases while for some others decreases. The
variable was expected to either positively or negatively affect choice of adaptation strategy.
Landholding size (LHSIZE): Landholding size is the total amount of cultivated landholding
of a farm household. This variable is continuous and measured in hectares. Nhemachena and

38
Hassan (2007) found that increase in landholding increases the likelihood of utilizing
irrigation, SWC practice, adjusting planting dates, and use of drought tolerant variety.
Wondimagegn and Lemma (2016) also found that large landholding increase the use of SWbC
practice. On the other hand, Aschalew (2014) revealed that large landholding decrease the use
of irrigation while it increases the use of agro-forestry and drought tolerant variety.
Landholding size could affect the land allocation of farmers to different enterprises. The
bigger the landholding, the more likely the farmer is to adopt suitable strategies and less likely
to others. The variable was expected to either positively or negatively affect choice of
adaptation strategy.
Farm income (FRINCM): It is a return from investment of capital, labor, land and time to the
farmer. This is a continuous variable and measures the amount of income the farmers make
per year from investment in their farm. In other words, it is the amount of annual farm income
obtained from the sale of crop and livestock or livestock products measured in Ethiopian Birr.
The work of Aemro et al. (2012) found that an increase in farm income increases the
likelihood of using SWC practices and drought tolerant variety. Aschalew (2014) and
Temesgen et al. (2009) asserted that as farm income increases the probability of adopting
irrigation, adjusting planting date, and using drought tolerant variety increases. Aschalew
(2014) also found that households with higher farm income are more likely adopt agro-
forestry. It was hypothesized that the more farm income a farmer has the more likely to
perceive and adapt to climate change using a convenient strategy by devoting higher time and
money for this activity. It was expected to positively influence choice of adaptation strategy.
Off-farm/non-farm income (NFRINC): This refers to annual income obtained from an
employment of the household in off-farm activities like laborer and non-farm activities like
petty trading, hand craft, selling of fire wood, gifts and remittance. It is a continuous variable
and measured in Ethiopian Birr. Aemro et al. (2012) found that off/non-farm income
positively affected farmers‟ use of SWC practices, adjusting planting date, and improved
variety. Additionally, Temesgen et al. (2009) confirmed that off-farm income increases the
likely of farmers to planting trees and adjusting planting dates. In contrary to this, Belaineh et
al. (2013) revealed that an increase in off-farm income decreases the likely of crop
diversification and the use of SWC practices as adaptation strategy. Farmers are assumed to
get additional income source and may or may not give time to take adaptation measures and

39
pay less attention to agriculture. Therefore, it was expected to either positively or negatively
affect farmers‟ adaptation decision.
Livestock size (TLU): It is the amount of all livestock owned by the household. This is a
continuous variable and measured in tropical livestock unit (TLU). Abrham et al. (2017)
revealed that owning large number of livestock in tropical livestock unit increases farmers‟
likelihood of planting trees, adjusting planting dates, and use of SWC practices. Contrary to
this, the result found by Temesgen et al. (2009) and Aschalew (2014) disclosed that ownership
of large number of livestock in tropical livestock unit adversely affected using of irrigation as
an adaptation strategy. In farming activities, animals such as oxen, cows, donkey, horse, mule
and others can be seen as capital inputs and farmers who have large livestock are considered
affluent. They serve as a means of plowing, harvesting and transporting inputs and outputs. It
can also serve as food and can be sold to generate income and fill household‟s financial deficit
during crop failure due to climate factors. On the other hand, production of livestock competes
with crop production for labor and land. Therefore, it was expected to have either a positive or
negative effect on choice of adaptation strategies.
Access to credit (CREDIT): Access to credit is about whether a farmer use credit or not. It is
a dummy variable coded 1 if the farmer has access to credit and 0 otherwise. The study by
Nhemachena and Hassan (2007) demonstrated that access to credit improves probability of
adopting irrigation, adjusting planting date, using different crop variety, and SWC practices in
response to climate change. Temesgen et al. (2009) also confirmed that access to credit
increases the probability of using irrigation, SWC practices, and adjusting planting date in
response to climate change. Additionally, Gadédjisso-Tossou (2015) stated that farmers‟ use
of improved variety increases when they have access to credit. Access to credit mitigates the
financial limitation and enables the farmer to adopt strategies that reduce the negative impact
of climate change. Access to credit makes adoption of new technologies such as improved
crop variety seed, water conservation and irrigation possible by the farmer. It was expected to
have a positive influence on choice of adaptation options.
Extension visit (EXTCON): It is the frequency of extension visit by the development agent.
It is a discrete variable measured in the number of contacts per year. Empirically, the study by
Temesgen et al. (2009) disclosed that extension contact enhances the likelihood of using

40
irrigation, SWC practices, planting trees, and improved variety in response to climate change.
Abid et al. (2015), Gebru et al. (2015) and Aemro et al. (2012) also confirmed that extension
visit enhances the likelihood of using improved variety. Having access to extension contact
increases the probability of using drought tolerant variety, SWC practices, use of irrigation,
and some others to cope with climate change. It was expected to have a positive effect on
selected adaptation strategies.
Farmer-to-Farmer extension (FFEXT): This variable indicates the access to informal
extension services. It involves sharing information and inputs from nearby farmers. It is a
dummy variable taking the value of 1 if there is access and 0 otherwise. Temesgen et al.
(2009) found that access to farmer-to-farmers‟ extension services positively affected adjusting
planting date, planting trees, using improved variety, SWC practices, and irrigation in
response to climate change. Such services provide the farmers with information about the
agricultural adaptation practices that are most suitable to their farms which is practically tested
by other farmers themselves. It also enhances the chances for farmers‟ decision to adapt to
climate change and influence their preferences for different adaptation strategies. Hence, it
serves as a source of information and experience sharing among farmers and expected to
positively affect choice of adaptation strategies.
Access to climate information (CLIMINFO): It is the availability of information related to
climate from different media. It is about whether farmers got climate information from radio,
television, schools, newspapers and others. This is a dummy variable indicating 1 if the
household head has access to climate information and 0 otherwise. The result found by Gebru
et al. (2015) confirmed that access to climate information increases the use of irrigation and
SWC practices. Abrham et al. (2017) also revealed that the use of SWC practices, adjusting
planting date, and planting trees in response to climate change is enhanced by access to
climate information. Gadédjisso-Tossou (2015) and Temesgen et al. (2009) as well found that
access to climate information improves the use of improved variety and adjusting planting
dates in response to climate change. Access to information on climate from different sources is
expected to have impact on the adaptation combination of different strategies. This variable
was also expected to have a positive influence on choice of adaptation strategies to climate
change.

41
Average distance from home to the farm (DFARM): It is about how far the farm of the
farmer is located on average from his/her residence. This variable is a continuous variable
measured in kilometers from farmers‟ home to their farming place. A research done by
Aschalew (2013) confirmed the higher probability of adopting irrigation and adjusting
planting date when distance from home to farm is far from each other. It also found that
distance from home to farm decreases the probability of using improved variety and agro-
forestry. It was anticipated that a farmer whose farm is far from his/her home is less likely to
frequently follow up the farm as compared to those whose farm is nearer to their home. Thus,
it was expected that farmers who live near to their farm are likely to have regular follow up of
their farm, hence, motivated to respond to the impact of climate change on their agricultural
activities. In contrary to this, distance from farm enhances the use of some other adaptation
strategies. It was therefore expected to either positively or negatively affect choice of
adaptation strategy.
Distance to market (DMKT): It is about how far the market for inputs and outputs is located
from farmers‟ residence. Distance to market is a continuous variable and represented in terms
of kilometers from farmers‟ residence to the market. Wondimagegn and Lemma (2016) found
that distance to market positively affected the use of different crop variety and adjusting
planting date while it negatively affected use of SWC practices. Nhemachena and Hassan
(2007) also found that distance to market positively influences use of improved variety, SWC
practices, and use of irrigation. In contrary to this, Solomon et al. (2016) established that
distances to market negatively affected use of irrigation. A farmer whose residence is too far
from the agricultural input as well as output market was hypothesized to use modern
agricultural input less likely than the farmers who can get the input nearby their farm. In
addition, the proximity to market is important even in helping the farmer to exchange
information. On the contrary, closeness to market makes the farmer to engage in activities
other than farming so that it gives less time to farming and using adaptation strategies. Hence,
this variable was hypothesized to either positively or negatively influences choice of
adaptation strategy.

42
Table 2: Summary of definition, measurement and hypothesis of explanatory variables
Notation Definition of Variable Measurement
of Variable
Expected effect
Y1 Y2 Y3 Y4 Y5
AE Agro-ecological setting Woinadega=0,
Dega= 1,
+/ - +/ - +/ - +/ - +/ -
SEX Sex of the household
head
Female =0,
Male=1
- + +/- - +/-
AGE Age of the household
head
Years +/- +/- + +/- +
EDU Education level of the
household head
Years + + + + +
FSIZE Family size ME +/- + +/- + +/-
FRSIZE Farm size Hectare + + + +/- +
FRINCM Farm income ETH. Birr + + + + +
NFRINC Non-farm income ETH. Birr + + + +/- +/-
TLU Livestock size TLU + + +/- - +
CREDIT Access to credit No Access=0,
Access to
Credit =1,
+ + + + +
EXTCON Extension contact No. of visit per
year
+ + + + +
FFEXT Farmer-to-Farmer
extension
No=0,
Yes=1
+ + + + +
CLIMINFO Access to climate
information
Have no
access=0, Have
access=1
+ + + + +
DFARM Distance from home to
the farm
Km + - - + +/-
DMKT Distance to market Km + +/- + +/- +/-
Source: Own summary from literature review

43
4. RESULTS AND DISCUSSION
This section presents the major findings of analysis of data obtained from NMA, survey and
focus group discussions. It is divided into four main parts. In the first section, characteristics
of sample households have been presented. In the second section, analysis of perception of
smallholder farmers to climate change has been argued. In the third section, farmers‟ choices
of adaptation strategies for climate change have been presented. Finally, determinants of
farmers‟ choice of adaptation strategies have been thoroughly discussed.
4.1. Characteristics of Sample Households
This study was based on quantitative and qualitative data collected from a total of 155 sample
households interviewed during the survey. From the total household heads interviewed 10.
32% are female and the remaining 89.68% are male. The average age, education level, family
size, landholding, annual farm income, and livestock ownership of sample households are
45.49 years, 3.26 years, 5.57 ME, 1.31 hectares, 19811.54 birr, and 4.75 TLU, respectively
(Table 3). Regarding landholding size, majority of the respondents own small and fragmented
plots. There are also households who have no land and whose main livelihood is rearing
animals in communal land and purchased feed.
Table 3: Summary of household characteristics
Variables
Agro-ecology
Dega
Freq./Mean (Std)
Woinadega
Freq./Mean (Std)
Both
Freq./Mean (Std)
χ2 /t-
value
Sex (1=Male) 110 29 139(89.68%) 4.21**
Age (years) 45.76 (10.78) 44.48 (10.45) 45.49 (10.69) 0.61
Education level (years) 3.12 (3.13) 3.79 (3.81) 3.26 (3.28) 1.03
Family size (ME) 5.71 (1.80) 5.06 (1.80) 5.57 (1.80) 1.86**
Landholding (hectares) 1.17 (0.57) 1.87 (1.08) 1.31 (0.75) 4.96***
Farm income (birr) 19864.69
(13090.4)
19615.06
(11811.47)
19811.54
(12792.13)
0.10
Livestock (TLU) 4.64 (2.55) 5.17 (2.68) 4.75 (2.58) 1.04
Source: Computation from own survey data, 2017
According to the χ2 and t-test statistics results, there is a statistically significant difference in
sex, family size, and landholding among the two agro-ecologies (Table 3). These household
characteristics are likely to cause difference in choice of adaptation strategies to climate
change among the two agro-ecologies.

44
Concerning institutional characteristics of sample respondents, household heads who have
access to credit, farmer-to-farmer extension service, and climate information account 51.62%,
58.71%, and 58.71%, respectively. Some of the sample household heads have access to
climate related information from radio, television, and school in addition to obtaining the
information from the extension agent. Similarly, the average annual off-farm/non-farm
income, extension visit, distance to farm, and distance to market are 1793.55 birr, 25 visits,
1.38 kilometers, and 4.02 kilometers, respectively (Table 4).
The χ2 and t-test statistics results showed that there is a statistically significant difference in
average annual off-farm/non-farm income, extension visit, and distance to farm among the two
agro-ecologies (Table 4). Accordingly, these characteristics are likely to cause difference in
the choice of adaptation strategies to climate change.
Table 4: Institutional characteristics of sample households
Variables
Agro-ecology
Dega
Freq./Mean (Std)
Woinadega
Freq./Mean (Std)
Both
Freq./Mean (Std)
χ2 /t-
value
Access to credit(1=Yes) 65 15 80(51.62%) 1.85
Farmer-to farmer
extension (1=Yes)
67
24
91(58.71%)
1.22
Access to climate
information (1=Yes)
58
18
91(58.71%)
0.02
Non-farm income (Birr) 1366.20
(3036.37)
3502.94
(3329.79)
1793.55
(3202.94)
3.43***
Extension visit (number) 28.23 (18.03) 12.51 (8.17) 25 (17.67) 4.72***
Distance to farm (km) 1.20 (1.29) 2.08 (1.38) 1.38 (1.35) 3.32***
Distance to market (km) 3.96 (2.68) 4.23 (2.73) 4.02 (2.69) 0.51
Source: Computation from own survey data, 2017
The χ2 and t-test statistics have been also used to judge whether or not there are statistically
significant difference in the explanatory variables included in the analysis change with respect
to the difference in the choice of each adaptation strategies to climate.
The result showed that there are statistically significant differences in some of the factors
associated with using or not using of each of the major adaptation strategies by sample
households. The χ2 and t-test statistics (Table 5 and Table 6) confirmed that there are
statistically significant differences in landholding, farm income, access to credit, off-farm/non-
farm income, extension visit, distance to farm, and distance to market with respect to

45
differences in the choice of adjusting planting date. There is also a statistically significant
difference in family size, landholding, farm income, access to credit, and distance to farm with
respect to difference in the choice of agro-forestry as adaptation strategy. Besides, there
existed a statistically significant difference in education level, farm income, agro-ecological
setting, access to credit, access to climate information, extension visit, and distance to farm
with respect to difference in the choice of drought tolerant variety associated. Results also
revealed that there is a statistically significant difference in sex, education level, farm income,
livestock ownership, agro-ecological setting, access to credit, farmer-to farmer extension, off-
farm/non-farm income, and extension visit in terms of difference in the choice of SWC
practice. Finally, the test results verified that there is a statistically significant difference in
family size, landholding, farm income, access to credit, off-farm/non-farm income, access to
climate information, and distance to market associated with difference in the choice of
irrigation as an adaptation strategy to climate change (Table 5 and Table 6). These variables
are therefore likely to affect the choice of respective adaptation strategies to climate change.
These variables are therefore likely to affect the choices of each adaptation strategies to
climate change.

46
Table 5: Comparison for household characteristics amongst adaptation strategies
Variables
Adaptation strategies
Adjusting planting
date (y1) (n=155)
Freq./ Mean
Std
Agro-forestry (y2)
(n=155)
Freq./ Mean
Std
Drought tolerant
variety (y3) (n=155)
Freq./ Mean
Std
SWC practice (y4)
(n=155)
Freq./ Mean
Std
Irrigation (y5)
(n=155)
Freq./ Mean
Std
y1=1 y1=0 χ2 /t-
value
y2=1 y2=0 χ2 /t-
value
y3=1 y3=0 χ2 /t-
value
y4=1 y4=0 χ2 /t-
value
y5=1 y5=0 χ2 /t-
valu
Sex (Male) 78 61 2.00 52 87 0.96 66 73 0.44 95 44 15.18
***
84 55 0.65
Age (years) 45.96
10.05
44.93
11.45
0.60 46.73
11.11
44.70
10.40
1.15 44.64
10.17
46.29
11.17
0.96 45.75
10.42
45.03
11.23
0.40 46.11
10.59
44.59
10.87
0.87
Education
level (years)
3.51
3.47
2.97
3.05
1.02 3.28
3.42
3.25
3.21
0.06 4.04
3.48
2.54
2.93
2.91*
**
3.59
3.27
2.70
3.26
1.63* 3.48
3.46
2.95
3.00
0.98
Family size
(ME)
5.70
1.75
5.42
1.86
0.96 6.03
1.82
5.28
1.73
2.57*
**
5.67
1.83
5.49
1.77
0.62 5.63
1.87
5.47
1.67
0.53 5.96
1.80
5.01
1.65
3.30
***
Landholdin
g (hectares)
1.35
0.60
1.18
0.59
1.76*
*
1.40
0.59
1.19
0.59
2.22*
*
1.26
0.62
1.28
0.59
0.29 1.31
0.61
1.20
0.58
1.17
1.39
0.54
1.10
0.65
2.95
***
Farm
income
(‟000)(birr)
22.96
13.64
16.08
10.65
3.45*
**
23.95
14.26
17.19
11.06
3.30*
**
22.48
13.21
17.30
11.93
2.56*
**
22.18
14.10
15.73
8.87
3.11*
**
22.78
13.08
15.46
11.08
3.64
***
Livestock
(TLU)
4.84
2.26
4.64
2.93
0.49 4.80
2.68
4.72
2.53
0.19 4.66
2.45
4.84
2.71
0.44 4.52
2.13
5.15
3.19
1.46* 4.65
2.53
4.90
2.66
0.57
Source: Computation from own survey data, 2017

47
Table 6: Comparison for institutional characteristics amongst adaptation strategies
Variables
Adaptation strategies
Adjusting planting
date (y1) (n=155)
Freq./ Mean
Std
Agro-forestry (y2)
(n=155)
Freq./ Mean
Std
Drought tolerant
variety (y3) (n=155)
Freq./ Mean
Std
SWC practice (y4)
(n=155)
Freq./ Mean
Std
Irrigation (y5)
(n=155)
Freq./ Mean
Std
y1=1 y1=0 χ2 /t-
value
y2=1 y2=0 χ2 /t-
value
y3=1 y3=0 χ2 /t-
value
y4=1 y4=0 χ2 /t-
value
y5=1 y5=0 χ2 /t-
value
Agro-ecology
(1=Dega)
65 54 0.04 46 73 0.00 51 68 6.27*
*
80 39 3.53* 74 45 1.70
Access to
credit(1=Yes)
52 28 7.78*
**
38 42 5.38*
**
45 35 4.09*
*
60 20 9.86*
**
55 25 6.05*
*
Farmer-to
farmer extension
(1=Yes)
50 41 0.05 37 54 0.35 47 44 0.94 68 23 12.53
***
57 34 0.98
Access to
information
(1=Yes)
43 33 0.34 31 45 0.27 50 26 18.08
***
47 29 0.12 56 20 12.69
***
Non-farm
income
(‟000)(birr)
2.27
3.60
1.22
2.57
2.07*
*
1.54
2.66
1.95
3.50
0.76
1.60
2.69
1.97
3.62
0.72
1.54
2.59
2.23
4.02
1.29* 2.17
3.01
1.23
3.40
1.80*
*
Extension visit
(‟0) (number)
2.78
1.88
2.20
1.58
2.10*
*
2.71
1.90
2.38
1.67
1.10 2.82
1.83
2.21
1.67
2.17*
*
2.70
1.82
2.18
1.63
1.75*
*
2.42
1.73
2.64
1.83
0.77
Distance to farm
(km)
1.77
1.73
1.43
1.41
1.29* 1.27
1.15
1.83
1.80
2.12*
*
1.44
1.51
1.78
1.66
1.34* 1.51
1.42
1.80
1.87
1.06 1.66
1.63
1.55
1.55
0.42
Distance to
market (km)
4.30
2.67
3.68
2.68
1.44* 3.89
2.86
4.10
2.58
0.47 3.88
2.59
4.14
2.78
0.60 4.11
2.68
3.85
2.71
0.59 3.73
2.54
4.44
2.85
1.63*
Source: Computation from own survey data, 2017

48
4.2. Farmers’ Perception to Climate Change
According to the belief of majority of participants in the focus group discussion, todays‟
climate change and its‟ consequences are the results of umbrage of God/Allah. In addition,
they respond that there is a high level of deforestation and old aged trees are being cut for the
purpose of timber. According to their saying, the local government is the primary responsible
body for this evil practice. Each year, new seedling will be planted. But because of poor
follow up and management, almost all seedlings ceased to survive. The other practice that
aggravates climate change is the production of charcoal by cutting trees in the area.
The farmers were asked about their perception to the condition of climate in their district. To
do this, the two known climate attributes; the condition of temperature and rainfall have been
used. Temperature and rainfall parameters in annual average temperature and annual average
rainfall were used to describe farmers‟ perception on climate change. For the analysis of
perception of farmers‟ to climate change, the trends of climate data recorded at meteorological
station have been compared with the view of farmers about the direction of changes in
temperature and rainfall. Descriptive statistics and Likert scale measurement were used to
provide insights into farmers‟ perceptions of climate change.
4.2.1. Perception on temperature changes
The statistical records of secondary data on temperature in NMA Kombolcha sub-station for
the district in the period between 1993 and 2016 showed an increasing trend. Based on the
linear fitted line of average annual temperature on times in years, there is a general increase in
the average annual temperature distribution in the study area (Figure 3).
On the other hand, the result computed from the survey data showed that 87.74% of the
respondents perceived that there is an increase in temperature in the past 24 years. About
4.52% of respondents also perceived there is rather a decrease in temperature while 3.22%
recognize that there is no change in temperature and the rest 4.52% respond they do not know
about the trend of temperature (Table 7).
This survey result demonstrated that majority of the respondents recognized the increase in
temperature. This accounts the response of 87.74% of respondents out of sample households.
…

49
Figure 3: Trend of average annual temperature (0C) in Woreillu District from 1993-2016
Source: Computed from NMA data in Kombolcha sub-station
Accordingly, this implied that the perception of majority of the respondents is in line with the
fitted line for the data obtained from NMA and hence showed that farmers‟ actually perceived
the presence of climate change considering temperature as one attribute. Adeoti et al. (2106)
and Gadédjisso-Tossou (2015) also found that 84% and 72% of respondents perceived the
increase in temperature in their particular study areas, respectively.
Table 7: Perception of farmers on annual average temperature during the last 24 years
Perceived change Number of respondents (n=155) Percent (%)
Increased 136 87.74
Decreased 7 4.52
No change 5 3.22
I do not know 7 4.52
Source: Own survey result, 2017
y=0.0997x-178.313
R^2 =0.8143
12.00
13.00
13.50
12.50
15.00
14.50
14.00
15.50
16.50
17.50
16.00
17.00
18.00
An
nu
al A
ve
rag
e T
em
pe
ratu
re
1993
1996
1999
2002
2005
2008
2011
2014
2017
Time in Years
Trends of Annual Average Temperature
R2
=

50
4.2.2. Perception on rainfall changes
The fitted line from NMA data on rainfall illustrated that there is a slight decrease in average
rainfall distribution across years. More importantly, it is highly erratic in nature in its
distribution from year to year and makes production of crop and livestock difficult (Figure 4).
Figure 4: Trend of average annual rainfall (mm) in Woreillu District from 1993-2016
Source: Computed from NMA data in Kombolcha sub-station
Concerning the result from the survey, 83.22% of the respondents recognized that there is a
decrease in rainfall. In addition, 8.39% of the respondents perceived that there is no change in
the availability of rainfall while the remaining 4.52% and 3.87% believed that there is a
increase in rainfall availability and they did not know, respectively (Table 8).
The result from the survey assured that majority (83.22%) of the respondents perceived as
there is a decrease in rainfall. Fosu-Mensah et al. (2012) and Nega et al. (2015) also found that
87% and 94% of respondents perceived the decrease in rainfall in their respective study areas.
However, according to NMA data, in addition to the decrease in rainfall, erratic nature of
rainfall availability is the key climatic problem. Irregularity in rainfall distribution among
y = - 0 . 489 x + 1670 . 246
R^2 = 0.0009
400
500
600
700
800
900
1000
An
nu
al A
ve
rag
e R
ain
fall
1993
1996
1999
2002
2005
2008
2011
2014
2017
Time in Years
Trends of Annual Average Rainfall
R2
=

51
months and years is the major change observed. Therefore, it can be concluded that farmers‟
perception on the decrease in rainfall availability is right even though its irregularity is also the
key challenge and which did not in fact recognized by them.
Table 8: Perception of farmers on annual average rainfall during the last 24 years
Perceived change Number of respondents (n=155) Percent (%)
Increased 7 4.52
Decreased 129 83.22
No change 13 8.39
I do not know 6 3.87
Source: Own survey result, 2017
In general, perception of majority of farmers is in accordance with the climatic parameter
trends of Woreillu District for temperature and rainfall. The data for temperature and rainfall
trends showed that temperature is increasing and rainfall is slightly decreasing and erratic over
time. The trend analysis between average annual temperature and rainfall over time indicated
that average temperature and rainfall in the study area increases on average about 0.09970C
and decreases 0.489mm each year, respectively (Figure 3 and 4). Thus, majority of farmers‟
perceptions appear to be in accordance with the statistical temperature and rainfall record of
the area except irregular nature of the rainfall distribution. Nevertheless, there are still a
significant number of farmers‟ (16.78%) who didn‟t perceive the existence of climate change
in the area.
4.2.3. Likert rating scale result of climate change perception of farmers
A five point Likert scale measure was also used to measure the level of perception of sample
respondents for some selected attributes of climate change. Farmers who strongly agree and
who simply agree are considered perceived the change while others not.
Based on the result of this measurement, about 85.81% of the respondents perceived that there
is a time to time increase in temperature and 81.29% of the respondent perceived that there is a
decrease in rainfall amount time to time (Table 9). The result is in line with the trend of the
fitted data. Adeoti et al. (2016) and Gadédjisso-Tossou (2015) also found that majority of
smallholder farmers perceived the increase in temperature and the decrease in rainfall.

52
Majority of the respondents who accounts 94.2% also perceived that today‟s rainfall could not
properly support full crop growth period. Wondmagegn and Lemma (2016) also asserted that
79.1% of farmers perceived that rainfall could not support production. The result of the focus
group discussions confirmed that the rainfall is frequently exiting before or coming after the
growing season of crop. Regarding the condition of springs, streams and ponds, 89.68% of the
respondents perceived that they are drying out because of climate change. In the focus group
discussions, respondents mentioned that they are forced to use irrigation by pumping water
from streams using water pumps whenever the rainfall fails. This is also possible if there is
access to irrigation. However, it causes pollution and drying out of streams, and most severely,
loss of water for their cattle and for washing clothes. The stream Selgi is the victim of this
event. Similarly, 87.74% of the respondents observed an increase in the number of hot periods.
Large number of respondents who account 94.19% observed an early cessation of rainfall and
89.67% of respondents observed that the starting time of rainfall is lagging behind the usual
(Table 9). They declared that because of early cessation and lagging of the starting period of
rainfall, they could not produce much as it was possible before. Belg production which was
obvious in the district is totally ceased. The result also showed that about 87.74% of the
respondents recognized that crop disease and pest infestation increases and becomes problem
than earlier times which is also in line with Wondmagegn and Lemma (2016).
Similarly, 49.68% of the respondents recognized that the price of grain is hiking because of
decreased productivity resulted from climate change. Nearly 74.2% of respondents also
perceived that deforestation is becoming severe than earlier times in attempting to compensate
the decrease in income and livelihoods. Forests are cleansed for timber and charcoal
production and productions of traditional honey products become impossible.
Regarding migration, 52.26% of respondents perceived that the community is migrating to
cities due to inability of agriculture to support their livelihood. About 39.35% of the
respondents perceived that some sources of livelihoods of the community are changing due to
changing climate conditions and peoples are employed in the cities as a daily laborer. About
70.97% of respondents also observed as there is an increase in irregularity of rainfall. Finally,
only 30.32 % of the respondents perceived that the community is enough aware of the climate
change impacts (Table 9).

53
Table 9: Climate change perception index of farmers for the last 24 years (%)
Note: 1 = Strongly Disagree, 2 = Disagree, 3 = Neutral, 4 = Agree, and 5 = Strongly Agree
Source: Own survey result, 2017
4.3. Climate Change Adaptation Strategies
For this study, adaptations are adjustments or interventions, which take place in order to
manage the losses or take advantage of the opportunities presented by a changing climate. It is
the process of improving society‟s ability to cope with changes in climatic conditions across
Climate change signals and pattern of
changes
Local level perception (n=155)
1
2
3
4
5
There is an increase in temperature
from time to time
1.29
1.93
10.97
29.68
56.13
There is a decrease in rain fall amount
from time to time
1.93
4.52
12.26
33.55
47.74
Rain fall could not properly support
full crop growth period
0
0
5.80
28.39
65.81
Springs, streams and pond dying out 0 5.16 5.16 50.97 38.71
There is an increase in the number of
hot period
0
3.23
9.03
40.64
47.10
There is an early cessation of rainfall 0 2.58 3.23 18.71 75.48
Starting time of rainfall is lagging
behind the usual
0.65
3.23
6.45
30.97
58.70
Crop disease and pest infestation
increases and becomes problem than
earlier times
0
1.94
10.32
52.26
35.48
The price of grain is hiking because of
decreased productivity for climate
change
0
26.45
23.87
27.74
21.94
Deforestation is becoming severe than
earlier times to compensate the income
and livelihoods
0
1.94
23.86
40.65
33.55
The community is migrating to cities
due to inability of agriculture to
support their livelihood
6.45
24.52
16.77
46.45
5.81
Some sources of livelihoods of the
community are changing due to
changing climate conditions
4.52
25.16
30.97
30.32
9.03
There is an increase in irregularity of
rain fall
1.29
22.58
5.16
29.03
41.94
The community is enough aware of the
climate change impacts
5.81
40.65
23.22
9.03
21.29

54
time scales, from short-term to the long-term. The goal of an adaptation measure should then
be to increase the capacity of a system to survive external shocks or changes.
A number of adaptation options used by famers have been explored. Accordingly, the
following adaptation strategies have been identified as a prominent adaptation strategies used
in the district. These are identified by considering the number of frequencies of these
adaptation strategies among farmers as compared to all other options surveyed. It is found that
farmers are using adjustment of planting dates, practicing agro-forestry, using drought tolerant
varieties, SWC practices, irrigation, crop diversification, and changing livestock variety which
accounts the response of 54.19%, 38.71%, 48.39%, 63.22%, 59.35%, 34.19%, and 20.64%
sample households, respectively to reduce the negative impact of climate change (Table 10).
The use of SWC practices was the most common response among the five adaptation
strategies. On the contrary, use of agro-forestry was the least used adaptation strategy among
the five strategies. Respondents in the focus group discussion reasoned out that shortage of
farmland is the major impediment not to use agro-forestry because large proportion of their
land is allotted for production of food crops. In most cases, however, farmers use some
adaptation strategies in combination with other adaptation strategies. Finally, farmers retorted
that praying to God/Allah is the prominent solution to all this climate change related hazards.
Table 10: Summary of adaptation strategies used by farmers
Adaptation strategies Number of respondents(n=155) Percent (%)*
Adjusting planting date 84 54.19
Agro-forestry 60 38.71
Use of drought tolerant varieties 75 48.39
Soil and water conservation 98 63.22
Use of irrigation 92 59.35
Crop diversification 53 34.19
Changing livestock variety 32 20.64
Source: Own survey, 2017
Note: * Percentages cannot be added to 100 since a farmer can employ more than one
adaptation strategy at a time

55
More interestingly, the estimated MVP model results from 155 respondents‟ survey data are
also in line with this summary. Based on the estimated result, the likelihood of households to
adopt adjusting planting date, using of agro-forestry, using of drought tolerant varieties, using
of SWC practices, and using of irrigation are 54.1%, 38.9%, 47.8%, 63.4%, and 59.6%,
respectively. It also showed that the joint probability of using all adaptation strategies was
only 9.9% and the joint probability of failure to adopt all of the adaptation strategies was 6.3%
(Table 11). These adaptation measures help farmers guard against losses due to changes in
temperature and rainfall.
To use MVP model, the correlation coefficients of the error terms should be significant for any
pairs of equations. The likelihood ratio test of Rhoij = 0 is significant at 5% significance level
implying that the correlation coefficient of at least one pair of adaptation strategies is
statistically different from zero.
Table 11: Correlation matrix of adaptation strategies from the MVP model
Adaptation strategies
Adjusting
planting date
(Rho1)
Agro-forestry
(Rho2)
Use of
drought
tolerant
varieties
(Rho3)
Soil and
water
conservation
(Rho4)
Use of
irrigation
(Rho5)
Coefficient
(Std. error)
Coefficient
(Std. error)
Coefficient
(Std. error)
Coefficient
(Std. error)
Coefficient
(Std. error)
Rho2 -0.039
(0.149)
Rho3 0.098
(0.162)
0.256*
(0.146)
Rho4 0.266 *
(0.148)
0.061
(0.156)
-0.236
(0.161)
Rho5 0.147
(0.148)
0.338***
(0.133)
0.342**
(0.149)
-0.292*
(0.167)
Predicted
probability
0.541 0.389 0.478 0.634 0.596
Joint probability (Success) 0.099
Joint probability (Failure) 0.063
Likelihood ratio test of Rhoij = 0; P>χ2 (10) 0.0186**
Note: ***, **, and * signify level of significance at 1%, 5%, and 10%, respectively.
Source: Own computation from survey data, 2017
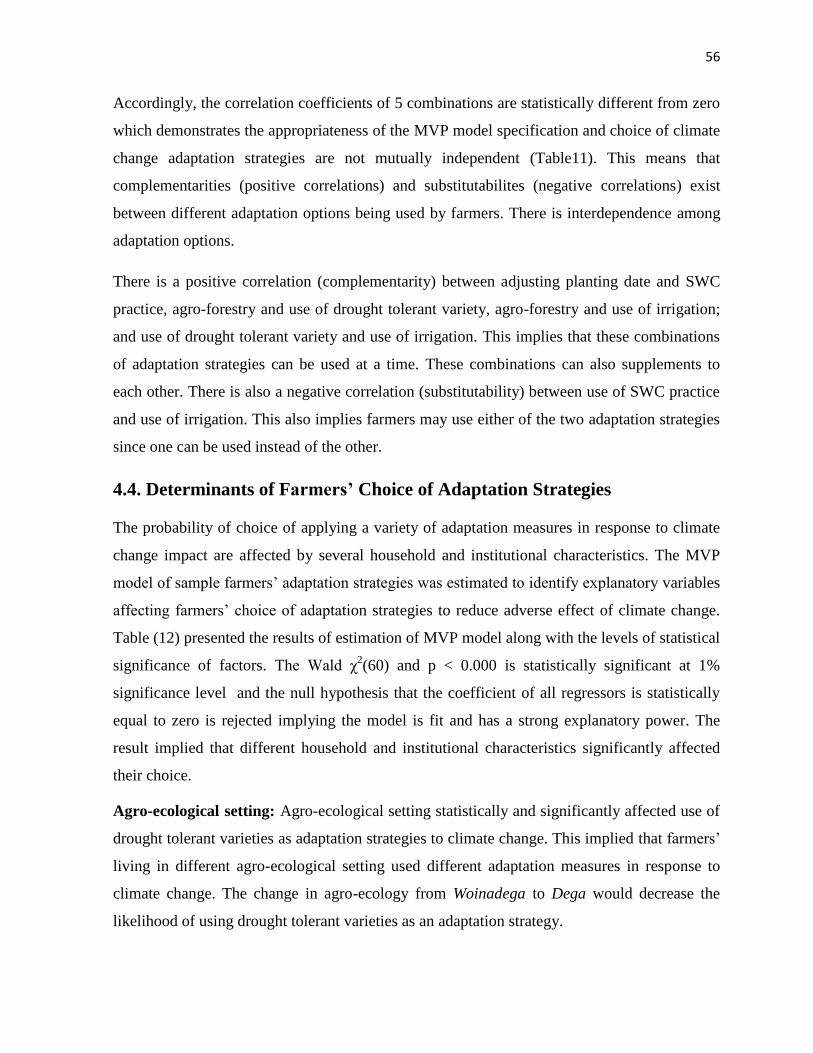
56
Accordingly, the correlation coefficients of 5 combinations are statistically different from zero
which demonstrates the appropriateness of the MVP model specification and choice of climate
change adaptation strategies are not mutually independent (Table11). This means that
complementarities (positive correlations) and substitutabilites (negative correlations) exist
between different adaptation options being used by farmers. There is interdependence among
adaptation options.
There is a positive correlation (complementarity) between adjusting planting date and SWC
practice, agro-forestry and use of drought tolerant variety, agro-forestry and use of irrigation;
and use of drought tolerant variety and use of irrigation. This implies that these combinations
of adaptation strategies can be used at a time. These combinations can also supplements to
each other. There is also a negative correlation (substitutability) between use of SWC practice
and use of irrigation. This also implies farmers may use either of the two adaptation strategies
since one can be used instead of the other.
4.4. Determinants of Farmers’ Choice of Adaptation Strategies
The probability of choice of applying a variety of adaptation measures in response to climate
change impact are affected by several household and institutional characteristics. The MVP
model of sample farmers‟ adaptation strategies was estimated to identify explanatory variables
affecting farmers‟ choice of adaptation strategies to reduce adverse effect of climate change.
Table (12) presented the results of estimation of MVP model along with the levels of statistical
significance of factors. The Wald χ2(60) and p < 0.000 is statistically significant at 1%
significance level and the null hypothesis that the coefficient of all regressors is statistically
equal to zero is rejected implying the model is fit and has a strong explanatory power. The
result implied that different household and institutional characteristics significantly affected
their choice.
Agro-ecological setting: Agro-ecological setting statistically and significantly affected use of
drought tolerant varieties as adaptation strategies to climate change. This implied that farmers‟
living in different agro-ecological setting used different adaptation measures in response to
climate change. The change in agro-ecology from Woinadega to Dega would decrease the
likelihood of using drought tolerant varieties as an adaptation strategy.

57
Table 12: Multivariate probit results of farmers‟ climate change adaptation decisions
Adaptation strategies
Independent
variables
Adjusting
planting date
Agro-
forestry
Use of
drought
tolerant
varieties
Soil and
water
conservation
Use of
irrigation
Coefficient
(Std. error)
Coefficient
(Std. error)
Coefficient
(Std. error)
Coefficient
(Std. error)
Coefficient
(Std. error)
Agro-ecology -0.052
(0.264)
0.019
(0.269)
-0.747***
(0.292)
0.273
(0.281)
0.271
(0.268)
Sex 0.508
(0.371)
-0.599*
(0.353)
-0.447
(0.380)
1.101***
(0.414)
0.058
(0.352)
Education level 0.017
(0.036)
0.007
(0.036)
0.122***
(0.038)
0.075*
(0.039)
0.029
(0.036)
Landholding 0.114
(0.213)
0.350*
(0.205)
-0.324
(0.229)
0.171
(0.231)
0.344*
(0.209)
Farm income 0.022*
(0.011)
0.021**
(0.010)
0.023**
(0.011)
0.025*
(0.014)
0.020*
(0.011)
Nonfarm income 0.783***
(0.241)
-0.182
(0.232)
-0.178
(0.245)
-0.029
(0.246)
0.398*
(0.242)
Livestock
ownership
0.009
(0.044)
-0.049
(0.047)
-0.056
(0.049)
-0.094*
(0.053)
-0.066
(0.047)
Access to credit 0.603***
(0.233)
0.424*
(0.224)
0.662***
(0.240)
0.523**
(0.239)
0.427*
(0.230)
Extension visit 0.023***
(0.007)
0.007
(0.007)
0.012*
(0.007)
0.008
(0.007)
-0.004
(0.007)
Farmer to farmer
extension
-0. 224
(0.240)
-0.018
(0.243)
-0.227
(0.255)
0.730***
(0.253)
0.108
(0.244)
Climate
information
0.045
(0.226)
0.050
(0.221)
1.031***
(0.244)
-0.334
(0.244)
0.753***
(0.228)
Distance from
farm
0.120
(0.072)
-0.163**
(0.083)
-0.119
(0.074)
-0.065
(0.074)
-0.003
(0.072)
Constant -2.201***
(0.642)
-0.514
(0.568)
0.006
(0.617)
-1.905***
(0.679)
-1.264**
(0.595)
Number of
observations
155
Number of
simulations
100
Log likelihood -411.69
Wald χ2(60) 152.17***
P-value 0.0000***
Note: ***, **, and * signify level of significance at 1%, 5%, and 10%, respectively.
Source: Own computation from survey data, 2017

58
The possible reason is that high temperature which enhances evapotranspiration loss and
creates heat stress is the common feature of midlands as compared to highlands. This makes
drought more severe in midlands and insists to use varieties that tolerate drought better than
others. This result is in fact in line with Gebru et al. (2015) and Temesgen et al. (2009) which
disclosed that agro-ecological setting affected changing crop variety. The study of Solomon et
al. (2016) also noted that difference in agro-ecological settings significantly affected the use of
climate change resilient variety in response to climate change which fortifies this finding.
Sex of the household head: Based on the result of the MVP model, sex of the household head
has a significant and negative influence on the use of agro-forestry and positive influence on
the use of SWC practice as an adaptation strategy. It implied that female headed households
are more likely to adopt agro-forestry than male headed households while male headed
households are more likely to use SWC practice than female headed households to adapt to
climate change. Perhaps agro-forestry practices are commonly undertaken near home that
females are more readily responsible. The other reason is the labor demanding nature of SWC
practices and male are usually involved in laborious activities as compared to females. In
addition, female headed households have limited access to inputs and institutions as a result of
traditional social barriers. Males are highly engaged in farm activities than females and have
better farm experience and information in the study area. The result is supported by Temesgen
et al. (2009) that found male headed households adopt SWC practices more readily than
female headed households. Male headed households were 9% more likely to conserve soil.
However, it is contrary to Nhemachena and Hassan (2007) which found that female-headed
households are more likely to take up SWC practices than male-headed households. It is also
contrary to Temesgen et al. (2009) and Abrham et al. (2017) which noted that males are more
likely to plant trees to adapt climate change.
Education level of the household head: The result of the MVP model showed that education
level of the household head found to be significantly and positively related with using drought
tolerant variety and SWC practice. Farmers who have more education level were more likely
to adapt to climate change using drought tolerant varieties and SWC practices than those who
do have lower education level. This result might emanate from the fact that education
improves farmers‟ capacity of obtaining and analyzing new information about climate change

59
and best adaptation practices that increases the probability of adapting to climate change. More
specifically, it equipped farmers with knowledge of selecting appropriate drought tolerant
variety and use of SWC practices. Various studies also reported a strong and positive
relationship between education and using drought tolerant variety and SWC practices. The
result is in line with Solomon et al. (2016), Gadédjisso-Tossou (2015) and Adeoti et al. (2016)
that confirmed as the educational level of the household head increases, the level of
understanding about climate change adaptation increases so that likelihood of using drought
tolerant and short season variety increases. Abrham et al. (2017) and Abid et al. (2015) also
noted that education has a positive influence on the use of SWC practices because it is likely
to enhance farmers‟ ability to receive, interpret and comprehend information relevant to make
innovative decision in the farms. In addition, the result of Temesgen et al. (2009) as well
asserted that the use of SWC practices and drought tolerant variety increase whenever
education level increases.
Landholding size: Landholding size significantly and positively affected use of agro-forestry
and irrigation in response to climate change. The bigger the landholding, the more likely the
farmer is to adopt agro-forestry and irrigation. The possible reason is that farmers who have
bigger farm size have an option to divide their farm into different enterprises. According to the
focus group discussions, they reach at a consensus that farmers who have a very limited land
size could not use agro-forestry. It is mostly because they produce consumption goods on the
farm they have. In addition, the farm of some households with small landholding may have
higher probability of not better suited for use of irrigation. This finding agrees with the result
found by Nhemachena and Hassan (2007) that noted an increase in landholding increases the
likelihood of applying irrigation in response to climate change. The result is contrary to
Aschalew (2014) that revealed large landholding size decreases the use of irrigation while it is
similar with the same author regarding the positive effect of landholding size on the use of
agro-forestry in response to climate change.
Farm income: Farm income was found to be statistically significant and positively related to
using adjusting planting date, agro-forestry, drought tolerant variety, SWC practices, and
irrigation. This implied that farmers who have higher farm income are more likely to adapt to
the change in climate using these strategies. When the main source of income in farming
increase, farmers tend to invest on productivity smoothing options such as using of adjusting

60
planting date, agro-forestry, drought tolerant variety, SWC practices, and irrigation. Farm
income enables the farmer to perceive and adapt to climate change by devoting higher money
for the purchase of seed and seedlings whenever the rain comes, buying a drought tolerant
variety and apparatus for the use of SWC practice and irrigation at higher price. Contentedly,
this result is supported by Temesgen et al. (2009) who confirmed that as farm income
increases the probability of adopting adjusting planting date, using drought tolerant variety,
using SWC practices, and irrigation increases. Aschalew (2014) also asserted that farm income
increases the probability of using agro-forestry. It is also in line with Aemro et al. (2012) that
noted as farm income increases the probability of adopting adjusting planting date, drought
tolerant variety, SWC practice, and irrigation increases.
Off-farm/non-farm income: Non-farm and off-farm income is significantly and positively
affected adjusting planting date and using of irrigation. The higher farmers have non-farm and
off-farm income, the more likely they were to adapt climate change using irrigation and
adjusting planting date. Perhaps the reason is farmers have had an optional income source that
enable them withstand the effect of climate change and they are also capable of buying
instruments for irrigation use. This result in fact proved the result found by Aemro et al.
(2012) and Temesgen et al. (2009) which stated non-farm or off-farm income increases the
likely of farmers to adjusting planting dates.
Livestock ownership: Ownership of livestock is also statistically significant and negatively
associated with SWC practices. Farmers who have large number of livestock in tropical
livestock unit are less likely to respond to climate change using SWC practices as an
adaptation strategy. The possible conviction is that since farmers use traditional way of
livestock husbandry system, it competes for land, time and labor with crop production. Cattles
are also likely to destroy terraces and soil bends. In addition, ownership of large livestock
implies the farmer is affluent and has alternative source of income so that he or she would give
less attention for crop production. Therefore, he or she participated less in SWC practice. This
result is contrary to the work of Abrham et al. (2017) which revealed that owning large
number of livestock in tropical unit increase farmers‟ likelihood of using SWC practices.
Access to credit: The MVP model revealed that farmer‟s access to credit has a statistically
significant positive effect on using of adjusting planting date, agro-forestry, drought tolerant

61
variety, SWC practice, and irrigation. Farmers who have access to credit are more likely to
adapt climate change by using these adaptation strategies. The result showed that having
access to credit increases the propensity of farmers to use the five adaptation strategies in
response to climate change. This is due to the fact that access to affordable credit mitigates the
financial limitation of the farmer and increases their ability to meet transaction costs
associated with the various adaptation options they might want to take. It enables farmers to
change their management practices in response to changing climatic factors and to buy
fertilizers, seedlings, drought tolerant varieties, irrigation technologies like water pumps and
other inputs to smoothening production and reduce the negative impact of climate change.
This result is supported by Gadédjisso-Tossou (2015) that found farmers who have access to
credit are more likely to adopt planting short season varieties. It is also consistent with the
work of Nhemachena and Hassan (2007) that strongly advocated the positive effect of access
to credit on the probability of adopting irrigation, SWC practices, adjusting planting date, and
using different crop variety in response to climate change by strengthening their financial
capacity. Besides, it is in line with Temesgen et al. (2009) that confirmed access to credit
increases the probability of using irrigation, SWC practices, and adjusting planting date in
response to climate change.
Extension visit: Extension visit was found to be statistically significant and positively related
to adjusting planting date and use of drought tolerant variety. This implied that having access
to extension visit increases the probability of adjusting planting date and use of drought
tolerant variety. Conceivably, the reason is that extension visit helps farmers to get informed
about contemporary climate related issues and plays a crucial role in improving farmers‟
knowledge about best adaptation practices to the change in climate. Hence, it enables farmers
to make decision based on substantial information. More specifically, it informs farmers when
to sow and what variety to use in response to climate change. In line with this finding, the
study by Temesgen et al. (2009) showed that extension service increases the chance of using
improved variety and adjusting planting date in response to climate change. In addition, Abid
et al. (2015), Gebru et al. (2015) and Aemro et al. (2012) also confirmed that extension visit
enhances the likelihood of using improved variety.
Farmer-to-Farmer extension: Farmer-to-farmer extension has a significant and positive
effect on using of SWC practices as one option to climate change adaptation. Accesses of such

62
services enhance the chances for farmers‟ decision to adapt to climate by enabling them to
share experience about and collectively apply SWC practices. Probably, the motive is that
such services provide the farmers with information about the agricultural adaptation practices
that are most suitable to their farms and practically tested by other farmer themselves. It serves
as a source of information and experience sharing among farmers about SWC practices. This
result is supported by Temesgen et al. (2009) who noted that access to farmers-to-farmers‟
extension services positively affected SWC practices in response to climate change.
Access to climate information: Access to climate information significantly and positively
affected using of drought tolerant varieties and using of irrigation. Farmers who have access to
climate related information from different media like radio and television have a higher
probability of using drought tolerant varieties and irrigation as an adaptation strategy in
response to climate change. Most likely, the reason is that access to climate information
permits to perceive the change and choose appropriate strategies in response to climate
change. Climate information notifies the situation of the existing climatic conditions to enable
the farmers to use alternative adaptation strategies like drought tolerant variety and irrigation.
The result is found to be the same with Gadédjisso-Tossou (2015) and Temesgen et al. (2009)
which asserted that access to climate information increases the likelihood of using short season
and improved variety in response to climate change. It is also supported by Gebru et al. (2015)
that confirmed access to climate information increases the use of irrigation. From the focus
group discussion, radio is the major source from which farmers obtain climate related
information.
Average distance from home to the farm: The average distance the farm is located from the
farmers‟ home has a statistically significant and negative effect on the use of agro-forestry in
response to climate change. When the farm of a farmer is located far from his or her home, he
or she is less likely to use agro-forestry in response to climate change. The reason for this
might be due to the fact that farmers whose farm is far from their home could not frequently
follow up their farm as compared to those whose farm is nearer to their home. In contrary to
this, agro-forestry practices needs a due management and close follow ups. Therefore, those
farmers whose farm is on average far from their home never use agro-forestry as an adaptation
strategy because they could not easily manage these investments so that it cannot sustain. This
result is in line with Aschalew (2013).

63
5. SUMMARY, CONCLUSIONS AND RECOMMENDATIONS
5.1. Summary and Conclusions
Climate change has adversely affected the livelihoods of people in developing countries where
a large proportion of the population is heavily dependent on agriculture. Long-term records
indicate that there have been severe and repeated rise in temperature and rainfall failures
resulting in severe food insecurity, including famines in Ethiopian due to significant loss of
crops and livestock. Farmers should thus be able to adapt in order to reduce the negative
impact of climate change.
A better knowledge on the level of perception of farmers to the changing climate and the
common adaptation strategies with their determinants is, therefore, vital as it permits to policy
makers to craft a host of strategies and instruments towards reducing climate change danger. It
is also important to make effective increment in output, self-sufficiency in food as well as
sustainable development possible.
This study was conducted to investigate farmers‟ perception and adaptation strategies to
climate change in Woreillu District based on 24 years time series data on temperature and
rainfall from NMA Kombolcha sub-office and cross-sectional survey data collected from 155
respondents. It answered the questions of what is the level of perception of farmers and the
major adaptation strategies to climate change and their determining factors.
Descriptive statistics and Likert scale measurement were used to analyze farmers‟ perception
to climate change. The results revealed that majority of the farmers are well aware of the
increase in temperature and the decrease in rainfall. As per the result of the descriptive
statistics, 87.74% and 83.22% of the respondents perceived the existence of climate change
with its attributes temperature and rainfall, respectively. Thus, majority of farmers perceived
the existing climate change in the study area. However, there are still a significant number of
farmers who didn‟t perceive the change yet and did not perceive the erratic nature of rainfall
distribution which was observed as the prominent change in the study area.
A multivariate probit model was used to identify factors affecting farmers‟ choice of
adaptation strategies to climate change. The study found out that there are five major
adaptation strategies: adjusting planting date, using of agro-forestry, using of drought tolerant

64
variety, using of irrigation, and SWC practice with their likelihood of being adopted 54.1%,
38.9%, 47.8%, 59.6%, and 63.4%, respectively. It also showed that the joint probability of
using all adaptation strategies was only 9.9% and the joint probability of failure to adopt all of
the adaptation strategies was 6.3%. In fact, the choice of adaptation measures by farmers also
has been affected by different factors. This study also explored the determinants of each of the
five adaptation strategies. Accordingly, the result of the MVP model verified that agro-
ecological setting, sex of the household head, education level of the household head,
landholding size, farm income, non-farm income, livestock ownership, access to credit,
extension visit, farmer-to-farmer extension, access to climate information, and average
distance from home to the farm are statistically significant determinants of farmers‟ choice of
adaptation strategies.
The strategy of adjusting planting date was positively affected by farm income, non-farm/off-
farm income, access to credit and extension visit. Use of agro-forestry was also positively
influenced by landholding size, farm income, and access to credit while it was negatively
affected by sex and distance of farm from home. Using drought tolerant variety was positively
affected by education level, farm income, access to credit, extension visit, and access to
climate information but negatively affected by agro-ecological setting. The choice of SWC
practice was positively associated with sex of the household head, education level, farm
income, access to credit, and farmer-to-farmer extension and negatively associated with
livestock ownership. Finally, the use of irrigation was positively associated with landholding
size, farm income, non-farm/off-farm income, access to credit and access to climate
information.
Generally, the result of this study provides applicable information for policy makers and other
stakeholders about the condition of awareness level of farmers for the changing climate to
commence interventions. It also identified the principal choice of adaptation strategies used by
smallholder farmers that need to be capitalized to best respond to the existing climate change.
Above all, it discovered the key factors to consider during intervention in order to exploit the
available adaptation strategies so that promote the adaptive capacity of farmers.

65
5.2. Recommendations
Based on the findings of this study, the following recommendations have been made for local
policy makers and stakeholders in the district.
The level of perception of farmers to climate change has a significant effect on the level of
using adaptation strategies to lessen the effect of climate change. But there are still a
considerable number of farmers who did not perceive the changing climate. Therefore,
emphasizing on awareness creation about the changing climate is crucial.
Policy interventions aimed at mitigating the adverse effect of climate change need to focus on
supporting farmers to intensively use and capitalize the existing adaptation strategies: use of
drought tolerant varieties, agro-forestry, adjusting planting dates, SWC practices, and
irrigation.
Intensifying efforts to improve awareness and adaptive capacity of farmers through improving
provision of extension service, encouraging farmer-to-farmer extension services and
motivating using of media is very critical. It is necessary to encourage informal social
networks and discussions at farmers‟ level so that enable them to share information and
experiences which are important for choice of appropriate adaptation strategies. Farmers also
need to be encouraged to use different media like radio, phone, and television to get access to
climate information so that they will be able respond to climate change.
Policies aimed at awareness creation about climate change and adaptation strategies need to be
framed considering agro-ecological setting and gender for effectiveness of interventions.
Promotion of a given adaptation strategies should consider the agro-ecological setting of the
area and gender difference needs special consideration for successful use of adaptation
measures by smallholder farmers.
It is necessary to design and implement policies that aim to expand adult education so that
improve education level of farmers. Literate farmers could be able to easily collect, analyze
and interpret relevant information about climate change and adaptation strategies. It will
enable them to select appropriate adaptation strategies and farming practices to manage
climate change impacts. Hence, it is essential to improve education level of farmers‟ through
expansion of adult schools and crafting systems that allow farmers to get education.

66
Creating opportunities for a diversified farm and off/non-farm income sources for the farmers
is important. Higher income increases the purchasing power of farmers and enables them to
easily meet the cost of farm inputs like drought tolerant variety, inputs for irrigation use like
water pump, seeds, seedlings and fertilizer. Hence, adequate farm inputs need to be available
to improve farm income and creation of alternative off-farm income source is very imperative.
The government and other stakeholders also need to inspire farmers who have large
landholding size for effective adaptation to climate change. They should suggest appropriate
adaptation strategies to practice through extension. On the other side, farmers with small
landholding should be encouraged for efficient use of successful adaptation to climate change.
Policy interventions should also focus on transforming the livestock husbandry system from
traditional way to modern. It helps to mitigate the land, time and labor requirement.
Promoting farmers‟ access to credit is vital to secure immediate need of money for the very
purpose of purchasing farm inputs and meet the costs associated with using various adaptation
strategies: adjusting planting date, using agro-forestry, using drought tolerant varieties using
SWC practices, and irrigation in response to climate change. Therefore, the outreach and
availability of formal credit providers that can be accessed with affordable interest rate need to
be increased to improve farmers‟ financial capacity.
Finally, the researcher recommend that further study need to be done on the impact of each
adaptation strategies in improving the livelihood of farmers and alleviate the problem of food
insecurity in the district.

67
6. REFERENCES
Abid, M., Scheffran, J., Schneider, U. A., and Ashfaq, M. 2015. Farmers' perceptions of and
adaptation strategies to climate change and their determinants: The case of Punjab
province, Pakistan. Earth System Dynamics, 6(1): 225-243.
Abrham Belay, Recha, J. W., Teshale Woldeamanuel, and Morton, J. F. 2017. Smallholder
farmers‟ adaptation to climate change and determinants of their adaptation decisions in
the Central Rift Valley of Ethiopia. Agriculture and Food Security, 6(1): 1-13.
Adeoti A.I, Coster, A.S and Akanni T.A. 2016. Analysis of farmers‟ vulnerability, perception
and adaptation to climate change in Kwara State, Nigeria. International Journal of
Climate Research, 1(1): 1-16.
Aemro Tazeze, Jemma Haji and Mengistu Ketema, 2012. Climate change adaptation strategies
of smallholder farmers: The case of Babilie District, East Harerghe Zone of Oromia
Regional State of Ethiopia. Journal of Economics and Sustainable Development, 3(14):
1-12.
AEO (African Economic outlook). 2016. African Economic Outlook 2016. Country Note
Ethiopia. Available online@ www.africaneconomicoutlook.org.
Akponikpè, P. I., Johnston, P., and Agbossou, E. K. 2010. Farmers‟ perception of climate
change and adaptation strategies in Sub-Saharan West-Africa. In ICID+ 18 second
international conference: Climate, sustainability and development in semi-arid
regions, Fortaleza - Ceará, Brazil.
Apata, T. G., Samuel, K. D., and Adeola, A. O. 2009. Analysis of climate change perception
and adaptation among arable food crop farmers in South Western Nigeria. In
Contributed paper prepared for presentation at the international association of
agricultural economists’ 2009 conference, Beijing, China, August 16 (Vol. 22, p.
2009).
Aschalew Shiferaw. 2014. Smallholder Farmers Adaptation Strategies to Climate Change in
Ethiopia: Evidence from Adola Rede Woreda, Oromia Region. Journal of Economics
and Sustainable Development, 5(7): 162-182.

68
Banjade, M. R. 2003. Local perception and use of information for Forest User Groups: Case
studies from Dhankuta District, Nepal. MSc thesis, Wageningen University,
Netherland.
Belaineh Legesse, Yared Ayalew and Woldeamlak Bewuket. 2013. Smallholder farmers‟
perceptions and adaptation to climate variability and climate change in Doba District,
West Hararghe, Ethiopia. Asian Journal of Empirical Research, 3(3): 251-265.
Belderbos, R., Carree, M., Diederen, B., Lokshin, B., and Veugelers, R. 2004. Heterogeneity
in R and D cooperation strategies. International journal of industrial organization,
22(8): 1237-1263.
Benedicta, Y., Paul, L. G., and Manschadi, A. M. 2010. Farmers‟ perception and adaptation to
climate change: A case study of sekyedumase district in Ghana. Tropentag, ETH
Zurich, Zürich, 14-16.
Bradshaw, B., Dolan, H., and Smit, B. 2004. Farm-level adaptation to climatic variability and
change: Crop diversification in the Canadian Prairies. Climatic Change, 67(1): 119-
141.
Bryan, E., Deressa, T. T., Gbetibouo, G. A., and Ringler, C. 2009. Adaptation to climate
change in Ethiopia and South Africa: Options and constraints. Environmental science
and policy, 12(4): 413-426.
Burton, I., and Cohen, S. J. 1992. Adapting to global warming: Regional options. In
International Conference on Impacts of Climatic Variations and Sustainable
Development in Semi-Arid Regions (ICID). Esquel Brazil Foundation, Brasilia, Brazil.
Christensen, J. H., Hewitson, B., Busuioc, A., Chen, A., Gao, X., Held, R., ... and Magaña
Rueda, V. 2007. Regional climate projections. In Climate Change, 2007: The Physical
Science Basis. Contribution of Working group I to the Fourth Assessment Report of the
Intergovernmental Panel on Climate Change, University Press, Cambridge, Chapter
11 (pp. 847-940).
Crimp, S. J., Stokes, C. J., Howden, S. M., Moore, A. D., Jacobs, B., Brown, P. R., and Leith,
P. 2010. Managing Murray–Darling Basin livestock systems in a variable and changing
climate: Challenges and opportunities. The Rangeland Journal, 32(3): 293-304.

69
CSA (Central Statistical Agency). 2007. Central Statistical Agency Population and Housing
Census of Ethiopia. Addis Ababa, Ethiopia.
Deressa, T., Hassan, R. M., and Ringler, C. 2008. Measuring Ethiopian farmers' vulnerability
to climate change across regional states. IFPRI discussion paper. No. 806.
Washington, DC.
Diggs, D. M. 1991. Drought experience and perception of climatic change among Great Plains
farmers. Great Plains Research, 114-132.
Downing, T. E., Ringius, L., Hulme, M., and Waughray, D. 1997. Adapting to climate change
in Africa. Mitigation and adaptation strategies for global change, 2(1): 19-44.
Elasha, B. 2006. Background paper for Vulnerability and Adaptation in Africa: The African
Workshop on Adaptation Implementation of Decision1/CP.10 of the UNFCC
Convention/Accra/Ghana.
EPCC (Ethiopian Panel on Climate Change). 2015. First Assessment Report, Working Group
II Agriculture and Food Security. Ethiopian Academy of Sciences.
FAO (Food and Agriculture Organization). 2003. Responding to agricultural and food
insecurity challenges: Mobilizing Africa to implement NEPAD programes. Conference
of ministers of agriculture of the African union, Maputo, Mozambique.
FAO (Food and Agriculture Organization). 2008. Climate change adaptation and mitigation in
the food and Agriculture Sector. Food and Agriculture Organization of the United
Nations, Rome, Italy. 58.
FAO (Food and Agriculture Organization). 2009. Climate Change in Africa: The Threat to
Agriculture. ftp://ftp.fao.org/docrep/fao/012/ak915e/ak915e00.pdf.
FAO (Food and Agriculture Organization). 2016. Ethiopia situation report. May 2016.
FDRE (Federal Democratic Republic of Ethiopia). 2016. Growth and transformation plan II
(2015/16-2019/20), Volume I. National Planning Commission. Addis Ababa, Ethiopia.
Fosu-Mensah, B. Y., Vlek, P. L., and MacCarthy, D. S. 2012. Farmers‟ perception and
adaptation to climate change: A case study of Sekyedumase district in Ghana.
Environment, Development and Sustainability, 14(4): 495-505.

70
Füssel, H. M. 2007. Adaptation planning for climate change: Concepts, assessment
approaches, and key lessons. Sustainability science, 2(2): 265-275.
Gadédjisso-Tossou, A. 2015. Understanding Farmers‟ Perceptions of and Adaptations to
Climate Change and Variability: The Case of the Maritime, Plateau and Savannah
Regions of Togo. Agricultural Sciences, 6(12): 1441-1454.
Gbetibouo, G. A., Hassan, R. M., and Ringler, C. 2010. Modelling farmers' adaptation
strategies for climate change and variability: The case of the Limpopo Basin, South
Africa. Agrekon, 49(2): 217-234.
Gebru Hadgu, Kindie Tesfaye, Girma Mamo and Belay Kassa. 2015. Farmers‟ climate change
adaptation options and their determinants in Tigray Region, Northern Ethiopia. African
Journal of Agricultural Research, 10(9): 956-964.
Greene, W. H. 2003. Econometric analysis, 5th
edition. Pearson Education India.
Gregory, P. J., Ingram, J. S., and Brklacich, M. 2005. Climate change and food security.
Philosophical Transactions of the Royal Society of London: Biological Sciences,
360(1463): 2139-2148.
Gutu Tesso, Bezabih Emana and Mengistu Ketema. 2012. Econometric analysis of local level
perception, adaptation and coping strategies to climate change induced shocks in North
Shewa, Ethiopia. International Research Journal of Agricultural Science and Soil
Science, 2(8): 347-363.
Hassan, R., and Nhemachena, C. 2008. Determinants of climate adaptation strategies of
African farmers: Multinomial choice analysis. African Journal of Agricultural and
Resource Economics, 2(1): 83-104.
Hausman, J., and McFadden, D. 1984. Specification tests for the multinomial logit model.
Econometrica: Journal of the Econometric Society, 1219-1240.
Huguenin, J., Pelgrin, F., and Holly, A. 2009. Estimation of multivariate probit models by
exact maximum likelihood. Institute of Health Economics and Management (IEMS)
Working Paper, (09-02).

71
IPCC (Intergovernmental Panel on Climate Change). 2001. Climate change 2001: Impacts,
adaptation and vulnerability. IPCC third assessment report, Cambridge University
Press.
IPCC (Intergovernmental Panel on Climate Change). 2007. Climate change 2007: Synthesis
report. Contribution of working Groups I, II and III to the fourth assessment report of
the intergovernmental Panel on climate change. IPCC, Geneva, Switzerland.
IPCC (Intergovernmental Panel on Climate Change). 2012. Glossary of terms in managing the
risks of extreme events and disasters to advance climate change adaptation. A special
report of working Groups I and II, Cambridge University Press, Cambridge, UK, and
New York, NY, USA. 555-564.
IPCC (Intergovernmental Panel on Climate Change). 2014. Climate Change 2014: Impacts,
Adaptation and Vulnerability: Regional Aspects. Cambridge University Press.
ISDR (Inter-Agency Secretariat of the International Strategy for Disaster Reduction). 2004.
Living with Risk: A global review of disaster reduction initiatives.
Joel, D., Scheraga, E. and Anne G. 1998. Risks, opportunities, and adaptation to climate
change.Washington, DC.
Kiehl, J.T., and Kevin E. Trenberth. 1997. Earth‟s Annual Global Mean Energy Budget.
Bulletin of the American Meteorological Society, 78:197-208.
Kothari, C. R. 2004. Research methodology: Methods and techniques. Second Revised
Edition. New Age International.
Krishna, P. P. 2011. Economics of climate change for smallholder farmers in Nepal. The
Journal of Agriculture and Environment, 12: 1-14.
Kurukulasuriya, P., and Mendelsohn, R. O. 2007. Endogenous irrigation: The impact of
climate change on farmers in Africa. Policy Research Working Paper 4278.
Development Research Group, Sustainable Rural and Urban Development Team. The
World Bank, 1818 H Street NW, Washington, DC 20433.

72
Kurukulasuriya, P., and Mendelsohn, R. 2008. A Ricardian analysis of the impact of climate
change on African cropland. African Journal of Agricultural and Resource Economics,
2(1): 1-23.
Kurukulasuriya, P., and Rosenthal, S. 2013. Climate change and agriculture: A review of
impacts and adaptations.
Lin, C. T. J., Jensen, K. L., and Yen, S. T. 2005. Awareness of foodborne pathogens among
US consumers. Food Quality and Preference, 16(5): 401-412.
Lobell, D. B., Schlenker, W., and Costa-Roberts, J. 2011. Climate trends and global crop
production since 1980. Science, 333(6042): 616-620.
Maddison, D. J. 2007. The perception of and adaptation to climate change in Africa. World
Bank Policy Research Working Paper, 4308. The World Bank, Washington, DC.
Mahoo H., Radney M., Kinyanji J., and Cramer L., eds. 2013. Climate Change Variability and
Risk Assessment of Agriculture and Food Security in Ethiopia: Which Way Forward?
CCAFS Working Paper N0. 59. CGIAR Research Program on Climate Change,
Agriculture and Food Security (CCAFS). Copenhagen, Denmark.
Masih, I., Maskey, S., Mussá, F. E. F., and Trambauer, P. 2014. A review of droughts on the
African continent: A geospatial and long-term perspective. Hydrology and Earth
System Sciences, 18(9): 3635.
Mengistu, D. K. 2011. Farmers' perception and knowledge on climate change and their coping
strategies to the related hazards: Case study from Adiha, central Tigray, Ethiopia.
Agricultural Sciences, 2(2): 138-145.
Mertz, O., Mbow, C., Reenberg, A., and Diouf, A. 2009. Farmers‟ perceptions of climate
change and agricultural adaptation strategies in rural Sahel. Environmental
management, 43(5): 804-816.
MoA (Ministry of Agriculture). 2000. Agro-ecological zonations of Ethiopia. Addis Ababa,
Ethiopia.
MoA (Ministry of Agriculture). 2011. Agriculture Sector Program of Plan on Adaptation to
Climate Change. Addis Ababa, Ethiopia.

73
Munasinghe M. and Swart R. 2005. Primer on climate change and sustainable development:
Facts, policy analysis, and applications. Cambridge University Press.
NBE (National Bank of Ethiopia). 2016. National Bank of Ethiopia Annual Report 2015/16.
Nega Debela, Mohammed, C., Bridle, K., Corkrey, R., and McNeil, D. 2015. Perception of
climate change and its impact by smallholders in pastoral/agropastoral systems of
Borana, South Ethiopia. SpringerPlus, 4(1): 236.
Nhemachena C and Hassan R. 2007. Micro-level Analysis of Farmers‟ Adaptation to Climate
Change in Southern Africa. IFPRI Discussion Paper No. 00714, Environment and
Production Technology Division, IFPRI, Washington DC.
NMA (National Meteorology Agency). 2007. Technical Reports for National Adaptation
Program of Action (NAPA) of Ethiopia.
PANE (Poverty Action Network Ethiopia). 2009. The Impact of Climate Change on Mil
lennium Development Goals (MDGs) and Plan for Accelerated and Sustained
Development to End Poverty (PASDEP) implementation in Ethiopia, Addis Ababa,
Ethiopia.
Parry, M. 2007. The implications of climate change for crop yields, global food supply and
risk of hunger. Centre for Environmental Policy, University of London and Hadley
Centre, London.
Pielke Sr, R. A. 1998. Climate prediction as an initial value problem. Bulletin of the American
Meteorological Society, 79(12): 2743.
Pittock, A. B. 2003. Climate change: An Australian guide to the science and potential impacts.
Ramamasy, S., and Baas, S. 2007. Climate variability and change: Adaptation to drought in
Bangladesh. A resource book and training guide. Rome, Italy FAO.
Saarinen, T. F. 1976. Environmental planning: Perception and behavior. Houghton Mifflin
Harcourt (HMH).
Solomon Addisu, Getachew Fissha, Birhanu Gediff and Yemane Asmelash. 2016. Perception
and adaptation models of climate change by the rural people of lake Tana Sub-Basin,
Ethiopia. Environmental Systems Research, 5(1): 7.
74
Storck, H., Berihanu Adnew, Bezabih Emana, and Shimelis W/Hawariat, 1991. Farming
system and farm management practices of smallholders in Harareghe highlands.
Farming systems and resource economics in the tropics, vol. 11, Wirtschafts-
Verlagvauk, Kiel, Germany.
Tadele Ferede, Ashenafi Belayneh, and Hanjra, M. A. 2013. Agroecology matters: Impacts of
climate change on agriculture and its implications for food security in Ethiopia. Global
food security: Emerging issues and economic implications, 71-112.
Temesgen Tadesse, Hassan R. M. and Ringler, C. 2009. Assessing Household Vulnerability to
Climate Change the Case of Farmers in the Nile Basin of Ethiopia: Environment and
Production Technology Division. IFPRI Discussion Paper. 00935.
Temesgen Tadesse, Hassan, R. M., Ringler, C., Tekie Alemu, and Mahmud Yesuf. 2009.
Determinants of farmers‟ choice of adaptation methods to climate change in the Nile
Basin of Ethiopia. Global environmental change, 19(2): 248-255.
Temesgen Tadesse, R. M. Hassan and C. Ringler. 2010. Perception of and adaptation to
climate change by farmers in the Nile basin of Ethiopia. Journal of Agricultural
Science. 1-9.
Temesgen Tadesse, Hassan, R. M., and Ringler, C. 2011. Perception of and adaptation to
climate change by farmers in the Nile basin of Ethiopia. The Journal of Agricultural
Science, 149(1): 23-31.
Temesgen Tadesse, Haymanot Yehualashet, and Rajan, D. S. 2014. Climate change
adaptations of smallholder farmers in South Eastern Ethiopia. Journal of Agricultural
Extension and Rural Development, 6(11): 354-366.
Tse, Y. K. 1987. A diagnostic test for the multinomial logit model. Journal of Business and
Economic Statistics, 5(2): 283-286.
UNDP (United Nations Development Programme), 2007. Human development report
2007/2008: Fighting climate change: Human solidarity in a divided world. New York.
Van den Ban, A. W., and Hawkins, H. S. 2000. Agricultural Extension, 2nd
edition. Blackwell
Science, UK.

75
WDADO (Woreillu District Agricultural Development Office). 2016. Woreillu District
Agricultural Development Office report, unpublished.
Weber, E. U. 2010. What shapes perceptions of climate change? Wiley Interdisciplinary
Reviews: Climate Change, 1(3): 332-342.
Wondimagegn Tesfaye and Lemma Seifu. 2016. Climate change perception and choice of
adaptation strategies: Empirical evidence from smallholder farmers in east Ethiopia.
International Journal of Climate Change Strategies and Management, 8(2): 253-270.
World Bank. 2006. World Development Indicators. The World Bank: Washington, DC.
World Bank. 2007. The Green Data Book. Washington, DC.
World Bank. 2010. Costing Adaptation through Local Institution. Village survey results,
Ethiopia. Draft Report of World Bank. Washington, DC.
Yibekal Tessema, Chanyalew Aweke and Getachew Endris. 2013. Understanding the process
of adaptation to climate change by small-holder farmers: The case of east Hararghe
Zone, Ethiopia. Agricultural and Food Economics, 1(1): 13.
Yohannes G/medhin. 2003. Ethiopia in view of the National Adaptation Program of Action.
National Meteorological Services Agency, Addis Ababa, Ethiopia.
Ziervogel, G., Cartwright, A., Tas, A., Adejuwon, J., Zermoglio, F., Shale, M., and Smith, B.
2008. Climate change and adaptation in African agriculture. Stockholm Environment
Institute, Sweden.

76
7. APPENDICES
7.1. Appendix I: Appendix Tables
Appendix Table 1: Conversion factors used to calculate Tropical Livestock Units (TLU)
Source: Storck et al. (1991)
Appendix Table 2: Conversion factor used to calculate man-equivalent (ME)
Age ME-Equivalent
Male Female
<10 0 0
10-13 0.2 0.2
14-16 0.5 0.4
17-50 1 0.8
>50 0.7 0.5
Source: Storck et al. (1991)
Animals TLU-Equivalent
Calf 0.2
Heifer and Bull 0.75
Cows and Oxen 1
Camel 1.25
Horse and Mule 1.1
Donkey 0.7
Sheep and Goat 0.13
Chicken/Poultry 0.013

77
Appendix Table 3: Long-term climate data of Woreillu District from 1993-2016
Year Mean minimum
temperature(0C)
Mean maximum
temperature(0C)
Average annual
temperature(0C)
Annual rainfall
(mm)
1993 7.3 21.4 14.4 610.7
1994 7.5 20.8 14.1 669.4
1995 6.4 22.1 14.3 785.8
1996 7.7 21.6 14.7 673.3
1997 8.6 21.9 15.3 414.2
1998 8.6 21.9 15.3 635.3
1999 7.7 21.1 14.4 751.1
2000 8.2 21.2 14.7 957.2
2001 9.6 21.2 15.4 652.0
2002 10.0 22.0 16.0 813.7
2003 10.0 21.6 15.8 601.0
2004 10.1 21.7 15.9 729.7
2005 9.7 21.7 15.7 591.9
2006 10.2 21.4 15.8 801.3
2007 9.9 21.5 15.7 807.3
2008 9.4 21.8 15.6 751.3
2009 10.5 22.3 16.4 670.6
2010 10.5 21.7 16.1 754.1
2011 10.1 21.9 16.0 592.0
2012 10.0 22.0 16.0 700.6
2013 10.2 22.4 16.3 803.2
2014 10.1 22.5 16.3 703.0
2015 10.4 22.7 16.5 523.1
2016 10.5 22.8 16.7 567.2
Source: NMA Kombolcha sub-office, 2017
7.2. Appendix II: Questionnaire for Interview Schedule
Questionnaire
I. Identification Data
1. Household Head code number …………………………….
2. Date of interview …………………………….
3. Name of Enumerator …………………………….
4. Name of the respondent‟s Kebele Administration ……….Village (Got) name……...…….
5. Agro-ecology: Dega Woinadega
6. Checked by supervisor ………………………Signature………………….Date …………

78
II. Household Characteristics and Institutional Related Questions
1. Gender of the house head? a) Female b) Male
2. Age of the household head? ………. years old.
3. Educational status of the households head? a) Illiterate b) Literate ………(years of
formal schooling)
4. Marital status a) single b) married c) divorced d) widowed
5. How many is the number of members of the household? ………Males and ...…Females
5.1. Number of active household members aged between 15-64 years.
Male…….………Female…...………Total …………………
5.2. Age category of members of the household
Age group Male Female Total
1 <10
2 10-13
3 14-16
4 17-50
5 >50
Total
6. Do you own land? a) No b) Yes
6.1. If “YES”, how much is the total farm land operated including any grazing land
(including rented land and excluding rented out land) during last production year (land
holding size)……………….. (in hectares)
6.2. Size of land rented in ……………. Size of land rented out………………..
7. How sloppy is your farm a) Plain b) Medium c) Very steep
8. What is the main source of household income? a) Crop production b) Livestock
production c) Mixed farming d) Other (Specify)……………………..
9. How many years of farming experience do you have? …………….years
10. How much income you get from your farm during the last one year? ………………birr.

79
10.1.Household Income from Crop Production
S.
No.
Type of
Crop
Meher Production Season
Belg Production Season
Quantity
Produced
(in
Quintal or
Kg )
Quantity
Sold (in
Quintal
or Kg)
Price
per
Kg
Total
Revenue
(ETB)
Quantity
Produced
(in
Quintal
or Kg )
Quantity
Sold (in
Quintal
or Kg)
Price
per
Kg
Total
Revenue
(ETB)
1 Teff
2 Wheat
3 Barley
4 Sorghum
5 Maize
6 Beans
7 Pea
8 Lentil
9 Chickpea
10 spices
11 Other
Total
10.2. Household income from Livestock and Livestock Products
S.No
Type of Livestock and
livestock products
From both MEHER and BELG Seasons
Quantity
Produced in
Number
Quantity Sold
in Number
Price per
Product
Total
Revenue
(ETB)
1 Milk/Butter/Cheese/Yoghurt
2 Honey
3 Egg
4 Hides and skin
5 Cow
6 Ox
7 Beef
8 Calf
9 Heifer and Bull
10 Sheep

80
11 Goats
12 Chickens
13 Donkeys
14 Mule
15 Camels
16 Pigs
17 Beehives
18 Other
Total
10.3. Estimate the amount of income you got from byproducts of crops and
livestock………………birr.
10.4. Total estimated farm income ………………….birr.
11. Do you have off-farm or non-farm income sources? a) Yes b) No
11.1. If “Yes”, mention some of the major sources and how much birr you earn in the last
one year.
S.No. Type of income Yes/No Total Income (ETB)
1 Petty trading
2 Remittance from relatives
3 Salary for nonfarm jobs
4 Gifts
5 From aid
6 From Pension
7 Sales of farm assets (Machineries,
building, trees, agricultural tools)
8 Sale of Nonfarm assets (TV, Fridge,
etc )
9 Other (handcraft,…..)
Total
11.2. Total estimated non-farm and off farm income………………….birr
12. On average how much is your total expenditure per year? Please specify in Birr…………
13. Dear respondent! How many of the following types of livestock do you have?

81
Please fill in the head count column.
S.No. Types of livestock Head count
1 Cow
2 Oxen
3 Bull
4 Heifer
5 Calf
5 Horses
6 Donkey
7 Mule
8 Camels
9 Goats
10 Sheep
11 Chicken
14. Do you have access for credit from any sources? a) Yes b) No
14.1. If YES, did you get credit for the past one year? a) Yes b) No
14.2. If “Yes”, how much money did you borrowed from any of the following sources
during the past one year? Total of …….…………birr
S.No.
Source
Yes/No
How often?
Total Amount
borrowed (ETB)
1 Relatives
2 Neighbors
3 Farmers associations or
Cooperatives
4 Commercial Banks
5 Traders
6 Other private money
lenders
7 Saving and credit
associations
8 Microfinance institutions
9 NGO
10 Women /Youth associations
11 Religious institutions
12 Government office
13 Other
Total
15. Do you have access to agricultural extension services? a) Yes b) No

82
15.1. If your answer for Q.15 is “Yes”, how many times the development agent/ health
extension workers visit you last year …………..…………..
15.2.What types of advices did you receive from extension workers? (multiple response is
possible)
a) Improved crop production systems
b) Improved livestock production
c) soil and water conservation
d) Irrigation use
e) Natural resource management
f) planting and harvesting time
g) Crop diversification
h) Using climate change tolerant variety
i) Others (please specify) …………………………
16. Does the extension agent provide you information on climate change? a) Yes b) No
17. If your answer for Q.16 is “Yes”, does it help you in choosing adaptation strategy to the
change in climate? If yes, in what way....................................
18. Have you heard information on climate change and adaptation strategies from your
neighbors/ farmer to farmer extension? a) Yes b) No
18.1. If “Yes”, how many times during the past one year? …………………..
19. Have you heard information on climate change, its consequences and adaptation other than
from extension agents and neighbors before?
a) Yes b) No
19.1. From which source you heard about climate change? (Multiple answers is possible)
a) Television (TV) b) Radio c) Newspapers d) school/college
e) Other (specify) …………………..
20. Did you get any training on climate related issues from any organization? a) Yes b) No
If “Yes”, specify the kind of training you received. …………………………………
21. How far is your farm from your home? In distance.…….. kms (one-way) or in time
………… hours (one-way).
22. How far is your home from the nearest market that you buy farm inputs? In distance
…..…… kms (one-way) or in time ………….. hours (one-way).

83
23. How productive is your land without fertilizer? a) High b) Medium c) Low
III. Climate Change Perception Assessment
24. Have you observed any change in climate in the last 24 years from now?
a) Yes b) No
25. If your response for Q.24 is “Yes”, how do you characterize the climate of this area in the
last 24 years? …………………………………
26. What do you say about the trend of level of temperature over the last 24 years?
a) Increased b) Decreased c) Not changed d) I don‟t know
27. Which local indicators do you use to evaluate the temperature trend in the area? (Please
support it with example)
a) Prevalence of human and animal diseases that are not familiar to the area (malaria etc)
b) Introduction of plant and animal species that were not popular in the area (goat in
highlands are not common)
c) Observation of physical structures and societal clothing styles (disappearance of ice
cover in mountain peaks, frost damage become uncommon, dry up of rivers , streams,
lakes, dressing light cloths etc )
d) Habitat shift towards higher locations
e) Other (specify)……………………………………………………………………….
28. What do you say about the trend of rainfall over the last 24 years?
a) Increased b) Decreased c) Not changed d) I don‟t know
29. Which local indicator do you use to evaluate today‟s rainfall pattern? ( multiple response is
possible)
a) Loss of some plant and animal species
b) Increased drought and flood frequency
c) Growing period shortened
d) Rainfall come early or lately
e) Decline of soil productivity/fertility
f) Decline of agriculture yields
g) Decreased available water
h) Other (specify)…………………………………………………………………………

84
30. In terms of the frequency of drought, what trends have you observed?
a) Increased b) Decreased c) Not changed d) I don‟t know
31. In terms of the frequency of flood, what trends have you observed?
a) Increased b) Decreased c) Not changed d) I don‟t know
32. In terms of the frequency of frost, what trends have you observed?
a) Increased b) Decreased c) Not changed d) I don‟t know
33. In terms of the frequency of others (specify), what trends have you observed?
a) Increased b) Decreased c) Not changed d) I don‟t know
34. What do you think is the cause of climate change?
a) Human actions
b) Natural process
c) The act of God
d) Both human action and natural process
e) I don‟t know/I have no idea. e) Other (Specify)…………………
35. Have you observed any change in the length of hot period in your life time? a) Yes b) No
36. If your answer for Q35 is Yes, how do you see it? a) Becomes shorter b) Becomes
longer c) No response
37. Have you observed any change in the amount of rainfall? a) Yes b) No
38. If your response for Q37 is Yes, how do you see it? a) Increased b) Decreased
c) Remaining the same d) Erratic nature
39. Dear respondent please fill the following if you are experienced with it.
Have you experienced with the
following types of climate change and
variability indicators?
Response How often? (in
past decade) Yes No
1 Drought
2 Floods
3 Off-seasonal rainfall
4 Too much rain
5 Too little rainfall
6 Higher temperature
7 Frost (coolness)

85
8 High winds
9 Others (specify)
40. In summary, have you observed the following climate change related impacts in last
decade?
No Climate change related impacts Yes No
1 Decline in crop yields
2 Increase in crop yields
3 Decline in livestock yields
4 Increase in livestock production
5 Death of livestock due to shortage of fodder and water
6 Food shortage /insecurity
7 Increased weed and pest pressures
8 Communicable diseases
9 Decrease of water quality and quantity
10 Higher risk of crop damage from drought
41. Likert scale measurement of perception of farmers to climate change:
No
Statement Point
Scales of Agreement
SA = 5 A = 4 N = 3 D = 2 SD = 1
1 There is an increase in temperature time to
time
2 There is a decrease in rain fall amount time
to time
3 Rain fall couldn‟t properly support full
crop growth period
4 Springs, streams and pond dying out
5 There is an increase in the number of hot
period
6 There is an early cessation of rainfall
7 Starting time of rainfall is lagging behind
the usual
8 Crop disease and pest infestation increases
and becomes problem than earlier times
9 The price of grain is hiking because of
decreased productivity for climate change
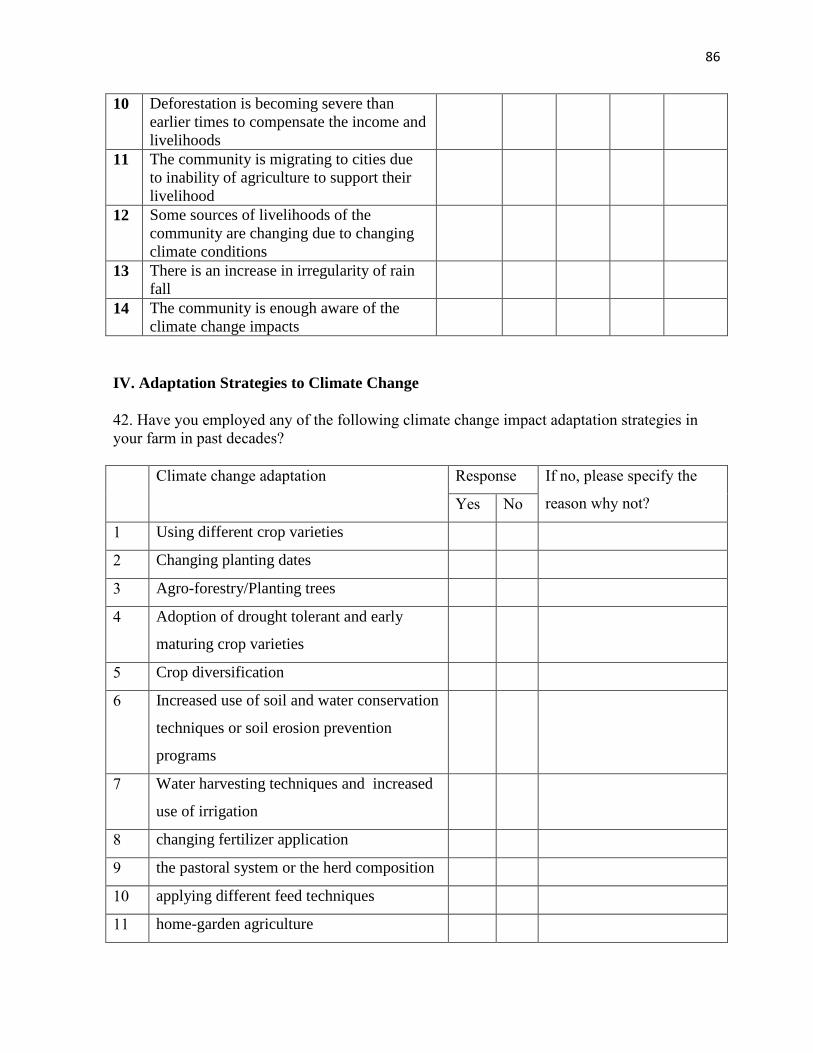
86
10 Deforestation is becoming severe than
earlier times to compensate the income and
livelihoods
11 The community is migrating to cities due
to inability of agriculture to support their
livelihood
12 Some sources of livelihoods of the
community are changing due to changing
climate conditions
13 There is an increase in irregularity of rain
fall
14 The community is enough aware of the
climate change impacts
IV. Adaptation Strategies to Climate Change
42. Have you employed any of the following climate change impact adaptation strategies in
your farm in past decades?
Climate change adaptation Response If no, please specify the
reason why not? Yes No
1 Using different crop varieties
2 Changing planting dates
3 Agro-forestry/Planting trees
4 Adoption of drought tolerant and early
maturing crop varieties
5 Crop diversification
6 Increased use of soil and water conservation
techniques or soil erosion prevention
programs
7 Water harvesting techniques and increased
use of irrigation
8 changing fertilizer application
9 the pastoral system or the herd composition
10 applying different feed techniques
11 home-garden agriculture

87
12 Buying insurance
13 Change livestock variety
14 Mixed farming
15 Temporary migration
16 Seek off-farm employment
17 Reduce number of livestock
18 Application of agro-chemicals
19 Fertilizer usage and application of animal
manure
20 Others (specify if any)
7.3. Appendix III: Guiding Questions for Focus Group Discussion
1. Explain the condition of environment in your locality. Do you feel the pattern of weather is
generally changing?
2. Have you ever heard about climate change? If yes, from which sources?
3. What is your observation on the climatic (temperature and rainfall) condition in your area?
4. What are your indicators to realize the presence of change in climate?
5. What is the cause of climate change (Traditional how people believe the cause)
6. What are the problems that you have ever experience because of climate change?
(Drought, flood,). For how many years during the last 24 years? Which one was the most
sever?
7. What are the impacts of climate change on agriculture and livelihood of rural people?
8. Do you think that the change in climate will continue in the future?
9. What are the adaptation strategies employed by farmers to minimize the adverse impact
climate change?
10. Identify any indigenous crop cultivar, which is now out of production due to climatic
change?
11. Identify any newly appeared crop infestation and diseases in your locality.
12. Do you sow your crops at different times or different places to avert risks of crop loss?
13. Do you switch to short maturing or drought resistance crop varieties instead of long
maturing crop verities? If yes, explain the crop types and the planting/ harvesting pattern.
14. Do you perceive that there are differences in adaptive capacities across your groups?

88
15. What factors affect the choice of adaptation strategies by smallholder farmers?
16. What are the main hindrances for use of adaptation options of combating climate change?
17. If you perceived climate change, but not adapt what other barriers do you have?
18. What agricultural technology and Meteorological information system do you access
regularly and during climatic extremes?
19. Do you have access to credit?
20. Do you have easy access to agricultural inputs such as seed?
21. Do you have sufficient knowledge about adaptation options?
22. Do you receive early warning information on short term variations and/or long-term
climate change from any sources?
23. What do you recommend to be done to enhance the fight towards climate change?