Family income and participation in post-secondary education
40
Analytical Studies Branch research paper series Family income and participation in post-secondary education By Miles Corak, Garth Lipps, and John Zhao Family and Labour Studies Division 24, R.H. Coats Building, Ottawa, K1A 0T6 Telephone: 1 800 263-1136 This paper represents the views of the authors and does not necessarily reflect the opinions of Statistics Canada. Catalogue no. 11F0019MIE — No. 210 ISSN: 1205-9153 ISBN: 0-662-34962-8 Research Paper
-
Upload
khangminh22 -
Category
Documents
-
view
2 -
download
0
Transcript of Family income and participation in post-secondary education
Analytical Studies Branch research paper series
Family income and participationin post-secondary educationBy Miles Corak, Garth Lipps, and John Zhao
Family and Labour Studies Division 24, R.H. Coats Building, Ottawa, K1A 0T6
Telephone: 1 800 263-1136
This paper represents the views of the authors and does not necessarily reflect the opinions of Statistics Canada.
Catalogue no. 11F0019MIE — No. 210
ISSN: 1205-9153
ISBN: 0-662-34962-8
Research Paper

Family income and participation
in post-secondary education
by
Miles Corak, Garth Lipps, and John Zhao
No. 210
11F0019MIE No. 210 ISSN: 1205-9153
ISBN: 0-662-34962-8
Family and Labour Studies Division Statistics Canada, Ottawa, Ontario
K1A 0T6
How to obtain more information : National inquiries line: 1 800 263-1136 E-Mail inquiries: [email protected]
October 2003 * Miles Corak is Director of the Family and Labour Studies Division at Statistics Canada and is also affiliated with Carleton University as an adjunct professor of economics and with the Institute for the Study of Labor (IZA) as a Research Fellow. Garth Lipps and John Zhao are Research Analysts with the Family and Labour Studies Division. An earlier version of this paper was presented at the Statistics Canada Economic conference and the Canadian Employment Research Forum conference on Education, Schooling and the Labour Market both held in Ottawa in May 2003. Comments from Michael Baker, Kevin Bishop, Dwaynne Benjamin, David Gray, Herb O’Heron, Gary Solon, and Alex Usher are greatly appreciated. This paper represents the views of the authors and does not necessarily reflect the opinions of Statistics Canada.
Aussi disponible en français

Table of Content
I. Introduction......................................................................................................................... 1 II. The Evolution of University Financing and the Responses of Students............................. 3 III. Methods and Data ............................................................................................................... 6 IV. Results............................................................................................................................... 11 V. Conclusion ........................................................................................................................ 13 Appendix....................................................................................................................................... 16 Bibliography ................................................................................................................................. 35

Abstract
The relationship between family income and post-secondary participation is studied in order to determine the extent to which higher education in Canada has increasingly become the domain of students from well-to-do families. An analysis of two separate data sets suggests that individuals from higher income families are much more likely to attend university, but this has been a long-standing tendency and the participation gap between students from the highest and lowest income families has in fact narrowed. The relationship between family income and post-secondary participation did become stronger during the early to mid 1990s, but weakened thereafter. This pattern reflects the fact that policy changes increasing the maximum amount of a student loan as well as increases in other forms of support occurred only after tuition fees had already started increasing. Keywords: University, Educational Finance, Intergenerational Mobility JEL: I2, J62
Published by authority of the Minister responsible for Statistics Canada
© Minister of Industry, 2003
All rights reserved. No part of this publication may be reproduced, stored in a retrieval system ortransmitted in any form or by any means, electronic, mechanical, photocopying, recording orotherwise without prior written permission from Licence Services, Marketing Division, StatisticsCanada, Ottawa, Ontario, Canada K1A 0T6.
Analytical Studies Branch – Research Paper Series - 1 - Statistics Canada No. 11F0019 No. 210
I. Introduction
In no policy area is the interplay between the social goals of efficiency and equity as evident as in education. A highly skilled workforce has long been seen as important in promoting economic prosperity, with theorists and policy makers alike emphasizing the contribution of human capital to economic growth. Many observers, in fact, feel this is becoming increasingly so. At the same time it is very hard to abstract from social goals related to equality of opportunity and a more inclusive society, and for many an important goal of the education system is to promote citizenship and active participation in society. For example, the Federal Government’s innovation strategy highlights both of these goals, emphasizing the importance of skills and learning in fostering innovation and growth in an era of the so-called “knowledge” economy, but in a way that encourages the full participation of all groups in society (Canada 2002). This implies there are two possible directions for the future of the education system: one in which the concerns of the market place are traded off against those of citizenship and inclusion, and another in which trade-offs are somehow not made and both goals are pursued simultaneously. Access to post-secondary education is one area that offers the clearest reflection of these two options: do we want higher education to promote excellence in a way that focuses resources on the few; do we want it to be universal and offer everyone the opportunity to participate; or can we have both excellence and inclusion? In fact, the federal government has pledged that among other things “one hundred percent of high school graduates have the opportunity to participate in some form of post-secondary education…” (Canada 2002, p.34). This milestone promises universal access to post-secondary education and as such speaks most directly to a growing worry that—at the very time its private and social returns are increasing—higher education will become the domain of those from more privileged backgrounds. On the one hand about 85% of Canadian parents hope their children will pursue post-secondary studies. This aspiration is shared across the income distribution, with 80% of those parents with less than $30,000 of income also holding this expectation (Statistics Canada 2001a). On the other hand the climate surrounding the financing of post-secondary education has changed significantly, with the 1990s witnessing notably sharp increases in university tuition fees. In this climate lower income families may not be as well positioned as higher income families to realize their expectations. For example, Statistics Canada (2001a) also reports that less than one-fifth of families with incomes of less than $30,000 are saving for the post-secondary education of their children, but about two thirds of those with more than $80,000 are doing so. For both these reasons—high expectations of participation and increases in the potential financial burden—“access” has become an important policy issue in understanding how higher education can promote growth and efficiency and at the same time equality of opportunity and social inclusion. The objective of our research is to inform this understanding by examining the relationship between family background, particularly family income, and the participation of the young in post-secondary education. What is the nature and strength of the relationship between post-secondary participation and family income, and how has it changed over the course of the last two decades or so? In other words, is higher education increasingly the purview of the well-to-do? This obvious and relevant question is surprisingly difficult to answer in large part because of data limitations. We use two complementary approaches in the hope of over-coming these limitations and offering an accurate estimate of the correlation between family income and post-secondary participation. In addition it should be noted that we use the term “access” to refer very

Analytical Studies Branch – Research Paper Series - 2 - Statistics Canada No. 11F0019 No. 210
broadly to participation in post-secondary education and at times more specifically to university. As such our analysis does not refer to the particular constraints that students may face in choosing their institution or field of study. The question as to whether the relationship between family background and entry into particular disciplines or institutions has changed would relate to a much narrower sense of the term “access” and is beyond the scope of our study. In the next section we begin by documenting the extent of the changes in university tuition fees, and in a limited way some of the possible responses of students. As an example, average Arts tuition started increasing significantly in 1990 and by the 2000/01 academic year was 86% higher. At the same time the 1990s also witnessed a significant variation in fees across provinces, across fields of study, and even between institutions. The most notable response by students has been to increase borrowing, particularly by those from parts of the country other than Quebec. This in part reflects an easing of borrowing limitations introduced to the Canada Student Loans Program in 1994. In section three we review a number of Canadian studies that examine the relationship between family background and post-secondary participation, most notably that by Christofides, Cirello and Hoy (2001). The major limitation of this work is that it all pertains to a period during the 1980s or early 1990s before the introduction of a higher tuition climate. It also does not make a distinction between participation in colleges and vocational schools on the one hand and universities on the other, nor does it distinguish the experience of young men from young women. Our analysis is intended to examine these three dimensions. In this section we also discuss the methods and data we employ. We use two alternative data sets and approaches, each with certain weaknesses, but which taken together may offer—we argue—an accurate estimate of the correlation between family income and post-secondary participation and how it has changed from the 1980s up to 2000.
Section four offers the results of our estimations and attempts to address a number of concerns inherent in our definitions, data, and approach. Our principle findings are three in number. First, we document slight increases in the participation of individuals from lower income households in university. Individuals from higher income families are certainly much more likely to be engaged in university education. But this has been a longstanding tendency, and if anything the gap between high and low-income participation rates has narrowed slightly. This in part reflects not just rises in the participation rates of those from the lowest income families, but also declines in the rates of those from middle income families. In contrast, there are no significant differences in college/vocational participation rates across income classes. Second, the correlation between parental income and university participation did in fact become stronger, but only to about the mid 1990s just after tuition fees first experienced substantial increases. The strength of the relationship has weakened since then. According to one set of estimates we produce every 10% increase in parental income was associated with a 2.7% increase in the probability of university attendance during the mid 1980s; with a 4.3% increase in 1994; but with only a 2.5% increase in 2000. Further, the results are more muted when the broader post-secondary system—including colleges and vocational institutions—is analysed. However, these results pertain to women, and our third major finding has to do with the fact that the patterns for young men are different. In particular, the run up in the correlation is not as great, and the subsequent decline is quicker. In sum, we find no evidence that the correlation between family income and post-secondary participation has increased during the latter half of the 1990s, indeed just the opposite. This may

Analytical Studies Branch – Research Paper Series - 3 - Statistics Canada No. 11F0019 No. 210
reflect the fact that students have responded in a number of different ways, most notably by borrowing more. If there was a period of a tighter link between family income and participation it was in the early 1990s when tuition fees began increasing but during which policy changes easing borrowing limits and offering increases in other forms of financial assistance had not yet been put into place. We also find a tendency for men to choose college education over university education. As a result, the latter part of the 1990s should not be characterized as a period in which the university system has become the domain of the relatively more privileged any more than it has been in the past, but rather a period in which the costs of higher education have shifted at least in part onto students. This is also a period in which the system has become more differentiated as the costs of programs varied more substantially between provinces, fields of study, and institutions. If there is a growing concern to be dealt with in terms of “access” future research should examine the consequences of this differentiation. Even though globally all Canadians have access to some form of post-secondary education, are particular institutions and particular fields of study—perhaps those more valued in the new economy—the domain of students with higher income backgrounds? Future research should also focus on the factors earlier in the lives of young people that place them in the fortunate circumstance during their late teens of having to choose whether or not to participate in post-secondary education. II. The Evolution of University Financing and the Responses of Students
The main source of revenue for universities comes from provincial grants and contracts, and the two panels of Figure 1 illustrate that there have been three distinct periods in the evolution of this funding. The first is a period of steadily declining funding on a per student basis, reflecting stable funding in absolute terms during a period of rising enrolments. This began in the mid/late 1970s and continued to the 1985/86 academic year, when enrolments went from about 240,000 to 472,000. Throughout this period universities received in real terms about $6.3 billion annually, but on a per student basis this reflected a decline from about $20,000 to $13,000. The second period is characterized by increases in funding levels and a resulting plateauing of per student funding. This period ends in 1992/93 when increases in absolute transfers peaked at about $7.3 billion after seven consecutive annual increases. During this period the number of full-time equivalent university students increased from 472,000 to 575,000. The third period begins thereafter and is characterized by declines in both absolute and per student funding. By the end of the 1990s per student funding, at just under $11,000, is almost half of what it was 25 years earlier and reflects a return to absolute funding levels of the 1980s and late 1970s. In this context universities have, among other things, increased the fees they charge students, the most important element of which is tuition for credit courses. As an example, Figure 2 charts developments in tuition fees for Arts programs, which fell in real terms during the 1970s, remained flat during the 1980s, and then began to increase sharply after the 1989/90 academic year to reach historic highs by the end of the 1990s. Average weighted Arts tuition fees for the entire country (expressed in $2001) rose from $1,866 in 1990/91 to a peak of $3,456 in 1999/00, after which they remained relatively constant. These Canada-wide developments mask the fact that fees are significantly different between the provinces and have increased at different rates. They rose in all regions during the early 1990s but students in Nova Scotia have consistently paid the highest fees and have also faced the largest increases. Particularly sharp increases also occurred in Ontario and Alberta. Students from Quebec experienced steadily declining fees (from $2,215 in 1972/73 to a low of $663 in 1989/90) followed by a near doubling between
Analytical Studies Branch – Research Paper Series - 4 - Statistics Canada No. 11F0019 No. 210
1989/90 and 1990/91. But with an average arts tuition of just under $2,000 in 2001/02, students in Quebec still pay the lowest tuition for Arts programs. Toward the end of the period average Arts tuition in British Columbia, Manitoba, and Newfoundland and Labrador all declined, but continued to increase elsewhere. These changes have led to a substantial increase in the dispersion of tuition fees between provinces. In 1978/79 the difference between the highest and lowest tuition was $1,130; by 2001/02 it had grown to $2,820. A similar story can be told by field of study and even by institution. University tuition fees have increased for all fields but not uniformly, with some professional programs experiencing particularly sharp increases during the 1990s. Between 1995/96 and 2001/02 average fees in Dentistry more than doubled (increasing from $3,389 to $8,491), while those for Medicine went from an average of $3,207 in 1995/96 to $6,654 in 2001/02. During the 1990s increases in fees for Law and Graduate Studies closely mirrored increases in overall Arts tuition fees, and while those for Education increased during the 1990s they did so to a relatively much smaller degree from $1,887 in 1990/91 to $2,892 in 2001/02). Indeed, on average Education students paid the lowest tuition fees of any field of study between 1991/92 and 2001/02. At the same time it should be noted that not all institutions responded in the same way. For example, between 1994/95 and 2001/02 tuition fees for Dentistry at the University of Toronto quadrupled (increasing from $3,235 in 1994/95 to $13,230 in 2001/02), but at the other extreme fees charged by the University of British Columbia actually dropped (from $4,300 in 1994/1995 to $3,740 in 2001/02). Similarly, tuition for medicine at the University of Toronto more than tripled from $3,484 in 1995/96 to $11,550 in 2001/02, but at the University of British Columbia they fell over the same period from $4,399 to $3,740.1 How have students responded to these changes? Some of the possible responses include: choosing a different field of study or a different institution, borrowing more from public or private sources, working more during the summer or during studies, pursuing part-time studies or otherwise taking longer to complete studies, saving on other aspects of education costs like living arrangements by for example living at home longer, deciding not to pursue university education and going instead to college, or finally not pursuing post-secondary education at all and entering the labour market sooner. It may well be that “access” to particular institutions or fields of study has changed and that the burden of adjustment has fallen more on students from some income groups than others. The result may be that the relationship between family income and participation is now different by field of study or institution. We do not use the term “access” in this narrow sense nor do we offer a full assessment of all the possible changes in student behaviour. Our focus is rather on “access” in the broadest sense of the term: has participation in higher education changed and how is this related to family income after all of these choices and adjustments have been made. The final outcome of the decisions students have made in response to all of the factors—not just tuition fees—they consider when choosing their level of education is illustrated in Figure 3. Overall participation rates in post-secondary education for 18 to 24 year olds are plotted from 1979 to 2002. In this chart post-secondary participation refers to a combination of information on current school attendance and highest level of education attained. For example, University
1 The source for these data is Statistics Canada, Tuition Fees and Living Accommodations at Canadian Universities Survey. Detailed information on tuition fees are available from this source for a host of disciplines for each degree granting institution in Canada from 1979 to 2002.

Analytical Studies Branch – Research Paper Series - 5 - Statistics Canada No. 11F0019 No. 210
participation refers to those who have completed a university degree or certificate at some point between the ages of 18 to 24 or who are currently enrolled in university. The definition is similar for College (which refers more specifically to Community College, CEGEP or Trade-Vocational School participation), while Drop-outs are those who report having some post-secondary education but who have not completed a degree or diploma and are not currently enrolled. Overall participation in higher education is at historic highs, but the rates of growth have slowed significantly during the 1990s. University participation rates increased steadily during the 1970s and 1980s and peaked in 1993 at 24%. There is a distinct drop of two percentage points between 1993 and 1994, and since that time participation rates have been flat at 22 to 23%. College rates also increased throughout the 1970s and 1980s, but display a slightly different pattern during the 1990s by continuing to grow (albeit at a much reduced rate). The drop-out rate has not changed much in the last two decades, perhaps even falling a bit during the 1990s. In short there is little evidence to suggest that drop-out rates have increased, some evidence to suggest that college may have been chosen over university by a small fraction of post-secondary participants, and while the rate of growth of university participation has stalled, there is no evidence to suggest declines below the levels experienced in the late 1980s and early 1990s before the sharp run up in tuition fees. These patterns are somewhat different by gender, as depicted in Figure 4. Participation in university declined between 1992 and 1993 for both men and women, but the pattern thereafter is different. University participation rates declined steadily for men after 1993 while community college attendance steadily increased. If there is a tendency for students in the 1990s to choose community college over university in response to high tuition fees this is almost totally a phenomenon associated with men. There was a temporary increase in college attendance by women during the early to mid-1990s, matched by a temporary fall in university attendance. But after 1995 female university participation returned to a path of steady growth and college participation stagnated with the result that by 2002 the participation rates were about the same. The strong majority of university students do not work while studying but this has changed slightly after about 1993 and particularly after 1997. Figure 5 illustrates that during the 1980s an average of 63% of university students did not work while studying, but this fell from 65% in 1993 to 59% in 1995 reflecting an equivalent percentage point increase in the fraction working part-time. Things have not changed much since that time with the fraction not working at all standing at 58% in 2002 and those working part-time at 34%. There is a greater tendency for college students to be working during their studies. In contrast to university students only 50 to 60% of college students do not work while studying. Like university students there has been a tendency for this to fall through time, but the decline has been a long-term trend. With the exception of a possible jump in the fraction working part-time between 1996 and 1997, this tendency does not seem any more pronounced during the 1990s than it did earlier. By 2002, 43% of college students were working part-time, and less than 50% were not working at all during their studies. In contrast, the majority of university students do not work while at school, but there was a small discrete increase in part-time work among university students between 1993 and 1995. The living arrangements of students have not changed very much during the last two decades and in particular there are no noticeable changes during the 1990s. Figure 6 offers the proportions of university and college students living at home, on their own, as a married couple, or in other arrangements. The fraction at home has hovered between 70 and 80% since 1979, and is about

Analytical Studies Branch – Research Paper Series - 6 - Statistics Canada No. 11F0019 No. 210
the same for the two groups. A certain caution is needed, however, in interpreting these data. The “At Home” category refers, strictly speaking to those whose “usual place of residence” is stated as being that of their parents. “Usual place of residence” is a construct of the survey taking process and refers to “the dwelling in Canada where a person lives most of the time” (Statistics Canada 2001b, p. 141-42). This does not necessarily imply that these students are living at their parents’ residence while studying. Some fraction may in fact be doing so, but another fraction may be attending an institution in another locale and returning to their parents’ home during the summer while continuing to refer to it as their usual place of residence. Bowlby and McMullen (2002) find that approximately 43% of first year university students lived with their parents during the school year and 41% reported living in a university residence. It may well be that the relative shares in these two groups have changed through time. This implies that in spite of the information in Figure 6 it may be the case that students are choosing to attend institutions closer to home in order to save on moving and living expenses. The most notable change in the decisions of those attending post-secondary schools has been with respect to borrowing. Between academic years 1986/87 and 1988/89 the number of borrowers fell by about 15%, but this trend was reversed in the 1990s so that the total number of borrowers increased from just over 300,000 at the beginning of the decade to over 500,000 by the end (Junor and Usher 2002, p. 105). Further, during the 1990s the average student loan increased considerably (Figure 7). More precisely between the 1992/93 academic year and the 1993/94 academic year the average amount borrowed through the provincial loans programs and the Canada Student Loans Program went from about $5,000—where it had been since the early 1980s—to over $7,500. It increased a bit further thereafter ending the 1990s at $7,680. This information, however, refers only to those students living in provinces other than Quebec.2 In Quebec, there has been only a modest tendency for the amount of the average student loan to increase, and no discrete changes in this relationship during the 1990s. At the end of the decade this figure was $3,360. The very sharp jump in student loan amounts between the 1992/93 and 1993/94 academic years reflects in part an administrative change that increased the limit on the maximum CSLP loan amount from $105/week to $165/week in 1994. Provinces which took part in the CSLP were obliged to match this increase according to a 60/40 ratio. This shift in policy also led to an increase in the number of students receiving provincial student loans since participating provinces previously only provided loans and grants to those whose need exceeded $105/week, and the policy change prompted many provinces to end their grant programs and convert them to loan-granting programs. Junor and Usher (2002, p.110) also report that within one year the maximum allowable loan went from $105 per week to $275 per week in many provinces.
III. Methods and Data
Our major objective is to offer an accurate estimate of the strength of the relationship between parental income and child post-secondary participation. The issue of family background and post-secondary participation is a longstanding concern in both academic and policy circles, with Bouchard and Zhao (2000) and Knighton and Mirza (2002) offering two recent Canadian 2 Quebec, Nunavut and the North West Territories have opted out of the Canada Student Loans Program and administer similar programs on their own. Quebec’s program functions in a manner similar to the Canada Student Loans Program but with different levels of support.

Analytical Studies Branch – Research Paper Series - 7 - Statistics Canada No. 11F0019 No. 210
examples. Their analyses, however, are focused on the socio-economic status of families, measured as an index related to parental education and occupation. Our focus is explicitly on family income and can be summarized as follows. Let Yi represent the post-secondary status for a young individual labelled i, which we will consider to be those 18 to 24 years of age. Y takes on the value of 1 if the individual has a post-secondary degree or diploma or is attending a post-secondary institution, and 0 otherwise. In addition let Xi represent the permanent income of individual i’s parents. We wish to obtain accurate estimates of β1 in the following equation. Yi = β0 + β1Xi + εi (1)
This is estimated using Least Squares. Equation (1) is a linear probability model of post-secondary participation, and when parental income is expressed in natural logarithms the coefficient β1 indicates the change in the chances of post-secondary schooling for each percentage point change in income.3 The greater this coefficient, the greater the impact changes in parental income will have on post-secondary participation. (The term β0 is a constant and εi is
a random component.) Under certain assumptions β1 can be thought of as the correlation between post-secondary participation and parental income. Only a limited number of studies have directly analyzed the correlation between family income and post-secondary participation. In part this may reflect data limitations. There are very few surveys that contain information on parental income and the post-secondary participation of children. One possibility is to use longitudinal surveys in which family income is collected while high school students still reside in the parental home and then observing these students through time as they leave and make their way either into post-secondary education or into the labour market. Zhao and de Broucker (2001, 2002) use the Survey of Labour and Income Dynamics in this way to document the relationship between family income and the post-secondary participation of 18 to 21 year olds between 1993 and 1998. They find that about 19% of youth from families with incomes in the lowest 25% of the income distribution attend university and that double that fraction do so for families in the top 25%. College attendance rates are just under 30% regardless of the position in the income distribution. Because of the need to observe young people leaving the family home the sample size for any given year can be quite small. The authors are therefore forced to pool all 18 to 21 year olds over the entire six years of longitudinal data available to them in order to obtain reliable estimates. As such there is no scope to illustrate how the relationship between income and post-secondary participation has changed. The starting point for our analysis is a study by Christofides, Cirello and Hoy (2001), which uses a different approach. The major issue they explore relates to the observation that between 1975 and 1993 the participation rate in post-secondary education of children from families in the lower 3 Moffitt (1999) offers an overview of the use empirical methods for binary dependent variables, and in particular highlights the limits and appropriate use of the linear probability model, stressing that traditional objections need not always apply. Following his analysis we use the linear probability model, as opposed to probit or logit models, since there is little possibility of predications outside of the 0-1 range, our concern is with an overall correlation and not with underlying structural parameters, and since non-linearities are less likely to be a problem given the probabilities of concern are likely in the lower tail of the distribution.

Analytical Studies Branch – Research Paper Series - 8 - Statistics Canada No. 11F0019 No. 210
end of the income distribution increased a lot more than those in the higher end. For example in 1975 children whose families were in the top fifth of the income distribution were almost three times as likely to be engaged in higher education than those from the bottom fifth, but in 1993 they were only 1.6 times as likely. The authors seek to examine the extent to which this reflects a disproportionately greater change in the demand for higher education among those in the bottom of the income distribution as their real income increases. They find that while income levels are certainly an important factor determining post-secondary participation, a disproportionate influence of income changes on the schooling choices of lower income groups does not explain the observed convergence in relative participation rates. We pick up on and extend three aspects of their study. First, our interest has less to do with their specific hypothesis than with the nature of the relationship between absolute income levels and post-secondary participation and how this has changed. They document that higher income families are much more likely to have their children attend post-secondary education, but that lower income groups have experienced relatively greater increases in participation over time. This finding, however, refers only to the period up to 1993 just as significant changes in post-secondary began.4 We update these patterns into the late 1990s. Second, they make no distinction between university education and community college education. The relationship between family income and post-secondary participation could be very different across these levels and as alluded to in Figure 3 changes in enrolment and substitution between the two levels could be an important dimension of access. We employ a distinction between university and college in our analysis. Finally, the authors offer no distinction in participation by gender. As illustrated in Figure 4 there are important differences in participation by gender, with women more engaged in university education than men. It may well be that access issues play themselves out differently by gender and to the extent possible we offer information along these lines. Christofides, Cirello and Hoy (2001) use information on parental income for a series of cross-sectional surveys over a period of almost 20 years. Their information comes from the Survey of Consumer Finances (SCF) in which income information is obtained from all household members aged 15 and older, while the survey contact person reports the educational status of all family members who continue to call the home their usual place of residence. In this way they obtain a reliable link between family income and post-secondary education of the young for a relatively large sample, but at the price of missing those students who are living independently either on their own, in a partnership with others, or in some other arrangement. We alluded to this issue in discussions of Figure 6. This information suggests that between 70 and 80% of post-secondary students consider their parents’ home as their usual place of residence and that this has not changed. If the likelihood of no longer living at home is the same across income levels the fact that parental income information is missing for 20 to 30% of students should not introduce a bias into their work. However if post-secondary students from high income backgrounds are more likely to leave home then the correlation between income and participation may be understated. It would be overstated if the opposite were the case. However given the fact that there have been 4 Indeed, in some of their modelling Christofides et al. attempt to examine the role of tuition fees in explaining participation rates but find no significant relationship. They explain this by referring to the fact that during the period of their study tuition fees did not vary that much over time and across provinces. Raymond and Rivard (2003) use different data for 1999 when there was substantial variation in fees across the provinces and are led to the same conclusion.

Analytical Studies Branch – Research Paper Series - 9 - Statistics Canada No. 11F0019 No. 210
no significant changes in this proportion over time suggests that the degree of the bias will not be changing. This still leaves unaddressed the experiences of those who do not attend university or college. In fact, studies of the living arrangements of the young suggest that a slightly different pattern occurs for the entire population of young people (Meunier, Bernard, Boisjoly 1998, Boyd and Norris 1999). This is illustrated in Figure 8 for all 18 to 24 year olds. Between 50 and 60% of this group refer to their parents’ home as the usual place of residence, with a tendency for this proportion to be increasing through time particularly after 1990. This suggests that parental income will not be as well reported for those who decide not to attend a post-secondary institution but that the extent of this bias is falling through time. It reflects substantial declines in the fraction of 18 to 24 year olds who live as a married couple. If children from lower income families are more likely to leave the parental home earlier then the sample of non-attendees actually used in the analysis will be over-represented with higher income groups and the correlation between family income and post-secondary participation will be understated. This bias should be falling with time. With this in mind we also make use of the SCF to estimate equation (1) since it is the only source of information that directly links parental income with educational status of the young over the time period of interest. However, one further important limitation of this information should also be noted. The income measure provided is annual income for only one year. Annual incomes may fluctuate from year to year and may not reflect at any point in time the true financial resources parents may have to support their children’s education. The use of annual income rather than a measure of permanent income will lead the correlation between family income and
post-secondary participation to be understated. For example, if we actually observe iX~
= Xi + vi,
where vi represents a transitory shock to income, this results in an errors in variables problem
leading the estimated coefficient (~β
1) to be less than the true coefficient according to a factor
determined by the ratio of the variance of vi to that of Xi, so that ~β
1(1+ σ v
2 / 2Xσ ) = β1 (Greene
1997, pp. 436-38). Further, if the variability of the transitory component of income is increasing through time this bias will become more important. Baker and Solon (2003) report that for 40 to 50 year old men the permanent component accounts for about two thirds of the total variance of income. There has been a tendency for the variability of income to increase through time, stepping up particularly after business cycle recessions, with the variance in the permanent and transitory components increasing by about the same amount. Their study is based upon data between 1976 and 1992. This would suggest that estimates of β1 resulting from annual income measures should be inflated by about 50%, and that the extent of the bias has not changed much. Beach, Finnie and Gray (2003) offer broadly similar conclusions for 25 to 54 year old men over a period that extends from 1982 to 1997. They suggest that the proportion of variance due to the permanent component may have increased more. On the whole we expect substantial understatement of the true value of β1 using the SCF—possibly in the order of 50%—and while the extent of the bias may have diminished we do not expect it to be the major source of changes through time. We use a complementary approach to work around these two difficulties with the SCF. Generally, students and young adults tend not to be questioned in cross sectional surveys on the income levels of their parents in large part because they may not be in a position to respond
Analytical Studies Branch – Research Paper Series - 10 - Statistics Canada No. 11F0019 No. 210
accurately to such questions. But information easier to recall is sometimes collected. In particular many surveys ask about parental education and occupation, variables that are often used to develop indicators of socio-economic status and which are strong predictors of income. Information on self-reported income, education and occupation can be made use of in combination with the parental background information. The methodology is related to a literature that estimates intergenerational income correlations, and is in turn related to instrumental variables (IV) and two-sample split IV methods (Angrist 1999, Angrist and Krueger 1995, Björklund and Jäntti 1997, Fortin and Lefebvre 1998, Grawe forthcoming, Zimmerman 1992). The procedure involves two steps. The first is to estimate an income equation for a subset of survey respondents who because of their ages represent the cohort of parents of 18 to 24 year olds. This uses self-reported information on incomes, age, occupation and education. The second stage uses the estimated coefficients from this equation and parental education and occupation information reported by each child to ascribe to each a predicted parental income.
To be more specific we use information from the General Social Surveys (GSS) of 1986, 1994, and 2001. This is a representative survey of the entire population in which all respondents are asked to report, among other things, their incomes, occupations, and education levels. In addition respondents are asked to recall the occupation and education levels of their parents. In the GSS parental occupation refers to the occupation of the parent when the respondent was 15 years of age. For all those male respondents between the ages of 40 and 60—those who can roughly be taken to represent fathers of 18 to 24 year olds—we estimate equation (2), an earnings equation using self-reported information on occupation (Z1i) and education (Z2i). Xi = γ0 + γ1Z1i + γ2Z2i + µi (2)
The estimated coefficients 0γ̂ , 1γ̂ and 2γ̂ can then be used to predict parental permanent incomes
for the group of 18 to 24 year olds in the data using the information they provide on the
occupation and education of their fathers. These predicted incomes, iX̂ , are then used as the
income measure in an estimation of equation (1). In this way all young people are captured regardless of their current living arrangements and by offering a more accurate estimate of permanent income based upon its major determinants the bias associated with transitory income fluctuations is eliminated. At the same time, however, this two-stage approach introduces another sort of bias that will lead to an overstatement of β1. This occurs because the influence of parental occupation and education on the post-secondary decisions of children is channelled entirely through their relationship with income. If these factors play an independent role in determining higher schooling, as they most surely do, then the influence of income on those decisions will be overstated. In sum, this implies that our first method using direct information on incomes from the SCF will understate the post-secondary participation - family income relationship, but that our second method using indirect income information from the GSS will overstate it. By relying on both approaches we put an upper and lower bound on the true value of β1, limit the role of other biases inherent in each of the surveys, and assess the robustness of any changes observed through time.

Analytical Studies Branch – Research Paper Series - 11 - Statistics Canada No. 11F0019 No. 210
IV. Results
Details of how we create our analytical data sets and the definitions of our key variables of interest are offered in the Appendix. The descriptive statistics associated with the SCF are presented in Table 1. Total income is defined as income from all sources for the household head and the spouse of the household head. The sample sizes range from a low of 4,817 individuals aged 18 to 24 in 1995 to a high of 7,695 in 1982; the sample sizes for economic families range from 3,868 to 5,601.5 Figure 9 depicts the trends in university participation rates by broad groupings of family income. In the neighbourhood of 40% of 18 to 24 year olds from families with incomes of $100,000 or more have a university degree or are enrolled in university. This percentage ebbs and flows a bit, but for the most part has not changed since the early to mid 1980s. This is a rate that is substantially and perennially higher than those for lower income groups. The participation rate for 18 to 24 year olds from families with more than $75,000 to $100,000 is also notably higher than for lower income groups, ranging between 20 to 30%, but the pattern of change does not vary too much once family income exceeds $25,000. Participation rates trended up throughout the 1980s and then stopped growing and even declined during the 1990s. The peak in participation rates seems to have occurred in 1991 or 1992. Only in the case of individuals from the lowest income families—$25,000 or less—has there been a steady progress in participation rates throughout the period under study: starting at less than 10% during the early 1980s and rising to 19% by 1997. Young people with this income background are by 1997 as likely to be attending university as those whose parents had $25,000 to $50,000 in income, and not much less likely as those whose parents had up to $100,000. Figure 10 offers similar information for college/technical school participation. Here the patterns are very different. The participation rates are much more similar across family income groupings, differing only by about one to three percentage points. Further there has been steady growth in participation, starting at about 15 to 20% in the early 1980s and rising steadily to about 20 to 25%. While college participation is not at all as closely tied to family income as university participation, it is the case that the lowest income group has once again experienced the most consistent growth. In addition, for middle income groups there has been steady if slight increases through the 1990s. Table 2 gives more precision to these patterns by offering the results from estimates of equation (1). As mentioned these estimates understate the true parameter because they are based on annual income rather than permanent income. Also the extent of the bias may diminish through time if there have been increases in the fraction of total income variance accounted for by permanent income. There could be other biases associated with changes in living arrangements but it is difficult to determine the direction of these. With this in mind the results reveal that the elasticity between family income and the probability of university participation is quite low, less than 0.1 for most years. Our best guess might be to inflate this value by 50% as a correction for the use of annual income. This would suggest that a 10% increase in parental income raises the chances of university attendance for an 18 to 24 year old by no more than 1.5%. However it is the pattern of change that is particularly relevant to us, and it would appear that the estimated elasticity 5 There were changes in the implementation of the survey in 1980 and 1983 that significantly lowered the sample sizes in these years. Preliminary analysis found these data to not be reliable for our purposes and they are not used in the analysis that follows.
Analytical Studies Branch – Research Paper Series - 12 - Statistics Canada No. 11F0019 No. 210
hovered between 0.08 and 0.1 before 1990, peaked in 1990 and 1991 at between 0.11 and 0.12, then fell substantially, particularly after 1995. Further, there is essentially no correlation between family income and college participation. The highest estimated value is only 0.03, and the coefficients are not statistically different from zero in 1989 and all subsequent years. That being said there is a clear drop off in the values in 1990 and after from the range of 0.02 to essentially zero. Tables 3 and 4 offer similar results by gender. The relationship between university participation and family income tends to be stronger for women, the elasticity being higher than that for men in 11 out of the 15 years under study. The general pattern of change for university participation is also the same for both men and women, a rise in the elasticity during the early 1990s followed by a fall to earlier levels during the latter part of the decade. The run up, however, seems to have been higher for women and to have lasted longer. During the early 1990s the elasticity for women is above 0.1 for three consecutive years and only appears to have clearly fallen and returned to 1980 levels after 1994. For men the elasticity rises sharply in 1990, but falls off immediately and steadily in subsequent years, with this being the only year it is above 0.1. The GSS does not suffer from any of the possible biases in the SCF, but does differ conceptually in a number of ways. Most notably the GSS analysis is based exclusively on father’s income, rather than parental income. We are not able to incorporate maternal information because a large number of young respondents do not report the occupations of their mothers, likely reflecting maternal labour force participation decisions at the time the individual was 15 years of age. The first stage regressions used to develop a measure of predicted income for the analysis and other issues of data construction are described in the Appendix, and are based upon samples of men aged 40 to 60 years. These range from 1,144 in the 1986 data to 2,711 in 2001. Further, for reasons of sample size we do not separately distinguish college participation, using rather university participation and a broader definition that incorporates both university and college and which we simply refer to as post-secondary participation. It should be noted that there are some differences between the three years of the GSS in the way in which occupations and incomes are coded, and our corrections to make the data comparable are also discussed in the appendix. Table 5 presents the data used in estimating equation (1) and in particular the predicted incomes. Table 6 offers the results from the second stage regressions of equation (1), based upon estimates of father’s permanent income from equation (2). As expected, the coefficient estimates of father’s income are all higher than those described in Tables 2 to 4 based on annual income measures, by a magnitude of three to four. That being said the pattern of change is roughly similar. For 1986, every percentage point increase in paternal income implies a 0.3 percentage point increase in the probability of university attendance, rising to 0.4 percentage points in 1994, but falling to 0.26 in 2001. When college participation is also included in the definition of participation the magnitudes of the coefficients are muted but the same pattern persists. Once again there are some differences between men and women. Most notably when the broader definition of participation is used the coefficients for men display successive declines in the value of the estimated elasticity. These are the only results that do not rise between the 1980s and early 1990s, and then fall afterward. This may reflect the observation in Figure 4 that men may have had more of a tendency to opt for community college over university, particularly if this were so for those from upper income families. As such the results suggest that for men participation in the post-secondary system as a whole—university and colleges together—has
Analytical Studies Branch – Research Paper Series - 13 - Statistics Canada No. 11F0019 No. 210
become more loosely tied to family background in large part because of the option to pursue studies in community colleges. The estimated elasticities tend to be lower for women, with the exception of 1994 when they are substantially higher. This difference relative to the analysis based on the SCF may reflect the fact that only the father’s income (as opposed to income from both parents) is being used in the GSS analysis. It may be that father-son intergenerational correlations are stronger than father-daughter, and likewise that mother-daughter correlations are stronger than mother-son. If this is the case then the exclusive use of paternal income in the GSS analysis would lead to higher father-son correlations and lower father-daughter correlations than if paternal and maternal income were combined. That said, the only estimate in Table 6 greater than 0.4 is for university participation by women in 1994. This reflects a substantial increase from 0.27 in 1986 and is well above the 0.37 estimate for men. A similar pattern is observed when college participation is included. In this sense the results also accord with the SCF findings that the post-secondary participation decisions of women are more closely tied to family income than for men.
V. Conclusion
The post-secondary climate has changed significantly for Canadian students during the 1990s. On the one hand both the returns to higher education and the perception of these returns have increased. A very high proportion of Canadians from all income backgrounds view higher education as the pathway to higher earnings and over four-fifths of families expect their children to attend a post-secondary institution. On the other hand the costs of higher education have also increased substantially, with for example the average annual undergraduate arts tuition rising by more than 85% and fees in some disciplines and institutions rising even more. In this context “access” to post-secondary education has become an important public policy concern. As important and obvious the concern there is surprisingly little information available to directly answer the question as to whether the Canadian post-secondary system is increasingly becoming the domain of those from relatively higher income backgrounds. In order to speak to this concern our analysis uses two different data sources in a novel way in order to examine changes in the relationship between post-secondary participation and family income over the course of the last two decades. At the most general level we find that post-secondary education at the end of the 1990s was no more the domain of the relatively better off than it was during the 1980s. It is certainly the case that children from higher income families are more likely to attend university, but this has not changed dramatically during the 1990s with the introduction of higher tuition fees. But behind this overall finding lie a number of developments that shed light on how young people have adapted to the changed financial environment, and how the institutional structure of post-secondary education and other aspects of public policy have influenced their decisions. Post-secondary participation is at historic highs, and we find no strong evidence that drop-out rates have increased. That said, it is true that the rate of growth in participation stalled during the 1990s, but this is more clearly the case for university participation than it is for college. There has been a tendency for some students, particularly male students, to increasingly choose community college over university. But the other more notable change in behaviour has been higher borrowing. The 1990s witnessed a significant increase in the average amount of a student loan. This reflects policy changes in the mid 1990s that increased the maximum permissible loan

Analytical Studies Branch – Research Paper Series - 14 - Statistics Canada No. 11F0019 No. 210
under the Canada Student Loans Program, and which in turn signalled increases in other forms of student loans and financial support. The option to choose lower cost community colleges and in particular to borrow more are probably the two most important factors that have influenced the relationship between family income and post-secondary participation. College participation is not related in any significant way to family income. Our estimates suggest a very small positive correlation before the 1990s, and essentially zero correlation afterwards. Young men have shown a strong tendency to choose community college over university beginning in the early 1990s and throughout the remainder of the decade. Young women displayed a tendency of this sort but only for two or three years when tuition fees first started increasing. By the mid 1990s college participation rates of women fell and remained flat for the rest of the decade; participation rates in university on the other hand increased and returned to earlier rates of growth. There is a clear positive correlation between parental income and university attendance, and this correlation in fact became stronger during the early to mid 1990s when tuition fees began increasing significantly. This change reflected declines in participation rates of youth from middle income families, those with incomes ranging from $25,000 to $100,000. The correlation, however, declined during the latter half of the decade reflecting rises in participation of those from the lowest income groups. This pattern is consistent with the fact that the changes in the Canada Student Loans Program raising the maximum amount of a loan occurred only after tuition fees had already begun to rise. In sum our analysis offers no evidence that the correlation between family income and post-secondary participation is higher at the end of the 1990s than it was at the beginning. That said, the costs of higher education have certainly increased and in part these costs have been shifted onto students, as reflected in much higher levels of borrowing and the decline in university participation rates of those from middle income families. At the same time it should be noted that the costs of post-secondary education have also become more differentiated. There is greater variation of fees across provinces, disciplines, and even institutions. Our analysis refers to a very broad notion of “access” to higher education, whether students are less likely to attend according to their family background. It may well be that students and other stakeholders will increasingly be concerned with “access” in a more narrowly defined sense, access to particular institutions or fields of study. Some of our results hint at this possibility, particularly the suggestion that men have been increasingly more inclined to choose community college over university. If there has been a switch in attendance between these broad categories of the post-secondary system then it may also be important to document the extent to which there have been changes at more detailed levels within the university system. Future research relating family background to the more specific choices students make in deciding upon an institution and a field of study may shed light on aspects of “access” not addressed in our research. In particular, our work sheds no specific light on the rules universities use in making their acceptance decisions. Research in this area may also be important in understanding the issue of access. Our findings are consistent with other work finding that tuition fees have had little impact on post-secondary attendance, but we also suggest that the reason for this may have to do concomitant—albeit lagging—increases in the level of financial support available to students. The impact of higher tuition feels cannot be judged in isolation of changes in the level of support available to students from governments and other institutions. In the 1990s both tuition fees and financial support have gone up. In this context it may be that the most important factor determining access are changes in admission requirements. A rise in admission standards would lead to stronger links between family background and post-secondary participation in particular institutions or fields of study if

Analytical Studies Branch – Research Paper Series - 15 - Statistics Canada No. 11F0019 No. 210
children from higher income families are more likely to have the skills to fulfill the requirements. This might play a role in understanding the gender differences highlighted in our analysis, and also suggests one further area for future research. It might be fruitful to in general examine non-financial barriers to accessing higher education, particularly the circumstances earlier in the lives of young people that place them in the fortunate situation of choosing to continue their education after high school graduation.
Analytical Studies Branch – Research Paper Series - 16 - Statistics Canada No. 11F0019 No. 210
Appendix
Data Sources
1. Survey of Consumer Finances
The Survey of Consumer Finances is a Statistics Canada survey administered as an annual supplement to the April Labour Force Survey (LFS). The SCF provides cross-sectional data on the income of Canadians and information on the labour market activities of all individuals 15 years of age or older in the surveyed households. The SCF identifies all individuals in each surveyed household, and maps out their relationship to the head of the economic families within the household.6 Following completion of the regular LFS, persons who are 15 years of age or older are asked to provide information on their sources of income during the previous year. Due to the absence of data on several key fields we limit the analyses to the period between 1979 and 1997. The SCF was discontinued after the 1997 reference year. In our analysis information on the labour market activities of household members 15 years of age or older is derived from the April LFS and appended to the SCF Master file. We use data from the master files of these surveys. In developing our analytical files we create two parallel data sets for each year between 1979 and 1997: an individual file of those 18 to 24 years of age, and an economic family file consisting of only those families with an 18 to 24 year old who are the children or relatives of the family head. We recognize a number of anomalies in the coding of the data from the Labour Force Survey. First, there was a change in how school attendance was coded. Respondents to the LFS questionnaire are asked several questions regarding their current attendance in school. In April 1984 the ordering of codes to represent the four types of schools respondents could report changed. Prior to 1984 the coding was: 1 Primary or Secondary School; 2 University; 3 Community College, Junior College or CEGEP; 0 Other. In April 1984 the codes (for Question 82) were reversed so that Community College was assigned a code of 2 and University a code of 3. This was done to better reflect the hierarchy of educational attainments. Second, in January 1990 the LFS revised both the flow of questions on highest level of education and the questions. This was done to better reflect the range of post-secondary qualifications and to remove the presumption that all forms of post-secondary education require high school graduation. Using these data we were able, with some minor deviations, to replicate Tables 1 and 4 in Christofides et al. (2001), those tables dealing with the relationship between family income and
6 An “economic family” consists of individuals related by blood, marriage or adoption. “Households” (all persons in a sampled dwelling) may contain more than one economic family. One individual in each economic family is identified by Statistics Canada as the head according to the following rules: (1) if the family is a married couple, either with or without children, the male is considered the head; (2) if the family is a lone parent family with unmarried children then the parent is considered the head; (3) if the family is a lone parent family with married children, then the family member who is mainly responsible for the maintenance of the family, as identified in a survey question, is considered the head; and (4) if the family is one where the relationships are other than husband/wife or parent/child then the eldest person is considered the head.
Analytical Studies Branch – Research Paper Series - 17 - Statistics Canada No. 11F0019 No. 210
post-secondary participation. Their measure of post-secondary attendance includes those currently attending college or university but also elementary-secondary schools. We refine this in three ways. First, we exclude youth who are currently attending elementary or secondary schools. Depending upon the survey year between six to 13% of all youth 18 to 24 year olds fall into this category. Second, we add individuals who completed a post-secondary degree. Third, we distinguish between university participation and other forms of post-secondary education. Post-secondary participation in our analysis is defined by combining information on highest level of post-secondary education attained and current attendance in school. University participation refers to youth (18 to 24 years of age) who have completed a university degree or certificate, or who are currently enrolled in university. College participation refers to those who have obtained a community college, CEGEP or trade diploma/certificate, or who are currently attending a community college, CEGEP or trade school. This classification gives primary weight to highest educational attainment and only secondary weight to current school attendance. The reason for this is to more accurately reflect access to post-secondary institutions for those individuals who may have completed a university degree but returned to school to attend a community college. We define parental income as the income from all sources of the household head and his or her spouse. Total income from all sources for the household head and the spouse are extracted from the individual SCF master files and merged with the Economic Family master files. This information is then ascribed to each data file on individuals 18 to 24 years of age who are children of a household head. Parental income is measured in constant 2001 dollars using the Consumer Price Index. The SCF defines a “child” by each household member’s relationship to the household head. Young adults 18 to 24 years of age who are either the son or daughter (natural or adopted), grandchild, foster child, son or daughter-in-law, brother or sister, or “other relative” of the household head are considered to be a child living in the economic family. Youth who are temporarily away from home attending a post-secondary institution but whose usual or permanent residence is with the economic household are part of our analysis. Young adults 18 to 24 year old who are not related in any of the above ways to the household head and who are not the spouse of the household head are considered to be the head of their own household. These individuals either live alone in a dwelling or share a dwelling with others not related to them through blood or marriage. This dwelling is their permanent or usual place of residence. As such we are not able to ascribe a parental income to them and they are not part of the analysis. 2. General Social Survey
The General Social Survey is conducted annually by Statistics Canada. The two primary objectives of the GSS are to gather data on social trends in order to monitor changes in the living conditions and well-being of Canadians over time and to provide immediate information on specific policy issues of current or emerging interest. To meet these objectives the core content of the GSS changes from year to year, with some key subjects repeated on a regular basis. Both the 1986 and 1994 GSS focus on education and work, while the 2001 GSS focuses on the family. These are the only three cycles of the survey with information on family background, particularly the occupations of the respondent’s parents when the respondent was growing up (specifically at age 15). Furthermore, just like all other cycles of the GSS they also include

Analytical Studies Branch – Research Paper Series - 18 - Statistics Canada No. 11F0019 No. 210
information on the current education of respondent’s parents. In addition respondents are also asked questions about their current education, occupation, and incomes. We classify individuals 18 to 24 years of age as being post-secondary participants if they have ever had some post-secondary education. Likewise university participation refers to those who have ever had any university education. Parental education refers to the education level of the parent as reported by the respondent. Our regression analysis is restricted to father’s education, which is grouped into three categories: high school diploma or less, more than high school but less than a university degree, and finally at least a Bachelor’s degree. In the regression analysis high school diploma or less is treated as the reference category. These definitions are consistent across the three versions of the GSS. Parental occupation is categorized in the 1986 and 1994 GSS at the two digit level using the 1980 Standard Occupational Classification. These are used in our model of parental income, with “managerial, administrative and related occupations” serving as the omitted category. There is one small difference between the 1986 and 1994 cycles of the GSS. The 1986 version of the survey includes a category called “occupations not elsewhere included” that is not present in the 1994 version. Since less than 1% of individuals in our sample of fathers fall into this category we feel that this slight difference between the two surveys will have minimal impact on the comparability of our results. Parental occupation in the 2001 GSS is based on the 1990 Standard Occupational Classification. This is fundamentally different from the 1980 SOC since it attempts to incorporate the skill level required for each occupation. The 1980 SOC is in large part based on industrial sectors without explicit attention paid to skill levels. There are some differences in the way personal income is captured across the years in the GSS. Income is provided as a continuous variable in the 1986 data, but capped at $60,000 dollars. In 1994 it is reported as a grouped variable with ranges varying from $5,000 increments to $20,000 increments. In addition it is capped at $100,000. In 2001 it is reported as a continuous variable without top coding. Further, in 1986 and 2001 it is possible to separate out zero or negative income, but in 1994 these incomes are lumped into the less than $5,000 category. We adjusted incomes in all cycles of the GSS to account for inflation by expressing them in 1994 dollars using the Canada wide Consumer Price Index. We also recoded incomes according to the categorization of the 1994 GSS, assigning each individual the mid-point income of the appropriate range. For those earning $60,000 or more in 1994 dollars we assigned the weighted average income of males aged between 40 and 60 from the 1986 and 1994 SCF and the 2001 GSS for each of the years under study. We in fact conducted many more estimations of equations (1) and (2) than reported in the text in order to assess the robustness of our results. At one level this involved using interactions of parental occupation and education as an additional set of regressors in equation (2). The results did not differ substantively. Furthermore we repeated the analysis for each survey year to assess the impact of restructuring the income information and categories for the sake of comparability.

Analytical Studies Branch – Research Paper Series - 19 - Statistics Canada No. 11F0019 No. 210
Table 1 Descriptive Statistics, Survey of Consumer Finance 1979 to 1997 Year Number of
Households Number of Individuals
University Participation
College Participation
Average Parental Income
(proportion of individuals)
1979 5,216 7,055 0.13 0.13 50,117
1981 5,438 7,354 0.15 0.15 52,413 1982 5,601 7,695 0.15 0.15 51,920
1984 5,063 6,759 0.16 0.17 50,786 1985 4,801 6,213 0.16 0.19 52,932 1986 4,131 5,286 0.16 0.20 52,511 1987 5,405 6,919 0.17 0.20 52,035 1988 4,427 5,554 0.18 0.21 54,389 1989 4,819 5,992 0.21 0.22 58,002 1990 5,275 6,653 0.21 0.21 56,582 1991 4,846 6,025 0.22 0.24 57,529 1992 4,348 5,418 0.24 0.24 58,203 1993 4,412 5,524 0.25 0.24 58,098 1994 4,519 5,674 0.25 0.24 60,541 1995 3,882 4,817 0.23 0.25 60,411 1996 3,931 4,883 0.24 0.25 62,531 1997 3,868 4,828 0.23 0.24 59,825
Note: Table entries are based on unweighted data. All dollar figures are expressed as constant 2001 dollars using the Consumer Price Index.

Analytical Studies Branch – Research Paper Series - 20 - Statistics Canada No. 11F0019 No. 210
Table 2 Least Squares Regression Results of the Elasticity between Post-secondary Participation and Family Income for 18 to 24 year olds
University College Sample Intercept ln
(Parental Income)
R2 Intercept ln (Parental Income)
R2 Size
1979 -0.515 0.062 0.020 -0.030 0.018 0.002 7,055
1981 -0.640 0.075 0.025 -0.009 0.018 0.001 7,354 1982 -0.686 0.079 0.027 -0.157 0.032 0.004 7,684
1984 -0.784 0.089 0.038 -0.118 0.030 0.004 6,759 1985 -0.647 0.076 0.028 0.025 0.023 0.002 6,213 1986 -0.770 0.087 0.030 0.003 0.023 0.002 5,286 1987 -0.672 0.079 0.025 -0.060 0.029 0.003 6,919 1988 -0.655 0.078 0.023 -0.083 0.031 0.003 5,554 1989 -0.869 0.101 0.032 0.118 0.011 0.000 5,992 1990 -1.020 0.116 0.043 0.298 -0.005 0.000 6,653 1991 -0.961 0.112 0.034 0.274 -0.002 0.000 6,025 1992 -0.542 0.075 0.019 0.101 0.015 0.001 5,418 1993 -0.728 0.092 0.024 0.280 -0.003 0.000 5,524 1994 -0.714 0.089 0.026 0.215 0.004 0.000 5,674 1995 -0.642 0.082 0.023 0.312 -0.004 0.000 4,817 1996 -0.405 0.060 0.014 0.289 -0.002 0.000 4,882 1997 -0.225 0.043 0.007 0.161 0.010 0.000 4,828
Note: Table entries are least squares estimation results from equation (1) described in the text using Survey of Consumer Finance Data, Statistics Canada. The coefficients on ln Income for University participation are all statistically significant with t-statistics ranging from 5.74 in 1997 to 17.3 in 1990. Those for College participation are not statistically different from zero for 1989 and all subsequent years.

Analytical Studies Branch – Research Paper Series - 21 - Statistics Canada No. 11F0019 No. 210
Table 3 Least Squares Regression Results of the Elasticity between Post-secondary Participation and Family Income for 18 to 24 year old Men
University College Sample Intercept ln
(Parental Income)
R2 Intercept ln (Parental Income)
R2 Size
1979 -0.562 0.065 0.024 -0.017 0.015 0.001 4,178
1981 -0.616 0.072 0.025 -0.043 0.020 0.002 4,298 1982 -0.609 0.071 0.024 -0.136 0.028 0.003 4,513
1984 -0.770 0.086 0.038 -0.096 0.026 0.003 3,984 1985 -0.682 0.072 0.030 0.018 0.017 0.001 3,587 1986 -0.727 0.080 0.034 -0.079 0.028 0.003 3,065 1987 -0.707 0.081 0.028 -0.127 0.033 0.004 3,956 1988 -0.659 0.078 0.022 -0.021 0.022 0.002 3,182 1989 -0.729 0.085 0.025 0.094 0.011 0.000 3,399 1990 -1.144 0.125 0.056 0.104 0.010 0.000 3,804 1991 -0.789 0.093 0.026 0.073 0.014 0.001 3,469 1992 -0.676 0.084 0.026 -0.188 0.040 0.006 3,038 1993 -0.749 0.090 0.026 0.168 0.006 0.001 3,138 1994 -0.516 0.067 0.016 0.032 0.019 0.001 3,146 1995 -0.644 0.079 0.026 0.201 0.003 0.000 2,713 1996 -0.522 0.067 0.020 0.256 0.000 0.000 2,617 1997 -0.186 0.037 0.005 0.135 0.011 0.000 2,712
Note: Table entries are least squares estimation results from equation (1) described in the text using Survey of Consumer Finance Data, Statistics Canada. The coefficients on ln Income for University participation are all statistically significant with t-statistics ranging from 5.17 in 1997 to 13.8 in 1990. Those for College participation are not statistically different from zero for 1989 and all subsequent years with the exception of 1992.

Analytical Studies Branch – Research Paper Series - 22 - Statistics Canada No. 11F0019 No. 210
Table 4 Least Squares Regression Results of the Elasticity between Post-secondary Participation and Family Income for 18 to 24 year old Women
University College Sample Intercept ln
(Parental Income)
R2 Intercept ln (Parental Income)
R2 Size
1979 -0.446 0.057 0.016 -0.031 0.021 0.001 2,877
1981 -0.671 0.079 0.024 0.068 0.013 0.001 3,056 1982 -0.793 0.091 0.030 -0.170 0.036 0.004 3,171
1984 -0.795 0.092 0.038 -0.137 0.034 0.005 2,775 1985 -0.675 0.081 0.027 0.090 0.032 0.004 2,626 1986 -0.788 0.091 0.031 0.139 0.013 0.001 2,221 1987 -0.597 0.075 0.020 0.062 0.020 0.001 2,963 1988 -0.651 0.079 0.024 -0.154 0.041 0.005 2,372 1989 -1.018 0.119 0.040 0.164 0.009 0.000 2,593 1990 -0.881 0.107 0.032 0.532 -0.023 0.002 2,849 1991 -1.123 0.131 0.042 0.589 -0.027 0.002 2,555 1992 -0.338 0.060 0.011 0.489 -0.020 0.001 2,380 1993 -0.728 0.098 0.024 0.413 -0.013 0.001 2,386 1994 -0.944 0.115 0.038 0.446 -0.014 0.001 2,528 1995 -0.607 0.083 0.019 0.518 -0.018 0.001 2,104 1996 -0.267 0.052 0.009 0.328 -0.004 0.001 2,266 1997 -0.235 0.048 0.008 0.205 0.007 0.000 2,116
Note: Table entries are least squares estimation results from equation (1) described in the text using Survey of Consumer Finance Data, Statistics Canada. The coefficients on ln Income for University participation are all statistically significant with t-statistics ranging from 4.02 in 1997 to 10.6 in 1991. Those for College participation are statistically different from zero for 1979, 1982, 1984, 1985, 1988, 1990, and 1991.

Analytical Studies Branch – Research Paper Series - 23 - Statistics Canada No. 11F0019 No. 210
Table 5: Descriptive Statistics, Data from the General Social Survey for the Estimation of the Elasticity between Post-secondary Participation and Family Income for 18 to 24 year olds
Mean Standard Deviation Minimum Maximum 1. 1986 (a) All Children, N = 1,423
Participation in University 0.27 Participation in Post-Secondary 0.62 Father’s Predicted Income 36,509 12,359 15,580 70,257 ln (Father’s Predicted Income) 10.5 0.33 9.65 11.2 Age 21.4 1.93 18 24
(b) Sons, N = 669 Participation in University 0.28 Participation in Post-Secondary 0.62 Father’s Predicted Income 36,783 12,514 15,580 70,257 ln (Father’s Predicted Income) 10.5 0.33 9.65 11.2 Age 21.4 1.96 18 24
(c) Daughters, N = 754 Participation in University 0.25 Participation in Post-Secondary 0.62 Father’s Predicted Income 36,265 12,222 15,580 70,257 ln (Father’s Predicted Income) 10.4 0.34 9.65 11.2 Age 21.4 1.91 18 24
2. 1994 (a) All Children, N = 750
Participation in University 0.35 Participation in Post-Secondary 0.65 Father’s Predicted Income 39,500 12,283 18,597 65,263 ln (Father’s Predicted Income) 10.5 0.32 9.83 11.1 Age 21.3 2.03 18 24
(b) Sons, N = 344 Participation in University 0.30 Participation in Post-Secondary 0.62 Father’s Predicted Income 40,095 12,558 18,597 65,263 ln (Father’s Predicted Income) 10.5 0.33 9.83 11.1 Age 21.2 2.00 18 24
(c) Daughters, N = 406 Participation in University 0.39 Participation in Post-Secondary 0.67 Father’s Predicted Income 38,995 12,037 18,597 65,263 ln (Father’s Predicted Income) 10.5 0.32 9.83 11.1 Age 21.3 2.06 18 24
3. 2001 (a) All Children, N = 1,677
Participation in University 0.31 Participation in Post-Secondary 0.62 Father’s Predicted Income 42,984 11,817 18,969 77,369 ln (Father’s Predicted Income) 10.6 0.28 9.85 11.3 Age 21.1 2.01 18 24
(b) Sons, N = 735 Participation in University 0.27 Participation in Post-Secondary 0.56 Father’s Predicted Income 43,679 11,981 18,969 77,369 ln (Father’s Predicted Income) 10.6 0.27 9.85 11.3 Age 21.0 2.02 18 24
(c) Daughters, N = 942 Participation in University 0.34 Participation in Post-Secondary 0.67 Father’s Predicted Income 42,442 11,666 18,969 77,369 ln (Father’s Predicted Income) 10.6 0.28 9.85 11.3 Age 21.2 1.99 18 24
Note: All income figures are expressed in constant 1994 dollars and are derived from equation (2) in the text using the specifications and information outlined in the Appendix.

Analytical Studies Branch – Research Paper Series - 24 - Statistics Canada No. 11F0019 No. 210
Table 6 Two Stage Least Squares Regression Results of the Elasticity between Post-secondary Participation and Family Income for 18 to 24 year olds
University Post Secondary Sample
Intercept ln (Father’s
Income)
R2
Intercept ln (Father’s
Income)
R2 Size
1. Total 1986 -2.85 0.296 0.053 -2.43 0.290 0.040 1,423 1994 -3.85 0.396 0.068 -2.54 0.302 0.038 750 2001 -2.42 0.255 0.025 -0.67 0.121 0.005 1,677
2. Men
1986 -3.07 0.319 0.055 -2.84 0.329 0.048 669 1994 -3.60 0.369 0.064 -1.86 0.234 0.023 344 2001 -2.67 0.275 0.031 -0.94 0.141 0.006 735
3. Women
1986 -2.61 0.272 0.050 -2.04 0.253 0.032 754 1994 -4.15 0.427 0.072 -3.33 0.380 0.062 406 2001 -2.27 0.245 0.021 -0.51 0.110 0.004 942
Note: Table entries are least squares estimation results from equation (1) described in the text using General Social Survey, Statistics Canada and relying on predicted parental income as estimated from equation (2). The coefficients on ln Father’s Income for University participation are all statistically significant with t-statistics ranging from 3.51 in 1986 to 5.88 in 1994. The coefficients on ln Father’s Income for overall post-secondary have t-statistics ranging from 1.66 in 2001 (for panel 3) to 5.28 in 1986 (for panel 1). All other coefficients are significant at the 0.95 level.

Analytical Studies Branch – Research Paper Series - 25 - Statistics Canada No. 11F0019 No. 210
Figure 1 University Revenues from Provincial Grants and Contracts, 1972/73 to 1998/99
University Revenues from Provincial Grants(millions of $2001)
$4,000
$5,000
$6,000
$7,000
$8,000
1973/74 1977/78 1981/82 1985/86 1989/90 1993/94 1997/98
University Revenue from Provincial Grants(per student)
$5,000
$10,000
$15,000
$20,000
$25,000
1973/74 1977/78 1981/82 1985/86 1989/90 1993/94 1997/98

Analytical Studies Branch – Research Paper Series - 26 - Statistics Canada No. 11F0019 No. 210
Figure 2 Average Arts Tuition Fees, Canada and Provinces, 1972/73 to 2001/02 (weighted and expressed in 2001$)
Average Arts Tuition, Canada ($2001)
$0
$1,000
$2,000
$3,000
$4,000
$5,000
1973/74 1977/78 1981/82 1985/86 1989/90 1993/94 1997/98 2001/02
Average Arts Tuition, by Province ($2001)
$0
$1,000
$2,000
$3,000
$4,000
$5,000
1973/74 1977/78 1981/82 1985/86 1989/90 1993/94 1997/98 2001/02
Nova Scotia
Quebec

Analytical Studies Branch – Research Paper Series - 27 - Statistics Canada No. 11F0019 No. 210
Figure 3 Participation Rates in Higher Education for 18 to 24 year olds
0
5
10
15
20
25
30
35
1979 1981 1982 1984 1985 1986 1987 1988 1989 1990 1991 1992 1993 1994 1995 1996 1997 1998 1999 2000 2001 2002
Per
Cen
t of
18
to 2
4 ye
ar o
lds
College
University
Post-Secondary Drop-Out

Analytical Studies Branch – Research Paper Series - 28 - Statistics Canada No. 11F0019 No. 210
Figure 4 Participation Rates in Higher Education for 18 to 24 year olds by Gender
Men
0
5
10
15
20
25
30
35
1979 1981 1985 1987 1989 1991 1993 1995 1997 1999 2001
Per
Cen
t of
18
to 2
4 ye
ar o
lds
College
University
Post-Secondary Drop Out
Women
0
5
10
15
20
25
30
35
1979 1981 1985 1987 1989 1991 1993 1995 1997 1999 2001
Per
Cen
t of
18
to 2
4 ye
ar o
lds
College
University
Post-Secondary Drop Out

Analytical Studies Branch – Research Paper Series - 29 - Statistics Canada No. 11F0019 No. 210
Figure 5 Proportion of Students working while Studying (for those 18 to 24 years of age)
University Students Working During Studies
0
10
20
30
40
50
60
70
80
1979 1981 1985 1987 1989 1991 1993 1995 1997 1999 2001
Per
Cen
t of
Uni
vers
ity S
tude
nts
(18
to 2
4 yr
s)
Not Working
Working Part time
Working Full time
College Students Working During Studies
0
10
20
30
40
50
60
70
80
1979 1981 1985 1987 1989 1991 1993 1995 1997 1999 2001
Per
Cen
t of C
olle
ge S
tude
nts
(18
to 2
4 yr
s) Not Working
Working Part time
Working Full time

Analytical Studies Branch – Research Paper Series - 30 - Statistics Canada No. 11F0019 No. 210
Figure 6 Living Arrangements of Students (for those 18 to 24 years of age)
Living Arrangements of University Students
0
10
20
30
40
50
60
70
80
90
1979 1981 1985 1987 1989 1991 1993 1995 1997 1999 2001
% U
nive
rsity
Stu
dent
s (1
8 to
24
yrs)
At Parental Home(Usual Place of Residence)
On Own
Married Couple Other
Living Arrangements of College Students
0
10
20
30
40
50
60
70
80
90
1979 1981 1985 1987 1989 1991 1993 1995 1997 1999 2001
% C
olle
ge S
tude
nts
(18
to 2
4 yr
s)
At Parental Home(Usual Place of Residence)
On Own Married Couple
Other
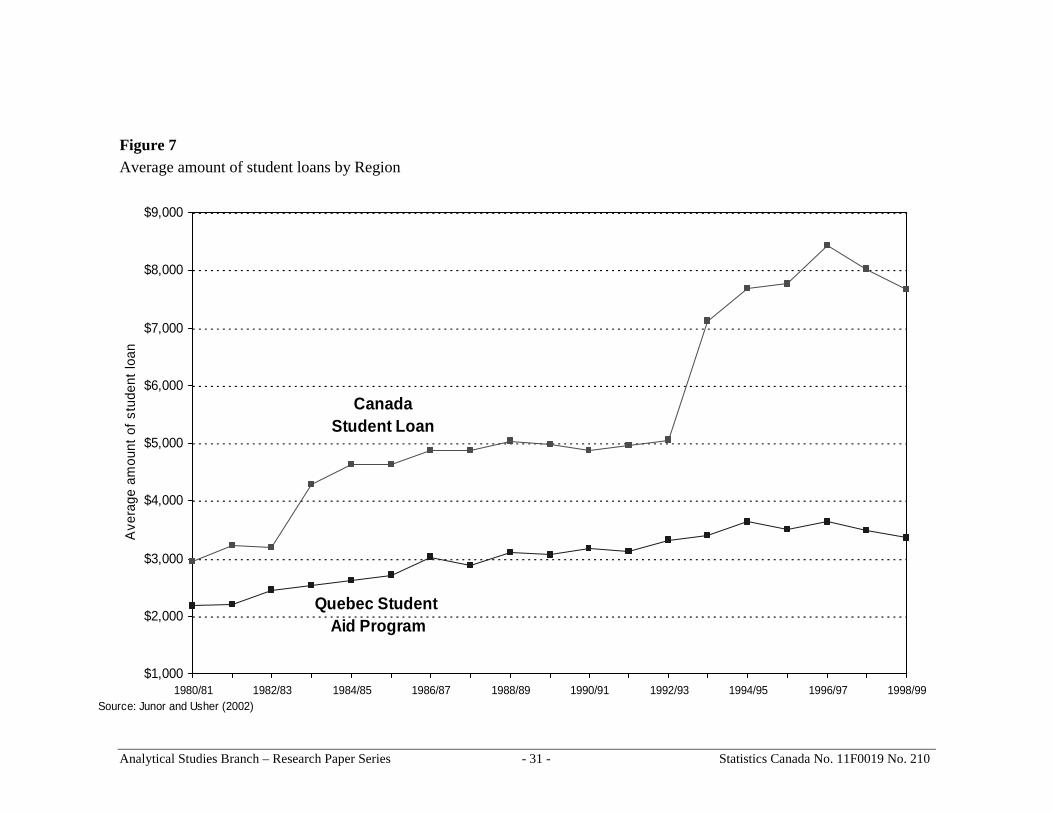
Analytical Studies Branch – Research Paper Series - 31 - Statistics Canada No. 11F0019 No. 210
Figure 7 Average amount of student loans by Region
$1,000
$2,000
$3,000
$4,000
$5,000
$6,000
$7,000
$8,000
$9,000
1980/81 1982/83 1984/85 1986/87 1988/89 1990/91 1992/93 1994/95 1996/97 1998/99
Ave
rage
am
ount
of
stud
ent
loan
CanadaStudent Loan
Quebec Student Aid Program
Source: Junor and Usher (2002)
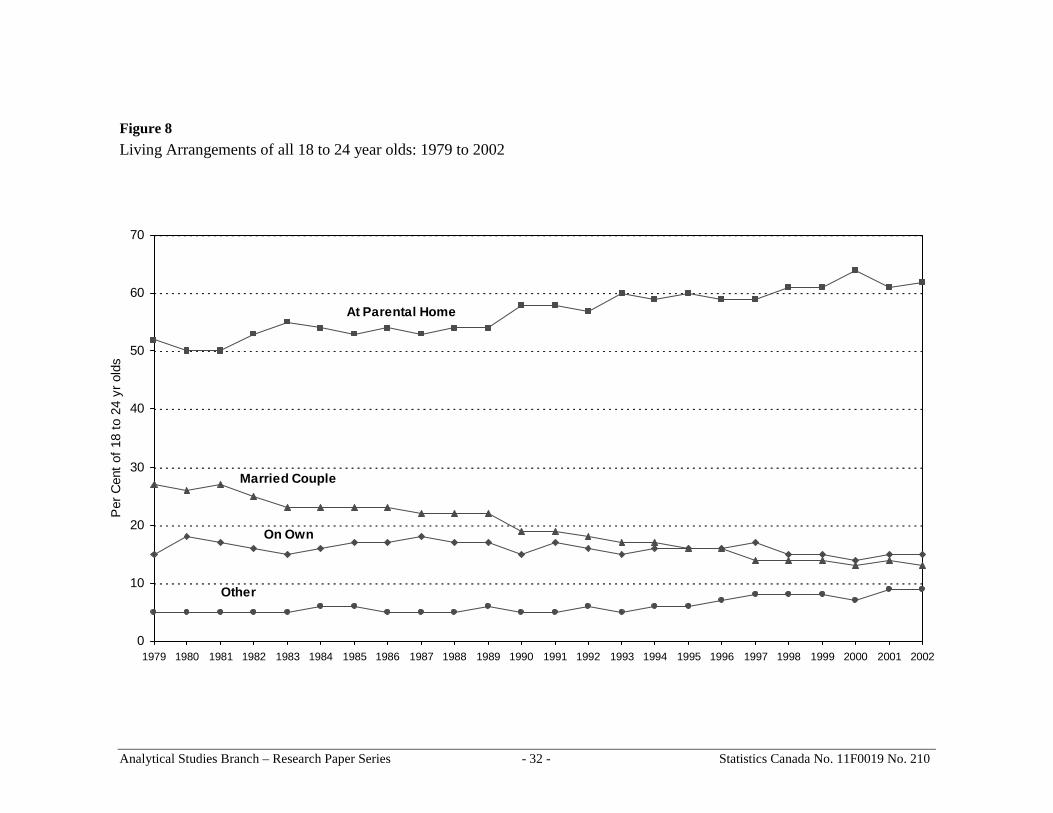
Analytical Studies Branch – Research Paper Series - 32 - Statistics Canada No. 11F0019 No. 210
Figure 8
Living Arrangements of all 18 to 24 year olds: 1979 to 2002
0
10
20
30
40
50
60
70
1979 1980 1981 1982 1983 1984 1985 1986 1987 1988 1989 1990 1991 1992 1993 1994 1995 1996 1997 1998 1999 2000 2001 2002
Per
Cen
t of
18
to 2
4 yr
old
s
At Parental Home
Married Couple
On Own
Other

Analytical Studies Branch – Research Paper Series - 33 - Statistics Canada No. 11F0019 No. 210
Figure 9 University Participation Rates of 18 to 24 year olds by Parental Income
0
10
20
30
40
50
1979 1981 1982 1984 1985 1986 1987 1988 1989 1990 1991 1992 1993 1994 1995 1996 1997
Per
Cen
t of
18
to 2
4 yr
old
s at
tend
ing
Uni
vers
ity more than$100,000
> $75,000 to$100,000 >$50,000 to
$75,000
$25,000or less
>$25,000 to$50,000

Analytical Studies Branch – Research Paper Series - 34 - Statistics Canada No. 11F0019 No. 210
Figure 10 College Participation Rates of 18 to 24 year olds by Parental Income 0
10
20
30
40
50
1979 1981 1982 1984 1985 1986 1987 1988 1989 1990 1991 1992 1993 1994 1995 1996 1997
Per
Cen
t o
f 18
to
24
yr o
lds
atte
nd
ing
Co
lleg
e
more than$100,000
> $75,000 to$100,000
>$50,000 to$75,000
$25,000or less
>$25,000 to$50,000

Analytical Studies Branch – Research Paper Series - 35 - Statistics Canada No. 11F0019 No. 210
Bibliography
Angrist, Joshua D. 1999. “Estimation of Limited Dependent Variable Models with Dummy Endogenous Regressors: Simple Strategies for Empirical Practice.” Journal of Business and Economic Statistics. Vol. 19 No.1, 2-16. Angrist, Joshua D. and Alan B. Krueger. 1995. “Split-Sample Instrumental Variables Estimates of the Return to Schooling.” Journal of Business and Economic Statistics. Vol. 13 No.2, 225-35. Baker, Michael and Gary Solon. 2003. “Earnings Dynamics and Inequality among Canadian Men, 1976-1992: Evidence from Longitudinal Income Tax Records.” Journal of Labor Economics. Vol. 21 No. 2. 289-322. Beach, Charles M., Ross Finnie, and David Gray. 2003. “Earnings Variability and Earnings Instability of Women and Men in Canada: How Do the 1990s Compare to the 1980s?” Canadian Public Policy. Vol. 29, Supplement S41-S63. Bouchard, Brigitte and John Zhao. 2000. “University Education: Recent Trends in Participation, Accessibility and Returns.” Education Quarterly Review. Ottawa: Statistics Canada, Catalogue No. 81-003-XPB, Vol. 6 No. 4. Bowlby, Jeffrey and Kathryn McMullen. 2002. At the Crossroads: First Results for the 18 to 20 year-old cohort of the Youth in Transition Survey. Ottawa: Statistics Canada, Catalogue No. 81-591-XIE. Boyd, Monica and Douglas Norris. 1999. “The Crowded Nest: Young Adults Living at Home.” Canadian Social Trends. Ottawa: Statistics Canada, Catalogue No. 11-008-XPE, Spring, No. 52. Björklund, Anders and Markus Jäntti. 1997. “Intergenerational Income Mobility in Sweden Compared to the United States.” American Economic Review. Vol. 87 No. 5, 1009-18. Canada. 2002. Knowledge Matters: Skills and Learning for Canadians. Ottawa: Human Resources Development Canada. Christofides, L.N., J. Cirello and M. Hoy. 2001. “Family Income and Post-Secondary Education in Canada.” Canadian Journal of Higher Education. Vol. 31 No. 1, 177-208. Fortin, Nicole M. and Sophie Lefebvre. 1998. “Intergenerational Income Mobility in Canada.” In Miles Corak (editor). Labour Markets, Social Institutions, and the Future of Canada’s Children. Ottawa: Statistics Canada, Catalogue No 89-553.
Analytical Studies Branch – Research Paper Series - 36 - Statistics Canada No. 11F0019 No. 210
Grawe, Nathan. (forthcoming). “Intergenerational Mobility for Whom? The Experience of High and Low Earnings Sons in International Perspective.” In Miles Corak (editor). Generational Income Mobility in North America and Europe. Cambridge: Cambridge University Press. Greene, William H. 1997. Econometric Analysis. Third Edition. Upper Saddle River, New Jersey: Prentice Hall. Junor, Sean and Alexander Usher. 2002. The Price of Knowledge: Access and Student Finance in Canada. Montreal: Canada Millennium Scholarship Foundation. Knighton, Tamara and Sheba Mirza (2002). “Post-Secondary Participation: The Effects of Parents’ Education and Household Income. Education Quarterly Review. Ottawa: Statistics Canada, Catalogue No. 81-003-XIE, Vol. 8 No. 3. Meunier, Domnique, Paul Bernard, and Johanne Boisjoly. 1998. “Eternal Youth? Changes in the Living Arrangements of Young People.” In Miles Corak (editor). Labour Markets, Social Institutions, and the Future of Canada’s Children. Ottawa: Statistics Canada, Catalogue No 89-553-XIB. Moffitt, Robert A. 1999. “New Developments in Econometric Methods for Labor Market Analysis.” In Orley Ashenfelter and David Card (editors). Handbook of Labor Economics. Vol. 3A. Amsterdam: North-Holland Elsevier. Raymond, Mélanie and Maud Rivard. 2003. “Have Tuition Fees in the Late 1990s Undermined Access to Post-Secondary Education in Canada? Paper presented to the Canadian Employment Research Forum conference on Education, Schooling and the Labour Market, Carleton University, Ottawa. Statistics Canada. 2001a. “Survey of Approaches to Educational Planning, 1999.” The Daily, Cat. No. 11-011-E. Ottawa: Statistics Canada, April 10. Statistics Canada. 2001b. 2001 Census Dictionary. Ottawa: Statistics Canada, Catalogue No. 92-378-XIE. Zhao, John and Patrice de Broucker. 2001. “Participation in Post Secondary Education and Family Income. The Daily, Cat. No. 11-011-E. Ottawa: Statistics Canada, December 7. Zhao, John and Patrice de Broucker. 2002. “Participation in Post Secondary Education and Family Income. The Daily, Cat. No. 11-011-E. Ottawa: Statistics Canada, January 9. Zimmerman, David J. 1992. “Regression Toward Mediocrity in Economic Stature.” American Economic Review. Vol. 82, 409-29.