
Factors Influencing Performance of the UAE Islamic and ...
159
Global Journal of Business R esearch VOLUME 4 NUMBER 2 2010 CONTENTS Factors Influencing Performance of the UAE Islamic and Conventional National Banks 1 Hussein A. Hassan Al-Tamimi Determinants of Emerging Markets’ Commercial Bank Stock Returns 11 Eric Girard, James Nolan, Tony Pondillo Inducing Green Behavior in a Manufacturer 27 Andrew Manikas, Michael Godfrey An Empirical Investigation of Internet Banking In Taiwan 39 Hsin Hsin Chang, Mohamad Rizal Bin Abdul Hamid The Moderating Role of Relationship Quality in Determining Total Value Orientation 49 Framarz Byramjee, Parimal Bhagat, Andreas Klein Optimizing the Use of the Fiscal Stimulus for Health IT in the U.S. 63 Adora Holstein, Patrick Litzinger, John Dunn Was the 2008 Financial Crisis Caused by a Lack of Corporate Ethics? 77 Victor Lewis, Kenneth D. Kay, Chandrika Kelso, James Larson Visual Language Skills – Do Business Students Need Them 85 Siu-Kay Pun Company Managed Virtual Communities in Global Brand Strategy 97 Laurent Arnone, Olivier Colot, Mélanie Croquet, Angy Geerts, Laetitia Pozniak Tourist Satisfaction with Mauritius as a Holiday Destination 113 Perunjodi Naidoo, Prabha Ramseook-Munhurrun, Jeynakshi Ladsawut Evidence on the Marketing Approaches Targeting Gay and Lesbian Consumers 125 Susan Baxter A Unifying Approach for Comparing One-Time Payouts and Recurring Dividends 141 Komlan Sedzro
-
Upload
khangminh22 -
Category
Documents
-
view
2 -
download
0
Transcript of Factors Influencing Performance of the UAE Islamic and ...

Global Journal of Business Research
VOLUME 4 NUMBER 2 2010
CONTENTS
Factors Influencing Performance of the UAE Islamic and Conventional National Banks 1Hussein A. Hassan Al-Tamimi
Determinants of Emerging Markets’ Commercial Bank Stock Returns 11Eric Girard, James Nolan, Tony Pondillo
Inducing Green Behavior in a Manufacturer 27Andrew Manikas, Michael Godfrey
An Empirical Investigation of Internet Banking In Taiwan 39Hsin Hsin Chang, Mohamad Rizal Bin Abdul Hamid
The Moderating Role of Relationship Quality in Determining Total Value Orientation 49Framarz Byramjee, Parimal Bhagat, Andreas Klein
Optimizing the Use of the Fiscal Stimulus for Health IT in the U.S. 63Adora Holstein, Patrick Litzinger, John Dunn
Was the 2008 Financial Crisis Caused by a Lack of Corporate Ethics? 77Victor Lewis, Kenneth D. Kay, Chandrika Kelso, James Larson
Visual Language Skills – Do Business Students Need Them 85Siu-Kay Pun
Company Managed Virtual Communities in Global Brand Strategy 97Laurent Arnone, Olivier Colot, Mélanie Croquet, Angy Geerts, Laetitia Pozniak
Tourist Satisfaction with Mauritius as a Holiday Destination 113Perunjodi Naidoo, Prabha Ramseook-Munhurrun, Jeynakshi Ladsawut
Evidence on the Marketing Approaches Targeting Gay and Lesbian Consumers 125Susan Baxter
A Unifying Approach for Comparing One-Time Payouts and Recurring Dividends 141Komlan Sedzro

GLOBAL JOURNAL OF BUSINESS RESEARCH ♦ VOLUME 4 ♦ NUMBER 2 ♦ 2010
FACTORS INFLUENCING PERFORMANCE OF THE UAE ISLAMIC AND CONVENTIONAL NATIONAL
BANKS Hussein A. Hassan Al-Tamimi, University of Sharjah
ABSTRACT
The objective of this study is to investigate some influential differences in UAE’s Islamic and conventional national banks during the period 1996-2008. UAE Islamic banks have a small market share, though there is an increasing demand for their services. This gives rise to an examination of the factors that influence the performance of these banks compared with conventional banks. A regression model was used in which ROE and ROA were used alternatively as dependent variables. A set of internal and external factors were considered as independent variables including: GDP per capita, size, financial development indicator (FIR), liquidity, concentration, cost and number of branches. The results indicate that liquidity and concentration were the most significant determinants of conventional national banks’ performance. On the other hand, cost and number of branches were the most significant determinants of Islamic banks’ performance. JEL: G20,G21 KEYWORDS: Bank performance, UAE Islamic banks, UAE conventional national banks INTRODUCTION
he UAE has 47 commercial banks, 22 of which are national banks and the remaining 25 are foreign banks. Among the national banks, there are five Islamic banks as of the end of 2008. The total assets of the national banks have increased from AED 123 billion in 1996 (about US$ 33.5
billion) to AED 1,041.7 billion (about US$ 283.7 billion) in 2008. The total assets of Islamic banks have increased from AED 7.1 billion in 1996 (about US$ 1.9 billion) to AED 182.6 billion (about US$ 49.6 billion) in 2008. The proportion of UAE Islamic banks’ assets has increased from 4.1 percent of the UAE banking sector’s total assets and 5.5 percent of the UAE national banks’ assets in 1996 to 10.6 percent and 14.9 percent in 2008 respecively (Emirates Banks Association and Orisis database). However, the UAE Islamic banks’ market share is still relatively small, given that the UAE is a Muslim country.
The objective of this study is to investgate some factors that ifluence performance in UAE’s Islamic and conventional national banks. Based on the evidence provided above the Islamic banks have a small market share in the UAE banking industry, although the UAE is a Muslim country and the general impression is that people prefer to bank with Islamic banks rather than with conventional national banks.
The paper also compares the relative importance of each factor on bank performance in the two sets of banks. This is intended to help the UAE Islamic and conventional national national banks assess and improve their performance to remain competative. Currently and because of the severe impact of the current financial crisis, there is a high demand for Islamic banking services, which encouraged three UAE conventional national banks to switch to Islamic banks and to offer Islamic banking services including foreign banks such as: Citinank and HSBC. This new development in Islamic banking industry, particularly in UAE, represents the motivition of this study to invistigate some factors influencing UAE Islamic banks’ performance compared with that of the national conventional national banks. The remainder of the paper is organized as follows. In the following section we discuss the literature related to the bank performance. This section is followed by an exposition of the empirical model and data. The
T
1
H. A. Al-Tamimi Global Journal of Business Research ♦ Vol. 4 ♦ No. 2 ♦ 2010
fourth section is devoted to the discussion of the empirical findings. In the final section a brief summary of the paper and conclusions of the main results is provided. LITERARTURE REVIEW A large number of empirical studies have been conducted about factors influencing bank performance or determinants of bank performance. However, most of these studies examine developed economies, with far fewer studies examining emerging economies such as UAE’s economy. Delis and Papanikolaou(2009) investigated the determinants of bank efficiency. They found that the banking sectors of almost all sample countries show a gradual improvement in their efficiency levels. The model used shows that a number of determinants like bank size, industry concentration and the investment environment have a positive impact on bank’s efficiency. The determinants of performance of Greek banks during the period of EU financial integration (1990-2002) has been examined by Kosmidou(2008). He used an unbalanced pooled time series dataset of 23 banks. For bank performance measure he used the ratio of return on average assets (ROAA) and for the determinants he classified them into internal and external determinants. The internal set included: the cost to-income ratio, the ratio of equity to total assets, the ratio of bank’s loans to customer and short-term funding, the ratio of loan loss reserves to gross loans and the bank’s total assets. The external set included: the annual change in GDP, inflation rate, the growth of money supply, the ratio of stock market capitalization to total assets, the ratio of total assets to GDP and concentration. The results showed that ROAA was found to be associated with well-capitalized banks and with lower cost to income ratios. The results also indicated that the impact of size and the growth of GDP was positive, while inflation had a significant negative impact. Some studies considered satisfaction with banking services as the main determinant of bank performance. An example of such studies was the one conducted by Jham and Khan(2008) in which they demonstrated how adoption of satisfaction variables can lead to better performance, and how customer satisfaction was linked with the performance of the banks. Wum et al.,(2007) investigated the impact of factors such as: financial development measured by financial interrelation ratio(FIR), the level of moneterization measured by M2/ GDP and the level of capitalization, size, age of the bank, business orientation measured by the ratio of non-interest income, and per capita GDP on the Chinese commercial banks. The results indicated that the higher the levels of financial development, the better ROA performance for banks. The results also indicated a positive impact of per capita GDP on bank performance. However, a negative impact of size and business orientation on the ROA was found. Unal et al.,(2007) conducted a comparative performance analysis between the Turkish state-owned and private commercial banks during the period 1997-2006. They used net profit-loss, return on assets and return on equity as proxies to measure profitability. To measure operating efficiency they used net profit, net assets efficiencies relative to total employment and total number of branches. The findings suggested that state-owned banks are as efficient as private banks. Chirwa(2003) investigates the relationship between market structure measured by concentration and profitability of commercial banks in Malawi using time series data between 1970 and 1994. He concluded that there was a positive relationship between concentration and performance
2

GLOBAL JOURNAL OF BUSINESS RESEARCH ♦ VOLUME 4 ♦ NUMBER 2 ♦ 2010
Naceur and Goaied (2001) examined the determinants of the Tunisian deposit during the period 1980-1995. The results indicated that the principal determinants of a bank’ s performance were by order of importance: labor productivity, bank’s portfolio composition, capital productivity and bank capitalization. Banking sector in Saudi Arabia has been examined by Ahmed and Khababa(1999). They used three measures of profitability as dependent variables; ROE, ROA and percentage change in earnings per share. On the other hand, they used four independent variables. These were: business risk measured by dividing the total loans of the bank by its total deposits, market concentration, the market size measured by dividing the deposits of the bank by the total deposits of the commercial banks under study and the size of the bank. The results indicated that the business risk and the bank size were the main determinants of the banks’ performance. Kim and Kim(1997) conducted a comparative study on the structure-profit relationship of commercial banks in Korea and the U.S. To assess the profitability of the sample banks, they used ROA and ROE. These two variables were used as dependent variables. They also used seven independent variables namely: shareholders’ equity to total assets, liquid assets to assets , total loans to total deposits, fixed assets to total assets, total borrowed funds to total assets, reserves for loans to total assets and a reciprocal value of total assts They concluded that the banks in Korea lag far behind the U.S. banks in terms of efficiency and profitability. The findings also indicated that the capitalization rate, reserves for loan losses, and the size of the bank were important factors affecting the profitability of the banks in both countries. Zimmerman (1996) examined factors influencing community bank’s performance and concluded that the regional conditions and loan portfolio concentration were important factors in community bank’s performance. In Summary it can be concluded that both ROA and ROE have been widely used a s measures of banks’ performance. Regarding factors affecting bank performance, different factors have been used by researchers such as: shareholders’ equity to total assets; liquid assets to assets ; total loans to total deposits; fixed assets to total assets; total borrowed funds to total assets; reserves for loans to total assets ; market concentration; the market size; labor productivity; bank portfolio composition; capital productivity, bank capitalization; financial interrelation ratio(FIR); M2/ GDP; the level of capitalization; age of the bank; per capita GDP, the cost to-income ratio and customer satisfaction. EMPIRICAL MODEL AND DATA The model adopted in this study includes some of the common variables used in the earlier studies noted above. For example, in evaluating the overall banks’ performance, there are two ratios normally used namely: return on equity (ROE) and return on assets (ROA). These two ratios are considered by Sinkey (2002) as the best measures of a bank’s overall performance (See also Ta Ho and ShunWu, 2006 ; Beck et al., 2005. In this study, ROE and ROA are used alternatively with seven independent variables. The following are brief justifications for the use of independent variables. The first independent variable is economic conditions (ECON) measured by GDP per capita. It is well established in the literature that there is a positive relationship between economic growth and financial development (see for example Wang ,2009, Beck et al., 2008 and Tang, 2006) . The second variable is SIZE measured by total assets. It is expected that there is a positive relationship between bank size and performance, because by increasing the size of banking firm, cost can be reduced and therefore, performance can be improved (Berger et al., 1987 and Shaffer, 1985. The third variable is FIR, which one of the most common measures of financial development (see for example Wum et al., 2007 and Goldsmith, 1969). The fourth variable is liquidity (LIQ) measured by the ratio of total loans to total deposits. In this regard, it is expected that the more the liquidity, the less efficient the commercial banks and vice versa. The fifth variable is concentration (CONT) measured by the percentage of conventional
3

H. A. Al-Tamimi Global Journal of Business Research ♦ Vol. 4 ♦ No. 2 ♦ 2010
national banks or Islamic banks’ assets to total assets of the UAE commercial banks. There is a positive relationship between concentration and bank performance (see for example Delis and Papanikolaou 2009 and Chiraw, 2003). The sixth variable is cost (COST); the higher the costs, the less efficient the commercial banks are. Finally, the number of branches (BRAN); the more the number of branches, the better the banks’ services are, which in turn is expected to affect performance positively. Therefore, the regression model used in this study is as follows: PERF = f (ECON, SIZE, FIR, LIQ, CONT, COST, BRAN) (1) Where:
PERF - represents performance measures for the UAE commercial banks (ROA and ROE); ECON - is a measure of economic conditions = GDP per capita; SIZE - is a measure of banks’ size measured by total assets; FIR - is a measure of financial development= total assets/GDP LIQ - is a measure of banks’ liquidity = ratio of total loans to total deposits; CONT - is a measure of banks’ concentration; COST - is a measure of banks’ salaries to total assets BARN - is the number of branches
In addition, a dummy variable is used as an independent variable to reflect the bank type (TYPE) of which 0 is allocated to Islamic banks and 1 to conventional banks. The data used in this study were mainly obtained from three sources: the UAE Central Bank annual reports and statistical bulletins, the UAE commercial banks annual reports published by the Emirates Banks Association and ORISIS database. The data covers the period of 1996-2008. Using more than one variable to examine the contribution of independent variables to the regression model may suggest a multicollinearity problem among these variables. Before examining the contribution of independent variables to the regression model there is a possibility of a multicollinearity problem among these variables. A multicollinearity test was carried out to assess the degree of correlation among variables. Table (1) provides the correlations among these variables for conventional national and Islamic banks. Using “rule of thumb” test, as suggested by Anderson et. al (1990), which suggests that any correlation coefficient exceeds (.7) indicates a potential problem. An examination of the results of correlations presented below. Table 1 suggests the existence of multicollinearity problem among some of the independent variables. Therefore, GDP per capita (ECON) and SIZE in the case of conventional national banks and FIR in the case of Islamic banks were dropped from the regression model. EMPIRICAL FINDINGS Table 2-a and Table 2-b provide a summary of the regression results of the regression model for conventional national banks by using ROE and ROA as dependent variables. It can be seen from Table 1 that the explanatory power of the adjusted 2R explained 28.8% of the variation of conventional national banks’ performance when ROE is used as dependent variable and 26.5% when ROA is used. In both cases, the estimated coefficient of LIQ was, as expected, positive and statistically significant at the 1 and 5 percent level. This result is expected because the conventional national banks did not face a liquidity problem. As a matter of fact, they did not reach the limit determined by the UAE Central Bank. The ratio of total loans to deposits required by the latter is 1:1, whereas, the average ratio of loans todeposits during the period under review was 82.6 percent. It is worth mentioning here that the average ratio in 2008 was 102 percent. This high ratio might be attributed to the impact of financial crisis on the UAE banking sector.
4

GLOBAL JOURNAL OF BUSINESS RESEARCH ♦ VOLUME 4 ♦ NUMBER 2 ♦ 2010
Table 1: The Correlation Coefficients between Independent Variables
Islamic Banks ECON SIZE FIR LIQ CONCN COST BRAN
ECON 1.000 SIZE .985** 1.000 FIR . .829** . .892** 1.000 LIQ -.274 -.243 -.232 1.000 CONCN .787** .728** .419 - .402 1.000 COST .432 .396 .198 .227 .553 1.000 BRAN .961** .932** .771** -.393 .855** .410 1.000
Conventional National Banks
ECON SIZE FIR LIQ CONCN COST BRAN
ECON 1.000 SIZE .959** 1.000 FIR . 829** . .920** 1.000 LIQ .871** .816** .6851* 1.000 CONCN -.328 -.314** -.571* . .245 1.000 COST -.789** -.847** -.658 -.534 .385 1.000 BRAN .857** .872** .703** .690** -.233 -.591* 1.000
**Correlation is significant at the 0.01 level (2-tailed), *Correlation is significant at the 0.05 level (2-tailed) The results also indicate that the coefficient value of concentration (CONC) and liquidity(LIQ) was as expected positive and statistically significant at 5 percent level. This is consistent with Delis and Papanikolaon(2009) and Chirwa(2003) who found a positive impact of concentration on banks’ performance. The expected positive impact of concentration might be attributed to the high density of branch network. Dean, 2003 indicated in this regard that the UAE banking sector is by far the most over-banked in the region. However, the results of positive impact of concentration on performance is not supported by the negative coefficient value of BRAN (the number of branches) although it is statistically insignificant. As for the remaining two variables in the model, FIR and COST, the estimated coefficient of FIR was unexpectedly negative and statistically insignificant. This is inconsistent with the finding of Wum et al., (2007) who found a positive impact of FIR on banks’ performance.
FIR is one of the most common indicators of financial development suggested by Goldsmith (1969). It is assumed to have a positive impact of financial development on banks’ performance as the ratio reflects the relationship between financial assets and economic activities measured by GDP. If economic activities increase, more demand on banking services is expected which means more profit opportunities for banks. Regarding COST, the estimated coefficient was unexpected positive, but statistically insignificant when ROA is used as a dependent variable and it is as expected negative but it is also statistically insignificant when ROE is used. The coefficient value is expected to be negative because of the inverse relationship between profits and costs. Regarding Islamic banks, the same procedure has been followed of which ROA and ROE were used alternatively as dependent variables. However, GDP is used instead of FIR because it gives better results. Table 3 shows a summary of regression results. The explanatory power of the adjusted 2R explained 53 % of the variation of the Islamic banks’ performance when ROA is used as dependent variable and 62% when ROE used. The selected independent variables better explain the variation of the Islamic banks’ performance compared with that of conventional national banks. The estimated coefficients were as expected negative, but statistically insignificant in the case of LIQ and CONC, whereas it was positive and statistically significant at 1 percent level in the case of BRAN. The estimated coefficient of COST
5

H. A. Al-Tamimi Global Journal of Business Research ♦ Vol. 4 ♦ No. 2 ♦ 2010
was unexpected positive and statistically significant at 5 percent level when ROA was used as dependent variable and at 10 percent level when ROE was used as dependent variable. Table 2: Summary of Regression Results National Conventional National Banks
Panel A: Dependent Variable ROE
Coefficient t Sig. (Constant) -2.049 .080 FIR
-.022 -.037 .971 CONC
1.017 2.732 .029** LIQ
.950 2.981 .020** COST
.176 .374 .719 BRAN
-.122 -.348 .738 R R Square Adjusted R Square Standard Error of the Estimate
.841a .707 .498 .00309 Panel B: Dependent Variable ROA
Coefficient t Sig. (Constant) -2.018 0.083 FIR
0.088 0.151 0.884 CONC
1.036 2.809 0.026** LIQ
1.011 3.203 0.015** COST
-0.006 -0.013 .990 BRAN
-0.128 -.367 .725 R R Square Adjusted R Square Standard Error of the Estimate
.844a .712 .507 0.02043 Panel A of this table shows the regression estimates of the equation: ROE = f (FIR, CONC,LIQ, CONT, BRAN). The table reveals the coefficient values, the t-statistics and the significant level. Panel B of this table shows the regression estimates of the equation: ROA = f ((FIR, CONC,LIQ, CONT, BRAN). **Statistically significant at the 5 percent level, * Statistically significant at the 10 percent level. The expected result of liquidity being negatively related to performance of Islamic banks was mainly attributed to the conservative policies of these banks regarding funds allocation. For example, they do not provide credit facilities in the same manner as conventional national banks. It is worth mentioning here that Islamic law considers a loan to be given or taken, free of charge, to meet any contingency. Thus in Islamic banking, the creditor should not take advantage of the borrower. On the other hand, conventional national banking is essentially based on the debtor-creditor relationship between the depositors and the bank on one hand, and between the borrowers and the bank on the other. In the case of conventional banks, interest is considered to be the price of credit, reflecting the opportunity cost of money, but it is forbidden from Islamic point of view. Therefore the incentive to lend is less in the case of Islamic banks compared with that of conventional national banks. Islamic banks provide loans and advances on the basis of profit- sharing. Based on this argument, Islamic banks are expected to keep high liquidity which in turn negatively affects the level of profits or performance. It is also expected that concentration (CONC) is negatively related to performance because of the small market share of Islamic banks. Finally, a dummy variable is added to the set of independent variables to explore the effect of the type of the bank on bank performance. Six independent variables are used, two were excluded ( FIR and Branches) because of the multicollinearity problem. The results of the estimate provided in the Table 4 indicate that independent variables including the dummy variable explain 59.8 percent of the variation in the dependent variable when ROE is used as a dependent variable. The coefficient value is as expected
6

GLOBAL JOURNAL OF BUSINESS RESEARCH ♦ VOLUME 4 ♦ NUMBER 2 ♦ 2010
positive in the case of concentration (CONC) and statistically significant at 5 percent level. This might be true in the case of conventional banks, but it is not regarding Islamic banks because of relatively small market share. The results also indicate a negative coefficient value of the bank type and statistically significant at 10 percent level. This might give an indication that performance of conventional banks might become better if they switch to Islamic banks or vice versa. It should be mentioned that better results have been obtained when ROE is used as a dependent variable rather than ROA, therefore we did not report the results. Table 3: Summary of Regression Results for Islamic Banks
Panel A: Dependent Variable ROE
Coefficient T Sig. (Constant) -0.363 .727 GDP
-1.535 -1.908 0.098* LIQ
-0.230 -0.548 0.600 CONC
-1.328 -1.681 0.137 COST
0.857 2.313 0.054* BRAN
2.769 2.616 0.035** R R Square Adjusted R Square Standard Error of the Estimate
0.852 0.727 0.531 0.00436 Panel B: Dependent Variable ROA
Coefficient T Sig. (Constant) 1.377 0.211 FIR
-0.580 -1.576 0.159 CONC
-0.185 -0.493 0.637 LIQ
-0.768 -0.969 0.365 COST
0.284 0.851 0.423 BRAN
1.762 2.295 0.055* R R Square Adjusted R Square Standard Error of the Estimate
0.883 0.780 0.622 0.02970 Panel A of this table shows the regression estimates of the equation: ROA = f (GDP, LIQ, CONC, COST, BRAN). The table reveals the coefficient values, the t-statistics and the significant level. Panel B shows the regression estimates of the equation: ROE = f (FIR, LIQ, CONC, COST, BRAN). **Statistically significant at the 5 percent level, * Statistically significant at the 10 percent level. CONCLUSIONS The objective of this study is to investigate some influential factors in UAE’s Islamic and conventional national banks during the period 1996-2008. Data were obtained from UAE official sources. Two dependent variables measuring performance were used, the ROA and ROE along with a number of independent variables. For conventional national banks model, the dependent variables were regressed on five independent variables namely, financial development indicator(FIR), liquidity(LIQ), concentration (CONT), cost(COST) branch number( BRAN). The results indicate a positive performance impact on the liquidity of conventional national banks. The same dependent and independent variable were used in the case of Islamic banks model except for FIR which was dropped because of a multicollinearity problem. The results indicate a positive impact of cost and branch number on Islamic banks’ performance and liquidity and conecentration in the case of conventional national banks. Among the limitations of this study is the data availability. If a longer data coverage were available (e.g. quarterly or monthly data) better results might be obtained. The other limitation is the lack of a similar
7

H. A. Al-Tamimi Global Journal of Business Research ♦ Vol. 4 ♦ No. 2 ♦ 2010
study for countries having the same features of UAE economy. Further research can be conducted by using monthly or quarterly data with different set of dependent and independent variables. Table 4: Summary of Regression Results for Islamic and Conventional Banks
Coefficient T Sig.
(Constant) -0.127 .900 GDP
0.568 1.628 0.120 LIQ
-0.366 -0.755 0.459 CONC
0.190 0.970 0.344 COST
5.505 2.291 0.034 BRAN
-0.112 -0.528 0.604 TYPE
-4.897 -1.924 0.069 R R Square Adjusted R Square Standard Error of the Estimate
0.833 0.695 0.598 0.02712 Note: This table shows the regression estimates of the equation: ROE = f (GDP , SIZE, , LIQ, CONC,COST, TYPE,). **Statistically significant at the 5 percent level * Statistically significant at the 10 percent level. . REFERENCES Ahmed, Abdulkader Mohammed and Khababa, Nourredine (1999), “Performance of banking sector in Saudi Arabia”, Journal of Financial Management and Analysis, Vol.12 ( 2), p. 30-36. Anderson, R. A., Sweeney, D. J, and Williams, T. A.,1990, Statistics For Business and Economics, West Publishing Company. Handymanson, Moneyguy (2002) “How to Make Money as a Handyman,” The Journal of Handyman Workers, vol. 4(3), August, p. 145-149 Beck, Thorsten; Demirguc-Kunt, Asli; Laeven, Luc; Levine, Ross(2008),” Finance, Firm Size, and Growth”. Journal of Money, Credit & Banking (Blackwell), Vol. 40(7), p1379-1405. Berger, A.N.(1995) The relastionship between capital and earnings in banking, Journal of Money, Credit and Banking, Vol. 27(2),pp. 404-31 Chirwa, E.W. (2003), “Determinants of commercial banks’ profitability in Malawi: A cointegration approach”, Applied Financial Economics, Vol. ( 13),p. 565-77 Dean, R. (2003), “Halcyon days are here to stay?”, Banker Middle East, Vol. 39. Delis, Manthos D. and Papanikolaou, Nikolaos(2009), “ Determinants of bank efficiency: evidence from a semi-parametric methodology”, Managerial Finance, Vol. 35 (3), pp. 260-275 Emirates Banks Association, “Financial Position of Commercial Banks in the UAE”. Different issues, Abu Dhabi. Goldsmith RW (1969), “ Financial structure and development”, Yale University Press, New Haven
8

GLOBAL JOURNAL OF BUSINESS RESEARCH ♦ VOLUME 4 ♦ NUMBER 2 ♦ 2010
Jham,Vimi and Khan, KaleemMohd( 2008), “ Determinants of Performance in Retail Banking: Perspectives of Customer Satisfaction and Relationship Marketing”, Singapore Management Review, Vol. 30( 2), p.35-45. Kim, Mihwa and Kim, II-woon(1997), “The Structure- Profit Relationship of Commercial Banks in South Korea and the United States: A comparative Study”, Multinational Business Review, Vol. 5(2), p. 81-94. Kosmidou, Kyriaki ( 2008). “The determinants of banks’ profits in Greece during the period of EU financial integration”, Managerial Finance Vol. 34(3), p. 146-159 Makherjee, Avinandan,Nath, Prithwiraj and Pal,Manabendra Narth(2002). “Benchmarking and strategic Homogeneity of Indian Banks”, International Journal of Bank Marketing,Vol.20(3), p. 122-139. Naceur,S.B. and Goaied M.(2001), “The determinants of the Tunisisian deposit banks’ performance”, Journal of Applied Financial Economoics,Vol, 11, p.317-319. ORISIS database, University of Sharjah Library. Shaffer,S, (1985) Competion, economies of scale, and diversity of firm sizes, Applied Economics, Vol. 17, pp. 467-76. Sinkey,Jr J. F.( 2002) Commercial Bank Financial Management,Englewood Cliffs,N.J.: Prentice-Hall. Ta Ho, Chien and Shun Wu(2006), “Benchmarking Performance Indicators for Banks”, Benchmarking, Vol. 13(1), p. 147-159. Tang, Donny, 2006 . “The effect of financial development on economic growth: evidence from the APEC countries, 1981–2000”.Applied Economics, Vol. 38(16), p1889-1904 UAE Central Bank, Annual Reports and Statistical Bulletins, Different Issues, Abu Dhabi. Unal, Seyfettin, Aktas,Rafet, Acikaline, Sezgin(2007), “A Comparative Profitability and Operating Efficiency Analysis and Private Banks in Turkey”, Banks and Bank System, Vol. 2(3) ,p. 135-141. Wang ,Fuhmei (2009), “Financial Distortions and Economic Growth: Empirical Evidence”.Ful Emerging Markets Finance & Trade, Vol. 45(3), p.56-66. Wum, Hsiu-Ling, Chen, Chien-Hsun, Shiu, Fang-Ying ( 2007), “The impact of financial development and bank characteristics on the operational performance of commercial banks in the Chinese transitional economy”, Journal of Economic Studies,Vol. 34(5), p. 401-414. Zimmerman,Gray C.(1996), “Factors Influencing Community Bank Performance in California, Economic Review, (No.1 ) p.26-42. BIOGRAPHY
Hussein A. Hassan Al-Tamimi is Associate Professor of Finance. He can be reached at Department of Accounting, Finance and Economics, College of Business Administration. University of Sharjah, P.O.Box 27272, Sharjah, United Arab Emirates, [email protected] Tel. +9716 5050539.
9


GLOBAL JOURNAL OF BUSINESS RESEARCH ♦ VOLUME 4 ♦ NUMBER 2 ♦ 2010
DETERMINANTS OF EMERGING MARKETS’ COMMERCIAL BANK STOCK RETURNS
Eric Girard, Siena College James Nolan, Siena College
Tony Pondillo, Siena College
ABSTRACT
Although banks are central to the economic development and growth of emerging markets (Benston, 2004), most studies have not investigated the determinants of stock returns of this sector in these countries. This study, contributes to the literature in finance by investigating and identifying factors that investors should be concerned about while deciding about their investments in commercial banks in emerging markets. Our results indicate that apart from fundamental risk factors like size and price to book, duration gap, bank concentration, corruption, debt servicing socio-economic conditions, and per-capita GDP also influence returns of commercial banks in emerging markets. JEL: F3; G1; N2 KEYWORDS: multifactor models; commercial banks; emerging markets
INTRODUCTION
quity risk premiums are central components of every risk and return model in finance and are fundamental and critical components in portfolio management. Although the understanding of the return generating process of individual stock is more established for developed markets, with
several seminal papers (Fama and French, 1992), the understanding of the risk components that determine individual stock risk premiums less developed emerging markets. While Girard and Sinha (2006) evaluated risk return relationship for individual stocks in frontier emerging markets, this paper contributes to the literature in finance by investigating and identify the determinants of commercial banks stocks in forty-two emerging markets. The stock performance of commercial banks in emerging markets is subject to two major issues. (a) The importance of banks to the financial system of the economy, and typical risks associated with emerging markets. For instance, Benston (2004) states that banks play a number of different roles in an economy: They provide products and services valued by both consumers and business; they play a vital role in development and growth of economies, as well as conduct of monetary policy. Benston (2004) also points out that to provide stability and to inspire confidence in the banking system, they tend to be highly regulated. As such, banks provide investors investment opportunities in a relative benign domestic environment. (b) Investment opportunities in emerging markets are, however, subject to a lot of risks, some of which have been well documented (Harvey 1995a, 1995b). Thus, from the perspective of investors, who consider investing in the commercial banking sector of emerging market, it is important to identify the risk factors that may influence returns, and this paper attempts to do just that. Our findings indicate that firm fundamentals are just as important determinants of emerging market commercial bank stock returns, as country risk factors are, while global risk are basically irrelevant in influencing returns. Our findings also show that large and growth bank stock outperform small and value bank stocks, a finding which is contrary to what is traditionally observed in returns of stocks developed markets. Returns are also highly susceptible to socio-economic conditions, per capital GDP and level of foreign debt. Our results also indicate that duration gap influence stock performance, with low duration
E
11
Girard et al Global Journal of Business Research ♦ Vol. 4 ♦ No. 2 ♦ 2010
gap banks outperforming high duration gap banks. The banking environment also influences stock performance, with banks in low bank concentration outperforming banks operating in high concentration environment. The remainder of the paper is organized as follows. Section 2 briefly discusses the relevant literature. Data are described in Section 3. Section 4 provides analysis and interpretations of the empirical findings and Section 5 concludes the paper.
LITERATURE REVIEW
When investing abroad, many different approaches have been proposed for pricing local assets, whether financial or real. Harvey (1991) shows that a world CAPM works in developed markets if beta is allowed to change through time. Although the model entails strong assumptions of perfect market integration, it fails in emerging markets and is unreliable in smaller, less liquid developed markets. Erb, Harvey and Viskanta (1995) show country betas of less than one in many highly volatile emerging markets, and these country betas and returns are often inversely related. Bekaert and Harvey (1995) suggest that (1) a time varying world beta reflects how investors expect to be rewarded for a change in risk in the world market and (2) CAPM needs to be modified to account for partial or nascent financial integration. For instance, if a world CAPM holds in integrated markets and a local CAPM holds in segmented markets, this information can be nested in a conditional beta CAPM. That is, the degree of integration with the world financial markets will determine what risks explain risk premiums in capital markets and a country asset pricing model should use a multifactor framework with local and common risk attributes. A related approach to price risk around the world has been suggested by Erb, Harvey and Viskanta (1995) who show that a country risk rating model can provide further explanations for the return generating process in world markets. The authors explore composite risks such as political risk rating, economic risk rating, financial risk rating and country credit ratings from the International Country Risk Guide (ICRG), the Institutional Investor’s Country Credit Rating, Euromoney’s Country Credit Rating, Moody’s, and S&P. They find that the ICRG composite is highly correlated with S&P’s sovereign rating (more than any other rating measures). They conclude that ratings predict inflation and are correlated with wealth. They also observe that a lower rating (higher risk) is associated with higher expected returns. In another article, Erb, Harvey and Viskanta (1996b) investigate how ICRG composite risk scores (political, financial and economic risk) explain the cross-sections of expected returns on IFC country indexes. They find that economic and financial risks include the most information about expected returns in developed markets, while political risk has some marginal explanatory power in emerging equity markets. They also investigate the relationship between the world beta, the index volatility, one fundamental attribute at the country level (index aggregate book-to-price value) and composite risk scores. Their findings suggest that composite risk scores are highly correlated with country fundamentals. Similar conclusions have been reached by other authors. Oijen and Perotti (2001) indicate that changes in political risk are a priced factor and tend to have a strong effect on local stock market development and excess returns in emerging economies. La Porta, Lopez-de-Silanes, Shleifer and Vishny (1997) find that countries with lower quality of legal rules and law enforcement have smaller and narrower capital markets. Demirgüç-Kunt and Maksimovic (1998) show that firms traded in countries with high ratings for the effectiveness of their legal systems are able to grow faster by relying more on external finance. At the stock level, empirical research has shown that some fundamental firm-specific factors (such as size or book value to market value of equity) are more suited to describe the cross-sections of stock returns. Many papers have shown that high beta, small, value and high momentum firms have higher cross-sectional risk premiums in developed markets (Chan, Hamao and Lakonishok, 1991; Aggarwal, Hiraki,
12

GLOBAL JOURNAL OF BUSINESS RESEARCH ♦ VOLUME 4 ♦ NUMBER 2 ♦ 2010
and Rao, 1992; Fama and French, 1992 and 1996). As for the risks explaining the return-generating processes of stocks traded in emerging capital markets, findings are dichotomous. On one hand, Fama and French (1998), Patel (1998) and Rouwenhorst (1999) argue that risk premiums in emerging markets exhibit the same characteristics as in developed markets—i.e., significant momentum, small stocks outperform large stocks and value stocks outperform growth stocks. On the other hand, Claessens, Dasgupta, and Glen (1995, 1998), Lyn and Zychowicz (2004), Ramcharran (2004) and Girard and Omran (forthcoming) describe mixed results for the relationship between fundamental attributes and returns in emerging markets. In some cases, the authors find positive relationships between size and returns as well as a positive relationship between price to book value and returns, which is contrary to the conventional belief that small and value firms are riskier. Several arguments may account for these findings. Daniel and Titman (1997) argue that firms’ characteristics explain the return premium—i.e., a value premium will exist in emerging markets if value stocks are less liquid than growth stocks. Harvey and Roper’s (1999) argument is that the market growth has led to the mobilization of new capital and an increase in the number of firms rather than an increase in value. Furthermore, due to either the restrictions to debt financing or the immature debt markets, small firms have a capital structure made up principally of equity, while larger firms with their international exposure can more easily access leverage. For instance, Bolbol and Omran (2005) and Girard and Omran (2007) indicate that only large firms have higher leverage ratios in Arab markets. Claessens, Dasgupta, and Glen (1998) also suggest that market microstructure causes these substantial differences and that regulatory and tax regimes force investors to behave differently in nascent markets. The authors also hypothesize that the positive relationships between returns and size and market-to-book value can be attributed to the segmentation of financial markets. In a recent article, Girard and Omran (2007) investigate how firm fundamentals and country risk ratings provide an explanation for the return-generating process of individual stocks traded in an Arab block comprised of 4 emerging markets and 1 frontier market. Their study shows that a constant beta is not a good proxy for risk in thinly traded emerging markets, and firm fundamentals and country risk rating factors are important in explaining the cross-sections of stock returns. Furthermore, they suggest that a pricing model including both firm’s fundamentals and country risk rating factors has significantly better explanatory power than either CAPM, or a model which only includes a firms’ fundamentals, or a model based only on country composite risk ratings. The authors conclude that financial transparency and political instability are still powerful obstacles to investments in these nascent emerging markets.
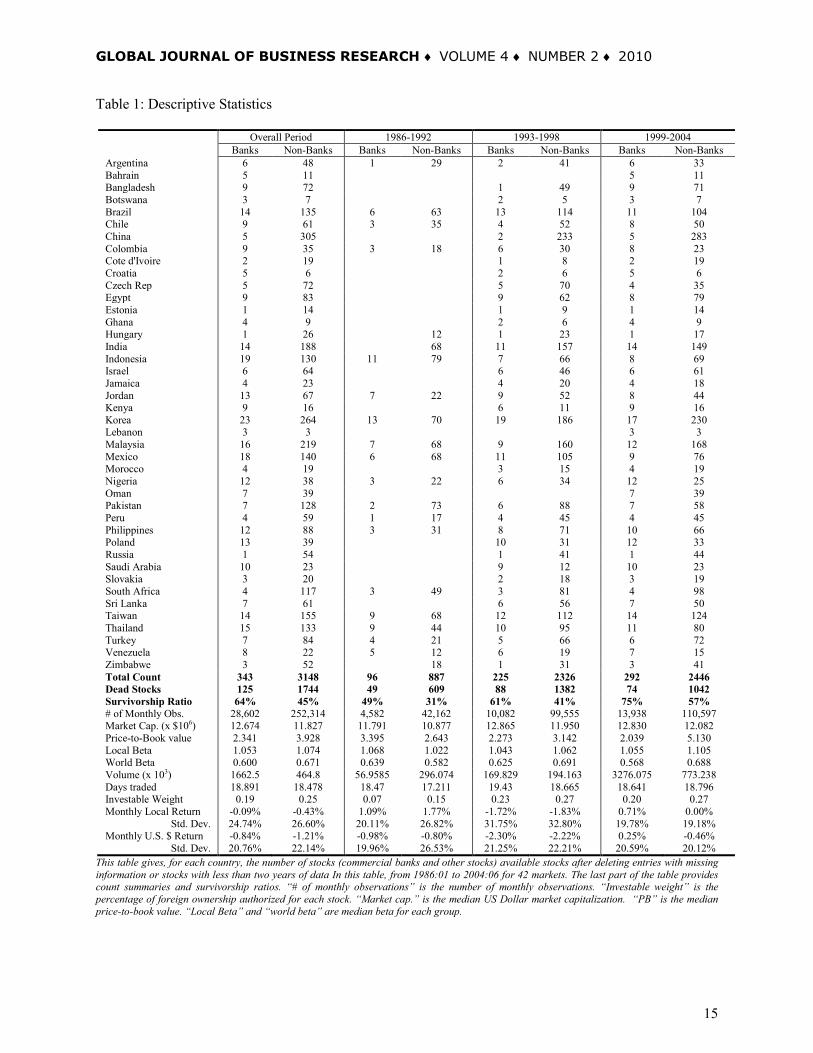
DATA As of June 2004, the SP/IFC Emerging Markets DataBase (EMDB) reports data for 33 emerging stock markets and 20 frontier markets. IFC provides monthly closing prices dating as far back as 1975 and stock fundamentals from the 1980s onward. We retrieve all firms traded in the 53 emerging markets from at least 1986:01 until 2004:06. Monthly return, size, price-to-book ratio, book and common equity value, exchange rates, volume and days traded series are downloaded for each firm. We use the US dollar as the standard to make the average returns comparable across countries. Stocks are included in the sample as they become available and “dead stocks” are also included for the period during which they were traded. Not all firms are retained in the final sample though. The deciding criterion for retention is that stock return series must have at least 2 years of data. Data imperfections such as missing values and recording errors are handled by dropping the firm for the particular month of data imperfection but retaining it when it is available. Table 1 shows the number of ‘usable’ stocks included in EMDB from 1986 to 2004, the number of deletions. Results are reported for the overall period, and three sub-periods: (i) 1986:01 to 1992:12, (ii) 1993:01 to 1998:12) and (iii) 1999:01 to 2004:06). The final sample consists of 3,491 firms including 343 commercial banks traded in 33 emerging markets and 9 frontier markets. As of June 2004, 1,869
13

Girard et al Global Journal of Business Research ♦ Vol. 4 ♦ No. 2 ♦ 2010
emerging market stocks disappeared; the resulting survivorship ratio is 64 percent for commercial banks and 45 percent for the other stocks. Throughout the sample, we observe that commercial banks are increasingly more resilient as compared to other firms—i.e., their survivorship ratio is 49 percent versus 31 percent for all the other stocks from 1986 to 1993; 61 percent versus 41 percent from 1993 to 1998; and 75 percent Versus 57 percent from 1999 to 2004. In addition, the number of commercial banks has increased from the first period to the last, at a much faster rate than other stocks. The bottom of Table 1 shows statistics for the number of observations, the median size, the median monthly volume and days traded, the median investable weight, and the median monthly return and standard deviation of monthly returns from 1986 to 2004. Our final sample consists of 252,314 monthly observations for non-banks and 28,602 for banks. Through out the period of study, commercial banks reveal idiosyncratic characteristics: They are always larger during each period, have recently become increasingly more liquid as compared to other stocks (this is true from 1999 to 2004). In addition, banks are usually traded more often (18.89 days versus 18.48 days) and are less accessible to foreign investors (the investable weight is 19 percent for banks and 25 percent for other stocks). Finally, we find commercial banks to have returned more than other stocks (-0.09 percent versus –1.21 percent per month) and to be somewhat less risky (24.74 percent versus 26.60 percent per month). As far as for the fundamental risks of the stock selected, we report the median for local beta, world beta, price-to-book ratio, and size (in US dollars). As in Rouwenhorst (1999), local betas are computed by regressing each stock dollar’s returns on a country index to which the firm belongs. This “size-unbiased” equally weighted country index is comprised of dollar-denominated stock returns averaged each month. Similarly, world betas are computed by regressing each stock dollar’s returns on the MSCI World. One lag of the equally weighted country (or world) index is included to allow for a delayed response due to non-synchronous trading. Betas are computed with a minimum of two years and a maximum of five years of historical monthly returns. We first observe that commercial banks have typically larger market capitalization and much lower price-to-book ratio than other stocks. In addition, although bank stocks (overall beta of 1.053) and other stocks (overall beta of 1.074) have on average very national similar betas, global betas are much lower. Considering that the monthly standard deviation of the MSCI World Index is at most half the figures reported for banks and other stocks in Table 1, it is indicating of the poor correlation of emerging markets with the US-dominated world index. Interestingly, bank stocks’ median ‘global’ beta is getting smaller over the sample as compared to other stocks, which indicates that commercial bank stocks are increasingly more segmented from the rest of the world. Summarizing, emerging markets commercial banks stocks are large value stocks as compared to other stocks. While they appear to have similar local systematic risk than other stocks, they seem more regulated and then more segmented from global factors. In fact, even if commercial bank are less accessible to foreign investors than other stock, they are more liquid and more often traded. Overall, commercial banks are less risky than other emerging market stocks and have returns better for the overall period of study.
14
GLOBAL JOURNAL OF BUSINESS RESEARCH ♦ VOLUME 4 ♦ NUMBER 2 ♦ 2010
Table 1: Descriptive Statistics
Overall Period 1986-1992 1993-1998 1999-2004 Banks Non-Banks Banks Non-Banks Banks Non-Banks Banks Non-Banks Argentina 6 48 1 29 2 41 6 33 Bahrain 5 11 5 11 Bangladesh 9 72 1 49 9 71 Botswana 3 7 2 5 3 7 Brazil 14 135 6 63 13 114 11 104 Chile 9 61 3 35 4 52 8 50 China 5 305 2 233 5 283 Colombia 9 35 3 18 6 30 8 23 Cote d'Ivoire 2 19 1 8 2 19 Croatia 5 6 2 6 5 6 Czech Rep 5 72 5 70 4 35 Egypt 9 83 9 62 8 79 Estonia 1 14 1 9 1 14 Ghana 4 9 2 6 4 9 Hungary 1 26 12 1 23 1 17 India 14 188 68 11 157 14 149 Indonesia 19 130 11 79 7 66 8 69 Israel 6 64 6 46 6 61 Jamaica 4 23 4 20 4 18 Jordan 13 67 7 22 9 52 8 44 Kenya 9 16 6 11 9 16 Korea 23 264 13 70 19 186 17 230 Lebanon 3 3 3 3 Malaysia 16 219 7 68 9 160 12 168 Mexico 18 140 6 68 11 105 9 76 Morocco 4 19 3 15 4 19 Nigeria 12 38 3 22 6 34 12 25 Oman 7 39 7 39 Pakistan 7 128 2 73 6 88 7 58 Peru 4 59 1 17 4 45 4 45 Philippines 12 88 3 31 8 71 10 66 Poland 13 39 10 31 12 33 Russia 1 54 1 41 1 44 Saudi Arabia 10 23 9 12 10 23 Slovakia 3 20 2 18 3 19 South Africa 4 117 3 49 3 81 4 98 Sri Lanka 7 61 6 56 7 50 Taiwan 14 155 9 68 12 112 14 124 Thailand 15 133 9 44 10 95 11 80 Turkey 7 84 4 21 5 66 6 72 Venezuela 8 22 5 12 6 19 7 15 Zimbabwe 3 52 18 1 31 3 41 Total Count 343 3148 96 887 225 2326 292 2446 Dead Stocks 125 1744 49 609 88 1382 74 1042 Survivorship Ratio 64% 45% 49% 31% 61% 41% 75% 57% # of Monthly Obs. 28,602 252,314 4,582 42,162 10,082 99,555 13,938 110,597 Market Cap. (x $106) 12.674 11.827 11.791 10.877 12.865 11.950 12.830 12.082 Price-to-Book value 2.341 3.928 3.395 2.643 2.273 3.142 2.039 5.130 Local Beta 1.053 1.074 1.068 1.022 1.043 1.062 1.055 1.105 World Beta 0.600 0.671 0.639 0.582 0.625 0.691 0.568 0.688 Volume (x 103) 1662.5 464.8 56.9585 296.074 169.829 194.163 3276.075 773.238 Days traded 18.891 18.478 18.47 17.211 19.43 18.665 18.641 18.796 Investable Weight 0.19 0.25 0.07 0.15 0.23 0.27 0.20 0.27 Monthly Local Return -0.09% -0.43% 1.09% 1.77% -1.72% -1.83% 0.71% 0.00%
Std. Dev. 24.74% 26.60% 20.11% 26.82% 31.75% 32.80% 19.78% 19.18% Monthly U.S. $ Return -0.84% -1.21% -0.98% -0.80% -2.30% -2.22% 0.25% -0.46%
Std. Dev. 20.76% 22.14% 19.96% 26.53% 21.25% 22.21% 20.59% 20.12% This table gives, for each country, the number of stocks (commercial banks and other stocks) available stocks after deleting entries with missing information or stocks with less than two years of data In this table, from 1986:01 to 2004:06 for 42 markets. The last part of the table provides count summaries and survivorship ratios. “# of monthly observations” is the number of monthly observations. “Investable weight” is the percentage of foreign ownership authorized for each stock. “Market cap.” is the median US Dollar market capitalization. “PB” is the median price-to-book value. “Local Beta” and “world beta” are median beta for each group.
15

Girard et al Global Journal of Business Research ♦ Vol. 4 ♦ No. 2 ♦ 2010
These results are true for a portfolio comprised of all commercial banks traded in emerging markets. However, we only depict one aspect of the whole story about commercial bank stocks’ risks. Indeed, commercial bank stocks are likely affected by country specific characteristics and must load on other factors related to segmentation, capital control or more generally to a country’s political, economic and financial risks. Based on Erb, Harvey and Viskanta (1995, 1996a, 1996b and 1998) who conclude after an extensive survey that the country risk ratings best explains emerging market index returns, we use the International Country Risk Guide risk scores as a proxy for country risk. ICRG assesses a country risk based on three dimensions – political, economic and financial. Each dimension is measured using several factors. The political risk dimension is measured using twelve factors and the economics and financial risk dimensions are measured using five factors each. The ICRG scale for each factor is calibrated such that a high score indicates low risk and a low score indicates high risk. Table 2 defines each risk factor and provides a summary of each country’s annual risk ratings. As Girard and Omran (2006) suggest, risk factors should be differentially weighted to allow for greater weight for those factors that have more bearing on business. Since this is not the case with the ICRG composite risk rating, we use the twenty-two primary ICRG risk factors (twelve political, and five each economic and financial) in preference to the ICRG composite measures. Most likely, some risk variables are highly correlated with each other, which make their simultaneous use redundant. To eliminate this problem of endogeneity, we use a Principal Component Analysis (PCA) to create a grouping or factor that captures the essence of these variables. We first run the Kaiser-Meyer-Olkin test (KMO) and Barlett test of sphericity; both are high for the sample and significant at the 1% level, indicating that the factor analysis is an appropriate technique for our data. Table 2 presents the results from the factor analysis. The number of common factors is found using a VARIMAX rotation. We find six newly extracted factors that are numbered from 1 to 6. The eigenvalues represent the proportion of total variance in all the variables that is accounted for by that factor. To decide the number of factors to retain, we use the Kaiser criterion which consists in dropping the eigenvalues less than one—i.e., unless a factor extracts at least as much as the equivalent of one original variable, we drop it. The “% of variance” represents values expressed as a percentage of the total. For instance, factor 1 accounts for 20.452 percent of the variance, factor 2 for 11.926 percent, and so on. The “Cumulated %” contains the cumulative variance extracted and shows that the six dominant factors whose eigenvalues are more than one, sum up to 66.988% of the total variance. These factors can be considered as the six major risk factors that characterize the 42 emerging market countries. We also show the loading of each risk score variable within each factor. Interpretation and naming of the factors are not straightforward as they depend on the particular combination of observed variables that correlate highly with each factor. In order to minimize the subjective nature of the PCA, we carefully follow the procedure described in Tabachnick and Fidell (1996) and Seiler (2004). Furthermore, we only consider individual risk score loadings with “good” correlations. Comrey and Lee (1992) define a “good” correlation for a loading greater than 0.5 (or smaller than -0.5) — i.e., 25 percent overlapping variance. Each factor’s composite score is determined by taking into account the risk scores that load highly on it. Accordingly, following Seiler (2004), each factor’s score is computed using a summated scale methodology where selected loading within each factor is added to determine a factor score. Since risk scores are not on a standardized scale, we have to ensure that each risk score selected for the composition of a risk factor is standardized so that equal importance is given to all risk scores in the summation process. The factor is finally computed using the logarithm of the sum. Table 2 shows that the factors form coherent groups of associated variables that describe risk in the 42 emerging markets. Each of the six constructs is briefly reviewed below. The first factor’s contributing variables are a mix of political (government stability and investment profile), financial (exchange rate
16

GLOBAL JOURNAL OF BUSINESS RESEARCH ♦ VOLUME 4 ♦ NUMBER 2 ♦ 2010
stability and international liquidity), and economic (budget balance, current account to GDP, growth in real GDP, and inflation) risk ratings. This factor accounts for 20.452 percent of the variance. The factor loadings are positive and interpreted according to rules of the normal ICRG scale — i.e., a high value indicates a low risk and a low value indicates a high risk. The second factor takes into account issues of law and order, ethnic and religious tensions as well as internal and external conflicts. This factor accounts for 11.926% of the variance. The factor loading is positive and a high value indicates a low risk and a low value indicates a high risk. The third factor grouping consists of variables related to social and economic conditions and real growth in GDP to population. This factor accounts for 10.376% of the variance. Factor loadings are positive and a high (low) value indicates a low (high) risk as on the ICRG scale. The fourth factor consists of four political risk ratings: bureaucracy quality, corruption, democratic accountability, and military involvement in politics. This factor accounts for 11.633% of the variance. The factor loadings are also positive, so a high value indicates a low risk and a low value indicates a high risk on the ICRG rating scale. The fifth factor is dominated by current account to net export, which is a rating for international trade and openness. This factor accounts for 6.301% of the variance. A high (low) score relates to a low (high) risk. The sixth factor addresses debt servicing. This factor accounts for 6.301% of the variance. It has a positive factor loading and a high (low) value indicates a low (high) risk. Table 2: Country Risk Ratings Data Reduction
Factor 1 2 3 4 5 6 Eigenvalue 4.499 2.624 2.559 2.283 1.386 1.386 % of Variance 20.452 11.926 11.633 10.376 6.301 6.301 Cumulative % 20.452 32.378 44.01 54.387 60.688 66.988 Factor Loading Risk Category GDP Growth Economic 0.860 0.009 -0.095 0.079 0.002 0.065 Current Accounts as a % of GDP Economic 0.780 0.059 -0.056 -0.090 0.468 -0.091 Investment Profile Political 0.753 0.098 0.241 0.281 0.069 0.009 Exchange Rate Stability Financial 0.729 0.124 0.007 0.073 -0.028 0.263 Government Stability Political 0.710 0.280 -0.193 -0.127 0.019 0.172 Budget Balance Economic 0.684 0.108 0.342 0.013 0.279 -0.151 Inflation Economic 0.642 -0.109 0.205 0.019 -0.031 0.406 International Liquidity Financial 0.560 0.089 0.206 -0.008 -0.284 0.072 Internal Conflicts Political 0.180 0.737 0.165 0.249 -0.001 0.264 Ethnic Tensions Political 0.156 0.679 0.233 -0.053 -0.245 -0.198 External Conflicts Political 0.001 0.662 -0.100 0.116 0.241 0.026 Religious Tensions Political 0.070 0.600 0.268 0.217 0.053 -0.417 Law and Order Political 0.218 0.530 0.229 0.252 -0.128 0.439 GDP per Inhabitant Economic -0.072 0.078 0.829 0.260 -0.057 -0.070 Socio-Economic Conditions Political 0.105 0.083 0.808 0.138 0.011 0.144 Foreign Debt Economic 0.207 0.246 0.673 0.012 0.117 0.250 Democratic Accountability Political 0.077 0.042 -0.044 0.816 -0.092 -0.128 Bureaucracy Quality Political 0.068 0.046 0.319 0.690 -0.047 0.089 Military in the Politics Political 0.161 0.449 0.083 0.630 0.125 0.068 Corruption Political -0.205 0.345 0.270 0.594 0.089 0.101 Current Accounts as a % of Goods and Services Financial 0.093 0.051 0.070 -0.021 0.889 0.092 Debt Servicing Financial 0.318 0.018 0.231 0.005 0.152 0.686
This table shows the factor analysis and the component matrix. The extraction method is the PCA. The rotation method is Varimax with Kaiser Normalization. Rotation converged in 7 iterations. Kaiser-Meyer-Olkin Measure of Sampling Adequacy is 0.831 and Bartlett's Test of Sphericity Approx. Chi-Square is 63,487.2 (df=231, significant at 99.99 percentile). I select individual risk scores with a cut-off at 0.5. The selected scores are further averaged to determine each factor’s composite score. ANALYSIS
We investigate whether stock risk premiums load into fundamental (local beta, price-to-book, and size), global (global beta) and the 6 country risk factors generated by the factor analysis. Thus, we examine the following multifactor representation:
17

Girard et al Global Journal of Business Research ♦ Vol. 4 ♦ No. 2 ♦ 2010
ε+λ+α+α+α+α+α= ∑=
ii6
1i43210 fw)Size(Lnw)PB(Lnw)w(Betaw)l(BetawwwRi (1)
where Ri is a vector of monthly risk premiums, fi is a vector of 6 common risk score factors for each premium, and αi and λi are vectors of risk premiums associated with each risk. W is a weight (
SQ_PRES/1w = ) that can be used to modify the influence of large errors on the estimation of the ‘best’ fit values of a regression constant and regression coefficients. This weighted least-squares regressions (WLS regressions) is estimated through the origin (with a regression constant equal to 0) and corrects the
problem of heteroskedastic errors—i.e., values of αi and λi are estimated by minimizing ∑ − 2^iii )RR(w
. This process has the effect of minimizing the influence of a case with a large error and maximizing the influence of a case with a small error on the estimation of the coefficients. W is estimated by residualizing the independent variables. We use equation 1 to identify the significant factors that explain risk premiums. Results are reported in table 3 for the overall period, and three sub-periods: (i) 1986:01 to 1992:12, (ii) 1993:01 to 1998:12) and (iii) 1999:01 to 2004:06. R-squared for each equation indicates that about 7 to 15 percent of the variations in fundamental, country and global risk factors explain the variation in stock risk premiums. The variance inflation factors (not reported for sake of brevity) for each independent variable are extremely low for each period (less than 1.5, that is, more than 67 percent of the variance of each independent variable is not shared by other independent variables) indicating that the our regressions are not likely affected by multicollinearity. At the bottom of the table, the sum of the absolute value of the standardized coefficients is reported; the significance of the sum is determined by a Wald test. The first interesting finding is that firms’ fundamentals are overall as important as country risk factors in explaining stock risk premiums for commercial banks, and global factors are somewhat irrelevant– e.g., a 1 standard deviation shock on fundamentals leads to a 0.105 standard deviation shock on Ri, a 1 standard deviation shock on country risk factors leads to a 0.100 standard deviation shock on Ri, and a 1 standard deviation shock on world beta leads to a 0.009 standard deviation shock on Ri. However, this has not always been true through out the sample. Indeed, from 1986 to 1998, country risk factors have greater bearing on commercial banks stocks than fundamentals– e.g., a 1 standard deviation shock on fundamentals leads to a 0.148 (0.149) standard deviation shock on Ri from 1986 to 1992 (1993 to 1998), and a 1 standard deviation shock on country risk factors leads to a 0.484 (0.204) standard deviation shock on Ri from 1986 to 1992 (1993 to 1998). For the most recent period (1999-2004), fundamentals seem to have somewhat a greater effect on bank stock risk premiums– e.g., a 1 standard deviation shock on fundamentals leads to a 0.101 standard deviation shock on Ri, and a 1 standard deviation shock on country risk factors leads to a 0.060 standard deviation shock on Ri. As far as global beta, it has its higher impact on commercial banks stock risk premiums from 1993 to 1998, the period of the three major financial crisis (possibly, increased integration due to contagion), and it remains insignificant thereafter. These patterns are somewhat similar to other stocks traded in emerging capital markets.
18

GLOBAL JOURNAL OF BUSINESS RESEARCH ♦ VOLUME 4 ♦ NUMBER 2 ♦ 2010
Table 3: Comparison of Banks and Non-Banks Risk Determinants
Overall Period 1986-1992 1993-1998 1999-2004 Banks Non-Banks Banks Non-Banks Banks Non-Banks Banks Non-Banks (Constant) -0.018 -0.08*** 0.608*** 0.053 0.151** 0.05** -0.094 -0.048** Std. Error 0.033 0.011 0.124 0.036 0.069 0.022 0.068 0.023 BetaUS 0.006** 0.003*** 0.003 0.003 -0.003 -0.001 0.009* 0.007*** Std. Error 0.003 0.001 0.006 0.003 0.006 0.002 0.005 0.001 SCOEF 0.014 0.006 0.009 0.000 -0.007 -0.003 0.016 0.017 BetaW 0.002 -0.003*** -0.002 0.002 0.007*** -0.002*** -0.004 -0.005*** Std. Error 0.002 0.001 0.004 0.002 0.002 0.001 0.003 0.001 SCOEF 0.009 -0.012 -0.008 0.005 0.039 -0.011 -0.014 -0.022 lnPB 0.017*** 0.015*** 0.022*** 0.021*** 0.028*** 0.022*** 0.012*** 0.009*** Std. Error 0.002 0.002 0.004 0.002 0.003 0.001 0.003 0.001 SCOEF 0.072 0.071 0.115 0.074 0.116 0.106 0.049 0.05 Lnsize US 0.002** 0.003*** -0.002 0.001 0.003* 0.002*** 0.004*** 0.005*** Std. Error 0.001 0.001 0.002 0.001 0.002 0.001 0.001 0.001 SCOEF 0.019 0.03 -0.024 0.01 0.026 0.021 0.036 0.046 f1 0.011 -0.008*** -0.064* -0.076*** -0.087*** -0.082*** 0.006 -0.025*** Std. Error 0.008 0.003 0.036 0.014 0.014 0.005 0.021 0.007 SCOEF 0.01 -0.007 -0.066 -0.066 -0.069 -0.064 0.003 -0.016 f2 -0.011 -0.013*** -0.089*** -0.03*** 0.01 0.029*** 0.010 0.009** Std. Error 0.008 0.002 0.025 0.007 0.015 0.005 0.012 0.004 SCOEF -0.011 -0.013 -0.091 -0.034 0.008 0.021 0.009 0.009 f3 -0.018*** -0.002 0.084*** 0.069*** -0.03** -0.006 -0.014** -0.002 Std. Error 0.005 0.002 0.024 0.01 0.012 0.004 0.007 0.003 SCOEF -0.029 -0.002 0.131 0.078 -0.037 -0.006 -0.025 -0.003 f4 0.016*** 0.003** 0.053*** 0.003 0.029*** 0.01*** 0.009 0.005*** Std. Error 0.004 0.001 0.013 0.005 0.009 0.003 0.006 0.002 SCOEF 0.026 0.005 0.09 0.003 0.046 0.014 0.014 0.009 f5 0.003 0.049*** -0.143*** 0.036** 0.073*** 0.068*** 0.0001 0.023*** Std. Error 0.005 0.004 0.036 0.015 0.02 0.007 0.007 0.005 SCOEF 0.004 0.031 -0.072 0.015 0.044 0.039 0.000 0.018 f6 -0.019*** -0.014*** -0.031* 0.009 -0.043** -0.028*** -0.007 -0.01*** Std. Error 0.006 0.002 0.016 0.007 0.018 0.006 0.008 0.003 SCOEF -0.02 -0.014 -0.034 0.008 -0.031 -0.02 -0.009 -0.012 R-squared 0.088 0.093 0.113 0.095 0.152 0.135 0.073 0.081 N 28601 252313 4581 42161 10081 99554 13937 110596 F 22.324*** 218.443*** 5.959*** 38.724*** 23.664*** 184.235*** 7.458*** 73.905*** # of Stocks 343 3148 96 887 225 2326 292 2446
Firm
431 α+α+α 0.105*** 0.107*** 0.148*** 0.084*** 0.149*** 0.130*** 0.101*** 0.113***
Country
∑ λi 0.100*** 0.072*** 0.484*** 0.204*** 0.235*** 0.164*** 0.060** 0.067***
Global
2α 0.009 0.012*** 0.008 0.005 0.039*** 0.011*** 0.014 0.022***
ε+λ+α+α+α+α+α= ∑=
ii6
1i43210 fw)Size(Lnw)PB(Lnw)w(Betaw)l(BetawwwRi . All regressions are estimated
using a weighted least-squared technique to correct for heteroskedasticity. Standardized coefficients (SCOEF) are the coefficients obtained after standardizing the variables and they indicate that an increase in 1 standard deviation on one of the factors affects “beta” standard difference in Ri, holding constant the other predictors in the model. In addition, standard errors and t-statistics are calculated using the Newey-West heteroskedasticity and autocorrelation consistent (HAC) covariance matrix to correct for the presence of autocorrelation and heteroskedasticity. ***, ** and * indicate significance at the 1, 5 and 10 percent level, respectively.
19

Girard et al Global Journal of Business Research ♦ Vol. 4 ♦ No. 2 ♦ 2010
The signs associated with the fundamentals indicate that large stocks outperform small stocks and that growth stocks outperform value stocks. These relationships are opposite to our expectations. Fama and French (1992) in the US and Chan, Hamao and Lakonishok (1991) and Aggarwal, Hiraki, and Rao (1992) in Japan suggest that small value stocks outperform large growth stocks. However, Harvey and Roper (1999) report small positive relationships between size and returns in Asian emerging markets. Claessens, Dasgupta and Glen (1998), Ramcharran (2004), Lyn and Zychowicz (2004) and Girard and Omran (2006) report a positive relationship between returns, and size and market-to-book value in some emerging markets. Several arguments have been put forth to explain these findings. Harvey and Roper (1999) argue that market growth has led to the mobilization of new capital and an increase in the number of firms rather than an increase in value. Furthermore, due to immature debt markets, small firms have a capital structure made up principally of equity, while larger firms with their international exposure can more easily gain access to leverage. For instance, Bolbol and Omran (2005) indicate that only large firms have higher leverage ratios in Arab markets. Claessens, Dasgupta, and Glen (1998) also suggest that the market microstructure causes these substantial differences and that regulatory and tax regimes force investors to behave differently in nascent markets. The authors also hypothesize that the positive relationships between returns and size and market-to-book value can be attributed to the segmentation of financial markets. Finally, Girard and Omran (2006) argue that large firms are more likely affected by legal and regulatory risks — i.e., exchange rate volatility, risk of nationalization (repossession of privatized assets), defaults on government obligations, and revocation of concessions given by previous governments. There is a significant positive relationship between the local beta and all stock risk premiums for the overall period (especially from 1999 to 2004). The relationship between the global beta and bank stock risk premiums is only significant from 1993 to 1998; it significantly negative for other stocks (overall period and 1993-2004). So, only recently, large ‘local’ beta stocks tend to outperform small ‘local’ beta stocks. The relationship between global beta stocks and risk premiums is inconclusive, indicating a high level of segmentation. The impact of country risk factors is different between bank stocks and other stocks. For instance, bank stocks seem to be particularly sensitive to socio-economic conditions and individual wealth (f3) while other stocks are sensitive to the investment potential of the country (f1), the risk of conflicts (f2), and the risk associated with foreign trade (f5). All stocks are similarly affected by risks associated with corruption (f4) and debt servicing (f6). In sum, we have identified that size, price-to-book value, individual wealth, corruption and debt servicing are the risks with the greatest bearing on bank stocks. Other stocks are not only affected by size and price to book value but also by the country investment opportunities, the risk of conflict, foreign trade, corruption debt servicing. From this observation alone, a bank stock selection criterion can be based on an expected increase in national income, a decrease in corruption and a more transparent financial system at the country level.
Next, we control for 2 well established measures of bank risk—i.e., bank concentration and duration gap. We retrieve local interest rates proxied by the lending rate, the annual GDP, and bank assets from the IMF databank (exact name?) for most countries. Taiwanese interest rates, GDP for Mexico, Russia, and South Africa are retrieved from Reuters. GDP data are unavailable for India, Lebanon and Taiwan and Bank asset data are unavailable for India and Taiwan. All data on bank assets are in U.S. Dollar (to the exception of Cote d’Ivoire and Zimbabwe which GDP is given in national currency) and all GDP data are in local currency. Using the exchange rate provided by EMDB, all series are converted into U.S. Dollars. We further retrieve from EMDB book value of equity and book value of total assets for each commercial bank used in our sample, these data are in monthly frequency and available for 30 markets as of 1998:01, and 1999:01 for the remaining markets.
20

GLOBAL JOURNAL OF BUSINESS RESEARCH ♦ VOLUME 4 ♦ NUMBER 2 ♦ 2010
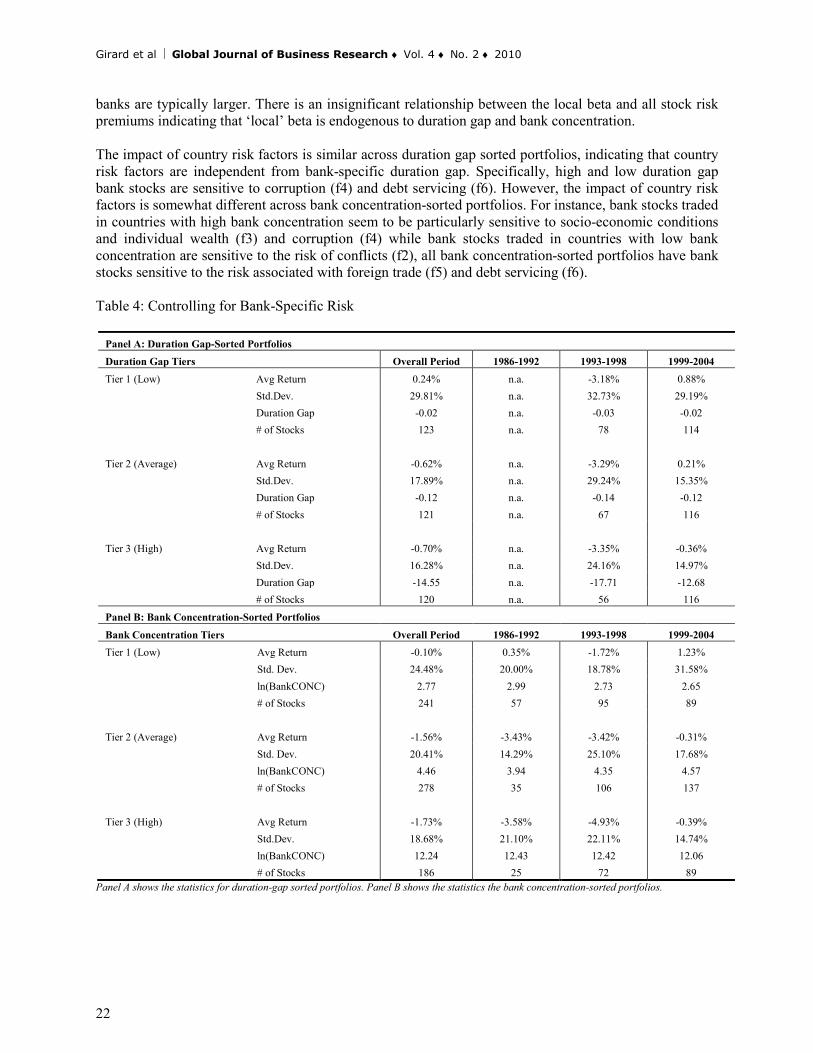
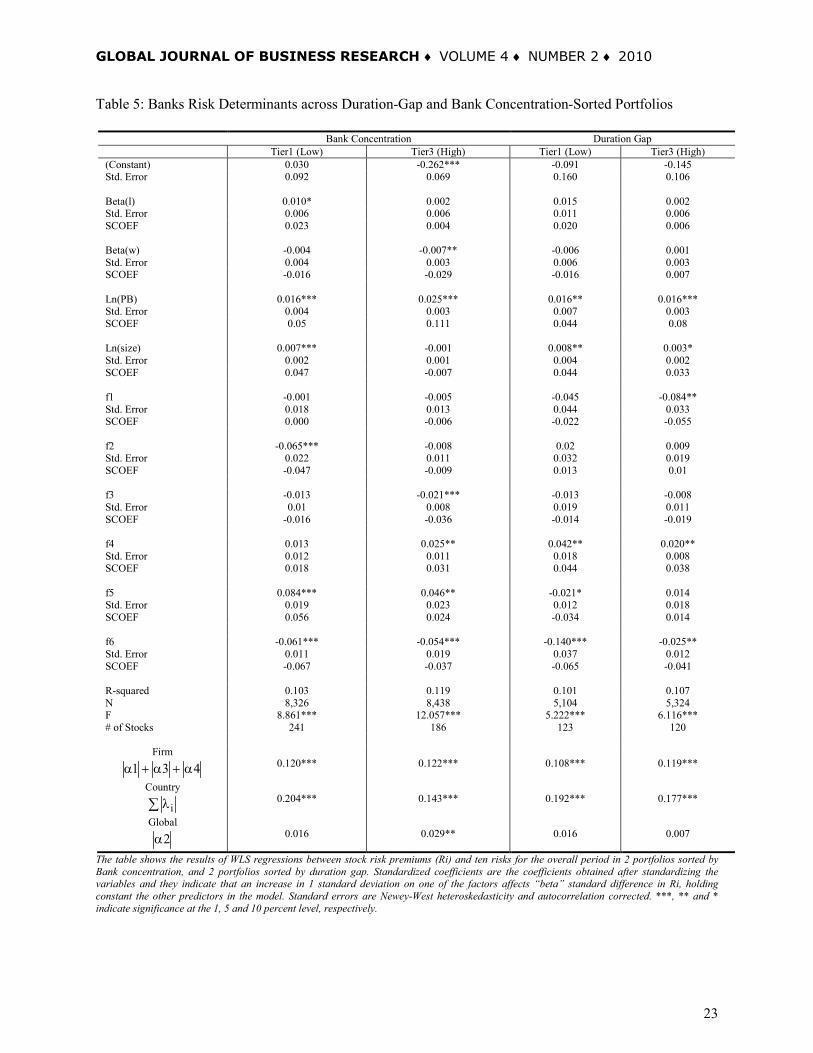
Then, bank concentration ratios ($ bank assets to $GDP) are computed for each stock and each month. Stocks traded in India, Lebanon and Taiwan are excluded due to missing information. Duration gaps for each bank and each month are also estimated. For this, we first regress each stock local returns on the difference in lending rate in the country to which the firm belongs. One lag of the interest rate difference is included to allow for a delayed response due to non-synchronous trading. Durations are computed with a minimum of two years and a maximum of five years of historical monthly returns. Duration gaps are then estimated by multiplying the duration by the weight of equity (book value of equity to book value of total assets). In order to investigate the effect of bank concentration and duration gap on bank stocks risk premiums, we build for each month and each country bank concentration and duration gap-sorted portfolios. For this, we use all bank stocks traded in each market from 1986:01 to 2004:06. At the beginning of each month, stocks with available ranking information are sorted into three portfolios (top 30%, middle 40%, bottom 30%) based on the logarithm of bank concentration and the logarithm of the absolute value of duration gap (explain in a footnote). For each month and each sorting, returns of these stocks are then averaged. In Table 4, we show the average return, standard deviation, duration gap, and the number of stocks making each tier for each grouping. Panel A shows the duration-gap sorted portfolios and panel B shows the bank concentration-sorted portfolios. Results can be summarized as follows: bank stocks with low duration gap outperform bank stock with high duration gap, they also have high total risk measured by the standard deviation of returns. Furthermore, bank stocks evolving in a low bank concentration environment outperform those evolving in a low bank concentration environment; they also have high total risk measured by the standard deviation of returns. Finally, we investigate how bank with different duration gaps and different bank concentration environments are affected by bank stock fundamentals, country, and global risk. For this, we run equation 1 in 4 portfolios of bank stocks: Low and high duration gap, and low and high bank concentration. Results are shown for the overall period (1986 to 2004) in Table 5. R-squared for each equation indicates that about 10 percent of the variations in fundamental, country and global risk factors explain the variation in stock risk premiums. The variance inflation factors (not reported for sake of brevity) for each independent variable are extremely low for each period (less than 1.4, that is, more than 71 percent of the variance of each independent variable is not shared by other independent variables) indicating that the our regressions are not likely affected by multicollinearity. At the bottom of the table, the sum of the absolute value of the standardized coefficients is reported; the significance of the sum is determined by a Wald test. The first interesting finding is that firms’ fundamentals are overall less important than country risk factors in explaining stock risk premiums for commercial banks with extreme duration gaps and bank concentration. It indicates that stock fundamentals are endogenous to duration gap and bank concentration – e.g., a 1 standard deviation shock on fundamentals leads to a 0.120 to 0.122 (0.108 to 0.119) standard deviation shock on Ri for low and high bank concentration portfolios (duration gap portfolios), and a 1 standard deviation shock on country risk factors leads to a 0.204 to 0.143 (0.192 to 0.177) standard deviation shock on Ri for low and high bank concentration portfolios (duration gap portfolios). Global factors are only significantly relevant for banks evolving in a high bank concentration environment. The signs associated with the fundamentals are the same as in Table 3, and indicate that large stocks outperform small stocks and that growth stocks outperform value stocks. However, the size factor is not significant for banks evolving in a high bank concentration environment. It might indicate that these
21
Girard et al Global Journal of Business Research ♦ Vol. 4 ♦ No. 2 ♦ 2010
banks are typically larger. There is an insignificant relationship between the local beta and all stock risk premiums indicating that ‘local’ beta is endogenous to duration gap and bank concentration. The impact of country risk factors is similar across duration gap sorted portfolios, indicating that country risk factors are independent from bank-specific duration gap. Specifically, high and low duration gap bank stocks are sensitive to corruption (f4) and debt servicing (f6). However, the impact of country risk factors is somewhat different across bank concentration-sorted portfolios. For instance, bank stocks traded in countries with high bank concentration seem to be particularly sensitive to socio-economic conditions and individual wealth (f3) and corruption (f4) while bank stocks traded in countries with low bank concentration are sensitive to the risk of conflicts (f2), all bank concentration-sorted portfolios have bank stocks sensitive to the risk associated with foreign trade (f5) and debt servicing (f6). Table 4: Controlling for Bank-Specific Risk
Panel A: Duration Gap-Sorted Portfolios Duration Gap Tiers Overall Period 1986-1992 1993-1998 1999-2004 Tier 1 (Low) Avg Return 0.24% n.a. -3.18% 0.88% Std.Dev. 29.81% n.a. 32.73% 29.19% Duration Gap -0.02 n.a. -0.03 -0.02 # of Stocks 123 n.a. 78 114 Tier 2 (Average) Avg Return -0.62% n.a. -3.29% 0.21% Std.Dev. 17.89% n.a. 29.24% 15.35% Duration Gap -0.12 n.a. -0.14 -0.12 # of Stocks 121 n.a. 67 116 Tier 3 (High) Avg Return -0.70% n.a. -3.35% -0.36% Std.Dev. 16.28% n.a. 24.16% 14.97% Duration Gap -14.55 n.a. -17.71 -12.68 # of Stocks 120 n.a. 56 116
Panel B: Bank Concentration-Sorted Portfolios
Bank Concentration Tiers Overall Period 1986-1992 1993-1998 1999-2004 Tier 1 (Low) Avg Return -0.10% 0.35% -1.72% 1.23% Std. Dev. 24.48% 20.00% 18.78% 31.58% ln(BankCONC) 2.77 2.99 2.73 2.65 # of Stocks 241 57 95 89 Tier 2 (Average) Avg Return -1.56% -3.43% -3.42% -0.31% Std. Dev. 20.41% 14.29% 25.10% 17.68% ln(BankCONC) 4.46 3.94 4.35 4.57 # of Stocks 278 35 106 137 Tier 3 (High) Avg Return -1.73% -3.58% -4.93% -0.39% Std.Dev. 18.68% 21.10% 22.11% 14.74% ln(BankCONC) 12.24 12.43 12.42 12.06 # of Stocks 186 25 72 89
Panel A shows the statistics for duration-gap sorted portfolios. Panel B shows the statistics the bank concentration-sorted portfolios.
22
GLOBAL JOURNAL OF BUSINESS RESEARCH ♦ VOLUME 4 ♦ NUMBER 2 ♦ 2010
Table 5: Banks Risk Determinants across Duration-Gap and Bank Concentration-Sorted Portfolios
Bank Concentration Duration Gap Tier1 (Low) Tier3 (High) Tier1 (Low) Tier3 (High) (Constant) 0.030 -0.262*** -0.091 -0.145 Std. Error 0.092 0.069 0.160 0.106 Beta(l) 0.010* 0.002 0.015 0.002 Std. Error 0.006 0.006 0.011 0.006 SCOEF 0.023 0.004 0.020 0.006 Beta(w) -0.004 -0.007** -0.006 0.001 Std. Error 0.004 0.003 0.006 0.003 SCOEF -0.016 -0.029 -0.016 0.007 Ln(PB) 0.016*** 0.025*** 0.016** 0.016*** Std. Error 0.004 0.003 0.007 0.003 SCOEF 0.05 0.111 0.044 0.08 Ln(size) 0.007*** -0.001 0.008** 0.003* Std. Error 0.002 0.001 0.004 0.002 SCOEF 0.047 -0.007 0.044 0.033 f1 -0.001 -0.005 -0.045 -0.084** Std. Error 0.018 0.013 0.044 0.033 SCOEF 0.000 -0.006 -0.022 -0.055 f2 -0.065*** -0.008 0.02 0.009 Std. Error 0.022 0.011 0.032 0.019 SCOEF -0.047 -0.009 0.013 0.01 f3 -0.013 -0.021*** -0.013 -0.008 Std. Error 0.01 0.008 0.019 0.011 SCOEF -0.016 -0.036 -0.014 -0.019 f4 0.013 0.025** 0.042** 0.020** Std. Error 0.012 0.011 0.018 0.008 SCOEF 0.018 0.031 0.044 0.038 f5 0.084*** 0.046** -0.021* 0.014 Std. Error 0.019 0.023 0.012 0.018 SCOEF 0.056 0.024 -0.034 0.014 f6 -0.061*** -0.054*** -0.140*** -0.025** Std. Error 0.011 0.019 0.037 0.012 SCOEF -0.067 -0.037 -0.065 -0.041 R-squared 0.103 0.119 0.101 0.107 N 8,326 8,438 5,104 5,324 F 8.861*** 12.057*** 5.222*** 6.116*** # of Stocks 241 186 123 120
Firm
431 α+α+α 0.120*** 0.122*** 0.108*** 0.119***
Country
∑ λi 0.204*** 0.143*** 0.192*** 0.177***
Global
2α 0.016 0.029** 0.016 0.007
The table shows the results of WLS regressions between stock risk premiums (Ri) and ten risks for the overall period in 2 portfolios sorted by Bank concentration, and 2 portfolios sorted by duration gap. Standardized coefficients are the coefficients obtained after standardizing the variables and they indicate that an increase in 1 standard deviation on one of the factors affects “beta” standard difference in Ri, holding constant the other predictors in the model. Standard errors are Newey-West heteroskedasticity and autocorrelation corrected. ***, ** and * indicate significance at the 1, 5 and 10 percent level, respectively.
23

Girard et al Global Journal of Business Research ♦ Vol. 4 ♦ No. 2 ♦ 2010
In sum, we have identified that duration gap, bank concentration, size, price-to-book value, corruption and debt servicing are the risks with the greatest bearing on bank stocks. Thus, a decrease in duration gap, a low bank concentration, a decrease in corruption and a more transparent financial system at the country level are critical success factors for bank stock selection.
CONCLUSION Although banks are central to a financial system in any economy, there have been relatively few studies that have investigated the factors that determine their stock returns especially in emerging markets. As pointed out by Benston (2004), banks provide highly valued products and services, act as conduits for monetary policy, and play a vital role in development and growth of economies. Just to inspire confidence in this system, governments have this sector highly regulated. The importance of banks in an economy, provide investors an opportunity for investment, and also to realize the benefits of growth, which is been observed in most emerging markets. But by their very nature, investments in emerging markets are risky. This paper thus contributes to the literature in finance by investigating and identifying the risk factors that determine stock returns of commercial banks emerging markets. Our investigation reveals that fundamental factors as well as country risk factors determine stock returns of commercial banks in emerging markets. Duration gap, bank concentration, corruption, debt servicing, socio-economic conditions and even per-capita GDP influence bank stock returns in these countries. REFERENCE Aggarwal, R., Ramesh, P. R., Hiraki, T., 1992. Price/book value ratios and equity returns on the Tokyo stock exchange: empirical evidence of regularities. Financial Review 27 (4), 589-605. Bekaert, G., Harvey, C., 1997. Emerging equity market volatility. Journal of Financial Economics 43 (1), 29-78. Bekaert, G., Harvey, C., 2000. Foreign speculators and emerging equity markets. Journal of Finance 55 (2), 565-613. Benston, George J., (2004), What’s Special About Banks?, The Financial Review v39, pp 13-33 Bolbol, A., Omran, M., 2005. Investment and the stock market: evidence from Arab firm-level panel data. Emerging Markets Review 6 (1), 85-106. Chan, L. K. C., Hamao, Y., Lakonishok, J., 1991. Fundamentals and stock returns in Japan. Journal of Finance 46, 1739-64. Claessens, S., Dasgupta, S., Glen, J., 1998. The cross section of stock returns: evidence from emerging markets. Emerging Markets Quarterly 2, 4–13. Comrey, A.L., Lee, H.B., 1992. A first course in factor analysis, 2nd Ed. (Hillsdale, NJ: Erlbaum). Daniel, K., Titman, S., 1997. Evidence on the characteristics of cross-sectional variation in stock returns. Journal of Finance 52, 427-65. Erb, C., Harvey, C., Viskanta, T., 1995. Country credit risk and global portfolio selection. Journal of Portfolio Management, Winter, 74-83.
24

GLOBAL JOURNAL OF BUSINESS RESEARCH ♦ VOLUME 4 ♦ NUMBER 2 ♦ 2010
Erb, C., Harvey, C., Viskanta, T., 1996a. Expected returns and volatility in 135 countries. Journal of Portfolio Management, Spring, 46-58. Erb, C., Harvey, C., Viskanta, T., 1996b. Political risk, financial risk and economic risk. Financial Analysts Journal 52(6), 28-46. Erb, C., Harvey, C., Viskanta, T., 1998. Risk in emerging markets. The Financial Survey, July/August, 42-46. Fama, E.F., French, K.R., 1992. The cross-section of expected stock returns. Journal of Finance 47(2), 1992. Fama, E.F., French, K.R., 1996. Multifactor explanations of asset pricing anomalies. Journal of Finance 51, 55–84. Fama, E.F., French, K.R., 1998. Value versus growth: the international evidence. Journal of Finance 53, 1975–1999. Girard E., Omran, M., 2007. What are the risks when investing in thin emerging equity markets: evidence from the Arab world. The Journal of International Financial Markets, Institutions & Money. Girard E, Sinha, A. K., (2006) Risk and Return in the Next Frontier, Journal of Emerging Market Finance, Forthcoming, Harvey, C. (1995a). The Cross-Section of Volatility and Autocorrelation in Emerging Markets. Finanzmarkt und Portfolio Management 9, 12-34. Harvey, C. (1995b). The Risk Exposure of Emerging Equity Markets.World Bank Economic Review, 19-50. Harvey, C., Roper, A., 1999. “The Asian bet” in Alison Harwood, Robert E. Litan and Michael Pomerleano, eds.: The crisis in emerging financial markets, Brookings Institution Press, 29-115. Lyn, E., Zychowicz, E., 2004. Predicting stock returns in the developing markets of Eastern Europe. The Journal of Investing, Summer 2004. Patel, S., 1998. Cross-sectional variation in emerging markets equity returns. January 1988-March 1997, Emerging Markets Quarterly 2, 57–70. Ramcharran, H., 2004. Returns and pricing in emerging markets. The Journal of Investing, Spring 2004. Rouwenhorst, K. G., 1999. Local return factors and turnover in emerging stock markets. Journal of Finance 54, 1439–64. Seiler, M.J., 2004. Performing financial studies, a methodological cookbook. (Upper Saddle River, NJ: Pearson Prentice Hall). Tabachnick, B., Fidell, L., 1996. Using multivariate statistics, 3rd Ed. (New York, NY: Harper Collins).
25

Girard et al Global Journal of Business Research ♦ Vol. 4 ♦ No. 2 ♦ 2010
BIOGRAPHY Eric Girard, James Nolan, Siena College and Tony Pondillo can be contacted at School of Business, Siena College, 515 Loudon Road, Loudonville, NY, 1221. Dr. Girard, the corresponding author, can also be contacted via email to [email protected]
26

GLOBAL JOURNAL OF BUSINESS RESEARCH ♦ VOLUME 4 ♦ NUMBER 2 ♦ 2010
INDUCING GREEN BEHAVIOR IN A MANUFACTURER Andrew Manikas, University of Wisconsin Oshkosh Michael Godfrey, University of Wisconsin Oshkosh
ABSTRACT
The triple bottom line (economic, environmental, and social performance) is an important approach to long-term sustainability of a manufacturing company. However, a manufacturer will always feel pressure to focus on the economic bottom line and to give at least equal importance to the second and third bottom lines (environmental and social performance). As environmental issues become more important to citizens, they demand enhanced environmental performance from companies by exerting pressure on public policy makers to enact regulations, taxes, permits, and penalties that motivate companies to improve their environmental performance. We present a model that could be used by governmental policy makers to predict the effects from reducing the number of emissions permits and increasing the penalties for exceeding allowable emission limits. Our model is for a product that has a limited selling season. We propose a newsvendor model to estimate a manufacturing company’s optimal production quantity based on maximization of expected profits given the cost of emission permits and penalties for exceeding emission limits allowed by the permits. In addition, the newsvendor model provides insights to policy makers on the effects of adjusting the regulatory levers of emission permits and penalties. JEL: M11, R38 KEYWORDS: Triple Bottom Line, Manufacturing, Sustainability, Green INTRODUCTION
n any economy around the globe, manufacturers will try to maximize their profit rationally. However, the public has increasing interest in environmentally safe products and processes. Implementing methods to motivate manufacturers to reduce emissions is increasingly important for policy makers as
citizens are becoming more conscious of the negative effects of pollution. The triple bottom line of economic, environmental, and social performance (Elkington, 1994, 1998) is an important concept for sustainability. Without the bottom line (economic performance), companies will not be able to invest time in the other two pillars of the triple bottom line because they will be worried about solvency. Therefore, a government agency will directly influence a company’s environmental performance most by creating regulations and policies that affect the company’s economic performance. If a policy or fee impacts a manufacturer’s expected profits, the manufacturer will act to improve its profit. Therefore, without dictating emissions, clean technologies, landfill quotas, or production limits, a regulatory agency can use the levers in our model to provide incentives for clean, sustainable manufacturing. The remainder of the paper is organized as follows. In the next section we discuss the relevant literature. In the following section we identify the problem at hand. Next, we discuss the policy implications associated with our findings. The paper closes with a discussion of some managerial implications of this work. LITERATURE REVIEW The first widespread definition of sustainable development was presented in Our Common Future (World Commission on Economic Development, 1987, p. 8) in which sustainable development was described as
I
27

A. Manikas, M. Godfrey Global Journal of Business Research ♦ Vol. 4 ♦ No. 2 ♦ 2010
“development that meets the needs of the present without compromising the ability of future generations to meet their own needs.” Later, other authors, e.g., Elkington (1994, 1998), expanded the definition of sustainability to include the triple bottom line of economic, environmental, and social performance. Environmental issues are becoming increasingly important to the public, e.g., as far back as 1995, four out of five Americans believed that pollution threatened the quality of their lives (Kuzmiak, 1995). In other words, Americans are becoming increasingly aware of the environment, and they are attempting to influence manufacturers and government to take action. As regulations become more pervasive and stricter, manufacturing companies must be prepared to invest in new production methods, materials, and equipment or pay higher penalties for producing pollution. Therefore, a manufacturer must account for emissions explicitly in its product cost. In the European Union, the impact of emissions on the environment has been the focus of study for some time. The European Union (EU) recently enacted the Registration, Evaluation, and Restriction of Chemicals (REACH) regulation that forces manufacturing companies and importers to find safer alternatives for high concern chemicals (Lockwood, 2008). However, the United States has lagged behind the EU in research and action that would enable policy makers to bring about pollution reduction. Even with the lagging regulation in the U.S., companies such as 3M launched Pollution Prevention Pays in 1975, which they claim has since eliminated 1.6 billion pounds of air, water and land pollution (Meyer, 2000). Similarly, DuPont reportedly has halved its landfill waste (Meyer, 2000). Interface Carpets’ environmentally sound product lines accounted for 10-15% of profits in 1997 (Meyer, 2000). General Electric (GE) estimates that the revenue it will bring in from environmental technology alone will reach $20 billion by 2010 (Wade, 2005). Rennie (2008) discussed other initiatives at Ford, where designers are starting to incorporate post-industrial materials in seats, and at Caterpillar, which since 2001 has seen its remanufacturing business grow by almost 70%. Of course, stricter environmental laws also are keeping companies such as GE from polluting. For example, in 2007, GE incurred Global Paid Penalties of $236,000, down from $351,000 in 2004 (GE Citizenship Performance Metrics, 2008). The total cost of complying with environmental laws over the past 25 years has exceeded $1 trillion, and about $120 billion continues to be spent annually for pollution abatement and control (Berry & Rondinelli, 1998). A higher tax can be charged for waste (a disincentive), or taxes can be lowered on desirable activities to provide economic incentives for reducing excessive environmental and social costs (Corson, 2002). Taxes also can be levied to the end users, to the manufacturer, or to multiple players. However, charging the end users often is ineffective as they are too far removed from the design and manufacturing processes to bring about significant changes in material use or pollution. Therefore, to encourage the design of ways to control pollution, upstream instruments are needed (Calcott & Walls, 2000). Two commonly used methods to reduce harmful emissions are subsidies for not emitting pollutants and taxes on the level of emissions. Many argue that subsidies can increase the cost of government, burden the economy, and hurt long-term development (Kohn, 1992). However, Nakada (2004) found that with taxes, profit losses are offset by the incentive to engage in research and development. A company will produce products using processes that may or may not pollute, depending on the best way to maximize profit. We posit that a company may not necessarily be environmentally conscious from an altruistic standpoint, but if the proper government levers are applied, the manufacturer’s optimal production strategy will be aligned with the government’s desire for a clean environment. The government can enact regulations for fees on pollution, hazardous waste disposal, permit prices, and a cap on the total number of permits available for emissions. In addition, some firms may be motivated to invest in green production processes to attract green consumers and investors (Fairchild, 2008).
28

GLOBAL JOURNAL OF BUSINESS RESEARCH ♦ VOLUME 4 ♦ NUMBER 2 ♦ 2010
Aidt and Dutta (2004) take a more generalized approach to the issue of who should be responsible for the cost of emissions; they describe the differences among three policy instruments: (1) uniform emissions standards, (2) tradable permits, and (3) emission taxes, all of which are methods for motivating manufacturers to reduce emissions. Subramanian, Gupta, and Talbot (2007) studied different manufacturer compliance strategies under permits for emissions: investment in abatement, bidding for permits, and adjustment of output levels. In our paper, we deal primarily with emission permits, penalties, and adjustment of output levels. We treat investment in abatement as an issue for future study. Unlike Subramanian, Gupta, and Talbot (2007), we allow for the possibility of firms paying penalties for exceeding emission limits, assume that demand is stochastic (rather than deterministic), and include a disposal/salvage cost at the end of the season. We seek to gain wide-reaching insights by examining one particular manufacturer that seeks to maximize profits by producing one product that is subject to a policy maker’s costs for permits, disposal, pollution penalty fees, and a cap on the maximum number of permits available. Our model should prove useful to a manufacturing company to determine its profit-maximizing production quantity and to policy makers to establish permit numbers and penalty costs. PROBLEM We examine a single manufacturer that makes only one product in a competitive setting. The product is perishable, and due to the toxicity of its components, a disposal fee must be paid for any products on hand at the end of the selling season. For example, this disposal fee could be a landfill fee. During manufacture of the product, permits for a certain level of emissions are available. Additional emissions incur a penalty substantially higher than the permit price. We assume that the manufacturer is a price taker. Given that substitute products from other manufacturers exist, the manufacturer is unable to pass on the cost of environmental compliance to its customers. The manufacturer does not have to exist strictly in a commodity market; rather, we assume that even with moderate product differentiation and a brand premium, there is a limit to how much the manufacturer can charge to offset increased costs due to polluting. The manufacturer cannot merely raise its prices to offset permit prices and penalty fees. The manufacturer seeks to maximize its profit given the permits and penalties set by the government. Given a forecast of demand and an expected standard deviation of demand for a product, it would be optimal for the manufacturer to solve a newsvendor equation and to buy exactly the specified number of permits corresponding to its optimal production quantity for the product. However, we assume that there is a scarcity of permits due to government regulations directed at reducing overall emissions. Given that the product is perishable, the manufacturer would determine its profit maximizing quantity using a newsvendor equation assuming unlimited permits. The manufacturer then would purchase as many permits as it could up to its profit maximizing quantity. After that, the manufacturer would solve another newsvendor equation to determine how many units above the permit quantity to produce. This revised newsvendor model would consider the increased penalty costs, which would be substantially higher than permit costs. The manufacturer’s goal, once again, would be to maximize its expected profit. Model Notation
p Selling price per unit of the end product
c Manufacturing cost per unit (materials and labor)
a Maximum number of permits available
e Emissions permit cost (per unit of output)
λ Emissions penalty cost (per unit of output without permit)
29

A. Manikas, M. Godfrey Global Journal of Business Research ♦ Vol. 4 ♦ No. 2 ♦ 2010
δ Cost per unit to dispose of unsold products (assessed to the manufacturer)
F Cumulative distribution function of demand
f Probability density function of demand
µ Mean demand
σ Standard deviation of demand *1q Optimal quantity to produce when permits are unlimited
*pq Optimal quantity to produce if no permits are available
*2q Optimal quantity to produce beyond the permit cap
*uq Optimal quantity to produce if no permits or penalties apply to the product
Assumptions The product is perishable and cannot be sold after the selling season, for example, high-tech electronic components. Furthermore, the product has zero value at the end of its selling season and may incur a disposal cost. A salvage value could be modeled easily by letting δ include a negative component corresponding to the salvage value. Thus, δ would be the net of disposal costs and salvage value. The penalty per unit of emission without a permit is greater than the cost per unit for a permit (i.e., λ > e). If this relationship did not hold, there would be no market for emissions permits. The parameters of the end customer demand distributions are known. Furthermore, we assume that the distribution of demand is normal, uniform, or exponential. The selling price, p, is greater than the manufacturing cost plus the emissions permit price (p > c + e). This relationship makes it profitable for the manufacturer to sell this product. Step 1 The manufacturer determines its profit-maximizing production quantity working from the assumption that an unlimited number of permits is available. The manufacturer wants to understand the optimal quantity to produce when a permit cap does not constrain production. Expected profit in this case with a single selling season is shown in (1) where the subscript 1 denotes Step 1 and the variable x denotes the end customer demand.
𝐸𝐸[Π1] � −(𝑐𝑐 + 𝑒𝑒)𝑞𝑞1 + 𝑝𝑝𝑞𝑞1,𝑥𝑥 > 𝑞𝑞1−(𝑐𝑐 + 𝑒𝑒)𝑞𝑞1 + 𝑝𝑝𝑥𝑥 − 𝛿𝛿 (𝑞𝑞1 − 𝑥𝑥), 𝑥𝑥 < 𝑞𝑞1
� (1)
Equivalently, ∫∫ ∫∞−∞−
∞
−−+++−=Π11
1
)()()()()(][ 1111
q
dxxfxqdxxfpqdxxxfpqecE δ (2)
Equation (2) can be rewritten as:
−+−−
−−++−=Π ∫ ∫∫ ∫
∞
∞−
∞∞
∞−
∞
11
)()()()()()()()(][ 11111qq
dxxfqxdxxfxqdxxfqxdxxxfpqecE δ (3)
30

GLOBAL JOURNAL OF BUSINESS RESEARCH ♦ VOLUME 4 ♦ NUMBER 2 ♦ 2010
Which can be simplified given that ∫∞
−=1
)()( 1q
dxxfqxγ is the loss function as:
γδµδδ )()()(][ 11 ppqecE +−++++−=Π (4) Taking the partial derivative of Equation (4) with respect to q1 and setting it to zero allows us to solve for the critical fractile:
0)()()(][
11=++++−=
∂Π∂
∫∞
q
dxxfpecq
E δδ (5)
0))(1)(()( 1 =−++++− qFpec δδ
Thus, the critical fractile is as shown in Equation (6):
δ+−−
=p
ecpqF )( *1 (6)
Taking the second derivative of Equation (4) with respect to *
1q gives a negative number because p and δ are positive. This confirms that we are finding the profit maximum (and not a minimum).
0)()(][21
2
<+−=∂
Π∂ dxxfpq
E δ (7)
By substituting Equation (6) into Equation (4), we can find the expected profit for the normal distribution.
For a normal distribution, the loss function γ is
−
σµ
σ 1qG . Letσµ−
=*1qz , therefore σµ zq +=*
1 .
For the normal distribution, we can rewrite Equation (4) as (8) below. We use the superscript n, u, and e for normal, uniform and exponential distributions, respectively. The subscript 1 denotes that this profit is for Step 1.
−+−++++−=Π
σµ
σδµδδ*1*
11 )()()(][qGppqecE n (8)
This can be simplified to Equation (9) below:
))](1()([)()()(][ *11 zzzppqecE n Φ−−+−++++−=Π φσδµδδ (9)
For a normalized uniform demand distribution over the range [0, 1], we know the probability density
function is 101
1)( =−
=xf and µ =1/2. The *1q in the following equations is the quantity produced
scaled to be in the range [0, 1]. Using this probability density function in Equation (4) with the loss
function 21)1(
21 q−=γ gives the expression in Equation (10):
2*1
*11 )1)((
21)(
21)(][ qppqecE u −+−++++−=Π δδδ (10)
31

A. Manikas, M. Godfrey Global Journal of Business Research ♦ Vol. 4 ♦ No. 2 ♦ 2010
For an exponential distribution with mean μ = 1, the probability density function is xexf −=)( and *1qe−=γ provides:
*1)()()(][ *
11qe eppqecE −+−++++−=Π δδδ (11)
Determining the optimal quantity to produce requires balancing the costs of having too many units (overage cost of co) and the costs of having too few units (shortage cost of cu). We define cu as the marginal benefit to profit of having more units to sell when demand exceeds the production quantity. The shortage cost is the incremental loss of profit for one unit. Explicitly, the shortage cost is the selling price (p) minus the manufacturer’s costs (c for materials and labor plus e for the permit cost). Therefore, we end up with the shortage cost equation below: cu = p – c – e (12) We define co as the marginal cost of having one too many units beyond the end demand. The overage cost includes product costs (c for materials and labor plus e for the permit cost) plus a disposal fee value δ. The overage cost equation for a single selling period is defined below: co = c + e + δ (13) If the cap on permits (a) does not constrain the production quantity, the optimal quantity for the manufacturer to produce *
1q is shown in Equation (14) below in general form equated to the result found in Equation (6):
δ+−−
=+
=p
ecpcc
cqF
ou
u)( *1 (14)
Step 2 The manufacturer buys permits to maximize its profits subject to the permit cap imposed by the government. In this step, the manufacturer purchases the minimum number of permits available (a) or the number of permits equating to the optimal production quantity *
1q calculated in Equation (14). Let m denote the number of permits that the manufacturer purchases. If a > *
1q , there is no constraint on the manufacturer’s production quantity. m = min (a, *
1q ) (15) Step 3 The manufacturer decides how much, if any, to produce in excess of the number of permits using the newsvendor equation. In this third step, the emissions permit cost (e) is replaced by a more expensive emissions penalty (λ). For example, the Clear Skies Act of 2003 (Energy Information Administration, 2003) specified levels of SO2—the penalty before 2008 was set at $2,000 per ton of SO2 if offsets were made and payments were received within 30 days. If offsets were not made or payments were not received within 30 days, then the penalty was set at $4,000 per ton of SO2.
If the manufacturer desires production beyond the permit cap (a), it now must pay the more expensive emissions penalty (λ) rather than the permit (e) price. The manufacturer decides how much production should exceed the number of permits using the newsvendor equation. Now, in the base model, the emissions permit cost (e) has been replaced by a more expensive emissions penalty (λ). The new critical
32

GLOBAL JOURNAL OF BUSINESS RESEARCH ♦ VOLUME 4 ♦ NUMBER 2 ♦ 2010
fractile equation below uses the penalty (λ) instead of the permit (e). Furthermore, on the same distribution, *
1q > *2q because λ > e is assumed and all other parameters are constant. We find the optimal
quantity to produce under penalty fees similarly to Equation (14), but with the emissions permit (e) replaced by the penalty cost (λ) as shown in Equation (16):
δλ
+−−
=+
=p
cpcc
cqF
ou
up )( * (16)
The quantity to produce beyond the permit cap (a) is:
)0,max( **2 aqq p −= (17)
Step 4 The manufacturer produces the optimal number of units ( *
2*1 qq + ). The manufacturer incurs material and
labor costs (c) per unit, permit cost (e) per unit of *1q , and penalty cost (λ) per unit of *
2q for a total cost of: *2
*1
*2
*1 )( pqeqqqc +++ (18)
Therefore the manufacturer’s expected profit is determined by the following equation based on the cost of
*1q units with emissions permits (e), the cost of *
2q units with penalty fees (λ), the expected disposal fees (δ) for having unmet demand, and the expected revenue for units sold.
𝐸𝐸[Π1] �−(𝑐𝑐 + 𝑒𝑒)𝑞𝑞1 − (𝑐𝑐 + 𝜆𝜆)𝑞𝑞2 𝑝𝑝(𝑞𝑞1 + 𝑞𝑞2) , 𝑥𝑥 > (𝑞𝑞1 + 𝑞𝑞2) −(𝑐𝑐 + 𝑒𝑒)𝑞𝑞1 − (𝑐𝑐 + 𝜆𝜆)𝑞𝑞2 + 𝑝𝑝𝑥𝑥 − 𝛿𝛿(𝑞𝑞1 + 𝑞𝑞2,−𝑥𝑥),𝑥𝑥 ≤ (𝑞𝑞1 + 𝑞𝑞2)
� (19)
Equivalently,
∫ ∫∫∞
+
−
∞−
+
∞−
−+−++++−+−=Π21
2121
)()()()()()()(][ 2121214qq
qqqq
dxxfxqqdxxfqqpdxxfxpcqecqE δλ (20)
Equation (20) can be rewritten as below, letting q = q1+q2 for ease of notation:
−+−−
−−+−−−=Π ∫ ∫∫ ∫
∞
∞−
∞∞
∞−
∞
dxxfqxdxxfxqdxxfqxdxxxfppqeqcqE )()()()()()()(][ 214 δ (21)
Which can be simplified, given that ∫∞
−=q
dxxfqx )()(γ is the loss function:
γδµλλδδ )()()()(][ 214 ppqcqecE +−++++−++−=Π (22) We now can find the equations for different demand distributions. For a normal distribution, the loss
function γ is
−
σµσ qG . Let
σµ−
=qz , therefore σµ zq += . For the normal distribution, we can
rewrite Equation (22) as Equation (23) below.
−
+−++++−++−=Πσµσδµδλδδ qGppqcqecE n )()()()(][ *
2*14 (23)
This can be simplified to Equation (24) below.
33

A. Manikas, M. Godfrey Global Journal of Business Research ♦ Vol. 4 ♦ No. 2 ♦ 2010
))](1()([)()()()(][ *2
*14 zzzpqecqecE n Φ−−+−++++−++−=Π φσδµδλδδ (24)
For a normalized uniform demand distribution over the range [0, 1], we know the probability density
function is 101
1)( =−
=xf and µ = 1/2. The *1q , *
2q and q in the following equations are the quantities
to produce scaled to be in the range [0, 1]. Using this probability density function in Equation (22) with
the loss function 2)1(21 q−=γ gives the expression in Equation (25):
2*2
*14 )1)((
21)(
21)()(][ qppqcqecE u −+−++++−++−=Π δδλδδ (25)
For an exponential distribution with mean μ = 1, the probability density function is xexf −=)( and qe−=γ , which gives:
qe eppqcqecE −+−++++−++−=Π )()()()(][ *
2*14 δδλδδ (26)
Step 5 Demand is realized at the manufacturer. At the end of the selling season, the disposal costs δ would be incurred by the manufacturer. In Figure 1, the cumulative pollution generated is the curve labeled Total Pollution that extends to the right. If permits do not constrain optimal production, the manufacturer will choose a production quantity *
Uq to maximize its expected profits. With a constraining cap on the available number of permits and a higher penalty for emissions beyond that limit, the optimal production quantity shifts left to *
2*1 qq + . As the penalty to permit fee ratio increases, *
2*1 qq + shifts further left from
*Uq .
IMPLICATIONS FOR POLICY MAKERS The government policy makers can dictate the cap on emissions permits, thereby directly or indirectly passing on some of the costs to the manufacturer. The manufacturer’s direct material and labor costs may be outside the policy maker’s control, but the effective total manufacturing costs are influenced by the costs of permits and penalties for polluting as well as the disposal costs for unsold products. A policy maker in charge of the number of available permits can reduce pollution in two ways:
1) Limiting permits lowers the quantity of goods that can be produced, and so directly reduces pollution.
2) The difference between permit price and the emission penalty indirectly forces a lower production quantity for the manufacturer. This, in turn, should result in fewer emissions during production and reduced likelihood that excess inventory will be disposed.
The disposal fee (δ) influences production levels. Calcott and Walls (2000) found that end consumer fees provide incentives only when there is a fully functioning recycling market. Our current models do not include recycling. Therefore, a schedule of phased out permits, with increasing penalties, may induce manufacturers to adopt clean technologies or cease production of polluting products. Regardless, because the optimal quantity of production will be lower given higher costs set by the regulator and because the manufacturer’s expected profit would decrease, the manufacturer inevitably will pollute less to maximize its expected profit.
34
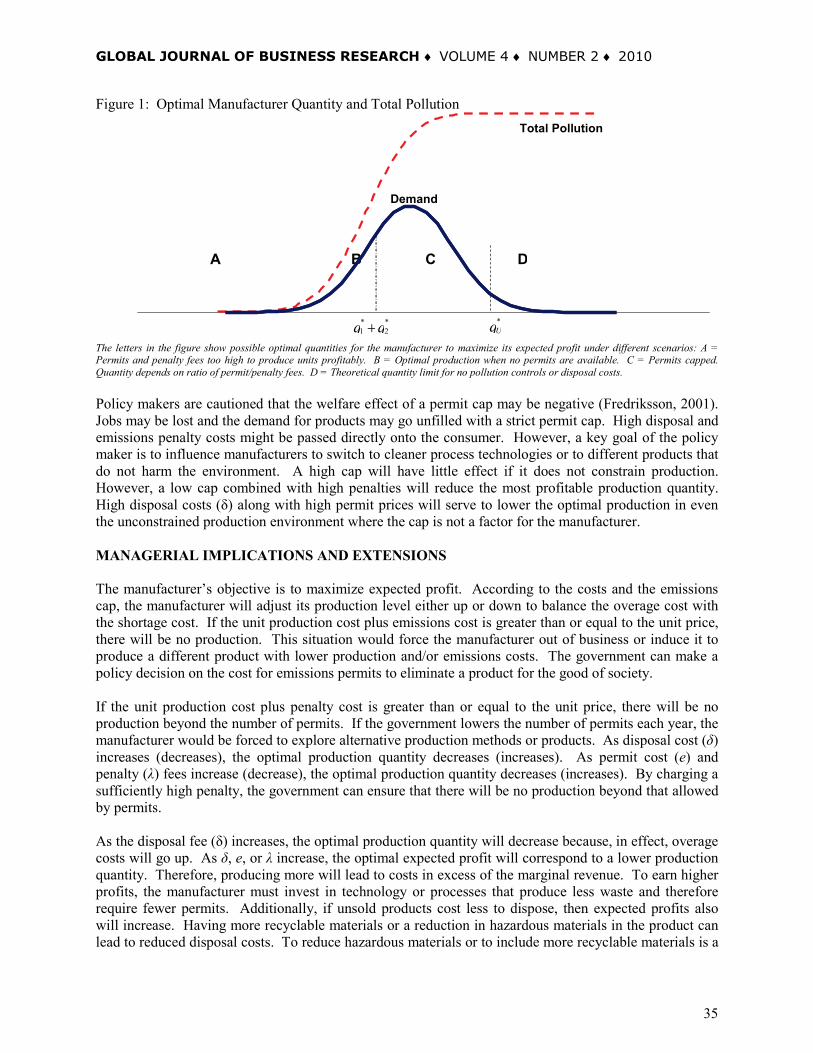
GLOBAL JOURNAL OF BUSINESS RESEARCH ♦ VOLUME 4 ♦ NUMBER 2 ♦ 2010
Figure 1: Optimal Manufacturer Quantity and Total Pollution
The letters in the figure show possible optimal quantities for the manufacturer to maximize its expected profit under different scenarios: A = Permits and penalty fees too high to produce units profitably. B = Optimal production when no permits are available. C = Permits capped. Quantity depends on ratio of permit/penalty fees. D = Theoretical quantity limit for no pollution controls or disposal costs. Policy makers are cautioned that the welfare effect of a permit cap may be negative (Fredriksson, 2001). Jobs may be lost and the demand for products may go unfilled with a strict permit cap. High disposal and emissions penalty costs might be passed directly onto the consumer. However, a key goal of the policy maker is to influence manufacturers to switch to cleaner process technologies or to different products that do not harm the environment. A high cap will have little effect if it does not constrain production. However, a low cap combined with high penalties will reduce the most profitable production quantity. High disposal costs (δ) along with high permit prices will serve to lower the optimal production in even the unconstrained production environment where the cap is not a factor for the manufacturer. MANAGERIAL IMPLICATIONS AND EXTENSIONS The manufacturer’s objective is to maximize expected profit. According to the costs and the emissions cap, the manufacturer will adjust its production level either up or down to balance the overage cost with the shortage cost. If the unit production cost plus emissions cost is greater than or equal to the unit price, there will be no production. This situation would force the manufacturer out of business or induce it to produce a different product with lower production and/or emissions costs. The government can make a policy decision on the cost for emissions permits to eliminate a product for the good of society. If the unit production cost plus penalty cost is greater than or equal to the unit price, there will be no production beyond the number of permits. If the government lowers the number of permits each year, the manufacturer would be forced to explore alternative production methods or products. As disposal cost (δ) increases (decreases), the optimal production quantity decreases (increases). As permit cost (e) and penalty (λ) fees increase (decrease), the optimal production quantity decreases (increases). By charging a sufficiently high penalty, the government can ensure that there will be no production beyond that allowed by permits. As the disposal fee (δ) increases, the optimal production quantity will decrease because, in effect, overage costs will go up. As δ, e, or λ increase, the optimal expected profit will correspond to a lower production quantity. Therefore, producing more will lead to costs in excess of the marginal revenue. To earn higher profits, the manufacturer must invest in technology or processes that produce less waste and therefore require fewer permits. Additionally, if unsold products cost less to dispose, then expected profits also will increase. Having more recyclable materials or a reduction in hazardous materials in the product can lead to reduced disposal costs. To reduce hazardous materials or to include more recyclable materials is a
Demand
Total Pollution
A B C D
* U q *
2 * 1 q q +
35

A. Manikas, M. Godfrey Global Journal of Business Research ♦ Vol. 4 ♦ No. 2 ♦ 2010
strategic policy decision for the manufacturer. As a last resort, a manufacturer will need to develop new products that can be produced with clean technologies. From the manufacturer’s standpoint, environmental policy instruments provide incentives to redesign products and processes to make them more environmentally friendly. The point of this research is not simply to determine the optimal production quantity from the model outlined above, but also to demonstrate that the predicted phasing out of the polluting product can be calculated with some degree of certainty. This study should provide guidance to management regarding the need to introduce clean technologies and/or new environmentally friendly products proactively. A rational manufacturer will produce to maximize its expected profit. If its profit decreases because of pollution costs during manufacturing, it will either produce less or introduce a different and less polluting product. If the regulating body believes that the social and environmental costs of pollution are sufficiently high, it can force the manufacturer to reduce pollution by imposing costs in the form of permits and higher penalties for pollution beyond the permit cap. A pre-determined and communicated schedule of permit caps over time allows the manufacturer to plan to reengineer processes, adopt cleaner technologies, and/or find cleaner products to produce. In this manner, the governmental regulating body and manufacturers become partners in reducing overall emissions. We have shown that a newsvendor equation models both the manufacturer’s quantity choices for production under permits and the penalties for exceeding available permits. With the combined expected profit equation, the key levers and their effects can be observed. The disposal fee for unsold products inversely influences the quantity produced. The number of permits, the permit fees, and the penalty fees also are inversely related to the quantity that the manufacturer will produce. The regulator can set a cap on the number of permits, their price, the penalties, and even on waste disposal fees. A limitation of the newsvendor model discussed here is the absence of competitors for demand and permits. The model could be extended to include the holding costs for keeping the product until the following season, as such costs would lower the optimal production quantity. The ratio of holding costs compared to the other costs and the discount factor for future revenue would dictate the significance of the holding costs. Another possible extension would be to include remanufacturing such that the revenue stream from future sales of remanufactured products would be included in the shortage cost. Remanufacturing would increase the optimal production quantity contingent on the additional reverse logistics costs and any cannibalization effects between new and remanufactured products. In this research, we have focused on the single bottom line (economic performance) rather than the triple bottom line because we believe that in the economy today, and especially in those economies of developing countries, manufacturers must use the levers described in our paper to alter the behavior of a manufacturer that is focused solely on economic performance. Clearly, a company that also focuses on environmental and social performance also will be influenced by these same levers. Therefore, our research provides insights into influencing all manufacturers regardless of their inherent level of interest in sustainability. REFERENCES
Aidt, T. & Dutta, J. (2004) “Transitional Politics: Emerging Incentive-based Instruments in Environmental Regulation,” Journal of Environmental Economics and Management, vol. 47(3), May, p. 458-479 Berry, M. & Rondinelli, D. (1998) “Proactive Corporate Environmental Management: A New Industrial Revolution,” Academy of Management Executive, vol. 12(2), May, p. 38-50
36

GLOBAL JOURNAL OF BUSINESS RESEARCH ♦ VOLUME 4 ♦ NUMBER 2 ♦ 2010
Calcott, P. & Walls, M. (2000) “Can Downstream Waste Disposal Policies Encourage Upstream ‘Design for Environment’?” The American Economic Review, vol. 90(2), May, p. 233-237 Corson, W. (2002) “Recognizing Hidden Environmental and Social Costs and Reducing Ecological and Societal Damage through Tax, Price, and Subsidy Reform,” The Environmentalist, vol. 22(1), March, p. 67-82 Elkington, J. (1994) “Towards the Sustainable Corporation: Win-Win-Win Business Strategies for Sustainable Development,” California Management Review, vol. 36(2), p. 90-100 Elkington, J. (1998) “Cannibals with Forks,” Stoney Creek, CT: New Society Publishers Energy Information Administration (EIA), Analysis of S.1844, the Clear Skies Act of 2003. Retrieved January 6, 2008, from http://www.eia.doe.gov/oiaf/servicerpt/csa/background.html Fairchild, R. (2008) “The Manufacturing Sector’s Environmental Motives: A Game-theoretic Analysis,” Journal of Business Ethics, vol. 79(3), May, p. 333-344 Fredriksson, P. (2001) “How Pollution Taxes May Increase Pollution and Reduce Net Revenues,” Public Choice, vol. 107(1-2), p. 65-85 GE Citizenship Performance Metrics. Retrieved January 6, 2008, from http://www.ge.com/citizenship/performance_metrics/ehs.jsp Kohn, R. (1992) “When Subsidies for Pollution Abatement Increase Total Emissions,” Southern Economic Journal, vol. 59(1), July, p. 77-87 Kuzmiak, D. (1995) “America’s Economic Future and the Environment: Shaping Tomorrow through an Awareness of Yesterday,” Managerial Auditing Journal, vol. 10(8), p. 3-14 Lockwood, D. (2008) “The REACH Regulation: Challenges Ahead for Manufacturers of Articles,” Environmental Quality Management, vol. 18(1), Autumn, p. 15-22 Meyer, H. (2000) “The Greening of Corporate America,” The Journal of Business Strategy, vol. 21(1), January/February, p. 38-43 Nakada, M. (2004) “Does Environmental Policy Necessarily Discourage Growth?” Journal of Economics, vol. 81(3), March, p. 249-275 Rennie, E. (2008) “Growing Green,” APICS Magazine, vol. 18(2), February, p. 33-35 Subramanian, R., Gupta, S. & Talbot, B. (2007) “Compliance Strategies under Permits for Emissions,” Production and Operations Management, vol. 16(6), November-December, p. 763-779 Wade, J. (2005) “Easy Being Green,” Risk Management, vol. 52(7), July, p. 10-18 World Commission on Environment and Development (1987) “Our Common Future,” Oxford University Press
37

A. Manikas, M. Godfrey Global Journal of Business Research ♦ Vol. 4 ♦ No. 2 ♦ 2010
BIOGRAPHY Dr. Manikas earned his B.S. in Computer Science and M.B.A. in Materials and Logistics Management from Michigan State University , and his Ph.D. from The Georgia Institute of Technology. Prior to that, he was an instructor for supply chain optimization courses for i2 Technologies. Prior to that, he worked as a management consultant for KPMG Peat Marwick, CSC, and Deloitte Consulting. Email: [email protected] Dr. Godfrey earned his B.S. in Operations Management and M.S. in Management Information Systems from Northern Illinois University, and his Ph.D. in Production & Operations Management from the University of Nebraska - Lincoln. He is department chair of the Supply Chain & Operations Management department at UW Oshkosh. He is a CFPIM, CIRM, and CSCP through APICS and a CPSM through ISM. Email: [email protected]
38
GLOBAL JOURNAL OF BUSINESS RESEARCH ♦ VOLUME 4 ♦ NUMBER 2 ♦ 2010
AN EMPIRICAL INVESTIGATION OF INTERNET BANKING IN TAIWAN Hsin Hsin Chang, Cheng Kung University
Mohamad Rizal Bin Abdul Hamid, National Cheng Kung University
ABSTRACT
This paper investigates Internet banking adoption among Taiwanese bank customers. The paper examines the affect of involvement using TAM (technology acceptance model). From the PII (Personal Involvement Inventory) scales, the results indicate that involvement is significantly influenced by the characteristics of the person, stimulus and the situation. Two sets of regression analysis were conducted for the current study. The first analyze the direct influence of two factors, belief of perceived usefulness and perceived ease of use. The second set investigates the affect of involvement on perceived usefulness and perceived ease of use in determining behavioral intention. The study found perceived usefulness is strongly influenced by high involvement. Likewise, the study found that low involvement is strongly related to perceived ease of use. In determining behavioral intention, both high and low involvement significantly influence perceived usefulness and perceived ease of use, respectively. JEL: M30, M31 KEYWORDS: Internet Banking, Technology Acceptance Model, High Involvement, Low Involvement, Taiwan INTRODUCTION
rior to the Internet revolution, traditional brick and mortar banking was been the mainstay for years in the banking industry. Today, the emergence of Internet banking offers a self-service channel. To some extent, the acceleration of Internet banking can be attribute to consume dissatisfaction with
the time and effort required for conventional banking (Karjaluoto, Koivumaki and Salo, 2003). At present banks’ use Internet banking as ways to (1) lowering their operating costs, and (2) for market penetration (Cheng, Lam and Yeung, 2006; Pikkarainen, Pikkarainen, Karjaluoto, and Pahnila, 2004). Moreover, by offering Internet banking, banks’ are capable of using cheaper delivery channels in their banking products, and reducing the operation of having physical branch networks. To realize these benefits, the banking industry is investing billions of dollars in providing and improving the Internet banking system for its customers (Bauer, Hammerschmidt and Falk, 2005). However, because of problems with connectivity and difficulties in cultivating awareness (Mols, Bukh, and Nielsen, 1999; Sathye, 1999), banks are facing difficulties in educating their customers to accept this new medium of banking. Robinson (2000), found that half of the people that have tried Internet banking services do not become an active user. Earlier studies on online adoption show risk concerns have been the main factor hindering consumers from using Internet banking. There is also evidence indicating that lacking elements of social dimension delay consumers shifting from the conventional to internet banking (Mattila, Karjaluoto and Pento, 2003). In 2006, approximately 15.4 million people were using the Internet in Taiwan (Investin Taiwan.nat.gov.tw). Out of this, only 53 percent of users use the Internet for their banking transaction (ithome.com, 2008) with information enquiries on bill payments and account transactions accounting for the largest portion of the usage (86 percent). However, this is still marginal compared to the total numbers of Internet users in Taiwan. The current study posits that involvement may have direct influence on the Internet banking adoption.
P
39
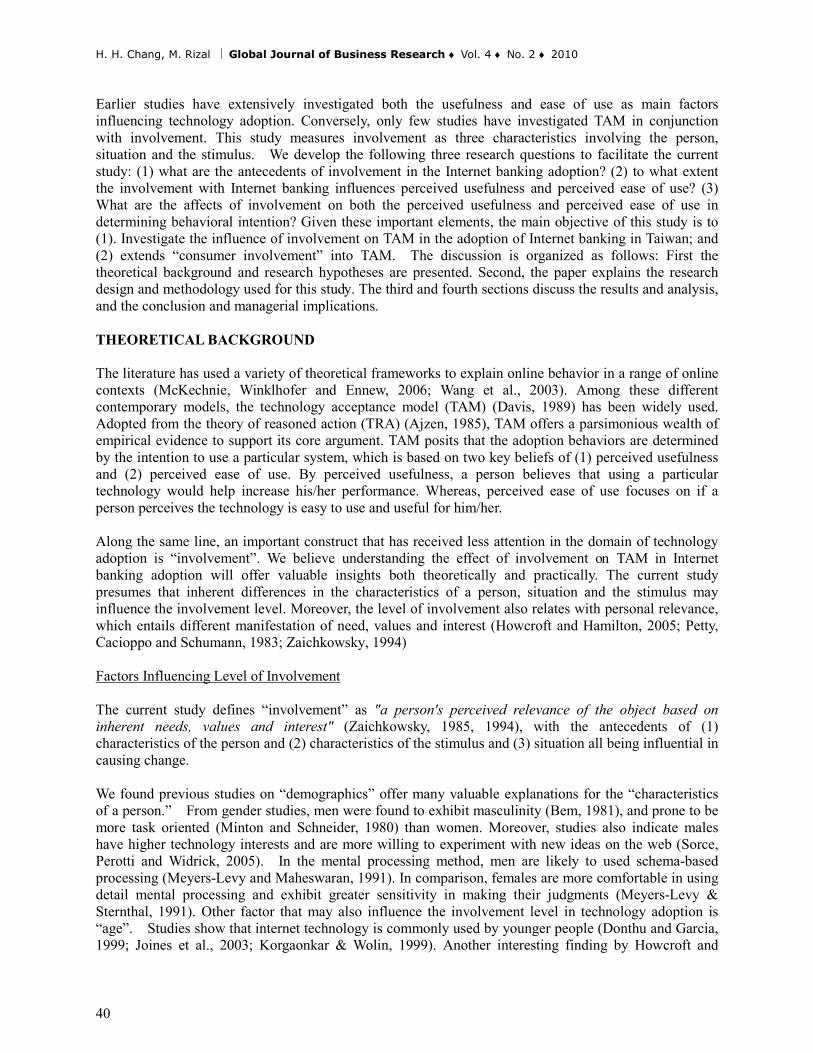
H. H. Chang, M. Rizal Global Journal of Business Research ♦ Vol. 4 ♦ No. 2 ♦ 2010
Earlier studies have extensively investigated both the usefulness and ease of use as main factors influencing technology adoption. Conversely, only few studies have investigated TAM in conjunction with involvement. This study measures involvement as three characteristics involving the person, situation and the stimulus. We develop the following three research questions to facilitate the current study: (1) what are the antecedents of involvement in the Internet banking adoption? (2) to what extent the involvement with Internet banking influences perceived usefulness and perceived ease of use? (3) What are the affects of involvement on both the perceived usefulness and perceived ease of use in determining behavioral intention? Given these important elements, the main objective of this study is to (1). Investigate the influence of involvement on TAM in the adoption of Internet banking in Taiwan; and (2) extends “consumer involvement” into TAM. The discussion is organized as follows: First the theoretical background and research hypotheses are presented. Second, the paper explains the research design and methodology used for this study. The third and fourth sections discuss the results and analysis, and the conclusion and managerial implications. THEORETICAL BACKGROUND The literature has used a variety of theoretical frameworks to explain online behavior in a range of online contexts (McKechnie, Winklhofer and Ennew, 2006; Wang et al., 2003). Among these different contemporary models, the technology acceptance model (TAM) (Davis, 1989) has been widely used. Adopted from the theory of reasoned action (TRA) (Ajzen, 1985), TAM offers a parsimonious wealth of empirical evidence to support its core argument. TAM posits that the adoption behaviors are determined by the intention to use a particular system, which is based on two key beliefs of (1) perceived usefulness and (2) perceived ease of use. By perceived usefulness, a person believes that using a particular technology would help increase his/her performance. Whereas, perceived ease of use focuses on if a person perceives the technology is easy to use and useful for him/her. Along the same line, an important construct that has received less attention in the domain of technology adoption is “involvement”. We believe understanding the effect of involvement on TAM in Internet banking adoption will offer valuable insights both theoretically and practically. The current study presumes that inherent differences in the characteristics of a person, situation and the stimulus may influence the involvement level. Moreover, the level of involvement also relates with personal relevance, which entails different manifestation of need, values and interest (Howcroft and Hamilton, 2005; Petty, Cacioppo and Schumann, 1983; Zaichkowsky, 1994) Factors Influencing Level of Involvement The current study defines “involvement” as "a person's perceived relevance of the object based on inherent needs, values and interest" (Zaichkowsky, 1985, 1994), with the antecedents of (1) characteristics of the person and (2) characteristics of the stimulus and (3) situation all being influential in causing change. We found previous studies on “demographics” offer many valuable explanations for the “characteristics of a person.” From gender studies, men were found to exhibit masculinity (Bem, 1981), and prone to be more task oriented (Minton and Schneider, 1980) than women. Moreover, studies also indicate males have higher technology interests and are more willing to experiment with new ideas on the web (Sorce, Perotti and Widrick, 2005). In the mental processing method, men are likely to used schema-based processing (Meyers-Levy and Maheswaran, 1991). In comparison, females are more comfortable in using detail mental processing and exhibit greater sensitivity in making their judgments (Meyers-Levy & Sternthal, 1991). Other factor that may also influence the involvement level in technology adoption is “age”. Studies show that internet technology is commonly used by younger people (Donthu and Garcia, 1999; Joines et al., 2003; Korgaonkar & Wolin, 1999). Another interesting finding by Howcroft and
40

GLOBAL JOURNAL OF BUSINESS RESEARCH ♦ VOLUME 4 ♦ NUMBER 2 ♦ 2010
Hamilton (2005) is that people who are both earning more income and highly educated are likely to demonstrate confidence when using financial services. The current study theorizes that gender differences, age, IT literacy, mental processing, income and education level may have profound influence on the characteristics of a person (Balabanis & Vassileiou, 1999; Devlin & Yeung, 2003). For the “characteristics of the stimulus”, studies indicate consumer involvement levels with financial services vary on the type of activities involved. This is because the customer will have different perception of risks for different types of financial products and services (Black et al., 2002; Howcroft et al., 2002). Similarly, internet use was also found to be closely associated with security and risks issues (Howcroft et al., 2002). Therefore, we expect both these factors will influence customer adoption of internet banking. The final factor that we assume to influence the level of involvement is the “situation”. Joines et al., (2003) found that internet access points influence the length of usage. For instance, a user accessing internet banking from home may feel more convenience and secure in comparison to places like work or a public access point. Places that offer convenience are likely to influence the length of usage; thus, influencing the involvement level with Internet banking. In line with these discussions, we develop the following hypotheses: H1: Characteristics of a person, stimulus and situation will significantly influence the consumer level of involvement. Technology Acceptance Model Research relative to the theories of involvement has viewed people behavior as a two-fold dichotomy of low and high involvement (Petty et al., 1983; Zaichkowsky, 1985, 1994). From the elaboration likelihood model (ELM), a person who is high in involvement will make an inference using the central route of persuasion. In contrast, the peripheral route will be more influential for a person who is low in involvement. By central route, a person promotes high elaboration, and involve giving careful scrutiny to determine the salient merits on the context that is under consideration. For the peripheral route, on the other hand, a person is assumed to make a simple inference based on various simple cues. In the same manner, the current study expects a person who is “high involvement” will value the overall “usefulness” of internet banking (e.g. increase efficiency or better performance). Likewise, a person who is “low involvement” will value the “ease of use” associated with internet banking (e.g. easy to use or less mental effort). Along the same lines, we posit perceived usefulness positively influences behavioral intentions strongly by high involvement. Whereas, the perceived usefulness positively influences behavioral intention for low involvement. Following this discussion, the study hypotheses are proposed: H2: High involvement will strongly relate with perceived usefulness. H3: Low involvement will strongly relate with perceived ease of use. H4: Perceived usefulness positively influences the behavioral intention strongly by the high involvement. H5: Perceived ease of use will positively influence behavioral intention strongly by the low involvement. MODEL FRAMEWORK Figure 1 shows the study model framework. To fit the current study, we modify the original elements in the TAM model to accommodate the present study. The characteristics of a person, characteristics of a stimulus and situation were used to measure the level of customer involvement in internet banking. The high involvement group is assumed to have strong relationship with perceived usefulness. Similarly, the low involvement group has a strong relationship with perceived ease of use. The current study excluded the "attitudes" construct to simplify the model (Venkatesh and Morris, 2000; Venkatesh and Davis, 2000; Wang et al., 2003). Finally, using the consumer’s level of involvement, we test the relationship between perceived usefulness and perceived ease of use in determining behavioral intention.
41

H. H. Chang, M. Rizal Global Journal of Business Research ♦ Vol. 4 ♦ No. 2 ♦ 2010
Figure 1: Model Framework The figure shows the three antecedents influencing the level of involvement. High involvement influences perceived usefulness and low involvement influences perceived ease of use. RESEARCH DESIGN AND METHOD Survey Measures Employing items from the TAM and PII, provides the content reliability and validity for the current study (Peter and Churchill, 1986). All items are originally developed in the English language, and we later translated these items into the Chinese language using three local translators. We performed another back-translation on the items to ensure translation accuracy. A pre-test was conducted on ten English teachers in Taiwan. Based on the feedback, we made minor modifications to the questionnaire to improve its overall readability. A satisfactory result was achieved with factor loadings ranging from 0.6 to 0.9 and Cronbach alpha exceeding 0.80 for the PII 20 items scale and the three construct of TAM (perceived usefulness, perceived ease of use and behavioral intention). The consumer state of involvement was measured using a 20 items scale developed by Zaichowsky’s (1985). The scale is a seven-point semantic differential scale that measures three constructs: (1) interests, (2) needs and (3) values (Aldlaigan and Buttle, 2001). For the PII questions, we asked the respondent to rate their level of involvement with internet banking. A breakdown of scores from low (20) to high (140) is used to indicate the level of consumer involvement. To fit the current study, cluster analysis was performed to categories between low and high involvement. A cut-off point with scores of 89.55 is used as a mean for the categorization. A score between the ranges of 20 to 89.54 was categorized as low involvement. Score between the ranges of 89.56 to 140 were categorized as high involvement (Zaichkowsky, 1985). Table 1 shows the distribution of the scores. Items for perceived usefulness, perceived ease of use and behavioral intention were adapted from previous studies. These items were later modified to fit with the study. All the items were measured by likert scales, with anchors ranging from 1 “strongly disagree” to 7 “strongly agree”. Sample In total, 220 questionnaires were distributed using Taiwanese respondents as sample for the study. Seventeen were found to be faulty, leaving 203 usable respondents with an effective response rate of 92.3 percent. Of the 203 respondents, 56 percent were female and the majority of the respondents were between the ages of 30 to 43 (74 percent). Four percent had completed high school and 68 percent and 28 percent had finished the bachelor and postgraduate level respectively. Seventy-five percent of the respondents were from the high-income group (USD 1, 500 and higher). A majority of the respondents indicated having no difficulty with internet technology, with 40 percent having more than 5 years of
Perceived Usefulness
Intention to Use
1. Characteristics of a person
2. Characteristics of stimulus
3. Situation
High Involvement
Low Involvement
Personal Involvement Inventory (PPI)
Perceived Ease of Use
42

GLOBAL JOURNAL OF BUSINESS RESEARCH ♦ VOLUME 4 ♦ NUMBER 2 ♦ 2010
experience. As access point, a majority of our study sample indicated accessing the Internet from either their home (49 percent). Table 1: Low and High Involvement
Involvement score Number (N=203) Percentage Involvement degree 20 – 89.54* 76 37.4 Low 89.56 -140** 121 62.6 High
The total scores were calculated using 20 items (seven-point semantic differential scale) *low involvement, **high involvement DATA ANALYSIS AND RESULTS The study first sought to determine the influence of a person’s characteristics, stimulus, and situation on consumer internet banking involvement. The study used internet banking as the stimulus, and both the characteristics of a person and situation measured using the demographic variables and the access point respectively. From the chi-square analysis, consumer level of involvement with internet banking was significantly related to (1) gender, (2) age group, (3) education (4) income (5) computer literacy and (6) access point. Thus, H1 was supported (Table 2). The results show the low involvement members were females, between the ages of 44 and 62, lower levels of education, lower income levels and a beginner with internet technology. In comparison, the members for the high involvement are males, between the ages of 30 to 43 years old, well educated, high income levels and familiar with the Internet technology.
Table 2: Chi-square Analysis
Degree of involvement with Internet banking Demographic item Chi-Square
(p) Low High
Gender 4.577* Female Male Age group 20.958* 44–62 years old
14 – 29 years old 30 – 43 years old
Education 5.519*** Senior high school
University/Bachelor Postgraduate
Income 33.709* Low
Medium High
Computer literacy 16.765* Beginner
Advance Intermediate
Access Point 23.575** Work
Home Both
The table shows the group of consumers under the low and high involvement. *p < 0.05, **p<0.01, ***p<0.001 To purify the measurement scales and to identify their dimensionality for the TAM constructs, the study used the principal components factor analysis with varimax rotation. Item-to-total correlation and internal consistency analysis (Cronbach alpha) were employed to confirm the reliability of each factor. Factor loadings of .60 were used for every item to identify correlation. The Cronbach alpha (Hair, et al. 2006; Nunnally, 1978) and item-to-correlation of 0.70 and 0.50 respectively were used as a general guidelines throughout the computation. As result in Table 3, all variables within a factor tend to have a high coefficient of item-to-total correlation and the high coefficient of Cronbach alpha on each factor further confirms the reliability of the measurement items. Two sets of regression analysis were performed for the study. On the first set of the regression analysis, the study found significant differences on all the constructs of TAM for perceived usefulness and perceived ease of use with consumer levels of involvement (low and high). As the results show, there is a significant relationship between high involvement and the perceived usefulness. (β = .563, p 0.01) supporting H2. In addition, the low involvement consumers are also significantly related with perceived ease of use (β = .458, p 0.01); thus, supporting H3 (see, Table 4).
43

H. H. Chang, M. Rizal Global Journal of Business Research ♦ Vol. 4 ♦ No. 2 ♦ 2010
Table 3: Factor Analysis and Cronbach Alpha
Research constructs Research items Factor loading
Item to total correlation
Cronbach’s α
.968
Perceived usefulness
I find the system to be useful in my job. .971 .947 Using the system enhances my effectiveness in my job .970 .946 Using the system improves my performance in my job .960 .927 Using the system in my job increases my productivity. .921 .864
.853
Perceived ease of use
I find it easy to get the system to do what I want it to do. .884 .770 I find the system to be easy to use. .867 .732 My intention with the system is clear and understandable. .838 .703 Interacting with the system does not require a lot of my mental effort. .750 .587
.987
Intention to use Given that I have access to the system, I predict that I would use it. .993 .974 Assuming I have access to the system, I intend to use it. .993 .974
The table shows exploratory factor analysis on TAM three construct of (i) perceived usefulness, (ii) perceived ease of used and (iii) intention to use Indices used for the EFA were (i) factor loading of more .60, (ii) item-to-total correlation of .70 and (iii) Cronbach alpha of .50.
Table 4: Consumer Involvement on Perceived Usefulness and Perceive Ease of Use
Dependent factors Perceived Usefulness
Perceived Ease of use
M1 M2 M3 M4 Independent factors Consumers involvement (Low level of involvement) .505* .458* Consumers involvement (High level of involvement) .563* .417* R2 .544 .785 .696 .411 F 25.324 58.096 19.671 26.301 P .000 .000 .000 .000 D-W Stats 2.236 1.693 2.198 1.973
The table shows the result of analysis on TAM key belief with the low and high involvement. M1 indicates the correlation between low involvement with PU, M2 (correlation between high involvement with PU), M3 (correlation between low involvement with PEOU), M4 (correlation between high involvement with PEOU). * p < 0.01, ** p < 0.05; ***p<0.1 The study developed a second set of regression analysis to conduct a test on the TAM measurement model (Table 5). The result supported both H4 (β = .861, p 0.01) and H5 (β = .542, p 0.01) as both low and high consumer involvement influence the two key beliefs of perceived usefulness and perceived ease of use in determining behavioral intention. DISCUSSION From a theoretical standpoint, the current study offers a new perspective for explaining the factors affecting TAM models. This study addresses the questions of (1) what are the antecedents of involvement in Internet banking adoption? (2) To what extend the involvement with Internet banking influence perceived usefulness and perceived ease of use? (3) What are the affects of involvement on the both the perceived usefulness and perceived ease of use in determining behavioral intention? The current study found members with high internet banking involvement to be males between 30 and 43 years old, highly educated, high income and already familiar with the Internet technology. This study further tested the influence of involvement on TAM’s two key beliefs of (1) perceived usefulness and (2) perceived usefulness. The study found high involvement consumers emphasize the overall “usefulness” of Internet banking (e.g. increase efficiency or better performance). In comparison,
44

GLOBAL JOURNAL OF BUSINESS RESEARCH ♦ VOLUME 4 ♦ NUMBER 2 ♦ 2010
low involvement consumers value the “ease of use” associated with internet banking (e.g. easy to use or less mental effort). Similarly, the study found both the perceived usefulness and perceived ease of use positively influence the behavioral intention s by high (for PU) and low (for PEOU) involvements, respectively. Table 5: Determining Behavioral Intention
Dependent factors--Intention to use M1 M2 M3 M4 Independent factors Perceived usefulness (Low level of involvement) .604* Perceived usefulness (High level of involvement) .861* Perceived ease of use (Low level of involvement) .542* Perceived ease of use (High level of involvement) .357* R2 .488 .741 .633 .417 F 42.482 356.986 11.517 38.621
P .000 .000 .000 .000
D-W Stats 2.122 2.106 1.989 1.996 M1 denotes the relationship between PU (low involvement group) with behavioral intention, M2-- relationship between PU (high involvement group) with behavioral intention, M3-- relationship between PEOU (low involvement group) with behavioral intention, M4-- relationship between PEOU (high involvement group) with behavioral intention. * p < 0.01, ** p < 0.05; ***p<0.1 Managerial implications and future research The current study offers new insights on the influence of consumer involvement in Internet banking adoption. From the results of the demographic characteristics, the results suggest a differentiation strategy targeting specific groups may positively attract potential bank customers. Instead of treating the consumers homogenously, the bank should try to specifically cater their promotions based on consumer involvement levels. Noteworthy, is that the majority of low involved consumers are also baby boomers, which also happen to be the most affluent in comparison to the others group of consumers. Furthermore, banks may also want to re-evaluate its approach to the female market segment, since females were found to be less involved with internet banking. For example, offering information on “how to use the system” using step-by-step procedures would be practical. For managers, the high involvement group also offers the potential to be a focus group for the bank’s new products and services. One potential limitation of this study is the exclusion of other factors in measuring consumer involvement. Future study should include other factors in predicting consumer levels of involvement. In particular, how different internet banking products or services affect the level of involvement? For instance, on some specific products or services such as opening an account online, applying for loan online or investing in stocks online. Furthermore, this study was conducted in Taiwan. More study is needed in generalizing and validating the findings of this study.
REFERENCES Ajzen, I. (1985), From intentions to actions: a theory of planned behavior. In: J. Kuhl & J. Beckmann (Eds.), Action control: From cognition to behavior (pp. 11-39). New York, NY: Springer-Verlag. Aldlaigan, A. H. and Buttle, F. A. (2001), Consumer involvement in financial services: an empirical test of two measures. International Journal of Bank Marketing, 19(6), 232-245. Balabanis, G. and Vassileiou, S. (1999), Some attitudinal predictors of home-shopping through the
45

H. H. Chang, M. Rizal Global Journal of Business Research ♦ Vol. 4 ♦ No. 2 ♦ 2010
Internet. Journal of Marketing Management, 15, 361-385. Bauer, H. H., Hammerschmidt, M. and Falk, T. (2005), Measuring the quality of e-banking. International Journal of Bank Marketing, 23(2), 153-175. Bem, D. J. and Allen, A. (1981), The BSRI and gender schema theory: a reply to Spence and Helmreich. Psychological Review, 81, 369-371. Black, N. J., Lockett, A., Winklholfer, H., and McKechnie, S. (2002), Modelling consumer choice of distribution channels: An illustration from financial services. The International Journal of Bank Marketing, 20(4), 161-173. Cheng, T. C. E., Lam, D. Y. C. and Yeung, C. L. (2006), Adoption of internet banking: an empirical study in Hong Kong. Decision Support System, 42, 1558-1572. Davis, F. D. (1989), Perceived usefulness, perceived ease of use, and user acceptance of information technology. MIS Quarterly, 13(3), 319-340. Devlin, J. F. and Yeung, M. (2003), Insights into customer motivations for switching to Internet banking. The International Review of Retail, Distribution & Consumer Research, 13(4), 375-392. Donthu, N. and Garcia, A. (1999), The Internet shopper. Journal of Advertising Research, 39(3), 52-58. Hair, J., Black, W. C., Babin, B. J., Anderson, R. E., and Tatham, R. L. (2006), Multivariate data analysis (6th ed.). New Jersey: Pearson Prentice Hall. Howcroft, B. and Hamilton, R. (2005), Customer involvement and interaction in retail banking: an examination of risk and confidence in the purchase of financial products. Journal of Services Marketing, 21(7), 481-491. Joines, J. L., Scherer, C. W. and Scheufele, D. A. (2003), Exploring motivations for consumer web use and their implications for e-commerce. Journal of Consumer Marketing, 20(2), 2003. Karjaluoto, H., Koivumaki, T. and Salo, J. (2003), Individual differences in private banking: empirical evidence from Finland. Paper presented at the 36th Hawaii International Conference on System Sciences (HICSS), Big Island, Hawaii. Korgaonkar, P. K. and Wolin, L. D. (1999), A multivariate analysis of web usage. Journal of Advertising Research, 39(2), 56-68. Mattila, M., Karjaluoto, H. and Pento, T. (2003), Internet banking adoption among mature customers: early majority of laggards. Journal of Services Marketing, 17(5), 514-526. McKechnie, S., Winklhofer, H. and Ennew, C. (2006), Applying the technology acceptance model to the online retailing of financial services. International Journal of Retail & Distribution Management, 34(4/5), 338-410. Meyers-Levy, J. and Maheswaran, D. (1991), Exploring differences in males' and females' processing strategies. Journal of Consumer Research, 18, 63-70. Meyers-Levy, J. and Sternthal, B. (1991), Gender differences in the use of message cues and judgements. Journal of Marketing Research, 28(February), 84-96.
46

GLOBAL JOURNAL OF BUSINESS RESEARCH ♦ VOLUME 4 ♦ NUMBER 2 ♦ 2010
Minton, H. L. and Schneider, F. W. (1980), Differential psychology. Prospect Heights, IL: Waveland Press. Mols, N. P., Bukh, P. N. D. and Nielsen, J. F. (1999), Distribution channel strategies in Danish retail banking. International Journal of Retail & Distribution Management, 27(1), 37-47. Nunnally, J. (1978), Psychometric theory, McGraw-Hill. New York, NY. Petty, R. E., Cacioppo, J. and Schumann, D. (1983), Central and peripheral routes to advertising effectiveness: the moderating role of involvement. Journal of Consumer Research, 10, 135-146. Pikkarainen, T., Pikkarainen, K., Karjaluoto, H. and Pahnila, S. (2004), Consumer acceptance of online banking: An extension of the technology acceptance model. Internet Research, 14(3), 224-235. Robinson, T. (2000). Internet Banking: Still not a perfect marriage. Retrieved 25 February 2009 from Informationweek.com. Sathye, M. (1999), Adoption of Internet banking by Australian consumers: an empirical investigation. International Journal of Bank Marketing, 17(7), 324-334. Sengupta, J., Goodstein, R. C. and Boninger, D. S. (1997), All cues are not created equal: obtaining attitude persistence under low-involvement conditions. Journal of Consumer Research, 23(March), 1997. Sorce, P., Perotti, V. and Widrick, S. (2005), Attitude and age differences in online buying. International Journal of Retail & Distribution Management, 33(2), 122-132. Venkatesh, V. and Morris, M. G. (2000), Why don't men ever stop to ask for directions? gender, social influence, and their role in technology acceptance and usage behavior. MIS Quarterly, 24(1), 115-139. Venkatesh, V. and Davis, F. D. (2000), A theoretical extension of the technology acceptance model: four longitudinal field studies. Management Science, 46(2), 186-204. Wang, Y.S., Wang, Y.M., Lin, H.H. and Tang, T.I. (2003), Determinants of user acceptance of Internet banking: An empirical study. International Journal of Services Industry Management, 14(5), 501-519. Zaichkowsky, J. L. (1985), Measuring the involvement construct. Journal of Consumer Research, 12, 314-352. Zaichkowsky, J. L. (1994), The personal involvement inventory: reduction, revision, and application to advertising. Journal of Advertising, 23(4), 59-70. BIOGRAPHY Chang Hsin Hsin is a professor of marketing at the Department of Business Administration, National Cheng Kung University. She can be contacted at the College of Management, Department of Business Administration, National Cheng Kung University, No.1, University Road, Tainan, Taiwan 70101. Mohamad Rizal is currently pursuing his PhD degree at the Institute of International Management, National Cheng Kung University. He can be contacted at the Institute of International Management, College of Management, National Cheng Kung University, 1 University Road, Tainan, Taiwan, 70101. Email: [email protected]
47


GLOBAL JOURNAL OF BUSINESS RESEARCH ♦ VOLUME 4 ♦ NUMBER 2 ♦ 2010
THE MODERATING ROLE OF RELATIONSHIP QUALITY IN DETERMINING TOTAL VALUE
ORIENTATION Framarz Byramjee, Indiana University of Pennsylvania
Parimal Bhagat, Indiana University of Pennsylvania Andreas Klein, University of Duisburg-Essen
ABSTRACT
Among the several approaches to understanding value in business transactions, the one most frequently encountered in marketing, management, and economics literature is the tradeoff of benefits and costs, the difference or ratio of which is operationalized as value. In a complex business relationship involving goods and services as well as multiple business partners, assessing the total value of the system involves more complex transactional and relational dynamics than simpler one-time business transactions. Thus, the purpose of this paper is to offer a model of total value of a business system including antecedent factors and outcomes, and thereupon to study the role of relationship quality in moderating the value of the individuals in the business relationship. This paper uses the transaction cost approach to study the value in a business relationship to both the service-provider and client firm, considering the costs and benefits to each business partner. Next, it discusses the impact of the quality of the business relationship on the value perceived by each business partner. Finally, several outcomes of a total value orientation such as financial performance, competitiveness and, especially, end-customer value is considered. JEL: M10; M20; M30 KEYWORDS: Value, Relationship Quality, Transactions, Costs, Benefits, Business Partnerships INTRODUCTION
he concept of value in a business transaction has been studied by academic scholars in several diverse fields such as management, marketing, economics and accounting. A classic operational definition of value to the customer engaged in any characteristic transaction with a seller of
goods/services would typically be the perceived benefits that the customer receives from the offering in relation to the costs incurred for availing of the same. Thus, clearly as the benefits outweigh the costs, the perceived value tends to increase for the customer. In the present business-to-business outsourcing context too, this notion of value tends to exist for each entity in the transaction environment in terms of the benefits perceived by that entity from the respective outsourcing arrangement in contrast with the costs incurred by that entity during the same. This paper considers the transaction environment wherein a client firm outsources its work to an external service-providing organization, thereby constituting a basic dyadic relationship between client and service-provider; however, the essence of the entire discussion could be applied to all trading partners within the network. The outsourcing context here is viewed as a special case of business partnership relationships. The outsourcing initiative, treated from a transactional and relational perspective, contends to create value for each of these trading partners as well as a shared synergistic notion of value in the relationship between these entities. Outsourcing seems to have transitioned from a mere economic convenience business decision to a more strategically driven initiative based on shared governance and decision-making aimed at harnessing the synergies of the organization providing the service, the client firm receiving the service, and the entire value creation process occurring during this exchange. To this accord, the outsourcing process blends the perceived value of the service providing organization to whom
T
49

F. Byramjee et al Global Journal of Business Research ♦ Vol. 4 ♦ No. 2 ♦ 2010
the work has been outsourced, the value of the client firm that outsources its work, and the value generated during the course of the relationship between the client firm and the service-provider. These three perspectives of shared value, respectively Outsourcing Service-Provider Value, Client Firm Value, and Relationship Value, manifest into a common synergy for the business system which this research labels as the ‘Total Value Orientation’ for Strategic Outsourcing decisions. The paper as follows first entails the literature review discussing the manner in which various transaction costs arise in the outsourcing context here viewed as a special case of business partnership relationships, and the role of service quality to help mitigate these transaction-cost inducing elements in an effort to create value for the network. Then, the paper proceeds toward development of the cost-benefit framework for strategic total value orientation, wherein the costs and benefits are discussed for the client firm as well as the service-providing organization. Following that, the moderating role of relationship quality is articulated to impress its critical impact on maximizing the realization of value for both the client firm and service-provider, and thus its influence on the total value orientation of the business system. LITERATURE REVIEW The context of outsourcing with regard to transaction costs and service quality occupies the focal basis of this research study. In today’s converging global business environment, outsourcing needs to be treated as a critical strategic business decision. “Outsourcing adds greater value of ownership, reduction of cost, assistance to your client's operation and increases customer satisfaction”, said Sharad Bohra, director of the corporate supply chain for Tyco International. Rodriguez-Diaz and Espino-Rodriguez (2006) define outsourcing as a means of recognizing that there are suppliers in the market that are able to perform part of the transformation activity better than the firm itself. Leavy (2001) points out that in today's dynamic economy, driven by intensifying global competition, more knowledge intensive value chains, and more sophisticated intermediate markets, the make-or-buy decision is footing strategic impetus for industrial marketing and procurement, with the opportunities for outsourcing offering interesting routes to innovation, growth and competitiveness. Kennedy (1993) conducted some experiments in outsourcing and found that several companies across the country are finding it cheaper and more efficient to outsource their legal work. They say the law firms can provide faster, better solutions to legal problems, and the exchange benefits as the firm providing the service would become more proactive in identifying and resolving situations before they become problems. The changing economic and labor conditions have motivated firms to outsource professional services activities to skilled personnel in less expensive labor markets (Gupta, Seshasai, Mukherji and Ganguly, 2007). According to Tas and Sunder (2004), the financial services industry is following a trend towards vertical disintegration similar to that in the manufacturing industry; the strategy of focusing on core competencies being a major driver for the growth of business process outsourcing. Bebea (2005) suggests that with more U.S. corporations taking advantage of cost-effective production in international markets, opportunities for outsourcing in all industries are raising the bar for minority business enterprises. Thus, minority business enterprises venturing into the global market must find ways to rise above the competition from outsourcing and provide services that make them invaluable to their clients. Hutchins (2005) explains that companies outsource for various reasons; for low-tech products, cost control and cost reduction seem attractive; while, for high value products and services, technology access and business flexibility gain precedence. Totty (2007) explains that many information technology outsourcing deals tend to fall short of the promised cost savings due to three major reasons: companies failing to anticipate changes in business dynamics and varying technologies, resulting in surprise charges; companies unable to recognize and adopt varying skill-sets for managing their vendors/outsourcers, thereby resulting in unfathomed monitoring costs; and, misaligned expectations resulting from poorly specified contractual agreements, which lead to unexpected bargaining/maladaptation costs. Ultimately, a
50

GLOBAL JOURNAL OF BUSINESS RESEARCH ♦ VOLUME 4 ♦ NUMBER 2 ♦ 2010
successful outsourcing arrangement depends on finer service quality in terms of the knowledge, flexibility to adjust to market dynamics, competence in working systems, and cost-efficiency that the outsourcer brings (Totty, 2007). Leavy (2001) suggests that outsourcing to leverage the special capabilities of suppliers sometimes carries risks of opportunism which manifest in the form of increased transaction costs for a firm looking to outsource. The risk of opportunism is small where the supplier's capabilities can be recreated in-house, or accessed through acquisition, at a reasonable cost. The threat of vertical integration alone is often enough to keep a supplier in check. However, in many cases, particularly those in rapidly evolving high-tech industries like information technology and biotechnology where the payoff from pooling capabilities is likely to be greatest, the impediments to integration are often too high (Leavy, 2001). Gewald, Wullenweber and Weitzel (2006) assess the risks associated with hidden costs, inexperienced vendors, failing interfaces, lack of cross-functional skills, under-achieved promises/benefits, default of vendor, communication mismatch, lock-in, loss of business flexibility, limited/bounded rationality, wrong measurements, misuse of trust, and security breaches which lead to increased transaction costs for the client organization. In a business process outsourcing context, limited rationality refers to the limited capabilities of the outsourcer that render complete contracts impossible; while opportunistic behavior entails that this incapability could be exploited by the service provider. Gonzalez, Gasco and Llopis (2006) opine that offshore outsourcing involves greater risks derived from the cultural and physical distance existing between customer and provider, the uncertainty regarding use of suitable necessary infrastructure and technical/technological capacities, and opportunism on the part of the service providers who may probably try to optimize their costs and may compromise on the quality requirements of the client. Gewald, Wullenweber and Weitzel (2006) state that the perceived risks, particularly financial risk and performance risk, associated with business process outsourcing strongly influence managers' intention to outsource business processes. Grover, Cheon and Teng (1996) indicate that transaction cost theory provides a good framework for information systems outsourcing and that asset specificity of outsourcing transactions needs to be considered in any decision to outsource. Asset specificity refers to the uniqueness of the product or service being exchanged between two parties. Low asset specificity implies more standardized products and services could reflect lower outsourcing costs due to coordination, and vendors could increase their economies of scale and scope (Grover, Cheon and Teng, 1996). Qu and Brocklehurst (2003) conduct an analysis of the role of transaction costs in supplier selection. They label certain important transaction cost-inducing factors such as language barriers, government support, quality, culture fit, financial robustness, process and methodology, and supplier reputation, and suggest ways and means by which more understanding dyadic relationships between buyers and suppliers may circumvent these costs and cost-inducing factors. Where language barriers are low, communication costs fall and there is less misunderstanding, which leads to lower uncertainty. High-level commitment by the government may reduce the opportunistic behavior of vendors. Government support in the form of incentives reduces production costs and attracts more investment into the sector. Quality is the basic requirement of a product or service, and adherence to preset standardized quality norms reduces monitoring costs. Culture fit can be a transaction costs barrier for others. People prefer to work with those who come from the same culture for a reassuring atmosphere. It is easier to communicate, understand and monitor, and thus reduces contractual costs. There is more chance of building a trusting relationship and this reduces the probability of opportunism. Financial robustness of the service-providing firm is generally desirable. If it is unlikely or costly for suppliers to declare bankruptcy, this will prevent them appropriating the quasi-rent. Customers can avoid the shifting costs of finding new vendors as well. Therefore, transaction costs are reduced. By means of standardizing processes and third party monitoring, the uncertainty and complexity of the transaction environment is reduced. Supplier reputation is also vital; giving consideration to reputation in source selection can reduce opportunism by sellers, thereby reducing
51

F. Byramjee et al Global Journal of Business Research ♦ Vol. 4 ♦ No. 2 ♦ 2010
the uncertainty and thus the transaction costs for buyers. Ultimately, effective long-term networking between a buyer and vendor requires the building of trust. Trust and networking are effective measures for reducing transaction costs. According to Williamson (1975), not everyone behaves opportunistically; only someone sometimes. If the buyer and seller trust each other, the transaction costs of preventing opportunism will be reduced significantly. People tend to trust someone that other trustworthy people trust. Networking is proven to be a reliable vehicle for building such mutual trust; consequently, associations of clients, vendors or both are a good way of reducing transaction costs (Qu and Brocklehurst, 2003). Under competitive conditions, organizations will seek governance structures that economize on transaction costs (Reidel, Lewis and Pawar, 1992). Hierarchy (the firm) tends to prevail when asset specificity and uncertainty are found to be high, while the market mechanism seems to be sought to under reverse conditions (Reidel, Lewis and Pawar, 1992), thus calling for better interaction between client and service provider for getting work done. Thus, it appears that many of the transaction cost-inducing factors could be controlled and their potential adverse impacts on outsourcing arrangements even minimized through increased levels of understanding, cooperation, and commitment to symbiotic relationship wherein both transacting entities need to be involved. Grover, Cheon and Teng (1996) contend that both service quality of the vendor and elements of partnership such as trust, cooperation, and communication are important for outsourcing success. Service quality refers to the degree and direction of discrepancy between service receiver's expectations and perceptions (Parasuraman, Zeithaml, and Berry, 1988). The smaller the discrepancy, the greater the service quality achieved. Because of the imprecise nature of services and the difficulty in assuring consistent quality, service receivers often form ongoing relationships with service providers, in an effort to better specify service requirements and desired quality levels (Grover, Cheon and Teng, 1996). The quality of service provided is critical to the success of information technology outsourcing and can be assumed to be independent of the outsourcing decision (Williamson, 1991). While the degree of outsourcing per se may or may not have a significant relationship with outsourcing success, it is proposed that this relationship will be stronger (moderated) under increased levels of service quality. Buzzell and Gale (1987) highlighted the importance of service quality with regard to the ‘Profit Impact of Marketing Strategy’; service quality was examined in its relationship with value, and a high level of correlation was observed between relative quality and profitability. Chusil and Downs (1979) contend that service quality forms an essential ingredient of the product quality being offered by a firm; thus the business will offer value when such ingredients of quality exceeds that expected for the given price. As per Crosby, Evans and Cowles (1990), the creation and recognition of quality or ‘value’ in a relationship require both parties to define quality from a long-term relationship perspective. These findings bear similar implication in the outsourcing context wherein better service quality of the service providing firm yields to higher profitability and increased value for the organization that outsources its work to this firm. Besides optimizing on transaction costs, the client firm’s outsourcing decision, which tends to be greatly influenced by the service quality of the service-providing organization, contends to create value for each of these trading partners as well as a shared synergistic notion of value in the relationship between these entities. BENEFITS AND COSTS FRAMEWORK IN THE OUTSOURCING CONTEXT This paper attempts to model the value perspectives in terms of the perceived benefits and incurred costs for the client firm and the service-provider when each of these entities is engaged in a typical outsourcing arrangement. The objective is establish a costs and benefits framework for this transacting dyad. The
52
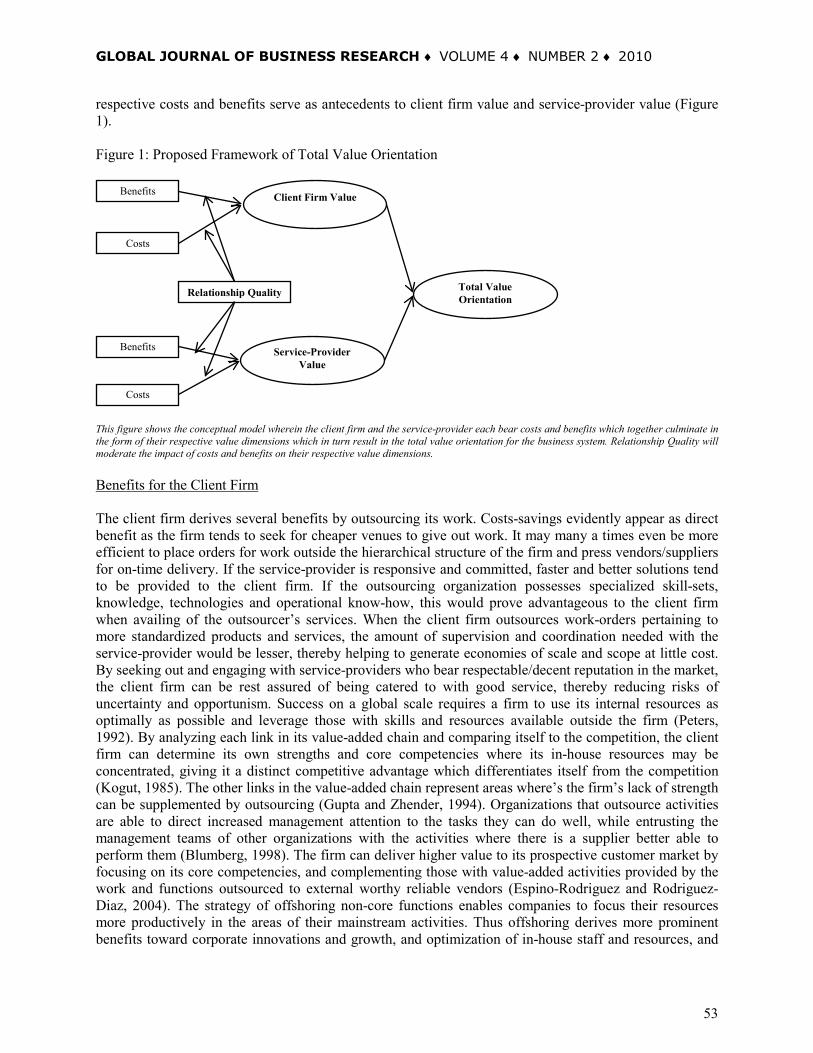
GLOBAL JOURNAL OF BUSINESS RESEARCH ♦ VOLUME 4 ♦ NUMBER 2 ♦ 2010
respective costs and benefits serve as antecedents to client firm value and service-provider value (Figure 1). Figure 1: Proposed Framework of Total Value Orientation
This figure shows the conceptual model wherein the client firm and the service-provider each bear costs and benefits which together culminate in the form of their respective value dimensions which in turn result in the total value orientation for the business system. Relationship Quality will moderate the impact of costs and benefits on their respective value dimensions. Benefits for the Client Firm The client firm derives several benefits by outsourcing its work. Costs-savings evidently appear as direct benefit as the firm tends to seek for cheaper venues to give out work. It may many a times even be more efficient to place orders for work outside the hierarchical structure of the firm and press vendors/suppliers for on-time delivery. If the service-provider is responsive and committed, faster and better solutions tend to be provided to the client firm. If the outsourcing organization possesses specialized skill-sets, knowledge, technologies and operational know-how, this would prove advantageous to the client firm when availing of the outsourcer’s services. When the client firm outsources work-orders pertaining to more standardized products and services, the amount of supervision and coordination needed with the service-provider would be lesser, thereby helping to generate economies of scale and scope at little cost. By seeking out and engaging with service-providers who bear respectable/decent reputation in the market, the client firm can be rest assured of being catered to with good service, thereby reducing risks of uncertainty and opportunism. Success on a global scale requires a firm to use its internal resources as optimally as possible and leverage those with skills and resources available outside the firm (Peters, 1992). By analyzing each link in its value-added chain and comparing itself to the competition, the client firm can determine its own strengths and core competencies where its in-house resources may be concentrated, giving it a distinct competitive advantage which differentiates itself from the competition (Kogut, 1985). The other links in the value-added chain represent areas where’s the firm’s lack of strength can be supplemented by outsourcing (Gupta and Zhender, 1994). Organizations that outsource activities are able to direct increased management attention to the tasks they can do well, while entrusting the management teams of other organizations with the activities where there is a supplier better able to perform them (Blumberg, 1998). The firm can deliver higher value to its prospective customer market by focusing on its core competencies, and complementing those with value-added activities provided by the work and functions outsourced to external worthy reliable vendors (Espino-Rodriguez and Rodriguez-Diaz, 2004). The strategy of offshoring non-core functions enables companies to focus their resources more productively in the areas of their mainstream activities. Thus offshoring derives more prominent benefits toward corporate innovations and growth, and optimization of in-house staff and resources, and
Relationship Quality
Costs
Client Firm Value
Service-Provider Value
Total Value Orientation
Benefits
Costs
Benefits
53
F. Byramjee et al Global Journal of Business Research ♦ Vol. 4 ♦ No. 2 ♦ 2010
domestic job creation. The enormous gains in efficiency, productivity, quality, and revenues by leveraging offshore talent are far more substantial than the labor cost savings (Asher and Nandy, 2007). Business flexibility is a big advantage that the client firm enjoys by being able to place greater or lesser number of orders with the vendor in accordance with varying market demand (Hutchins, 2005). In the quest for providing customer value while yet minimizing costs, firms employ process benchmarking and process improvement projects wherein strategic planning decisions can then be made about how to generate greater customer value by eliminating excess capacity, outsourcing and modifying existing processes (Ralston, Wright and Kumar, 2001). Firms strive to identify and adapt best practices of their industry with regard to quality, cost, and productivity performance measures for their core processes, and scout the market to outsource peripheral work to suit their needs (Ralston, Wright and Kumar, 2001). Such strategic outsourcing decisions ultimately lead to increased productivity for the client firm and thereupon better profitability.
Proposition 1a.- Higher the perceived benefits, higher the perception of value to the client firm. Costs for the Client Firm In spite of the many putative benefits of outsourcing, the client firm also tends to be faced with costs beyond just monetary expenses, and these costs weigh importantly in the firm’s outsourcing decision. When outsourcing work to an external organization, the client firm may have to make certain adjustments and comprises toward product reengineering and design in order to match the modesoperandi of the outsourcer. The client firm may also have to many a time assist the service-provider with intelligence, technology and technical specification, personnel, and infrastructure needed for getting the work done; all these costs may have to be borne in part or full by the client. Companies sometime fail to recognize and adopt skill-sets which differ from their current in-house practice in order to manage suppliers; these result in added costs (Totty, 2007). First and foremost, the client would have to incur search costs and information acquisition costs when scouting several vendors in the market, be it domestic or international, and judge the efficacy of the most productive and beneficial service-providing entity to get into business with. The client firm would have to then strike feasible negotiations and well-specified contractual agreements, all of which result in bargaining and contracting costs. The outsourcing arrangement can lead to potential loss of supervision and control over work processes for the client firm; as a result the client may have to incur monitoring costs to keep periodic checks for ensuring quality control and systematic workflows of the service-provider. The client firm may also have to deal with maladaptation costs when misaligned expectations between client and vendor lead to hidden costs to be borne by the entities (Totty, 2007). When an outsourcer provides specialized service to a client, it is possible that the client may feel threatened as the outsourcer may possess the ability to replicate those services and oust the client in the open market; such opportunistic behavior of the service-provider could put the client firm at risk of losing its core capabilities, and pose costs for the client. An outsourcer could also create information asymmetries for the client by not divulging details of its processes and work systems involved in the service that it caters to the client, thereby creating a dependency and lock-in effect for the client who feels compelled to remain in the arrangement on account of the opportunistic behavior of the outsourcer. Qu and Brocklehurst (2003) label certain important transaction cost-inducing factors such as language barriers, government support, quality, culture fit, financial robustness, process and methodology, and supplier reputation, which firms could face during the process of supplier selection. Gewald, Wullenweber and Weitzel (2006) assess the risks associated with hidden costs, inexperienced vendors, failing interfaces, lack of cross-functional skills, under-achieved promises/benefits, default of vendor, communication mismatch, lock-in, loss of business flexibility, limited/bounded rationality, wrong measurements, misuse of trust, and security breaches which lead to increased transaction costs for the client organization.
54

GLOBAL JOURNAL OF BUSINESS RESEARCH ♦ VOLUME 4 ♦ NUMBER 2 ♦ 2010
Proposition 1b.- Lower the perceived costs, higher the perception of value to the client firm. Benefits for the Service-Provider The service-providing organization, i.e. the outsourcer also derives several benefits. By equipping itself to provide certain specialized services, an outsourcer can create and capitalize on its intellectual capital in terms of the knowledge it accumulates and uses to add value to its products or services, which in turn feeds in to deliver better value to the client firm (Gupta and Zhender, 1994). The outsourcer can leverage its economies of scale and scope when many alternative users want/order similar services, thereby paving the way for asset ownership for the outsourcer who gets motivated to take better responsibility for those processes (Baker, Gibbons and Murphy 2002). The outsourcing organization may many a times be encouraged to assume operational quality responsibilities as well (Hutchins, 2005), and enhance productivity and effectiveness of service by engaging in higher value-adding activities over time. The outsourcer can thereby benefit through exposures to new workflows, systems and technology transfers. It can derive higher revenues by adopting optimal utilization of its workforce and resources and providing formidable competition to other vendors in the market. Through interaction with clientele and work processes, it gets an opportunity to proliferate its portfolio of services, and also widen its access to newer markets and products. In vertical markets, suppliers typically attempt to create higher value-addition by moving from simple assembly and testing operations to component manufacturing, design, and marketing (Sako, 2006). In markets for business services, suppliers also operate on the notion of climbing the value-added ladder, by transitioning from simple to more complex transactions; thus, enhancing their productivity and effectiveness of service (Sako, 2006).
Proposition 2a.- Higher the perceived benefits, higher the perception of value to the service-providing organization.
Costs for the Service-Provider The outsourcing service-providing organization also tends to be faced with costs beyond just the monetary expense incurred while providing service. The outsourcer is many a time forced to function as per the dictates of the client firm, especially when such clients bear strong reputation and power in the business channel. The outsourcer may have to live with such conditions of lower operational control and reduced flexibility of working processes in its struggle to hold on to clients’ orders amidst tough competition. It may experience dependency on the client firm whose orders drive its business and have to adhere to the client’s requirements and expectations. When catering to special services of a client firm, the service-provider may sometime have to establish transaction-specific locked-in assets necessary to comply with the modesoperandi demanded by the client; this leads to transaction costs arising from such asset specificity conditions for the outsourcer. Costs arising from frequency or infrequency of orders and transactions also induce uncertainty of steady work-load for the service-provider.
Proposition 2b.- Lower the perceived costs, higher the perception of value to the service-providing organization.
RELATIONSHIP QUALITY AND ITS MODERATING ROLE Having established the costs and benefits framework for the client firm and the service-providing organization in the outsourcing relationship, this paper further builds on the conjecture that the relationship quality between these two entities plays a major moderating role in the ultimate realization of costs and benefits for each entity. The outsourcing argument has transited from pure ‘cost savings from labor arbitrage’ to that of ‘value creation through leveraging of resources and scale economies’ – a more sustainable proposition, that creates economic value for both clients and vendors, provided they are
55

F. Byramjee et al Global Journal of Business Research ♦ Vol. 4 ♦ No. 2 ♦ 2010
prepared to get into a strategic, long-term relationship (Cachon and Harker, 2002). To reap the full benefits from outsourcing, clients need to treat offshore vendors as strategic entities, rather than as mere low cost service providers, engaged in long-term partnerships instead of merely arms-length contractual channel members (Gupta, Seshasai, Mukherji and Ganguly, 2007; Choudhury and Sabherwal, 2003; Kishore, Rao, Nam, Rajagopalan and Chaudhury, 2003). Better service quality resulting from symbiotic relationships between clients and service providers can serve to reduce the transaction costs arising from information asymmetries, opportunism, bounded rationality, uncertainty, and the kind as entailed by Williamson (1981); thus paving the way for client and service provider alliance as the efficient governance structure wherein institutional form and internal organization are blended with synergies of the market to drive the corporate strategy (Reve, 1990). The client firm and the service delivering organization both need to be cognizant and involved in the shared definitions of ‘value’ from a long-term relationship perspective (Crosby, Evans and Cowles, 1990). The ‘value constellation’ derives mutual value to be developed as a consequence of the reciprocal interactive relationship between these organizations who work together to increase their benefits and decrease their costs so as to co-produce value (Normann and Ramirez, 1994). The outcome of this inter-firm interaction and rethinking of the operating structure of firms is that an outsourcing strategy leads to new visions of ‘total relationship marketing’ and collaborative value generation (Gummesson, 1999), where the general competitiveness is increased, long-term cooperation is strengthened, and a culture and operating routines aimed at generating relational capabilities is generated (Espino-Rodríguez and Rodríguez-Díaz, 2004). This determines that the value offered to end consumers is increased and a greater number of transactions performed, with the consequent indirect effect of strengthening the basic internal capabilities of each firm. Such nature of client-server interaction materializes in the integration of processes by related companies in such a way that greater integration generates greater cooperation, higher commitment and trust (Dwyer, Schurr and Oh, 1987; Ganesan, 1994; Morgan and Hunt, 1994; Doney and Cannon, 1997), greater transfer of knowledge, greater innovation capability and business flexibility. The economic dimensions (investments quality, value engineering, concurrent engineering, and cost reduction), strategic dimensions (core competencies, strategic fit, time to market, and goals), and behavioral dimensions (social bonding, trust, and culture) would all be optimized with better relationship quality between client and outsourcer (Wilson and Jantrania, 1993, 1994). Inter-firm relationship developed and matured over time leads to creation of quality and value for both the client firm and service-provider, which will ultimately be realized as perceived value by the end customer in the market (Gronroos, 1997; Payne and Holt, 2001). Thus, better relationship quality and higher relationship value in the business dyad serves to increase/maximize the benefits and decrease/minimize the costs for the client firm and the service-provider, so as to ultimately maximize the value for each entity, and thereby maximize the total value orientation of the strategic business arrangement.
Proposition 3a.- Higher relationship quality will enhance the effect of the perceived benefits on client firm value. Proposition 3b.- Higher relationship quality will mitigate the effect of the perceived costs on client firm value. Proposition 4a.- Higher relationship quality will enhance the effect of the perceived benefits on service-provider value. Proposition 4b.- Higher relationship quality will mitigate the effect of the perceived costs on service-provider value.
56

GLOBAL JOURNAL OF BUSINESS RESEARCH ♦ VOLUME 4 ♦ NUMBER 2 ♦ 2010
TOTAL VALUE ORIENTATION There are several anticipated outcomes of the Total Value Orientation (for the business system) ranging from short-term financial gains to long-term competitiveness categorized as follows: Financial Performance, Competitiveness, End Customer Value, Innovation Capability, and Strategic Partnership Effectiveness. Traditional financial performance metrics such as total (joint) profitability and shareholder wealth are important to track as outcome measures. Increased competitiveness is achieved through improved value to end-customer, increased shared knowledge and resulting reduction in environmental uncertainty. The primary purpose of the client firm and service-provider relationship is to enhance value for the end-customer. Just as Dell uses Intel microprocessors to provide and communicate value to its computer users, the partnerships the client firm establishes with other firms such as outsourcing service-providers improve value to the end-customer. If this enhanced total value of the system as it benefits the end-customer is communicated effectively, the perceived end-customer value is higher. Improved innovation capability for both product and process modifications and breakthroughs are achieved through re-alignment of critical internal processes. Apart from the behavioral currency traded in a relationship, the currency of increasing value in today’s economy is the currency of information and knowledge. In a genuine relationship, the client firm and the service-provider both seek empowerment through a two-way exchange of information and knowledge; thereby moving towards an effective strategic partnership, by sharing product, process and people knowledge (Bhagat and Williams, 2002). Finally, truly strategic partnership effectiveness takes root through shared values and goals and improved inter-organizational coordination (Table 1, Figure 2)
Proposition 5.- Higher the perceived value to the client firm and the perceived value to the service-providing organization, higher the total value orientation of the business system.
Table 1: List of the Research Propositions 1a. Higher the perceived benefits, higher the perception of value to the client firm. 1b. Lower the perceived costs, higher the perception of value to the client firm. 2a. Higher the perceived benefits, higher the perception of value to the service-providing organization. 2b. Lower the perceived costs, higher the perception of value to the service-providing organization. 3a. Higher relationship quality will enhance the effect of the perceived benefits on client firm value. 3b. Higher relationship quality will mitigate the effect of the perceived costs on client firm value. 4a. Higher relationship quality will enhance the effect of the perceived benefits on service-provider value. 4b. Higher relationship quality will mitigate the effect of the perceived costs on service-provider value. 5. Higher the perceived value to the client firm and the perceived value to the service-providing
organization, higher the total value orientation of the business system.
CONCLUDING COMMENTS The outsourcing context here is viewed as a special case of business partnership relationships. The essence of the entire discussion could be applied to all trading partners within the business network. While this paper considers the partnership of only two firms, the Total Value Orientation perspective is not limited to only such dyadic relationships. The framework articulated here can be usefully extended to a network of relationships between the client firm and several of its business partners. These partners may be outsourcing service-providers for manufactured products, professional services, or business processes. Conducting such cost-benefit analysis can be useful for firms to decide upon the efficacy and effectiveness of their business partnership arrangements. Entities engaged in business transactions will always face costs and benefits during the course of their communication; however, the relationship quality which they develop and nurture as a function of time would determine how well the benefits arising amidst their business dynamics would override their costs in order to project and establish notions of value in the trading network.
57
F. Byramjee et al Global Journal of Business Research ♦ Vol. 4 ♦ No. 2 ♦ 2010
Figure 2: Cost-Benefit Framework of Total Value Orientation
This figure summarizes the gist of all the conjectures elaborated upon by us in the paper. The benefits and the costs incurred by the client firm and the service-provider are respectively shown as indicators describing the domains of their respective constructs, namely client value and service-provider value. Relationship quality is shown as the moderator between the benefits/costs and the respective value constructs for the client firm and the service provider. The five strategic outcomes of the total value orientation are shown as reflective indicators for that construct. It is our view that such an evaluation or measurement of value of an entire business system is critical for firms and organizations to develop greater competitiveness in today’s world of global collaborations. Value may be operationalized in various ways and at different market levels. Some common metrics – direct measures or surrogates - include customer satisfaction, customer value-added, total cost analysis, strategic profit model or shareholder value (Lambert and Burduroglu, 2000). Naumann (1995) use the ratio of perceived benefits and “perceived sacrifices” to capture expected customer value – a perspective close to that considered by us in this paper. Gale (1994) proposes the quality-price differential to indicate
Relationship Quality
Client Firm Value
Service-Provider Value
Total Value Orientation
Competitiveness
End-Customer Value
Financial Performance
Innovation Capability
Strategic Partnership Effectiveness
Benefits- • Product/Service Quality • Profitability • Productivity • Reduced Communication • Reputation • Responsiveness • Operational Know-how • Specializations and Core
Competencies
Costs- • Product Reengineering • New Personnel • New Infrastructure • Search • Information Acquisition • Negotiation • Monitoring/Control • Dependency on Provider • Opportunism
Benefits- • Technology Transfer • Additional Revenues • Intellectual Capital • Responsiveness • Economies of Scale • Exposure to New Workflows • Access to New Markets • Optimal Workforce Utilization • Reduction of Competition
Costs- • Transaction Costs • Dependency on Client
• Reduced Flexibility • Adherence to Clients’
Requirements • Loss of Operational Control
58

GLOBAL JOURNAL OF BUSINESS RESEARCH ♦ VOLUME 4 ♦ NUMBER 2 ♦ 2010
value to the end-customer. None of these perspectives, however, consider measuring and aggregating the value from multiple business partners. Extending the current models of such supplier or vendor analysis to a set of business partners should be the next step in this research. At the macro-level, the impact of outsourcing on productivity growth and efficiency in manufacturing and service industries has been studied (Heshmati, 2003). At the firm or micro-level, Grover, Cheon and Teng (1996) study the impact of service quality and partnership on outsourcing of information system functions. However, their measures of success of outsourcing are based on the strategic, economic and technological benefits and do not explicitly consider the costs. They do recognize the role of service quality as a moderating variable of the relationship between the extent of outsourcing and outsourcing success. Lee and Kim (1999) consider partnership quality as a mediating variable which leads to outsourcing success. The success measure considers both the firm perspective and the user perspective. Poppo and Zenger (1998) approach the make-or-buy decision from the three perspectives of transaction cost, knowledge-based and measurement reasoning and conclude that an integrated approach of measurement is needed for such a complex decision. We agree with these researchers and would consider measuring the total value of outsourcing as well as the value to the end-user. In conclusion, the model proposed here is the first step on understanding, evaluating and measuring the total value of a complex system of multiple participants, dynamic inputs and outputs as well as diverse contexts. REFERENCES Asher, Mukul and Amarendu Nandy (2007), ‘Demographic Complementarities And Outsourcing’, IIMB Management Review, June. Baker, G., R. Gibbons and K. Murphy (2002), ‘Relational Contracts And The Theory Of The Firm’, Quarterly Journal of Economics, February, pg. 39. Bebea, Ines (2005), ‘Competing With Outsourcing; Corporate Executives Offer Some Tips’, Network Journal, 12 (3), pg. 10. Bhagat, Parimal and Jerome Williams (2002), ‘Assessing And Leveraging Relationships In Marketing’, Journal of Relationship Marketing, 3/4, Haworth Press, NY. Blumberg, D. (1998), ‘Strategic Assessment Of Outsourcing And Downsizing In The Service Market’, Managing Service Quality, 8 (2), pg. 5. Buzzell, R. and B. Gale (1987), The PIMS Principles, The Free Press, NY. Cachon, G. and P. Harker (2002), ‘Competition And Outsourcing With Scale Economies’, Management Science, 48 (10). Choudhury, V. and R. Sabherwal (2003), ‘Portfolios Of Control In Outsourced Software Development Projects’, Information Systems Research, 14 (3). Chusil, M. and S. Downs (1979), ‘When Value Helps’, The PIMS-Letter On Business Strategy, The Strategic Planning Institute, Cambridge, MA. Crosby, L., K. Evans and D. Cowles (1990), ‘Relationship Quality In Services Selling: An Interpersonal Influence Perspective’, Journal of Marketing, 54, pg. 68. Doney, P. and J. Cannon (1997), ‘An Examination Of The Nature Of Trust In Buyer-Seller Relationships’, Journal of Marketing, 61, pg. 35.
59

F. Byramjee et al Global Journal of Business Research ♦ Vol. 4 ♦ No. 2 ♦ 2010
Dwyer, F., P. Schurr and S. Oh (1987), ‘Developing Buyer-Seller Relationships’, Journal of Marketing, 51, pg. 11. Espino-Rodriguez, Tomas and Manuel Rodriguez-Diaz (2004), ‘Outsourcing Of The Manufacturing And Distribution Process From The Internal And Relational Capability View’, Second World Conference on POM and Fifteenth Annual POMS Conference, Cancun. Gale, Bradley (1994), Managing Customer Value, The Free Press, NY. Ganesan, S. (1994), ‘Determinants Of Long-Term Orientation In Buyer-Seller Relationships’, Journal of Marketing, 58, pg. 1. Gewald, Heiko, Kim Wüllenweber and Tim Weitzel (2006), ‘The Influence Of Perceived Risks On Banking Managers' Intention To Outsource Business Processes: A Study Of The German Banking And Finance Industry’, Journal of Electronic Commerce Research, 7 (2), pg. 78. Gonzalez, Reyes, Jose Gasco and Juan Llopis (2006), ‘Information Systems Offshore Outsourcing; A Descriptive Analysis’, Industrial Management and Data Systems, 106 (9), pg. 1233. Gronroos, C. (1997), ‘Value-Driven Relational Marketing: From Products To Resources And Competencies’, Journal of Marketing Management, 13 (5), pg. 407. Grover, Varun, Myun Joong Cheon and James Teng (1996), ‘The Effect Of Service Quality And Partnership On The Outsourcing Of Information Systems Functions’, Journal of Management Information Systems, 12 (4), pg. 89. Gummesson, E. (1999), Total Relationship Marketing, Butterworth-Heinemann, Oxford. Gupta, Amar, Satwik Seshasai, Sourav Mukherji and Auroop Ganguly (2007), ‘Offshoring: The Transition From Economic Drivers Toward Strategic Global Partnership And 24-Hour Knowledge Factory’, Journal of Electronic Commerce in Organizations, 5 (2), pg. 1. Gupta, Mahesh and Dana Zhender (1994), ‘Outsourcing And Its Impact On Operations Strategy’, Production and Inventory Management Journal, 35 (3), pg. 70. Heshmati, Almas (2003), “Productivity Growth, Efficiency and Outsourcing in Manufacturing and Service Industries”, Journal of Economic Surveys, Vol. 17, No. 1. Blackwell Publishing: UK. Hutchins, Greg (2005), ‘Outsourcing Quality’, Quality Progress, 38 (4), pg. 77. Kennedy, Daniel (1993), ‘Experiments In Outsourcing’, ABA Journal, 79, pg. 28. Kishore, R., H. Rao, K. Nam, S. Rajagopalan and A. Chaudhury (2003), ‘A Relationship Perspective On IT Outsourcing: Insights From A Longitudinal Study’, Communications of the ACM, 46, pg. 12. Kogut, B. (1985), ‘Designing Global Strategies: Comparative And Competitive Value-Added Chains’, Sloan Management Review, Summer, pg. 15. Lambert, Douglas M. and Renan Burduroglu (2000), “Measuring and Selling the Value of Logistics”, The International Journal of Logistics Management, 11 (1).
60

GLOBAL JOURNAL OF BUSINESS RESEARCH ♦ VOLUME 4 ♦ NUMBER 2 ♦ 2010
Leavy, Brian (2001), ‘Supply Strategy - What To Outsource And Where’, Irish Marketing Review, 14 (2), pg. 46. Lee, Jae-Nam and Young-Gul Kim (1999), ‘The Effect Of Partnership Quality On IS Outsourcing Success: Conceptual Framework and Empirical Validation’, Journal of Management Information Systems, 15 (4), pg. 29-61. Morgan, R. and S. Hunt (1994), ‘The Commitment-Trust Theory Of Relationship Marketing’, Journal of Marketing, 58, pg. 20. Naumann, Earl (1995), Creating Customer Value: The Path to Competitive Advantage, Thompson Executive Press, Cincinnati, OH. Normann, R. and R. Ramirez (1994), Designing Interactive Strategy: From Value Chain to Value Constellation, John Wiley & Sons, Chichester. Parasuraman, A., V. Zeithaml and L. Berry (1988), ‘SERVQUAL: A Multiple-Item Scale For Measuring Consumer Perceptions Of Service Quality’, Journal of Retailing, 64, pg. 12. Payne, Adrian and Sue Holt (2001), ‘Diagnosing Customer Value: Integrating The Value Process And Relationship Marketing’, British Journal of Management, 12, pg. 159. Peters, T. (1992), Liberation Management, NY. Poppo, Laura and Todd Zenger (1998), “Testing Alternative Theories of the Firm: Transaction Cost, Knowledge-based, and Measurement Explanations for Make-or-Buy Decisions in Information Services”, Strategic Management Journal, 19, pg. 853. Qu, Zhonghua and Michael Brocklehurst (2003), ‘Analysis Of The Role Of Transaction Costs In Supplier Selection’, Journal of Information Technology, 18, pg. 53. Ralston, Deborah, April Wright and Jaynendra Kumar (2001), ‘Process Benchmarking As A Market Research Tool For Strategic Planning’, Marketing Intelligence & Planning, 19 (4), pg. 273. Reidel, J., Lewis, J. and Pawar, K. (1992), ‘Make or Buy: the Strategic Design Choice’, Integrated Manufacturing Systems, 3 (2), pg. 9. Reve, T. (1990), ‘The Firm as a Nexus of Internal and External Contracts’, The Firm as a Nexus of Treaties, pg. 133. Rodriguez-Diaz, Manuel and Tomas Espino-Rodriguez (2006), ‘Redesigning The Supply Chain: Reengineering, Outsourcing, And Relational Capabilities’, Business Process Management Journal, 12 (4), pg. 483. Sako, Mari (2006), ‘Outsourcing And Offshoring: Implications For Productivity Of Business Services’, Oxford Review of Economic Policy, 22 (4), pg. 499. Tas, J. and S. Sunder (2004), ‘Financial Services Business Process Outsourcing’, Communications of the ACM, 47 (5), pg. 50.
61

F. Byramjee et al Global Journal of Business Research ♦ Vol. 4 ♦ No. 2 ♦ 2010
Totty, Michael (2007), ‘Technology (A Special Report); Outside Chance: Why Outsourcing IT Often Doesn't Save As Much As It Could’, Wall Street Journal (Eastern edition), Jan 29, 2007, pg. R.7. Williamson, M (1991), ‘Outsourcing: The Decision’, CIO, October, pg. 23. Williamson, O. (1975), Markets and Hierarchies: Analysis and Antitrust Implications, The Free Press, NY. Williamson, O. (1981), ‘The Economics of Organizations: the Transaction Costs Approach’, American Journal of Sociology, 87, 3, pg. 548. Wilson, D. and S. Jantrania (1993), ‘Measuring Value In Relationship Development’, Proceedings of the 9th IMP Conference, Bath University, Bath. Wilson, D. and S. Jantrania (1994), ‘Understanding The Value Of A Relationship’, Asia-Australia Marketing Journal, 2 (1), pg. 55. BIOGRAPHY Dr. Framarz Byramjee is an Associate Professor of Marketing at Indiana University of Pennsylvania. He can be contacted at: Eberly College of Business and Information Technology, Indiana University of Pennsylvania, 664 Pratt Drive, Indiana, PA 15705, USA. Email: [email protected] Dr. Parimal Bhagat is an Associate Professor of Marketing at Indiana University of Pennsylvania. He can be contacted at: Eberly College of Business and Information Technology, Indiana University of Pennsylvania, 664 Pratt Drive, Indiana, PA 15705, USA. Email: [email protected] Dr. Andreas Klein is an Assistant Professor of Marketing at University of Duisburg-Essen. He can be contacted at: Mercator School of Management, University of Duisburg-Essen, 65 Lotharstrasse, Duisburg, Germany 47057. Email: [email protected]
62
GLOBAL JOURNAL OF BUSINESS RESEARCH ♦ VOLUME 4 ♦ NUMBER 2 ♦ 2010
OPTIMIZING THE USE OF THE FISCAL STIMULUS FOR HEALTH IT IN THE U.S.
Adora Holstein, Robert Morris University Patrick Litzinger, Robert Morris University
John Dunn, Robert Morris University
ABSTRACT
The fiscal stimulus of 2009 allocated about $19 billion over five years to advance the country’s push for a nationwide health information network. Information sharing among public health agencies and private health care providers has the potential for reducing public health threats and increasing public access to measures of provider quality. It can also help build and disseminate a database of cost-effective best practices in health care delivery. An analysis of existing evidence on enablers and barriers to adoption and effective use of electronic health records suggest that government intervention is justified. The market system will result in low utilization because of scale economies, externalities, network effect, and a need for national standards to ensure interoperability, privacy and data security,. However, optimal use of the fiscal stimulus requires that financial and technical assistance be targeted on smaller physician practices and independent hospitals. Such assistance must be made conditional on adoption and effective use of a certified, interoperable system. The public health benefits will also be maximized the more health care providers participate in the national health IT network. Thus, in addition to awarding financial incentives, electronic submission of aggregated or de-identified health information must be mandated of all health care providers, not only those that are participants of Federal health programs.
JEL: I18 KEYWORDS: electronic health records, electronic medical records, national health IT infrastructure, government intervention to promote adoption of health IT INTRODUCTION
he impetus for using electronic health records in the United States is increased concern regarding the quality of patient care. A landmark study published by the Institute of Medicine eight years ago reported that more people die in hospitals each year due to medical errors than from breast cancer
or AIDS or highway accidents, and more people die due to medication errors than from work-related injuries (IOM, 2001). The IOM’s report pointed directly to an increased use of information technology (IT) to reduce fatalities stemming from human error. It was not until April 2004 that the Bush administration made a commitment to develop nationwide use of health IT so that by the year 2014 each person in the U.S. will have an electronic health record (EHR). To that end, the Office of National Coordinator of Health Information Technology (ONC) was established within the Health and Human Services Department. (HHS). The ONC and the American Health Information Community (now called the National eHealth Collaborative) formed work groups comprising health care providers, software vendors, academic institutions, federal health agencies, and health plans, to formulate a national health IT policy and strategy (Leavitt, 2008). In September 2005, the ONC created a quasi-public Certification Commission for Health Information Technology (CCHIT) by merging leading private sector health IT associations. With a three-year HHS grant, this Commission was given the charge of developing national certification standards for functionality, interoperability, and data security of health IT products (CCHIT, 2009).
T
63

A. Holstein et al Global Journal of Business Research ♦ Vol. 4 ♦ No. 2 ♦ 2010
In February this year, the Obama administration allocated about $19 billion of the Fiscal Stimulus (American Recovery and Reinvestment Act) to accelerate adoption and effective use of health IT nationwide (White House, 2009). The Stimulus provides for matching grants to states and Indian tribes to plan and implement EHR diffusion from 2011 to 2013. A state can use the grant to extend loans to health care providers for purchase and/or improvement of health IT systems. With 50% Federal subsidy, states will also be able to establish nonprofit regional extension centers to provide technical assistance for adoption, implementation, upgrade, ongoing maintenance, and effective use of health IT. In addition, the Stimulus provides for incentive payments to physicians and hospitals that participate in Federal health programs to encourage meaningful use of health IT. Meaningful use apparently includes e-prescribing, use of standardized billing codes, reporting of predetermined health care quality measures, and providing evidence of coordinating care with other providers. The amount awarded is set to decline from 2010 to 2015 to incentivize early adoption. Lastly, matching grants will be awarded, on a competitive basis, to academic institutions who integrate multidisciplinary health informatics and IT courses into the curricula of medical and allied health degree programs. The objectives of this study are: (1) to benchmark the state of health IT adoption, use, and public spending in the U.S. with other countries, (2) to establish the rationale for government intervention in the development of a national health IT infrastructure, and (3) to determine the optimal use of public funds by analyzing the evidence on factors that promote early adoption, as well as barriers that impede adoption and implementation. The remainder of this paper is organized into five sections: Literature Review, Methodology, Research Findings, Analysis, Conclusion, and Areas for Future Research. LITERATURE REVIEW To understand the levels of IT applications in health care and the measurable benefits and costs of adoption, this section will review the existing literature on health care informatics and relevant government websites. Levels of IT Applications in Health Care The use of information technology in the health care industry can range from the basic electronic medical record (EMR) to an enterprise-wide, comprehensive electronic health record (EHR) system, to a national health IT infrastructure. An EMR is a patient-focused electronic data storage facility designed for use by physicians. It replaces the traditional patient’s file containing patient’s contact information, date of birth, insurance information, medical history, drug allergies, adverse reactions to certain treatment, documentation of physician encounters (symptoms, diagnosis, treatment, and outcome), and billing code cross references. Unlike paper files, an EMR enables real-time data access and electronic search capabilities (Amatayakul, 2007). An EHR system is designed for use by an integrated network of health management organization, hospitals and providers like the University of Pittsburgh Medical Center System in Pittsburgh, or a large federal health program like the Veteran’s Administration and Medicare. It allows multiple healthcare providers (physician’s offices, laboratories, hospitals, pharmacies, home care, rehabilitation and long-term care facilities) access to patients’ electronic health information for the purpose of coordination of care, and collection of data for cost control (Hartley and Jones, 2005). As described in Stead and Lin (2009), the most comprehensive EHR system can include: a) Computerized Physician Order Entry (CPOE) for e-prescribing, orders for diagnostic tests, and reminders for corollary orders and diagnostic tests intended to improve compliance with preventive care and chronic disease management guidelines, and reduce errors of omission; b) Picture Archiving Communication System (PACs) for storage and transfer of radiology tests results; c) Computerized Decision Support Systems (CDSS) for evidence-based, best practice diagnosis and treatment databases that physicians can access to arrive at prompt, reliable, and optimal diagnoses and treatment options.
64

GLOBAL JOURNAL OF BUSINESS RESEARCH ♦ VOLUME 4 ♦ NUMBER 2 ♦ 2010
When EMR and EHR systems can communicate with each other (i.e. interoperable), and integrated into health IT systems of public health agencies like the Center for Disease Control and Homeland Security, a national health IT infrastructure is formed. Through it, physicians can quickly transmit data on the occurrence of a set of predetermined symptoms to public health agencies, enabling them to see aggregate patterns or identify disease clusters, and quickly deliver geographically targeted warnings about outbreaks of infectious diseases, food poisoning, or bioterrorist incidents (Scanlon, 2009). Interconnected EMRs and EHR systems can also generate electronic data on health outcomes and cost of care, which can aid public and private health plans in identifying cost-effective treatments, efficiently allocate resources, and design performance incentives accordingly (ONC, 2009). Benefits and Costs At its website the Department of Health and Human Services states its vision that nationwide use of HIT has the potential to “improve health care quality, prevent medical errors, increase the efficiency of care provision and reduce unnecessary health care costs, increase administrative efficiencies, decrease paperwork, expand access to affordable care, and improve population health” (HHS, 2009). Empirical studies that formally quantify the benefits and costs experienced by early adopters of EMRs or EHR systems are often limited as far as sample size and geographic representation, but they nonetheless offer evidence of the sources of realized cost savings and improved patient outcomes. Among a small sample of hospitals that have comprehensive EHR systems in place, Simon et al (2005) reported that prompts generated by Computerized Decision Support Systems (CDSS) resulted in a 5.8% increase in Pap test alerts, and 18.3% improvement in flu vaccine alerts. The CDSS also improved drug dosing, preventive care, diagnosis, and patient outcomes in two of every three hospitals studied. In addition, a combination of the CDSS and Computerized Physician Order Entry (CPOE) systems reduced medication errors and increased adherence to medication ordering guidelines in nine of 12 hospitals studied. These benefits come at a reasonable cost. An American Hospital Association survey estimates a one-time acquisition and installation cost for an EHR system of $70~-$100 billion or 15% of average capital spending in the hospital industry, plus annual operating cost of $1.7 billion or 2% of average operating cost in the industry (Stead and Lin, 2009). For a three-doctor practice, installing an EMR could cost $70,000 to $80,000 plus annual operating cost of $8,000 to $10,000 (King, 2009a). Wang et al. (2003) reported that full EMR implementation yielded net benefits of about $86,400 per physician. Most of the savings were generated in the areas of cost-effective drug prescriptions and reduced medication errors (33%), and reduced personnel needed for chart pulling and filing (28%). The rest of the cost savings came from eliminating duplicate radiology tests and better documentation of services for billing purposes. Enterprise-wide use of an EHR system in the U.S. is so far limited to a few, but well recognized success stories. One is the Veterans Health Information Systems and Technology Architecture (VistA) developed by the Veterans Administration 25 years ago. It is now used by over 1,400 VA hospitals and health facilities. It allows clinicians to access patient EHRs from other VA facilities. When records at the VA Medical Center in Gulfport Mississippi were destroyed during Hurricane Katrina, for example, VA hospitals in other states were able to retrieve records for nearly 40,000 veterans (Hill, 2007). Use of the VistA system has transformed the VA from a provider of substandard care to an institution that outperformed most private hospitals in 14 out of 15 quality assurance areas (Hill, 2007). Because of its proven benefits, the Defense Department’s Military Health System and the Indian Health Services have both adopted VistA. The open source version, WorldVistA, is freely available to the public and private sector through the Freedom of Information Act, and has been adopted overseas by the Instituto Mexicano del Sequro Sociale, Berlin Heart Institute, National Cancer Institute of Cairo, and other health care organizations in Finland, Nigeria, and American Samoa (VA, 2009). Another enterprise-wide EHR user is
65
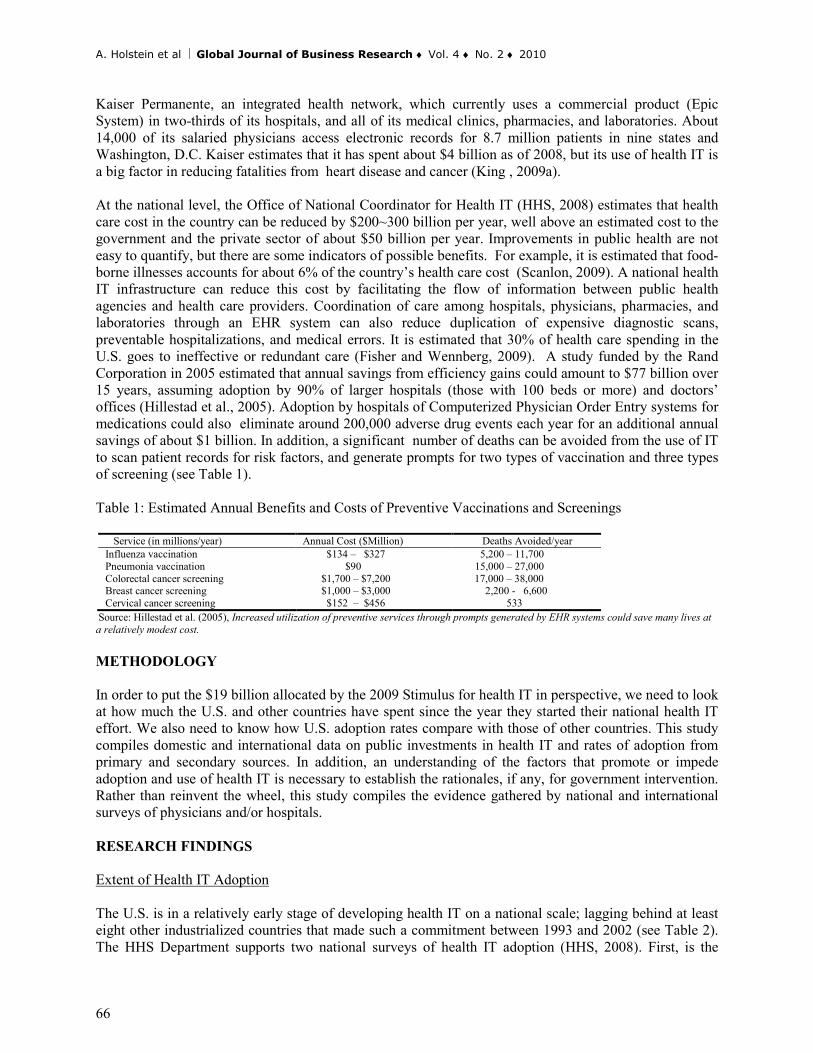
A. Holstein et al Global Journal of Business Research ♦ Vol. 4 ♦ No. 2 ♦ 2010
Kaiser Permanente, an integrated health network, which currently uses a commercial product (Epic System) in two-thirds of its hospitals, and all of its medical clinics, pharmacies, and laboratories. About 14,000 of its salaried physicians access electronic records for 8.7 million patients in nine states and Washington, D.C. Kaiser estimates that it has spent about $4 billion as of 2008, but its use of health IT is a big factor in reducing fatalities from heart disease and cancer (King , 2009a). At the national level, the Office of National Coordinator for Health IT (HHS, 2008) estimates that health care cost in the country can be reduced by $200~300 billion per year, well above an estimated cost to the government and the private sector of about $50 billion per year. Improvements in public health are not easy to quantify, but there are some indicators of possible benefits. For example, it is estimated that food-borne illnesses accounts for about 6% of the country’s health care cost (Scanlon, 2009). A national health IT infrastructure can reduce this cost by facilitating the flow of information between public health agencies and health care providers. Coordination of care among hospitals, physicians, pharmacies, and laboratories through an EHR system can also reduce duplication of expensive diagnostic scans, preventable hospitalizations, and medical errors. It is estimated that 30% of health care spending in the U.S. goes to ineffective or redundant care (Fisher and Wennberg, 2009). A study funded by the Rand Corporation in 2005 estimated that annual savings from efficiency gains could amount to $77 billion over 15 years, assuming adoption by 90% of larger hospitals (those with 100 beds or more) and doctors’ offices (Hillestad et al., 2005). Adoption by hospitals of Computerized Physician Order Entry systems for medications could also eliminate around 200,000 adverse drug events each year for an additional annual savings of about $1 billion. In addition, a significant number of deaths can be avoided from the use of IT to scan patient records for risk factors, and generate prompts for two types of vaccination and three types of screening (see Table 1). Table 1: Estimated Annual Benefits and Costs of Preventive Vaccinations and Screenings
Service (in millions/year) Annual Cost ($Million) Deaths Avoided/year Influenza vaccination Pneumonia vaccination Colorectal cancer screening Breast cancer screening Cervical cancer screening
$134 – $327 $90 $1,700 – $7,200 $1,000 – $3,000 $152 – $456
5,200 – 11,700 15,000 – 27,000
17,000 – 38,000 2,200 - 6,600 533
Source: Hillestad et al. (2005), Increased utilization of preventive services through prompts generated by EHR systems could save many lives at a relatively modest cost. METHODOLOGY In order to put the $19 billion allocated by the 2009 Stimulus for health IT in perspective, we need to look at how much the U.S. and other countries have spent since the year they started their national health IT effort. We also need to know how U.S. adoption rates compare with those of other countries. This study compiles domestic and international data on public investments in health IT and rates of adoption from primary and secondary sources. In addition, an understanding of the factors that promote or impede adoption and use of health IT is necessary to establish the rationales, if any, for government intervention. Rather than reinvent the wheel, this study compiles the evidence gathered by national and international surveys of physicians and/or hospitals. RESEARCH FINDINGS Extent of Health IT Adoption The U.S. is in a relatively early stage of developing health IT on a national scale; lagging behind at least eight other industrialized countries that made such a commitment between 1993 and 2002 (see Table 2). The HHS Department supports two national surveys of health IT adoption (HHS, 2008). First, is the
66

GLOBAL JOURNAL OF BUSINESS RESEARCH ♦ VOLUME 4 ♦ NUMBER 2 ♦ 2010
Center for Disease Control Ambulatory Medical Survey of 2,700 physicians conducted from 2006-2008. This survey reports an increasing trend in adoption rates, but as of 2008 only about one of five physicians use an EHR system. This is below the 24% targeted by the federal government. Table 2: Time Frame for Nationwide Health IT Implementation
Country eHealth Policy Established Target for Completion Germany 1 1993 2006 Finland 2 1995 2004 Denmark 2 1996 2000 Iceland 2 1996 2004 Canada 1 1997 2009 (50% ) France 2 1997 N/A Australia 1 2000 N/A United Kingdom. 1 2002 2014 United States 1 2004 2014 Austria 2 2005 2008 Switzerland 2 2006 N/A
Sources: 1 Anderson, et al. (2006) and 2 WHO (2007). This table shows that at least eight other industrialized countries started their national health IT effort earlier than the U.S. Second, is the national survey of 3,037 hospitals conducted by the American Hospital Association, which found that only one of ten hospitals has adopted an EHR system as of 2008 (see Table 3). Two levels of usage: Basic and full usage are defined according to different functionalities in the physician’s practice and hospital settings (see Tables 4 and 5). Among the adopters (physicians as well as hospitals), only one of five use all the functionalities of EHR systems. Table 3: Survey Results on EHR Adoption and Usage in the U.S.
Setting 2006 2007 2008 Physicians offices Basic Full
14% 11% 3%
17% 13% 4%
21% 17% 4%
Hospitals Basic
N/A
N/A
10% 8%
Full N/A N/A 2% Source: HHS (2008). A national survey found that only one of five physicians and one of ten hospitals in this country have an EHR system in place as of 2008. Most of the adopters use only the basic functions Table 4: Basic vs. Full Usage: Physicians
Type of Usage Basic Full Type of Usage Basic Full
Health Information and Data Order Entry Management Patient demographics X X Prescription orders X X Problem list or symptoms X X Laboratory orders X Current medications X X Radiology orders X Clinical notes X X Rx sent electronically X Diagnosis and follow up X Orders sent electronically X Clinical Decision Support Results Management Drug warnings X View lab results X X Out of range levels highlighted X View imaging results X X Clinical reminders X Images returned X
Source: HHS (2008). This table compares basic and full functionalities of health IT designed for physicians. Comparing the extent of adoption of health IT in the U.S. to those of other countries is not easy. First, the cross-country survey available does not include the U.S. in the sample (Dobrev, 2008). Second, this survey reports adoption rates at a level of IT usage that is more disaggregated (see Table 6) than the national surveys done in the U.S. Nonetheless, it is probably safe to infer from these data that, on average, health IT adoption in the European Union is more widespread and usage is more intense than here.
67
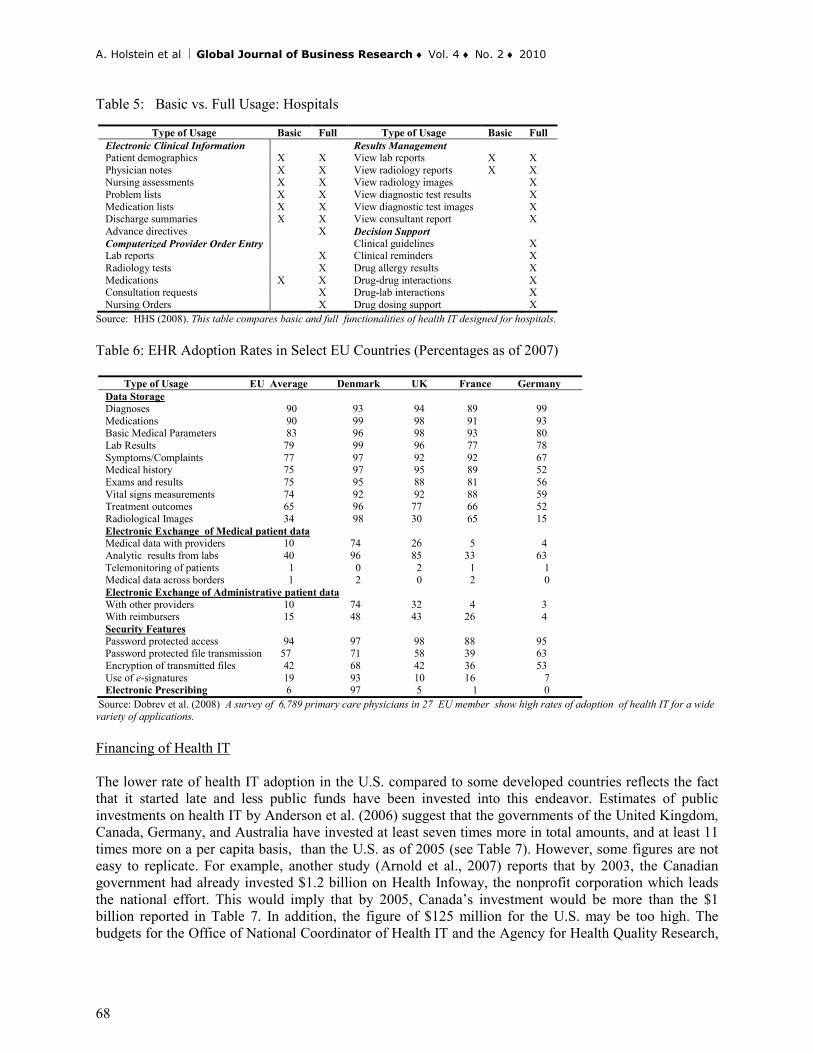
A. Holstein et al Global Journal of Business Research ♦ Vol. 4 ♦ No. 2 ♦ 2010
Table 5: Basic vs. Full Usage: Hospitals
Type of Usage Basic Full Type of Usage Basic Full Electronic Clinical Information Results Management Patient demographics X X View lab reports X X Physician notes X X View radiology reports X X Nursing assessments X X View radiology images X Problem lists X X View diagnostic test results X Medication lists X X View diagnostic test images X Discharge summaries X X View consultant report X Advance directives X Decision Support Computerized Provider Order Entry Clinical guidelines X Lab reports X Clinical reminders X Radiology tests X Drug allergy results X Medications X X Drug-drug interactions X Consultation requests X Drug-lab interactions X Nursing Orders X Drug dosing support X
Source: HHS (2008). This table compares basic and full functionalities of health IT designed for hospitals. Table 6: EHR Adoption Rates in Select EU Countries (Percentages as of 2007)
Type of Usage EU Average Denmark UK France Germany Data Storage Diagnoses 90 93 94 89 99 Medications 90 99 98 91 93 Basic Medical Parameters 83 96 98 93 80 Lab Results 79 99 96 77 78 Symptoms/Complaints 77 97 92 92 67 Medical history 75 97 95 89 52 Exams and results 75 95 88 81 56 Vital signs measurements 74 92 92 88 59 Treatment outcomes 65 96 77 66 52 Radiological Images 34 98 30 65 15 Electronic Exchange of Medical patient data Medical data with providers 10 74 26 5 4 Analytic results from labs 40 96 85 33 63 Telemonitoring of patients 1 0 2 1 1 Medical data across borders 1 2 0 2 0 Electronic Exchange of Administrative patient data With other providers 10 74 32 4 3 With reimbursers 15 48 43 26 4 Security Features Password protected access 94 97 98 88 95 Password protected file transmission 57 71 58 39 63 Encryption of transmitted files 42 68 42 36 53 Use of e-signatures 19 93 10 16 7 Electronic Prescribing 6 97 5 1 0
Source: Dobrev et al. (2008) A survey of 6,789 primary care physicians in 27 EU member show high rates of adoption of health IT for a wide variety of applications. Financing of Health IT The lower rate of health IT adoption in the U.S. compared to some developed countries reflects the fact that it started late and less public funds have been invested into this endeavor. Estimates of public investments on health IT by Anderson et al. (2006) suggest that the governments of the United Kingdom, Canada, Germany, and Australia have invested at least seven times more in total amounts, and at least 11 times more on a per capita basis, than the U.S. as of 2005 (see Table 7). However, some figures are not easy to replicate. For example, another study (Arnold et al., 2007) reports that by 2003, the Canadian government had already invested $1.2 billion on Health Infoway, the nonprofit corporation which leads the national effort. This would imply that by 2005, Canada’s investment would be more than the $1 billion reported in Table 7. In addition, the figure of $125 million for the U.S. may be too high. The budgets for the Office of National Coordinator of Health IT and the Agency for Health Quality Research,
68
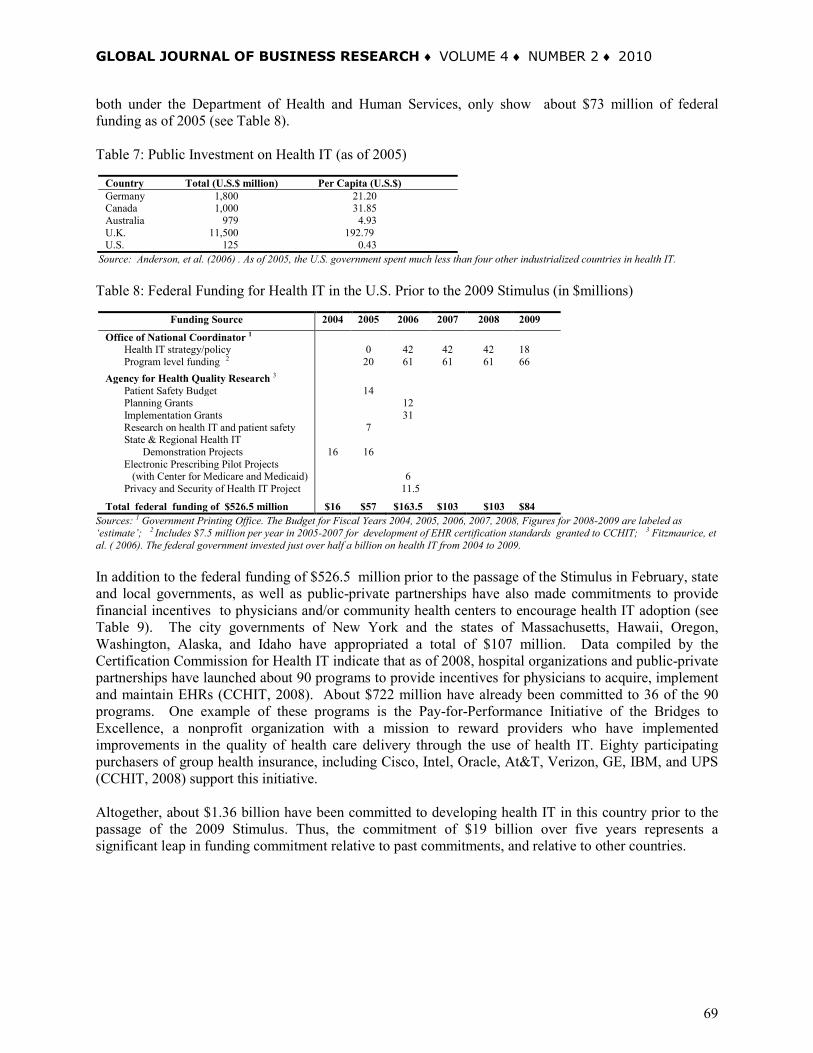
GLOBAL JOURNAL OF BUSINESS RESEARCH ♦ VOLUME 4 ♦ NUMBER 2 ♦ 2010
both under the Department of Health and Human Services, only show about $73 million of federal funding as of 2005 (see Table 8). Table 7: Public Investment on Health IT (as of 2005)
Country Total (U.S.$ million) Per Capita (U.S.$) Germany 1,800 21.20 Canada 1,000 31.85 Australia 979 4.93 U.K. 11,500 192.79 U.S. 125 0.43
Source: Anderson, et al. (2006) . As of 2005, the U.S. government spent much less than four other industrialized countries in health IT. Table 8: Federal Funding for Health IT in the U.S. Prior to the 2009 Stimulus (in $millions)
Funding Source 2004 2005 2006 2007 2008 2009
Office of National Coordinator 1 Health IT strategy/policy
Program level funding 2
0
20
42 61
42 61
42 61
18 66
Agency for Health Quality Research 3 Patient Safety Budget 14 Planning Grants 12 Implementation Grants 31 Research on health IT and patient safety 7 State & Regional Health IT Demonstration Projects
16
16
Electronic Prescribing Pilot Projects (with Center for Medicare and Medicaid)
6
Privacy and Security of Health IT Project 11.5
Total federal funding of $526.5 million $16 $57 $163.5 $103 $103 $84 Sources: 1 Government Printing Office. The Budget for Fiscal Years 2004, 2005, 2006, 2007, 2008, Figures for 2008-2009 are labeled as ‘estimate’; 2 Includes $7.5 million per year in 2005-2007 for development of EHR certification standards granted to CCHIT; 3 Fitzmaurice, et al. ( 2006). The federal government invested just over half a billion on health IT from 2004 to 2009.
In addition to the federal funding of $526.5 million prior to the passage of the Stimulus in February, state and local governments, as well as public-private partnerships have also made commitments to provide financial incentives to physicians and/or community health centers to encourage health IT adoption (see Table 9). The city governments of New York and the states of Massachusetts, Hawaii, Oregon, Washington, Alaska, and Idaho have appropriated a total of $107 million. Data compiled by the Certification Commission for Health IT indicate that as of 2008, hospital organizations and public-private partnerships have launched about 90 programs to provide incentives for physicians to acquire, implement and maintain EHRs (CCHIT, 2008). About $722 million have already been committed to 36 of the 90 programs. One example of these programs is the Pay-for-Performance Initiative of the Bridges to Excellence, a nonprofit organization with a mission to reward providers who have implemented improvements in the quality of health care delivery through the use of health IT. Eighty participating purchasers of group health insurance, including Cisco, Intel, Oracle, At&T, Verizon, GE, IBM, and UPS (CCHIT, 2008) support this initiative. Altogether, about $1.36 billion have been committed to developing health IT in this country prior to the passage of the 2009 Stimulus. Thus, the commitment of $19 billion over five years represents a significant leap in funding commitment relative to past commitments, and relative to other countries.
69
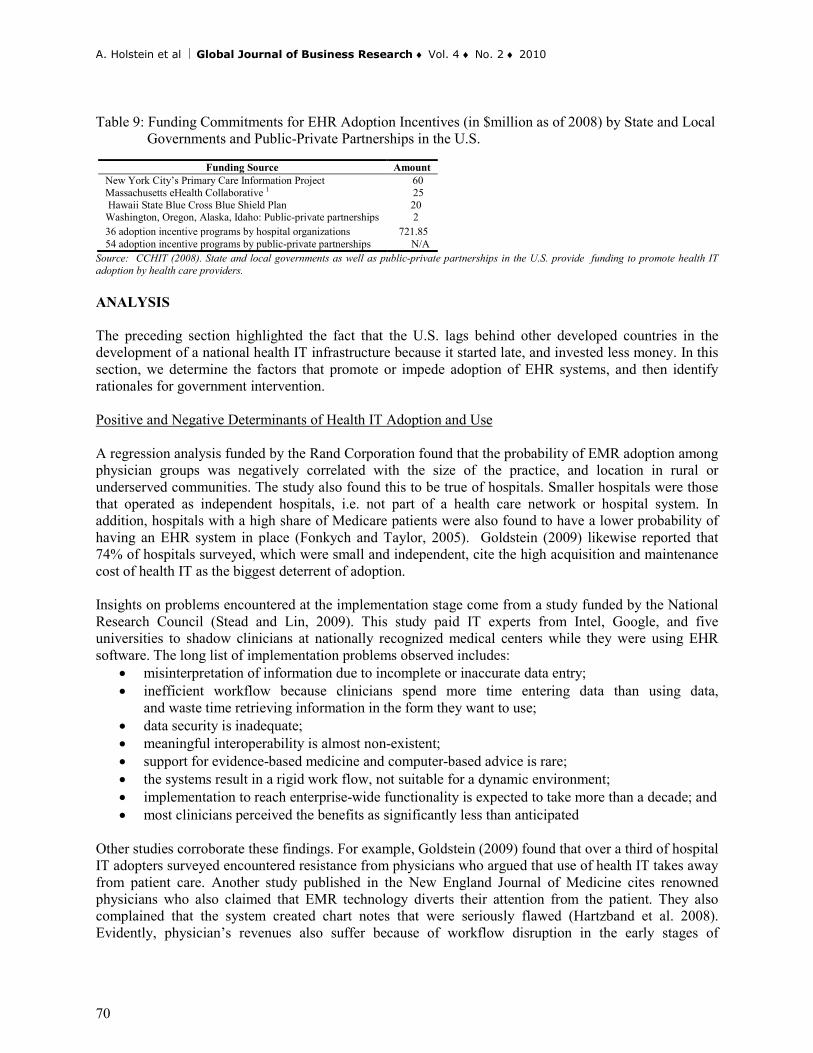
A. Holstein et al Global Journal of Business Research ♦ Vol. 4 ♦ No. 2 ♦ 2010
Table 9: Funding Commitments for EHR Adoption Incentives (in $million as of 2008) by State and Local Governments and Public-Private Partnerships in the U.S.
Funding Source Amount
New York City’s Primary Care Information Project 60 Massachusetts eHealth Collaborative 1 25 Hawaii State Blue Cross Blue Shield Plan 20 Washington, Oregon, Alaska, Idaho: Public-private partnerships 2 36 adoption incentive programs by hospital organizations 721.85 54 adoption incentive programs by public-private partnerships N/A
Source: CCHIT (2008). State and local governments as well as public-private partnerships in the U.S. provide funding to promote health IT adoption by health care providers. ANALYSIS The preceding section highlighted the fact that the U.S. lags behind other developed countries in the development of a national health IT infrastructure because it started late, and invested less money. In this section, we determine the factors that promote or impede adoption of EHR systems, and then identify rationales for government intervention. Positive and Negative Determinants of Health IT Adoption and Use A regression analysis funded by the Rand Corporation found that the probability of EMR adoption among physician groups was negatively correlated with the size of the practice, and location in rural or underserved communities. The study also found this to be true of hospitals. Smaller hospitals were those that operated as independent hospitals, i.e. not part of a health care network or hospital system. In addition, hospitals with a high share of Medicare patients were also found to have a lower probability of having an EHR system in place (Fonkych and Taylor, 2005). Goldstein (2009) likewise reported that 74% of hospitals surveyed, which were small and independent, cite the high acquisition and maintenance cost of health IT as the biggest deterrent of adoption. Insights on problems encountered at the implementation stage come from a study funded by the National Research Council (Stead and Lin, 2009). This study paid IT experts from Intel, Google, and five universities to shadow clinicians at nationally recognized medical centers while they were using EHR software. The long list of implementation problems observed includes:
• misinterpretation of information due to incomplete or inaccurate data entry; • inefficient workflow because clinicians spend more time entering data than using data,
and waste time retrieving information in the form they want to use; • data security is inadequate; • meaningful interoperability is almost non-existent; • support for evidence-based medicine and computer-based advice is rare; • the systems result in a rigid work flow, not suitable for a dynamic environment; • implementation to reach enterprise-wide functionality is expected to take more than a decade; and • most clinicians perceived the benefits as significantly less than anticipated
Other studies corroborate these findings. For example, Goldstein (2009) found that over a third of hospital IT adopters surveyed encountered resistance from physicians who argued that use of health IT takes away from patient care. Another study published in the New England Journal of Medicine cites renowned physicians who also claimed that EMR technology diverts their attention from the patient. They also complained that the system created chart notes that were seriously flawed (Hartzband et al. 2008). Evidently, physician’s revenues also suffer because of workflow disruption in the early stages of
70
GLOBAL JOURNAL OF BUSINESS RESEARCH ♦ VOLUME 4 ♦ NUMBER 2 ♦ 2010
implementation. The practice usually does not go back to a full schedule until two to three months later (King 2009a). Moreover, electronic monitoring and exchange of information can reduce the need for patients to come for follow-up visits. One study that measured the decrease in office visits found that this could be as high as 15% over a year (Gans et al., 2005). Rationales for Government Intervention The preceding analysis of determinants of health IT adoption points to four rationales for government intervention to attain the goal of having a national health IT infrastructure: (1) the need for national standards to ensure interoperability, data security and privacy, (2) economies of scale, (3) externalities, and (4) network effects. Each of these rationales is discussed below. National Standards for Interoperability, Data Security, and Privacy. – A national network of interoperable health IT systems can generate data for three purpose: (1) reducing public health threats, (2) public reporting of standardized quality measures of health care services, and (3) creation of a database of evidence-based best practices in diagnosis and treatment. Due to the multiplicity of software and hardware vendors in the U.S. and abroad, there is a need for the government, at the federal level, to establish national standards to ensure that health care providers purchase EHR systems that will enable health care providers to share health information with each other, and with public health agencies. Standardized measures of health care quality for different chronic illnesses, a predetermined set of symptoms linked to different public health threats, and billing codes to track cost-effective treatments, and evidence-based best practices, are all necessary. From the point of view of consumers of health care, data security and privacy are of utmost importance. Currently, pharmacies are able to sell detailed records of patient medications to clearinghouses, which then create profiles on individuals and sell that information to interested parties such as insurance companies for underwriting purposes (King, 2009b). In the absence of a single-payer system in this country, or a law that prevents private health plans from denying insurance coverage to someone with pre-existing condition or genetic susceptibility, patient’s concern about the privacy of medical records is understandable. Thus, uniform or national standards are also needed to ensure privacy and data security among patients. In 2005-2006, the quasi-public Certification Commission for Health IT developed national standards for functionality, interoperability, and data security and privacy. It began certifying EMR and EHR software in 2006, and has certified more than 200 EHR products by mid-2009, representing over 75% of the marketplace CCHIT, 2009). As mandated by the Stimulus, HHS released a document on June 16, 2009, which provides hospitals and physicians affiliated with Federal health programs a draft of guidelines on what it takes to establish “Meaningful Use” of health IT, and hence be eligible for financial incentives (HHS, 2009). Among others, health care providers will be required to ensure privacy and security protections for confidential information not only through operating policies and procedures, but also by adopting appropriate technology to be in compliance with state law and HIPAA Privacy and Security Rules. They will also be required to provide transparency and consumer choice about what health information is shared, with whom, and for what purpose. Accordingly, an HIT Policy Committee recommended that the following measurable outcomes be monitored during 2011-2015 to determine if physicians and hospitals remain eligible for financial incentives (HHS, 2009):
• conduct or update a security risk assessment and implement security updates as necessary; • be cleared by the investigating authority of any HIPAA privacy or security violation; • incorporate and utilize technology to segment sensitive health information; • provide aggregated or de-identified health information, when sufficient, to satisfy a data request
for population health purposes; • provide patients, on request, with a timely accounting of disclosures for treatment, payment and
health care operations.
71

A. Holstein et al Global Journal of Business Research ♦ Vol. 4 ♦ No. 2 ♦ 2010
Economies of Scale and Externalities. - Early adopters of health IT tend to be the larger hospitals and physicians practice groups, especially those that belong to an integrated health network. The huge investment in health IT hardware, software, technical staff, and training of users coupled with the inability to internalize the benefits tips the balance of benefits and costs against adoption by independent hospitals, and clinics with fewer than five physicians. This situation is even worse for providers located in rural and low-income areas. The purchase and installation of an EHR system would be worthless unless physicians use it. Resistance among physicians may be due to their inability to internalize or share in the benefits of improved patient outcomes, fewer redundant tests, cost-effective medications and treatments, among others. For example, the benefits of cost-effective drug prescriptions and elimination of duplicate radiology tests accrue to the health insurer. Physicians are not rewarded for performance or for cost-savings passed on to health insurers. Moreover, their revenues fall because of reduced office visits and work disruption during the early phase of IT installation and implementation. As a result, the adoption rate is higher among health plans that integrate hospitals, physicians, and laboratories into one health system. Examples are Kaiser Permanente, the Cleveland Clinic, Intermountain Health Care, and UPMC. Thus, rather than providing loans and technical assistance to smaller hospitals and physician practices directly, it may be more cost-effective for the government to mandate insurers or health plans to invest in EHR systems, or else pay into a pool of funds that can be invested in shared facilities either at the city, state or regional level. The cost of providing EHR systems for use by small physician groups and independent hospitals within a health plan can be substantially reduced if instead of installing and maintaining the hardware and software in each office or hospital, the health plan provides remote access to a shared health IT facility on a subscription basis. This is known in the health IT industry as the software as a service or SaaS model (Close, 2009). Lastly, society as a whole also benefits from health care cost savings that can slow down the rise in health insurance cost. When the uninsured uses emergency care, hospitals raise the bill for insured inpatients. Private health insurers subsequently pass this on to the insured by raising future premium or cost-shares. As the cost of insurance increases, individuals with lower health risk opt out of health insurance. The adverse selection problem implies that the cost of health insurance will continue to spiral upward among the remaining higher risk pool of insured individuals. Cost savings from effective use of health IT can potentially offset the rise in cost of health insurance in this country. Network Effect. - Building a national health IT infrastructure through a network of interoperable EHR systems is on top of the country’s health IT priorities. A nationwide network, that allows private sector providers to feed data on a predetermined set of symptoms linked to food-borne illnesses, contagious diseases, and bioterrorism into eHealth systems, which the Center for Disease Control or Homeland Security can access in real time, is immensely valuable from the point of view of early detection of threats to public safety. Moreover, a national health IT system can substantially enhance the dissemination of information to the public, and containment of these threats. In addition, consumer choice and market competition can be enhanced if a nationwide health IT network can generate quality or performance ratings on various hospitals and physicians. The Agency for Health Care Quality Research under the Health and Human Services Department has gone a long way towards identifying measures of quality in health care delivery (AHRQ, 2009). Physicians and hospitals who perform well on these measures have the incentives to publicize this information, but those who underperform do not. Needless to say, the more hospitals, laboratories, and physicians participate in periodic submission of information to public health agencies through the national health IT infrastructure, the greater the public benefits are. On their own, however, private sector providers will have no incentive to participate in this nationwide exchange of health information since they do not internalize the benefits to society as a whole. This network effect justifies monetary incentives that the Stimulus proposes to award to physicians and hospitals for effective or “meaningful use” of health IT. The Stimulus does propose to establish regional exchanges that will provide loans and technical assistance for the purchase, installation, and maintenance of interoperable
72

GLOBAL JOURNAL OF BUSINESS RESEARCH ♦ VOLUME 4 ♦ NUMBER 2 ♦ 2010
EHR systems. However, it does not mandate health care providers outside of Federal health programs to adopt health IT systems. This precludes the full realization of potential public health benefits. CONCLUSION The U.S. lags behind other developed countries in terms of adoption and public investment in a nationwide network of electronic health records systems. The fiscal stimulus of $19 over five years represents a significant increase compared to past funding commitments, and per capita spending by other countries. Evidence gathered by surveys of physicians and hospitals indicate the presence of economies of scale, externalities, network effects, and public concerns about data security and privacy. Thus, government intervention is necessary to accelerate adoption and widespread use. However, to optimize the use of public funds, loans and technical assistance must be targeted to health care providers who cannot reap the economies of scale and externalities inherent in the purchase, maintenance and use of EHR systems. These are smaller practice groups of less than five physicians and independent hospitals, including those in rural and disadvantaged communities. Shared access to an EHR system installed and maintained by a nonprofit facility at the city, state or regional level is more cost-effective than having each hospital or practice group acquire and maintain separate systems. As an alternative, each practice or hospital can subscribe to software provided and maintained by certified commercial vendors. Moreover, financial incentives awarded to physicians and hospitals for meaningful use of health IT must be made conditional on their use of certified EHR systems. This will ensure that various EHR systems in the country can communicate with each other, and have passed the standards for data security and privacy. Reporting by health care providers of health care quality measures and costs through a national network of EHR systems could generate valuable information for consumer choice. Submission of depersonalized or aggregated health information with public health agencies also has the potential of reducing threats to public health. Lastly, to maximize the network effects, electronic submission of such information must be mandated of all health care providers, not only those within federal health programs. AREAS FOR FUTURE RESEARCH It would be interesting to document case studies that provide evidence of health care quality improvements attributable to the use of health IT. Another study of future interest is the job market implications of the health IT stimulus. The stimulus is flexible enough in that it does not restrict physicians, if they prefer, from using the financial incentives that they receive to pay IT support staff. It would be interesting to see how many more health IT professionals will graduate from educational institutions receiving grants provided for in the stimulus. REFERENCES Agency for Healthcare Research and Quality (2009). National Quality Measures Clearinghouse. Retrieved January 22, 2009 from the AHRQ Web site: http://www.qualitymeasures.ahrq.gov/ Anderson, G., B. Frogner, R. Jones, and U. Reinhardt (2006) Health Care Spending and Use of Information Technology in OECD Countries, Health Affairs, May/June 2006, 25(3):819-31 Amatayakul, M. (2007) Electronic Health Records: a Practical Guide for Professionals and Organizations. Chicago, IL: American Health Information Management Association. Certification Commission for Health Information Technology (2008) Incentive Programs for EHR Adoption Growing. September. Retrieved March 4, 2009 from the CCHIT Web site: www.cchit.org/about/news/releases/2008/Incentive-programs - EHR-adoption-growing.asp
73

A. Holstein et al Global Journal of Business Research ♦ Vol. 4 ♦ No. 2 ♦ 2010
____(2009). Certification Standards for Electronic Health Record Systems. Retrieved January 12, 2009, from the CCHIT Web site: http://www.cchit.org/about Close, Richard (2009). “Healthcare IT Growth is ‘There for the Taking’: Sector Will Attract Technology Investors,” The Wall Street Transcript’s Health Care IT Report. Retrieved August 10, 2009 from the Yahoo Web site:http://finance.yahoo.com/news/Healthcare-IT-Growth-is-There-twst-2474473109.html?x=0&.v=1 Dobrev, Alexander, M. Haesner, T. Hüsing, W. Korte, and I.Meyer (2008). Benchmarking ICT use among General Practitioners in Europe. Retrieved July 31, 2009 from the eHealth Europe Web site: http://www.ehealtheurope.net/img/document_library0282/gp_survey_final_report.pdf Fisher, E. and J. Wennberg, cited in Rachel King (2009a) “How Kaiser Permanente Went Paperless,” Business Week, April 7. Fitzmaurice, J., and J. Sensmeier (2006). Standards & Interoperability: The DNA of the EHR . Retrieved July 29, 2009 from the CCHIT Web site: www.cchit.org/files/CCHIT_Contract_Award_Press_Release.pdf Fonkych K. and R. Taylor (2005).The State and Pattern of Health Information Technology Adoption, RAND MG-409-HLTH. Retrieved December 12, 2008 from the Rand Corp. Web site: http://www.rand.org/pubs/research_briefs/RB9136/index1.html Gans, David, J. Kralewski, and B. Dowd (2005). “Medical Groups’ Adoption of Electronic Health Records and Information Systems,” Health Affairs, Sept/Oct. issue. Retrieved November 5, 2008 from the SRS Software Web site: http://www.srssoft.com/pdf/MGMA_Landmark_Study.pdf Goldstein, Jacob (2009). U.S. Hospitals Slow to Adopt E-Records. Retrieved March 26, 2009 from the Wall Street Journal Web site: http://online.wsj.com/article/SB123802378615142099.html Government Printing Office. 2004-2009. The Budget for the Health and Human Services Department. Fiscal Years 2005, 2006, 2007, 2008, 2009. Washington, D.C. Retrieved August 2, 2009 from the GPO Web site: www.gpoaccess.gov/usbudget/fy05/pdf/budget/hhs.pdf; www.gpoaccess.gov/ usbudget/fy06/ pdf/budget/ hhs.pdf; www.gpoaccess.gov/usbudget/fy07/pdf/budget/hhs.pdf; www.gpoaccess.gov/us budget/fy08/pdf/budget/ hhs.pdf; www.gpoaccess.gov/usbudget/fy09/pdf/budget/hhs.pdf Hartley, C. and E. Jones (2005). EHR Implementation. Retrieved October 16, 2008 from the AMA Web site: http://www.ama.org Hartzband, P. and J. Groopman (2008) “Off the Record-Avoiding the Pitfalls of Going Electronic,” New England Journal of Medicine, vol. 358(16), pp. 1656-7 Health and Human Services Department (2008). Coordinated Federal Health IT Strategic Plan: 2008-2012. Washington, D.C. Retrieved Jan. 10, 2009 from the HHS Health IT Web site: www.hhs.gov/healthit/resources/HITStrategicPlan.pdf ____ (2008). Health IT Adoption Initiative. Retrieved August 2, 2009 from the HHS Health IT Web site: http://healthit.hhs.gov/portal/server.pt?open=512&objID=11&parentname=CommunityPage&parentid=11&mode=2 &in_hi_userid=10741&cached=true ____ (2009) “Meaningful Use Matrix,” HIT Policy Committee - Meaningful Use Workgroup Update, June 16, p. 7. Retrieved August 2, 2009, from the HHS Health IT Web site:
74

GLOBAL JOURNAL OF BUSINESS RESEARCH ♦ VOLUME 4 ♦ NUMBER 2 ♦ 2010
http://healthit.hhs.gov/portal/ server.pt/gateway/PTARGS_0_11113_872719_0_0_18/Meaningful%20Use%20Matrix.pdf Hill, E. (2007). Promoting Health Information Technology in California. Retrieved Sept. 12, 2008 from Legislative Analyst Office Web site: http://www.lao.ca.gov/2007/health_info_tech/health_info_tech_021307.pdf Hillestad R, J. Bigelow, et al (2005), “Can Electronic Medical Record Systems Transform Healthcare? An Assessment of Potential Health Benefits, Savings, and Costs,” Health Affairs, vol.(24)5, September 14 Institute of Medicine (2001). Crossing the Quality Chasm: A New Health System for the 21st Century. National Academy Press, Washington, D.C. King, Rachel (2009a) “How Kaiser Permanente Went Paperless,”Business Week, April 7 _____(2009b) “Putting Patient Privacy in Peril?” Business Week, April 6 Leavitt, Michael (2008). Remarks as Prepared for Delivery to the American Health Information Community (AHIC). January 22. Retrieved December 14, 2008 from the HHS Web site: http://www.hhs.gov/news/speech/2008/sp20080122a.html Scanlon, Jessie (2009) “GE Healthcare Unveils a Plan to Stop Epidemics,” Business Week, April 6 Simon, J., T. Rundall, and S. Shortell (2005) “Drivers of electronic medical record adoption among medical groups,” Journal of Quality and Patient Safety. November 31, 2005, pp. 631-9. Stead, W. and H. Lin, eds. (2009). Computational Technology for Effective Health Care: Immediate Steps and Strategic Directions. January 9. National Academies Press, Washington, D.C. Wang, S., B. Middleton et al (2003) “A Cost-Benefit Analysis of Electronic Medical Records in Primary Care,” American Journal of Medicine. Vol. 4(5), pp. 397-403 White House (2009). American Recovery and Reinvestment Act of 2009. Retrieved February 15, 2009, from the White House Web site: http://whitehouse.gov World Health Organization (2007). Building Foundations for eHealth: Progress of Member States. February. Retrieved July 25, 2009 from the WHO Web site: www.who.int/ehealth/resources/bf_full.pdf. Veterans Administration (2008). VistA. Retrieved Sept. 29, 2008 from the VA web site: http://www.va.org ACKNOWLEDGMENT We would like to thank Robert Faulkner for his research assistance in the Fall 2008, while a senior student at the School of Business, Robert Morris University. BIOGRAPHY Adora Holstein is Associate Professor of Economics in the Dept. of Economics and Legal Studies, School of Business, Robert Morris University. She has published several articles in interstate and international comparisons of the link between health care system design and health outcomes. Her email address is [email protected].
75

A. Holstein et al Global Journal of Business Research ♦ Vol. 4 ♦ No. 2 ♦ 2010
Patrick Litzinger is Professor of Economics and Chair, Dept. of Economics and Legal Studies, School of Business, Robert Morris University. He has published several articles in the economics of trade policy and education. His email address is [email protected]. John Dunn is President of J.H. Dunn & Co., a consulting company in business strategy and finance. He is an Adjunct Faculty in the Dept. of Economics and Legal Studies, School of Business, Robert Morris University. His email address is [email protected]. The authors can also be contacted by writing to: Massey Hall, Robert Morris University, 6001 University Blvd., Moon Township, PA 15108.
76

GLOBAL JOURNAL OF BUSINESS RESEARCH ♦ VOLUME 4 ♦ NUMBER 2 ♦ 2010
WAS THE 2008 FINANCIAL CRISIS CAUSED BY A LACK OF CORPORATE ETHICS?
Victor Lewis, National University, La Jolla, California Kenneth D. Kay, National University, La Jolla, California Chandrika Kelso, National University, La Jolla, California
James Larson, National University, La Jolla, California
ABSTRACT During the second half of 2008, the United States financial markets, and eventually all major world markets, were devastated by the aftermath of unethical lending practices by major lending institutions. These bad loans were made at the height of a real estate bubble in the United States. Aggressive lenders engaged in loans called “sub-prime mortgages.” These mortgages were extremely high risk and most of them violated traditional underwriting standards for the industry. Prudence and ethics were pushed aside as greed overcame good judgment among mortgage lenders nationwide. The problem was exacerbated by the packaging, and leveraging, of these loans by Wall Street financial companies. These companies leveraged these bad loans, and sold them to unsuspecting buyers as bundled investments in the secondary markets. When the overheated United States real estate market finally began a severe and protracted correction of fair market values due to these bad sub-prime loans made to questionable borrowers, not only did the real estate markets collapse but it resulted in a domino effect causing the collapse of major banks and a precipitous and protracted market drop in stock values, financial companies, insurers, and eventually the biggest financial crisis since the great depression. This paper will review the 2008 collapse, and evaluate the questionable practices among the various corporate and financial participants that caused a worldwide collapse of shareholder values. This paper will also explore and review the United States government’s various attempts to solve this great crisis including what proper ethical and legal safeguards are being considered to prevent a repeat of this disaster in the future. JEL: M00, M14, M48
INTRODUCTION
ho is to blame for the current financial crisis that has led to a mortgage and stock market meltdown that incoming President Elect Obama has called “the greatest crisis since the great depression”? Many feel that the financial services industry is to blame because it has
consistently tried to defy gravity by using debt, securitization and proprietary trading to boost fee income and profits. Investors, hungry for yield have willingly gone along with the financial services industry. Due to this collaboration, this process has turned investment banks into debt machines that trade heavily on their own accounts. Goldman Sachs used approximately $40 billion of equity as the foundation for $1.1 trillion of assets. At Merrill Lynch, the most leveraged, approximately $1 trillion of assets teetered on approximately $30 billion of equity. In rising markets, this type of strategy creates stellar returns on equity. However, history tells that when markets are in peril, a small fall in asset values can completely wipe out shareholder equity. Many feel that the financial services industry, that had promised miracles, did nothing more than seduce the greedy and bring destruction to not only the United States economy but to the global world markets as well. The paper is organized into five parts. The first part discusses the events leading up to the mortgage and stock market meltdown. The second part discusses the main causes of the bank failures and subsequent bailouts. The third part discusses the now congressionally approved auto company bailouts. The fourth part discusses possible suggested remedies. Finally, the conclusion
W
77

V. Lewis et al Global Journal of Business Research ♦ Vol. 4 ♦ No. 2 ♦ 2010
presents a summary of the paper and answers the hypothesis of whether the 2008 financial crisis was indeed caused by a lack of corporate ethics. LITERATURE REVIEW J. E. Stiglitz in his essay in 2003 entitled Ethics, Market and Government Failure, and Globalization looked at how ethical aspects of globalization proceeded in recent years. In particular, Stiglitz argued that it was socially unjust if the more affluent benefit at the expense of someone who is poorer and to view negative redistributions as ethically wrong. Stiglitz goes on to posit that the United States Treasury and the International Monetary Fund have long well overstepped these bounds. Stiglitz states that they have put forward as economic advice, policies which advantage one group at the expense of others. Stiglitz points out that some economists have questioned whether ethics has much of anything to do with economics. He further points out that when there are market failures, however, individuals in the pursuit of their own interests may not pursue general interests. Discussing ethical issues, Stiglitz states there is a fine line between ordinary incentives and broader ethical issues. In the United States, the corporate accounting, and banking scandals, in each of which, individuals were simply acting in ways which reflected their own interests, and most of which were at the time totally legal, raised serious ethical issues. Stiglitz goes on to point out that “CEO’s and other executives deliberately took advantage of their positions of trust to enrich themselves at the expense of those they were supposed to serve.” Does this scenario sound familiar? Z. Jun Lin, (2000) analyzed the impact of the Asian financial crisis on the Chinese economy and the preventive measures adopted by the Chinese Government to curb an economic recession in China. Although currencies were substantially devaluated and banking systems collapsed in most Asian countries, China escaped from the disastrous scenarios affecting most Asian countries Lin points out that China suffered a shaky banking system. There were enormous amounts of troublesome loans in China’s banking system derived from frequent interventions of credit policies by government authorities. The banks’ exposure to bad loans was substantially high. He further points out that according to some estimates, the portion of “risky loans” in Chinese state-owned banks stood at a level well above the acceptable ceiling recognized by international credit-rating institutions. This is probably why the Chinese government is so worried about the enormous value of United States bonds purchased and whether their investment is safe. Laurids S. Lauridsen (1998) examined the financial crisis in Thailand which was found to be a private sector failure” and expressed itself mainly in careless lending/borrowing practices and the accumulation of nonperforming loans. When the economy showed signs of weakening, “hot money” flowed in and covered the deficit but also led to careless investments. This financial liberalization resulted in a miscalculation and political instability, indecisiveness and mismanagement at the political and administrative level and contributed to a financial meltdown in Thailand. Inder P. Khera, (2001) in discussing ethics did a study on ethical business practices of businesses, officials and politicians in the East compared to the Western world. He found that although most consider Eastern Third World countries pervasively corrupt while Westerners view themselves as mostly uncorrupt, realities turned out to be quite different. Khera found that advanced countries often take a stereotypical view of the governments and institutions in developing countries of Asia, Africa, and Latin America as being corrupt, uninformed, incompetent, and just plain ignorant, while their views of their own businesses, governments, institutions, etc., are those of hardworking knowledgeable, ethical well-governed, efficient, productive , etc. Khera goes on the state that in the 1997 Asian financial crisis, Times columnist A. M. Rosenthal wrote that Asian leaders, bankers and business executives worked in a tight partnership to drive their countries into chaos through institutionalized corruption, nepotism and crony capitalism. Khera’s premise is that the reality of the way things really are as reported by Time magazine
78

GLOBAL JOURNAL OF BUSINESS RESEARCH ♦ VOLUME 4 ♦ NUMBER 2 ♦ 2010
in 2000 is that there exists a working relationship between United States politicians and “their commercial henchmen” He goes on to state that political contributions and extensive spending on lobbying net rich American firms billions of dollars in tax relief, government bailouts from bad decisions, ability to pay lower-than-market-rate wages, immunity from certain laws, and the ability to kill or change legislation they do not like. Khera alludes to a study by sociologist Emiti Etzione who found that between 1975 and 1985, two-thirds of the Fortune 500 firms had been convicted of serious crimes ranging from price fixing to illegal dumping of hazardous waste. Khera’s research further found that although recent financial scandals in the United States have typically occurred in commodity trading, the Wall Street (Ivan Bosky, Michael Milken) and defense contracts, no industry is immune to abuses. He further points out that Melvyn Weiss, the king of class-action suites has won huge judgments and settlements from such giants as Prudential Insurance Company, Washington Public Power supply, Rexall Sundown, Tyco, Windmere Holdings, Sunbeam, Aviation Sales, National Finance Corp., Metropolitan Life Insurance, and many more. Therefore, this latest financial ethical crisis is not the first time this has occurred nor will it be the last time unless the proper government regulations are put in place. WHAT WENT WRONG Alan Greenspan, former Chairman of the Federal Reserve, said in 2005, “that increasingly complex financial instruments have contributed to the development of a far more efficient, flexible, and hence resilient financial system than the one that existed just a quarter-century ago.” Tell that to Bear Stearns, Wall Street’s fifth largest investment bank, who became the most spectacular corporate casualty due to the current financial crisis. Financial experts have stated that the demise of Bear Stearns in March 2008 was the inevitable consequence of the laissez-faire philosophy that allowed financial institutions to wrongfully innovate and spread almost unchecked without any proper controls. This in turn, created a complex, interdependent system prone to conflicts of interest, fraudulent practices, and the eventual sale of sub-prime mortgages backed by unqualified mortgagors. Spurred on by short term gains, bankers and fund managers stand accused of pocketing enormous bonuses with no thought to the long-term consequences of their actions. The gambling by these bankers and fund managers was fed by the knowledge that if disaster struck, someone else, i.e. borrowers, investors, taxpayers, would end up bearing the lion’s share of the losses. The banks’ course was made possible by cheap money, facilitated in turn by low consumer-price inflation. Although in more regulated times, credit controls or the gold standard, restricted the creation of credit. As a prelude to this current financial crisis, central banks in effect conspired with local banks to enhance their philosophy to earn higher and higher fees, resulting in a glut of liquidity and a thirst for yield that led eventually to the ill-fated boom in American sub-prime mortgages. This tendency of bankers and financial managers to accept unnecessary risk is accentuated by the fact that their financial assets' have a habit of growing during booms. By hedging their extra assets as collateral, these same individuals can put them to work and borrow even more. Tobias Adrian, of the Federal Reserve Bank of New York, and Hyun Song Shin, a Professor of economics at Princeton University, posit that since the 1970s, debts have grown faster than assets during booms. This pro-cyclical leverage can feed on itself. If financial groups use the borrowed money to buy more of the sorts of securities they lodged as collateral, then the prices of those securities will go up. That, in turn, enables them to accrue even more debt to buy more securities. Unfortunately, sooner or later, the music stops. And when it does stop, the very mechanisms that create abundant credit will also destroy that credit. Most securities attract buyers when the price falls. But this is not necessarily so because financial intermediaries need to limit their leverage and in a falling market, they sell assets. That lowers the prices of securities, which puts further strain on balance sheets leading to further sales. Existing rules on capital adequacy require banks to put some capital aside for each asset. If the market leads to losses, the chances are they will have enough capital to cope. Yet this rule sets up a
79
V. Lewis et al Global Journal of Business Research ♦ Vol. 4 ♦ No. 2 ♦ 2010
perverse incentive to create structures free of the capital burden, such as credits that last 364 days, and hence do not count as "permanent". The hundreds of billions of dollars in the shadow banking system, the notorious SIVs and conduits that have caused the banks so much pain have been warehoused there to get around the rules. Spain's banking regulator prudently said that such vehicles could be created, but only if the banks put capital aside. So far, that country has escaped the damage seen elsewhere. When reformed capital-adequacy rules are introduced, this is an area that will need to be monitored rigorously. The financial industry is likely to stagnate or shrink in the next few years. That is partly because the last phase of its growth was founded on unsustainable leverage, and partly because the value of the underlying equities and bonds is unlikely to grow as it did in the 1980s and 1990s. (The Economist. London: Mar 22, 2008. Vol. 386, Issue 8572; page 92) INDYMAC: THINKING BEYOND FORECLOSURE
Diane Smith could have been another foreclosure statistic. The 56-year-old mother of two refinanced her Los Angeles home in 2006 to pay for a kitchen remodeling. However, Smith, a small business owner, found herself in trouble earlier this year after the teaser rate on her adjustable-rate mortgage expired and banks began lowering spending limits on her credit cards. Smith’s monthly mortgage payment jumped spectacularly and she could not pay it. That's when her mortgage lender, IndyMac Federal Bank, made her an offer she couldn't refuse. In September, the bank knocked down the rate on her loan to 4.75%, slashing her monthly payments from $6,000 to $4,050. The bank also provided counseling to help Smith manage her household expenses. Smith is one of more than 3,000 borrowers who have signed on to a fast-track loan modification program launched by IndyMac, the insolvent California lender seized by the feds in July. Officials from the Federal Deposit Insurance Corp. have moved quickly to tackle the 60,000 delinquent mortgages in IndyMac's portfolio of 742,000 home loans. In late August, letters went out to 7,500 distressed borrowers, offering new terms.
The FDIC says those taking part have seen their monthly payments lowered by $430 per month on average. FDIC Chairwoman Sheila C. Bair is hoping the IndyMac initiative will provide a blueprint for the rest of the industry. Lenders have been under fire from politicians and consumer advocates for not doing enough to stave off a wave of foreclosures: Filings were up 82% in the first half of the year. The FDIC and investors will end up footing the bill for IndyMac's loan modification program. If the plan succeeds, it will keep families like Smith in their homes. In addition, could help arrest the rot in the complex, mortgage-backed securities that precipitated the worldwide financial meltdown. "Theirs is the first systematic effort to really simplify the loan modification process," That is the solution to the mortgage crisis." says Austin King, director of the financial justice unit at Acorn, a community advocacy group. Like it or not, more lenders may be compelled to negotiate new terms with delinquent borrowers. On Oct. 6, Bank of America announced it had reached a legal settlement with authorities in 11 states that had been looking into allegations of predatory lending practices at Countrywide Financial, the mortgage lender it acquired earlier this year. As part of that deal, Bank of America has committed to modifying loans for nearly 400,000 customers. (Source: Business Week. New York: October 20, 2008)
MELTDOWN 101: WHY DID THE AIG BAILOUT GET BIGGER?
According to the (AP), the bailout of insurance giant American International Group (AIG) is a $150 billion gamble. That’s the size of the newly enlarged financial lifeline the U.S. government threw the tottering insurance giant, expanding an aid package that’s gradually grown since it began as an $85 billion loan in September 2008. The history of this bailout is that back on September 16, 2008, the Federal Reserve initially provided AIG with a $85 billion loan, in return for a nearly 80% ownership stake. On October 8, 2008, the Fed followed up with another $37.8 billion loan. Then on October 31, 2008, AIG was allowed access to yet another $20.0 billion through the Fed’s “commercial paper” program. That’s
80

GLOBAL JOURNAL OF BUSINESS RESEARCH ♦ VOLUME 4 ♦ NUMBER 2 ♦ 2010
where the Fed buys mounds of short-term debt from the companies, which often used the money for crucial day-to-day expenses, such as payroll and supplies. So, even with the original $85 billion lifeline, AIG continued to have problems as the country’s overall financial and credit conditions worsened. AIG was saddled with risky mortgage-related securities that had fallen sharply in value and continued to deteriorate after the initial bailout. Shortly thereafter, AIG reported a massive third- quarter hit. It lost $24.47 billion, or $9.95 a share, compared to a profit of $3.09 billion, or $1.19 per share, a year ago. “This is the largest quarterly loss we’ve ever reported,” Chief Financial Officer David Herzog told investors. In addition, the Treasury Department is now stepping in with $40 billion, which is coming from the $700 billion financial bailout package enacted in November. It marked the first time any of that bailout money has gone to any company other than a bank. In addition, this new arrangement replaced the $37.8 billion Fed loan to AIG with a $52.5 billion aid package. So why is it important to keep AIG afloat? The answer is simple; AIG is a collossus with operations in more than 130 countries. It is so interconnected with other financial firms that its problems have a jolting ripple effect in both the United States as well as abroad. In exchange for the money, Neel Kashkari, the Treasury Department official who is serving as the interim head of the $700 billion financial bailout program has said, that “AIG must comply with stringent limitations on executive compensation for its top executives, golden parachutes, its bonus pool, corporate expenses and lobbying.” (Source: Washington AP-November 10, 2008)
Citibank Bailout: $300 Billion Doesn’t Sound Like a Lot Anymore
The Wall Street Journal reports in November that Citibank has become the latest recipient of a government bailout, this time to the tune of $300 billion, or thereabouts. Somehow, $300 billion doesn’t sound like a lot of money anymore. In late November, the Treasury Department was talking about a $500 to $700 billion stimulus package that will be on President Obama’s desk, ready to sign on inauguration day. This is a new record – a $trillion in government commitments in a single day. The Treasury Department has also agreed to inject an additional $20 billion in capital into Citigroup under terms of the deal hashed out between the bank, the Treasury Department, the Federal Reserve, and the Federal Deposit Insurance Corp. In addition to the capital, Citigroup will have an extremely unusual arrangement in which the government agrees to backstop a roughly $300 billion pool of assets, containing mortgage-backed securities among other things. Citigroup must absorb the first $37 to 40 billion in losses from these assets. If losses extend beyond that level, Treasury will absorb the next $5 billion in losses, followed by the FDIC taking on the next $10 billion in losses. Any losses on these assets beyond that level would be taken by the Fed. (Source: Wall Street Journal-November 24, 2008)
Are U.S. Auto Companies Next in Line for a Bailout?
In late November and the first week of December 2008, General Motors Corp., Ford Motor Co., and Chrysler LLC have been pressing the government for financial assistance. First, they came hat in hand requesting a $25 billion loan and now in December 2008, that request has increased to almost $40 billion. This request is on top of the $25 billion in loans Congress passed in September to help retool auto plants to build more fuel-efficient vehicles. (Source Washington AP-November 10, 2008)
POSSIBLE REMEDIES
Bankers have long argued that there is no one-size-fits-all solution to the mortgage mess. Loan workouts, they say, must be done on a case-by-case basis. Yet the IndyMac program was designed around a simple formula: borrowers' mortgage payments should amount to no more than 38% of their gross income. "The key is to make the new loans affordable," says John Bovenzi, the senior FDIC executive now serving as CEO at IndyMac. Bovenzi also knows how to tailor his pitch. At banks, the traditional approach is to send delinquent borrowers a form letter asking them to call the bank to discuss their payment problems. But
81

V. Lewis et al Global Journal of Business Research ♦ Vol. 4 ♦ No. 2 ♦ 2010
instead of using regular mail, IndyMac sent out its letters in overnight delivery packages, which had to be signed for (to prevent the contents from being mistaken for junk mail). What those envelopes contained was, by bank standards, a remarkably straightforward piece of communication: a letter stating, "We want to help you stay in your home," at the top, accompanied by a dollar figure, the new, lower monthly payment being offered. All the recipient had to do was sign a couple of forms and send them back in a prepaid return envelope. IndyMac's new management team readily acknowledges that not all distressed borrowers can be helped. As many as one-third just don't have the income to support even reduced payments. One such case involved a Nevada woman who wanted to relocate after her husband, the family's sole breadwinner, was incapacitated by a stroke. In what's known as a "cash for keys" offer, IndyMac paid her $5,000 to surrender her home. As word of its program has gotten around, IndyMac has been deluged with inquiries from borrowers looking to refinance on better terms, though it's debatable whether many of them are actually in need of assistance. One Washington D.C. woman telephoned senior FDIC officials as well as the top four IndyMac executives to badger them about lowering payments on an investment property.
The bank postponed a scheduled foreclosure but hasn't agreed to renegotiate. "This is like triage after a train crash," says IndyMac spokesman Evan Wagner. "You take care of the worst cases first." Bovenzi has plenty of experience in dealing with bad loans. An FDIC veteran, he worked at the agency during the savings and loan crisis of the late '80s and early '90s. One of the key lessons from that era: Debt workouts can pay off for lenders as well as for borrowers. Chairwoman Bair, in a Sept. 17 speech to Congress, noted that the FDIC's recovery rate on nonperforming loans averages just 32% of the loan's value. If the loan is current, the agency gets 87%. It's too early to judge whether the IndyMac program will succeed. There are studies that show many loan modifications offer at best, only temporary reprieves. Many borrowers will continue to fall behind on payments. Moreover, there is no guarantee that whoever eventually buys IndyMac, will carry on with the program. Already several would-be buyers have visited its Pasadena headquarters to pore over the books. In the meantime, Bovenzi, who once headed the Liquidation Department unit of the FDIC, has been busy dumping assets. First to go were the season tickets to Los Angeles Dodgers games used to entertain corporate clients. A company-owned Porsche went for $65,000 on AutoTrader.com in August. Next on the list: are the paintings hanging on the walls. On the downside, Valparaiso University law professor Alan White looked at 4,344 renegotiated subprime loans and found that only half of the modified loans resulted in lower payments. In many cases, the amount owed actually rose as missed payments and late fees were added to the loan's principal. His conclusion: "The subprime crisis will be worked out only over a period of many years." (Source: Business Week, New York: October 20, 2008)
U.S. Tackles Consumer Debt Market
The Los Angeles Times reports that the federal government’s new $800 billion initiative to revive the nation’s credit markets and reverse the deepening economic crisis propels the government into risky territory-the uncertain world of credit cards, student loans, auto loans and cash-strapped small businesses. Most of the money in the plan is aimed at making home loans cheaper and more readily available. To that end, the Fed plans to buy as much as $600 billion in debt and mortgage-backed securities held or issued by government-sponsored lenders such as Fannie Mae, Freddie Mac and Ginnie Mae and the Federal Home Loan Banks. In addition, the Fed will commit as much as $200 billion to help loosen lending for consumer goods, including everything people can buy with their credit cards. This is intended to make it easier for ordinary Americans to get credit. (Source: Los Angeles Times: November 26, 2008)
82

GLOBAL JOURNAL OF BUSINESS RESEARCH ♦ VOLUME 4 ♦ NUMBER 2 ♦ 2010
Treasury Weighs Plan to Lower Mortgage Rates
Under this proposal according to Scott Talbott, Vice President of the Financial Services roundtable, the Treasury Department would seek to lower the rate on a 30-year mortgage to 4.5%. That’s about 1 percentage point below the current rate in December of 5.6%. The Treasury Department would accomplish this by purchasing mortgage-backed securities from Fannie Mae and Freddie Mac. Although the details are in flux, the program would be similar to the effort the Federal Reserve announced at the end of November to purchase up to $500 billion of mortgage-backed securities from the two mortgage giants. Fannie Mae and Freddie Mac, which were seized by federal regulators in September, own or guarantee about half of the $11.5 trillion in U.S. outstanding home loan debt. (Source: Washington Associated Press, L.A. Times 12/4/08)
N.Y. Prosecutor Picked to Oversee Bailout
The Washington Post has reported that the White House has nominated Neil M. Barofsky, an Assistant U.S. Attorney for the Southern District of New York to oversee the $700 billion bailout program. Mr. Barofsky has spent his entire career as a federal prosecutor specializing in $multibillion accounting frauds. (Source: Washington Post: November 15, 2008)
CONCLUSION
This financial crisis has been called by many, including President-Elect Obama, “the biggest financial crisis since the great depression”. The bailout started out as a $700 billion bailout and is now expected to reach almost $2 trillion. Since experts believe that it could take up to two years before the financial markets stabilize, with the massive amount of bailout funds to be expended, it is important to monitor the bailout, which the government is attempting to do with the appointment of a federal prosecutor as the chief watchdog. The incoming Obama administration has stated that it intends to initiate creative new fiscal policies designed to revive and stimulate the domestic markets and the overall U.S. economy. This together with massive new spending programs, which were initially designed to rebuild the national infrastructure, should also result in increased employment to get people who have lost their jobs, back to work. It is the new administration’s goal to restore faith in government and in the financial markets by immediately initiating investigations into past unethical and questionable financial practices by greedy corporations who many believe are responsible for the current financial crisis that led to the mortgage and stock market meltdown. Hopefully things will not get worse prior to the new administration’s financial team taking over on January 20, 2009.
REFERENCES
Associated Press, November 10, 2008 Business Week, New York: October 20, 2008 Los Angeles Times, November 26, 2008 The Economist, London: March 22, 2008, Vol. 386, Issue 8572; Page 92 Inder P. Khera, 2001. Business Ethics East vs. West: Myths and Realities Laurids S. Lauridsen, 1998. The Finance Crisis in Thailand: Causes, Conduct and Consequences?
83

V. Lewis et al Global Journal of Business Research ♦ Vol. 4 ♦ No. 2 ♦ 2010
Z. Jun Lin, 2000. Asian Financial Crisis and Accounting Reforms in China J. E. Stiglitz, 2003. Ethics, Market and Government Failure, and Globalization Wall Street Journal, November 24, 2008 Washington Associated Press: November 10, 2008 Washington Associated Press, Los Angeles Times, December 4, 2008 Washington Post, November 15, 2008 BIOGRAPHY Victor Lewis, Esq., is an Associate Professor and Program Lead faculty in the Department of Professional Studies at National University, La Jolla, California. He earned his Juris Doctor degree in 1990 from WSU College of Law and is an Attorney at Law, duly licensed to practice before all the courts in the State of California as well as the U.S. District and U.S. Bankruptcy Courts of the Central and Southern Districts of California. Prof. Lewis has practiced law for 18 years and sometimes sits as a Judge Pro Tem in the Superior Court of California. Prior to his legal and scholastic careers, he served as Chief Financial Officer of a major communications company in NYC. Kenneth D. Kay, Esq., is an Assistant Professor and Regional Lead faculty in the Department of Professional Studies at National University, La Jolla, California. He earned his Juris Doctor and LLM degrees from McGeorge School of Law. He is an Attorney at Law duly licensed to practice before all the courts in the State of California as well as by the U.S. District and Tax Courts for the Eastern District. Chandrika Kelso, is an Associate Professor and Chair in the Department of Professional Studies at National University, La Jolla, California. She earned her Juris Doctor degree from Osmania University, College of Law in India and an MFS at National University. James Larson is an Associate Professor and Program Lead faculty in the Department of Professional Studies at National University, La Jolla, California. He earned his Juris Doctor degree in 1995 from Thomas Jefferson College of Law. He has 21 years of experience dealing with cost cutting and efficiency in the public administration sector.
84

GLOBAL JOURNAL OF BUSINESS RESEARCH ♦ VOLUME 4 ♦ NUMBER 2 ♦ 2010
VISUAL LANGUAGE SKILLS – DO BUSINESS STUDENTS NEED THEM
Siu-Kay Pun, Nanyang Technological University, Singapore
ABSTRACT
The use of visual images is an effective means not only to communicate with but also to elicit emotions from and to influence the masses. Present-day computer tools have removed the need for specialized equipment and personnel for the design and preparation of visual images. With globalization and the increasingly visual economy, there is an urgent need to develop visual literacy skills in business students. This paper discusses the cognitive benefits of learning the visual language. Through the experience from a general elective course at Nanyang Technological University, it studies the pedagogical approaches to the nurturing of visual language skills in undergraduates. Specially highlighted are the outcomes of the business students’ performance which were found to be very promising. Although nearly all of them had no background in the visual art prior to taking this course, the majority of them have the innate ability to acquire the basic concepts of the visual language and to apply these effectively in their design projects. Two of these projects are illustrated in this paper as examples of students’ works. This paper concludes with a reflection on the urgency for the training in visual language for our future workforce to compete in the new age. JEL: I20 KEYWORDS: Visual Language, Visual Literacy, Business Education
INTRODUCTION
e live in a visual economy. Visual images exert tremendous impact and influence in the way we conduct our businesses and our lifestyles. They are the driving forces behind marketing and communication. Yet the development of competency in the visual language has
traditionally only been for artists and designers. This paper begins with the reasons for the need for training in the visual language and the significance of nurturing artistic intelligence in our undergraduates. The cognitive benefits of learning the visual language are highlighted. Next, the approach taken by Nanyang Technological University (NTU) for the development of such skills is discussed using as an example a general elective course which aims at developing an understanding of, and competency in, the visual language in business undergraduates. Presented are the pedagogical approaches used to develop in the students their abilities to see in a new way, to perceive with the intent of finding meaning, to move fluidly between verbal and visual modes of thought, to engage in problem solving, and to create visual messages that have impact. This is followed by a discussion of the outcomes as reflected by the achievements of the students. Presented are the composition of the class including, the various disciplines the students came from, the performance of these students according to the different disciplines in the analyses of graphic images and the results of their creative design works. This paper concludes with a reflection and implication on the urgency for the training in visual language especially for our Business students to compete in the new age economy.
W
85

S. K. Pun Global Journal of Business Research ♦ Vol. 4 ♦ No. 2 ♦ 2010
LITERATURE REVIEW AND BACKGROUND
Why learn the visual language? In the 2008 Global Financial Centers Index, Singapore ranked third in the world behind New York and London (“S’pore rises to No.3,” 2008). Singapore now finds itself having to compete head-on with the best economies in the world. To enable it to compete with the best economies, it needs to recognize that its economy depends upon ever increasing consumption, including imagery consumption (Harvey, 1989). Visual images have the power not only to inform consumers, but to influence. They create the consumers’ needs and also have the power to satisfy those needs. Edmund Feldman, Professor of Art went on to say that the entire history of art testifies to the communicative power of man-made images (Feldman, 1978). However, the training of visual language skills in schools for the young lacks behind the accelerated growth of the visual economy and is directed almost solely to those aiming to be artists and designers. The majority of graduates, especially business graduates who will be the future driving force for the economy, have been and are entering the workforce lacking in the necessary literacy in the visual language. It must be understood that business and communication strategies that take full advantage of the power of the visual language have much to gain in our visual economy. Our young need to be equipped with this new skill to gain the competitive edge when they enter the workforce.
What is this visual language and what is its significance? According to Wikipedia, “a visual language is a set of practices by which images can be used to communicate concepts.” Art educationist Mary Stankiewicz described “visual art as language and literature, as a means of expression and communication as well as a body of knowledge, more furniture for the mind” (Stankiewicz, 2000). Edmund Feldman once said, “Art is a language of visual images that everyone must learn to read…an individual who cannot understand or read images is incompletely educated. Complete literacy includes the ability to understand, respond to, and talk about visual images” (Feldman, 1982). To render the language of the visual arts comprehensible and to secure meaning from the visual forms, “one must understand the symbolic and syntactical forms they present” (Eisner, 1971). An understanding of the visual language can lead to the development of artistic intelligence which Rudolf Arnheim referred to as the “intelligence of visual perception” (Arnheim, 1969). This artistic intelligence can be nurtured in the classroom for all students as a part of the general education, a position held by the NAEA and many educators (Benz, 1968; Kohl, 1981; Schubert, 1986). Much research has been done and literature written from Jean Piaget to Richard Suchman on the cognitive processes and development through instruction (Suchman & Aschner, 1961), and on the significance of nurturing artistic intelligence (Arnheim, 1969; Bruner, 1961; Eisner, 1967). Ann Barry further advocated the need for “critical visual awareness” which she defined as “visual intelligence”, a capability which can be “developed and exercised in order to think more creatively and to better comprehend the pattern of forces that govern our existence” (Barry, 1997). It is based on this background and understanding that the following general elective course was designed to nurture the artistic intelligence in students, namely, the ability to see in a new way, to perceive with the intent of finding meaning, to move fluidly between verbal and visual modes of thought, to engage in problem solving, and to create visual messages that have impact. It is structured for non-art and design students through the learning of the visual language.
APPROACHES FOR THE TRAINING OF VISUAL LANGUAGE AT NTU
This paper studies the development of visual language skills in a general elective course entitled “Creative Use of the 2D Media”. Approved by NTU’s Academic Board, this 3-academic unit course was introduced in the July 2002 semester. It is available as a general elective to all NTU undergraduates with the objectives of inculcating visual literacy in the students. The course aims to lay the foundation for their visual perception – how they make sense of images, how they recognize, interpret and analyze visual messages, how they develop their aesthetic sense, how they become more visually aware and more sensitive to their surroundings, and how they can become more effective visual communicators. Demand for the course from students has been very high and the course in one class section has been offered and
86

GLOBAL JOURNAL OF BUSINESS RESEARCH ♦ VOLUME 4 ♦ NUMBER 2 ♦ 2010
fully subscribed every semester since it was introduced. The demand is such that the maximum class size allowed has been increased from 40 to 50 for the last three years. The majority of the students who elected for this course are Business, Accountancy and Engineering students. Surveys on students enrolled in this course indicated that the majority of them had very little or no background in the visual arts when they elected for this course. Students attend a 3-hour lecture-cum-tutorial session every week for 12 weeks. The following is the learning experience of the author, who has taught this course since its inception. Learning to See in a New Way In this course, students are first introduced, through carefully selected examples, to the persuasive power of visual images and the impact they have on how we think and feel. They learn the art of seeing purposefully and in a new way. This approach follows that of Aldous Huxley, author of the Brave New World, who summed up his method for achieving clear vision with the formula: “sensing + selecting + perceiving = seeing” (Lester, 2001). To him, to sense is to let the eyes and the nervous system do their work. Then comes selecting which is to isolate a specific part of a scene to focus on. It is a conscious, intellectual act. Finally, to perceive is to make sense of, and find meaning in, what one selects. This calls for sharper mental activity. This combination of sensing and mental activity is the art of seeing, an approach also espoused by well-known theorist Rudolph Arnheim, who argued that perception itself is cognitive. It involves “active exploration, selection, grasping of essentials, simplification, abstraction, analysis and synthesis, completion, correction, comparison, problem solving…” (Arnheim, 1969).
Following the introduction to the art of seeing in a new way, students learn the underlying elements and principles of design which are the language of images. They learn to understand how these can help them to perceive, and subsequently to interpret, the visual messages. As Ann Barry, in her book Visual Intelligence, so aptly put, “The language of images, grounded in the stuff of perceptual experience, affects us directly and involves instincts and emotions, before the linear logic derived from language can be imposed on it” ( Barry, 1997). Students thus learn that design elements such as a line can create a mood and can be used as an organizer and to add texture; that a shape can sustain interest, organizes and be a conceptual tool; that a type can convey mood, implies meaning and can be used to create shapes; and that texture, being the visual and tactile surface appearance, can be used to strengthen a design idea. They learn that color and value can create mood, draw attention, create movement and direction, and can also have cultural connotations and emotional appeal. Students also learn the basics of the design principles which state that the proper structure of the design elements can have a significant impact on the viewer. For example, elements that are placed to achieve balance create a more stable mood as opposed to the tension created by unbalanced elements. Different elements in sizes, shapes, textures, values and colors can be used to create contrast to strengthen an idea. Unity is the skillful coordination of design elements so that each works well with the others to achieve “the whole is greater than the sum of its parts”. The composition of elements in the foreground, middle ground and background, and lightness and darkness can create depth and illusion of perspective. Students are also introduced to the concept that visual hierarchy creates eye movement for the viewers and allows visual messages from a single image to be prioritized. Manipulation of positive and negative space makes all space active, interactive and interdependent, and can be used to imply meaning (Peterson, 1996; Landa, 1998). In addition, Gestalt theories remind us that vision is a creative experience, not simply an act of seeing. Our eyes group information by similarity, proximity, continuity and common fate. A page must be looked upon as a unified whole, the sum of all the parts (Lester, 2001).
Students are also exposed to a brief history of the design movements from the Arts and Crafts Movement to Post-modern (Heller & Chwast, 1988). The aims are to identify the visual language used in the various design conventions of the past and to learn from tradition the reasons for the strategies, styles, techniques, and past solutions to recurring design problems. An illustrated example is Surrealism, a style that had
87

S. K. Pun Global Journal of Business Research ♦ Vol. 4 ♦ No. 2 ♦ 2010
pervasive influence on luxury product advertising in the twentieth century. Students are shown how surrealistic imagery in ad which combines highly realistic style and reality-defying content is a particularly effective way of attracting the spectator’s eye. A commercial for Tagheuer watch Success is a Mind Game is highlighted to illustrate how surrealistic images are continued to be used in today’s commercial and are modeled deliberately on the works of well-known surrealist painter like René Magritte – high art to high quality watch. Through more illustrated examples, students further learn how to perceive visual images created by advertisers with the intent to persuade. This form of visual persuasion encompasses its own sets of visual language found in the semantic and syntactic properties of images. The type of semantic properties of images classified by American philosopher Charles Sanders Peirce as iconic and indexical signs is adopted in this course. Peirce’s system of iconic sign which is characterized by some form of similarity or analogy between the sign and its object is firstly introduced (Messaris, 1997). Many examples are projected on the screen in the classroom to enable students to identify iconic signs. They are followed by examples of iconic signs that advertisers used to add meaning over and above the message in an ad. Discussed are the intended objectives of the advertisers to attract attention, elicit a desire and reaction and/or change opinions in order to induce a behavioral change or action on the target audience. Students’ attention is drawn to the implications from imagery that deploys, for example, sex and gender; style and social status, style and youth; surrealism and visual metaphor and violation of reality. They also learn that the technical orientation of the subject in an image which can also alter the perception of the viewer. For example, a subject viewed from a low angle projects a more authoritative look while a child viewed from a high angle gives a subservient look; a close-up shot enhances details while heightening the drama; and a head-on with direct eye gaze draws viewers’ immediate attention. Peirce’s system of indexical sign which is caused by its object and serves as a physical trace pointing to the object’s existence is then introduced. Images in photographs, videos and films are classified according to Peirce’s category of signs produced as physical traces of their objects (Messaris, 1997). These images are often used by advertisers as documentary evidence of an advertisement’s point. Examples of photos and videos showing interviews of satisfied customers imply a product’s approval and when a celebrity is used in an ad, his/her endorsement of the product is implied. Following the semantic properties of images, students are introduced to the syntactic properties of images, another form of visual persuasion frequently used by advertisers. This is what Paul Messaris called visual syntax. It is concerned with the interrelationships among the elements in visual images as they combine to form larger meaningful units. Students are drawn to the understanding that when images are juxtaposed next to one another, a connection between these images can be created in the viewer’s mind to imply analogy, causality, contrast and/or generalization (Messaris, 1997). Advertisements and TV commercials are used as examples to help students understand these concepts. At the same time, students are called to share what they think are the conceptual connections created by these advertising images. One of the examples used is the commercial by Apple Computer for its first launch of Macintosh in 1984. Students also learn how products are packaged to communicate their value to their targets and to serve as silent salesmen. Some of the marketing tactics contemporary designers use in packaging design are illustrated. For example, for products that claim to be pure and natural and possess certain eye appeal, the use of clear containers to allow the ‘natural’ color of the food to come out, and the use of design labels that project healthy and homemade environments are added on to further appeal to those who are health conscious. Other illustrative examples are used to show how colors, fonts, illustrations, and photographs are employed in contemporary packaging to infiltrate the consumer’s body, mind and soul, and to appeal to the shopper’s social status and lifestyle (Heller & Fink, 1996). Graphic pattern or image called Product Uniform designed to be seen on packaging over long distance, together with the approach and the distance at which key messages must be legible on packaging referred to as Effective Reading Sequence
88

GLOBAL JOURNAL OF BUSINESS RESEARCH ♦ VOLUME 4 ♦ NUMBER 2 ♦ 2010
are highlighted and illustrated (Judd, Aalders & Melis, 1989). Their aims are to secure consumer’s attention and to reduce the competition from the adjacent brands on the shelves in the retail settings. To distinguish visual images used by advertisers with the intent to persuade and images used by journalists for news reporting, a lesson on photojournalism is introduced. Examples of world-renown news photographs are highlighted to illustrate the power of the single image that is able to lodge permanently in the viewer’s memory and reproduced across the world thousands of times. Eddie Adams’ frozen moment of the street execution of a Vietcong officer and the piercing eyes of Sharbat Gula, the young Afghan girl who appeared on National Geographic’s cover are two of these examples. Students also study how good news photographs communicate based on content and form (Evans, 1997) and how visual truths and visual manipulations can occur in photojournalism. Throughout the lecture-cum-tutorial sessions, visual images and commercials are used heavily as examples. They are projected onto the large screen in the classroom to act as illustrations, to draw attention and create interest and to create a memorable experience for the learners. Classroom sessions are designed to be highly interactive. Students are asked thought-provoking questions to draw out their comments and responses before being introduced to the subject knowledge. Questions are also used to guide and help students to perceive visual images. Special efforts are made to use a lot of witty remarks to create a fun and interesting learning environment.
Perceiving with the Intent of Finding Meaning
During the course, students are encouraged to find meaning in a visual image and to interpret the visual message intended. This requires a higher level of cognition with regards to understanding the content, context and connotation. Terry Barrett, art critic-in-education argued that to interpret is to respond in thoughts, feelings and actions to what we see and experience, and to make further sense of our responses by putting them into words. Students are thus given the opportunity to discover for themselves the truth of the principles for interpretation put forward by Barrett, some of which are: “Interpretations are arguments…are persuasive. No single interpretation is exhaustive of the meaning of artwork and there can be different, competing, and contradictory interpretations of the same artwork. Interpretations are not so much absolutely right, but more or less reasonable, convincing, enlightening, and informative. Good interpretations have coherence, correspondence, and inclusiveness. Feelings are guides to interpretations…” (Barrett, 2000). So the act of interpretation is to build meaning to what we see and to use words to convey our thoughts and to share with others (Cromer, 1990). Michael Parsons went further to say that “artworks must be interpreted” and that “artworks are constituted as meaningful objects by both visual and linguistic materials of thought in interaction” (Parsons, 1998). Edmund Feldman summed up the discourse in teaching art which revolves around ideas and feelings we comprehend with our eyes. He contended that without a prior act of criticism, or visual interpretation, no really significant teaching can take place (Feldman, 1978).
Training to Move Fluidly between Verbal and Visual Modes of Thought
After five weeks into a semester, each student is given the opportunity to practice his/her perception and interpretation of a visual image selected by him/her. Each student then takes turn to verbally present to the class his/her analysis of the graphic image. Some of the questions students have to answer in their analyses are: “What is the message?”, “Does it communicate a clear message?”, “Does the visual form have any impact?”, “Whether it makes effective use of design elements and design principles in its layout?”, and “Is it a creative solution and why?” Comments from their peers are encouraged so that different approaches to interpretations are shared and learnt. Comments from the lecturer are also given in class and later by emails. Students also have to submit their analyses in writing. The objective is to sharpen their visual, verbal and written analytic skills enabling their verbal and visual modes of thought to move fluidly from one to the other.
89

S. K. Pun Global Journal of Business Research ♦ Vol. 4 ♦ No. 2 ♦ 2010
The students’ analytic skills in visual image are again assessed during the examination at the end of the semester. One of the questions which counted for 40% of the final grade is to perceive and interpret the visual message of a given graphic image based on content, context and connotation using the design elements and principles. Students have two hours to write their analyses and at the same time answer two other short essay questions on their understanding and comprehension of the subjects learnt in the course.
Engaging in Problem Solving
During the semester, students form themselves into groups of four each. Their assigned projects involve hands-on creation of the promotional materials for an event, a company or a new product using a poster and an invitation. They have to work in a group to firstly define the design problem and to analyze it. They then brainstorm to generate possible solutions, analyze each of these solutions and select the best creative solution for their final design. When coming up with the creative solution, they need to work out the purpose of the message, the target audience and write the appropriate headline and body copy. For the design of the visuals for the message, they need to work towards an original and creative solution and also be concerned with good and appropriate use of design elements and principles. Their final design submissions can be either using the computer or any other materials such as paper or cloth cuttings, collage or color pencil illustrations.
Finally, they are required to present their solutions in class in addition to a written report. The report is expected to include how the group came up with the creative solution for the project; the intended message to be communicated; the visual form employed to create impact and how and why the design elements and principles are or are not employed in the design layout. This provides students the opportunity to further familiarize themselves with the visual language they have learnt and to apply it to their solutions in both visual and verbal form. This act of creating encourages students to explore their ideas, feelings, and experiences and synthesize them into meaningful visual and verbal expressions. Comments from their peers and lecturer are employed to challenge and strengthen their arguments. The goal is to nurture effective visual communicators who can produce powerful images that others can understand and remember (Lester, 2001). Also required in the report is one paragraph on individual contribution to the project. This is to enable appropriate assessment of individual effort.
STUDENTS’ PERFORMANCE
Analyses of Graphic Images
The average performance of the students, according to their major, in the analyses of graphic images was studied for years 2006 to 2008. Their performance in percentage scores during the course (CA1 or continual assessment 1) and during the examination is shown in Figure 1 and Figure 2 respectively.
Based on the results in the year 2006 to 2008, it was found that for the coursework (CA1) which involved verbal and written analysis of a graphic image of the student’s choice, there is no statistically significant difference in the performance of students from the different disciplines. However, Business/Accountancy students scored slightly better than the rest. Business and Accountancy students scored an average of 77%; Engineering students scored 73% while Communication Studies/Humanities students scored 75%. For the examination which involved only written analysis of a given graphic image, Business and Accountancy students scored an average of 74%; Engineering students 70% and Communication Studies and Humanities students 76%.
90
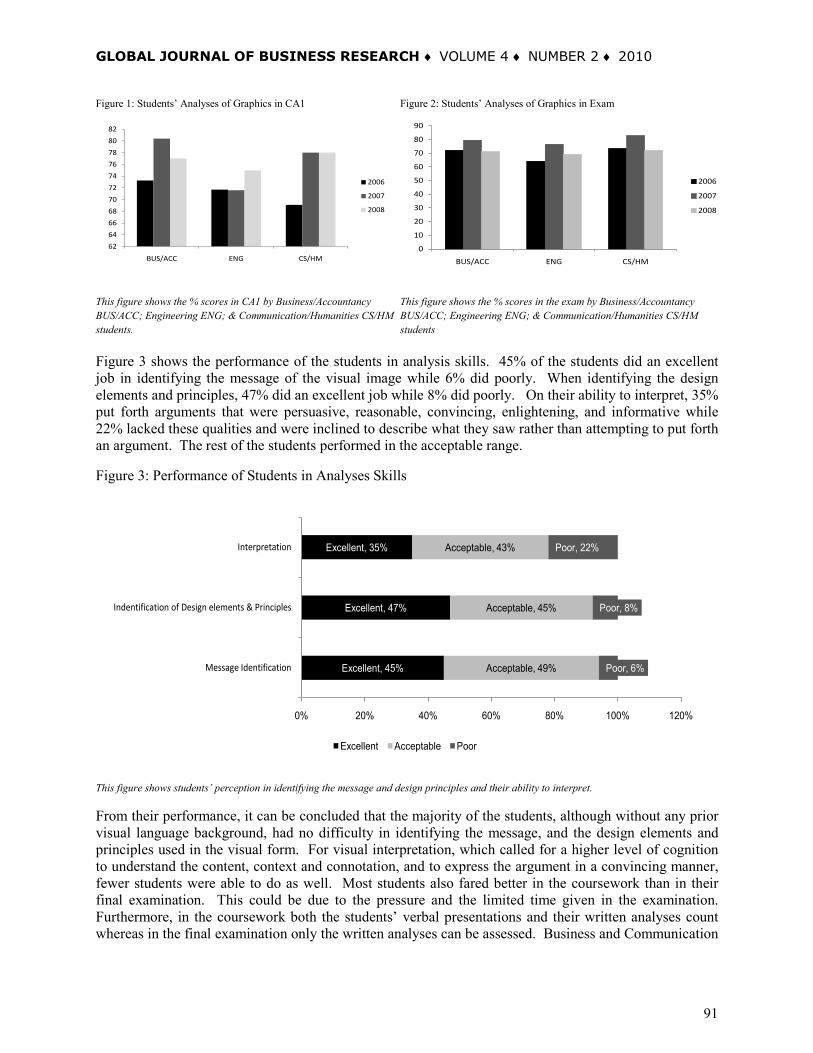
GLOBAL JOURNAL OF BUSINESS RESEARCH ♦ VOLUME 4 ♦ NUMBER 2 ♦ 2010
Figure 1: Students’ Analyses of Graphics in CA1 Figure 2: Students’ Analyses of Graphics in Exam
62
64
66
68
70
72
74
76
78
80
82
BUS/ACC ENG CS/HM
2006
2007
2008
0
10
20
30
40
50
60
70
80
90
BUS/ACC ENG CS/HM
2006
2007
2008
This figure shows the % scores in CA1 by Business/Accountancy BUS/ACC; Engineering ENG; & Communication/Humanities CS/HM students.
This figure shows the % scores in the exam by Business/Accountancy BUS/ACC; Engineering ENG; & Communication/Humanities CS/HM students
Figure 3 shows the performance of the students in analysis skills. 45% of the students did an excellent job in identifying the message of the visual image while 6% did poorly. When identifying the design elements and principles, 47% did an excellent job while 8% did poorly. On their ability to interpret, 35% put forth arguments that were persuasive, reasonable, convincing, enlightening, and informative while 22% lacked these qualities and were inclined to describe what they saw rather than attempting to put forth an argument. The rest of the students performed in the acceptable range.
Figure 3: Performance of Students in Analyses Skills
Excellent, 45%
Excellent, 47%
Excellent, 35%
Acceptable, 49%
Acceptable, 45%
Acceptable, 43%
Poor, 6%
Poor, 8%
Poor, 22%
0% 20% 40% 60% 80% 100% 120%
Message Identification
Indentification of Design elements & Principles
Interpretation
Excellent Acceptable Poor
This figure shows students’ perception in identifying the message and design principles and their ability to interpret.
From their performance, it can be concluded that the majority of the students, although without any prior visual language background, had no difficulty in identifying the message, and the design elements and principles used in the visual form. For visual interpretation, which called for a higher level of cognition to understand the content, context and connotation, and to express the argument in a convincing manner, fewer students were able to do as well. Most students also fared better in the coursework than in their final examination. This could be due to the pressure and the limited time given in the examination. Furthermore, in the coursework both the students’ verbal presentations and their written analyses count whereas in the final examination only the written analyses can be assessed. Business and Communication
91

S. K. Pun Global Journal of Business Research ♦ Vol. 4 ♦ No. 2 ♦ 2010
Studies students generally scored slightly better than Engineering students. This could be due to the nature of the former’s subjects which require more reading and writing while Engineering subjects tend to require more numerical understanding.
Creation of Design Works
For the hands-on group projects, 54% of the teams showed good understanding of what constituted creative design using appropriate visual language to express their message. The designs and layouts were unique, artistic, surprising and full of impact. Their reports were well-written with indications of thorough brainstorming for concept and how the design evolved in the process. These projects can be said to be on par with that of professional designers. Appendix 1 and 2 show two examples of group projects in this category. The project in Appendix 1 was created by four Accountancy students, while the project in Appendix 2 was by two Business and two Linguistics and Multilingual students. From these, it is clear that all of them have applied effectively what they learnt in the course in the creation of the design works with successful results. 34% of the teams turned out works and reports which indicate that these students had the potential to be trained as designers. While they had attained proficiency in the visual language, they needed more experimentation to improve their results. The remaining 12% of the teams performed not so well, showing that they still lacked understanding of what constituted an effective message and a visual form that had impact.
CONCLUSION AND IMPLICATION
This paper first argued for the need to provide training in visual language skills in business students to give them an additional competitive advantage. It then described the work done in exploring if and how well a course on the creative use of 2D media can develop such skills in undergraduates, particularly in business students. The results show that undergraduates, in particular Business students, even though they may not have prior art or design experience, can learn the visual language well and apply this for effective visual communication. A vast majority of the students were able to identify messages and design elements and principles. They were also able to interpret the visual messages and put forth their arguments. Their creative design projects were also very promising. About half of them created design works that were on par with professional designers and another third exhibiting a potential to be trained as designers.
Basic skills in the visual language help students to see, to comprehend and find meaning in what they see and to express their thoughts in verbal, written and visual ways. These skills are essential not only in marketing services and products but in effective communication. It is also clear that almost all undergraduates have the innate ability to acquire basic concepts of the visual language and to apply these effectively, as with the verbal and written skills. The work presented here does not go into the study of how, and to what extent, the creative processes used by the teams that excelled in their creative design works are different from those used by the teams that did not do well; and whether and how these affected the outcome. Such a further study will be helpful to better refine the pedagogical approaches that can be more effectively employed in nurturing visual language skills.
In an age of intense economic competition, a business graduate equipped not only with competency in the verbal and written languages but also in the visual language will be a more effective communicator particularly when it involves the mass market. Such a graduate has acquired an additional significant competitive advantage to meet the challenges of the new economy. A follow-up study on the extent of the effect the training of visual language skills offered in this course has on the subsequent careers of the Business graduates will certainly be very useful and informative.
92

GLOBAL JOURNAL OF BUSINESS RESEARCH ♦ VOLUME 4 ♦ NUMBER 2 ♦ 2010
APPENDIX
93

S. K. Pun Global Journal of Business Research ♦ Vol. 4 ♦ No. 2 ♦ 2010
94

GLOBAL JOURNAL OF BUSINESS RESEARCH ♦ VOLUME 4 ♦ NUMBER 2 ♦ 2010
REFERENCES
Arnheim, R. (1969). Visual Thinking. Berkeley: University of California Press, p. 13
Barrett, T. (2000). “About Art Interpretation for Art Education,” Studies in Art Education, vol. 42 (1), Autumn, p. 5-8
Barry, A. (1997). Visual Intelligence. Albany: State University of New York Press
Benz, J. (Chairman), Bealmer, W., Henry, E., McKibbin, M.A., & Peltz, A. (1968). “A rationale for the arts – the National Art Education Association. Art education, vol. 21 (1), p. 15-18
Bruner, J. (1961). The Process of Education. Cambridge: Harvard University Press
Cromer, J. (1990). Critism. Reston VA: National Art Education Association
Evans, H. (1997). Picture on a Page: Photojournalism, Graphics and Picture Editing. London: PIMLICO
Eisner, E. (1967). “Changing Conceptions of Artistic Learning,” The Elementary School Journal, vol. 68 (1), October, p. 23
Eisner, E. (1971). “Media, Expression and the Arts,” Studies in Art education, vol. 13 (1), Autumn, p. 9
Feldman, E. (1978). “Catalyst: The Arts,” Art Education, vol. 31 (7), November, p. 11
Feldman, E. (1982). “Art in the Mainstream: A Statement of Value and Commitment. Art Education, vol. 35 (5), September, p. 6
Harvey, D. (1989). The condition of postmodernity. Oxford: Basil Blackwell
Heller, S. & Fink, A. (1996). A. Food Wrap – Packages that Sell. PBC International, Inc.
Heller S. & Chwast S. (1988). Graphic Styles: From Victorian to Post-modern. New York: Harry N. Abrams, Inc., Publishers
Kohl, H. (1981). “It’s time to stop sacrificing the arts,” Learning, vol. 10 (3), p. 101-106
Judd, D., Aalders, B. & Melis, T. (1989). The Silent Salesman. Singapore: Octogram Design Pte Ltd.
Landa, R. (1998). Thinking Creatively. Ohio: North Light Books
Lester, P. (2001). Visual Communication. Wadsworth Publishing Company
Messaris, P. (1997). Visual Persuasion: The Role of Images in Advertising. California: SAGE Publications
Parsons, M. (1998). “Integrated Curriculum and Our Paradigm of Cognition in the Arts,” Studies in Art Education, vol. 39 (2), Winter, p. 113
Peterson, B. (1996). Using Design Basics to get Creative Results. Ohio: North Light Books
Schubert, T.E. (1986). “Art in Education: Five Rationales,” Art Education, vol. 39 (1), January, p. 41-43
S’pore rises to No.3 financial centre in global index. (2008). Straits Times, Sep.26, 2008, p. B37
95

S. K. Pun Global Journal of Business Research ♦ Vol. 4 ♦ No. 2 ♦ 2010
Suchman, R. & Aschner, J. (1961). “Perceptual and Cognitive Development,” Review of Educational Research, vol. 31(5), December
Stankiewicz, M. (2000). “Discipline and the Future of Art Education,” Studies in Art Education, vol. 41 (4), Summer, p. 305
BIOGRAPHY
Siu-Kay Pun started her career as a graphic designer in New York City. She later spent twelve years as TV Producer/Director and later as Executive Producer at Singapore Broadcasting Corporation. She is presently a Lecturer at the School of Art, Design and Media, Nanyang Technological University in Singapore. Her research interests center on visual literacy, visual language and visual communication. Her paper “Inculcating Visual Literacy to Meet the Professional Needs of Engineering Undergraduates” won her the Silver Award for Best Paper.
96

GLOBAL JOURNAL OF BUSINESS RESEARCH ♦ VOLUME 4 ♦ NUMBER 2 ♦ 2010
COMPANY MANAGED VIRTUAL COMMUNITIES IN GLOBAL BRAND STRATEGY
Laurent Arnone, University of Mons Olivier Colot, University of Mons
Mélanie Croquet, University of Mons Angy Geerts, University of Mons
Laetitia Pozniak, University of Mons
ABSTRACT
Nowadays, many international businesses are experimenting with virtual communities of consumers in order to foster relationships between them and their customers. However, analysis of their strategies has rarely been considered in the existing literature. In this framework, our paper aims at providing a better understanding of the creation process and the management of these kinds of communities at an international level. To this aim, in the first part of the article, we propose a typology making it possible to distinguish between three types of international community strategies. After that, we follow a case study research design (DSA) and set the focus on the analysis of the creation process of two virtual communities coordinated by an international brand and implemented in the UK and in France. This allows us to highlight the strategic reflection, the tools and the roles of the people involved in the implementation of a community strategy. These elements are then considered under the lens of international marketing theories.
JEL : M31
KEYWORDS: virtual communities, international strategy, DSA, consumption communities
INTRODUCTION
ince the mid ’90s, marketers have developed an interest in virtual communities, both in terms of psycho-sociological factors linked to the participation of internauts in these groupings (Bagozzi and Dholakia, 2002; Dholakia et al., 2004) and their marketing implications (Algesheimer and
Dholakia, 2006; Armstrong and Hagel, 1996; Kozinets, 1999; Brodin, 2000; Cova and Cova, 2001). Based on these analyses, numerous authors, mainly with a managerial background, consider virtual communities as a marketing tool that can be used by companies to foster the development of strong, reliable relationships with their customers (Armstrong and Hagel, 1996; McWilliam, 2000). Beside these “C2C” virtual communities (which emerged from consumer initiatives), the Internet landscape is changing and numerous “B2C” virtual communities have been created and managed by brands in order to gather their consumers together and incite them to brand loyalty. Academic literature relating to virtual consumer communities is mainly focused on people, their motivation and the consequences of their participation in virtual gatherings. The academic debate has neglected the managerial aspects related to the implementation of these actions by companies. More particularly in the globalization context, the integration of virtual communities in the international marketing strategy of the brand raises the question of the specificities of the communal approach, which could be implemented in different countries. This paper is articulated in 4 parts. First, we propose an overview of the literature about consumer communities. Secondly, we discuss the methodology used to implement our model. Then we set the focus on our case study, Organzettes. At last we discuss the conclusion and the limitations of the paper.
S
97
L. Arnone et al Global Journal of Business Research ♦ Vol. 4 ♦ No. 2 ♦ 2010
LITERATURE REVIEW B2C Consumer Virtual Communities The virtual community is often defined as a socio-cultural grouping that emerges when an adequate number of persons take part in public discussions during enough time and with enough emotions to build a network of human relationships inside the cyberspace (Rheingold, 1995). Previous research has set the emphasis on C2C virtual communities, but little has focused on consumer communities created by companies. Among these works, Armstrong and Hagel (1996) propose to categorize B2C virtual communities into 4 types depending on the needs they aim to fulfill: interest communities (allowing people to interact on the basis of a shared interest for a specific topic), relationship communities (inside which members share life experience and find emotional and social support), fantasy communities (allowing the consumer to get involved in a virtual world), transactional communities (which can foster commercial exchanges). Porter (2004) distinguishes commercial communities (related to the sale of products) from non-commercial communities. Ben Yahia (2006) spreads this typology by distinguishing non-commercial B2C communities that are brand- and product-based from those based on a theme related to the brand and its activity. Ben Yahia (2006) stresses that the latter do not constitute brand communities such as those defined by Muniz and O’Guinn (2001). Actually, these consumers share an interest for the same theme rather than for the brand sponsoring the virtual space in which their interactions take place. Community strategies constitute a new kind of relational tool, allowing brands to get closer to their consumers through their passions and to foster the creation of intimate and genuine relationships with them leading to affective loyalty (Cova and Cova, 2001). Actually, previous research has often highlighted the benefits that can be generated by the implementation of this tool in relational strategies (Brodin, 2000; McWilliams, 2000; Li and Bernoff, 2008). Armstrong and Hagel (1996, p. 135), namely stress that “by creating strong on-line communities, businesses will be able to build customer loyalty to a degree that today's marketers can only dream of”. Confirming practicians’ experience, recent research shows the positive impact of B2C consumption communities on consumers’ emotional involvement with the brand supporting the group (Casalò et al., 2008; Kim et al., 2008). This involvement with the brand is the first step leading to the development of a loyal relationship. Some authors have studied the motivations leading consumers to participate in this type of grouping (Dholakia et al., 2004; Raïes and Gavard-Perret, 2006). Dholakia et al. (2004) show that search for information, entertainment, social status and self-discovery are the main factors in members’ participation. International Consumer Communities Many companies use this type of community to assemble their customers. They offer a virtual space of exchanges based on a theme often linked to a consumption activity and want to gather people sharing a real interest in this activity. Companies try to take advantage of what Kozinets has called (virtual) consumption communities enabling people to gather around topics like wine, motorcycles, photography, etc. These are defined as “groups whose online interactions are based on an enthusiasm and a shared know-how linked to a specific consumption activity” (Kozinets, 1999). The sharing of a common interest is the basis to members’ identification and enables brands to assemble their customers (Sitz, 2006). A literature review related to communities (Armstrong and Hagel, 1996; McWilliam, 2000; Algesheimer and Dholakia, 2006; Li and Bernoff, 2008), and the accurate observations of community initiatives on the Web show that most B2C consumer communities are initiated by international brands.
98

GLOBAL JOURNAL OF BUSINESS RESEARCH ♦ VOLUME 4 ♦ NUMBER 2 ♦ 2010
In their study of the Warhammer community, Cova et al. (2007) analyze a global brand community and pinpoint the opportunity of dividing the collective framework into national “sub-communities”. The authors highlight the differences between the way the two sub-communities (France and US) see the brand. As far as we know, there has not been any other research aiming to identify the specificities of consumer communities in an international perspective, and no B2C community strategies have been studied in an international context. Regarding the literature as far as international marketing strategy and process are concerned, authors distinguish two different perspectives: standardization of the marketing strategy or adaptation to each local market. Beside the standardization degree, authors have also considered marketing process which relates to the degree of centralization of the decision-making process between the head office and the subsidiaries (e.g. Daniels, 1986; Ozsomer et al 1991). Above these two strategic extremes, authors highlight that the decision to go for standardization or adaptation and for centralization or decentralization is not a dichotomous choice. Indeed, managers have to find the right balance between these two situations (Quelch et Hoff, 1986; Harris, 1992; Vrontis, 2003; Croué, 2006). Considering the lack of a sound theoretical background on this topic, we propose to highlight the specificities related to the implementation and management of B2C consumer communities in the international context. Our research will attempt to attain two objectives: First, by developing a typology, we will identify the different ways of managing virtual consumer communities that can be considered by global companies. Secondly, we focus on a particular type of B2C virtual community from the typology: coordinated local community. By identifying the actors involved and tasks completed, we will try to improve understanding of the creation and management processes of international B2C virtual communities. METHODOLOGY Methodological Approach To improve understanding of a concept on which little research has been done, Yin (1994) suggests implementing an exploratory qualitative approach, namely by using case study methods. In the strategic process study context, Cova, Mazet and Salle (1994) show that an exploratory approach could be valuable in bringing about a better knowledge of the complex process of launching virtual communities. In order to come up with an accurate and reliable approach, our research is based on the DSA method (Decision Systems Analysis), developed by Capon and Hulbert (1975) in their paper studying the dynamics of the decisional process. Information collected through in-depth interviews with actors involved in the different levels of the process enables us to implement a descriptive schematization of the process that could lead to theorization. Capon and Hulbert (1975) suggest researchers implement a preliminary model of the investigated process, developed in the following section. Creating an International Consumer Community: Preliminary Model The first step in implementing a B2C virtual community, similar to every other marketing tool, should follow a strategic reflection. According to general marketing management literature, the definition of the marketing plan and tools are derived from an analysis of the business’s internal (objectives and available means, for instance) and external situations (competitors and consumers’ needs, for example) (Croué, 2006; Kotler et al., 2006). In this framework, the selection of the virtual community as a tool depends on its ability to successfully contribute to the marketing objectives (O’Dell, 1966), which are derived from the global organizational strategy (Croué, 2006). After that, the virtual community will be assigned specific objectives and persons will be designated in charge of the coordination (McWilliam, 2000).
99
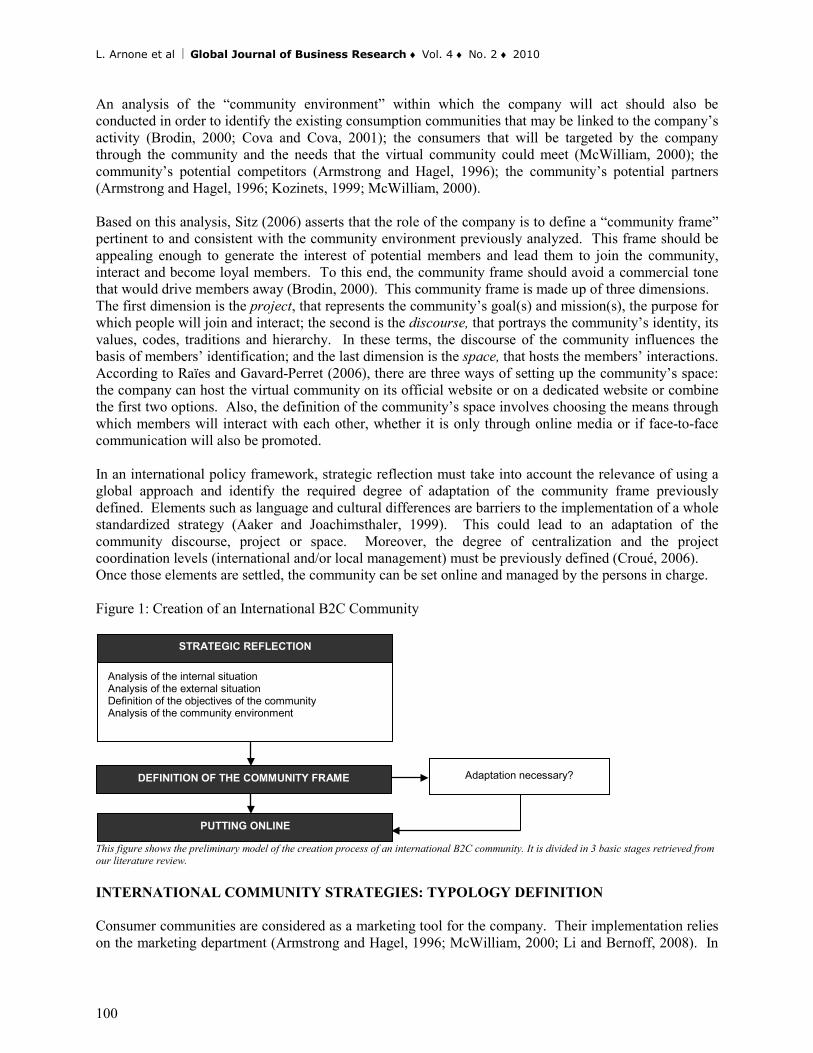
L. Arnone et al Global Journal of Business Research ♦ Vol. 4 ♦ No. 2 ♦ 2010
An analysis of the “community environment” within which the company will act should also be conducted in order to identify the existing consumption communities that may be linked to the company’s activity (Brodin, 2000; Cova and Cova, 2001); the consumers that will be targeted by the company through the community and the needs that the virtual community could meet (McWilliam, 2000); the community’s potential competitors (Armstrong and Hagel, 1996); the community’s potential partners (Armstrong and Hagel, 1996; Kozinets, 1999; McWilliam, 2000).
Based on this analysis, Sitz (2006) asserts that the role of the company is to define a “community frame” pertinent to and consistent with the community environment previously analyzed. This frame should be appealing enough to generate the interest of potential members and lead them to join the community, interact and become loyal members. To this end, the community frame should avoid a commercial tone that would drive members away (Brodin, 2000). This community frame is made up of three dimensions. The first dimension is the project, that represents the community’s goal(s) and mission(s), the purpose for which people will join and interact; the second is the discourse, that portrays the community’s identity, its values, codes, traditions and hierarchy. In these terms, the discourse of the community influences the basis of members’ identification; and the last dimension is the space, that hosts the members’ interactions. According to Raïes and Gavard-Perret (2006), there are three ways of setting up the community’s space: the company can host the virtual community on its official website or on a dedicated website or combine the first two options. Also, the definition of the community’s space involves choosing the means through which members will interact with each other, whether it is only through online media or if face-to-face communication will also be promoted.
In an international policy framework, strategic reflection must take into account the relevance of using a global approach and identify the required degree of adaptation of the community frame previously defined. Elements such as language and cultural differences are barriers to the implementation of a whole standardized strategy (Aaker and Joachimsthaler, 1999). This could lead to an adaptation of the community discourse, project or space. Moreover, the degree of centralization and the project coordination levels (international and/or local management) must be previously defined (Croué, 2006). Once those elements are settled, the community can be set online and managed by the persons in charge. Figure 1: Creation of an International B2C Community
This figure shows the preliminary model of the creation process of an international B2C community. It is divided in 3 basic stages retrieved from our literature review. INTERNATIONAL COMMUNITY STRATEGIES: TYPOLOGY DEFINITION Consumer communities are considered as a marketing tool for the company. Their implementation relies on the marketing department (Armstrong and Hagel, 1996; McWilliam, 2000; Li and Bernoff, 2008). In
Analysis of the internal situation Analysis of the external situation Definition of the objectives of the community Analysis of the community environment
STRATEGIC REFLECTION
Adaptation necessary?
PUTTING ONLINE
DEFINITION OF THE COMMUNITY FRAME
100

GLOBAL JOURNAL OF BUSINESS RESEARCH ♦ VOLUME 4 ♦ NUMBER 2 ♦ 2010
the context of a global company, the degree of centralization of the marketing policy will influence the liberty offered to local divisions to define their own objectives, strategies and marketing tools (Croué, 2006) such as implementing a consumer community around the brand. So doing, in case of a decentralized marketing policy, each subsidiary could initiate the development of a community. A contrario, the company could assemble its customers by coordinating the community initiative globally. In this context, we notice that the “non-geographical” dimension of virtual communities highlighted by several authors (e.g. Kozinets, 1999; Muniz and O'Guinn, 2001), can be limited by the choices made by the company initiating the community. We can identify 3 factors that could affect the geographical spread of these communities: the reference language chosen by the community organizers; the geographical target and the extent of marketing efforts made to recruit members of the grouping; the organization of gatherings enabling virtual community members to meet each other face-to-face. On the basis of these elements, we have analyzed company-initiated communities of 20 brands. This has led us to identify three types of international community strategies relying on two criteria: the geographical extent of the community (defined by its global vs. local characteristics) and the degree of centralization of the implementation (independently settled by a national subsidiary or coordinated by the parent company). These types of strategies are represented in Figure 2. Figure 2: Typology of Community Strategies on an International Scale
Figure 2 highlights the 3 types of international B2C communities
Independent local communities are initiated by each national subsidiary on their own according to the local marketing policy. The analysis of the tool relevance, its implementation and its control are locally carried out without any interaction with the parent company. Several consumer communities could emerge from the same brand without any consistency regarding the identity, the project or the place of interaction Ex.: Asics - www.asicslovesrunning.fr (France) and www.myasics.nl (Netherlands); A single global community is initiated and managed by the marketing head and aims to gather brand customers around a common project in a specific virtual space without any content or language adaptation regarding local specificities. The company wants to develop a unique identity. Ex.: Ray-Ban – Never Hide Community (www.Ray-Ban.com); At a middle stage, we can identify local coordinated communities that are a network of local initiated communities managed by the international marketing manager. This aims to federate consumers from different markets around a common project and to foster the creation of a unique identity, by locally adapting the interaction space, namely regarding the language. The implementation is managed at a global level, local subsidiaries are in charge of day-to-day management, and if necessary, the adaptation of the community frame to the local market (in terms of language and content, among other things)
GLOBAL COMMUNITIES LOCAL COMMUNITIES
GLOBAL MANAGEMENT LOCAL MANAGEMENT
Independent local communities
Asics, Ben & Jerry’s
New Balance, Yves Rocher, Pimkie, Nutella
Coordinated local communities
Weight Watchers, Fiskars,
Xbox, Fiat 500 Organza
Single global community
Laphroaig, Nike, Ray-Ban, Lego, Swatch
101

L. Arnone et al Global Journal of Business Research ♦ Vol. 4 ♦ No. 2 ♦ 2010
Ex.: Organza – www.Organzettes.fr (France) and www.Organzettes.co.uk (UK); The company’s choice as to the community strategy to implement relies on two factors: the opportunity to define a global community frame (depending on the uniformity of the international target and of the competitive environment, for instance) and the autonomy offered to local subsidiaries in the definition of their marketing policy. CASE STUDY: ORGANZETTES Case Study Choice The results presented in this paper derive from interviews analysis with different players involved in the implementation of a network of local communities coordinated by Organza (The identity of the community has been removed to guarantee anonymity), an international brand offering a wide range of sewing products and dry goods. There are two local versions of the community, one in France and another in the UK: www.Organzettes.fr and www.Organzettes.co.uk. These sewing-dedicated communities are globally coordinated at a European level and they are locally adapted, namely with respect to the language. They consist of brand blogs, each of which is maintained by a local ambassador, highly knowledgeable in this field. This successful initiative (based on the three criteria pinpointed by the interviewed managers: regular growth in membership, number of visits / day and number of contributions proposed by the members) regarding the target audience (sewing community) and the management techniques at a European level make this case study particularly interesting to investigate. This allows us to bring about a better understanding of the coordinated management strategy of communities at a global level and to contribute to a theoretical framework still missing in this field of research. Analysis of the Creation Process The implementation of the Organzettes community in France and in the UK can be divided into two stages: the first step consisted in strategy definition at a European level; the second step was the management and adaptation of tasks at a local level (see Figure 3). The implementation of the Organzettes community results from both internal and external analysis of the company at the global level. On the one hand, market analysis (1) should enable the company to value the community tool regarding its consumers and the relevance of implementing this strategy at a global level (are the customers homogeneous on this point?). The external analysis also pertains to the competitive situation in order to allow the company to distinguish itself. On the other hand, the implementation of such a tool relies also on the analysis of the internal situation (2) (marketing objectives, available resources and budget, for example). This first step of the process gives the company an idea of the utility and the chance of success of such a community strategy (3). The consumer community implementation must contribute to reaching company marketing objectives (5). For example, in the Organzette community, marketing managers allocated four specific overall objectives to the community tool: to reinforce consumer loyalty to the brand, to recruit new customers, to integrate the brand as ‘the’ partner of the sewing enthusiasts and to discretely put forward brand products. Marketing managers should ensure that the community tool is efficiently implemented and managed. It is necessary to be sure that the company has the adequate skills to develop and implement the community
102

GLOBAL JOURNAL OF BUSINESS RESEARCH ♦ VOLUME 4 ♦ NUMBER 2 ♦ 2010
(6) (knowledge of the webplatform, of the community strategies, and so forth). If the company is not able to do that, it has to find external partners contributing to the success of the community (7). Among these, choice of a qualified web agency is of prime importance. The implementation of Organzettes was from the start done in an international perspective, the marketing management opted for an international web agency able to ensure the implementation of the community in different countries. Once the partners are selected, it is necessary to choose the persons (inside or outside the company) who will be in charge of developing, launching and managing the community (8). In order to guarantee the consistency of the project in the different countries where it will be implemented, a “community cell” composed of 2 persons (European marketing director and Web agency head) has to be settled at the European level. Its role is to ensure the project coordination, to guide global community policy, to define the common community frame to the locally-implemented community and to see that tool-specific objectives are reached. The community cell is in charge of defining the community frame (discourse, project, space) (Sitz, 2006). As far as Organzettes communities are concerned, it was decided to implement a common community frame at the European level in order to guarantee the consistency of the strategy in the different countries where it will be carried out (9). It is composed of 3 elements: The first element is the global discourse allowing members to identify each other (sharing the passion of sewing, values related to creativity, brand presence and non commercial tone). According to literature recommendations (Brodin, 2000; Cova and Cova, 2001), the discourse should avoid a commercial tone in order not to impact authenticity of the approach and should avoid leading the members to leave. “This is an expert community. As a brand as such we are not too much present on the blog. Up to now we are present with some packages, or with articles written by ambassadors (advice, tips,…) about some products”. [European Marketing Manager] The second element is the global project to which the target audience could affiliate whatever its country of origin (exchange of information, personal work); At last, the third element is the global space allowing each member to express his own identity and to interact with other participants (Mairinger, 2008). Nonetheless, it is adapted in the different countries with the different languages. However, the multiple implementation of community initiatives in the different countries is not always possible (for instance, lack of required resources or budget), so the company should identify the countries where it wants to implement the community as a priority (10). The local market, its importance in the company’s turnover and competitive situation are criteria that the company can use to value the local priority (11). “France and the UK are the countries which offer the most important turnover for Organza in the sewing category […] it is interesting to notice that in these countries blogs generated by enthusiasts are highly developed. It’s time to react” [European Marketing Manager]. Once the countries are chosen, local actions can be carried out. The local managers are only involved in the process when the countries are selected and the common community frame is implemented (12). At this stage, their role is to carefully analyze the community environment in the selected countries (existing C2C and B2C virtual communities, their strengths and weaknesses) (13) and identify potential partners (14). Indeed, the working of the community requires collaborations with partners from the consumption field concerned (Kozinets, 1999) such as dedicated events organizers, virtual and physical C2C communities involved in the community environment. At this level the European community cell, in collaboration with local managers, has selected the local community ambassadors that will be responsible for the organization and the maintaining the community’s activity. Thereafter, the role of the local managers and the ambassadors is to maintain
103

L. Arnone et al Global Journal of Business Research ♦ Vol. 4 ♦ No. 2 ♦ 2010
relationships with potential partners and to ensure the integration of the community in the local community environment. “The ambassadors are themselves popular bloggers in the sector, with online relationships networks and they can integrate the brand blog in the existing network” [European Marketing Manager]. Moreover, besides the general objectives defined by the European management, the community can also play a specific part in the local marketing strategy (15). Based on the analysis of their “community environment” and on the local company’s objectives, local managers can adapt some elements of the community. So doing, the Organzettes community content management in France or in the UK has been adapted in terms of local news of the brand (16). “At the European level the general guidelines to follow are decided, and after that they make the adaptations at the local level […] it can pertain to newsletter content, or to a promotional plan specific to each country” [European Marketing Manager]. Other adaptations related to the activity of the community (games, contests), to the environment (fairs dedicated to sewing), or members’ local preferences (sewing, embroidering, patchwork) could also be implemented by local members in charge of the community (ambassadors and marketers).“For example in the UK, at Christmas, we talk about that since September, while in France, this will not come up before October or November. We need to talk about that earlier on the English blog” [Agency Project Leader]. All these adaptations are supervised by the European management, guaranteeing the consistency between both communities. Finally, the virtual community can be set online (17) and its day-to-day management can be ensured by local teams (local marketing director and ambassador) (18). As a last stage the community is monitored at both local and European levels (19). Managers then assess the necessity to modify the objectives and the frame of the community. DISCUSSION Specificities of International Community Approaches Internet is a very attractive tool for companies acting on international markets (Prashantham, 2003). While numbers of international companies interested in community strategies are growing, it seems interesting to bring insight into creation and management strategies of international B2C virtual consumer communities. Strategic aspects of B2C virtual community management highlighted by McWilliams (2000) along with existing literature on international marketing strategies (e.g. Buzzel, 1968; Van Mesdag, 1987; Aaker and Joachimsthaler, 1999; Quelch and Hoff, 1999; Vrontis, 2003; Croué, 2006), have allowed us to identify different international B2C virtual community management strategies and to set the focus on their respective strengths and weaknesses. The choice among these strategies can namely be influenced by the characteristics of the target market of the company. The case study highlights the implementation of a community segmentation (Kozinets, 1999) aiming to assemble consumers based on their passion for a given consumption activity. This type of segmentation can lead to the identification of an international market segment regarding which the company can carry out a united strategy (Hofstede et al., 1999). The implementation of coordinated local consumer communities could be relevant in this context.
104

GLOBAL JOURNAL OF BUSINESS RESEARCH ♦ VOLUME 4 ♦ NUMBER 2 ♦ 2010
Numerous international companies have launched their own virtual communities in order to federate their customers on a sharing and/or collaboration and/or exchange platform. Nevertheless, the implementation of the community tool at a global level requires a complicated decision-making process that has been neglected by the academic literature. In this context, our research aimed to reach two main objectives. O1: Typology of B2C international virtual communities The study of the strategies of a global brands sample leads us to identify three approaches to implement when creating a B2C virtual community at an international level: independent local communities, coordinated local communities and the single global community. The typology we proposed in this paper is different from the previous research regarding classification (Armstrong and Hagel, 1996; Dholakia et al., 2004; Porter, 2004; Ben Yahia, 2006). Actually, we categorized B2C virtual communities regarding their strategic management characteristics. Moreover, we have included an international dimension and highlighted the importance of the non geographical aspect of the B2C virtual communities, whose implementation can be related to a local strategy. The identification of these 3 management modes of B2C virtual communities allows us to bring a better understanding of the strategic choices of international managers. This choice can be influenced by the company’s international structure, the degree of centralization of the marketing policy and the characteristics of the international target market. The case study, Organza, highlights the implementation of a community segmentation (Kozinets, 1999) aiming to assemble consumers based on their passion for a given consumption activity. This type of segmentation can lead to the identification of an international market segment regarding which the company can carry out a united strategy (Hofstede et al., 1999; Bille, 2003). Nevertheless, as shown in the case study of Organzette communities in France and in the UK, though sewing enthusiasts can be considered as an international segment, the analysis of the local community environment demonstrates some specificities (enthusiasts’ expectations, local activities, rituals and traditions, competition between communities,…) and requires the implementation of differentiated approaches in each country. This reactivity is even more important in the virtual world where the local community environments can change quickly (emergence of new virtual communities – C2C and/or B2C – , local activities, evolution of the consumer needs,…). Therefore managers should be aware of the importance of a local management of the community and its activities. In this context, the most relevant choice would be to implement coordinated local consumer communities. O2: Process, actors and parts: identification through the DSA Method Community Frame: between Standardization and Adaptation The study of the implementation of local coordinated communities, such as Organzettes, demonstrates a creation and management process at 2 levels, enabling us to precise our preliminary model: the global level aiming to define the common community frame of the local “sub-communities” and to guarantee the uniformity of the strategy on the different markets; the local level aiming to adapt the frame to the local characteristics of the market and of the environment, while respecting the boundaries previously defined by the European management.
105
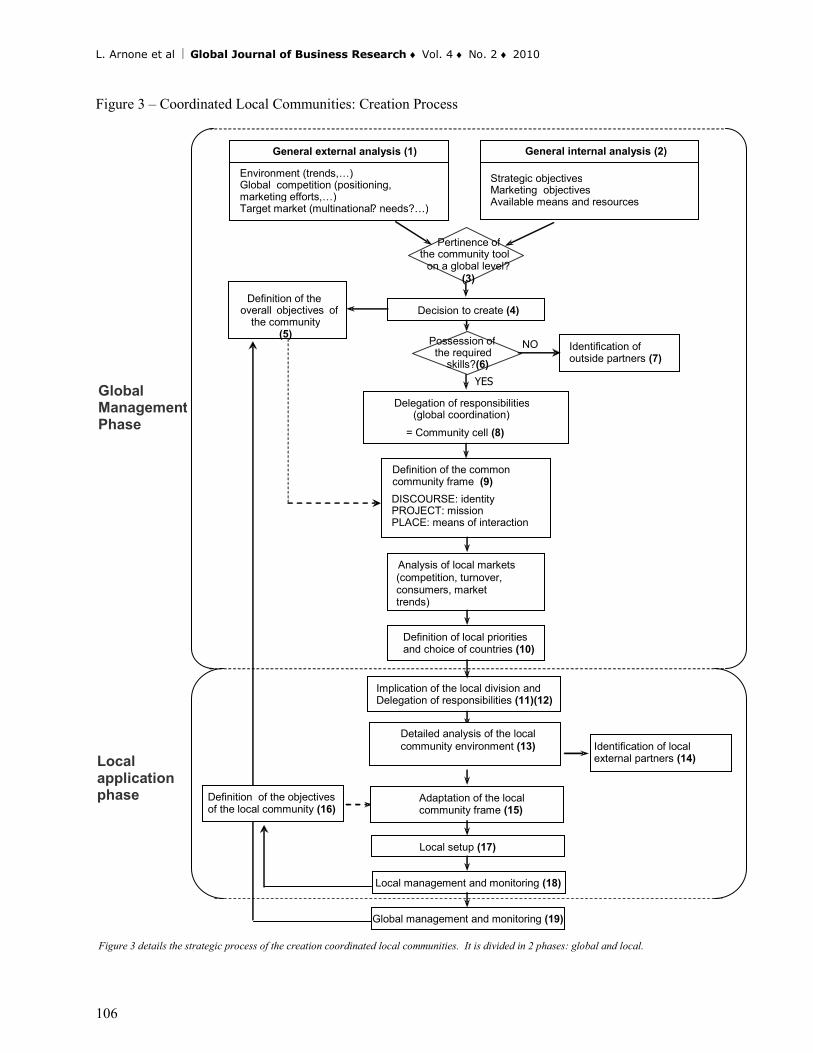
L. Arnone et al Global Journal of Business Research ♦ Vol. 4 ♦ No. 2 ♦ 2010
Figure 3 – Coordinated Local Communities: Creation Process Figure 3 details the strategic process of the creation coordinated local communities. It is divided in 2 phases: global and local.
Strategic objectives Marketing objectives Available means and resources
General internal analysis (2)
Pertinence of the community tool on a global level?
(3)
De cision to create (4) Possession of
the required skills?(6)
Identification of outside partners (7)
NO
Definition of local priorities and choice of countries (10)
Analysis of local markets (competition, turnover, consumers, market trends)
Implication of the local division and Delegation of responsibilities (11)(12)
Identification of local external partners (14)
Definition of the overall objectives of
the community (5)
Delegation of responsibilities (global coordination) = Community cell (8)
Local setup (17)
Local management and monitoring (18)
Definition of the common community frame (9)
DISCOURSE: identity PROJECT: mission PLACE: means of interaction
YES
Global management and monitoring (19)
Definition of the objectives of the local community (16)
Adaptation of the local community frame (15)
Global Management Phase
Local application phase
Environment (trends,…) Global competition (positioning, marketing efforts,…) Target market (multinational ? needs?…)
General external analysis (1)
Detailed analysis of the local community environment (13)
106

GLOBAL JOURNAL OF BUSINESS RESEARCH ♦ VOLUME 4 ♦ NUMBER 2 ♦ 2010
The organizational structure highlighted in this case study sets the focus on the “Europeanization” trend of the marketing structure such as stressed by Lewi (1995). According to Quelch and Hoff (1986), interactions between the two levels of decision-making make it possible to maintain the balance between “standardization” and “adaptation” of the community frame. Despite what we have expected regarding our preliminary model, each element of the global community frame is not locally adaptable. Table 1 summarizes the constitutive elements present in the global community frame and those that can be adapted. Table 1 – Global and Local Community Frames
Standardized elements GLOBAL COMMUNITY FRAME
Adapted elements LOCAL COMMUNITY FRAME
DISCOURSE Name of the community – Values, codes and traditions – Tone – Importance of the brand – Roles of the moderator – Content (general themes, calendar of events)
Partial adaptation of the content (depending on marketing objectives, members’ local preferences, cultural specificities)
PROJECT Sharing of a passion, exchanges
No adaptation
PLACE Platform – Design – Arborescence – Functioning – Physical encounters
Language of interactions, organization of encounters according to local events
This table shows global and local community time frames across three dimensions: Discourse, Project and Place The balance of compliance between standardization and adaptation allows the company to conciliate local adaptation, global brand management and the minimization of marketing costs. The latter two are considered, respectively by 81% and 75% of the companies, as main concerns of the international policy (Vrontis, 2003). Global brand management. Global brand building is a very tricky task to carry out. (Aaker and Joachimsthaler, 1999). It becomes even more difficult when the creation of a B2C consumer community leads to a company’s loss of control to the benefit of its customers. Those actively take part in producing content about the brand, which influences its building and its image (Mairinger, 2008). So, the lack of coordination between the different local communities could emphasize the differences between the brand image and its significations in the consumer’s mind on the international market (Cova et al., 2007). In this context, while allowing members to interact in the virtual space provided by the brand, the Organzette case study demonstrates that the creation of global strategic guidelines for defining the community frame makes it possible to concentrate the brand-hijacking mechanisms and to guarantee consistency at the global level. Moreover, the use of blogs as the main interaction tool between members allows a better control regarding the content, while letting the members act on their own in the virtual space. Cost minimization. As far as budgets allocated to the building of a virtual consumer community are concerned, the development of the community platform is the most expensive part of the process. The definition of a uniform community space at a global level (design, structure, functions), as in the case of Organzettes, enabled the company to reduce costs by splitting the investment on the different local initiatives. The adaptation margin of local managers (integrated in the process once the platform is defined) is related to the elements that do not impact the economy of scale (Quelch and Hoff, 1986). Process, Actors and Roles The study of the Organzettes creation process in France and the UK allowed us to identify the actors and to clarify the tasks and processes related to the implementation of coordinated local B2C communities (summarized in table 2). Actually, three main points are emphasized through the Organzettes case study and enable us to precise our preliminary model proposed in Figure 2.
107

L. Arnone et al Global Journal of Business Research ♦ Vol. 4 ♦ No. 2 ♦ 2010
First, we notice that the implementation of an international B2C virtual community requires a two-stage process: global and local. Besides making an overall analysis of both internal and external situations of the company, managers should be aware of the need of an analysis of local situations. As virtual communities can play a part in both the local and global strategies, the attribution of specific objectives can be carried out at these two levels as well as in monitoring results. Table 2 – Actors and Roles in Community Creation and Management
ACTORS ROLES
Global
level
European Marketing Directors
Evaluate the pertinence of the tool, define the objectives of the community, define the common community frame, coordinate local adaptations, define the budgets allocated to the community initiative,
Web Marketing Agency
Develops the common community platform as well as local versions, manages the technical aspects, analyzes the community environments, guides the marketing decisions, accompanies the local management, makes statistical analyses (number of members, number of visits, etc.)
Local level Local Marketing Directors
Define the local objectives, adapt the content and the calendar locally , identify local partners
Expert Ambassadors Write the first contents, provide new content (articles, photos and videos, answer questions), organize and facilitate contacts in the community (contests, encounters,…) on the basis of a calendar, recruit new members, get the community integrated into the world of consumption, legitimate and validate through expertise
Local Events Organizers
Partnerships allowing face-to-face encounters among the members (stands for the brand during events), collaboration in contests,
C2C Sewing Communities
Reference the community (hypertext links), participate n and contribute to the content, legitimate the community as a partner in the world of consumption
This table shows actors and roles in community creation and management at the global and local levels. Secondly, the study of local community environments is prominent regarding the consumer communities belonging to a specific consumption universe. Actually, the priority of the countries to target and the specificities of the local approach (e.g. adaptation of the community frame) are defined on the basis of this analysis. We can stress that the role of local actors (managers and ambassadors) is particularly important to integrate the B2C community into the existing community environment. The relationships with local partners such as C2C (real or virtual) groupings and event organizers are managed from this local level. Even if Internet makes it possible to implement the virtual platform from the parent company, it is necessary to carry out local action in the local community environments. As far as local community environment analysis is concerned, it could be relevant to involve local managers. Considering the importance of local actors, especially with respect to analyzing the local community environments that influence the selection of countries to prioritize, it would be advisable for Organza to involve local managers further upstream in the marketing process. Moreover, the necessity to define the community frame will be decided on the basis of the results of the analysis of these environments. In other respects, if local adaptations are always made under the control of the European marketing director, the launching of Organzettes communities in other countries in Europe, may complicate the supervision of different local adaptations. Then it would be appropriate to inform local actors of their degree of freedom in adapting the community frame by clearly and precisely defining the elements that can be adapted and those that must absolutely remain unchanged. This precaution would make it possible to remedy the lack of clarity that sometimes characterizes decentralized decision-making structures (Quelch et Hoff, 1996).
108

GLOBAL JOURNAL OF BUSINESS RESEARCH ♦ VOLUME 4 ♦ NUMBER 2 ♦ 2010
CONCLUSIONS AND LIMITATIONS Analyzing the implementation of Organzettes communities in France and the UK sheds new light on the managerial aspects of the creation and management of consumer communities. More particularly, this analysis makes it possible to highlight the particularities of these strategies on an international scale. Also, despite their international anchoring (based on being online on the Web and their accessibility to an international public), B2C virtual communities do not escape the principles of adaptation and standardization, characteristics of international strategies. Our goal is not to propose a standardized model to be used as a recipe ready-made for managers, but to bring to light the tasks and the actors implicated in setting up B2C virtual communities. The managerial orientation of this research is certainly a valid contribution both for its theoretical and practical aspects. Nevertheless, we must underline the fact that the results reported in this article have two major limitations. First, the typology is of an exploratory nature and its construction is mainly based on the observation of efforts set up by companies that do not make it possible to precisely define the strategic reflection that underlies their implementation. In this context, further study of the different international community strategies identified, could constitute an interesting contribution that would give managers and academics a more precise view of the different strategic options of international community approaches. Secondly, the elements put forward in this research come from a single case study and may not be representative. The diagram presented could differ according to the structure of the company, the sector of activity or the environment in which the company operates. Other studies would enable us to refine our empirical analysis and bring to light possible differences. It would also be interesting to identify the implementation processes specific to other types of international B2C virtual communities in order to identify the differences they present with respect to the processes highlighted in our work. REFERENCES Aaker, D. A. and Joachimsthaler, E. (1999), the Lure of Global Branding. Harvard Business Review, Nov-Dec., 137-144. Algesheimer, R. and Dholakia U. M. (2006), Do Customer Communities Pay Off ?. Harvard Business Review, Vol. 84 (11), 26-30. Armstrong, A. and Hagel, III J. (1996), the Real Value of On-Line Communities. Harvard Business Review, Vol. 74 (3), 134-141. Bagozzi, R.P, and Dholakia, U. M. (2002), Intentional Social Action in Virtual Communities. Journal of Interactive Marketing, Vol. 16 (2), 2-21. Ben Yahia, I. (2006), Non commercial B2C virtual communities: definition and classification. An Exploratory Qualitative Study. IADIS International Journal, Vol. 5, 1, 129-144. Bille, J. (2003), La Mondialisation et l’Organisation Internationale de la Publicité, Revue Française du Marketing, May, 192-193, 17-23 Brodin, O. (2000), Les Communautés Virtuelles: Un Potentiel Marketing Encore Peu Exploré. Décisions Marketing, 21, 47-56.
109

L. Arnone et al Global Journal of Business Research ♦ Vol. 4 ♦ No. 2 ♦ 2010
Buzzell, R. (1968), Can You Standardize Multinational Marketing ?, Harvard Business Review, Vol. 46, Nov/Dec, 102-112 Capon, N., and Hulbert, J. (1975), Decision Systems Analysis in Industrial Marketing. Industrial Marketing Management, 4, 143-160. Casaló, L. V., Flavián, C. and Guinalíu, M. (2008), Promoting Consumer's Participation in Virtual Brand Communities: A New Paradigm in Branding Strategy. Journal of Marketing Communications, 14:1, 19-36. Cova, V., and Cova, B. (2001), Alternatives Marketing, Paris, Dunod, 224p. Cova, B., Mazet, F., and Salle, R. (1994), From Competitive Tendering to Strategic Marketing: An Inductive Approach for Theory Building. Journal of Strategic Marketing, 2 (1), 29-48. Cova, B., Pace, S., and Park, D. J. (2007), Global Brand Communities Across Borders: The Warhammer Case. International Marketing Review, Vol. 24, 3, 313-329 Croué, C. (2006), Marketing international: Un consommateur local dans un monde global, De Boeck Université, 616p. Daniels, J. D. (1986), European Regional Management by Large U.S. Multinational Firms, Management International Review, Vol. 26, No. 2, 27-42 Dholakia, U., Bagozzi, R. P., and Klein, L. R. (2004), A Social Influence Model of Consumer Participation in Network- and Small-Group-Based Virtual Communities. International Journal of Research in Marketing, n°21, 241-263. Hofstede, F. T., Steenkamp, J.B., and Wedel, M. (1999), International Market Segmentation Based on Consumer-Product Relations, Journal of Marketing Research, Vol. 36, February, 1-17. Harris, G. (1992), International Marketing Centralization : the Case for Balance, European Business Journal, Vol. 4, No. 3, 50-54 Kim, J.W., Choi, J., Qualls, W., and Han, K. (2008), It takes a marketplace community to raise brand commitment: the role of online communities. The Journal of Marketing Management, Vol. 24, No. 3-4, 409-431. Kotler, P., Keller, K., Dubois, B., and Manceau, D. (2006), Marketing Management, 12th edition, Pearson Education, France. Kozinets, R. V. (1999), E-tribalized Marketing? The Strategic Implications of Virtual Communities of Consumption. European Management Journal, Vol. 17 (3), 252-264. Lewi, C. (1995), « Nouvelles Organisations Marketing Européennes : le Cas de Procter et Gamble », Décisions Marketing, No. 4, 79-86 Li, C., and Bernoff, J. (2008), Groundswell: Winning in a World Transformed by Social Technologies. Harvard Business School Press, 224p. Mairinger, M. (2008), Branding 2.0 – Using Web 2.0 Principles to Build an Open Source Brand. Electronic Markets, Vol. 18 (2), 117-129.
110

GLOBAL JOURNAL OF BUSINESS RESEARCH ♦ VOLUME 4 ♦ NUMBER 2 ♦ 2010
McWilliam, G. (2000), Building Stronger Brands through Online Communities. Sloan Management Review, Spring, 43-54. Muniz, A., and O’Guinn, T. (2001), Brand Community. Journal of Consumer Research, 27, 412-432. O'Dell, W. F. (1966), Theory or Research for the Marketing Decision-maker? Journal of Marketing, Vol. 30 (2), 52-53. Ozsomer, A., Bodur, M. and Cavusgil, S. T. (1991), Marketing Standardisation by Multinationals in an Emerging Market, European Journal of Marketing, Vol. 25, No. 12, 50-64 Porter,.E.C. (2004), A Typology of Virtual Communities: a Multi-Disciplinary Foundation for Future Research. Journal of Computer Mediated Communication, 10, Available at http://jcmc.indiana.edu/vol10/issue1/porter.html Prashantham, S.: 2003, ‘The Internet and International Marketing’, The Marketing Review 3, 403–418. Raïes, K., and Gavard-Perret, M.L. (2006), Vers une Meilleure Compréhension des Besoins des Participants à une Communauté Virtuelle de Marque. Actes du XXII° Congrès de l’AFM, Nantes. Rheingold, H. (1995), Les Communautés Virtuelles. Addison-Wesley France, Paris, 320p. Quelch, A., and Hoff, E. (1986), Customizing Global Marketing. Harvard Business Review, May-Jun, 2-12. Sitz, L. (2006), Communauté de Marque. Rôle des Membres Centraux dans son Emergence, sa Structuration et les Liens avec son Environnement. Thèse de doctorat en Sciences de Gestion, IRG, Université de Paris. Van Mesdag (1987), "Winging it in foreign markets", Harvard Business Review, No.January-February, pp.71. Vrontis, D. (2003), Integrating Adaptation and Standardisation in International Marketing: The AdaptStand Modelling Process, Journal of Marketing Management, Vol. 19, 283-305. Yin, R. K. (1994), Case Study Research: Design and Methods (2
nd ed.). Thousand Oaks, Sage
Publications. BIOGRAPHY Laurent Arone is a Ph.D. Student and works as a Teaching Assistant at the Warocqué School of Business, University of Mons-Hainaut, Belgium. He is affiliated to the Warocqué Research Center and his main research interests are in the fields of marketing communications and consumer behaviour, focusing on tribes and brand communities. He can be reached at Department of Marketing and Communications Warocqué School of Business - University of Mons-Hainaut, Place Warocqué, 17 - 7000 Mons – Belgium, Tel: + 32 (0)65 37 32 41 / Fax : + 32 (0)65 37 32 18, [email protected]. Angy Geerts works at the Warocqué Research Center, Warocqué School of Business, University of Mons-Hainaut. She is a Teaching assistant and PhD student in Marketing. Her research in progress concern luxury brands focussing on new luxury strategies and trading up consumption trend. She can be
111

L. Arnone et al Global Journal of Business Research ♦ Vol. 4 ♦ No. 2 ♦ 2010
reached at Department of Marketing and Communications, Warocqué School of Business - University of Mons-Hainaut, Place Warocqué, 17 - 7000 Mons – Belgium, Tel: + 32 (0)65 37 32 64 / Fax : + 32 (0)65 37 32 18, [email protected]. Mélanie Croquet is a Ph.D. and works at the Warocqué School of Business, University of Mons-Hainaut, Belgium. She is affiliated to the Warocqué Research Center and her main research interests are in the fields of corporate finance, focusing on financial structure of firms. She can be reached at: Department of Finance, Warocqué School of Business - University of Mons-Hainaut, Place Warocqué, 17 - 7000 Mons – Belgium, Tel: + 32 (0)65 37 32 45 / Fax : + 32 (0)65 37 32 18, [email protected]. Olivier Colot is a Ph.D. and works at the Warocqué School of Business, University of Mons-Hainaut, Belgium. He is affiliated to the Warocqué Research Center and his main research interests are in the fields of accounting, entrepreneurship and family firms. He can be reached at: Department of Accounting and Management, Warocqué School of Business - University of Mons-Hainaut, Place Warocqué, 17 - 7000 Mons – Belgium, Tel: + 32 (0)65 37 32 80, [email protected]. Laetitia Pozniak is a Ph.D. Student and works as a Teaching Assistant at the Warocqué School of Business, University of Mons-Hainaut, Belgium. She is affiliated to the Warocqué Research Center and her main research interests are in the fields of financial communications and the non regulated markets. She can be reached at: Department of Finance, Warocqué School of Business - University of Mons-Hainaut, Place Warocqué, 17 - 7000 Mons – Belgium Tel: + 32 (0)65 37 32 64 / Fax : + 32 (0)65 37 32 37, [email protected].
112

GLOBAL JOURNAL OF BUSINESS RESEARCH ♦ VOLUME 4 ♦ NUMBER 2 ♦ 2010
TOURIST SATISFACTION WITH MAURITIUS AS A HOLIDAY DESTINATION
Perunjodi Naidoo, University of Technology Mauritius Prabha Ramseook-Munhurrun, University of Technology Mauritius
Jeynakshi Ladsawut, University of Technology Mauritius
ABSTRACT
Tourist satisfaction is one of the most important concerns of competitive destinations as it considerably impacts on the tourist’s choice of the holiday destination, and the decision to visit the destination in the future. As a result, tourist satisfaction is one of the most investigated topics in the field of tourism due to its role in the survival of a destination. Several studies have researched tourist satisfaction; however, there has been limited investigation of tourist satisfaction with small island holiday destinations. This paper reports the findings of a study carried out to determine tourist satisfaction with the holiday destination Mauritius, a small island situated in the Indian Ocean. The method used consisted of a questionnaire distributed at the international airport among 400 departing international tourists. Findings are analyzed and the implications are discussed. JEL: M31 KEYWORDS: Tourist satisfaction, destination, tourism, Mauritius
INTRODUCTION
auritius, a small isolated island is performing relatively well as a tourism destination. Tourism has grown into one of the main pillars of the Mauritian economy. In 1973, international tourist arrivals amounted to 67, 994 and the figure rose by more than 10 times to reach 702, 818 in
2003 (Central Statistical Office, 2008). In February 2007, the number of visitors to the island was 72, 358 while in February 2008, a 7.5% increase was recorded representing 77, 763 visitors. In 2007, 906, 971 tourists visited the island and tourism receipts amounted to 40, 687 million rupees (approx. USD 1265 million) and provided direct employment to 26, 322 individuals (Central Statistical Office, 2008). However, due to the increasing number of existing and emerging destinations, it is important for Mauritius to remain competitive. Additionally, the economical conditions prevailing due to the current global financial crisis may impede on the growth of the industry. In order to maintain its competitive edge and continue to attract visitors, there is an increasing urgency for the destination to ensure that tourists are satisfied with the overall holiday experience as well as the specific range of products, services, events and activities available at the tourism destination. It is important to assess tourist satisfaction since various studies have shown the relationship between satisfaction and future purchase behavior (Juaneda, 1996; Kozak and Rimmington, 2000). Additionally, satisfied customers spread positive word-of-mouth recommendations about the destination to friends and relatives. Although several studies have measured customer satisfaction with tourism destinations, no studies were found on customer satisfaction with the destination Mauritius. Hence, this study aims to investigate tourists’ satisfaction with this small island destination. Based on the analysis, the intention is to discuss if tourists are satisfied with the specific destination attributes as well as with their overall satisfaction with the destination. As a result, the destination can choose to redress the weak attributes to remain competitive on the international tourism map. This paper employs the following organization: Firstly, the literature on customer satisfaction is reviewed with a focus on tourism. Next, the method of data collection including questionnaire design and sampling is exposed. Finally, the results are presented and the article concludes with a discussion of the research findings and its implications.
M
113

P. Naidoo et al Global Journal of Business Research ♦ Vol. 4 ♦ No. 2 ♦ 2010
LITERATURE REVIEW Customer satisfaction is one of the most investigated topics in the tourism and hospitality industry due to its role in the survival and future of any tourism products and services (Gursoy, McCleary and Lepsito, 2003, 2007). Customer satisfaction considerably impacts on the tourist’s choice of a holiday destination (Ahmed 1991), the consumption of products and services and the decision to visit the destination in the future (Stevens 1992). Studies have revealed that customer satisfaction is likely to produce positive behavioral intentions from customers such as positive word-of-mouth and repeat purchases (Saleh and Ryan, 1991; Barsky, 1992; Bojonic and Rosen, 1994; Yuksel, 2001; Kozak and Rimmington, 2000; Gursoy, McCleary and Lepsito, 2003; Karatepe, 2006; Andaleeb and Conway, 2006; Neal and Gursoy, 2008). Other investigations have also revealed that it is highly likely that a dissatisfied customer will not return to a company, and that repeat purchases impact directly on the finances of a business given that obtaining a new customer costs more than keeping an existing one (Dube, Renaghan and Miller, 1994; Stevens, Knutson, and Patton, 1995; Oh and Mount, 1998). Hence, customer satisfaction results in the reduction of marketing costs (Haywood 1989; Rosenberg and Czepiel 1983) and achieving customer satisfaction is a cost-effective way to run a business (Murray, 1992). Due to the imperative role of customer satisfaction, a great deal of research has focused on the topic (Yuksel, 2001).Customer satisfaction is defined as a psychological concept that involves the feeling of well-being and pleasure that results from obtaining what one hopes for and expects from an appealing product and/or service (WTO, 1985). Consumer satisfaction is therefore a post-consumption evaluation (Tse and Wilton, 1988) of the product or service received. It is also explained as a function of consumer perceptions (Neal and Gursoy, 2008). For example, customer satisfaction is synonymous of the perceive quality of products that are delivered to consumers (Vavra, 1997; Pizam and Ellis, 1999). Tourists as travelers experience products and services of several destinations, and their perceptions of a holiday destination is influenced by comparing the different facilities, attractions and level of service (Laws 1995). However, understanding and measuring customer perceptions is extremely complex as each individual has unique perceptions. Furthermore, measuring customer perceptions is even more challenging for a destination due to the characteristics of the tourism product. The latter is considered as a complicated phenomenon as it consists of a range of attributes, which makes it complex to describe and evaluate. According to Echtner and Ritchie (1993), a destination consists of a combination of tangible (i.e. ecotourism activities) and intangible attributes (i.e. hospitality of locals). Research indicates that several components of the destination contribute to tourist satisfaction such as destination services, recreational facilities, cultural tours, hotel services, restaurant services and host culture (Yuksel, 2001). Other attributes such as the destination’s natural environment, local culture and climate also affect tourist satisfaction (Pizam, Neumann and Reichel, 1978). Yuksel and Yuksel (2001: 337) argue that ‘various positive and negative experiences may occur as a result of [customer] interactions with these components [attributes], and it is the cumulative effect that will ultimately determine the tourists' overall evaluation of the experience’. Hence, it is important to measure tourist satisfaction with individual destination attributes as well as tourists’ overall satisfaction with the holiday destination. Assessing individual attributes will help detect areas of strengths or shortfalls within the destination. Customer satisfaction has been examined in a multitude of empirical and conceptual investigations within the marketing literature (Oliver, 1980; Parasuraman, Zeithaml and Berry, 1985; Gronroos, 1990; Cronin and Taylor, 1992) A review of the customer satisfaction literature expose numerous studies that have been carried out in tourism-related areas such as accommodation (Saleh and Ryan, 1991; Barsky, 1992; Barsky and Labagh, 1992; Bojanic, 1996; Karatepe, 2006), restaurants (Fick and Ritchie, 1991, Bojonic and Rosen, 1994; Dube, Renaghan and Miller, 1994; Gursoy, McCleary and Lepsito, 2003; Andaleeb and Conway, 2006); destinations (Chon and Olsen 1991; Yuksel, 2000; Kozak and Rimmington, 2000; Neal and Gursoy, 2008); tours (Ross and Iso-Ahola, 1991; Hughes, 1991; Hsieh, O’Leary and Morrison, 1994; Reisinger and Warysak, 1995). The literature depicts that most widely used model within the customer
114

GLOBAL JOURNAL OF BUSINESS RESEARCH ♦ VOLUME 4 ♦ NUMBER 2 ♦ 2010
satisfaction literature is the disconfirmation paradigm (Oliver 1980, 1981, 1989, 1993; Swan and Trawick, 1981; Oliver and Bearden, 1985; Oliver and Burke, 1999). After using the service, consumers compares their perceptions of the actual performance with their expectations (Neal and Gursoy, 2008).Consumers are likely to have a positive confirmation if the performance is superior to their expectations, implying that consumers are highly satisfied and will be more willing to purchase the same service in the future. On the other hand, if the actual performance is worse than expectations, consumers are likely to have a negative disconfirmation, where consumers will be dissatisfied. In this situation, consumers will not become loyal to the organization and are likely to look for alternative products for their next purchase (Neal and Gursoy, 2008). Previous studies on tourist satisfaction indicate that there is no agreement on when to measure satisfaction (Kozak and Rimmington, 2000). Some researchers have compared pre-holiday expectations with post-holiday perceptions (Duke and Persia, 1996) and others have collected data during the holiday (Gate and Phelps, 1989). The present study measures tourist satisfaction before the departure of tourist by assessing their opinions at the departure lounge of the airport. METHODOLOGY The quantitative method was selected for the study though the use of a questionnaire as it was a suitable way to reach a geographically dispersed audience at a relatively low cost. A one sheet survey was administered to a sample of 400 international tourists. The convenience sampling method was used where customers were approached at the departure lounge of the international airport during the period of March to April 2008. A pilot test was carried out among 30 tourists in well known tourist spots in the capital city and on public beaches. Following this exercise, the layout of the questionnaire was changed from three A4 pages to one A4 sheet questionnaire as the appearance of the instrument discouraged respondents as length was an issue. The questionnaire was therefore printed on both sides of an A4 paper. It also comprised of a short covering letter, and directions on how to fill the questionnaire. Questions 1-5 related to the background of tourists, questions 6-7 enquired about the expectations and the performance of the destination attributes. A list of 18 destination attributes was provided to tourists where they were asked to provide ratings on a 5-point Likert Scale. The last question was open-ended and sought to gather data regarding improvements to be made to enhance the satisfaction of tourists with the destination. RESULTS Out of the 400 questionnaires distributed, 339 were found usable for the study representing a response rate of 85%. Table 1 depicts the nationalities of the respondents. It can be noted that the largest segment came from the United Kingdom (37.4%), followed by South Africa (26.4%), Australia (21.4%) and France (12.1%) and this is primarily due the high frequency of flights departing for these countries at the time the survey was carried out. 43.7% of the respondents stayed in 4-star hotels and 37.2 % in 5-star hotels while only 5.9% resided in 3-star hotels. 13.2% of respondents stayed in non-hotel accommodation such as bungalows and flats. Among the nine different nationalities surveyed, it was found that most of the Australians, South Africans and British tourists preferred 4-star and 5-star hotels whereas most of the French tourists stayed in 3-star and non-hotel accommodation. This could be because the French tourists have close cultural ties with Mauritius including language. Due to these factors, French tourists feel comfortable to visit the destination as independent tourists and do not require the extensive facilities offered on the premises of luxurious hotels. The length of stay for the majority of tourists (37.1%) was 5-10 days, followed by 28% who stayed for more than 15 days, 27.3 % stayed for 11-15 days and 7.6% visited the destination for less than 5 days. Since Mauritius is a long-haul destination and the prices of airline tickets are relatively expensive, most
115
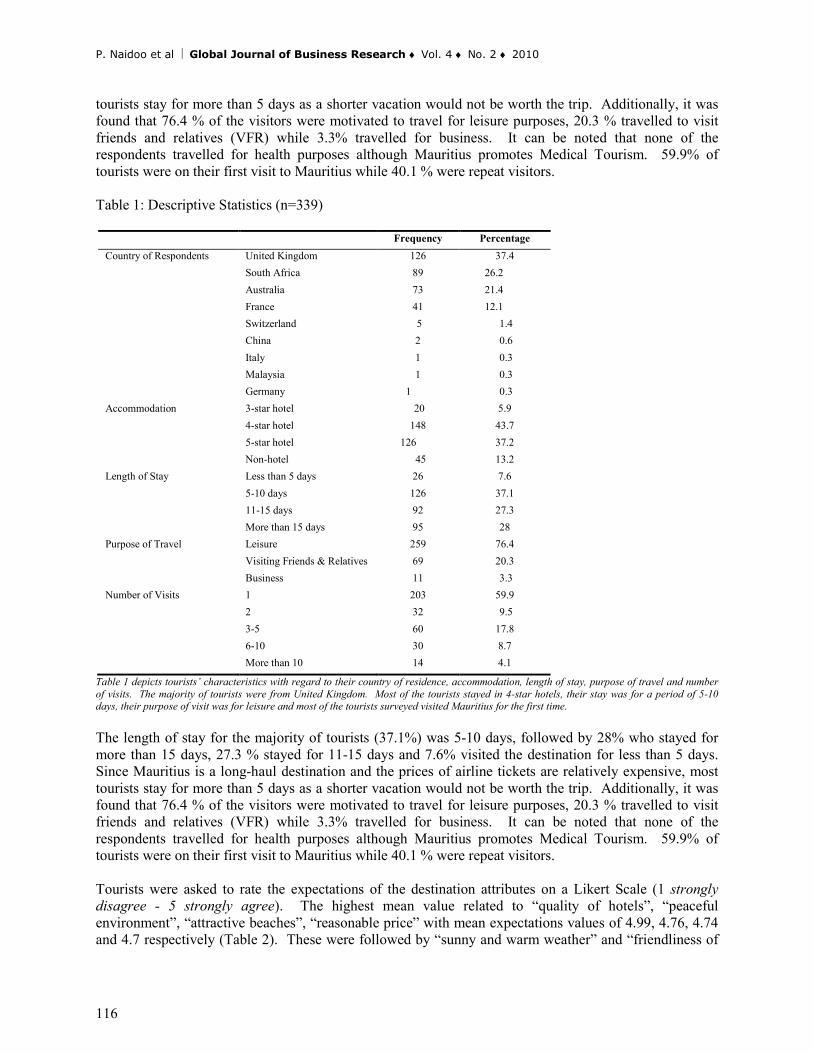
P. Naidoo et al Global Journal of Business Research ♦ Vol. 4 ♦ No. 2 ♦ 2010
tourists stay for more than 5 days as a shorter vacation would not be worth the trip. Additionally, it was found that 76.4 % of the visitors were motivated to travel for leisure purposes, 20.3 % travelled to visit friends and relatives (VFR) while 3.3% travelled for business. It can be noted that none of the respondents travelled for health purposes although Mauritius promotes Medical Tourism. 59.9% of tourists were on their first visit to Mauritius while 40.1 % were repeat visitors. Table 1: Descriptive Statistics (n=339)
Frequency Percentage Country of Respondents United Kingdom 126 37.4 South Africa 89 26.2 Australia 73 21.4
France 41 12.1 Switzerland 5 1.4 China 2 0.6 Italy 1 0.3 Malaysia 1 0.3 Germany 1 0.3
Accommodation 3-star hotel 20 5.9 4-star hotel 148 43.7 5-star hotel 126 37.2 Non-hotel 45 13.2 Length of Stay Less than 5 days 26 7.6 5-10 days 126 37.1 11-15 days 92 27.3 More than 15 days 95 28 Purpose of Travel Leisure 259 76.4 Visiting Friends & Relatives 69 20.3 Business 11 3.3 Number of Visits 1 203 59.9 2 32 9.5 3-5 60 17.8 6-10 30 8.7 More than 10 14 4.1
Table 1 depicts tourists’ characteristics with regard to their country of residence, accommodation, length of stay, purpose of travel and number of visits. The majority of tourists were from United Kingdom. Most of the tourists stayed in 4-star hotels, their stay was for a period of 5-10 days, their purpose of visit was for leisure and most of the tourists surveyed visited Mauritius for the first time. The length of stay for the majority of tourists (37.1%) was 5-10 days, followed by 28% who stayed for more than 15 days, 27.3 % stayed for 11-15 days and 7.6% visited the destination for less than 5 days. Since Mauritius is a long-haul destination and the prices of airline tickets are relatively expensive, most tourists stay for more than 5 days as a shorter vacation would not be worth the trip. Additionally, it was found that 76.4 % of the visitors were motivated to travel for leisure purposes, 20.3 % travelled to visit friends and relatives (VFR) while 3.3% travelled for business. It can be noted that none of the respondents travelled for health purposes although Mauritius promotes Medical Tourism. 59.9% of tourists were on their first visit to Mauritius while 40.1 % were repeat visitors. Tourists were asked to rate the expectations of the destination attributes on a Likert Scale (1 strongly disagree - 5 strongly agree). The highest mean value related to “quality of hotels”, “peaceful environment”, “attractive beaches”, “reasonable price” with mean expectations values of 4.99, 4.76, 4.74 and 4.7 respectively (Table 2). These were followed by “sunny and warm weather” and “friendliness of
116
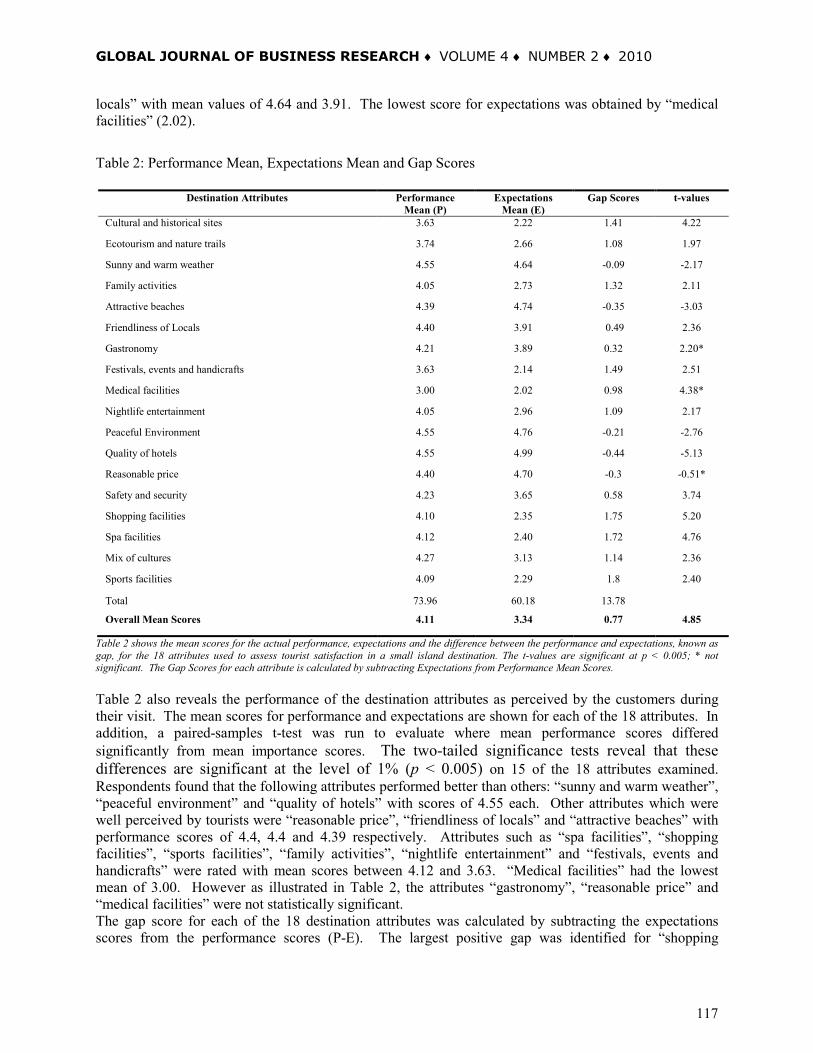
GLOBAL JOURNAL OF BUSINESS RESEARCH ♦ VOLUME 4 ♦ NUMBER 2 ♦ 2010
locals” with mean values of 4.64 and 3.91. The lowest score for expectations was obtained by “medical facilities” (2.02).
Table 2: Performance Mean, Expectations Mean and Gap Scores
Destination Attributes Performance Mean (P)
Expectations Mean (E)
Gap Scores t-values
Cultural and historical sites 3.63 2.22 1.41 4.22
Ecotourism and nature trails 3.74 2.66 1.08 1.97
Sunny and warm weather 4.55 4.64 -0.09 -2.17
Family activities 4.05 2.73 1.32 2.11
Attractive beaches 4.39 4.74 -0.35 -3.03
Friendliness of Locals 4.40 3.91 0.49 2.36
Gastronomy 4.21 3.89 0.32 2.20*
Festivals, events and handicrafts 3.63 2.14 1.49 2.51
Medical facilities 3.00 2.02 0.98 4.38*
Nightlife entertainment 4.05 2.96 1.09 2.17
Peaceful Environment 4.55 4.76 -0.21 -2.76
Quality of hotels 4.55 4.99 -0.44 -5.13
Reasonable price 4.40 4.70 -0.3 -0.51*
Safety and security 4.23 3.65 0.58 3.74
Shopping facilities 4.10 2.35 1.75 5.20
Spa facilities 4.12 2.40 1.72 4.76
Mix of cultures 4.27 3.13 1.14 2.36
Sports facilities 4.09 2.29 1.8 2.40
Total 73.96 60.18 13.78
Overall Mean Scores 4.11 3.34 0.77 4.85
Table 2 shows the mean scores for the actual performance, expectations and the difference between the performance and expectations, known as gap, for the 18 attributes used to assess tourist satisfaction in a small island destination. The t-values are significant at p < 0.005; * not significant. The Gap Scores for each attribute is calculated by subtracting Expectations from Performance Mean Scores. Table 2 also reveals the performance of the destination attributes as perceived by the customers during their visit. The mean scores for performance and expectations are shown for each of the 18 attributes. In addition, a paired-samples t-test was run to evaluate where mean performance scores differed significantly from mean importance scores. The two-tailed significance tests reveal that these differences are significant at the level of 1% (p < 0.005) on 15 of the 18 attributes examined. Respondents found that the following attributes performed better than others: “sunny and warm weather”, “peaceful environment” and “quality of hotels” with scores of 4.55 each. Other attributes which were well perceived by tourists were “reasonable price”, “friendliness of locals” and “attractive beaches” with performance scores of 4.4, 4.4 and 4.39 respectively. Attributes such as “spa facilities”, “shopping facilities”, “sports facilities”, “family activities”, “nightlife entertainment” and “festivals, events and handicrafts” were rated with mean scores between 4.12 and 3.63. “Medical facilities” had the lowest mean of 3.00. However as illustrated in Table 2, the attributes “gastronomy”, “reasonable price” and “medical facilities” were not statistically significant. The gap score for each of the 18 destination attributes was calculated by subtracting the expectations scores from the performance scores (P-E). The largest positive gap was identified for “shopping
117

P. Naidoo et al Global Journal of Business Research ♦ Vol. 4 ♦ No. 2 ♦ 2010
facilities” (1.75), “spa facilities” (1.72), “cultural and historical sites” (1.41) which reveal that tourist are satisfied to a higher extent with these attributes. Among the 18 destination attributes, 5 attributes obtained negative gap scores showing that these features of the destination are performing below expectations: “quality of hotels” (-0.44), “reasonable price” (-0.3), “peaceful environment” (-0.21), “attractive beaches” (-0.35) and “sunny and warm weather” (-0.09). The study also investigated tourist overall satisfaction with the destination by subtracting the overall mean score for expectations (3.34) from the overall mean score of performance (4.11). The overall tourist satisfaction with the destination was positive as the overall gap score was 0.77. The open-ended questions probed into factors which could improve the overall satisfaction of tourists during their visit. It was found that an important factor concerned the state of the physical environment as tourists found that the destination was not performing well in terms of preserving this asset. For example, hawkers based around the market in the capital city leave the remains of their food product and packaging which spoil the appearance of the area. Tourists also found that there was litter on public beaches. Repeated visitors mentioned that the lagoons were not well preserved as they found that the corals and amount of fish have deteriorated as compared to their previous visits. The interaction of tourists and locals was a factor which affected tourist satisfaction with the destination. For example, a few tourists claimed that hawkers were sometimes aggressive and forced them to purchase items that they did not wish to buy. Additionally, prices of products were perceived as expensive, including the tariff charged by taxis. In terms of infrastructure, it was found that tourists did not appreciate the congested roads. Mauritian drivers were found to be impolite and the speed limit was not respected. The road signage along connecting roads was not clear and independent visitors could easily get lost. Tourists also commented that certain museums were old and not very interesting. Finally, tourists did not appreciate rainy days as they were compelled to undertake indoor activities at the hotels and thus could not visit the attractions as per their plans. CONCLUSIONS The study reveals that both first time and repeat tourists were satisfied with the destination and this includes those travelling for leisure, VFR and business. The data collected provided important information regarding tourist satisfaction at the destination under scrutiny. The expectancy-disconfirmation model (Oliver, 1980) used in the study has investigated tourist satisfaction across 18 destination attributes as well as overall satisfaction with the destination. Positive disconfirmation arised with the destination because the outcomes were superior to the expectations of tourists. Tourists satisfaction with individual destination attributes reveal that 13 attributes were positively disconfirmed. The highest positive disconfirmation occurred with “shopping facilities”, “spa facilities” and “cultural and historical sites”. It is believed that tourists were satisfied with these attributes as the gap scores were positive. However, these results could be explained by lower expectations scores obtained for these attributes as they have only been promoted during recent years. Hence, customers were more likely to have lower expectations as these were not core attributes which position the destination and which impact on tourists’ expectations. On the other hand, 5 destination attributes were negatively disconfirmed as they fall below the expectations of tourists. These attributes were “quality of hotels”, “reasonable price”, “peaceful environment”, “attractive beaches” and “sunny and warm weather”. Although negative disconfirmation occurs, it is important to note that these attributes fall below expectations of consumers (<0.5) to a little extent indicating that tourists were only slightly dissatisfied. Tourist dissatisfaction could be further explained by the open-ended answers where they stated that the environment of the destination is unclean including the beaches and the destination is lagging behind with regards to protecting the environment. Additionally the traffic and congested road may spoil the “peaceful environment” of the destination. A few tourists also mentioned that on some occasions, they were charged high prices which may explain the dissatisfaction with “quality of hotels” and “reasonable price”. Furthermore, since tourist brochures and advertising always portray a “sunny and warm climate”, this is likely to raise the
118

GLOBAL JOURNAL OF BUSINESS RESEARCH ♦ VOLUME 4 ♦ NUMBER 2 ♦ 2010
expectations of customers. Therefore, when tourists encountered rainy days, the outcome associated with the attribute “sunny and warm climate” was lower than their enhanced expectations. This study has helped to identify the weak attributes of the destination. Particular attention should be paid to improve the destination and satisfy tourists so that they are motivated to travel long distances to visit this small island destination despite of the existence of competing destinations as well the threat of the global financial crisis. Future studies could investigate the impacts of tourist satisfaction on their behavioral intentions.
APPENDIX: QUESTIONNAIRE
Directions: Please write down your answers in the space provided or place a tick in the box where appropriate.
1. Nationality:……………………………………………..
2. Gender: Male Female
3. Is it your first visit to Mauritius? Yes No
If No, how many times have you visited Mauritius before?
(i) Once (ii) 2-4 (iii) 5-10 (iv) More than 10
4. What type of accommodation did you stay in during your visit to Mauritius? (i) 3- star hotel (ii) 4- star hotel (iii) 5- star hotel (iv) Others (Please specify)………….
5. What was the length of stay of your visit? (i) Less than 5 days (ii) 5 -10 days (iii) 11-15 days (iv) More than 15 days 6. What motivated you to travel?
(i) Leisure /recreation holidays (ii) Visiting friends and relatives (iii) Business
(iv) Others (Please specify)…………. 7. Please rate what you expected in terms of performance from the following attributes prior to your visit to Mauritius. 1=Extremely Poor, 2=
Poor, 3=Neither Poor nor Excellent, 4=Good, 5=Excellent
Attributes Expected Performance 1 2 3 4 5 Cultural and historical sites Ecotourism and nature trails Sunny and warm weather Family activities Attractive beaches Friendliness of Locals Gastronomy Festivals, events and handicrafts Medical facilities Nightlife entertainment Peaceful environment Quality of hotels Reasonable price Safety and security Shopping facilities Spa facilities Mix of culture Sports facilities
119

P. Naidoo et al Global Journal of Business Research ♦ Vol. 4 ♦ No. 2 ♦ 2010
8. Please indicate the performance of the following attributes during your visit to Mauritius. 1=Extremely Poor, 2= Poor, 3=Neither Poor nor Excellent, 4=Good, 5=Excellent
9. According to you, what improvements need to be carried out to enhance your satisfaction with Mauritius as a holiday destination? REFERENCES Ahmed, Zafar U. (1991). “The influence of the components of a state’s tourist image on product positioning strategy.” Tourism Management, 12: 331-40. Andaleeb, S. S. and C. Conway (2006). “Customer satisfaction in the restaurant industry: an examination of the transaction-specific model.” Journal of Services Marketing, 20 (1): 3-9. Barsky, J. D. (1992). “Customer satisfaction in the hotel industry: meaning and measurement.” Hospitality Research Journal, 16 (1): 51-73. Barsky, J. D. and R. Labagh (1992). “A strategy for customer satisfaction.” Cornell Hotel and Restaurant Administration Quarterly, 33 (October): 32-40. Bojanic, David C. (1996). “Consumer perceptions of price, value, and satisfaction in the hotel industry: an exploratory study.” Journal of Hospitality and Leisure Marketing, 14 (1): 5-22. Bojonic, D. C. and L. D. Rosen (1994). “Measuring service quality in restaurants: an application of the SERVQUAL instrument.” Hospitality Research Journal, 18 (1): 3-14. Central Statistics Office (2008). “Central Statistics Office”, from : <http://www.gov.mu > (Accessed 25 April, 2008). Chon, Kaye S., and Michael D. Olsen (1991). “Functional and symbolic approaches to consumer satisfaction/dissatisfaction in tourism.” Journal of the International Academy of Hospitality Research, 28: 1-20. Cronin, J. Joseph and Steven A. Taylor (1992). “Measuring service quality: a re-examination and extension.” Journal of Marketing, 56 (3): 55-68.
Attributes Performance Level 1 2 3 4 5 Cultural and historical sites Ecotourism and nature trails Sunny and warm weather Family activities Attractive beaches Friendliness of Locals Gastronomy Festivals, events and handicrafts Medical facilities Nightlife entertainment Peaceful environment Quality of hotels Reasonable price Safety and security Shopping facilities Spa facilities Mix of culture Sports facilities
120

GLOBAL JOURNAL OF BUSINESS RESEARCH ♦ VOLUME 4 ♦ NUMBER 2 ♦ 2010
Dube, L., Renaghan, L. M. and Miller, J. M. (1994). “Measuring customer satisfaction for strategic management.” Cornell Hotel and Restaurant Administration Quarterly, 35 (1), 39-47. Duke, Charles R. and Persia, Margaret A. (1994). “Foreign and domestic escorted tour expectations of American travelers.” In Global Tourist Behaviour, edited by Muzaffer Uysal. New York: International Business Press, pp. 61-78. Echtner, C. M. and Ritchie, B. (1993). “The measurement of destination image: an empirical assessment.” Journal of Travel Research, 31 (3), 3-13. Fick, G. R. and J. R. Brent Ritchie (1991). “Measuring service quality in the travel and tourism industry.” Journal of Travel Research, 30 (2): 2-9. Gronroos, Christian (1990). Service Management and Marketing: Managing the Moments of Truth in Service Competition. Lexington, MA: Lexington Books. Gursoy, D., McCleary, K. W. and Lepsito, L. R. (2003). “Segmenting dissatisfied restaurant customers based on their complaining response styles.” Journal of Food Service Business Research, 6 (1), 25-44. Gursoy, D., McCleary, K. W. and L. R. Lepsito (2007). “Propensity to complain: affects of personality and behavioral factors.” Journal of Hospitality & Tourism Research, 31 (3), 358-386. Gyte, Douglas, M. and Phelps, Angela (1989). “Patterns of destination repeat business: British tourists in Mallorca, Spain.” Journal of Travel Research, 28 (summer), 24-28. Haywood, K. M. (1989). “Managing Word-of-Mouth Communications.” Journal of Service Marketing, 3 (2): 55-67. Hughes, Karen (1991). “Tourist satisfaction: a guided cultural tour in North Queensland.” Australian Psychologist, 26 (3): 166-71. Hsieh, Sheauhsing, Joseph T. O’Leary and Alastair M. Morrison (1994). “A comparison of package and non-package travelers from the United Kingdom.” In Global Tourist Behavior, edited by Muzaffer Uysal. New York: International Business Press, pp. 79-100. Juaneda, C. (1996). “Estimating the probability of return visits using a survey of tourist expenditure in the Balearic Islands.”, Tourism Economics, 2(4), 339-352. Karatepe, O. M. (2006). “Customer complaints and organizational responses: the effects of complainants’ perceptions of justice on satisfaction and loyalty.” Interactional Journal of Hospitality Management, 25:69-90. Kozak, K. and Rimmington, M. (2000). “Tourist satisfaction with Mallorca Spain, as an off-season holiday destination.” Journal of Travel Research, 38, February, 260-269. Laws, E. (1995) Tourist Destination Management Issues, Analysis and Policies, Routledge, London. Murray, I. P. (1992) in Yuksel “Managing customer satisfaction and retention: a case of tourist destinations, Turkey.” Journal of Vacation Marketing, 7 (2), 153-168.
121

P. Naidoo et al Global Journal of Business Research ♦ Vol. 4 ♦ No. 2 ♦ 2010
Neal, J. D. and Gursoy, D. (2008). “A multifaceted analysis of tourism satisfaction.” Journal of Travel Research, 47, August, 53-62. Oh, M., and Mount, J. D. (1998). “Assessments of lodging service unit performance for repeat business.” Journal of International Hospitality, Leisure and Tourism Management, 1(3): 37-54. Oliver, Richard L. (1980), “A cognitive model of the antecedents and consequences of satisfaction decisions,” Journal of Marketing Research, 17 (September), 46-49. Oliver, Richard L. (1981), “Measurement and evaluation of satisfaction processes in retail settings,” Journal of Retailing, 57 (Fall), 25-48. Oliver, Richard L. (1989), “Processing of the satisfaction response in consumption: a suggested framework and research propositions,” Journal of Consumer Satisfaction, Dissatisfaction, and Complaining Behavior, 1-16. Oliver, Richard L. (1993), “Cognitive, affective, and attribute bases of the satisfaction response,” Journal of Consumer Research, 20 (December), 418-30. Oliver, Richard L. and William O. Bearden (1985), “Disconfirmation processes and consumer evaluations in product usage,” Journal of Business Research, 13 (June), 235-46. Oliver, Richard L. and Raymond R. Burke (1999), “Expectation processes in satisfaction formation,” Journal of Service Research, 1 (February), 196-214. Parasuraman, A., Valeria A. Zeithaml and Leonard L. Berry (1985). “A conceptual model of service quality and its implications for future Research.” Journal of Marketing, 49 (fall): 41-50. Pizam, A., Neumann, Y. and Reichel, A. (1978). “Dimensions of tourist satisfaction with a destination area.” Annals of Tourism Research, July/September, 314-322. Pizam, A. and T. Ellis (1999). “Customer satisfaction and its measurement in hospitality enterprises.” International Journal of Contemporary Hospitality Management, 11 (7): 326-339. Reisinger, Yvette and Robert Waryszak (1995). “Japanese tourists’ perceptions of their tour guides: Australian experience.” Journal of Vacation Marketing, 1 (1): 28-40. Rosenberg, L. J. and J. A. Czepiel (1983). “A Marketing Approach for Customer Retention.” Journal of Consumer Marketing, 1: 45-51. Ross, Elizabeth L. D. and Seppo E. Iso-Ahola (1991). “Sightseeing tourists’ motivation and satisfaction.” Annals of Tourism Research, 18: 226-37. Saleh, Farouk and Chris Ryan (1992). “Client perceptions of hotels.” Tourism Management, 13 (June): 163-68. Stevens, Blair F. (1992). “Price value perceptions of travelers.” Journal of Travel Research, 31 (fall): 44-48. Stevens, P., Knutson, B. and Patton, M. (1995). “Dineserv: a tool for measuring service quality in restaurants.” Cornell Hotel and Restaurant Administration Quarterly, April, 56-60.
122

GLOBAL JOURNAL OF BUSINESS RESEARCH ♦ VOLUME 4 ♦ NUMBER 2 ♦ 2010
Swan, John E. and Frederick I. Trawick (1981), “Disconfirmation of expectations and satisfaction with a retail service,” Journal of Retailing, 57 (Fall), 49-67. Tse, D.K, Wilton, P.C (1988). “Model of consumer satisfaction formation: an extension.” Journal of Marketing Research, 25: 204-212. Vavra, T. G. (1997). Improving Your Measurement of Customer Satisfaction: A Guide to Creating, Conducting, Analyzing and Reporting Customer Satisfaction Measurement Programs. Milwaukee, WI: ASQ Quality. WTO (1985). Improving your measurement of customer satisfaction: a guide to creating, conducting, analyzing and reporting customer satisfaction measurement programs, ASQ Quality Press. Yuksel, Atila (2001). “Managing customer satisfaction and retention: a case of tourist destinations, Turkey.” Journal of Vacation Marketing, 7 (2), 153-168. Yuksel, Atila and Yuksel Fisun (2001). “Comparative performance analysis: tourist’s perceptions of Turkey relative to other tourist destinations.” Journal of Vacation Marketing, 7 (4), 333-355. BIOGRAPHY Perunjodi Naidoo is a lecturer in Tourism at the University of Technology, Mauritius. Her main research interests include Sustainable Tourism and Service Quality. Email: [email protected] Prabha Ramseook-Munhurrun is a lecturer in Services Management at the University of Technology, Mauritius. Her research interests focus on Services Marketing, Service Quality and Tourism. Email [email protected] Jeynakshi Ladsawut is a former undergraduate student at the University of Technology, Mauritius.
123

GLOBAL JOURNAL OF BUSINESS RESEARCH ♦ VOLUME 4 ♦ NUMBER 2 ♦ 2010
EVIDENCE ON THE MARKETING APPROACHES TARGETING GAY AND LESBIAN CONSUMERS
Susan Baxter, Farmingdale State College – SUNY
ABSTRACT
Diversity is an important concept in business and marketing and is utilized in campaigns to attract consumers. This study examines the level of diversity in print media that targets the niche market of gays and lesbians. Race and gender are examined to determine if, in fact, marketers are being innovative in reaching this target market, or are we still using an old paradigm. This study, which examined over 3000 models used in gay and lesbian targeted media proves that we still use the old paradigm of white male models in the advertisements that we used in the 1960s. JEL: M1, M30 M31, M37 KEYWORDS: Content analysis, diversity, GLBT, gay, lesbian, print media, niche market
INTRODUCTION
iversity as an important concept in business and marketing has been gaining focus in the Unites States and abroad. Businesses have begun to look at the changing population demographics of their market. The United States is one area of focus, and is increasingly becoming a multicultural
society. The population in the United States is changing just as rapidly as the rest of the world. By 2050, half of the United States will be people of color (Johnson, 2008). During the 1990s and beyond, the United States is shifting from a society dominated by whites and rooted in Western culture to a world society characterized by three large racial and ethnic minorities: blacks, Hispanics, and Asians (Riche, 1991). The United States, with a history of being the world’s melting pot, has become a multicultural society. Successful utilization of this diversity has been of strategic concern to business. With the marketplace inundated with new businesses, new products, and revamped products, consumers have multiple options on how to spend their money. How does a business find and keep the consumers who want their products? Even established businesses have to work to keep current customers and attract new ones The changing face of the marketplace, particularly regarding ethnicity, is impacting marketing strategies with increased target marketing including expanding representation of ethnic groups in advertising (Zinkhan, Quall, & Biswas, 1990; Martin, Lee, & Yang, 2004). The 1960s saw the first integration of ethnic groups when blacks were added to the mainstream marketing strategies. Today there are three target groups being discussed in marketing circles as new niche areas to pursue: Hispanics, Asians, and the Gay, Lesbian, Bisexual, and Transgender (GLBT) population. This paper focuses on one of these niche areas – the GLBT population. LITERATURE REVIEW Target marketing has become an increasingly important marketing strategy, especially given the amount of increasing population diversity (Martin, Lee, & Yang, 2004; Grier & Brumbaugh, 1999). Budford noted, “the more targeted the advertising, the greater response in terms of recall and eventual purchase patterns” (as cited in Sass, 2006). Target marketing, and segmenting of markets, dates back to the mid 1950s. Segmentation is an accepted tool of management and considered one of the foremost means of
D
125

S. Baxter Global Journal of Business Research ♦ Vol. 4 ♦ No. 2 ♦ 2010
operationally defining the marketing concept. Marketers using segmentation strategies attempt to deliver value to a specific subset of consumers who share similar demands (Fugate, 1993). The increased use of target marketing has been touted as an answer to consumer diversity (Grier & Brumbaugh, 1999). Effective target marketing is possible with segmentation. The fundamental proposition of segmentation is that not all consumers are equal; consumers have to be diverse in order for segmentation to be cost-effective. Why target a portion of your total market opportunity? Targeted niche marketing allows the organization to focus on a specific consumer group. Niche groups are easier to understand and, therefore, easier to address their needs than targeting a wider, more diverse group, thereby creating a more effective use of marketing dollars (Nisberg & Nierenberg, 2004). Why target the GLBT community? The market already exists as demonstrated by commercial interest in the population. This interest is visible in current television shows, advertisements that have targeted the community over the past 20+ years, and the influx of television and radio programming geared toward this audience. Research suggests that some six to ten percent of the United States freely identifies as gay or lesbian (Buford, 2000). This proportion can be as high as twelve percent or more in America’s large cities (Buford, 2000). In recent years, marketing and media attention has begun to be directed to gays and lesbians as a distinct consumer group dubbed the "Dream Market" (Penaloza, 1996). As early as 1992, researchers have been discussing the discretionary buying power and brand loyalty of members of the GLBT community (Schwartz, 1992 & Soloman, 1994). The buying power of GLBT consumers is estimated at $641 billion, just in the United States (GLBT loyalty, 2007). Network television had over 30 openly gay characters appearing regularly on television series as of fall 1997 (A new, affluent, 1998). GLBT consumers buy new products earlier than most, have more discretionary income than average folks and are very brand loyal (Winter, 2004). In the last few years, there has been an increase in corporate attention focused on the homosexual population as evidenced by increased television shows with out homosexual characters, the creation of television networks geared towards this population (QueerTV, PNN, LOGO TV, HERE TV) and increased advertisement by major industries. Several industries have targeted this group for several years already. The automotive industry, namely Subaru and Saturn, started actively marketing to the homosexual community in 1994 (Schweinsberg, Winter, & Zachary, 2004). Tobacco, alcohol, and travel-oriented firms have also been pitching to the market for at least a decade (Schweinsberg, Winter, & Zachary, 2004). Marzano-Lesnevish (n.d.) describes a composite profile, discussed by Delozier and Rodriguez, of desirable characteristics of the homosexual consumer: being well-educated, high discretionary income, informed socially and politically, and dedicated to career and home ownership. The main desirable traits of the homosexual couple are summed up not in hard numbers, but in “DINKS” stereotype: “dual income-no kids” which assumes there is more discretionary income and more disposable time (Marzano-Lesbevish, n.d.; Buford, 2000). Gay and lesbian consumers are more likely to have time for leisure activities, and are thus especially interesting prospects for products and services that are consumed in units of disposable time, including entertainment, travel and all related industries (Buford, 2000). Puechl (2004) goes on to state that this same research also concluded that approximately 76% of gay and lesbian household incomes were above the national average of $40,000 per year. So, not only does the GLBT population have more disposable income due to the “DINKS” stereotype, but there is also research evidence that lends credence to the stereotype. Mass marketing is becoming a thing of the past as businesses realize that one needs to respond to consumer differences with differentiation and segmentation strategies that recognize ethnic minority subcultures are growing in size and have, not only increased purchasing power, but also heightened
126

GLOBAL JOURNAL OF BUSINESS RESEARCH ♦ VOLUME 4 ♦ NUMBER 2 ♦ 2010
political and cultural awareness and ethnic pride (Sheth et al., 1990; Cui, 1997; Penaloza & Gilly, 1999). The 2000 United States Census showed that same-sex households reside in 99% of the counties nationwide, with approximately 25% of the households having children, 20% having someone over age 55 and over 10% having a senior over the age of 65 (Wilke, 2004; Doyle, 2005). Therefore, in this age of global competition, concerns about the bottom line, and looking for competitive advantage in the market place, the question should be “Why not the GLBT community?” What is the most effective media to use in reaching this groups? While there are some targeted television channels (LOGO and HERETV) and some targeted shows (the LWord), these require the audience to have cable television. There are GLBT targeted radio shows, but it is not nationwide nor 24 hours per day. Print media (magazines and newspapers) is the media of choice for this niche segment. Utilizing niche print outlets allows a company the opportunity to increase the frequency of their promotion being seen by the targeted audience, versus doing a mass-market campaign that may have greater reach but not necessarily the correct audience. This is especially true when targeting culturally diverse markets. Additionally, print outlets are more cost effective than television. An examination of the reach towards the GLBT population has been limited. This is an important population for consideration as “ads with specifically gay-themed content generated $212 million in revenue in 2005” (Saas, 2006, 2). The prior research has been somewhat limited due to difficulty in identifying this segment. However, given the buying power of this market segment, it is becoming a market segment of strategic consideration for many corporations. In an era of globalization and increased competition, finding and reaching new consumers is of importance to every business. This paper examines a snapshot of print advertising in several national and regional magazines and newspapers geared to the gay and lesbian consumer to determine if there is, in fact, diversity in print advertising directed towards this group. Or are we continuing with the model of 40 years ago where the diversity we have is only found in stereotypical and/or gender specific roles? Given that anywhere from 6-10% of the population is thought to be GLBT, one would assume that the population exists in various ages, ethnicities, cultures, and size. Gender is examined to determine if advertisers target both males and females or one gender over the other. Race is examined, as historically advertising focused first on white males, then white males and females, then African Americans in the late 1960s. Does this favoritism towards white males occur in GLBT advertisements? Print advertisements were slow to add additional ethnicities, and when they were added, the roles given the various ethnic groups tended towards stereotypical (Cohen, 1992; Bristor, Gravois, & Hunt, 1995; Taylor & Bang, 1997; Coltrane & Messineo, 2000; Odekerken-Schroder, De Wulf, & Hofstee, 2002; Bailey, 2006). RESEARCH QUESTIONS Why is it important to examine diversity in print advertisement? Consumer attitude towards an advertisement, and subsequently towards the product or service promoted in that advertisement, are influenced by the ability of the consumer to view themselves as similar or dissimilar to the users of that product or service. The conclusions that consumers make when viewing an ad regarding similarities and dissimilarities, and the ability to imagine oneself comparatively to the ad portrayal can influence the attitude toward the product and purchase intentions (Debevec & Iyer, 1988). “It follows that when consumers of a particular minority perceive a similarity between themselves and an advertising model of a similar background, this judgment will result in self-referencing” (Martin, Lee, & Yang, 2004, p. 28). Furthermore, research has found that “In-group members will evaluate other in-group members more favorably than they will out-group members” (Qualls & Moore, 1990, p. 148). Therefore, advertisements to reach niche target markets should strive to utilize models or symbols that represent the targeted market. In the case of the GLBT market, that requires more thoughtful analysis of what constitutes that target market, i.e. what does that market look like.
127

S. Baxter Global Journal of Business Research ♦ Vol. 4 ♦ No. 2 ♦ 2010
The GLBT population does not fit into a single category of gender, race/ethnicity, age, nationality, or socioeconomic status. It is a diverse group of people found in every gender and race worldwide. A content analysis of print advertisements was conducted in order to begin to assess how diverse (or not) the advertising appeals are when targeting the gay and lesbian consumer. Are advertisers reaching lesbians and gays of color in advertisements? What about older lesbians and gays? Are more advertisements geared toward men than women? Historically, the literature review will denote that marketing campaigns in the United States have focused primarily on white males as the main consumer, then moving to white females, allowing African Americans in mainstream advertising in the late 1960s, and other ethnic groups were added slowly over the next several decades. When models of color were utilized in advertisements, they were typically in stereotypical roles and not as the main character. This research will determine if the advertisements in various GLBT publications has followed this trend, focusing on predominantly white males. The publications examined include national GLBT magazines, national gay magazines, national lesbian magazines, and regional GLBT newspapers. To examine further these questions this study will examine the following variables as they apply to the GLBT population: gender, race, and the roles portrayed by models of various gender and race. The main question driving this research is “Are advertisers adequately and appropriately representing minorities in advertisements targeting the GLBT population”? The research questions and hypotheses driving this study are as follows:
RQ1: Will there be diversity of models portrayed in print advertising geared towards gays and lesbians as demonstrated by gender, skin color, and age? Ha1: There is a significant difference in representation based on gender in print advertisements. Ha2: There is a significant difference in representation based on race in print advertisements. RQ2: Will there be equity in the roles portrayed by models of various gender, ages, and races/ethnicities? Ha3: There is a significant difference in the proportion of leading versus supporting and background roles based on race in print advertising. Ha4: There is a significant difference in the proportion of leading versus supporting and background roles based on race and gender in print advertising.
DATA AND METHODOLOGY This study examined ten issues each of a national magazine that targets the GLBT audience, three GLBT newspapers, three magazines that target Gay men and three magazines that target lesbians. There is only one national magazine chosen, as there is only one national magazine in the United States that targets the GLBT population. The issues examined were published between the years 2006 – 2008. The sample consists of print advertisements at least ¼ page size or larger, eliminating personal advertisements and business card sized advertisements. This allows for a focus on main advertisements and not personal service advertisements or personal ads. A limitation of the sampling is tied to the volatility of the magazine industry. Research Design
Quantitative research gathers data in numbers via set categories predetermined by the researcher.
128

GLOBAL JOURNAL OF BUSINESS RESEARCH ♦ VOLUME 4 ♦ NUMBER 2 ♦ 2010
This studied utilized content analysis as the primary method of data collection. Why use content analysis? Content analysis has been used for over 50 years in various studies primarily in the field of mass communication and social sciences (Berelson, 1952). The use of content analysis allows for the study of the message itself, rather than focusing on the communicator or the audience (Kassarjian, 1977). The study can focus on the cues, symbols, signs, pictures, graphics, or words within the advertisement instead of the intent of the sender or the action or reaction of the receiver. Content analysis allows for observation and analysis of overt communication behaviors in marketing, as it is an effective research tool when faced with a limited budget. Content analysis has proven to be an objective, systematic and quantitative tool for use in empirical research (Berelson, 1952; Healey & Kassarjian, 1983; Sayre, 1992; Graham, Kamins, & Oetomo, 1993; Naccarato & Neuendorf, 1998; and Carrigan & Szmigin, 1999). It “provides quantified data suitable for statistical analysis” (Philips & McQuarrie, 2002, p. 3). Content analysis is principally useful in detecting frequently and infrequently used portrayals in promotions (Kolbe & Albanese, 1996). Content analysis has been chosen as the method of data collection for this study as the researcher aimed to examine advertisement content targeting the GLBT population in print media for the time period under consideration. The codebook was developed using information from prior studies on gender, age, race/ethnicity, and role dominance in print advertising. The definitions of the coding form come from a variety of sources including previously published content analysis studies (Neuendorf, 2001; Peterson, 1995; Al-Olayan & Karande, 2000; Stern, Klugman, & Resnik, 1981). Utilizing previously studied definitions increases the validity of the coded content. The coders that assisted in data collected went through a training session and inter-coder reliability was tested and retraining occurred until there was a 90% or higher consistency in inter-coder reliability as demonstrated by Krippendorff’s alpha. The Krippendorff alpha statistic for inter-coder reliability after training was α=923, thus achieving an inter-coder reliability higher than the required 90%. RESULTS The results of this study are important because they add to the understanding of current marketing strategies being utilized to reach this consumer group, as there has not been a lot of published research focused on what has been attempted. The success of marketers in the future depends upon having a greater understanding of their consumers. Various research in the past have noted that this consumer group has significant potential due to disposable income and their buying power, as noted previously. Targeted advertising campaigns are supposedly effective because precise advertising characteristics have been tailored to the characteristics of a targeted consumer segment (Grier & Brumbaugh, 1999). The results of this study demonstrate that the advertising campaigns have a limited view of what a GLBT person looks like in regards to gender and race. The research started by examining the genders represented in the print advertisements found in the subject media.
Ha1: There is a significant difference in representation based on gender in print advertisements. In the 100 magazine and newspaper issues examined, the total sample of models used in this study was 3,122. The gender breakdown was males: 1,687 and females 1, 435. Examining U.S. Census (2007) data from 2000, it is found that 50.9% of the reported population was female with 49.1% of the reported population being male. Alternative hypothesis 1 examined the distribution by gender of the models in the print advertisements to determine if the distributed mimicked the U.S. Census population data. The original options in the coding for this part of the distribution included choices of male, female, and unable to be determined. Due to the small number of unable to be determined (n=45), this category was
129

S. Baxter Global Journal of Business Research ♦ Vol. 4 ♦ No. 2 ♦ 2010
dropped from the final sample totals. In the distribution shown in Table 1, the genders are not equally divided, as one would expect in a normal distribution. The US Census data was, for the most part, an equal representation of gender, and as noted, the genders displayed in the research advertising do not mimic the actual U.S. population. The chi-squared statistic (x2 (1)=20.341, p < .001), demonstrates that the distribution is not equal, and we can reject the null hypothesis and accept the alternative hypothesis. Table 1: Gender and Media
a. Gender Observed N Expected N Percentages Male Female Total
1687 1435 3122
1561 1561
54.0% 46.0%
x2 (1)=20.341, p < .001
b. Media Name Male Female Total
Advocate NY Blade Washington Blade
95 70 84
20 30 36
115 100 120
Watermark 430 200 630
Table 1 part a. shows the observed number, by gender, in all media sources followed in cell 2 of the expected observations and the observed percentages. Part b examines by gender the distribution of models in media that purports to target both genders. Within the media examined for this study, there are magazines that target one gender over the other and there are newspapers and a magazine that purport to target both genders equally. Table 1b looks at the frequency of gender in those media that target both genders. A quick examination of this table shows that the males are used more often in advertisements than females in magazines and newspapers that target both genders. Table 1a: Media
Media Type Advocate National Magazine NY Blade Newspaper Washington Blade Newspaper Watermark Newspaper Curve National Magazine DIVA International Magazine LN National Magazine OUT National Magazine Attitude International Magazine Instinct National Magazine
Table 1a lists the media used in this study. Ten issues of each magazine or newspaper published between 2006-2008 were randomly selected. The international magazines are published in the United Kingdom but are readily available nation-wide in the United States. Table 1a is a listing of the various media used in this study. The top four in the table target both gays and lesbians. The three newspapers utilize a majority of black and white advertisements. The magazines targeting lesbians are Curve, DIVA, and LN. OUT, Attitude, and Instinct target gays. The next hypothesis, alternative hypothesis 2, examined the representation of people of color in print advertisements.
Ha2: There is a significant difference in representation based on race in print advertisements.
130

GLOBAL JOURNAL OF BUSINESS RESEARCH ♦ VOLUME 4 ♦ NUMBER 2 ♦ 2010
U.S. Census data, as of 2000, makes this a more complicated demographic to count as additional categories were added to the U.S. Census, including Hispanic whites, non-Hispanic whites, and categories for two or more races (U.S. Census, 2007). For purposes of this research, Caucasian depictions in advertisements are assumed to be non-Hispanic whites. Hispanic and Latino measures encompass Hispanic whites, Hispanics and Latinos. Table 2: Ethnicity of Models in Advertisements
Race/Ethnicity Observed N Caucasian 2376 African American 405 Hispanic 245 Asian 67 Total 3093
x2 (3)=2503.398, p < .001 This table shows the breakdown by race of models observed in all media for this study. Column 1 is the race/ethnicity, column two gives the total number observed.
Table 2 shows the break down of ethnicity as found in the coding of the advertisements with some minor adjustments. The original choices of the coding book included the following categories: Caucasian, African American, Hispanic, Native American, Other, and unable to be determined. In the original sample, there were ten (10) Native American and twenty-seven (27) unable to determine. Therefore, due to small numbers within these categories, they were dropped from the statistical analysis. The chi-squared statistic (x2 (3)=2503.398, p < .001) was significant and supports this alternative hypothesis.
The diversity present in the advertisements was next examined in regards to the roles portrayed in the advertisements. This part of the research was driven by the second research question.
RQ2: Will there be equity in the roles portrayed by models of various gender, ages, and races/ethnicities?
In prior research, as discussed in the literature review, models of various demographics (gender, age, and race) differed on use within the advertisement. This earlier research focused on mainstream advertising utilizing various forms of media. This section of the research focused on whether or not there is diversity, as determined by demographic characteristics, demonstrated in the various roles found in print advertisements that target the GLBT community. There are two hypotheses analyzed from this research question.
Ha3: There is a significant difference in the proportion of leading versus supporting and background roles based on race in print advertising.
Alternate hypothesis three examines the ethnicity of the models in various roles portrayed in the print advertisement. This question stems from earlier research in mainstream media that looked at racial diversity in print and televised media to determine if the GLBT targeted advertisements were following the same pattern. This data from the print advertisements studied can be found in Table 3. This hypothesis takes into account character role and the characteristic of ethnicity without regard to gender or age. Following Table 3 is a discussion of some statistical analysis changes that occurred based on the data gathered.
131
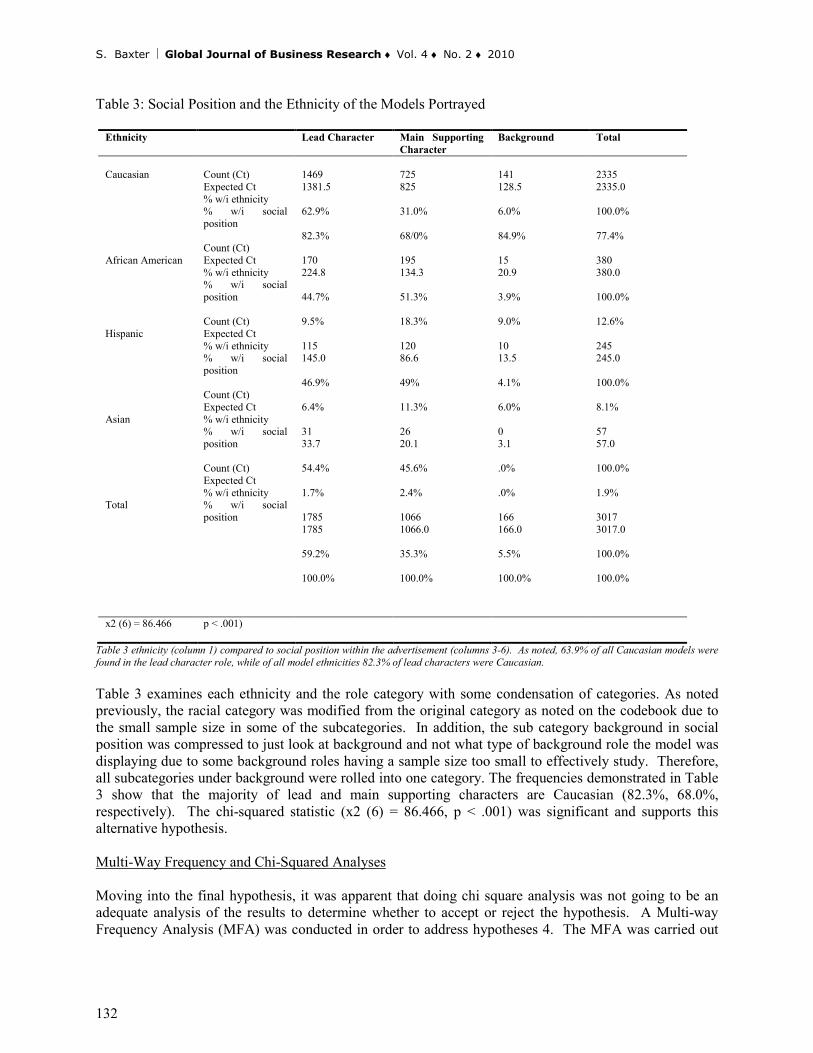
S. Baxter Global Journal of Business Research ♦ Vol. 4 ♦ No. 2 ♦ 2010
Table 3: Social Position and the Ethnicity of the Models Portrayed
Ethnicity Lead Character Main Supporting Character
Background Total
Caucasian African American Hispanic Asian Total
Count (Ct) Expected Ct % w/i ethnicity % w/i social position Count (Ct) Expected Ct % w/i ethnicity % w/i social position Count (Ct) Expected Ct % w/i ethnicity % w/i social position Count (Ct) Expected Ct % w/i ethnicity % w/i social position Count (Ct) Expected Ct % w/i ethnicity % w/i social position
1469 1381.5 62.9% 82.3% 170 224.8 44.7% 9.5% 115 145.0 46.9% 6.4% 31 33.7 54.4% 1.7% 1785 1785 59.2% 100.0%
725 825 31.0% 68/0% 195 134.3 51.3% 18.3% 120 86.6 49% 11.3% 26 20.1 45.6% 2.4% 1066 1066.0 35.3% 100.0%
141 128.5 6.0% 84.9% 15 20.9 3.9% 9.0% 10 13.5 4.1% 6.0% 0 3.1 .0% .0% 166 166.0 5.5% 100.0%
2335 2335.0 100.0% 77.4% 380 380.0 100.0% 12.6% 245 245.0 100.0% 8.1% 57 57.0 100.0% 1.9% 3017 3017.0 100.0% 100.0%
x2 (6) = 86.466 p < .001)
Table 3 ethnicity (column 1) compared to social position within the advertisement (columns 3-6). As noted, 63.9% of all Caucasian models were found in the lead character role, while of all model ethnicities 82.3% of lead characters were Caucasian. Table 3 examines each ethnicity and the role category with some condensation of categories. As noted previously, the racial category was modified from the original category as noted on the codebook due to the small sample size in some of the subcategories. In addition, the sub category background in social position was compressed to just look at background and not what type of background role the model was displaying due to some background roles having a sample size too small to effectively study. Therefore, all subcategories under background were rolled into one category. The frequencies demonstrated in Table 3 show that the majority of lead and main supporting characters are Caucasian (82.3%, 68.0%, respectively). The chi-squared statistic (x2 (6) = 86.466, p < .001) was significant and supports this alternative hypothesis. Multi-Way Frequency and Chi-Squared Analyses Moving into the final hypothesis, it was apparent that doing chi square analysis was not going to be an adequate analysis of the results to determine whether to accept or reject the hypothesis. A Multi-way Frequency Analysis (MFA) was conducted in order to address hypotheses 4. The MFA was carried out
132

GLOBAL JOURNAL OF BUSINESS RESEARCH ♦ VOLUME 4 ♦ NUMBER 2 ♦ 2010
by utilizing the Hiloglinear program in SPSS. The independent variables race, gender and age along with the dependent variable social position were entered into the MFA. In order to determine the best model fit to the data in the MFA, a backward elimination of higher order effects was utilized. This backward elimination procedure eliminates the highest order effect from the model, in this case the three-way interaction of race, gender, and social position, and then assesses if a significant amount of prediction of observed cell frequencies was lost by the elimination. If the highest order effect is not significant, then the next highest effect (i.e., all three way effects) is tested. This proceeds until it is determined the highest order effects that explain the data. The results of the MFA indicated that the three-way interactions of race, gender, and social position indicated that the elimination of the three way interactions would result in decreased prediction (c2 (40) = 159.53, p < .001). This indicates that the three way interaction is required in the overall model in order to predict the cell frequencies. Given that the elimination of the three-way interaction effects resulted in reduced prediction of cell frequencies, it needed to be determined exactly which of the four possible three-way interactions were significant and therefore needed to remain in the overall model. The results indicated that the interactions of gender, race and social position (c2 (6) = 39.58, p < .001), resulted in reduced prediction of cell frequencies. Therefore, the three-way interaction needed to be included in the final overall model. A chi-squared analysis was conducted to assess if the social position of the character would be predicted by the gender of the character. The results indicated that social position is predicted by gender (c2 (2) = 22.42, p <.001). As noted previously, these hypotheses examined demographic characteristics of models portraying various roles in print advertising. Alternative hypothesis 4 examines more than one demographic characteristic as they pertain to the role of the model in the advertisement.
Ha4: There is a significant difference in the proportion of leading versus supporting and background roles based on race and gender in print advertising.
Alternative hypothesis 4 examines the role position of the model within the print advertising based on the race and gender of the model. Alternative hypothesis 4 stated that social position within the print advertising will be predicted by the race and gender of the character. This hypothesis was supported by the three-way interaction of race, gender and social position in the MFA (c2 (6) =39.58, p < .001). An inspection of Table 4 reveals the nature of the three-way interaction. Male Caucasians had a greater proportion of lead character roles (67.1%) when compared to female Caucasians (57.3%); however, they also had a less proportion of main supporting character roles (28% versus 35.3%). African American males had a less proportion of lead character roles (40%) when compared to African American females (48.8%); however, they also had a greater proportion of main supporting character roles (60% versus 43.9%). African American females also had a greater proportion of background character roles (14.9%) when compared to African American males (0%). Hispanic males had a greater proportion of main supporting character roles (53.8%) when compared to Hispanic females (43.5%). Finally, Asian males had a less proportion of lead characters (50%) when compared to Asian females (57.1%) and a greater proportion of main supporting character roles (50%
133
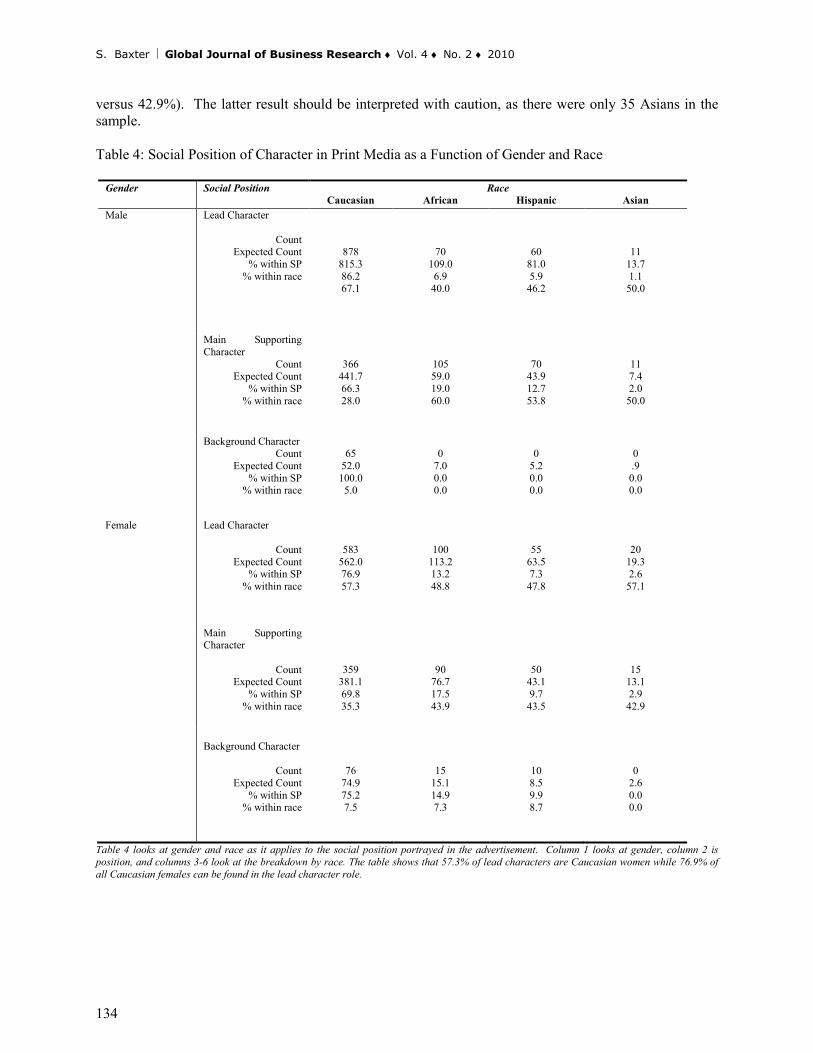
S. Baxter Global Journal of Business Research ♦ Vol. 4 ♦ No. 2 ♦ 2010
versus 42.9%). The latter result should be interpreted with caution, as there were only 35 Asians in the sample. Table 4: Social Position of Character in Print Media as a Function of Gender and Race
Gender Social Position Race Caucasian African
Hispanic Asian
Male Lead Character
Count Expected Count
% within SP % within race
878 815.3 86.2 67.1
70 109.0 6.9
40.0
60 81.0 5.9
46.2
11 13.7 1.1
50.0
Main Supporting Character
Count Expected Count
% within SP % within race
366 441.7 66.3 28.0
105 59.0 19.0 60.0
70 43.9 12.7 53.8
11 7.4 2.0
50.0
Background Character Count
Expected Count % within SP
% within race
65
52.0 100.0
5.0
0
7.0 0.0 0.0
0
5.2 0.0 0.0
0 .9 0.0 0.0
Female Lead Character
Count Expected Count
% within SP % within race
583 562.0 76.9 57.3
100 113.2 13.2 48.8
55 63.5 7.3
47.8
20 19.3 2.6
57.1
Main Supporting Character
Count Expected Count
% within SP % within race
359 381.1 69.8 35.3
90 76.7 17.5 43.9
50 43.1 9.7
43.5
15 13.1 2.9
42.9
Background Character
Count Expected Count
% within SP % within race
76
74.9 75.2 7.5
15
15.1 14.9 7.3
10 8.5 9.9 8.7
0
2.6 0.0 0.0
Table 4 looks at gender and race as it applies to the social position portrayed in the advertisement. Column 1 looks at gender, column 2 is position, and columns 3-6 look at the breakdown by race. The table shows that 57.3% of lead characters are Caucasian women while 76.9% of all Caucasian females can be found in the lead character role.
134
GLOBAL JOURNAL OF BUSINESS RESEARCH ♦ VOLUME 4 ♦ NUMBER 2 ♦ 2010
FINDINGS This study looks at two general research questions and four hypotheses. The first segment of this study examined the diversity of advertisements as evidenced by gender and race. Secondly, the roles of models in the advertisements were studied based on the demographics examined in the first section. Roles include main character, main supporting, and background. In summarizing the findings, it became evident that diversity in gender and ethnicity was not as commonplace in current advertisements targeting the GLBT population as originally thought. Research question one was broken into two hypotheses. Each one of these hypotheses looked at a demographic feature, or a combination, of the advertisements in question. The study concluded that there was significance in the race and the gender of the models. This research question demonstrated that there were more men shown in advertisements, and that these men were predominantly Caucasian. These findings are similar to findings discussed in the literature review. Research question two focused on the demographic categories from research question one, with the added component of the social position role the models held within the print advertisement. The three-way interaction demonstrated significance. The three way interactions between the variables of social position (role), gender, and race are necessary for prediction of position. Furthermore, the hypothesis demonstrated further that gender, race, and age play a role in the position of models in the advertisement. For example, male Caucasians are more likely to be main characters in advertisements. LIMITATIONS There are several limitations to this study. The first one s that the print media sample included magazines and newspapers. Some of the magazines specifically target one gender. Only one magazine bills itself as targeting both. This is a limitation when looking at the demographics in research question one. Secondly, this target market has a limited number of national publications with large circulations. This hampers the ability to make far-reaching conclusions. Third, this study examined the advertisements of the past two years. Advertisers generally advertise long term in GLBT publications to demonstrate loyalty to the market segment, in hopes of gaining the population’s trust. Therefore, the business may be running the same or a similar advertisement over several months. A longer look at advertising could have given a more diverse view of the variables examined.
Next, advertisements had to meet certain criteria to be included in this study. However, advertisements for videotapes, movies, theater productions, and albums were not excluded from the study. These advertisements have a tendency to use models that represent the product, not necessarily target the consumer group. Additionally, the coder questions assumed a basic knowledge of marketing concepts, especially as it related to target market. The coders ranged in age and marketing experience constituting another limitation for this study. Finally, as with many media enterprises, the GLBT publication world is condensing with fewer owners of more publications. This can contaminate the advertisement sample as similar advertisements can be found in same-owner publications. A more diverse field of publications that limited publication ownership would enhance this study. FUTURE RESEARCH AND CONCLUSIONS Marketers use knowledge of the targeted segment to create campaigns that carry a particular message for the targeted group. Advertisements targeting niche groups are uncommon in mainstream media (Ringhold, 1995). Having an appropriately diverse presence in GLBT oriented media, participating in GLBT community events, and contributing to various social causes of importance to this community may prove to be effective tools for building long lasting relationships in the GLBT community. Prior research
135
S. Baxter Global Journal of Business Research ♦ Vol. 4 ♦ No. 2 ♦ 2010
has demonstrated that gays and lesbians can be very brand loyal to a brand that is loyal to them (Miller, 1990; Tuten, 2005). This study demonstrates that advertisers and marketers today are following the patterns learned from the past 40 years – all consumers are Caucasian males between 20 -35 years of age. One age group, one ethnicity, or one gender does not represent the GLBT population. It is a multicultural cosmopolitan population that varies in age and gender. That fact may be what makes it so hard to appropriately target this niche market. The population, by virtue of the identifying characteristic being sexual orientation, does not fit into a pre-existing mold that advertisers and marketers are used to working with. Basic demographics will not adequately reach this group at this time. Attempting to reach this group requires marketers to take the time to learn about the consumer and their culture. This population represents a group that is being tolerated more in society today, as evidenced by the increased number of out characters in television and movies. Another demonstration of this tolerance is the inclusion of GLBT engagement announcements in major newspapers, and the increase in domestic partner benefits being offered by employers. Additionally, there is the increased visibility of GLBT members working to change laws they find discriminatory around the country. Marketers need to be aware of the limitations of their current advertisements. They are attempting to box in what a GLBT person looks like, when in fact, this is one group that marketers could easily include various ages, genders, ethnicities, and sizes, and while doing so may increase the consumer loyalty due to presenting a more accurate representation of that group. Future Research Implications Additional research is needed in this area. The GLBT population has not been widely covered in the literature as of this time, yet it is a specific target market that is gaining interest in the business world due to its size, disposable income, and various other demographic features. This study demonstrates that while American GLBT publications are limited, there are international ones that can be used to compare advertising practices. Further research in how gay men or lesbians are portrayed in targeted advertisements worldwide is of importance in this global economy. It may be easier to study one gender or the other instead of attempting to generalize to the GLBT population, as there are more gay or lesbian specific magazines than there are ones targeting the GLBT population as a whole. It would behoove organizations to know if the GLBT population had similarities on an international scale. This could affect marketing options (global campaign or a local one). The GLBT consumer group is measurable, accessible, differentiable, and actionable. As noted previously, the 2000 United States Census showed that same-sex households reside in 99% of the counties nationwide, with approximately 25% of the households having children, 20% having someone over age 55 and over 10% having a senior over the age of 65 (Wilke, 2004; Doyle, 2005). Therefore, in this age of global competition, concerns about the bottom line, and looking for competitive advantage in the market place, the question should be “Why not the GLBT community?” REFERENCES A new, affluent target market comes out. (1998, January). Chain Store Age, 74(1), 54. Al-Olayan, F. S., & Karande, K. (2000, Fall). A content analysis of magazine advertisements from the United States and the Arab world. Journal of Advertising, 29(3), 69-82. Bailey, A. A. (2006). A year in the life of the African-American male in advertising: A content analysis. Journal of Advertising, 35(1), 83-104.
136

GLOBAL JOURNAL OF BUSINESS RESEARCH ♦ VOLUME 4 ♦ NUMBER 2 ♦ 2010
Berelson, B. (1952). Content Analysis in communications research, 3rd Edition. Glencoe: The Free Press. Bristor, J. M. L., Gravois, R., & Hunt, M. R. (1995). Race and ideology: African-American images in television advertising. Journal of Public Policy & Marketing, 14(1), 48-59. Buford, H. (2000, Spring). Understanding gay consumers. [Electronic Version]. The Harvard Gay & Lesbian Review, 7(2). Carrigan, M. & Szmigin, I. (1999, July). The representation of older people in advertisements. Market Research Society. Journal of the Market Research Society, 41(3), 311- 326. Cohen, J. (1992). White consumer response to Asian models in advertising. Journal of Consumer Marketing, 9(2), 17-27. Coltrane, S., & Messineo, M. (2000). The perpetuation of subtle prejudice: race and gender imagery in 1990s television advertising. Sex Roles, 42(5/6), 363-389. Cui, G. (1997, Winter). Marketing strategies in a multicultural ethnic environment. Journal of Marketing Theory and Practice, 122-34. Debevec, K., & Iyer, E. (1988). Self-referencing as a mediator of the effectiveness of sex-role portrayals in advertising. Psychology and Marketing, 5(1), 71-84. Doyle, R. (2005, March). Gay and lesbian census. Scientific American, 28. Fugate, D. L. (1993). Evaluating the US male homosexual and lesbian population as a viable target market segment. Journal of Consumer Marketing, 10(4), 46-57. GLBT loyalty. (2007, January). Incentive, 181(1), p. 9. Graham, J. L., Kamins, M. A., & Oetomo, D. S. (1993). Content analysis of German and Japanese advertising in print media from Indonesia, Spain, and the United States. Journal of Advertising, 22(2), 5-15. Grier, S. A., & Brumbaugh, A. M. (1999, Spring). Noticing cultural differences: ad meanings created by target and non-target markets. Journal of Advertising, 28(1), 79-94. Healey, J. S., & Kassarjian, H. H. (1983). Advertising substantiation and advertiser response: a content analysis of magazine advertisements. Journal of Marketing, 47(1), 107-117. Johnson, R. (2008). 2006-2007 Gay and lesbian TV. Retrieved June 27, 2008, from: http://gaylife.about.com/od/entertainment/a/gay_tv.htm Kassarjian, H.H. (1977, June). Content analysis in consumer research. Journal of Consumer Research, 4(1), 8-18. Kolbe, R. H., & Albanese, R. J. (1996, Winter). Man to man: A content analysis of sole-male images in male-audience magazines. Journal of Advertising, 25(4), 1-20. Martin, B. A. S., Lee, C. K. C., & Yang, F. (2004, Winter). The influence of ad model ethnicity and self- referencing on attitudes. Journal of Advertising, 33(4), 27-37.
137

S. Baxter Global Journal of Business Research ♦ Vol. 4 ♦ No. 2 ♦ 2010
Marzano-Lesnevich, A. (n.d.). Camping the ad: a theoretical application of camp theory to marketing concerns. Retrieved June 20, 2004, from http://www.geocities.com/alexandriathegirl/campad.htm Miller, C. (1990, December 24). Gays are affluent but often overlooked market. Marketing News, p. 2. Naccarato, J. L., & Neuendorf, K. A. (1998). Content analysis as a predictive methodology: Recall, readership, and evaluations of business-to-business print advertising. Journal of Advertising Research, 38(3), 19-33. Nisberg, J. N., & Nierenberg, D. C. (2004, May 17). A professional approach to niche marketing. [Electronic Version]. Accounting Today, 18(9), 8-11. Odekerken-Schroder, G., De Wulf, K., & Hofstee, N. (2002). Is gender stereotyping in advertising more prevalent in masculine countries? A cross national analysis. International Marketing Review, 19(4/5), 408-419. Penaloza, L. (1996). We’re here, we’re queer, and we’re going shopping! A critical perspective on the accommodation of gays and lesbians in the United States marketplace. Journal of Homosexuality, 31(1/2), 9-41. Penaloza, L., & Gilly, M.C. (1999). Marketer acculturation: the changer and the changed. Journal of Marketing, 63, 84-104. Peterson, R. T. (1995). The portrayal of senior citizens by banks in newspaper advertisements: A content analysis. Journal of Professional Services Marketing, 12(2), 95-106. Phillips, B. J., & McQuarrie, E. F. (2002, Winter). The development, change, and transformation of rhetorical style in magazine advertisements 1954-1999. Journal of Advertising, 31(4), 1-13. Puechl, M. (2004, February 3). Boost profits: market to the gay community. Retrieved June 19, 2004, http://www.promotenewz.com/poromotenewx-11-20040203boostprofitsmarkettothegaycommunity.html Qualls, W. J., & Moore, D. J. (1990). Stereotyping effects on consumers’ evaluation of advertising: Impact of racial differences between actors and viewers. Psychology & Marketing, 7(2), 135-151. Riche, M. F. (1991). We’re all minorities now. American Demographics, 13(10), 26-31. Ringhold, D. J. (1995). Social criticisms of target marketing: Process or product. American Behavioral Scientist, 398(Feb), 578-592. Sass, E. (2006, May 11). Gay ad market tops $212 million. Retrieved May 7, 2006 from http://opuscommgroup.com/NewsRomm.html#Anchor-Gay-14210 Sayre, S. (1992, Winter). Content analysis as a tool for consumer research. The Journal of Consumer Marketing, 9(1), 15-25. Schwartz, J. (1992, April). Gay consumers come out spending. American Demographics, 10-11. Schweinsberg, C., Winter, D. & Zachary, K. (2004, April 23). Straight eye for the gay buyer. Ward’s Auto World, 40(4), 36-41.
138

GLOBAL JOURNAL OF BUSINESS RESEARCH ♦ VOLUME 4 ♦ NUMBER 2 ♦ 2010
Sheth, J.N., Gardner, D.M., & Garrett, D.E. (1988). Marketing theory: evolution and evaluation. New York: John Wiley & Sons. Sheth, J.N., Mittal, B. and Newmann, B.I. (1999). Customer Behavior: Consumer Behavior and Beyond, Harcourt Brace and Company: Orlando, FL Stern, B. L., Krugman, D. M., & Resnik, A. (1981, April). Magazine advertising: An analysis of its information content. Journal of Advertising Research, 21(2), 39-44. Taylor, C. R., & Bang, H. (1997, Summer). Portrayals of Latinos in magazine advertising. Journalism & Mass Communication Quarterly, 74(2), 285-303. Tuten, T. L. (2005). The effect of gay-friendly and non-gay-friendly cues on brand attitudes: A comparison of heterosexual and gay/lesbian reactions. Journal of Marketing Management, 21(3/4), 441-461. U.S. Census Bureau. (2007, September 12). 2006 Community Survey, Retrieved October 7, 2008, from http://factfinder.census.gov/servlet/DTTable?_bm=y&-context=dt&-ds_name=ACS_2006_EST_G00_&-mt_name=ACS_2006_EST_G2000_B02001&-CONTEXT=dt&-tree_id=306&-redoLog=false&-all_geo_types=N&-geo_id=01000US&-currentselections=ACS_2006_EST_G2000_B02001&-search_results=01000US&-format=&-_lang=en. Winter, D. (2004, April). GLBT market can’t be ignored. [Electronic Version]. Ward’s Auto World, 40(4), 5. Wilke, M. (2004, June 8). Commercial closet report: US Census offers new same-sex couple data. Retrieved May 21, 2007 from the World Wide Web: http://www.hrc.org/Template.cfm?section=home&CONTENTID=19717&TEMPLATE=/ContentManagement/ContentDisplay.cfm Zinkhan, T., Qualls, W. J., & Biswas, A. (1990). The use of blacks in magazines and television advertising: 1946 to 1986. Journalism Quarterly, 67(3), 547-553. ACKOWLEDGEMENTS This paper could not be possible without the support of family and friends, as well as the careful eyes and thoughtful comments of two anonymous reviewers. Thanks to A. Wanderer for proof reading – any errors remaining are my own. BIOGRAPHY
Dr. Susan Baxter is an Assistant Professor of Marketing at Farmingdale State College – SUNY. She can be contacted at Farmingdale State College, 2350 Broadhollow Rd., Thompson Hall #127, Farmingdale, NY 11735. Email: [email protected]
139


GLOBAL JOURNAL OF BUSINESS RESEARCH ♦ VOLUME 4 ♦ NUMBER 2 ♦ 2010
A UNIFYING APPROACH FOR COMPARING ONE-TIME PAYOUTS AND RECURRING DIVIDENDS
Komlan Sedzro, University of Quebec at Montreal
ABSTRACT
This paper examines the market responses to four cash payout methods: regular dividend increases, special dividends, tender-offer repurchases and open market repurchases. We also investigate the reasons why firms choose one payout form over another. We use relative, and discounted relative, residuals as the unifying concepts whereby the market reaction is related to payout magnitude and likely recurrence as need be. With these measures, the responses to one-time payouts and recurring dividends can be directly compared and integrated for testing purposes. Our results show that various forms of payouts can be equally effective provided the form is properly chosen, repurchases being more efficient for erasing larger stock undervaluation whereas dividends will best be chosen for mitigating agency problem. JEL: G32; G35 KEYWORDS: Relative Residuals; Signaling; Agency Theory; Regular Dividends; Special Dividends;
Tender Offer Repurchases; Open Market Repurchases. INTRODUCTION
e compare the market responses to four competing forms of incremental payouts: regular dividend increases, special dividends, self-tender offer repurchases and open market repurchases. We also investigate the reasons why firms choose one payout form over another.
Our purpose is to assess the extent to which the market responses involved are compatible with prevailing hypothesis, namely the agency and signaling theories. At the same time, we want to address the still obvious lack in the literature, deplored by Ofer and Thakor (1987), of coherent measures for comparing the market’s reaction to one-time payouts with the reaction to recurring payouts. Accordingly, we put forward the unifying concepts of relative, and discounted relative, residuals whereby the market response is related to payout magnitude and, whenever applicable, recurrence of payouts. The integrated framework used is convenient for securing evidence about questions such as the following: 1) Does the announcement of a dollar of payout elicit the same market response whatever the payout form chosen and the total amount it is part of? 2) Which signaling or agency theory implications appear to be the most compatible with the competing market responses observed? 3) What indications do the market responses provide about the economic rationale behind the payout form chosen? Etc. Our tentative answers are obtained using US data from the 1985-2003 periods. They include 1,304 regular dividend increases and 249 special dividends in addition to 63 self-tender offer repurchases and 547 open market repurchases. To the extent that a low Q ratio indicates stock undervaluation or poor growth opportunities for a firm, and its combination with large cash flows reflects overinvestment (Lang et al., 1991), our results essentially suggest that various forms of payouts are equally effective signals but convey different information: 1) more undervalued firms will be inclined to repurchase their shares on a self-tender basis; 2) less undervalued firms will favor open market repurchases; 3) firms with growth opportunities will prefer disbursing special dividends; 4) firms likely to overinvest (those with low Q and large cash flows) will be more inclined to increase regular dividends.
W
141

K. Sedzro Global Journal of Business Research ♦ Vol. 4 ♦ No. 2 ♦ 2010
The remainder of the paper is organized as follows. Section 2 reviews the literature that is deemed pertinent for explaining the market responses to multiform payouts. In section 3, we describe our sampling procedure before we characterize the variables that influence the choice of payout forms by firms. Section 4 presents our results indicating that the various forms of payouts can have equally valuable effects provided the form chosen is appropriate, repurchases being more effective for erasing larger stock undervaluation whereas dividends will best be chosen for mitigating agency problems. Section 5 summarizes our findings. LITERRATURE REVIEW Agency and signaling hypothesis are the two major theories for explaining the market reaction to dividend payouts. On the one hand, according to signaling theory, a “good” company will find advantageous to differentiate itself from a “bad” company by increasing its payout, because, by doing so, it sends a credible message about its performance. Therefore, the value of its share will rise beyond the opportunity cost related to an increased payout. On the other hand, according to agency theory, a company that increases its payout distributed an increased fraction of its cash flow. By doing so, the manager (the shareholders’ agent) has less opportunity to squander the company’s value. Consequently, the increase in payouts reduces its agency costs related to cash flow and increase the value of its shares. These theories also provide frameworks for comparing market responses to multiform payouts. From a signaling standpoint, the relative advantage of dividends relative to repurchases depends, namely, on the signaling costs considered. For example, in Miller and Rock (1985), where signaling costs lie in reduced future profitable investment, equal amounts of dividends and repurchases are perfect substitutes and either announcement should elicit the same market reaction. In John and Williams (1985) however, where signaling costs lie in the imposed revenue taxation, they are not perfect substitutes since dividends are taxed at a higher rate than revenues from repurchases. Thus, the market should react differently in the two cases. Finally, according to Ofer and Thakor (1987), announced dividend and repurchase decisions are both valid signals, and neither signal always dominates over the whole range of possible distributions. On a dollar for dollar basis, dividends are less costly signals than repurchases but the amount required to convey private managerial information is greater in the case of dividends. Consequently, dividends will be a more (less) effective distribution method than repurchases to correct for smaller (larger) stock undervaluation. Similar conclusions are reachable within other theoretical frameworks. For instance, Brennan and Thakor (1990) do so after relying on shareholder preferences expressed through an unspecified majority voting procedure. According to the agency theory in its free cash flow version (Jensen, 1986), managers with excess funds will tend to keep the resources under their control and accept wealth-reducing projects. Should they resist overinvestment and increase payouts instead, stock value should rise to the extent of the averted loss in rents. In the same vein, Kanatas and Ofer (1990) assert that only a seemingly permanent increase in dividends will bring the market to revise the firm's value upward. Single payouts are not convincing enough for the market because, once made, the incentive to reduce agency costs abates. More recently, combining elements of free cash theory with the evolution in the firm’s investment opportunity, DeAngelo and DeAngelo (2006) propose a lifecycle explanation of dividends whereby younger firms with high growth opportunities will refrain from paying dividends while more mature firms with large cash flows and less investment opportunities will optimally pay out the excess funds. Even if prevailing theories provide partially competing, although not mutually exclusive, explanations of the market response to multiform payouts, the literature has heretofore been devoid of integrated empirical comparisons. In fact, the available evidence is mainly restricted to studies involving payouts of the same nature, namely those of Charest (1978) and Aharony and Swary (1980) for regular dividend increases, Brickley (1983) and Jayaraman and Shastri (1988) for special dividends and Vermaelen (1981)
142

GLOBAL JOURNAL OF BUSINESS RESEARCH ♦ VOLUME 4 ♦ NUMBER 2 ♦ 2010
and Comment and Jarrell (1991) for repurchases. The obvious need is for tests comparing different forms of payouts within an integrated framework as recognized by Ofer and Thakor (1987). These authors warned of the methodological difficulty in comparing the announcement residuals involved, given that typical repurchases compared to dividends consume a much larger fraction of firm equity. Few studies compare the market reaction to different cash payout methods. Choi and Chen (1997) show results indicating that tender-offer repurchases elicit a more positive stock price reaction upon announcement than increases in regular dividends. More recently, and after controlling for payout size and the market’s expectation about cash flow shocks, Guay and Harford (2000) present results indicating a higher positive market response to dividend increases when compared to open market repurchases. However, these studies involve essentially the treatment of only two payout methods. An exception is Lie (2000) who studies three payout methods but on a distinct basis. For firms paying large special dividends, he finds that their announcement residuals are related to their excess funds and investment opportunities. He observes a similar relation for self-tender offers and no significant relation when increments in regular dividends are considered. Let us now describe the variables that are deemed pertinent in the literature to affect the choice between payout methods. Signalling Related to Size and Yield Variables Signalling theory argues that management has private information about a firm’s prospects which is superior to that available to investors. The latter will interpret an increase in cash distribution as a signal that management entertains improved prospects. Thus, signalling models predict a market reaction that increase with signal intensity and degree of informational asymmetry between managers and investors (Miller and Rock, 1985; John and Williams, 1985). Following Yoon and Starks (1995), etc., we use a Size variable as a proxy for informational asymmetry since it is widely documented that more (less) asymmetry are associated with smaller (larger) firms. The increase in yield (∆Yield) implied by the distribution is used as a proxy for signal intensity following Asquith and Mullins (1986) and Denis et al. (1994). ∆Yield is measured by dividing the per share cash paid out (∆D) by the share price observed two days prior to announcement date, where ∆D is the announced increase in payout per share for the dividend categories (regular and special). For the tender-offer repurchase category, ∆D equals the targeted number of shares multiplied by the per share offer price and divided by the number of shares outstanding; for the open market repurchase category, ∆Yield equals the percentage of shares announced to be repurchased. Agency Context and Variables at Play According to agency theory, firms with substantial free cash flows will tend to overinvest by accepting negative net present value projects, rather than distributing the excess cash flows to shareholders. To curb overinvestment, Jensen (1986) argues that debt service may be more effective than dividends in many forms. For instance, share repurchases are mild commitments that leave managers much in control of future free cash flows. Similarly, an increase in regular dividends is also a weak commitment since dividends can be reduced in the future. Hence, the view that because it is more binding, debt service can only but be more effective in preventing managers from making poor use of free cash flows. Some authors, including Feldstein and Green (1983), contend that dividend payments may simply be used as a means of control over the desired leverage ratio. Another aspect underlined by Jensen and Meckling (1976) and developed by Rozeff (1982), is that the agency problem relates to extant managerial ownership in the firm and dividend policy. According to Rozeff, dividends are part of the firm’s optimum monitoring package and serve to reduce agency costs. Bagwell and Judd (1988) make a possibly more compelling case whereby dominant shareholders, be they managers, will favor the payment of dividends since it always keeps the firm ownership intact, contrary to share repurchases.
143

K. Sedzro Global Journal of Business Research ♦ Vol. 4 ♦ No. 2 ♦ 2010
Consequently, more managerial, and dominance in, ownership, will favor the choice of dividends over repurchases. Overinvestment is taken into account below by combining the Tobin’s Q and Cashflow variables as justified in Lang et al. (1991) and Denis et al. (1994). Q ratios are measured as the sum of the market value of equity, book value of long-term debt, book value of short-term debt, and preferred stock at carrying value, divided by the book value of assets. As in Lang et al. (1991), Cashflow equals operating income before depreciation minus interest expenses, taxes, preferred and common dividends. The ratio of total debt over total asset is used as a proxy for leverage. Ownership is measured as the fraction of shares held by the officers and directors as well as the major stockholders with at least 10% of the firm’s stock as recorded in the Value Line issue preceding the announcement. SAMPLES CHARACTERIZED AND METHODOLOGY In this section, we describe our sampling procedure and characterize the sampled firms in terms of variables that are hypothesized to explain the preference for a given payout form. The sample is drawn from the set of firms quoted on the NYSE and AMEX during the 1985-2003 periods. The announcement dates are taken from the CRSP files for the dividend cases whereas those of the self-tender and open market repurchases come from the Security Data Company’s online database of domestic acquisitions. The sampled cases meet the following criteria: 1) The necessary data can be found on the CRSP (Daily Return and Daily Master) files. 2) Regular dividends are paid quarterly and the increase occurs after at least two years of stability as justified in Charest (1978). 3) Announcements of special dividends (whether labeled ''special'' or ''extra'') are not preceded by similarly labeled dividends within the two previous years. 4) Repurchases must be clearly identifiable as being of the tender-offer or open market type. The sampling procedure yielded 1,304, 249, 62 and 547 cases of regular dividend increases, special dividends, tender-offer, and open market, repurchases, respectively. The Variables Characterized Table 1 shows, in accordance with expectations (Ofer and Thakor, 1987; and Brennan and Thakor, 1990), that larger payouts occur through repurchases of the two types. Indeed, we find that the mean increase in payout, ∆D, and the corresponding effect on yield, ∆Yield, are respectively $4.90, 19.06% for tender-offer repurchases and $1.51 and 6.63% for open market repurchases. We observe much lower corresponding levels for regular dividend increases ($0.06 and 0.31%) and special dividends ($0.69 and 4.18%). The Kruskall-Wallis chi-square statistics indicate significant differences with a p-value at the 1% level. As for the other variables (Size, Ownership, Cashflow, Q ratios and Debt), they differ significantly across firms resorting to different forms of payouts. The indication here is that the choice of payout form may depend on firm-specific characteristics. To better understand the preference for a given form of payout, a multinomial logit analysis is also conducted. The probability of observing form j = 0, 1, 2 or 3 when firm i chooses between increase in regular dividends, special dividend, tender-offer, or open market, repurchases, respectively, for enlarging its payout is taken to be a function of its characteristics (Xik; k=1,..., n=6), that is,
Prob(Y=j|Xik) =
∑ ∑
∑=
3
0=j
6
1=kikjk
6
1ikjk
)X(ßexp
)X(ßexpk (1)
144
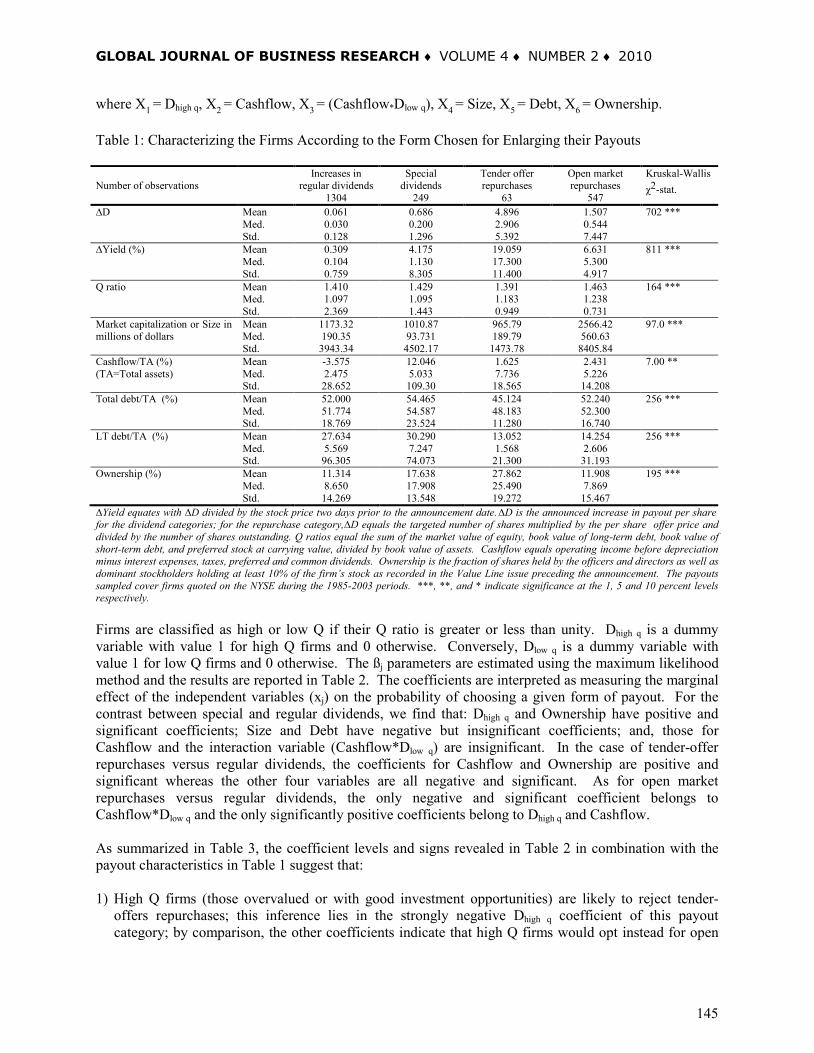
GLOBAL JOURNAL OF BUSINESS RESEARCH ♦ VOLUME 4 ♦ NUMBER 2 ♦ 2010
where X1 = Dhigh q, X2 = Cashflow, X3 = (Cashflow*Dlow q), X4 = Size, X5 = Debt, X6 = Ownership. Table 1: Characterizing the Firms According to the Form Chosen for Enlarging their Payouts Number of observations
Increases in regular dividends
1304
Special dividends
249
Tender offer repurchases
63
Open market repurchases
547
Kruskal-Wallis χ2-stat.
∆D Mean Med. Std.
0.061 0.030 0.128
0.686 0.200 1.296
4.896 2.906 5.392
1.507 0.544 7.447
702 ***
∆Yield (%) Mean Med. Std.
0.309 0.104 0.759
4.175 1.130 8.305
19.059 17.300 11.400
6.631 5.300 4.917
811 ***
Q ratio Mean Med. Std.
1.410 1.097 2.369
1.429 1.095 1.443
1.391 1.183 0.949
1.463 1.238 0.731
164 ***
Market capitalization or Size in millions of dollars
Mean Med. Std.
1173.32 190.35
3943.34
1010.87 93.731
4502.17
965.79 189.79
1473.78
2566.42 560.63
8405.84
97.0 ***
Cashflow/TA (%) (TA=Total assets)
Mean Med. Std.
-3.575 2.475 28.652
12.046 5.033 109.30
1.625 7.736
18.565
2.431 5.226
14.208
7.00 **
Total debt/TA (%) Mean Med. Std.
52.000 51.774 18.769
54.465 54.587 23.524
45.124 48.183 11.280
52.240 52.300 16.740
256 ***
LT debt/TA (%) Mean Med. Std.
27.634 5.569 96.305
30.290 7.247 74.073
13.052 1.568
21.300
14.254 2.606
31.193
256 ***
Ownership (%) Mean Med. Std.
11.314 8.650 14.269
17.638 17.908 13.548
27.862 25.490 19.272
11.908 7.869
15.467
195 ***
∆Yield equates with ∆D divided by the stock price two days prior to the announcement date. ∆D is the announced increase in payout per share for the dividend categories; for the repurchase category, ∆D equals the targeted number of shares multiplied by the per share offer price and divided by the number of shares outstanding. Q ratios equal the sum of the market value of equity, book value of long-term debt, book value of short-term debt, and preferred stock at carrying value, divided by book value of assets. Cashflow equals operating income before depreciation minus interest expenses, taxes, preferred and common dividends. Ownership is the fraction of shares held by the officers and directors as well as dominant stockholders holding at least 10% of the firm’s stock as recorded in the Value Line issue preceding the announcement. The payouts sampled cover firms quoted on the NYSE during the 1985-2003 periods. ***, **, and * indicate significance at the 1, 5 and 10 percent levels respectively. Firms are classified as high or low Q if their Q ratio is greater or less than unity. Dhigh q is a dummy variable with value 1 for high Q firms and 0 otherwise. Conversely, Dlow q is a dummy variable with value 1 for low Q firms and 0 otherwise. The ßj parameters are estimated using the maximum likelihood method and the results are reported in Table 2. The coefficients are interpreted as measuring the marginal effect of the independent variables (xj) on the probability of choosing a given form of payout. For the contrast between special and regular dividends, we find that: Dhigh q and Ownership have positive and significant coefficients; Size and Debt have negative but insignificant coefficients; and, those for Cashflow and the interaction variable (Cashflow*Dlow q) are insignificant. In the case of tender-offer repurchases versus regular dividends, the coefficients for Cashflow and Ownership are positive and significant whereas the other four variables are all negative and significant. As for open market repurchases versus regular dividends, the only negative and significant coefficient belongs to Cashflow*Dlow q and the only significantly positive coefficients belong to Dhigh q and Cashflow. As summarized in Table 3, the coefficient levels and signs revealed in Table 2 in combination with the payout characteristics in Table 1 suggest that: 1) High Q firms (those overvalued or with good investment opportunities) are likely to reject tender-
offers repurchases; this inference lies in the strongly negative Dhigh q coefficient of this payout category; by comparison, the other coefficients indicate that high Q firms would opt instead for open
145
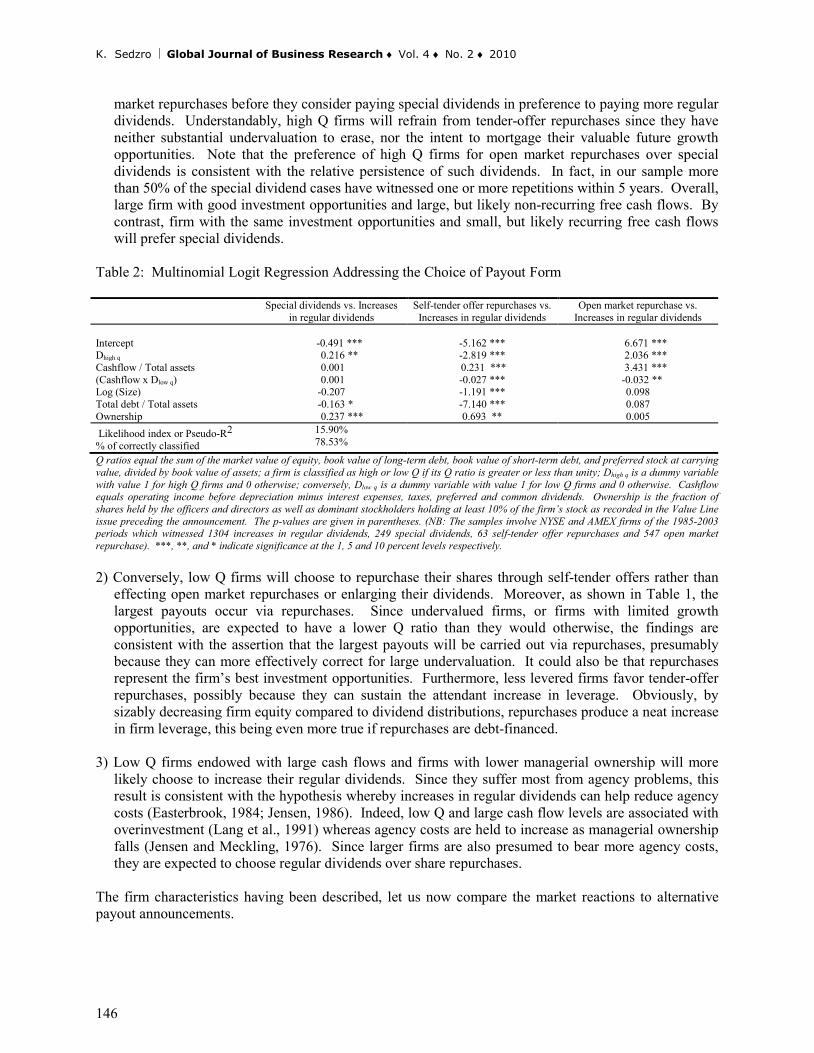
K. Sedzro Global Journal of Business Research ♦ Vol. 4 ♦ No. 2 ♦ 2010
market repurchases before they consider paying special dividends in preference to paying more regular dividends. Understandably, high Q firms will refrain from tender-offer repurchases since they have neither substantial undervaluation to erase, nor the intent to mortgage their valuable future growth opportunities. Note that the preference of high Q firms for open market repurchases over special dividends is consistent with the relative persistence of such dividends. In fact, in our sample more than 50% of the special dividend cases have witnessed one or more repetitions within 5 years. Overall, large firm with good investment opportunities and large, but likely non-recurring free cash flows. By contrast, firm with the same investment opportunities and small, but likely recurring free cash flows will prefer special dividends.
Table 2: Multinomial Logit Regression Addressing the Choice of Payout Form Special dividends vs. Increases
in regular dividends Self-tender offer repurchases vs.
Increases in regular dividends Open market repurchase vs.
Increases in regular dividends Intercept
-0.491 ***
-5.162 ***
6.671 ***
Dhigh q 0.216 ** -2.819 *** 2.036 *** Cashflow / Total assets 0.001 0.231 *** 3.431 *** (Cashflow x Dlow q) 0.001 -0.027 *** -0.032 ** Log (Size) -0.207 -1.191 *** 0.098 Total debt / Total assets -0.163 * -7.140 *** 0.087 Ownership 0.237 *** 0.693 ** 0.005 Likelihood index or Pseudo-R2 % of correctly classified
15.90% 78.53%
Q ratios equal the sum of the market value of equity, book value of long-term debt, book value of short-term debt, and preferred stock at carrying value, divided by book value of assets; a firm is classified as high or low Q if its Q ratio is greater or less than unity; Dhigh q is a dummy variable with value 1 for high Q firms and 0 otherwise; conversely, Dlow q is a dummy variable with value 1 for low Q firms and 0 otherwise. Cashflow equals operating income before depreciation minus interest expenses, taxes, preferred and common dividends. Ownership is the fraction of shares held by the officers and directors as well as dominant stockholders holding at least 10% of the firm’s stock as recorded in the Value Line issue preceding the announcement. The p-values are given in parentheses. (NB: The samples involve NYSE and AMEX firms of the 1985-2003 periods which witnessed 1304 increases in regular dividends, 249 special dividends, 63 self-tender offer repurchases and 547 open market repurchase). ***, **, and * indicate significance at the 1, 5 and 10 percent levels respectively. 2) Conversely, low Q firms will choose to repurchase their shares through self-tender offers rather than
effecting open market repurchases or enlarging their dividends. Moreover, as shown in Table 1, the largest payouts occur via repurchases. Since undervalued firms, or firms with limited growth opportunities, are expected to have a lower Q ratio than they would otherwise, the findings are consistent with the assertion that the largest payouts will be carried out via repurchases, presumably because they can more effectively correct for large undervaluation. It could also be that repurchases represent the firm’s best investment opportunities. Furthermore, less levered firms favor tender-offer repurchases, possibly because they can sustain the attendant increase in leverage. Obviously, by sizably decreasing firm equity compared to dividend distributions, repurchases produce a neat increase in firm leverage, this being even more true if repurchases are debt-financed.
3) Low Q firms endowed with large cash flows and firms with lower managerial ownership will more
likely choose to increase their regular dividends. Since they suffer most from agency problems, this result is consistent with the hypothesis whereby increases in regular dividends can help reduce agency costs (Easterbrook, 1984; Jensen, 1986). Indeed, low Q and large cash flow levels are associated with overinvestment (Lang et al., 1991) whereas agency costs are held to increase as managerial ownership falls (Jensen and Meckling, 1976). Since larger firms are also presumed to bear more agency costs, they are expected to choose regular dividends over share repurchases.
The firm characteristics having been described, let us now compare the market reactions to alternative payout announcements.
146

GLOBAL JOURNAL OF BUSINESS RESEARCH ♦ VOLUME 4 ♦ NUMBER 2 ♦ 2010
Table 3: Firm Characteristics and the Payout Form
Firm Type Payout form Firm with agency problems Increase in regular dividends Undervalued firms Tender offer repurchase Large firm with fairly good investment opportunities and large, but likely non-recurring free cash flows
Open market repurchase
Firm with valuable investment opportunities and small, but likely recurring free cash flows Special dividends
RESULTS: MEASURING THE MARKET REACTION TO PAYOUTS Comparing the Residuals Abnormal returns (residuals) are estimated from the market model using the CRSP equally-weighted Index and Scholes-Williams (1977) betas with an estimation period covering 120 daily stock returns, from days -70 to -11 and days + 11 to +70, relative to announcement day 0. The first column of Table 4 (panel A) shows the mean residuals for each sample. We observe highly significant residuals around all forms of payout announcements, from a low of 1.28% on average for increases in regular dividends to a high of 8.62% for tender-offer repurchases, with special dividends and open market repurchases falling in between at 1.86% and 1.71%, respectively. As evidenced by Table 4 (Panel B, first column), tender-offer repurchases have a mean residual that is significantly higher than those found for regular and special dividends and open market repurchases as revealed through Scheffé's multiple comparison procedure (In Scheffé’s procedure the decision rule is to reject Ho if | t | > ( )j Fj
a− −1 1 , where j is the number of comparisons, a, the significance level, t and F standing for the usual statistics (see Toothaker, 1993)). The stronger market reaction to tender-offer repurchases is consistent with the reasoning of Ofer and Thakor (1987), whereby repurchases are held to be more effective in correcting for larger stock price undervaluation. However, these residuals cannot be directly compared for at least two reasons: 1) self-tender repurchases, compared to other forms of payout, consume a much larger fraction of the firm's equity; and, 2) the amount by which the regular dividend is increased has a recurring nature compared to one-time payouts. The stronger market response observed for tender-offer repurchases could then be due to the larger yield increase involved (see Table 1). To make the market response directly comparable, we compute a stock’s payout related residual or relative residual (RR), by dividing its coincident residual by the change in yield implied by the announced payout; that is:
YieldYieldResidualRR
∆=
∆==
ARresidual Relative , (2)
where, ∆Yield=(∆D/Pt= -2), the change in yield, is given by the change in payout per share over the share price observed at day t=-2; here ∆D stands for the announced per share increase in regular dividends, the special dividend itself, or the expected payout from the shares tendered calculated thus: (Number of shares tendered)*(Per share offer price)/(Number of shares outstanding). As for open market repurchases, ∆Yield equals the percentage of shares announced to be repurchased by the firms. Developing equation (2), we have:
ΔDΔP Abnormal
ricedividend/Pin Changeeprice/Pricin change Abnormal
ΔYieldResidualRR === , (3)
147

K. Sedzro Global Journal of Business Research ♦ Vol. 4 ♦ No. 2 ♦ 2010
and see that the RR are estimates of the stock's abnormal price variation per added dollar paid out; as such, they lend themselves to comparisons of the wealth effects associated with alternative payouts. To illustrate, suppose identical firms A and B, except for number of shares priced at $16 and $32, respectively, announce a 2¢ dividend increase. Then, if the abnormal market reaction for A is 1%, it should be 0.5% for B, given that 1% of $16=0.5% of $32. Since both firms are identical, the market reaction per dollar paid out per share should also be identical. This is the case here since
RRA= ∆∆
PD= = =
1%(160 02
8)
. RRB = 05%(32
0 028
. ).
= .
Given the one-time nature of repurchases, the allegedly similar nature of special dividends and the persistent nature of the increase in regular dividends, comparisons should be improved if the RR’s of the latter are based on the present value of the increase. In fact, announcing an increase in the regular dividend is tantamount to announcing a permanent addition to revenue with a present value equal to: PV= (1+r)(∆D/r), (4) r being the discount rate measured following Choi and Chen (1997) as β)( fmf RRR −+ . Where Rf, Rm-Rf and β stand, respectively, for the risk-free rate (assumed to be 5%), the market risk premium (assumed to be 8%, a reasonable level given the high returns of the 1985-2003 periods involved) and the market model equity beta, the latter being estimated using daily stock returns and the CRSP value-weighted market returns for days –350 to –101 relative to announcement day 0. Hence our use of discounted relative residuals (DRR) which are measured thus:
DRR=yield added Total
ResidualPV/PriceResidual
= . (5)
Because the sampled regular dividend increases belong to quarterly series, quarterly discount rates are deemed suitable for calculating the DRR. Of course, DRR equates with RR for repurchases because they are clearly one-time payouts. For special dividends, the equality between RR and DRR could be a convenient assumption even though it is less likely the case. Indeed, in our sample, special dividend repetitions are observed for more than half the cases in the five years following the announcements. More precisely, 17.8%, 10.5%, 7.0%, 4.8% and 12.5% of them have been repeated 1, 2, 3, 4 and 5 times or more, respectively. Thus, it was deemed appropriate to measure the DRR for special dividends by assuming that their recurrence over a five-year horizon is perfectly anticipated. In Table 4 (Panel A, columns 2 and 3) we present the mean of our relative residuals measures (RR, and DRR) for each sample. We observe that when the market response is measured per dollar of added payout as is called for by our RR’s, then the relative response turns out to be much smaller (even though significant) for repurchases. That is 0.0065 and 0.0003 on average respectively for tender-offer and open market repurchases, compared to 0.95 for special dividends and 10.67 for increases in regular dividends. Furthermore, as Panel B shows, the average relative response to the increase in regular dividends is significantly stronger than the responses to special dividends and both repurchases categories whereas the difference between the latter two is not significant. This result is consistent with Jensen’s (1986) free cash flow theory, which suggests that the recurring payouts are more effective than one-time payouts for curbing agency costs. Alternatively, our results in terms of RR can be reconciled with signaling theory. After all, in the presence of valuable growth opportunities, and assuming, as in Kalay (1980), that the reluctance of managers to renege on their implicit dividend commitments represents a signaling cost (the cost
148
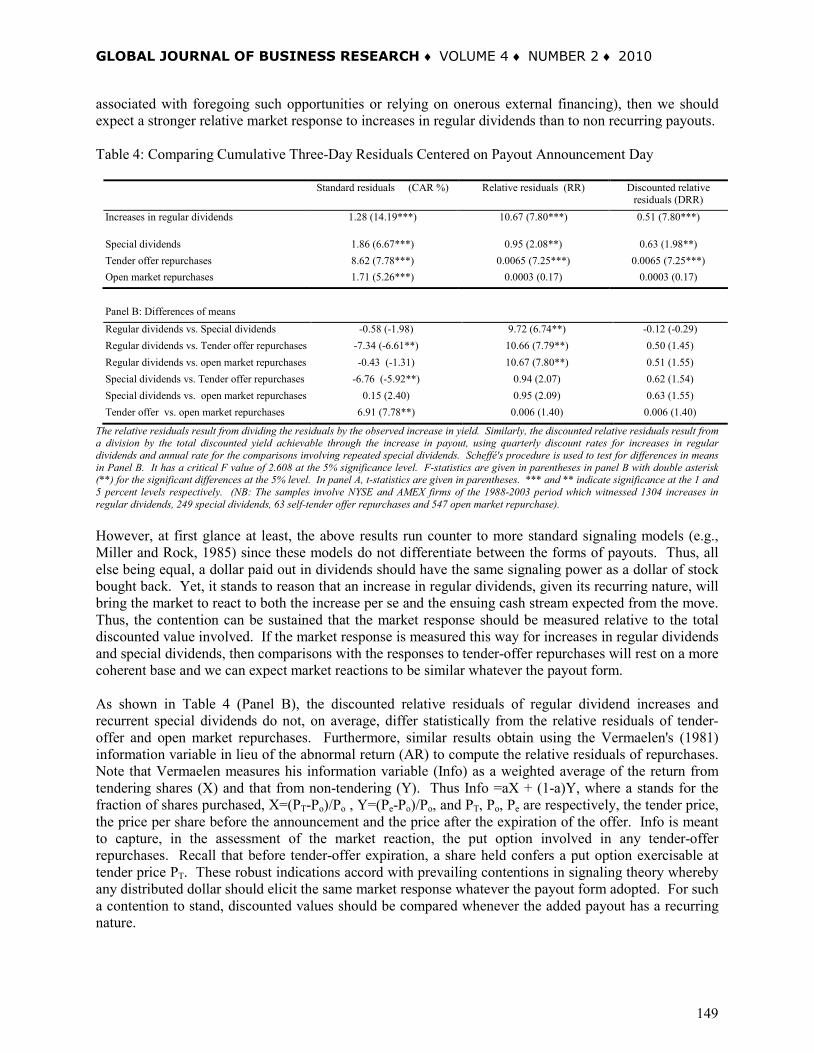
GLOBAL JOURNAL OF BUSINESS RESEARCH ♦ VOLUME 4 ♦ NUMBER 2 ♦ 2010
associated with foregoing such opportunities or relying on onerous external financing), then we should expect a stronger relative market response to increases in regular dividends than to non recurring payouts. Table 4: Comparing Cumulative Three-Day Residuals Centered on Payout Announcement Day
Standard residuals (CAR %) Relative residuals (RR) Discounted relative residuals (DRR)
Increases in regular dividends 1.28 (14.19***) 10.67 (7.80***) 0.51 (7.80***)
Special dividends 1.86 (6.67***) 0.95 (2.08**) 0.63 (1.98**) Tender offer repurchases Open market repurchases
8.62 (7.78***) 1.71 (5.26***)
0.0065 (7.25***) 0.0003 (0.17)
0.0065 (7.25***) 0.0003 (0.17)
Panel B: Differences of means Regular dividends vs. Special dividends -0.58 (-1.98) 9.72 (6.74**) -0.12 (-0.29) Regular dividends vs. Tender offer repurchases -7.34 (-6.61**) 10.66 (7.79**) 0.50 (1.45) Regular dividends vs. open market repurchases -0.43 (-1.31) 10.67 (7.80**) 0.51 (1.55) Special dividends vs. Tender offer repurchases -6.76 (-5.92**) 0.94 (2.07) 0.62 (1.54) Special dividends vs. open market repurchases 0.15 (2.40) 0.95 (2.09) 0.63 (1.55) Tender offer vs. open market repurchases 6.91 (7.78**) 0.006 (1.40) 0.006 (1.40)
The relative residuals result from dividing the residuals by the observed increase in yield. Similarly, the discounted relative residuals result from a division by the total discounted yield achievable through the increase in payout, using quarterly discount rates for increases in regular dividends and annual rate for the comparisons involving repeated special dividends. Scheffé's procedure is used to test for differences in means in Panel B. It has a critical F value of 2.608 at the 5% significance level. F-statistics are given in parentheses in panel B with double asterisk (**) for the significant differences at the 5% level. In panel A, t-statistics are given in parentheses. *** and ** indicate significance at the 1 and 5 percent levels respectively. (NB: The samples involve NYSE and AMEX firms of the 1988-2003 period which witnessed 1304 increases in regular dividends, 249 special dividends, 63 self-tender offer repurchases and 547 open market repurchase).
However, at first glance at least, the above results run counter to more standard signaling models (e.g., Miller and Rock, 1985) since these models do not differentiate between the forms of payouts. Thus, all else being equal, a dollar paid out in dividends should have the same signaling power as a dollar of stock bought back. Yet, it stands to reason that an increase in regular dividends, given its recurring nature, will bring the market to react to both the increase per se and the ensuing cash stream expected from the move. Thus, the contention can be sustained that the market response should be measured relative to the total discounted value involved. If the market response is measured this way for increases in regular dividends and special dividends, then comparisons with the responses to tender-offer repurchases will rest on a more coherent base and we can expect market reactions to be similar whatever the payout form. As shown in Table 4 (Panel B), the discounted relative residuals of regular dividend increases and recurrent special dividends do not, on average, differ statistically from the relative residuals of tender-offer and open market repurchases. Furthermore, similar results obtain using the Vermaelen's (1981) information variable in lieu of the abnormal return (AR) to compute the relative residuals of repurchases. Note that Vermaelen measures his information variable (Info) as a weighted average of the return from tendering shares (X) and that from non-tendering (Y). Thus Info =aX + (1-a)Y, where a stands for the fraction of shares purchased, X=(PT-Po)/Po , Y=(Pe-Po)/Po, and PT, Po, Pe are respectively, the tender price, the price per share before the announcement and the price after the expiration of the offer. Info is meant to capture, in the assessment of the market reaction, the put option involved in any tender-offer repurchases. Recall that before tender-offer expiration, a share held confers a put option exercisable at tender price PT. These robust indications accord with prevailing contentions in signaling theory whereby any distributed dollar should elicit the same market response whatever the payout form adopted. For such a contention to stand, discounted values should be compared whenever the added payout has a recurring nature.
149

K. Sedzro Global Journal of Business Research ♦ Vol. 4 ♦ No. 2 ♦ 2010
To sum up, the results shown in Table 4 appear consistent with signaling theories provided the signals are expressed in terms of discounted expected payouts whenever applicable. Thus, a marginal dollar distributed through an increase in regular dividends leads to a stronger relative market response due to its recurring nature. The regression results below complement our evidence on the effectiveness of various payouts. Regression Results In our regression models, the dependent variable is the market reaction as measured by the three-day standard cumulative residuals straddling the payout announcements. These models are estimated using weighted least squares with the weights equal to the inverse of the standard deviation of the market model residuals. This estimation procedure was used because we found the variance of the market model residuals to vary across firms (OLS regressions yield similar results). In Model 1, the market reactions are related to the nature of the payouts. The results shown in Table 5 (Model 1) indicate that: (a) the market reacts positively and significantly to increases in regular dividends since the constant term, which captures the average market response to such increases, is positive and significant; and (b) the average market responses to special dividends, tender-offer, and open market, repurchases are stronger than that for regular dividends since the coefficients of DSpec, DTor, and DOmr are positive and significant. Note that these three coefficients measure the differential average market responses to special dividends, tender-offer, and open market, repurchases relative to the response associated with the regular dividends. However, the wealth effects associated with the four forms of payouts cannot be directly compared unless the magnitude of the added payout involved is taken into account. This is achieved by extending model (1) using a ∆Yield variable and three interaction terms, as per estimated models (2a), (2b) and (2c). The interaction variables (DSpec *∆Yield), (DTor*∆Yield) and (DOmr*∆Yield) are included to determine whether the sensitivity of the market response differs with payout form. Their coefficients capture the differential effects on the stock price per dollar of special dividends, tender-offer and open market repurchases relative to a dollar increase in regular dividends. As shown in Table 5 (model 2a), the ∆Yield coefficient is negative but insignificant whilst the three interaction coefficients (DSpec*∆Yield, DTor*∆Yield, DOpr*∆Yield) are positive and significant. This reveals that the increase in regular dividends elicits a weaker market response per dollar of payout compared to either, special dividends, tender-offer, or open market, repurchases. A premature conclusion here would be that the relative market reaction is stronger for special dividends or repurchases (tender offer or open market) than it is for regular dividends. This contradicts Ofer and Thakor’s (1987) view whereby, on a dollar for dollar basis, dividends and repurchases are both valid signals with one never dominating the other over the whole range of payouts. Nonetheless, given the results of Model 3 (Table 5), for the dividend increase cases, we can sustain the contention that the relative market response is stronger for regular dividends of smaller magnitude, since the interaction variable (Dlow div) is positive and significant. A more convincing test should therefore involve two separate regressions of type (2a). Accordingly, we estimated the first one using the below-mean subsample of dividend increases (Model 2b) combined with the complete samples of special dividends and both types of repurchases. In the second regression, the sampled cases combine the above-mean increases in regular dividends with special dividends and both types of repurchases. As expected, the coefficients of the three interaction variables are all negative and significant in regression (2b) whereas in regression (2c) they are positive and significant. This accords with Ofer and Thakor’s (1987) model in which: (a) for relatively small distributions, the marginal wealth effect of a
150

GLOBAL JOURNAL OF BUSINESS RESEARCH ♦ VOLUME 4 ♦ NUMBER 2 ♦ 2010
dollar paid out through an increase in regular dividends is stronger than that of a dollar distributed via repurchases; and, (b) for large distributions, repurchases elicit a stronger wealth effect. Table 5: Regression Analysis Comparing the Market Reaction to Regular Dividend Increases, Special Dividends, Tender-Offer Repurchases and Open Market Repurchases. Variables Model 1 Model 2a Model 3 Model 2b Model 2c Model 4 Model 5 Intercept 0.0108*** 0.0109*** 0.013*** 0.0029* 0.013*** 0.024*** 0.039*** Dhigh q -0.001 -0.007 Cashflow 0.001 0.006 Cashflow*Dlow q -0.005* -0.003 Size -0.002*** -0.003*** Debt -0.004 -0.012 Ownership -0.0001 0.0002* Dpost-1986 -0.003* 0.006 ∆Yield -0.0273 -0.152** 5.301*** -0.152 3.130** 0.0006 Dlow div -0.010*** DSpec 0.0159*** 0.0077*** 0.014*** 0.005** 0.009** 0.052*** DTor 0.0970*** 0.0585*** 0.067*** 0.056*** 0.059*** -0.140 DOmr 0.0112*** 0.0065*** 0.012*** 0.0043 0.007** -0.054* Dlow div *∆Yield 5.458*** (DSpec*∆Yield) 0.224** -5.110*** 0.356** -2.910** 0.377** (DTor*∆Yield) 0.265** -5.082*** 0.378** -2.978** 0.383** (DOmr*∆Yield) 0.189** -6.031*** 0.287** -3.112*** 0.192** Adj. R-square 0.123 0.156 0.01 0.173 0.218 0.316 0.332 In all our regression models, the dependent variable is the market reaction as measured by the three-day standard cumulative residuals. ***, **, and * indicate significance at the 1, 5 and 10 percent levels respectively. To check whether this finding is due to some firm-specific characteristics, it was deemed appropriate to extend models (2b) and (2c) using those variables that have been proved in our logit analysis to influence the preference of firms for a given form of payout, namely: Dhigh q, Cashflow, (Cashflow*Dlow q), Size, Debt and Ownership. In addition to these variables, we also included a dummy variable (Dpost-1986) with value 1 for post-1986 cases and 0 otherwise, since, as underscored by Bernheim and Wantz (1995), the 1986 Tax Reform Act may have changed appreciably the market response per dollar of a given form of payout. Indeed, Before January 1, 1987, the marginal tax rate on dividend revenues for wealthy individuals stood at 50% versus 20% for gains from repurchases (=50% of its 40% formerly taxable portion). See Auerbach and Slemrod, 1997, p. 597. Note that this variable may also proxy for other time-specific factors. For example, the investors' perception of dividend and repurchase events may have changed after the October 1987 crash. This extension of models (2b) and (2c) leads to our models (4) and (5) respectively. The results are included in Table 5. Let us note that the three interaction variables show coefficients that remain negative and significant in Model (4) but positive and significant in Model (5). Among the firm-specific factors, only the Size variable proves to be significant in both models at the 5% level. The coefficients for Dpost-1986 do not come out significant, thus indicating that the tax rate changes involved have not materially altered the relative market responses to competing forms of payouts. Overall, our results are seen as supportive of the contention that various payouts can be equally effective provided the form chosen is in harmony with the wealth effect sought by the firm. CONCLUSION We have evaluated, within an integrated framework, the effectiveness of increasing firm payouts via alternative forms: increases in regular dividends, special dividends, tender-offer repurchases or open market repurchases. The effectiveness is inferred from stock residuals defined in both standard and relative terms. Relative residuals measure the market’s reaction, in dollars of abnormal price change per dollar of the extra revenue paid out or promised. They make comparisons between one-time and
151

K. Sedzro Global Journal of Business Research ♦ Vol. 4 ♦ No. 2 ♦ 2010
recurring dividend payouts more coherent from a market standpoint and allow integration of findings about the market’s reaction to alternative payouts. The quality of comparisons is enhanced whenever relative residuals of one-time payouts are compared with the discounted relative residuals of increases in regular dividends, the latter involving the estimated present value of the likely permanent increase. Likewise, a logit analysis was performed to estimate the propensity of firms to opt for a given form of payout. We have found that an increase in regular dividends would be the choice of firms beset by agency problems (low managerial ownership, low Q ratios and large cash flows). More often than not, firms with valuable investment opportunities (high Q firms) will favor special dividends. By contrast, the most undervalued firms (low Q firms) will choose repurchases. In summary, the evidence gathered is supportive of the contention that various forms of payouts can be equally effective signals, provided the effectiveness measure takes into account the recurring nature of the payouts whenever applicable. However, this study presents some limitations that could be an interesting subject of future researches. For example, our measures of the payouts are naive, since we consider the entire added dividends as unexpected. The analysis could be refined using a forecasting model (see Lintner, 1956) to extract the unexpected part of the payout. Another possible research could be to test in an integrated framework, the claim that the market reaction to the issuance of debts is less negative than that related to equity issuances. To do so, we could apply the methodology developed in this paper to compare, on a dollar for dollar basis, the market responses to different financing methods. REFERENCES Aharony, J. and Swary I. (1980), Quarterly Dividends and Earnings Announcements and Stockholder Returns: An Empirical Analysis. Journal of Finance, 35, 1-12. Asquith, P. and Mullins D. (1986), Signaling with Dividends, Stock Repurchases, and Equity Issues. Financial Management, 15, 27-44. Auerbach, A. and Slemrod J. (1997), The Economic Effects of the Tax Reform Act of 1986. Journal of Economic Literature, 35, 589-632. Bagwell, L. and Judd K. (1988), Transaction Costs and Corporate Control. Mimeo, Northwestern University. Bagwell, L. and Shoven J. (1988), Cash Distributions to Shareholders. Journal of Economic Perspectives, 3, 129-140. Barclay, M. and Smith C. 1988, Corporate Payout Policy: Cash Dividends versus Open-Market Repurchases. Journal of Financial Economics, 22, 61-82. Bernheim, D. and Wantz A. (1995), A Tax-Based Test of the Dividend Signaling Hypothesis. American Economic Review, 85, 532-551. Brennan, M. and Thakor A. (1990), Shareholder Preferences and Dividend Policy. Journal of Finance, 45, 993-1018. Brickley, J. (1983), Shareholders Wealth, Information Signaling and the Specially Designated Dividend: An Empirical Study. Journal of Financial Economics, 12, 187-209.
152

GLOBAL JOURNAL OF BUSINESS RESEARCH ♦ VOLUME 4 ♦ NUMBER 2 ♦ 2010
Charest, G. (1978), Dividend Information, Stock Returns and Market Efficiency-II. Journal of Financial Economics, 6, 297-330. Choi, D. and Chen S. (1997), The Differential Information Conveyed by Share Repurchase Tender Offers and Dividend Increases. Journal of Financial Research, 20, 529-543. Comment, R. and Jarrell G. (1991), The Relative Signaling Power of Dutch-Auction and Fixed-Price Self-Tender Offers and Open-Market Share Repurchases. Journal of Finance, 46, 1243-1271. DeAngelo, H. and DeAngelo, L. (2006), The Irrelevance of the MM Dividend Irrelevance Theorem. Journal of Financial Economics, 79, 293–315. Denis, D., Denis D. and Sarin A. (1994), The Information Content of Dividend Changes: Cash Flow Signaling, Overinvestment, and Dividend Clienteles. Journal of Financial and Quantitative Analysis, 29, 567-587. Easterbrook, F. (1984), Two Agency-Cost Explanations of Dividends. American Economic Review, 74, 650-659. Feldstein, M. and Green J. (1983), Why Do Companies Pay Dividends? American Economic Review, 73, 17-30. Guay, W. and Harford J. (2000), The Cash-Flow Permanence and Information Content of Dividend Increases vs. Repurchases. Journal of Financial Economics, 57, 385-415. Jagannathan, M. Stephens C. and Weisbach M. (2000), Financial Flexibility and the Choice between Dividends and Stock Repurchases. Journal of Financial Economics, 57, 355-384. Jayaraman, N. and Shastri K. (1988), The Valuation Impacts of Specially Designated Dividends. Journal of Financial and Quantitative Analysis, 23, 301-312. Jensen, M. (1986), Agency Costs of Free Cash Flow, Corporate Finance, and Takeovers. American Economic Review, 76, 323-329. Jensen, M. and Meckling W. (1976), Theory of the Firm: Managerial Behavior, Agency Costs and Ownership Structure. Journal of Financial Economics, 3, 305-360. John, K. and Williams J. (1985), Dividends, Dilution and Taxes: A Signaling Equilibrium. Journal of Finance, 40, 1053-1070. Kalay, A. (1980), Signalling, Information Content, and the Reluctance to Cut Dividends. Journal of Financial and Quantitative Analysis, 15, 885-869. Kanatas, G. and Ofer A. (1990), Managerial Incentives and Corporate Dividend Policy. Working Paper Northwestern University. Lang, L., Stultz R. and Walkling R. (1991), A Test of the Free Cash Flow Hypothesis: The Case of Bidder Returns. Journal of Financial Economics, 29, 315-335. Lie, E. (2000), Excess Funds and Agency Problems: an Empirical Study of Incremental Cash Disbursements. Review of Financial Studies, 13, 219-248.
153

K. Sedzro Global Journal of Business Research ♦ Vol. 4 ♦ No. 2 ♦ 2010
Lintner, J. (1956), Distribution of Incomes of Corporations among Dividends, Retained Earnings, and Taxes. American Economic Review, 46, 97-113. Miller, M. and Rock K. (1985), Dividend Policy under Asymmetric Information. Journal of Finance, 40, 1033-1052. Ofer, A. and Thakor A. (1987), A Theory of Stock Price Responses to Alternative Cash Disbursement Methods: Stock Repurchases and Dividends. Journal of Finance, 42, 365-394. Rozeff, M. (1982), Growth, Beta and Agency Costs as Determinants of Dividend Payout Ratios. Journal of Financial Research, 5, 249-259. Scholes, M. and Williams J. (1977), Estimating Betas from Non-Synchronous Data. Journal of Financial Economics, 5, 309-329. Toothaker, L. E. (1993), Multiple Comparison Procedures. Newbury Park, California. Sage Publications. Vermaelen, T. (1981), Common Stock Repurchases and Market Signalling. Journal of Financial Economics, 10, 139-183. Yoon, S. and Starks L. (1995), Signalling, Investment Opportunities, and Dividend Announcements. Review of Financial Studies, 8, 995-1018. BIOGRAPHY Dr. Komlan Sedzro is professor of finance at University of Quebec at Montreal. He can be contacted at Finance Department, School of Business and Management, University of Quebec at Montreal, CP 6192, succursale Centre-Ville, Montreal (Quebec) H3C 4R2. Email: [email protected].
154

REVIEWERS
The IBFR would like to thank the following members of the academic community and industry for the much appreciated contribution as reviewers.
Vera Adamchik University of Houston-VictoriaYousuf Al-Busaidi Sultan Qaboos UniversityGlyn Atwal Groupe Ecole Supérieure de Commerce de RennesSusan C. Baxter Bethune-Cookman CollegeKarel Bruna University of Economics-PragueWan-Ju Chen Diwan College of ManagementLeonel Di Camillo Universidad AustralSteven Dunn University of Wisconsin OshkoshWilliam Francisco Austin Peay State UniversityLucia Gibilaro University of BergamoDanyelle Guyatt University of BathZulkifli Hasan Islamic University College of MalaysiaTejendra N. Kalia Worcester State CollegeAnn Galligan Kelley Providence CollegeHalil Kiymaz Rollins CollegeBohumil Král University of Economics-PragueChristopher B. Kummer Webster University-ViennaMary Layfield Ledbetter Nova Southeastern UniversityXin (Robert) Luo Virginia State UniversityAndy Lynch Southern New Hampshire University
Cheryl G. Max IBMAvi Messica Holon Institute of TechnologyCameron Montgomery Delta State UniversityBilge Kagan Ozdemir Anadolu UniversityDawn H. Pearcy Eastern Michigan UniversityRahim Quazi Prairie View A&M UniversityAnitha Ramachander New Horizon College of EngineeringKathleen Reddick College of St. ElizabethMatthew T. Royle Valdosta State UniversityTatsiana N. Rybak Belarusian State Economic UniversityRafiu Oyesola Salawu Obafemi Awolowo UniversityPaul Allen Salisbury York College, City University of New YorkSunando Sengupta Bowie State UniversitySmita Mayuresh Sovani Pune UniversityJiří Strouhal University of Economics-PragueRamona Toma Lucian Blaga University of Sibiu-RomaniaJorge Torres-Zorrilla Pontificia Universidad Católica del PerúK.W. VanVuren The University of Tennessee – MartinVeronda Willis The University of Texas at San Antonio Eduardo Sandoval Universidad de Concepción

HOW TO PUBLISH
Submission Instructions
The Journal welcomes submissions for publication consideration. Authors wishing to submit papers for publication consideration should e-mail their manuscripts to [email protected]. Complete directions for manuscript submission are available at the Journal website www.theIBFR.com. Papers may be submitted for initial review in any format. However, authors should take special care to address spelling and grammar issues prior to submission. Authors of accepted papers are required to precisely format their document according to the guidelines of the journal.
There is no charge for paper reviews. The normal review time for submissions is 90-120 days. However, authors desiring a quicker review may elect to pay an expedited review fee. Authors who pay the expedited review fee are guaranteed an initial review within two weeks of submission and receipt of the fee. Authors of accepted papers are required to pay a publication fee based on the length of the manuscript. Please see our website for current publication and expedited review rates.
Authors submitting a manuscript for publication consideration must guarantee that the document contains the original work of the authors, has not been published elsewhere, and is not under publication consideration elsewhere. In addition, submission of a manuscript implies that the author is prepared to pay the publication fee should the manuscript be accepted.
Subscriptions
Individual subscriptions to the Journal are available for $50 per year. Library subscriptions are $100 per year. Please add $35 for shipping outside the United States. Payments should be made payable to: The Institute for Business and Finance Research. Please send payments for subscriptions to: Editor, The IBFR, P.O. Box 5569, Hilo, HI 96720. Other payment methods are acceptable. Please visit our website at www.theIBFR.com for information on all payment options.
Contact Information
Mercedes Jalbert, Managing Editor The IBFRP.O. Box 4908Hilo, HI [email protected]
Website
www.theIBFR.org or www.theIBFR.com

Review of Business & Finance Case Studies ISSN 2150-3338Review of Business and Finance Case Studies (ISSN:2150-3338 ) publishes high-quality case studies in all areas of business, finance and related fields. Cases based on real world and hypothetical situations are welcome.
All papers submitted to the Journal are double-blind reviewed. The RBFCS has been submitted to Cabell’s Publishing and will be submitted to Ulrich’s Periodicals Directory, EBSCOHost and The American Economic Association’s Econlit, e-JEL and JEL on CD and SSRN.
The journal accept rate is between 15 and 25 percent
REVIEW BUSINESS &FINANCE cASE sTUDIESOF Business Education
& AccreditationBE A
AT Accounting
Taxation&
Accounting and Taxation (AT)ISSN 1944-592XAccounting and Taxation (AT) publishes high-quality articles in all areas of accounting, auditing, taxation and related areas. Theoretical, empirical and applied manuscripts are welcome for publication consideration.
All papers submitted to the Journal are double-blind reviewed. BEA is listed in Cabell’s and will be submitted to Ulrich’s Periodicals Directory, EBSCOHost and The American Economic Association’s Econlit, e-JEL and JEL on CD and SSRN.
The journal acceptance rate is between 5 and 15 percent.
Business Education and Acreditation (BEA)ISSN 1944-5903Business Education & Accreditation publishes high-quality articles in all areas of business education, curriculum, educational methods, educational administration, advances in educational technology and accreditation. Theoretical, empirical and applied manuscripts are welcome for publication consideration.
All papers submitted to the Journal are double-blind reviewed. BEA is listed in Cabell’s and will be submitted to Ulrich’s Periodicals Directory, EBSCOHost and The American Economic Association’s Econlit, e-JEL and JEL on CD and SSRN.
The journal acceptance rate is between 15 and 25 percent.
PUBLICATION OPPORTUNITIES