Factors associated with cesarean sections in a public hospital in Rio de Janeiro, Brazil
12
2067 Cad. Saúde Pública, Rio de Janeiro, 22(10):2067-2078, out, 2006 ARTIGO ARTICLE Factors associated with cesarean sections in a public hospital in Rio de Janeiro, Brazil Fatores associados à realização de cesáreas em uma maternidade pública do Município do Rio de Janeiro, Brasil 1 Centro de Ciências da Saúde, Universidade Federal de Santa Catarina, Florianópolis, Brasil. 2 Escola Nacional de Saúde Pública Sergio Arouca, Fundação Oswaldo Cruz, Rio de Janeiro, Brasil. 3 Departamento de Ciência e Tecnologia, Ministério da Saúde, Brasília, Brasil. 4 Programa de Assistência Integral à Saúde da Mulher, Criança e Adolescente, Secretaria de Estado de Saúde do Rio de Janeiro, Rio de Janeiro, Brasil. 5 Faculdade de Serviço Social, Universidade do Estado do Rio de Janeiro, Rio de Janeiro, Brasil. 6 Centro de Informação e Saúde, Secretaria de Estado de Saúde do Rio de Janeiro, Rio de Janeiro, Brasil. Correspondence E. D’Orsi Departamento de Saúde Pública, Centro de Ciências da Saúde, Universidade Federal de Santa Catarina. Campus Universitário Trindade, Florianópolis, SC 88040-900, Brasil. [email protected] Eleonora D’Orsi 1 Dora Chor 2 Karen Giffin 2 Antonia Angulo-Tuesta 2,3 Gisele Peixoto Barbosa 2,4 Andréa de Sousa Gama 2,5 Ana Cristina Reis 2,6 Abstract Brazil has one of the world’s highest cesarean section rates. Contributing factors include the organization of obstetric practice, physicians’ attitudes, and women’s preferences and deci- sions. This study aimed to identify factors asso- ciated with cesarean sections in a public mater- nity hospital in Rio de Janeiro. A case-control study was conducted with 231 cesarean sections (cases) and 230 vaginal deliveries (controls). Hi- erarchical logistic regression analysis was per- formed, based on a conceptual model. Factors associated with increased odds of cesarean sec- tion were: primiparity; mother’s age 20-34; last birth by cesarean; cervical dilatation < 3cm at admission; patient request; daytime birth; male attending obstetrician; obstetrician on duty for more than 24 hours a week; obstetrician with private practice; gestational hypertension; non- cephalic presentation; and gestational age > 41 weeks. Factors associated with lower odds of ce- sarean were: gestational age < 37 weeks; leaving home with signs of labor, use of oxytocin; and amniotomy. In this hospital, interventions aimed to modify the above-mentioned factors can help lower the cesarean rate. Cesarean Section; Parturition; Maternity Introduction Brazil has one of the world’s highest cesarean section rates in the world (38% of live births in 2000) 1 , surpassed only by Chile, with 42% in 1999 2 . Recently, a slight downward trend in the cesarean rate has been observed in the Brazil- ian public sector, from 32% in 1994-1997 to 25% in 2001 3 . In Brazil, higher socioeconomic status is as- sociated with increased probability of a cesare- an section. Thus, the cesarean rate is higher in more developed regions like the Southeast (45%), South (40%), and Central-West (43%) than in the less developed North (27%) and Northeast (25%) 4 . The rate is also higher in private hospi- tals (70%) as compared to public (32%) 5 and in women with more schooling and higher in- come 6 . Another aspect of inadequate use of cesare- ans in Brazil is the difficult access to hospital care (particularly in poorer regions of the coun- try) 7 , but even in developed metropolitan ar- eas like Rio de Janeiro the excessive use of ce- sarean sections coexists with its absence when clearly indicated 8 . Studies suggest several factors related to the high cesarean rate, including obstetrician’s convenience with this programmed interven- tion 9 , physicians’ lack of training for unexpect- ed situations during delivery 10 , lack of integra- tion between prenatal and childbirth services,
Transcript of Factors associated with cesarean sections in a public hospital in Rio de Janeiro, Brazil

2067
Cad. Saúde Pública, Rio de Janeiro, 22(10):2067-2078, out, 2006
ARTIGO ARTICLE
Factors associated with cesarean sections in a public hospital in Rio de Janeiro, Brazil
Fatores associados à realização de cesáreas em uma maternidade pública do Município do Rio de Janeiro, Brasil
1 Centro de Ciências da Saúde, Universidade Federal de Santa Catarina,Florianópolis, Brasil.2 Escola Nacional de SaúdePública Sergio Arouca,Fundação Oswaldo Cruz,Rio de Janeiro, Brasil.3 Departamento de Ciência e Tecnologia, Ministério da Saúde, Brasília, Brasil.4 Programa de AssistênciaIntegral à Saúde da Mulher,Criança e Adolescente,Secretaria de Estado deSaúde do Rio de Janeiro,Rio de Janeiro, Brasil.5 Faculdade de ServiçoSocial, Universidade doEstado do Rio de Janeiro,Rio de Janeiro, Brasil.6 Centro de Informação eSaúde, Secretaria de Estadode Saúde do Rio de Janeiro,Rio de Janeiro, Brasil.
CorrespondenceE. D’OrsiDepartamento de SaúdePública, Centro de Ciênciasda Saúde, UniversidadeFederal de Santa Catarina.Campus UniversitárioTrindade, Florianópolis, SC88040-900, [email protected]
Eleonora D’Orsi 1
Dora Chor 2
Karen Giffin 2
Antonia Angulo-Tuesta 2,3
Gisele Peixoto Barbosa 2,4
Andréa de Sousa Gama 2,5
Ana Cristina Reis 2,6
Abstract
Brazil has one of the world’s highest cesareansection rates. Contributing factors include theorganization of obstetric practice, physicians’attitudes, and women’s preferences and deci-sions. This study aimed to identify factors asso-ciated with cesarean sections in a public mater-nity hospital in Rio de Janeiro. A case-controlstudy was conducted with 231 cesarean sections(cases) and 230 vaginal deliveries (controls). Hi-erarchical logistic regression analysis was per-formed, based on a conceptual model. Factorsassociated with increased odds of cesarean sec-tion were: primiparity; mother’s age 20-34; lastbirth by cesarean; cervical dilatation < 3cm atadmission; patient request; daytime birth; maleattending obstetrician; obstetrician on duty formore than 24 hours a week; obstetrician withprivate practice; gestational hypertension; non-cephalic presentation; and gestational age > 41weeks. Factors associated with lower odds of ce-sarean were: gestational age < 37 weeks; leavinghome with signs of labor, use of oxytocin; andamniotomy. In this hospital, interventions aimedto modify the above-mentioned factors can helplower the cesarean rate.
Cesarean Section; Parturition; Maternity
Introduction
Brazil has one of the world’s highest cesareansection rates in the world (38% of live births in2000) 1, surpassed only by Chile, with 42% in1999 2. Recently, a slight downward trend in thecesarean rate has been observed in the Brazil-ian public sector, from 32% in 1994-1997 to 25%in 2001 3.
In Brazil, higher socioeconomic status is as-sociated with increased probability of a cesare-an section. Thus, the cesarean rate is higher inmore developed regions like the Southeast (45%),South (40%), and Central-West (43%) than inthe less developed North (27%) and Northeast(25%) 4. The rate is also higher in private hospi-tals (70%) as compared to public (32%) 5 and inwomen with more schooling and higher in-come 6.
Another aspect of inadequate use of cesare-ans in Brazil is the difficult access to hospitalcare (particularly in poorer regions of the coun-try) 7, but even in developed metropolitan ar-eas like Rio de Janeiro the excessive use of ce-sarean sections coexists with its absence whenclearly indicated 8.
Studies suggest several factors related tothe high cesarean rate, including obstetrician’sconvenience with this programmed interven-tion 9, physicians’ lack of training for unexpect-ed situations during delivery 10, lack of integra-tion between prenatal and childbirth services,

D’Orsi E et al.2068
Cad. Saúde Pública, Rio de Janeiro, 22(10):2067-2078, out, 2006
and the hospital shift system, which does notallow women to remain in labor from one shiftto the next 11.
Contrary to allegations by some obstetri-cians, recent studies, including the Latin Amer-ican Study on Cesarean Sections (ELAC) 14, showa declared preference for vaginal birth amongBrazilian women (about 70%) 5,12,13. This studyshows faster recovery and a less painful post-partum as the principal reasons for this prefer-ence, and the absence of contractions as theprincipal advantage of a cesarean. Most womenfeel that a cesarean should be performed onlywhen there is no alternative (due to serious ill-ness of the woman or risk to the fetus) 14.
This study focuses on the association be-tween cesarean sections and factors related tothe patient, physicians, and organization of ob-stetric practice. Brazilian epidemiological stud-ies on these three dimensions are scarce 11,15.We thus aim to contribute to a more detailedknowledge of the mechanisms leading to cesare-an sections in the selected maternity hospital.
Methodology
Study design
A case-control study was conducted from Oc-tober 1998 to March 1999 in a public maternityhospital in the city of Rio de Janeiro, where ce-sarean deliveries were classified as cases andvaginal deliveries as controls.
The sample was planned to include 225 cas-es and 225 controls 16. With 80% power and a5% significance level, this number was suffi-cient to detect an odds ratio (OR) of ≥ 2.0 for anexposure among controls ranging proportion-ally from 15% to 70% 16. All cesarean deliveriesoccurring on the day prior to the interviews,plus a systematic sample of approximately 50%of the vaginal deliveries chosen from the hos-pital’s birth registry, were included in the study.Exclusion criteria were mother’s age < 16 years,gestational age < 28 weeks, stillbirths, and deliv-eries by obstetric nurses (since they performedonly vaginal deliveries).
Data sources
Data were collected in interviews with post-partum mothers in the infirmary, from 24 to 48hours after birth. Interviews with physiciansand review of patient charts were also per-formed. The study was approved by the institu-tional review board, and informed consent wasobtained from participants before interviews.
Information was collected from the womenon socioeconomic and demographic charac-teristics, reproductive history, prenatal care,adverse gestational or labor events, preferencefor cesarean, request for cesarean, women’sperception of signs of labor when leaving homefor the hospital, and tubal sterilization. In thereview of medical charts, admission character-istics, labor management, and time of birthwere recorded. In the interviews with obstetri-cians, information was taken on gender, age,year of graduation, work in private clinics, andnumber of hours per week on hospital duty.
Data analysis
According to the conceptual model created andtested by Freitas 11, the factors that influencetype of delivery can be grouped into hierarchi-cal levels of influence, numbered from 1 to 7(Figure 1).
An initial bivariate analysis was performedto identify significant associations betweentype of delivery (cesarean vs. vaginal) and a se-ries of independent variables. Odds ratios wereestimated only for variables showing signifi-cant association with type of delivery (p < 0.05).
Multivariate logistic regression analysis wasperformed with SPSS, version 8.0 (SPSS Inc.,Chicago, USA). Variables were entered into themodel manually, according to the hierarchicalorder established by the conceptual model 11.A model was fitted for each level. In the firstmodel, first-order variables that were signifi-cant in the bivariate analysis were included. Inthe second model, only first-order variableswith a significance of 0.10 or less (measured bythe Wald test) remained, along with significantvariables from the second level. This procedurewas repeated until the last level. The model’sexplanatory power at each level was evaluatedby measuring the increase in the value of -2 loglikelihood (-2LL) with the model’s χ2. Thesestatistics allow assessing the effect of interme-diate variables on the complex framework ofdirect and indirect relations among several fac-tors, such as social, demographic, biological,and organization of medical care 11,13,17,18,19,20.
Results
The final sample size was 461 women (231 ce-sarean sections and 230 vaginal births). The ce-sarean rate during the study was approximate-ly 30%.

Cad. Saúde Pública, Rio de Janeiro, 22(10):2067-2078, out, 2006
Bivariate analysis
Median age was 24 years for cases (cesareansections) and 22 for controls (vaginal deliver-ies). The odds of cesarean were significantlyhigher for women > 20 years of age comparedto adolescents. Only 1/6 of the women hadcompleted high school or university, and theirprobability of cesarean was 60% greater thanfor women with less schooling. There was a
FACTORS ASSOCIATED WITH CESAREAN SECTIONS 2069
strong association between childbirth/obstet-ric history and type of delivery. Primiparae andmultiparae whose last delivery was by cesareanhad significantly higher odds of cesarean thanmultiparae whose last delivery was vaginal(Table 1, level 1).
As for prenatal characteristics (Table 1, lev-el 2), the odds of cesarean section were signifi-cantly higher for women with more than sixprenatal visits, who had begun prenatal care in
Demographic and socioeconomic
Parity and obstetric history Level 1
Figure 1
Flowchart of factors influencing type of delivery.
Prenatal care Level 2
Adverse gestational events
Level 3
Patient preferences and decisions
Level 4
Characteristics of admission
Level 5
Level 6
Time of delivery Level 7
Type of delivery
Management of labor Obstetrician on duty
v
v
v
v
v v
v
v

D’Orsi E et al.2070
Cad. Saúde Pública, Rio de Janeiro, 22(10):2067-2078, out, 2006
Table 1
Demographic and socioeconomic characteristics, parity, and obstetric history, prenatal care,
adverse gestational events, and patient preferences and decisions by type of delivery.
Public maternity hospital, Rio de Janeiro, Brazil, 1998/1999.
Cesarean sections Vaginal births OR* 95%CIn % n %
Level 1 – Demographic and socioeconomic characteristics, parity, and obstetric history
Age (years)
16-19 39 17.2 69 30.3 1.0
20-34 158 69.6 141 61.8 2.0 1.3-3.1
≥ 35 30 13.2 18 7.9 3.0 1.5-6.0
Total 227 100.0 228 100.0
Schooling
< Secondary 133 57.6 145 63.0 1.0
Secondary 53 22.9 54 23.5 1.0 0.7-1.7
≥ University 45 19.5 31 13.5 1.6 0.9-2.6
Total 231 100.0 230 100.0
Parity/obstetric history
Last delivery vaginal 37 16.0 124 53.9 1.0
Primiparae 97 42.0 85 37.0 3.8 2.4-6.1
Last delivery cesarean 97 42.0 21 9.1 15.5 8.5-28.1
Total 231 100.0 230 100.0
Level 2 – Prenatal care
Number of visits
0 to 5 100 43.3 127 55.2 1.0
≥ 6 131 56.7 103 44.8 1.6 1.1-2.3
Total 231 100.0 230 100.0
Trimester of initiation
2nd or 3rd 83 35.9 100 43.5 1.0
1st 137 59.3 105 45.7 1.6 1.1-2.3
No prenatal care 11 4.8 25 10.9 0.5 0.2-1.1
Total 231 100.0 230 100.0
Prenatal and delivery at same hospital
No 169 73.2 184 80.0 1.0
Yes 51 22.1 22 9.6 2.5 1.5-4.3
No prenatal care 11 4.8 24 10.4 0.5 0.2-1.1
Total 231 100.0 230 100.0
Level 3 – Adverse gestational events
Hypertension
No 114 49.4 189 82.2 1.0
Yes 117 50.6 41 17.8 4.7 3.1-7.2
Total 231 100.0 230 100.0
3rd trimester bleeding
No 217 93.9 227 98.7 1.0
Yes 14 6.1 3 1.3 4.9 1.4-17.2
Total 231 100.0 230 100.0
Loss of amniotic fluid
No 210 90.9 215 93.5 1.0
Yes 21 9.1 15 6.5 1.4 0.7-2.8
Total 231 100.0 230 100.0
(continues)

FACTORS ASSOCIATED WITH CESAREAN SECTIONS 2071
Cad. Saúde Pública, Rio de Janeiro, 22(10):2067-2078, out, 2006
the first trimester, or who had prenatal care anddelivery in the same hospital. Concerning ad-verse gestational events (Table 1, level 3), therewas a significant association between third-trimester hypertension or bleeding and cesare-an section.
Most participants reported not wanting acesarean (Table 1, level 4). Wanting or request-ing a cesarean was associated with surgical birth.Tubal sterilization also increased the odds of acesarean, while leaving home with signs of la-bor showed significantly lower odds of cesare-an. Various admission characteristics (Table 2,level 5) were significantly associated with ce-sareans. The strongest associations were forcervical dilatation < 3cm and non-cephalic fe-tal presentation. In the management of labor(Table 2, level 6), use of oxytocin and amnioto-my showed significantly lower odds of cesare-an section. As for the obstetrician’s characteris-tics, male gender, > 20 years since graduation,private practice, and more than 24 hours/weekon duty increased the odds of cesarean. At lev-el 7 there was a significant association between
type of delivery and time of day, with cesareansections more frequent from 9:00 am to 2:59pm (Table 2).
Multivariate analysis
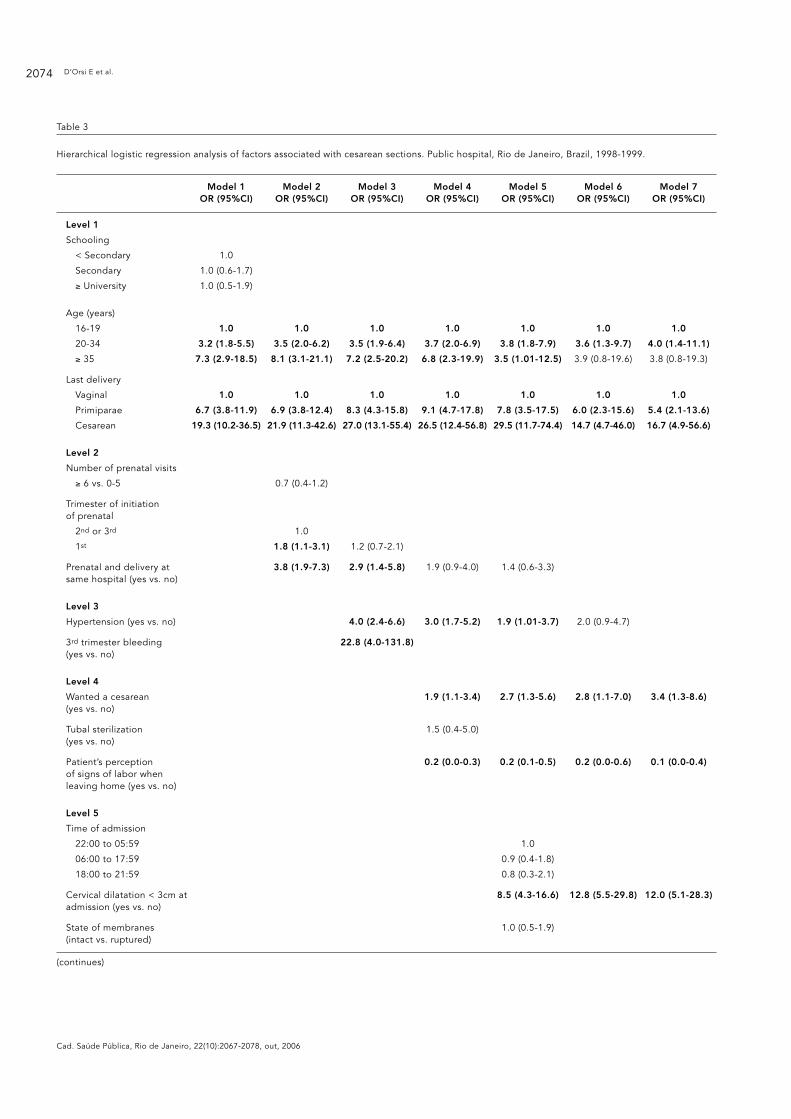
The first characteristics included in the modelwere woman’s age and educational level (Table3). After adjustment for parity/obstetric histo-ry, women > 35 years of age showed an OR of7.3 for cesarean section (95%CI: 2.9-18.5) ascompared to younger women. In addition, apersistently strong influence was shown forboth first delivery and previous cesarean: prim-iparae showed an OR of 6.7 (95%CI: 3.8-11.9),and multiparae whose last delivery was cesare-an had an OR of 19.3 (95%CI: 10.2-36.5) as com-pared to those whose last delivery was vaginal.
At level 2 (Table 3), the positive associationbetween the number of prenatal visits and oddsof cesarean disappeared when prenatal vari-ables, age group, and obstetric history were in-cluded in the model. However, initiating pre-natal care in the first trimester and having pre-
Table 1 (continued)
Cesarean sections Vaginal births OR* 95%CIn % n %
Fetal distress
No 217 95.6 225 98.7 1.0
Yes 10 4.4 3 1.3 3.4 0.9-12.6
Total 227 100.0 228 100.0
Level 4 – Patient preferences and decisions
Wanted a cesarean
No 141 61.0 185 80.4 1.0
Yes 83 35.9 42 18.3 2.6 1.7-4.0
Didn’t know 7 3.0 3 1.3 3.1 0.8-12.1
Total 231 100.0 230 100.0
Requested a cesarean
No 193 83.5 202 87.8 1.0
Yes 38 16.5 28 12.2 1.4 0.8-2.4
Total 231 100.0 230 100.0
Tubal sterilization
No 208 90.4 223 97.0 1.0
Yes 22 9.6 7 3.0 3.4 1.4-8.1
Total 230 100.0 230 100.0
Women’s perception of signs of labor when leaving home
No 63 27.3 12 5.2 1.0
Yes 168 72.7 218 94.8 0.1 0.0-0.3
Total 231 100.0 230 100.0
* OR = odds of cesarean section/odds of vaginal delivery.Note: associations with p < 0.05 in bold.

D’Orsi E et al.2072
Cad. Saúde Pública, Rio de Janeiro, 22(10):2067-2078, out, 2006
Table 2
Characteristics of admission, management of labor, attending obstetrician, and time of decision by type of delivery.
Public hospital, Rio de Janeiro, Brazil, 1998/1999.
Public hospitalCesarean section Vaginal delivery OR* 95%CI
n % n %
Level 5 – Characteristics of hospital admission
Time of admission (hours)
22:00 to 05:59 55 25.9 80 37.0 1.0
06:00 to 17:59 119 56.1 107 49.5 1.6 1.0-2.5
18:00 to 21:59 38 17.9 29 13.4 1.9 1.0-3.4
Total 212 100.0 216 100.0
Cervical dilatation
≥ 3cm 54 24.3 172 76.4 1.0
< 3cm 168 75.7 53 23.6 10.1 6.5-15.6
Total 222 100.0 225 100.0
Status of membranes
Ruptured 55 24.2 75 32.9 1.0
Intact 172 75.8 153 67.1 1.5 1.0-2.3
Total 227 100.0 228 100.0
Gestational age (weeks)
37-40 132 59.5 144 65.8 1.0
< 37 57 52.7 61 27.9 1.0 0.7-1.6
41-43 33 14.9 14 6.4 2.6 1.3-5.0
Total 222 100.0 219 100.0
Fetal presentation
Cephalic 203 89.4 226 99.1 1.0
Other (majority breech) 24 10.6 2 0.9 13.4 3.1-57.2
Total 227 100.0 228 100.0
Level 6 – Management of labor and characteristics of attending obstetrician
Use of oxytocin
No 196 86.0 136 60.7 1.0
Yes 32 14.0 88 39.3 0.3 0.1-0.4
Total 228 100.0 224 100.0
Amniotomy
No 183 85.5 139 63.8 1.0
Yes 31 14.5 79 36.2 0.3 0.2-0.5
Total 214 100.0 218 100.0
Obstetrician’s gender
Female 62 27.6 116 51.3 1.0
Male 163 72.4 110 48.7 2.8 1.8-4.1
Total 225 100.0 226 100.0
Time since graduation (years)
< 7 41 21.8 57 33.3 1.0
7-19 58 30.9 48 28.1 1.7 1.0-2.9
≥ 20 89 47.3 66 38.6 1.9 1.1-3.1
Total 188 100.0 171 100.0
(continues)

FACTORS ASSOCIATED WITH CESAREAN SECTIONS 2073
Cad. Saúde Pública, Rio de Janeiro, 22(10):2067-2078, out, 2006
natal care and delivery in the same hospitalmaintained a strong effect on the odds of ce-sarean section after adjusting for variables atthis level and the previous one.
At level 3 (Table 3), hypertension and bleed-ing continued to be associated with cesareansection. However, because of low precision,third-trimester bleeding was excluded from themodel.
At level 4 (Table 3), the OR for cesarean dou-bled in women who declared a preference forsurgical delivery (95%CI: 1.1-3.4). Women withsigns of labor before leaving home had 80%lower odds of cesarean (OR = 0.2; 95%CI: 0.0-0.3), after adjusting for statistically significantvariables from the previous levels. At this level,performance of tubal sterilization also lost sta-tistical significance.
Time of admission and membrane status(Table 3, level 5) lost statistical significance(shown previously). Cervical dilatation on ad-mission was still one of the variables moststrongly associated with type of delivery: womenadmitted with < 3cm dilatation had an OR forcesarean of 8.5 (95%CI: 4.3-16.6) as comparedto those admitted with ≥ 3cm. Gestational agealso remained in the model: gestations > 41weeks were more prone to cesarean (OR = 4.8;95%CI: 1.8-12.8). Fetal presentation was ex-cluded from the model due to the low precisionin the estimate of association. Inclusion of cer-vical dilatation at admission decreased themagnitude of the association between cesare-
an section and age group, prenatal care and de-livery in the same hospital, and hypertension.
At level 6 (Table 3), the strong inverse asso-ciation between both oxytocin and amniotomyand cesarean section was maintained. Inclu-sion of these variables in the model reducedthe effects of both age and previous cesarean.
Among the obstetrician’s characteristics, theassociation between male gender and cesareansection was significant (OR = 2.1; 95%CI: 0.9-4.7), after adjusting for other physician charac-teristics and previous levels. Time spent onhospital duty per week (> 24 hours) and workin private clinics remained in the model, with afourfold (95%CI: 1.5-9.2) and threefold increase(95%CI: 1.1-10.2) in cesareans, respectively.
Finally, level 7 (Table 3) suggests that if de-livery occurred during the morning to early af-ternoon (09:00 am to 02:59 pm), the OR for acesarean was 2.7 (95%CI: 0.9-8.4) as comparedto the early morning (00:00 to 05:59h). The vari-ables added at each level significantly improvedthe explanation of the target variable.
Discussion
This study identified characteristics of patients,physicians, and obstetric care that are poten-tially related to type of delivery. The strongestpredictors of cesarean section were last deliv-ery by cesarean and cervical dilatation of lessthan 3cm at admission.
Table 2 (continued)
Public hospitalCesarean section Vaginal delivery OR* 95%CI
n % n %
Private practice
No 91 48.4 100 58.5 1.0
Yes 97 51.6 71 41.5 1.5 1.0-2.3
Total 188 100.0 171 100.0
Hours on duty/week
< 24 92 48.9 112 65.5 1.0
> 24 96 51.1 59 34.5 2.0 1.3-3.1
Total 188 100.0 171 100.0
Level 7 – Time of delivery (hours)
00:00 to 05:59 31 13.7 52 22.8 1.0
06:00 to 08:59 8 3.5 33 14.5 0.4 0.2-1.0
09:00 to 14:59 92 40.5 56 24.6 2.8 1.6-4.8
15:00 to 23:59 96 42.3 87 38.2 1.9 1.1-3.1
Total 227 100.0 228 100.0
* OR = cesarean section/vaginal delivery.Note: associations with p < 0.05 in bold.
D’Orsi E et al.2074
Cad. Saúde Pública, Rio de Janeiro, 22(10):2067-2078, out, 2006
Table 3
Hierarchical logistic regression analysis of factors associated with cesarean sections. Public hospital, Rio de Janeiro, Brazil, 1998-1999.
Model 1 Model 2 Model 3 Model 4 Model 5 Model 6 Model 7OR (95%CI) OR (95%CI) OR (95%CI) OR (95%CI) OR (95%CI) OR (95%CI) OR (95%CI)
Level 1
Schooling
< Secondary 1.0
Secondary 1.0 (0.6-1.7)
≥ University 1.0 (0.5-1.9)
Age (years)
16-19 1.0 1.0 1.0 1.0 1.0 1.0 1.0
20-34 3.2 (1.8-5.5) 3.5 (2.0-6.2) 3.5 (1.9-6.4) 3.7 (2.0-6.9) 3.8 (1.8-7.9) 3.6 (1.3-9.7) 4.0 (1.4-11.1)
≥ 35 7.3 (2.9-18.5) 8.1 (3.1-21.1) 7.2 (2.5-20.2) 6.8 (2.3-19.9) 3.5 (1.01-12.5) 3.9 (0.8-19.6) 3.8 (0.8-19.3)
Last delivery
Vaginal 1.0 1.0 1.0 1.0 1.0 1.0 1.0
Primiparae 6.7 (3.8-11.9) 6.9 (3.8-12.4) 8.3 (4.3-15.8) 9.1 (4.7-17.8) 7.8 (3.5-17.5) 6.0 (2.3-15.6) 5.4 (2.1-13.6)
Cesarean 19.3 (10.2-36.5) 21.9 (11.3-42.6) 27.0 (13.1-55.4) 26.5 (12.4-56.8) 29.5 (11.7-74.4) 14.7 (4.7-46.0) 16.7 (4.9-56.6)
Level 2
Number of prenatal visits
≥ 6 vs. 0-5 0.7 (0.4-1.2)
Trimester of initiation of prenatal
2nd or 3rd 1.0
1st 1.8 (1.1-3.1) 1.2 (0.7-2.1)
Prenatal and delivery at 3.8 (1.9-7.3) 2.9 (1.4-5.8) 1.9 (0.9-4.0) 1.4 (0.6-3.3)same hospital (yes vs. no)
Level 3
Hypertension (yes vs. no) 4.0 (2.4-6.6) 3.0 (1.7-5.2) 1.9 (1.01-3.7) 2.0 (0.9-4.7)
3rd trimester bleeding 22.8 (4.0-131.8)(yes vs. no)
Level 4
Wanted a cesarean 1.9 (1.1-3.4) 2.7 (1.3-5.6) 2.8 (1.1-7.0) 3.4 (1.3-8.6)(yes vs. no)
Tubal sterilization 1.5 (0.4-5.0)(yes vs. no)
Patient’s perception 0.2 (0.0-0.3) 0.2 (0.1-0.5) 0.2 (0.0-0.6) 0.1 (0.0-0.4)of signs of labor when leaving home (yes vs. no)
Level 5
Time of admission
22:00 to 05:59 1.0
06:00 to 17:59 0.9 (0.4-1.8)
18:00 to 21:59 0.8 (0.3-2.1)
Cervical dilatation < 3cm at 8.5 (4.3-16.6) 12.8 (5.5-29.8) 12.0 (5.1-28.3)admission (yes vs. no)
State of membranes 1.0 (0.5-1.9)(intact vs. ruptured)
(continues)

FACTORS ASSOCIATED WITH CESAREAN SECTIONS 2075
Cad. Saúde Pública, Rio de Janeiro, 22(10):2067-2078, out, 2006
In this public maternity hospital, age (20-34years), primiparity, last delivery by cesarean,patient requesting a cesarean, cervical dilata-tion < 3cm at admission, post-term gestationalage, male attending obstetrician, and obstetri-cian on hospital duty > 24 hours per week orwith a private practice, and delivery during theday shift (9:00 am to 3:00 pm) were indepen-dent predictors of cesarean. On the other hand,signs of labor before leaving home, pre-termgestational age, oxytocin, and amniotomy wereassociated with decreased odds of cesarean.
Some limitations in this study must be con-sidered. Compared to medical charts, most ofthe patients’ self-reported information on ob-stetric history and adverse gestational eventswas valid. It is possible that questions such asthose related to preference and requests for ce-
sarean should be repeated at different momentsduring the gestation (see Potter et al. 5). Occa-sional changes of opinion (related to physicaland emotional problems) could thus be moni-tored. This study did not include private pa-tients (from private hospitals), who may havedifferent characteristics, not susceptible to theproposed interventions.
As expected, various patient characteristicsinvolved increased odds of cesarean section.Young women were more prone to cesareansthan adolescents, suggesting that age is an in-dependent predictor of type of delivery, in agree-ment with other Brazilian authors 11,21,22 whoreported a similar association. In our study, theeffect of age was partially explained by cervicaldilatation at admission and use of oxytocin, in-dicating that both the stage of labor and its
Table 3 (continued)
Model 1 Model 2 Model 3 Model 4 Model 5 Model 6 Model 7OR (95%CI) OR (95%CI) OR (95%CI) OR (95%CI) OR (95%CI) OR (95%CI) OR (95%CI)
Gestational age (weeks)
37.40 1.0 1.0 1.0
< 37 0.6 (0.3-1.3) 0.3 (0.1-0.9) 0.4 (0.1-0.9)
41.43 4.8 (1.8-12.8) 5.0 (1.4-17.2) 4.6 (1.3-16.4)
Fetal presentation 34.8 (5.9-204.7)(other vs. cephalic)
Level 6
Use of oxytocin (yes vs. no) 0.1 (0.0-0.3) 0.1 (0.0-0.2)
Amniotomy (yes vs. no) 0.4 (0.2-1.0) 0.4 (0.2-1.0)
Obstetrician’s gender 2.1 (0.9-4.7) 2.2 (1.0-5.2)(male vs. female)
Obstetrician’s time since graduation (years)
< 7 1.0
7-19 0.9 (0.3-2.5)
≥ 20 1.1 (0.3-4.3)
Private practice (yes vs. no) 3.3 (1.1-10.2) 4.0 (1.7-9.5)
Hospital duty (> 24 vs. 3.7 (1.5-9.2) 3.5 (1.4-8.7)< 24 h./wk.)
Level 7
Time of delivery
00:00 to 05:59 1.0
06:00 to 08:59 0.4 (0.1-1.6)
09:00 to 14:59 2.7 (0.9-8.4)
15:00 to 23:59 1.4 (0.5-4.2)
2LL of the model 500 476 427 415 304 194 188
Increment on χ2 130* 154* 203* 213* 263* 243* 249*
2LL of the model: log likelihood of the model.* p < 0.05.

D’Orsi E et al.2076
Cad. Saúde Pública, Rio de Janeiro, 22(10):2067-2078, out, 2006
management may reduce the effect of age onthe odds of cesarean. Still, even after adjustingfor variables at all levels, the effect of age re-mained.
No association was found between moth-er’s schooling and type of delivery. This can beexplained by the relative socioeconomic ho-mogeneity of these patients, also found by Frei-tas 11. However, obstetric history strongly influ-enced type of delivery. The association betweenprimiparity and cesarean section was also foundin Brazil by Janowitz et al. 21 and Barros et al. 23.According to Freitas 11 (p. 154), the majority ofobstetricians “considered primiparae less capa-ble of dealing with the difficulties of labor”.
The strong influence of previous cesareanon the odds of repeating the surgery was alsoobserved by Freitas 11. Prior cesareans wereamong the principal medical indications of acesarean in Brazilian studies based on hospitalrecords 24. In our study, this effect was only re-duced when oxytocin was included in the mod-el, suggesting that the way labor is managedcan reduce the odds of subsequent cesareans.Although the literature reports excellent resultswith trial of labor 25,26, this practice has stillnot been incorporated into Brazilian obstetricpractice.
Regarding prenatal care characteristics, ourstudy showed that women who had prenatalcare and delivery in this same public maternityhospital had increased odds of cesarean, evenafter adjusting for age, obstetric history, andadverse gestational events. Thus, this associa-tion cannot be entirely explained by the pa-tient’s increased gestational risk, leaving one tospeculate that the type of information and sug-gestions transmitted by health services duringprenatal care may favor cesareans 11,22,27.
The effect of adverse gestational events de-creased (losing statistical significance) afteradjusting for cervical dilatation at admission,suggesting that hypertension may not be a mo-tive for not attempting vaginal delivery 28.
The declared preference for vaginal deliveryexpressed by most patients in our study is con-sistent with other Brazilian studies 5,11,12,13,14.Our study showed a positive association be-tween preference for cesarean and delivery bycesarean.
An original result of our study, not identi-fied in the literature consulted, relates to theimportance of women’s proper perception oflabor signs when leaving home for the hospi-tal, yielding significantly lower odds of cesare-an. The effect was direct and was not explainedby any of the other variables. Likewise, earlyadmission (with cervical dilatation < 3cm) was
one of the strongest predictors of cesarean.Freitas 11 argues that the patient’s psychologi-cal status on arrival influences both the waythey deal with labor and the obstetrician’s de-cisions. Clement 29 agrees with the observationthat early arrival at the maternity hospital canaffect progress of labor. These results indicatethe importance of prenatal orientation on typi-cal signs of labor, enabling women to ade-quately recognize them and avoid coming tothe maternity hospital too early.
In relation to management of labor, use ofoxytocin was associated with decreased oddsof cesarean, consistent with the findings by Frei-tas 11. This result was not eliminated by adjust-ing for all other variables, suggesting that thedecreased odds of using oxytocin in womensubmitted to cesarean occurred because thedecision for cesarean had already been made,thus dispensing use of this medication.
The influence of obstetrician’s characteris-tics on type of delivery appears to occur due tothe variability in the perception of symptomsindicating the need for cesarean 11. In our study,cesareans were performed more frequently bymale obstetricians, those with > 24 hours/weekon duty, or those with private practices. Thesecharacteristics may indicate a more interven-tionist profile for obstetricians subject to anexcessive workload. This result is consistentwith Freitas 11, who identified doctor-centeredorganization of obstetric practice with littleteamwork and excessive workload as contribut-ing factors to cesareans. Concerning the asso-ciation between obstetrician’s gender and typeof delivery, female obstetricians in the publicmaternity hospital may be more sensitive tothe influence of government policy to curb thecesarean rate, or they may have different jobsand/or less demanding work hours. This resultdeserves more in-depth qualitative research onsuch differences. Various studies indicate theeffects of obstetrician’s characteristics on typeof delivery 10,11,30,31,32,33, but we found only two34,35 with an independent association betweenmale gender and increased odds of cesarean.
Our study showed increased odds of cesare-an during some periods of the day. This result,with no apparent technical explanation, sug-gests that convenience of the team on duty in-fluences type of delivery. Freitas 11 also observedthe practice of speeding up delivery during theday in cases which could prove to be more pro-tracted or prone to complications, in order toavoid dealing with them in the middle of thenight.
These data reinforce the importance of avoid-ing early hospital admission, which could lead

FACTORS ASSOCIATED WITH CESAREAN SECTIONS 2077
Cad. Saúde Pública, Rio de Janeiro, 22(10):2067-2078, out, 2006
to an erroneous diagnosis of prolonged laborafter a few hours. This could be accomplishedthrough reorganization of prenatal care, withmore frequent appointments scheduled to-ward the end of pregnancy and provision of ad-equate information on the signs of labor, aswell as guaranteeing a vacancy in the materni-ty at the necessary time. Medical training in theuse of the partogram could help reduce anxietyin both physicians and patients and lead tomore adequate treatment.
Policies instituting trial of labor for womenwith previous cesareans are also important forreducing the cesarean rate. This would requireincreased medical training as well as more ac-curate information during prenatal care forwomen with previous cesareans. Changes inmedical education (to consider delivery a physi-ological rather than pathological event) couldreduce the fear of unexpected situations duringlabor instead of prioritizing the degree of med-ical control offered by the surgical procedure.
Resumo
O Brasil apresenta uma das maiores proporções decesáreas do mundo. Fatores contribuintes para estefenômeno incluem organização da prática obstétrica,atitudes dos obstetras, preferências e decisões das mu-lheres. Com o objetivo de identificar fatores associadosà realização de cesáreas, foi realizado estudo de caso-controle em uma maternidade pública do Municípiodo Rio de Janeiro. Incluíram-se 231 partos por cesárea(casos) e 230 partos vaginais (controles). Utilizou-seanálise multivariada com regressão logística, as variá-veis foram incluídas no modelo obedecendo à ordemhierárquica definida em modelo conceitual. Fatoresassociados à maior chance de cesárea: primiparidade;idade 20-34 anos; último parto por cesárea; dilataçãocervical < 3cm na admissão; preferência da mulherpor cesárea; horário diurno; parto realizado por obste-tra do sexo masculino; obstetra que trabalha mais de24 horas semanais de plantão; obstetra com consul-tório particular; hipertensão; apresentação fetal não-cefálica; e idade gestacional > 41 semanas. Fatores as-sociados à menor chance de cesárea: prematuridade;sinais de trabalho de parto ao sair de casa; uso de oci-tocina e amniotomia. Propostas de modificação nosfatores estudados podem contribuir para redução daproporção de cesáreas.
Cesárea; Parto; Maternidades
Contributors
E. D’Orsi contributed to the design, planning, datacollection, analysis, and interpretation, and draftingof the paper. D. Chor participated in the analysis, datainterpretation, drafting of the paper, critical review ofthe content, and approval of the paper’s final version.K. Giffin coordinated the research, participated in thedesign, planning, and approval of the paper’s finalversion. A. Angulo-Tuesta participated in the researchcoordination, design, planning, and data collection,analysis, and interpretation. G. P. Barbosa, A. S. Gama,and A. C. Reis participated in the design, planning,and data collection, analysis, and interpretation.
References
1. Departamento de Informação e Informática doSUS. Sistema de Informações de Nascidos Vivos.http://www.datasus.gov.br (accessed on 15/Jul/2003).
2. Salinas HP, Carmona SG, Albornoz JV, Veloz PR,Terra RV, Marchant RG, et al. Se puede reducir elíndice de cesárea? Experiencia del Hospital Clíni-co de la Universidad de Chile. Rev Chil ObstetGinecol 2004; 69:8-13.
3. Yazlle ME, Rocha JS, Mendes MC, Patta MC, Mar-colin AC, Azevedo GD. Incidência de cesáreas se-gundo fonte de financiamento da assistência aoparto. Rev Saúde Pública 2001; 35:202-6.
4. Duarte EC, Schneider MC, Paes-Souza R, RamalhoWM, Sardinha LMV, Silva Jr. JB, et al. Epidemio-logia das desigualdades em saúde no Brasil: umestudo exploratório. Brasília: Organização Pan-Americana da Saúde; 2002.
D’Orsi E et al.2078
Cad. Saúde Pública, Rio de Janeiro, 22(10):2067-2078, out, 2006
5. Potter JE, Berquó E, Perpétuo IHO, Leal OF, Hop-kins K, Souza MR, et al. Unwanted caesarean sec-tions among public and private patients in Brazil:prospective study. BMJ 2001; 323:1155-8.
6. D’Orsi E, Carvalho MS. Perfil de nascimentos noMunicípio do Rio de Janeiro: uma análise espa-cial. Cad Saúde Pública 1998; 14:367-79.
7. Barros FC, Vaughan JP, Victora CG. Why so manycaesarean sections? The need for a further policychange in Brazil. Health Policy Plan 1986; 1:19-29.
8. Carvalho ML. Mortalidade neonatal e aspectos daqualidade da atenção à saúde na Região Metro-politana do Rio de Janeiro em 1986/87 [Disser-tação de Mestrado]. Rio de Janeiro: Escola Nacio-nal de Saúde Pública, Fundação Oswaldo Cruz;1993.
9. Porreco RP, Thorp JA. The cesarean birth epidem-ic: trends, causes and solutions. Am J Obstet Gy-necol 1996; 175:369-74.
10. Berkowitz GS, Fiarman GS, Mojica MA, BaumanJ, De-Regt RH. Effect of physician characteristicson the cesarean birth rate. Am J Obstet Gynecol1989; 161:146-9.
11. Freitas PF. The epidemic of caesarean sections inBrazil, factors influencing type of delivery in Flo-rianópolis, South Brazil [PhD Thesis]. London:London School of Hygiene and Tropical Medi-cine; 1999.
12. Hopkins K. Are Brazilian women really choosingto deliver by cesarean? Soc Sci Med 2000; 51:725-40.
13. Béhague DP, Victora CG, Barros FC. Consumerdemand for caesarean sections in Brazil: informeddecision making, patient choice or social inequal-ity? A population based birth cohort study linkingethnographic and epidemiological methods. BMJ2002; 324:1-6.
14. Althabe F, Belizán JM, Villar J, Alexander S, BergelE, Ramos S, et al. Mandatory second opinion toreduce rates of unnecessary caesarean sectionsin Latin America: a cluster randomised controlledtrial. Lancet 2004; 363:1934-40.
15. Faúndes A, Cecatti JG. A operação cesárea noBrasil. Incidência, tendências, causas, conseqüên-cias e propostas de ação. Cad Saúde Pública 1991;7:150-73.
16. Fleiss JL. Statistical methods for rates and pro-portions. 2nd Ed. New York: John Wiley & Sons;1981.
17. Victora CG, Fuchs SC, Flores JA, Fonseca W, Kirk-wood B. Risk factors for pneumonia among chil-dren in a Brazilian metropolitan area. Pediatrics1994; 93:977-85.
18. Victora CG, Huttly SR, Fuchs SC, Olinto MTA. Therole of conceptual frameworks in epidemiologi-cal analysis: a hierarquical approach. Int J Epi-demiol 1997; 26:224-7.
19. Estebanez PE, Russel NK, Aguilar MD, Béland F,Zunzunegui MV. Woman, drugs and HIV/AIDS:results of a multicentre European study. Int J Epi-demiol 2000; 29:734-43.
20. Barros FC, Victora CG, Horta BL. Ethnicity and in-fant health in Southern Brazil. A birth cohortstudy. Int J Epidemiol 2001; 30:1001-8.
21. Janowitz B, Nakakamura MS, Lins FE, Brown ML,Clopton D. Cesarean section in Brazil. Soc Sci Med1982; 16:19-25.
22. Barros FC, Vaughan JP, Victora CG, Huttly S. Epi-demic of caesarean sections in Brazil. Lancet 1991;338:167-9.
23. Barros FC, Victora CG, Morris SS. Caesarean sec-tions in Brazil. Lancet 1996; 347:839.
24. D’Orsi E, Chor D, Giffin K, Barbosa GP, Angulo-Tuesta AJ, Gama AS, et al. Factors associated withvaginal birth after cesarean in a maternity hospi-tal of Rio de Janeiro. Eur J Obstet Gynecol ReprodBiol 2001; 97:152-7.
25. Rosen MG, Dickinson JC, Westhoff CL. Vaginalbirth after cesarean: a meta-analysis of morbidityand mortality. Obstet Gynecol 1991; 77:465-70.
26. Harer WB. Vaginal birth after cesarean delivery:current status. JAMA 2002; 287:2627-30.
27. LoCicero AK. Explaining excessive rates of cesare-ans and other childbirth interventions: contribu-tions from contemporary theories of gender andpsychosocial development. Soc Sci Med 1993;37:1261-9.
28. Enkin M, Keirse MJNC, Renfrew M, Neilson J. Aguide to effective care in pregnancy & childbirth.2nd Ed. Oxford: Oxford Medical Publications; 1996.
29. Clement S. The caesarean experience. London:Pandora Press; 1991.
30. Goyert GL, Bottoms SF, Treadwell MC, Nehra PC.The physician factor in cesarean birth rates. NEngl J Med 1989; 320:706-9.
31. Signorelli C, Cattaruzza MS, Osborn JF. Risk fac-tors for caesarean section in Italy: results of a mul-ticentre study. Public Health 1995; 109:191-9.
32. Hueston WJ. Site-to-site variation in the factorsaffecting cesarean section rates. Arch Fam Med1995; 4:346-51.
33. Poma PA. Effects of obstetrician characteristicson cesarean delivery rates. A community hospitalexperience. Am J Obstet Gynecol 1999; 180:1364-72.
34. Tussing AD, Wojtowycz MA. The effect of physi-cian characteristics on clinical behavior: cesare-an section in New York State. Soc Sci Med 1993;37:1251-60.
35. Mitler LK, Rizzo JA, Horwitz SM. Physician gen-der and cesarean sections. J Clin Epidemiol 2000;53:1030-5.
Submitted on 10/Mar/2005Final version resubmitted on 09/Sep/2005Approved on 27/Sep/2005