
Factors affecting consumer behaviour when ... - TalTech Digikogu
60
TALLINN UNIVERSITY OF TECHNOLOGY School of Business and Governance Department of Marketing Joel Ylä-Mononen Factors affecting consumer behaviour when selecting and using investment service providers in Finland Bachelor’s thesis Programme International Business Administration, specialisation marketing Supervisor: Yiannis Kouropalatis, PhD Tallinn 2021
-
Upload
khangminh22 -
Category
Documents
-
view
2 -
download
0
Transcript of Factors affecting consumer behaviour when ... - TalTech Digikogu

TALLINN UNIVERSITY OF TECHNOLOGY
School of Business and Governance
Department of Marketing
Joel Ylä-Mononen
Factors affecting consumer behaviour when selecting and using
investment service providers in Finland
Bachelor’s thesis
Programme International Business Administration, specialisation marketing
Supervisor: Yiannis Kouropalatis, PhD
Tallinn 2021
I hereby declare that I have compiled the thesis independently
and all works, important standpoints and data by other authors
have been properly referenced and the same paper
has not been previously presented for grading.
The document length is 8043 words from the introduction to the end of conclusion.
Joel Ylä-Mononen ……………………………
(signature, date)
Student code: 184078TVTB
Student e-mail address: [email protected]
Supervisor: Yiannis Kouropalatis:
The paper conforms to requirements in force
……………………………………………
(signature, date)
Chairman of the Defence Committee:
Permitted to the defence
…………………………………
(name, signature, date)

3
TABLE OF CONTENTS
ABSTRACT .................................................................................................................................... 4
INTRODUCTION ........................................................................................................................... 5
1. THEORETICAL OVERVIEW ................................................................................................... 7
1.1. Brand .................................................................................................................................... 7
1.1.1. Brand equity .................................................................................................................. 8
1.2. Consumer behaviour ........................................................................................................... 11
1.3. Investment service market in Finland ................................................................................. 13
2. METHODOLOGICAL PART .................................................................................................. 15
2.1. Research methodology ....................................................................................................... 15
2.2. Data collection .................................................................................................................... 16
3. EMPIRICAL ANALYSIS ......................................................................................................... 18
3.1. Results and analysis ............................................................................................................ 18
3.2. Discussion ........................................................................................................................... 30
CONCLUSION ............................................................................................................................. 34
LIST OF REFERENCES .............................................................................................................. 36
APPENDICES ............................................................................................................................... 39
Appendix 1. Questionnaire ........................................................................................................ 39
Appendix 2. Results of the questionnaire .................................................................................. 48
Appendix 3. Non-exclusive licence ........................................................................................... 60

4
ABSTRACT
The main purpose for this study is to identify what are important factors for the consumers when
selecting an investment service provider, and evaluation of consumers’ experience after using the
selected investment services. Investment service providers have similar service offerings and
without a meaningful brand, it is hard for the consumer to differiantate them before using it.
Therefore it is important for investment service providers to understand what are important factors
for the consumer when selecting a service provider.
Factors were identified from existing literature, and an online questionnaire was developed where,
respondents were asked to rate the importance of the factors and to answer what were additional
factors that affected them when making a selection. Respondents were also asked to rate their
experiences after using the selected investment service provider. The questionnaire was distributed
through social media and investing related forums. The data was analyzed with descriptive
statistics and the sampling method was non-probability sampling was employed. The main
findings were that brand image and price were the most important factors for the consumers,and
majority of the respondents were satisfied with their experiences with the selected investment
service provider.
Keywords: Brand, brand equity, financial services, investing, consumer behaviour

5
INTRODUCTION
There has been a clear rise in the popularity of investing into the financial sector in Finland for
several years (Euroclear 2021), and following the 2020 stock market crash, due to the Covid-19
pandemic, there has been a number of clear opportunities for investors as gains have arisen in the
stock market. Also there has been a lot of talk about investing in media in the recent years and
especially after the Reddit related wallstreetbets related frenzy that happened in February 2021
and was a big news story all over the world in social media and traditional news. Also podcasts
about investing are regularly in the top charts in Finland and it is not unusual to see social media
influencers who promote investing related services. Also, in 2020 Finland allowed a new type of
equity savings account, where investors can trade stocks tax free inside the account without paying
taxes before taking the money out of the account (Valtiovarainministeriö 2018). This allows
investors to get the maximum benefit of compound interest. This has also increased knowledge
and popularity of investing.
The investment service industry in Finland consists of about ten companies. Most of the companies
are banks that also offer investment services, but there are also a few companies that are purely
investment platforms without any other major services. The service offerings of these companies
are very similar to each other, so according to Robson and Farquhar (2014, 4) the brand of the
company plays a role for the consumer when selecting which company’s services to use.
The author’s interest towards investing and marketing was the major reason for selection of this
topic. The author has invested using different investment service providers, and the made the
change from one service provider to another due to different factors. Therefore the research
problem in this study is find out how consumers see different factors when selecting and using
investment service providers.
The aim of this thesis was to identify out what are some of the important factors that affect
consumer behaviour when selecting an investment service provider, what are the main channels
6
that bring brand awareness to consumers and how consumers rate the different aspects of their
investment service providers.
Reseach questions are:
• What are important factors for the consumer when selecting an investment service
provider?
• How the consumers evaluate their experiences after using selected investment service
providers?
The structure of the paper is divided in to three main parts. The first part is an overview of theory
of brand and consumer behaviour and an overview of the Finnish investment services market. The
second part goes through the methodological part and describes how the research was done, why
quantitative method was chosen, how the data was collected and how the questionnaire was
planned and executed. The third part of this paper is empirical analysis. It describes the results of
the study, analysis of the results and a discussion about the results. The theis ends with a
conclusion of the paper where all the main points and results of the study are concluded.
The author is grateful and would like to thank Yiannis Kouropalatis for helping the author
throughout this process. The author would also like to thank all the people who participated in the
questionnaire.
7
1. THEORETICAL OVERVIEW
First chapter of this thesis gives an overview of the theoritical part of this study and and goes
through the investment service market in Finland. The theoretical part explains what a brand is,
how it relates to the financial services, what are the different aspects of brand and what is
consumber behaviour and how these are connected
1.1. Brand
Brand can be defined in many ways. According to Kotler et al. (2019, 377) brand can be defined
as a symbol, logo, design, image or a name or a mix of these, which identifies a service or a
product, that differentiates it from competitors. De Chernatony (2003, 374) describes brands as
groups of emotional and functional values, that give assurance to consumers special experiences.
One another definition of a brand is that it is the reputation that you have in the marketplace (Tracy
2014, 9). Brand also gives a promise of a certain quality and information about the source of the
supply to the consumer (Mohsin 2009, 183).
A strong brand has the capability to make the decision-making process simpler, make the decision
less risky and set certain expectations (Keller 2012, 30). A powerful brand can generate relevant
images to the consumer’s mind. Emotional responses can be created through the association of a
brand. Brands can have many roles, but the main roles are emotional and functional roles. The
functional role of the brand is that it functions the way that it was expected to function. The
emotional role of the brand is that it is trying to connect with the customer emotionally. Brands are
often considered the most valued asset that the company can have. (Kotler et al 2019, 377-380).
When consumers are making a decision between two options, brands can play a significant role
in the decision-making process. In the service industry, when the quality of the services can vary
a lot, it is important to have a strong brand so that it communicates that the service is up to expected
standard and that it deserves the brand name. In the financial services brand communicates that
this service is comprehensive and stands out from the other service offerings. In online services it

8
is important that consumers feel that the aspects of the brand are convenient, priced correctly but
at the same time it performs sufficiently in customer service and that it is a credible service (Keller
2012, 36-43). For service companies a strong brand is built, by being distinctive, executing the
core service well, engaging with customers emotionally and by connecting their brand with trust
(Berry 2000, 130). As financial services might be hard to understand for customers, the services
are intangible, and the services cannot really be compared before making the decision to purchase.
Also, customers might not always have a comprehensive approach when making a purchasing
decision, a brand can help them make the decision. If there is no meaningful brand available for
the customer, the price might be the indication to which the customer makes the decision to
purchase or not to purchase. (Robson & Farquhar 2014, 4). Therefore, we can say that a strong
brand is a necessity for a company to succeed in financial services, and if the brand is not strong
enough, competitive pricing can be a key factor affecting consumer behaviour.
1.1.1. Brand equity
Brand equity can be described as the total sum of all the values that consumer attaches to the brand
(Mohsin 2009, 7). Another description of what brand equity is that it is the services or products
positioning in the consumers mind and its potential to affect the purchase behaviour of a consumer
(Kim 1990, 66). Aaker (1991, 31-32) explains brand equity as the brands liabilities and assets that
are connected to the brand, its symbol and name, that increase or decrease the value that is offered
of the service or a product to a firm or the firm’s customers. The assets of brand equity typically
increase or decrease the value to customers, they can also affect the purchase decision of a
customer, due to the familiarity that customer feels about the brand and the aspects of it. According
to Keller (2012, 57) brand equity explains why a service or a product that is branded has different
outcome, compared if the product or service was not branded. The added value that the product or
a service with a brand has, makes a difference. Making a difference is what branding is about.
Brand equity is made of five different components: brand loyalty, name awareness, perceived
quality, brand associations and other proprietary brand assets (Aaker 1991, 31). According to
Kotler et al. (2019, 744) it can be said that brand equity comes from two components: the brand
awareness and brand image.
Brand awareness is part of brand equity and it is the capability of the potential costumer to
acknowledge that a brand is part of a certain service or product category. There are different levels

9
of brand awareness which are, brand recognition, brand recall and top of mind. These different
levels are used to estimate how the brand is recognized. The lowest level, brand recognition means
that there is a link with the brand and the product or service, but it is not strong, and that the
recognition was aided by giving a set of brand names from where to pick out what the costumer
recognizes. Brand recall means that the brand is recognized to belong to a certain product or
service category, but the recognition happens without aid. The last level, top-of-mind awareness,
means that the brand is the first thing that the costumer comes up when thinking about a certain
product or service category, in many situations when a customer is making a purchase decision, it
is the only brand that is being considered, so it is big advantage over the competition. (Aaker
1991,79-81). Aaker (1996, 10) added later one more level measure awareness, he added dominant,
which means that it is the only brand to be recalled. Recognition of a brand comes from past
exposure to it. It does not always mean that the costumer remembers where the brand has come
across before or why it is different from other brands or even to what product or service category
this brand is linked with. Research has shown that that recognition can lead to a positive emotion
towards a brand. So, brands that are recognized will seem more familiar to consumers will have
an edge over totally new brands that costumer has not come across before. (Aaker 1996, 10-11).
Brand awareness has been found out to positively affect the purchase intention of a costumer. The
higher the level of brand awareness of a brand, the higher the purchase intention is. Brand
awareness is also linked to influence the perceived quality significantly. (Chi, H et al. 2009,
141). Having a brand that is recalled and recognized by consumer can significantly grow brand
equity (Aaker 1996, 17). Al-Hawari (2011, 161) pointed out that security of the online service
creates positive affect on the brand awareness. One thing that companies should focus on when
talking about brand awareness is the brand name. Brand name is one of the key factors affecting
consumer purchase intention and companies should focus and invest more in the brand name to
improve brand awareness. (Mirabi et al 2015, 271).
Brand loyalty is a component of brand equity. Brand loyalty means if a consumer selects the
product or service from a certain brand, even if a competitor offers a similar product or a service
with a better price, it is more convenient, or the features are better. It measures to connection that
a customer has with a certain brand. There are different levels of brand loyalty: Switchers, who
have no brand loyalty, Habitual Buyers, who have no reason to change the brand, Satisfied Buyers,
who switch if the cost of switching is compensated with a benefit that is large enough, Likes the
Brand, who associate the brand with high perceived quality or might have an emotional connection
with the brand and then there is the final level which is the Committed Buyer, who are so
10
committed to brand that they might even have a tattoo of it. (Aaker 1991, 55-57). Therefore, it
makes sense, that Danish et al (2018) found out that there is positive correlation between brand
loyalty and purchase intention, and as purchase intention is part of consumer behaviour we can
say that creating brand loyalty among consumers would be beneficial for investment service
providers who have already existing customers in other services and try to attract them to also use
already existing investment services that they offer.
Perceived quality is part of brand equity and it is the perception that customer has of the product
or service. It can be the overall quality and aspects of the product or service or the dominance of a
product or service when comparing it to alternatives. It is not necessarily possible to determine the
perceived quality as it is differs between each customer and they might have different aspects that
are important for them. Perceived quality can offer the value in many ways for the brand, it can be
the reason why consumer choses the brand, a brand can charge a price premium because of it and
it can position the brand higher compared to competitors. (Aaker 1991,105-108). To build a better
brand image and get a bigger market share it is important to build the perceived quality in in a way
that consumers feel that it is high (Tsiotsou 2005, 7). Perceived quality can be linked to purchase
intention, Bou-Llusar et al. (2001, 730) found that it is a significant factor in purchase intention.
As purchase intetion is part of the process that a consumer makes when selecting services or
products, perceived quality will be a factor when selecting an investment service provider. The
perceived quality in investment service providers can be linked to the quality of the websites that
the companies have, what kind of trading platforms they use or what is the quality of their customer
service.
Brand association is whatever the customer connects the brand into in his or her mind. It can be a
feeling, a product feature, some kind of a symbol, activity or a lifestyle. The associations can have
different levels of strength, the more there are connections to the brand the stronger it is, more
exposures to the brand gives a stronger level of association. The associations that a brand has are
the base for purchase decisions. These associations create value for the firm and for customers that
are buying the brand. (Aaker 1991, 132-134). Purchase intention and brand preference are linked
to brand association, the feelings that are related to a brand can have a strong connection with the
purchase intention of a customer (O’Cass & Lim 2002, 63). So if a customer links the brand to
investment services, it is likely that it is one of the service providers that the customers thinks
about when selecting an investment service provider.
11
Brand image is how the brand is perceived in the in the mind of the consumer (Kotler et al 2019,
379). Aaker (1991, 132-133) describes the brand image as a set of the consumers associations of
the brand that are organized in a meaningful way to the consumer. The associations are perceptions
of the consumer and may not be the objective reality. In the online service sector that is related to
financial services, quality of the service is a key factor on enchasing brand image (Al-Hawari 2011,
160). Brand image is key factor in financial services when consumers think about do, they trust
the service or its provider. It is important to create a brand image in the financial sector in a way
that the image creates trust between the consumer and the brand, the image should include sincerity
and competence. (Mois et al 2016, 123). O’Loughlin & Szmigin (2004, 20) found out that
financial service providers have often similar brand images and that is important that a brand gets
referrals and word of mouth marketing from consumers to stand out from competitors.
Brand identity is how the company is trying to position or identify the products that it offers, the
brand itself or the services that it offers, in the consumers mind (Kotler et al 2019, 379). It provides
a meaning, objective and a path for the brand. It should help build a connection between the
customer and the brand, by creating a value proposition that involves practical, emotional or self-
expressive benefits. Brand identity should be dynamic and try to associate with the desired
associations, it should not be satisfied with the existing associations, it should try make changes
to the existing perceptions. (Aaker 1996, 68-70). Brand identity is important for the investment
service providers, as they need to identify themselves with factors that positively affect consumer
behaviour to attract new customers.
1.2. Consumer behaviour
Decisions that the buyers make are influenced by personal characteristic, which are age,
occupation, values, lifestyle, stage in the life cycle and economic situation. These characteristics
can be linked to impact consumer behaviour. Consumer behaviour can be described as how people
purchase, use, and get rid of goods and services that satisfy the needs and wants. There is variance
between the needs and wants that is created by different kind of cultures, personal characteristics,
and situations. (Kotler 2019, 196). A consumer goes through decision-making making process
when deciding to buy something. The first step for a consumer is to solve the problem that is facing
the consumer. After this becomes the search of information and evaluating the possible
12
alternatives, then the consumer makes a cost benefit-analysis to decide which brand image is the
most satisfactory and will take care of the problem that they are facing. (Khan 2006,150-151).
There is a five-stage model that describes how the buying decision process goes, and how
consumer behaviour works. It starts, by that the consumer recognizes that there is a problem or
need that needs to be solved, this may have been set of external or internal stimuli, like the feeling
of being hungry or admiring a friend’s new phone. After the recognition has been made there starts
a new stage, the search for information. The buyer searches information about the service or
product that is needed. There are four different groups which are the major sources for the
information: Personal, which is friends and family, commercial, which is advertisements, websites,
salesperson, public, which is media and different kind of consumer rating organizations and then
there is experiential, which means trying to service or product and feeling it. After the buyer has
found information about the products, there is a stage where evaluation of the possible alternatives
happens. The consumer evaluates the alternatives by looking at what satisfied the needs or solves
the problem, then if there are some benefits that comes from a certain solution and finally the buyer
sees that the service has different kind of attributes attached to it and these attributes vary in the
capability to satisfy the problem or need that will be solved. After evaluation stage comes the
purchasing decision, but before the consumer makes the decision to choose one from the
alternatives there is a step called purchase intention from which there are two factors that influence
the consumer before making the purchase decision. These factors are the attitude of other people
towards the preferred selection and unexpected situational factors. After considering these the
consumer is ready to make the final selection and proceed to make the purchase decision of the
most preferred brand. After making the decision comes the last stage which is the post-purchase
behaviour, where the consumer assesses the expectations and the reality of using the service and
does it satisfy the need that it was sought out for. (Kotler 2019, 213-220).
Purchase intention is the likelihood of a consumer purchasing a product or a service (Hsia, Chen
2017, 106). According to Keller (2012, 344-345) purchase intention can be predicted to an actual
purchase when circumstances, which are location, time and purpose for the purchase are known.
The key driver affecting purchase intention in the financial services are according to Salciuviene et
al. (2014, 198) security, confidentiality, how easy it to use, trust and how useful it is. When the
service has a high usability and the easier it is, the more likely it is that consumer will use the
financial services that are available online. The trust, confidentiality, and the security that the
service provider tries to communicate to customer will increase the likelihood that the customer

13
will purchase financial services online. Therefore, we can expect that security will be a key factor
that affects consumer behaviour.
1.3. Investment service market in Finland
There has been a steady growth of new shareholders in Finland. The current number of private
shareholders has reached over 970 000 people. When comparing the January of 2020 and 2021,
there has been a growth of around 100 000 new shareholders (Euroclear 2021). According to a
survey done by Statista that was released in November of 2020, 21% of the respondents in Finland
were planning to acquire stocks or invest in investment funds in the following 12 months (Statista
2020). According to Kauppalehti, in 2018 the three biggest firms according to the number of trades
made in Nasdaq Helsinki were Nordnet with 2 807 465 trades, Nordea with 2 551 718 trades and
OP with 1 190 663 trades (Järvenpää 2019). All of the three mentioned offer a service where
consumers can acquire stocks from different stock markets. There are also other companies that
offer similar services in Finland, such as Aktia, Danske Bank, Handelsbanken, Lynx, Degiro and
Mandatum Trader. According to a study Välittäjä 2019 Nordnet was the most popular service
provider, after that became Nordea and OP. Of these firms Nordnet, Mandatum Trader, Lynx
and Degiro are the only ones which are not banks, but almost purely investment orientated service
companies. (Ranta-aho 2019, 19-23) In January of 2020 Nordnet had 378 000 customers in
Finland (Nordnet 2020).
Branding will become even more relevant as Järvenpää (2019) mentioned in his article
that Nordnet announced that the price competition between them and other investment service
providers is over from their part and the message was also the same from other investment service
providers such as Nordea and OP. Nordnet had realized that competition over the price doesn’t
make a major difference for the customer since most of the small private investors don’t know
what to invest in, so they decided to allocate content to small private investors that would lead
them to making the decisions to invest in certain stocks or funds. Nordnet was estimated to be the
best investment service provider by the Finnish Shareholders’ Association. So, creating this kind
of extra value and messaging it to customers creates brand awareness, brand associations and
enhances the brand image that allows a certain brand to rise above its competitors, even if the
prices and the service offerings are similar. So in conclusion, in this study we would expect that

14
brand image, price and high quality website that creates value for the consumer to be important
factors that affect consumer behaviour postively.
15
2. METHODOLOGICAL PART
The second chapter in this graduation thesis gives an overview about how the research was
conducted. The author describes why certain research methods were selected, how data was
collected and analyzed, and what kind of sampling method was used.
2.1. Research methodology
The aim of this graduation thesis is to identify what are some of the key factors when consumer
selects an investment platform in Finland, how consumers evaluate the importance of those factors
and how consumers evaluate their experiences after using selected services.
The research method that will be used in this study will be quantitative approach using descriptive
statistics and a questionnaire will be used to collect data. Quantitative model allows to use the data
collected in a way that a useful conclusion’s can be interpreted (Franses, Paap 2001, 11).
Quantitative research provides deeper results than qualitative research on brand awareness (Keller
2012, 298). For sampling method, the non-probability sampling method was chosen, since to be
able to answer the survey and be a part of the sample group, you had to have the capability to use
the internet. The decision to use non-probability sampling method was chosen due to the fact that
it is a cheap and a time efficient way to collect the required answers for the data. The analysis of
the responses was done by using Microsoft Excel and the method that was used was descriptive
statistics.
The questionnaire consisted of 25 questions and was conducted in English. The factors that the
questionnare measured were brand awareness, brand loyalty, perceived quality and brand image,
and as these part of brand equity, also brand equity was measured. There were three parts in the
questionnaire. The first part, consisted of demographic questions about the gender, age, income
and educational background. The second part of the questionnaire was done by using mostly
Likert-scale questions about factors that according to the brand theory part were relevant to
consumers when selecting an investment service provider. There were also some multiple-choice
16
questions about the factors and investment service providers. The third part of the questionnaire
asked the respondents to evaluate how they feel about their selection overall, the quality of the
service, user-friendliness, price, investment possibilities and satisfaction after using the services.
There were also questions about possibly changing the investment service provider and how likely
they would recommend it to someone else.
2.2. Data collection
The questionnaire was distributed through the authors social media channels, which included,
WhatsApp, Facebook, Linkedin and Instagram. It was also posted to investing related
forums Sijoitustieto and Inderes. The author used Google forms for creating the survey, as it was
convenient, cheap and time efficient. Using a survey as a data collection method is cheap, flexible
and can be generalized for a larger population. Surveys also allow a time efficient way to collect
data, due to the fact that more questions can be asked from more people in an effective manner.
(Ruel 2021, 3).
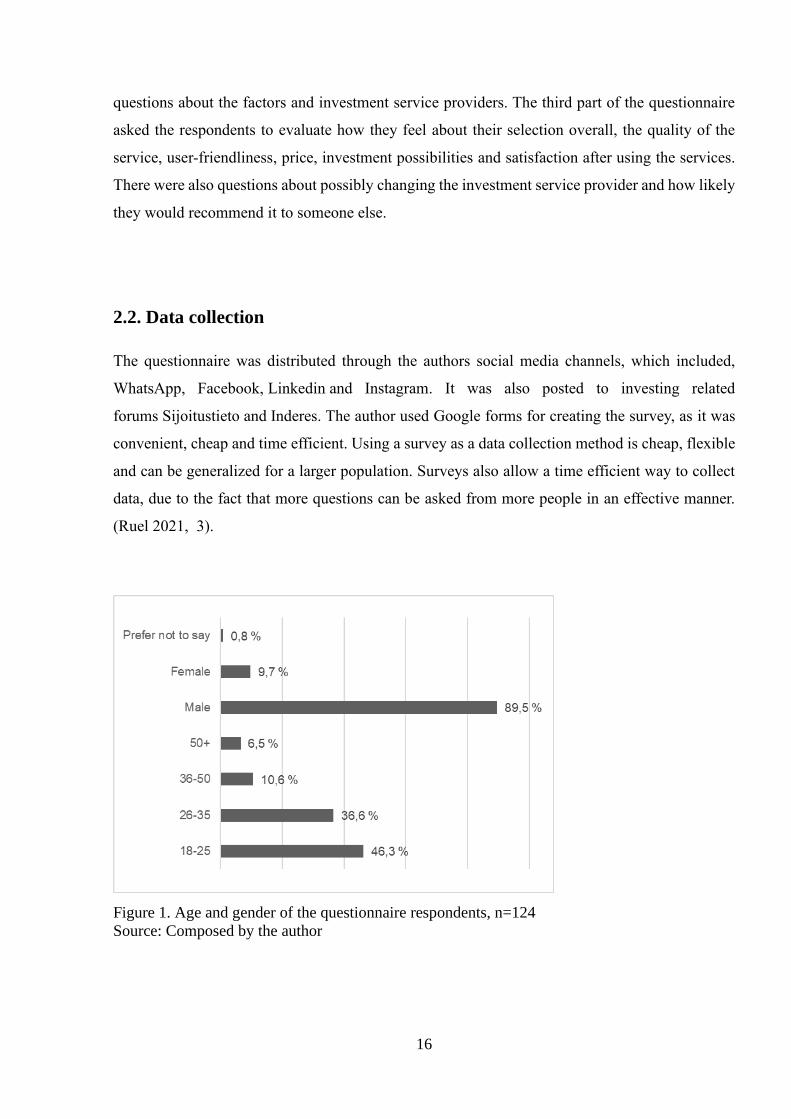
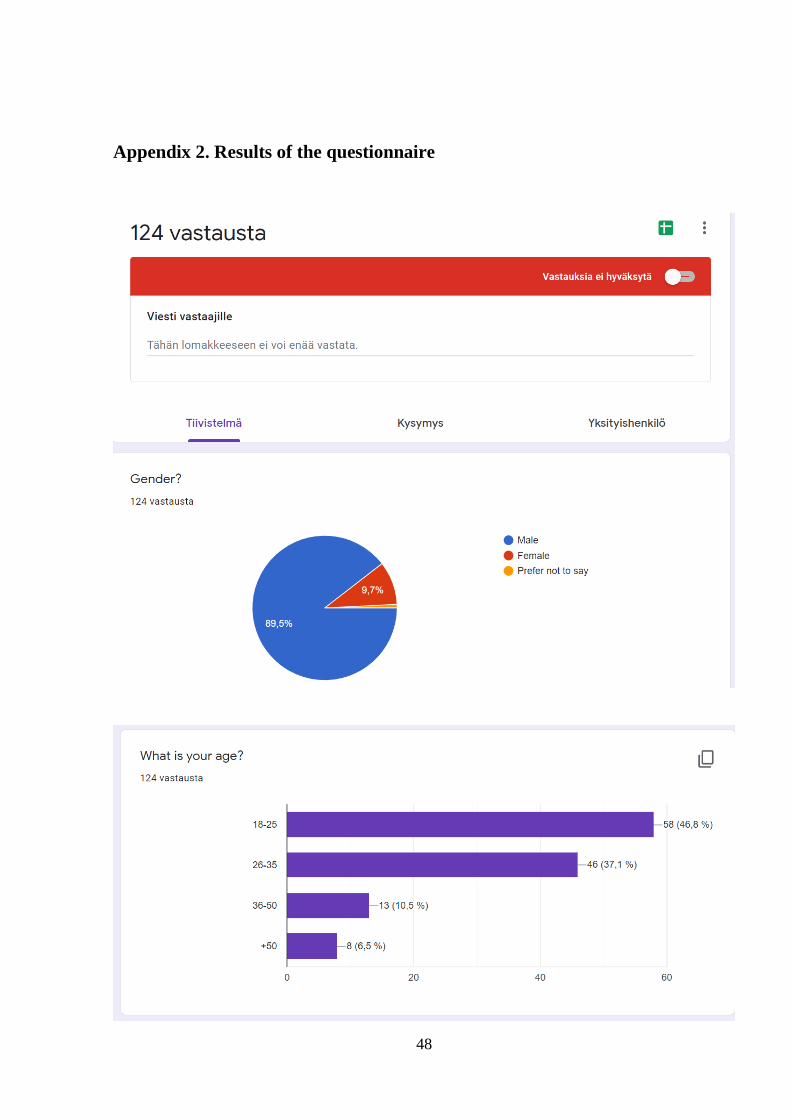
Figure 1. Age and gender of the questionnaire respondents, n=124
Source: Composed by the author
17
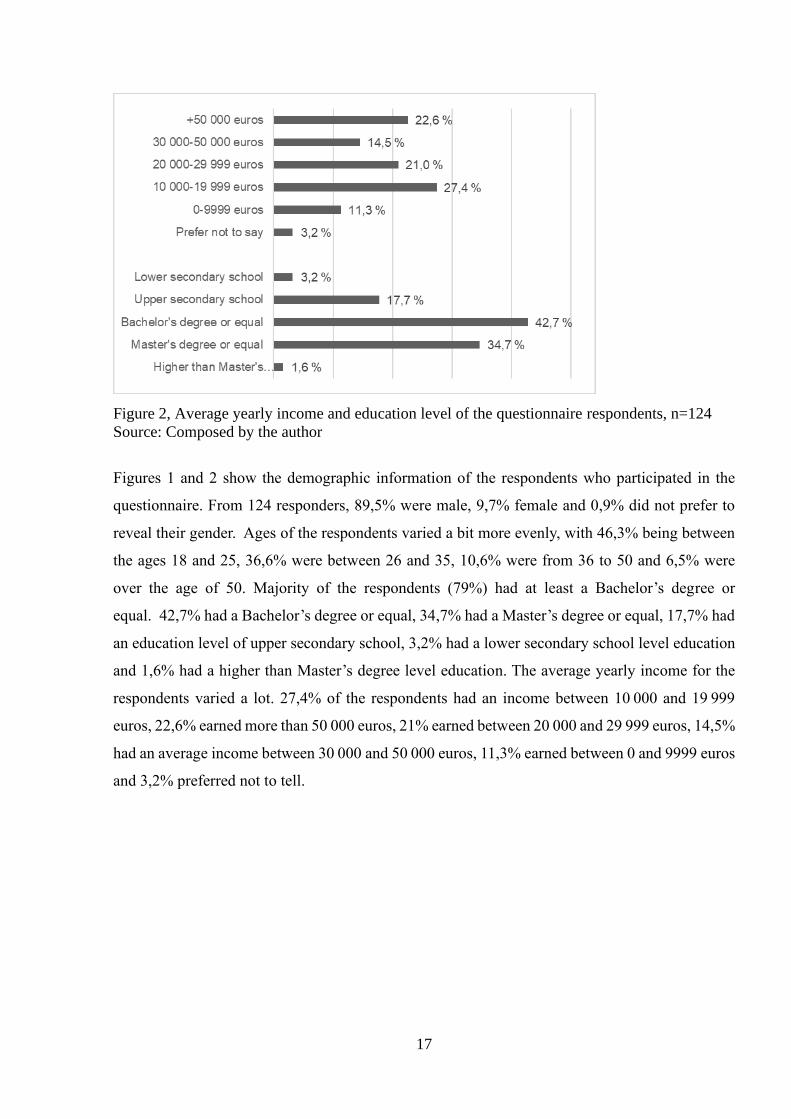
Figure 2, Average yearly income and education level of the questionnaire respondents, n=124
Source: Composed by the author
Figures 1 and 2 show the demographic information of the respondents who participated in the
questionnaire. From 124 responders, 89,5% were male, 9,7% female and 0,9% did not prefer to
reveal their gender. Ages of the respondents varied a bit more evenly, with 46,3% being between
the ages 18 and 25, 36,6% were between 26 and 35, 10,6% were from 36 to 50 and 6,5% were
over the age of 50. Majority of the respondents (79%) had at least a Bachelor’s degree or
equal. 42,7% had a Bachelor’s degree or equal, 34,7% had a Master’s degree or equal, 17,7% had
an education level of upper secondary school, 3,2% had a lower secondary school level education
and 1,6% had a higher than Master’s degree level education. The average yearly income for the
respondents varied a lot. 27,4% of the respondents had an income between 10 000 and 19 999
euros, 22,6% earned more than 50 000 euros, 21% earned between 20 000 and 29 999 euros, 14,5%
had an average income between 30 000 and 50 000 euros, 11,3% earned between 0 and 9999 euros
and 3,2% preferred not to tell.
18
3. EMPIRICAL ANALYSIS
Empirical analysis part of the study will go through the results and analysis that were achieved
from the questionnaire and discussion about the results. The method that was used to analyse the
results was descriptive statistics. The results are presented with Microsoft Excel charts to make
them more understandable. Discussion about the results includes suggestions that can be
concluded from the results of the study.
3.1. Results and analysis
The factors that affected consumers consumer behaviour were researched with an online
questionnaire. The questionnaire was formed to give an extensive picture about what are the factors
that affect consumer behaviour and how consumers evaluate their experiences with their selected
investment service providers.
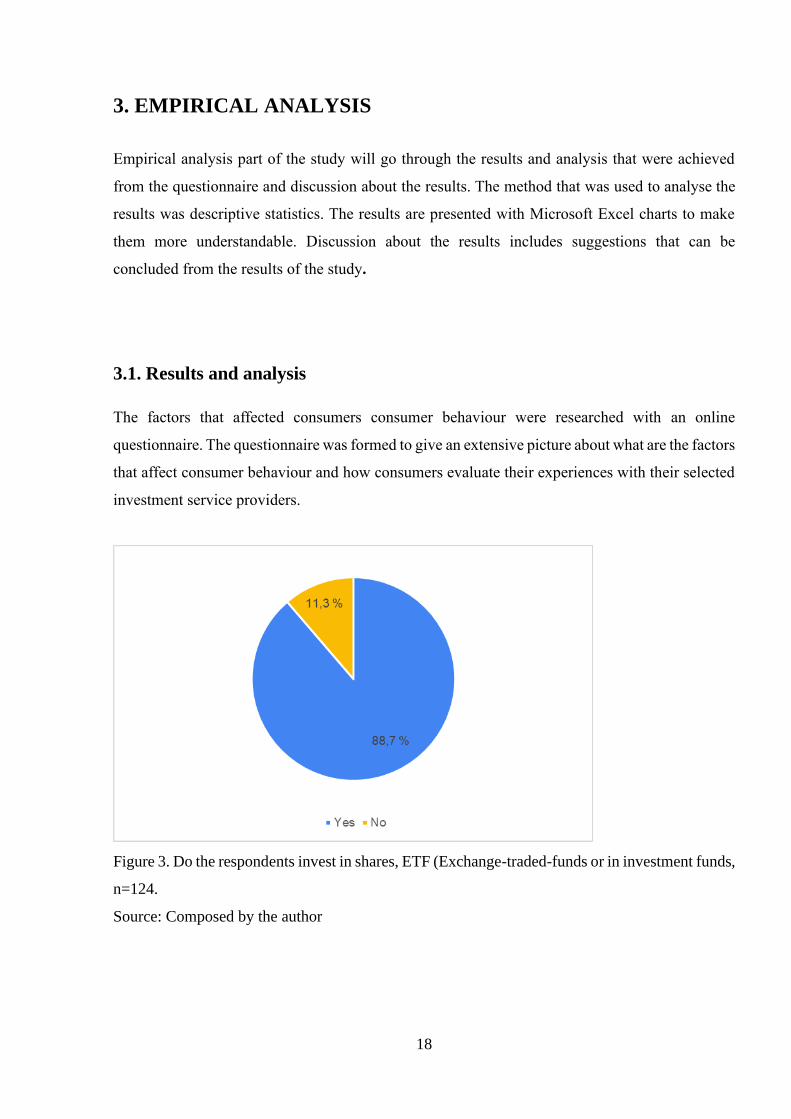
Figure 3. Do the respondents invest in shares, ETF (Exchange-traded-funds or in investment funds,
n=124.
Source: Composed by the author
19
The fifth question asked if the respondents invest in shares, ETF(Exchange-traded-funds) or in
investment funds. If the respondent answered yes, they moved on to the next part of the
questionnaire. If the answer from the respondent was no, then the questionnaire ended for the
respondent, as the target group for the questionnaire was people who invest and are over the age
of 18. There were overall 124 respondents, and of those 110 did invest in shares, ETF or investment
funds.
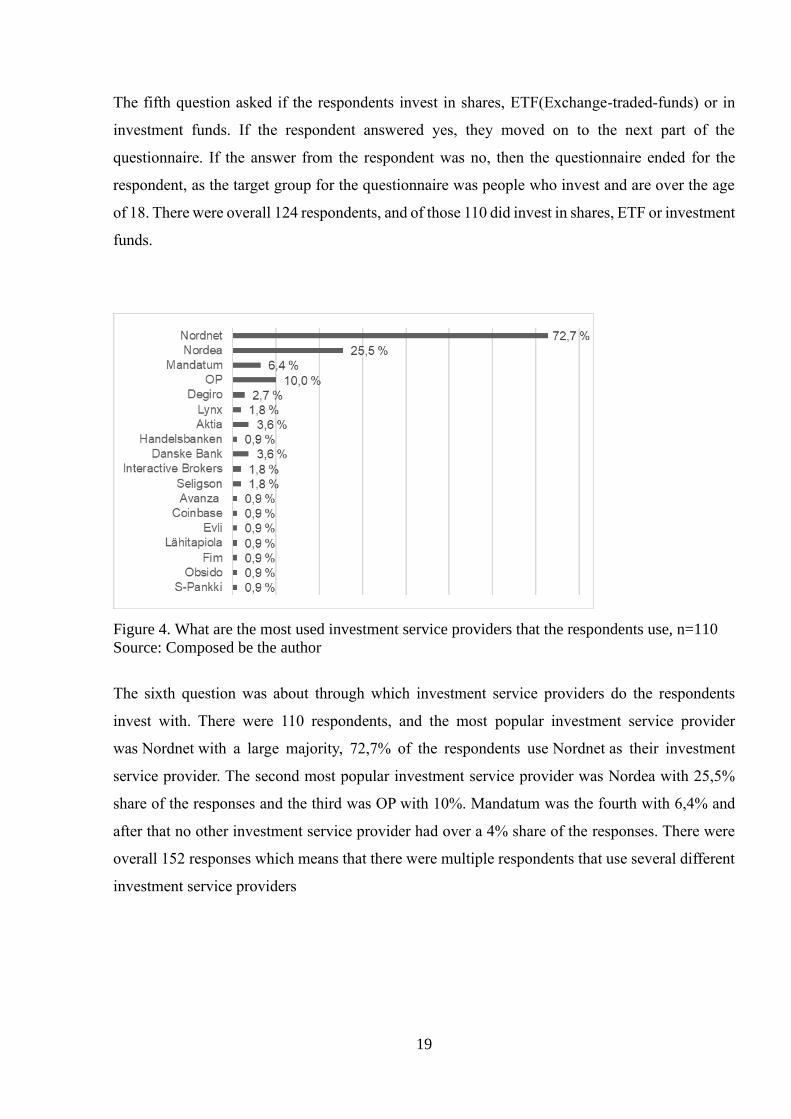
Figure 4. What are the most used investment service providers that the respondents use, n=110
Source: Composed be the author
The sixth question was about through which investment service providers do the respondents
invest with. There were 110 respondents, and the most popular investment service provider
was Nordnet with a large majority, 72,7% of the respondents use Nordnet as their investment
service provider. The second most popular investment service provider was Nordea with 25,5%
share of the responses and the third was OP with 10%. Mandatum was the fourth with 6,4% and
after that no other investment service provider had over a 4% share of the responses. There were
overall 152 responses which means that there were multiple respondents that use several different
investment service providers
20
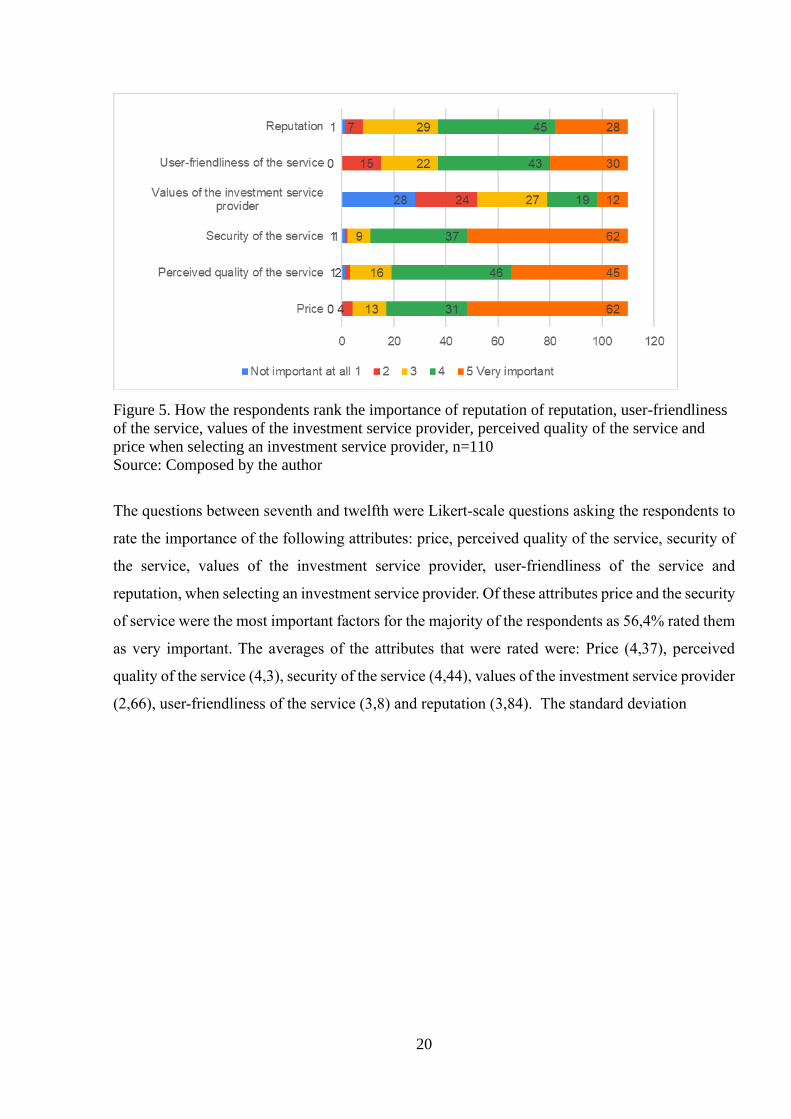
Figure 5. How the respondents rank the importance of reputation of reputation, user-friendliness
of the service, values of the investment service provider, perceived quality of the service and
price when selecting an investment service provider, n=110
Source: Composed by the author
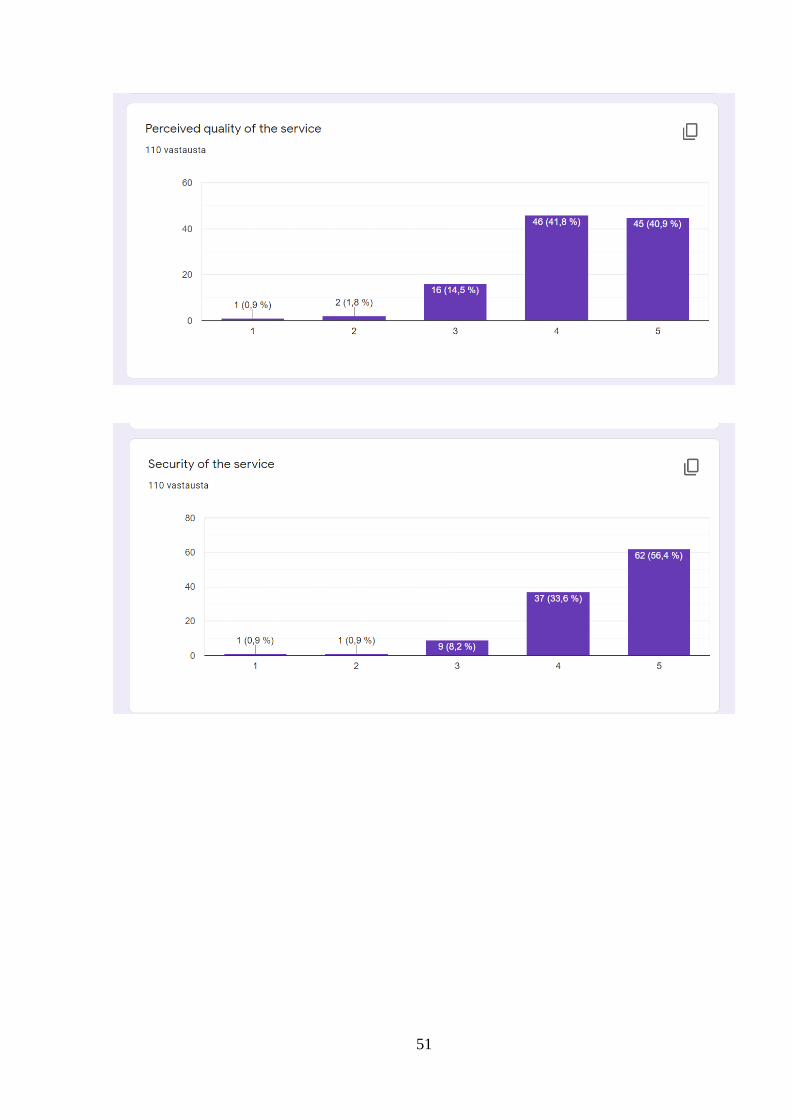
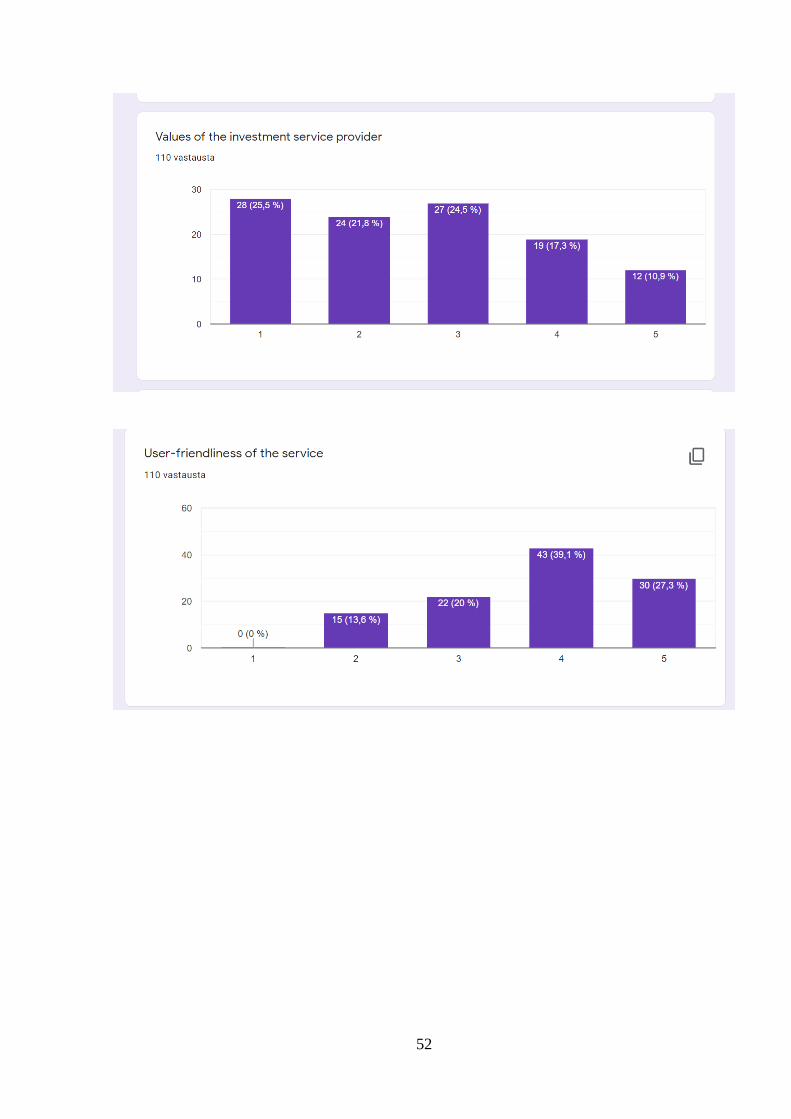
The questions between seventh and twelfth were Likert-scale questions asking the respondents to
rate the importance of the following attributes: price, perceived quality of the service, security of
the service, values of the investment service provider, user-friendliness of the service and
reputation, when selecting an investment service provider. Of these attributes price and the security
of service were the most important factors for the majority of the respondents as 56,4% rated them
as very important. The averages of the attributes that were rated were: Price (4,37), perceived
quality of the service (4,3), security of the service (4,44), values of the investment service provider
(2,66), user-friendliness of the service (3,8) and reputation (3,84). The standard deviation
21
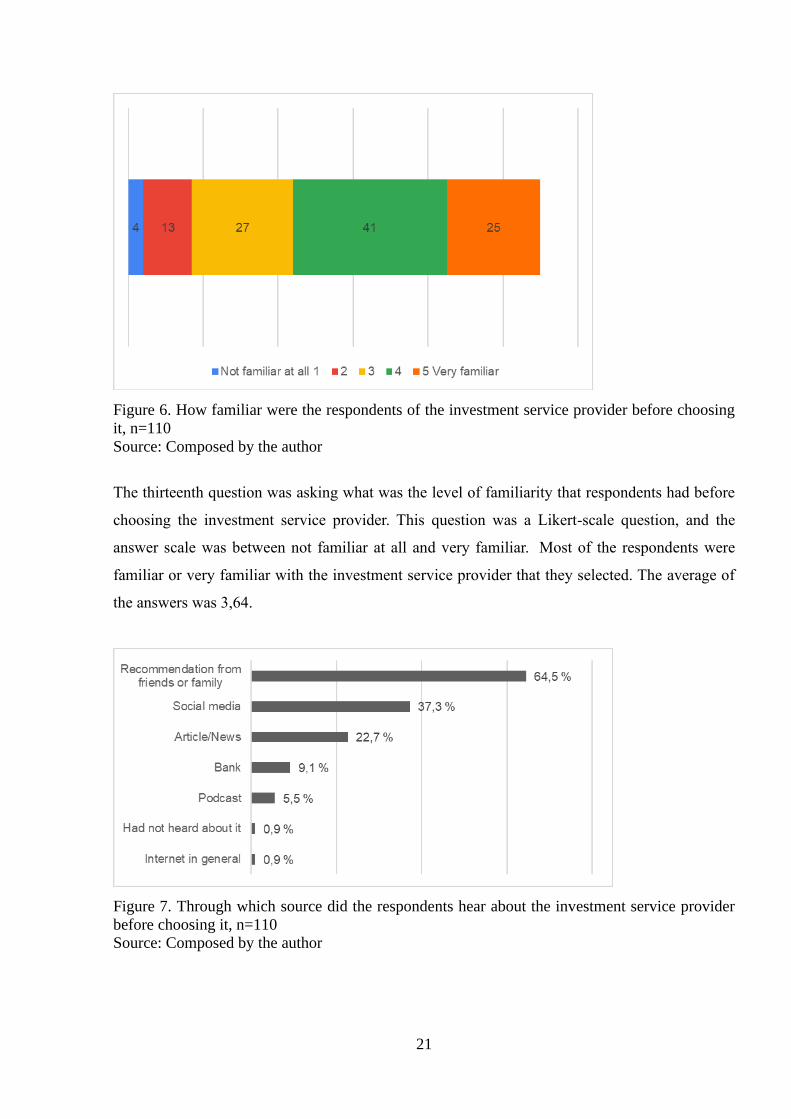
Figure 6. How familiar were the respondents of the investment service provider before choosing
it, n=110
Source: Composed by the author
The thirteenth question was asking what was the level of familiarity that respondents had before
choosing the investment service provider. This question was a Likert-scale question, and the
answer scale was between not familiar at all and very familiar. Most of the respondents were
familiar or very familiar with the investment service provider that they selected. The average of
the answers was 3,64.
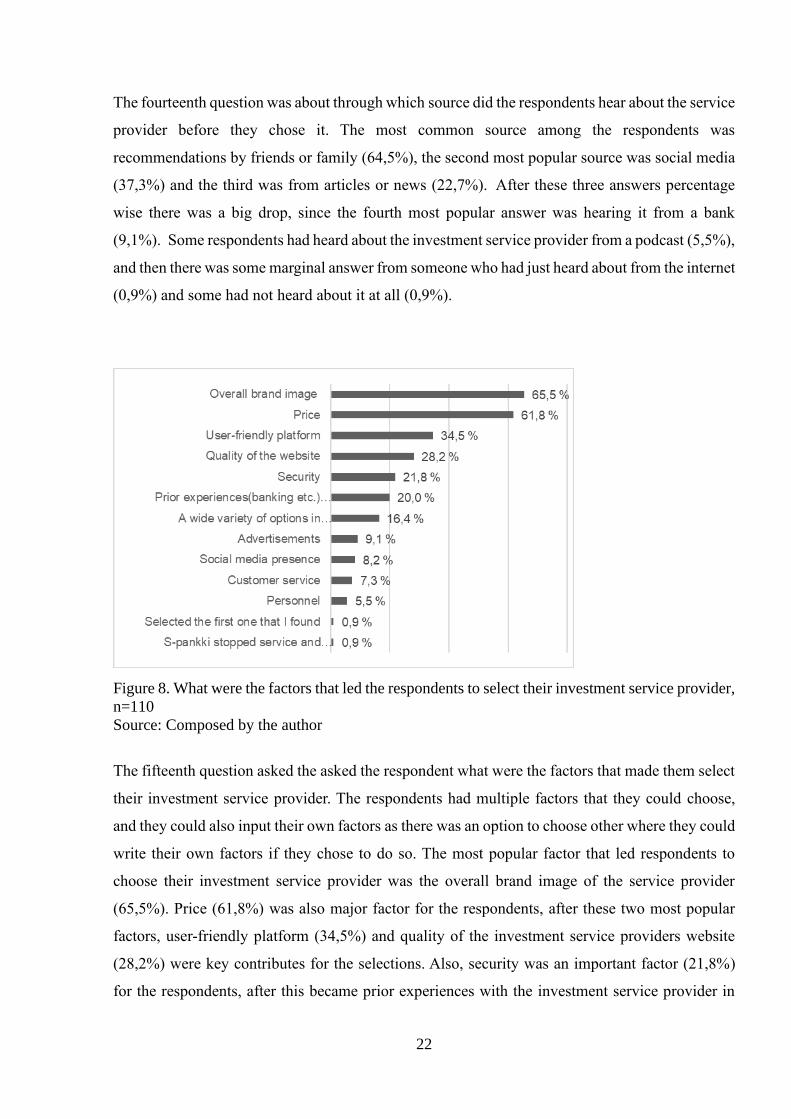
Figure 7. Through which source did the respondents hear about the investment service provider
before choosing it, n=110
Source: Composed by the author
22
The fourteenth question was about through which source did the respondents hear about the service
provider before they chose it. The most common source among the respondents was
recommendations by friends or family (64,5%), the second most popular source was social media
(37,3%) and the third was from articles or news (22,7%). After these three answers percentage
wise there was a big drop, since the fourth most popular answer was hearing it from a bank
(9,1%). Some respondents had heard about the investment service provider from a podcast (5,5%),
and then there was some marginal answer from someone who had just heard about from the internet
(0,9%) and some had not heard about it at all (0,9%).
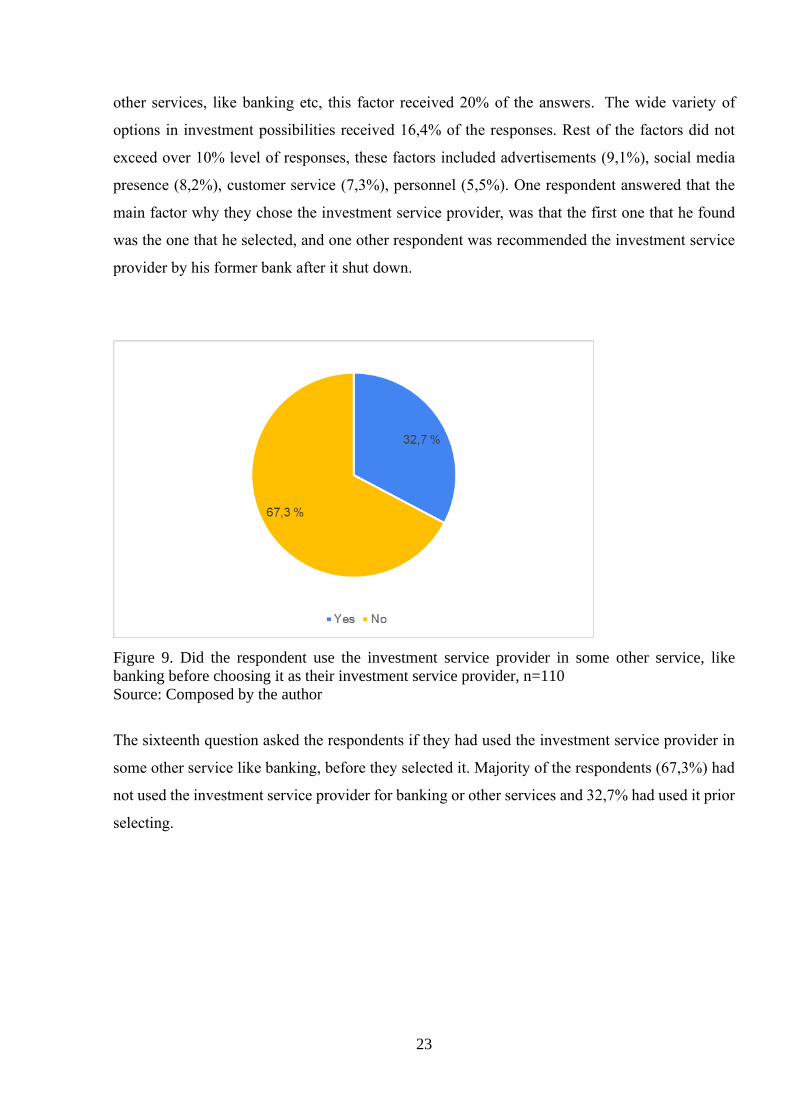
Figure 8. What were the factors that led the respondents to select their investment service provider,
n=110
Source: Composed by the author
The fifteenth question asked the asked the respondent what were the factors that made them select
their investment service provider. The respondents had multiple factors that they could choose,
and they could also input their own factors as there was an option to choose other where they could
write their own factors if they chose to do so. The most popular factor that led respondents to
choose their investment service provider was the overall brand image of the service provider
(65,5%). Price (61,8%) was also major factor for the respondents, after these two most popular
factors, user-friendly platform (34,5%) and quality of the investment service providers website
(28,2%) were key contributes for the selections. Also, security was an important factor (21,8%)
for the respondents, after this became prior experiences with the investment service provider in
23
other services, like banking etc, this factor received 20% of the answers. The wide variety of
options in investment possibilities received 16,4% of the responses. Rest of the factors did not
exceed over 10% level of responses, these factors included advertisements (9,1%), social media
presence (8,2%), customer service (7,3%), personnel (5,5%). One respondent answered that the
main factor why they chose the investment service provider, was that the first one that he found
was the one that he selected, and one other respondent was recommended the investment service
provider by his former bank after it shut down.
Figure 9. Did the respondent use the investment service provider in some other service, like
banking before choosing it as their investment service provider, n=110
Source: Composed by the author
The sixteenth question asked the respondents if they had used the investment service provider in
some other service like banking, before they selected it. Majority of the respondents (67,3%) had
not used the investment service provider for banking or other services and 32,7% had used it prior
selecting.
24
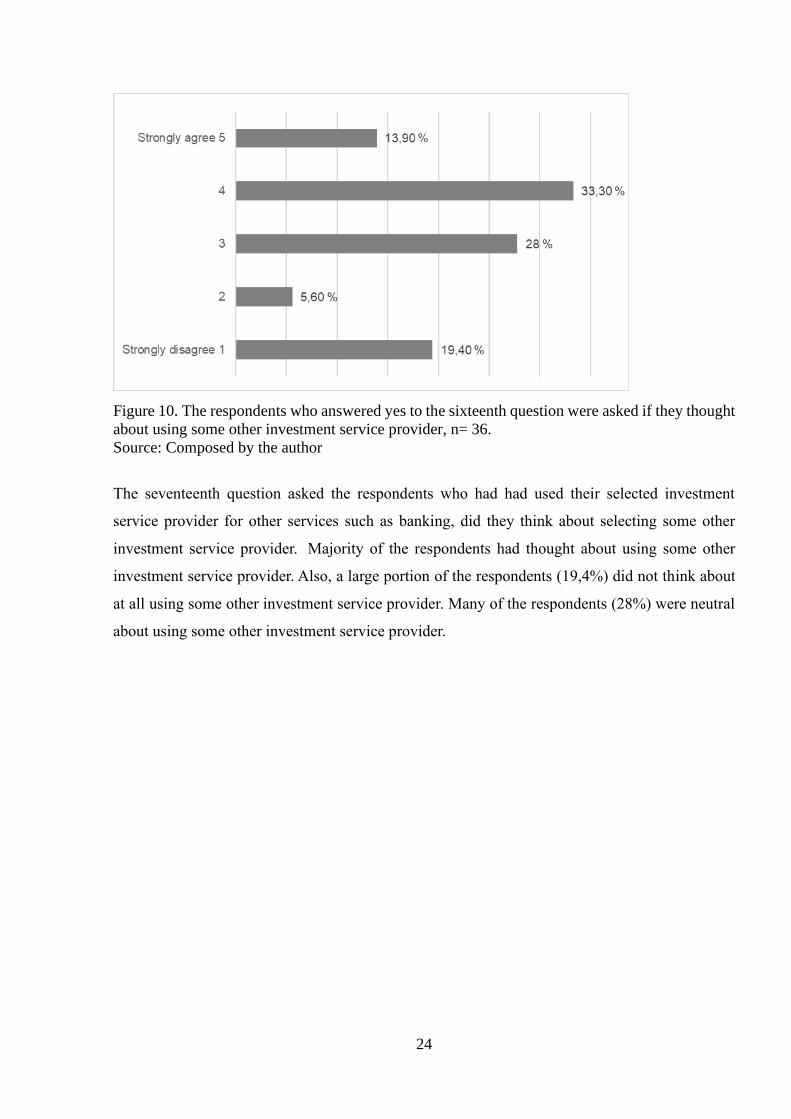
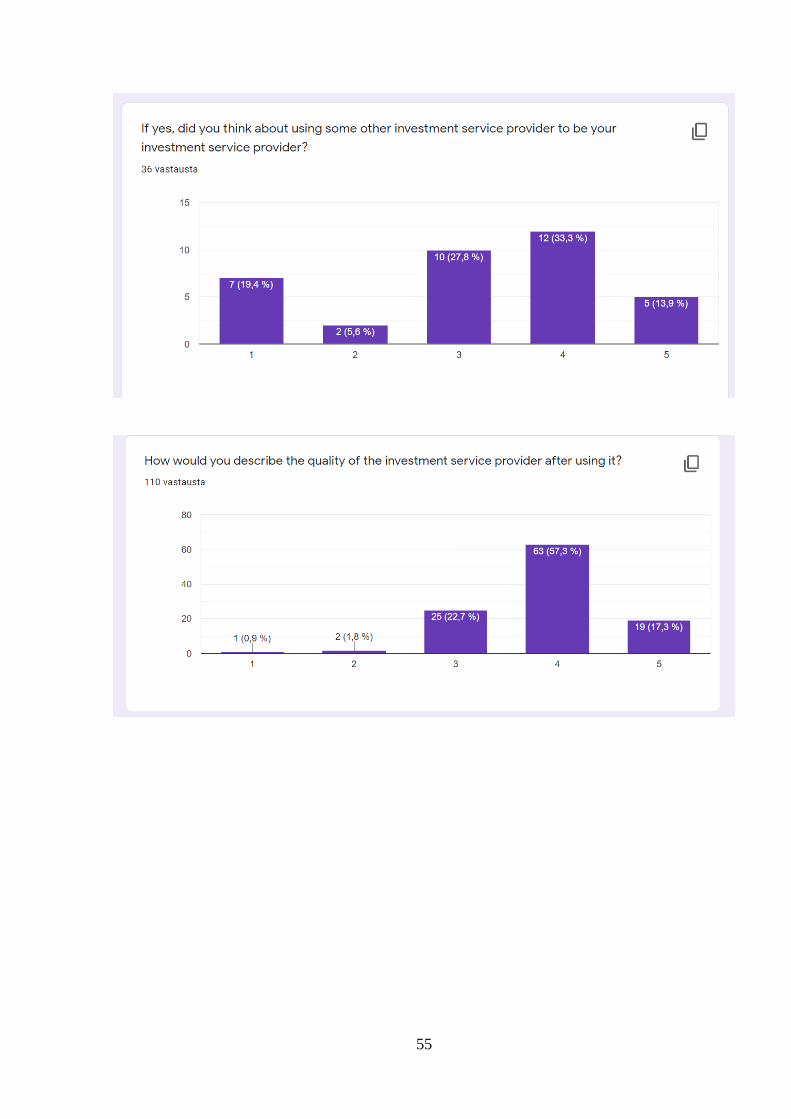
Figure 10. The respondents who answered yes to the sixteenth question were asked if they thought
about using some other investment service provider, n= 36.
Source: Composed by the author
The seventeenth question asked the respondents who had had used their selected investment
service provider for other services such as banking, did they think about selecting some other
investment service provider. Majority of the respondents had thought about using some other
investment service provider. Also, a large portion of the respondents (19,4%) did not think about
at all using some other investment service provider. Many of the respondents (28%) were neutral
about using some other investment service provider.
25
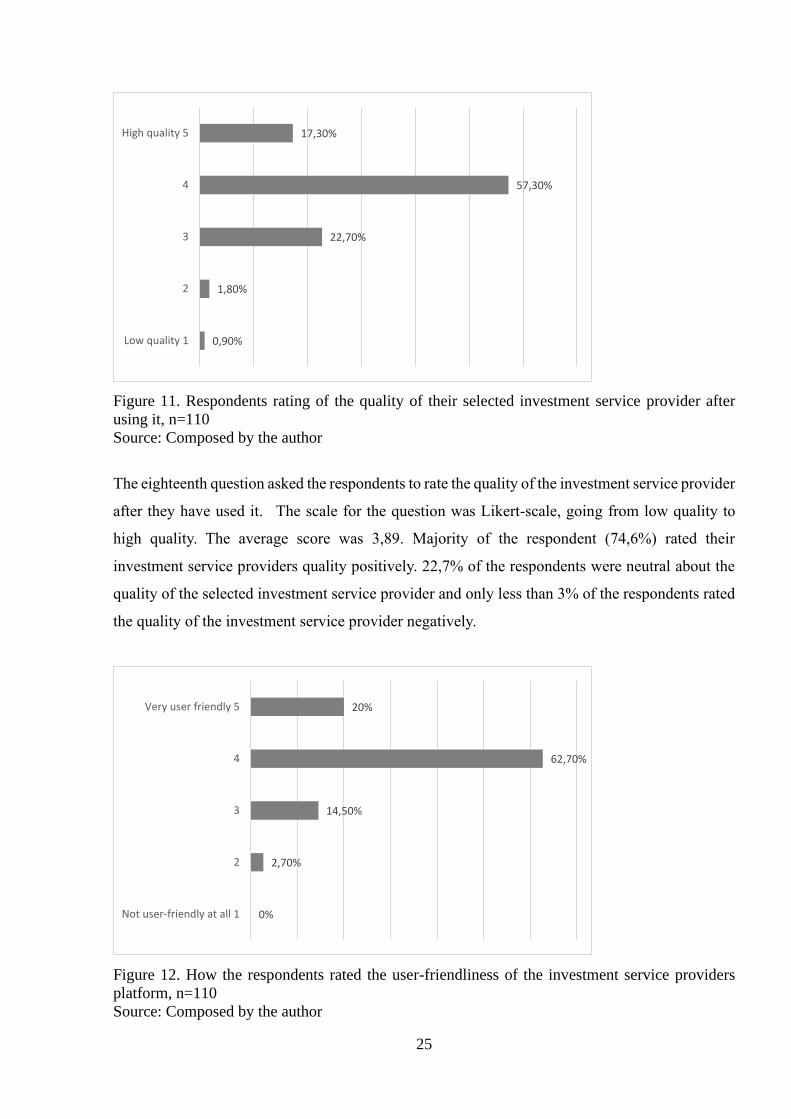
Figure 11. Respondents rating of the quality of their selected investment service provider after
using it, n=110
Source: Composed by the author
The eighteenth question asked the respondents to rate the quality of the investment service provider
after they have used it. The scale for the question was Likert-scale, going from low quality to
high quality. The average score was 3,89. Majority of the respondent (74,6%) rated their
investment service providers quality positively. 22,7% of the respondents were neutral about the
quality of the selected investment service provider and only less than 3% of the respondents rated
the quality of the investment service provider negatively.
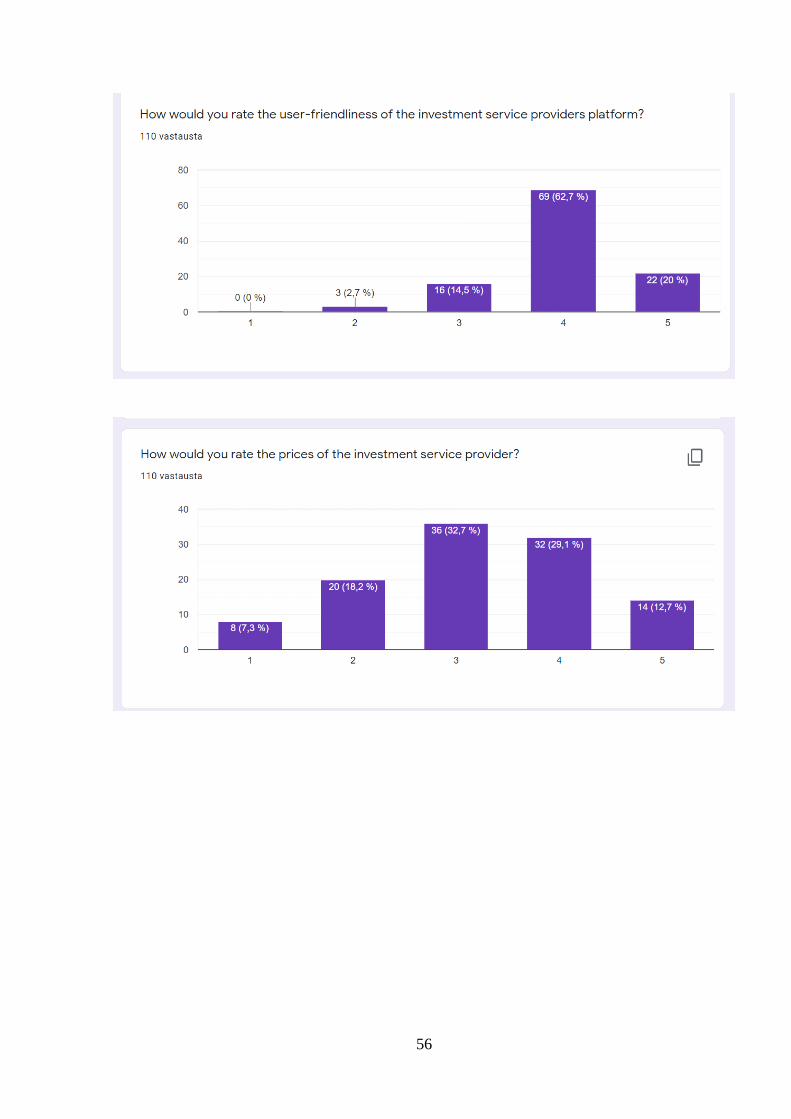
Figure 12. How the respondents rated the user-friendliness of the investment service providers
platform, n=110
Source: Composed by the author
0,90%
1,80%
22,70%
57,30%
17,30%
Low quality 1
2
3
4
High quality 5
0%
2,70%
14,50%
62,70%
20%
Not user-friendly at all 1
2
3
4
Very user friendly 5

26
The nineteenth question asked to respondents to rate the user-friendliness of the investment service
provider that they use. Once again most of the respondents (82,7%) answered positively towards
their experiences with using the platform of their selected investment service provider. 14,5% of
the respondents felt neutral and only 2,7% felt slightly negatively towards the user-friendliness.
The average rate of the user-friendliness was 4.
Figure 13. How the respondents rated the prices of their investment service provider, n=110
Source: Composed by the author
The twentieth question asked the respondents to rate the prices of their investment service
providers. The average of answers was 3,22. Most of the respondents (32,7%) rated the prices of
the investment service provider as neutral, 29,1% rated the prices as low and 18,2% rated them as
high, on the ends of the scale 12,7% rated their investment service providers prices as very low
and 7,3% as very high.
27
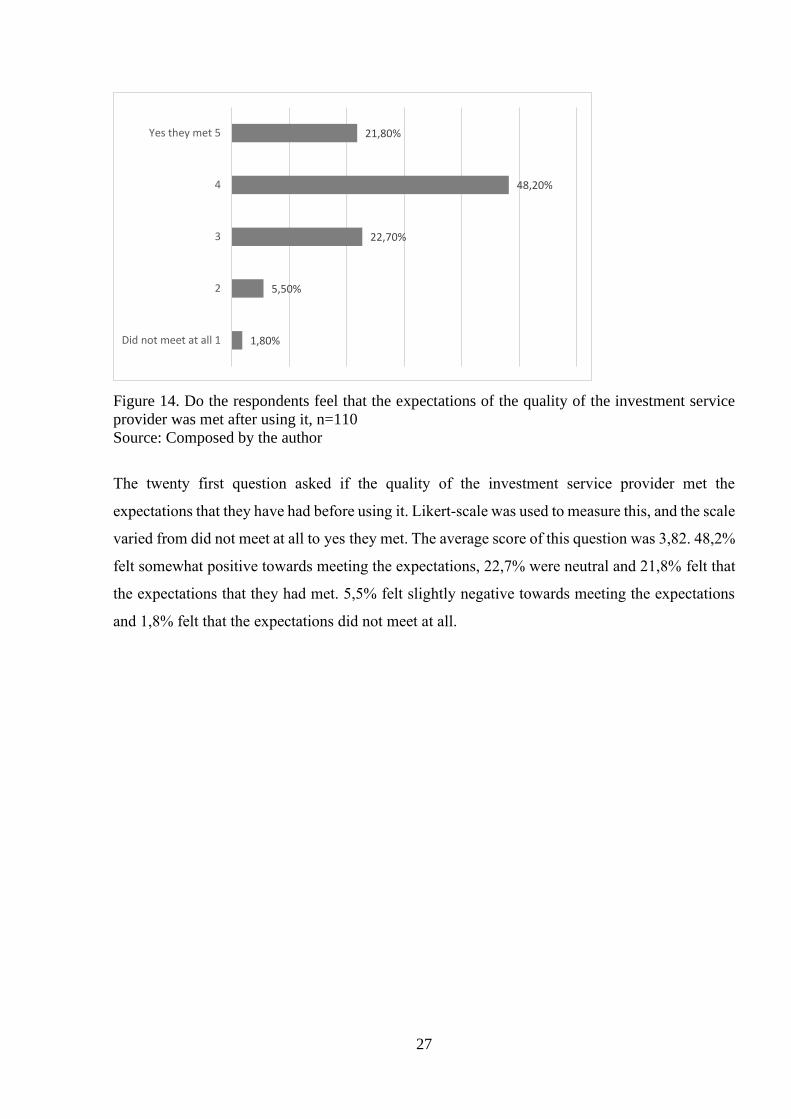
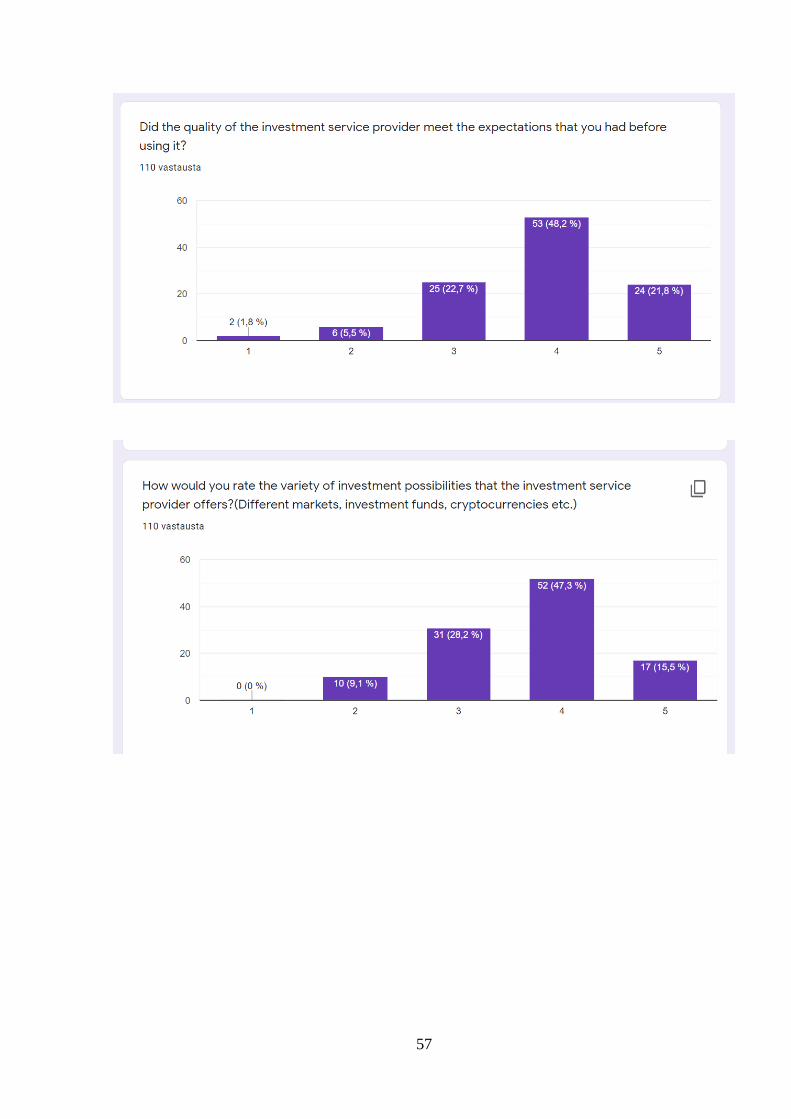
Figure 14. Do the respondents feel that the expectations of the quality of the investment service
provider was met after using it, n=110
Source: Composed by the author
The twenty first question asked if the quality of the investment service provider met the
expectations that they have had before using it. Likert-scale was used to measure this, and the scale
varied from did not meet at all to yes they met. The average score of this question was 3,82. 48,2%
felt somewhat positive towards meeting the expectations, 22,7% were neutral and 21,8% felt that
the expectations that they had met. 5,5% felt slightly negative towards meeting the expectations
and 1,8% felt that the expectations did not meet at all.
1,80%
5,50%
22,70%
48,20%
21,80%
Did not meet at all 1
2
3
4
Yes they met 5
28
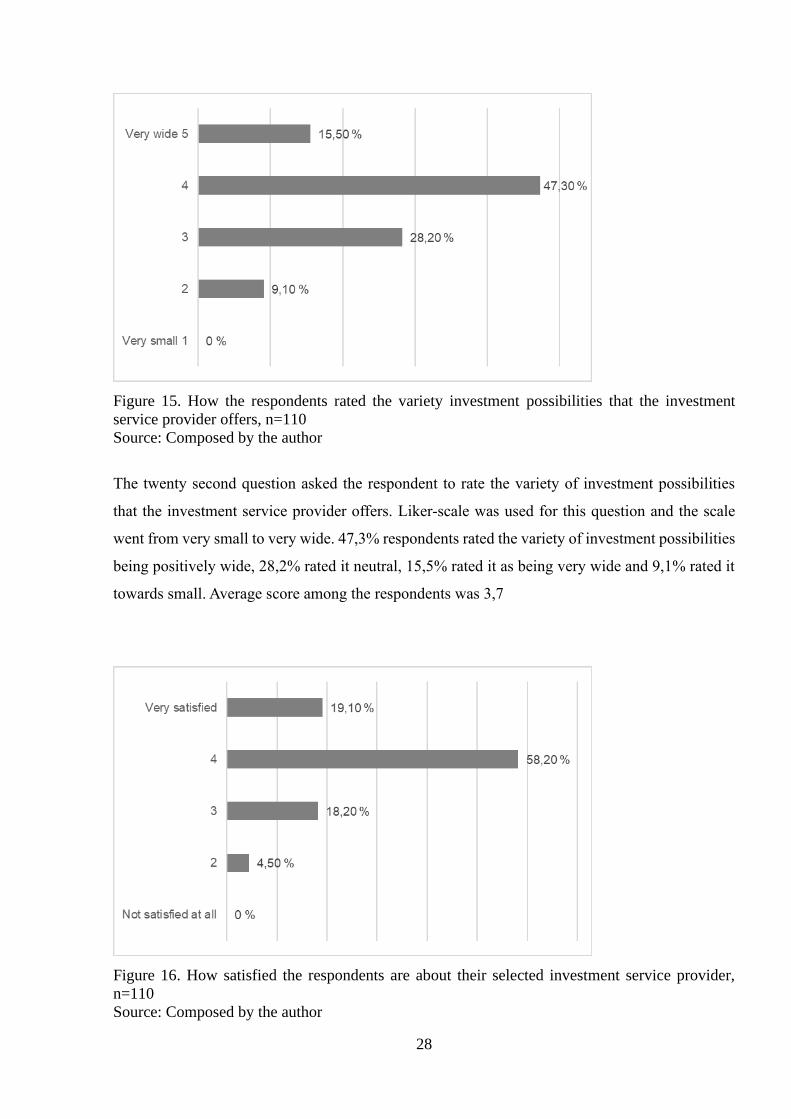
Figure 15. How the respondents rated the variety investment possibilities that the investment
service provider offers, n=110
Source: Composed by the author
The twenty second question asked the respondent to rate the variety of investment possibilities
that the investment service provider offers. Liker-scale was used for this question and the scale
went from very small to very wide. 47,3% respondents rated the variety of investment possibilities
being positively wide, 28,2% rated it neutral, 15,5% rated it as being very wide and 9,1% rated it
towards small. Average score among the respondents was 3,7
Figure 16. How satisfied the respondents are about their selected investment service provider,
n=110
Source: Composed by the author

29
The twenty third question asked how satisfied the respondents are about the investment service
provider are that they selected. 58,2% of the respondents felt that they are somewhat satisfied,
19,1% answered that they are very satisfied, 18,2% were neutral and 4,5% were somewhat not
satisfied. The average of the answers was 3,92.
Figure 17. How likely will the respondents change their investment service provider in the
following 12 months, n=110
Source: Composed by the author
The twenty fourth question asked how likely the respondents are to change the investment service
provider in the following 12 months. Majority of the respondents (52,7%) were not likely at all to
change their investment service provider in the following 12 months, 22,7% were leaning towards
not likely, 14,5% were neutral. 7,3% answered that it was likely that they would change and 2,7%
answered that it was very likely. The average score from the responses was 1,85.
30
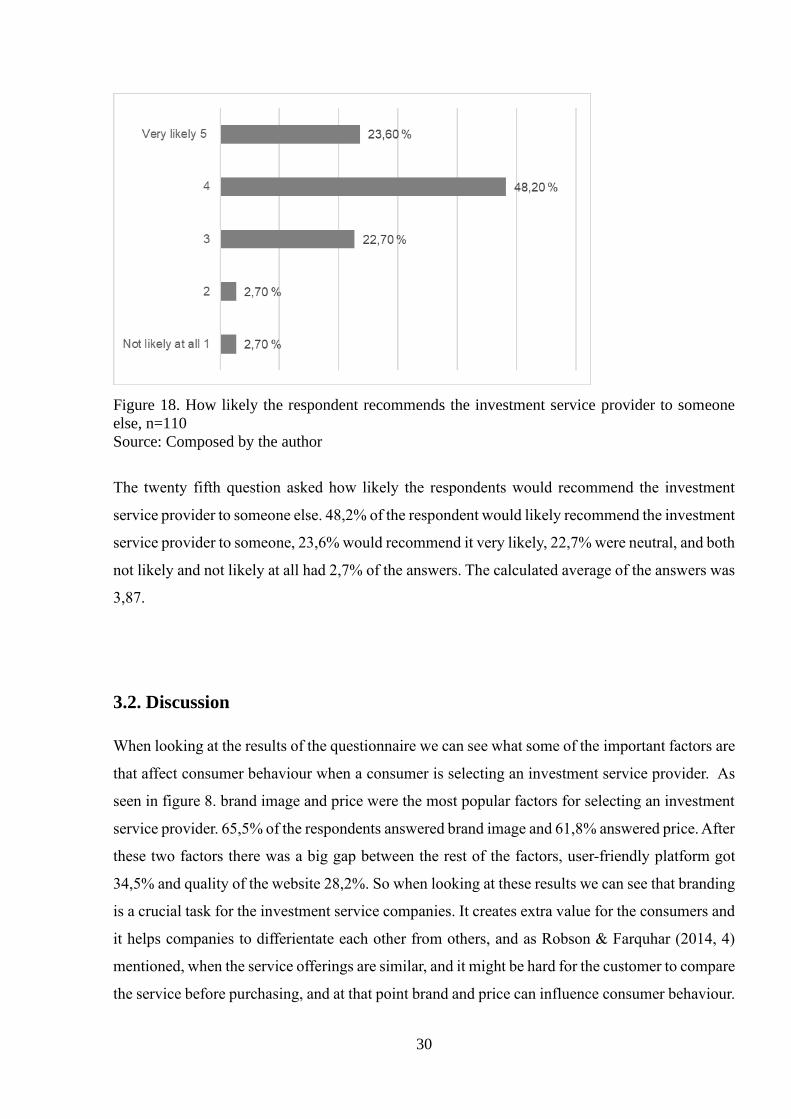
Figure 18. How likely the respondent recommends the investment service provider to someone
else, n=110
Source: Composed by the author
The twenty fifth question asked how likely the respondents would recommend the investment
service provider to someone else. 48,2% of the respondent would likely recommend the investment
service provider to someone, 23,6% would recommend it very likely, 22,7% were neutral, and both
not likely and not likely at all had 2,7% of the answers. The calculated average of the answers was
3,87.
3.2. Discussion
When looking at the results of the questionnaire we can see what some of the important factors are
that affect consumer behaviour when a consumer is selecting an investment service provider. As
seen in figure 8. brand image and price were the most popular factors for selecting an investment
service provider. 65,5% of the respondents answered brand image and 61,8% answered price. After
these two factors there was a big gap between the rest of the factors, user-friendly platform got
34,5% and quality of the website 28,2%. So when looking at these results we can see that branding
is a crucial task for the investment service companies. It creates extra value for the consumers and
it helps companies to differientate each other from others, and as Robson & Farquhar (2014, 4)
mentioned, when the service offerings are similar, and it might be hard for the customer to compare
the service before purchasing, and at that point brand and price can influence consumer behaviour.

31
When the respondents were asked to rank the importance of the factors given in figure 5. price and
security of the service were ranked the most important factors. So as Salciuviene et al. (2014, 198)
stated, security was an important factor affecting consumer behaviour. Perceived quality of the
service was the third most highly ranked factor for the respondents. Reputation was also ranked
higly among the respondents. The least important factor overall among the respondents was the
values of the investment service provider.As repuation and perceived quality can be seen as a part
of brand image, it is important for companies that to create a brand that is associated with high
quality and a positive reputation. Creating a brand for investment service providers that is
associated with a competitive price and a secure service is also important to attract consumers.
Quite suprisingly the values of the investment services were not important for most of the
respondents, if the values of the companies are not really brought up, it is possible that many of
the respondents did not know what the values are. It would be interresting to see if this would
change if the gender demographics of the conducted questionnaire were the other way around.
Nordnet was owerwhelmingly most popular investment service provider among the respondents.
72,7% of the respondent used Nordnet, the second most used service provider was Nordea with
25,5% of the respondent using it as their investment platform. The third most popular was OP
with 10%. There were also multiple respondents who used multiple service providers for their
investments.
The respondents were asked if they were familiar with the investment service provider before
choosing it and majority of the respondents were atleast somwhat familiar with the service provider
that they selected. When asked through which sources the respondents had heard about the
investment provider before choosing it, the most popular source was a recommendation for friends
or family. 64,5% of the respondent answered had gotten a recommendation, and as O’Loughlin
& Szmigin (2004, 20) had mentioned it is important that the brand gets referrals and word of mouth
marketing from consumers to differiante itself from competitors. The second most popular source
among the respondents was social media. 37,3% of the respondents had heard about their
investment service provider from social media, and 22,7% had heard about the service provider
from an article or the news. This means that brand loyalty is something that companies should
focus on as majority of the respondents had gotten recommendations. Also creating brand
awareness through social media is neccesary for a company to attract customers. So companies
could report about popular stocks, new investmend funds or important news that have happened
32
on the stock markets on their social medias or try to work with social media influencers to create
knowledge and value for their consumers.
32,7% of the respondents had used their selected investment service provider for some other
services prior to selecting it as their investment platform. When asked from these respondents if
they thought about using some other investment service provider, 47,2% had atleast somewhat
thought about using some other company. 19,40% did not think at all about using some other
investment service provider. This would suggest that banks that also offer investment possibilities
should try to increase brand loyalty among their already existing consumers.
The respondent were asked to rate the quality of their selected investment service. Majority of the
respondent ranked the quality towards high, only 2,7% rated the quality towards low. When asked
about the user-friendliness of the investment service provider platform, majority (82,7%) of the
respondent felt positively about it. When asked about the prices of their selected investment service
provider after using it, the respondents answers were a bit more evenly distributed. 41,8% felt that
the prices were towards low, 32,7% were in the between and 25,5% were towards the prices being
high. This would suggest that some of the respondents felt that the prices might been higher than
they expected. 70% of the respondents felt that the quality of the service provider atleast somewhat
met the expectations that they had and only 7,3% felt towards that the expectations did not fully
meet. Also majority (62,8%) of the respondent rated the variety of investment possibilites atleast
somewhat wide on their selected investment service provider. Overall majority (77,3%) of the of
the respondents were towards being positively satisfied about their selected investment service
provider and only 4,5% were not complete satisfied. So we could say that overall majority of the
consumers evaluated their experiences positively after using the services of investment service
providers and therefore the companies have mostly met the expectations that the brands have
created.
When asked about how likely the respondent would change investment service provider in the
following 12 months, 52,7% said that it is not likely at all and 22,7% were towards not likely,
14,50% were in between and 10% were atleast somewhat likely to change. Majority of the
respondents (71,8%) were atleast somewhat likely to recommend their investment service provider
to someone else. This would suggest that these investment service companies have succeed in
creating brand loyalty, which is important in attracting customers and creating brand awareness,
which is seen in figure 7.

33
Overall increasing brand equity for investment service providers is important. As mentioned
before, many of these companies these services have similar service offerings and brand is one of
the main things that separates these companies from each other. Creating a brand that brings value
for the consumer is hard, but focussing on competitive pricing, user-friendly platforms, high
quality websites and having a wide variety of investment possibilities are good ways to do it.
34
CONCLUSION
This study was done to find out what are important factors for consumers when selecting an
investment service provider in Finland and how consumers evaluate their experiences with their
selected investment service providers. The finnish investment service provider industry has been
experiencing growth in terms of private shareholder numbers in the recent years. The service
offerings that these investment service providers offer are very similar, and finding out what factors
are important to the consumers can be beneficial for the investment service providers to differiante
from each other. Evaluating the experiences that consumer have will give information on what
aspects the investment service providers can do better on. An online questionare was conducted to
receive answers for these questions and the answers were analyzed to meet the study objective.
The following two research questions were created for the study 1) What are important factors for
the consumer when selecting an investment service provider? 2) How do the consumers evaluate
their experiences from using the selected investment service providers? The factors that were asked
about were gathered from already existing literature, and respondents were asked to answer
questions about these factors. Main findings that the study found were that brand image, and price
were the the most important factors for the respondents. Security of the service was also important
factor to the consumers. The most used investment service provider was Nordnet, and majority of
the consumer described the quality of their investment service provider as being good quality and
most consumers were also satisfied with their selection. This study also found out that majority of
the consumers received recommendations from friends or family about their investment service
provider. Consumers also responded that user-friendly platforms and good quality websites are
important factors that affect consumer behavior.
The result of this study generated specific information about the way consumers see different
factors in choosing an investment service providers in Finland and what are some of the aspects
that investment service providers can improve on to make their services more tempting.

35
There very some limitations that occured in this study. As the sampling method that was used, was
non-probability sampling, which means that the sample does not represent the whole population.
Access to the questionnaire was limited due to the fact that it was an online questionnaire and
posted on to the internet and social media. Also as the questionnaire was conducted in English and
the questionnaire was posted to Finnish speaking forums, it is possible that some of the respondents
have not fully understood the questions. The majority of the respondents were male and the
received results could have varied if there had been more female respondents. Also majority of the
respondents used Nordnet as their investment service provider and the rest of the investment
service providers had a lot less users in this sample.
For further research it would be beneficial to conduct a qualitative study about the same research
problem as it would give a more insightful view on the factors and would probably come up with
some other factors that is not found on currently existing literature. This study suggests that
investment service provides should focus on creating a brand image that is associated with a
competitive price and a secure service. The study found out that majority of the respondents were
satisfied in every category questioned about their experiences with selected investment service
provider.

36
LIST OF REFERENCES
Aaker, D. (1991) Managing Brand Equity. New York: The Free Press.
Aaker, D. (1996) Building Strong Brands. New York: The Free Press
Al-Hawari, M. (2011) Do Online Services Contribute to Establishing Brand Equity Within the
Retail Banking Context? Journal of Relationship Marketing. 10 8 (3) 145-166.
Berry, L. (2000) Cultivating service brand equity. Journal of the Academic of Marketing Science,
28, (1), 128-137.
Bou-Llusar, J. Camison-Zornoza, C. Escrig-Tena, A. (2001) Measuring the relationship between
firm perceived quality and customer satisfaction and its influence on purchase intention.
Total Quality Management, 12 (6), 719-734.
Chi, H. Yeh, H. Yang, Y. (2009) The Impact of Brand Awareness on Consumer Purchase
Intention: The Mediating Effect of Perceived Quality and Brand Loyalty. The Journal of
International Management Studies, 4 (1). 135-144.
Danish, R. Khan, M. Ghafoor, M. Ahmad, I. Humayon, A. Aslam, S. (2018) Impact of Brand
Loyalty in Assessing Purchase Intentions of a Customer: A Study of Automobile Industry
in South Asian Perspective. A Research Journal of South Asian Studies, 33(2), 347-364.
De Chernatony, L (2003) Brand building. In M.J. Baker (Ed.) Marketing Book (5th ed) (372-
394). Oxford. Butterworth-Heinemann.
Development of the number of shareholders (2021). Euroclear Finland Retrieved
from https://www.euroclear.com/finland/en/statistics.html#content_title_1177124260 , 17
March 2021
Franses, P. Paap, R. (2001) Quantitative Models in Marketing Research. Cambridge. Cambridge
University Press.
Hsiao, K. Chen, C. (2017) What drives smartwatch purchase intention? Perspective from
hardware, software, design and value. Telematics and Informatics, 35(1), 103-113
Järvenpää, A.(2019) Osakevälityksen palkiot eivät enää laske - Nordnet: “Hintakisa on ohi”
Retrieved from
https://www.kauppalehti.fi/uutiset/osakevalityksen-palkkiot-eivat-enaa-laske-nordnet-
hintakisa-on-ohi/7ca56499-4090-4e06-b3e1-6ed8d6965e40 , 18 March 2021.

37
Keller, K. (2012) Strategic Brand Management: Global Edition. Boston : Pearson.
Khan, M. (2006) Consumer Behaviour and Advertising Management. New Delhi. New Age
International Ltd.
Kim, P. (1990) A Perspective on Brands. Journal of Consumer Marketing, 7 (4), 63-67.
Kotler, P. Keller, K. Goodman, M. Mairead, B & Hansen, T. (2019) Marketing Management
4th European Edition. Harlow: Pearson Education, Limited.
Mirabi, V. Akbariyeh, H. Tahmasebifard, H. (2015) A Study of Factors Affecting on Customers
Purchase Intention. Journal of Multidisciplinary Engineering Science and Technology. 2
(1), 267-273.
Mohsin M. (2009) Encyclopaedia of Brand Equity Management : Volumes 1-3. Mumbai:
Himalaya Publishing House.
Moin, S. Devlin, J. McKechnie, S. (2016) The magic of branding: The role of ‘pledge’, ‘turn’ in
fostering consumer trust in financial services. Journal of Financial Services
Marketing,21(2), 113-126.
O’Cass, A. Lim, K. (2002) The influence of Brand Associations on Brand Preference and
Purchase Intention. Journal of International Consumer Marketing 14(2-3), 41-71.
O’Loughlin, D. Szmigin, I. (2004) Customer perspectives on the role and importance of branding
in Irish retail financial services. International Journal of Bank Marketing, 23(1), 8-27.
Osakesäästötili käyttöön vuonna 2020(2018).Valtiovaraininisteriö 9.4.2021 Retreived from
https://vm.fi/-/osakesaastotili-kayttoon-vuonna-2020 , 9 April 2021.
Ranta-aho, H.(2019) Nordnetin etumatka lyheni. Retrieved
from https://www.yumpu.com/fi/document/read/62788464/viisas-raha-6-2019 18 March
2021.
Robson, J. Farquhar, J. (2014) A Brave New World: Branding in Financial Services. In
T.Harrison & H. Estelami, The Routledge Companion to Financial Services Marketing.1-
29.
Ruel,E (2019) 100 Questions (and Answers) About Survey Research. California: SAGE
publications
Salciuviene, L. Auruskeviciene V. Ivanauskiene, N. (2014) Key Drivers Affecting Customer
Intention to Purchase Financial Services Online. Inzerine Ekonomika-Engineering
Economics, 25(2), 194-202.
38
Statista (2020) Which of these financial products and investment are you planning to acquire in
the next 12 months? Retrieved
from https://www.statista.com/forecasts/1188019/financial-product-purchase-intention-
in-finland , 17 March 2021
Tracy, B. (2014) Marketing. New York: American Management Association.
Tsiotsou, R. (2005) Perceived Quality Levels and their Relation to Involvement, Satisfaction,
and Purchase Intentions. Marketing Bulletin 16.
Yasin, M. Noor, N. Mohammad, O (2007) Does image of country-of-origin matter to brand
equity? Journal of Product & Brand Management, 16 (1), 38-48.
Year-end report(2020).Nordnet Retrieved from
https://nordnetab.com/wp-content/uploads/2021/02/Q4eng20.pdf , 18 March 2021.

39
APPENDICES
Appendix 1. Questionnaire

40

41

42

43

44

45
46

47
48
Appendix 2. Results of the questionnaire

49

50
51
52

53

54
55
56
57

58

59

60
Appendix 3. Non-exclusive licence
A non-exclusive licence for reproduction and publication of a graduation thesis11
I Joel Ylä-Mononen
1. Grant Tallinn University of Technology free licence (non-exclusive licence) for my
thesis:
FACTORS AFFECTING CONSUMER BEHAVIOUR WHEN SELECTING AND
USING INVESTMENT SERVICE PROVIDERS IN FINLAND
supervised by Yiannis Kouropalatis,
1.1 to be reproduced for the purposes of preservation and electronic publication of the
graduation thesis, incl. to be entered in the digital collection of the library of Tallinn University of
Technology until expiry of the term of copyright;
1.2 to be published via the web of Tallinn University of Technology, incl. to be entered in the
digital collection of the library of Tallinn University of Technology until expiry of the term of
copyright.
2. I am aware that the author also retains the rights specified in clause 1 of the non-exclusive
licence.
3. I confirm that granting the non-exclusive licence does not infringe other persons' intellectual
property rights, the rights arising from the Personal Data Protection Act or rights arising from other
legislation.
_______________ (date)
1 The non-exclusive licence is not valid during the validity of access restriction indicated in the student's application
for restriction on access to the graduation thesis that has been signed by the school's dean, except in case of the
university's right to reproduce the thesis for preservation purposes only. If a graduation thesis is based on the joint
creative activity of two or more persons and the co-author(s) has/have not granted, by the set deadline, the student
defending his/her graduation thesis consent to reproduce and publish the graduation thesis in compliance with clauses
1.1 and 1.2 of the non-exclusive licence, the non-exclusive license shall not be valid for the period.