Habits of Inequality: A Radical View of Institutions and Inequality
Upload
khangminh22Category
view
1download
0
Factor Shares in the Long Run
Matthew Fisher-Post
March 2020
WID.world WORKING PAPER N° 2020/03
Factor Shares in the Long Run
Matthew Fisher-Post⇤†
March 2020
Abstract
The purpose of this study is to construct and then analyze a new dataset that systematicallydocuments the labor share of national income for more than 200 countries over the past 70years. Using new archival data on national accounts, we measure the long-run evolution ofnational income between factor shares (labor and capital). In addition to its implicit impor-tance in the study of inequality, the data naturally lends itself to novel empirical analysis ofinternational patterns in tax progressivity, trade integration, technology, and labor force com-position.
⇤Center for International Development (Harvard Kennedy School)79 John F Kennedy St, Cambridge, MA 02138matthew [email protected]& World Inequality Lab (Paris School of Economics)48 Boulevard Jourdan, Paris 75014 [email protected]
†The author gratefully acknowledges research support and instructive guidance from Anders Jensen and GabrielZucman, and helpful comments and discussion from Facundo Alvaredo, Thomas Blanchet, Francois Bourguignon,Ignacio Flores, Jeremie Gignoux, Douglas Gollin, Loukas Karabarbounis, Brent Neiman, and Rafael Proenca. Iwould be remiss not to acknowledge the kind support and historical data provided by Hermanus Smith and theNational Accounts Section of the United Nations Statistics Division, as well as archival researchers at HarvardUniversity’s Lamont Library Government Documents collection. Errors are mine.
1

Contents
1 Introduction 3
2 Conceptual Framework 4
3 Data 6
4 Method 7
References 14
Tables 16
2

1 Introduction
Recent studies have suggested an international rise in the capital share of national income alongwith increased concentration of both income and wealth (e.g., Piketty and Zucman, 2014; WorldInequality Report, 2018). Such striking results raise further questions on the global extent ofcapital’s rise, and on the fiscal policy tools that either mitigate or amplify inequality and growth.The first question, then, is how national incomes (and their growth) have been distributed be-tween capital and labor, over the long run, and especially in the less-studied developing countries.
To answer this question, we build a novel and comprehensive database that harmonizes andsystematically integrates 70 years of national accounts data from more than 200 countries acrossall levels of development.
Before studying these trends, the definitions will be important: Labor and capital sharescan be defined as the proportion of national income that accrues to labor and capital inputs, thefactors of production. We will return to their precise measurement below, but economists sincethe time of Solow (1956) have generally understood the labor share to be a static proportion ofnational income (between 60 and 80 percent of GDP, according to early estimates).
However, more recent empirical studies have called that assumption into question. Whilethese studies vary in their methods, they generally find that the compensation of labor (relativeto the returns to capital) has declined in a majority of countries observed. Although Karabarbou-nis and Neiman (2014) limited their measure to the corporate sector labor share (more on thisin Section 2 below), they found that the relative compensation of labor (relative to the returnsto capital) had declined in a majority of countries, and attributed these results to a decliningrelative price of capital investment. By contrast, Cette, Koehl and Philippon (2019) have useddetailed French data to argue that any decline in the observed labor share may be an artifact ofproperty values, and could be overstated if one does not adequately account for self-employment.Nevertheless, Piketty, Saez and Zucman (2018) documented that overall income for 90 percentof the US population (largely labor income) has not increased since 1980, despite skyrocketinggrowth at the top of the distribution (largely capital income). The first World Inequality Report(Alvaredo et al 2018) documented similar trends worldwide.
Simply put, scholars disagree on the basic facts of the labor share—its level and its trend—let alone the mechanisms driving those trends.
In this study, we clarify and reconcile several methodological di↵erences among measuresof the labor share, and extend the temporal and geographic coverage of these estimates—with asingle benchmark measure over 200 countries and 70 years.
To construct factor shares, then, we begin with a pioneering dataset of national accountsvariables, including archival materials not available elsewhere. Where mixed income is missing insome early country-years, we use information about its later values and other national accountsvariables to retrieve and impute its earlier values. Our statistical model reflects persistence ineach country’s time series and captures constant country characteristics. After finally estimating
3
mixed income from the rich coverage of long-run national accounts data that we do have, we arein position to estimate the complete long-run returns to labor and capital.
Our study of factor shares eventually aims, then:
i. to clarify and reconcile methodological distinctions in measuring the labor share;
ii. to expand coverage to include 200 countries over 70 years; and
iii. to analyze global trends in the labor share of national income.
The database should naturally lend itself to analysis of inequality and the determinants of la-bor’s relative compensation, along dimensions of public finance and taxation, trade and laborregulations, and fiscal policy controls.
2 Conceptual Framework
After building our original comprehensive database of harmonized, long-run national accountsdata, we can begin to calculate the labor share of GDP at factor cost:
YL
Y=
CE + ↵ ·OSPUE
CE +OSCORP +OSPUE
(1)
where YL
Yis the labor share of GDP at factor cost (subtracting indirect taxes net of
subsidies, which are neither labor nor capital income); CE is labor income, the com-pensation of employees in formal wages and salaries; OSCORP is capital income, theoperating surplus of corporations in the corporate sector (net of employee compensa-tion and other costs); OSPUE is “mixed income,” the return to self-employment andinformal/unincorporated enterprises; and ↵ represents the (usually unobserved) laborcomponent of mixed income, usually represented as 0.7 (with 0.3 the capital share ofmixed income).
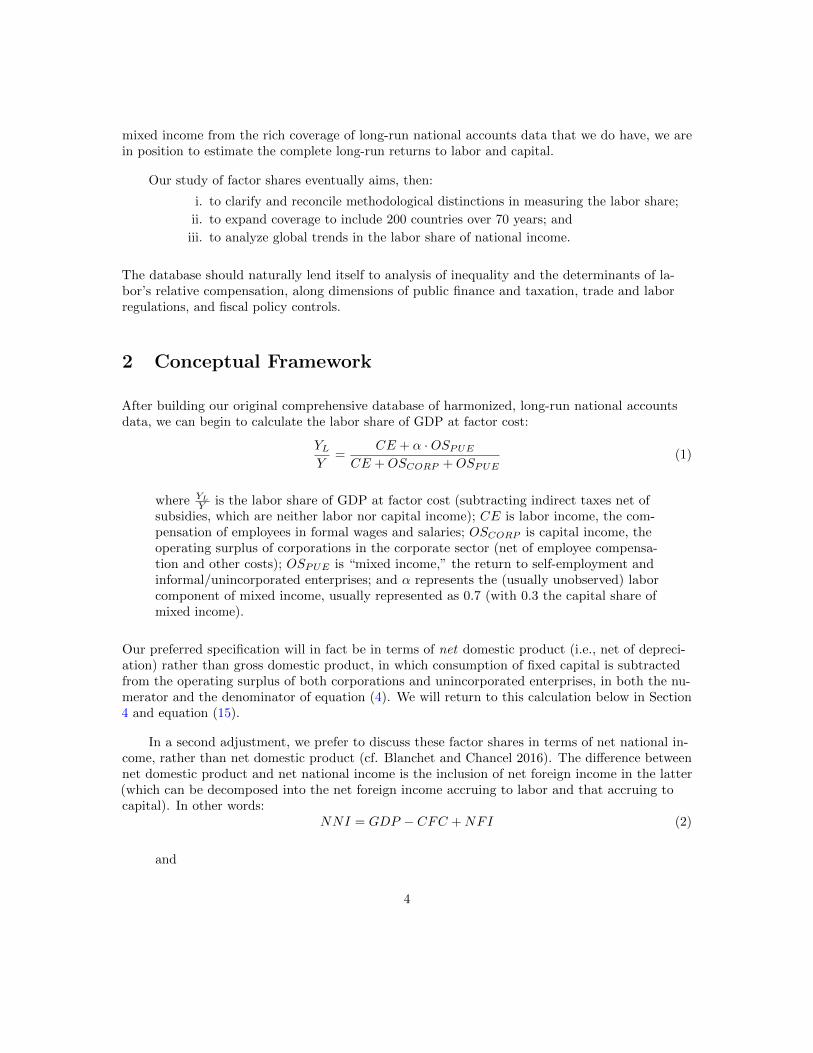
Our preferred specification will in fact be in terms of net domestic product (i.e., net of depreci-ation) rather than gross domestic product, in which consumption of fixed capital is subtractedfrom the operating surplus of both corporations and unincorporated enterprises, in both the nu-merator and the denominator of equation (4). We will return to this calculation below in Section4 and equation (15).
In a second adjustment, we prefer to discuss these factor shares in terms of net national in-come, rather than net domestic product (cf. Blanchet and Chancel 2016). The di↵erence betweennet domestic product and net national income is the inclusion of net foreign income in the latter(which can be decomposed into the net foreign income accruing to labor and that accruing tocapital). In other words:
NNI = GDP � CFC +NFI (2)
and
4

NFI = NFIL +NFIK (3)
where NNI is net national income; CFC is depreciation (consumption of fixed capi-tal); and NFI is net foreign income, attributable to labor (NFIL) and capital (NFIK).
Taking these adjustments into account, our benchmark specification represents the labor share offactor-price net national income:
YL
Y=
CE + ↵ ·OSPUE +NFIL
CE +OSCORP +OSPUE +NFI(4)
Before moving on, we should note an important assumption we are making in this estimation.That is, we currently do not have a better measure of ↵ (the labor share of mixed income) thanto follow the literature that estimates ↵ = 70%.1 It would be reasonable to speculate that ↵may di↵er across countries and over time, for both di↵erences in measurement of what countsas self-employment and unincorporated enterprise (across countries) and for di↵erences in theeconomic fundamentals within corporations vs. unincorporated enterprises (which could di↵erboth across countries, with di↵erent mixes of industries and self-employment by industry, andover time). However, we do not currently have enough information to pass judgment on the likelyranges of ↵ by place and time, so for now we leave it as it has been canonically represented in theliterature. We will return to this point in future research.
Now, in considering the variety of ways to measure the labor share, two earlier e↵orts areparticularly worthy of note. Gollin’s seminal study (2002) underlined the pitfalls of estimatinglabor shares without taking self-employment into account, then set forth what has since becomethe most established method(s) for doing so.2 While Gollin’s data and method covered relativelyfew countries and years, Karabarbounis and Neiman (2014, henceforth KN) tracked the laborshare for almost 60 middle- and high-income countries over more than 15 years.
We extend this coverage to developing countries, over the past 70 years: See Table 1 for acomparison of our data coverage to these earlier sources. We also compare studies from Feenstraet al (Penn World Table [PWT] 2015) and Guerriero (2019).
Because of the di�culty of measuring ↵ in (4) above, and the potential controversy or modelsensitivity from any assumption, KN (2014) simply omit mixed income OSPUE from their calcu-lation and discussion of the labor share. As such, their labor share represents only the corporatesector of the economy, and does not capture self-employment and unincorporated enterprises.Gollin’s (2002) benchmark specification does the same, in assuming that the labor share in thecorporate sector is the same as in the economy as a whole.
1For further discussion of this point, refer to the World Inequality Lab’s Distributional National Accountsguidelines (Alvaredo et al 2020).
2First, Gollin (2002) adjusted for mixed income by assuming that it follows the same proportion of laborincome as in the corporate sector. Second, he proposed to improve on this unsatisfactory measure by imputingthe same wage/salary to informal and self-employed workers as is found in the formally employed corporate sector.The first technique is perhaps oversimplistic, while data for the second technique is hard to come by, and eventhen it may not be fully satisfactory. Refer to Guerriero (2019), ILO (2019) and Cette, Koehl and Philippon (2019)for further discussion, as well as Table 2 below.
5

In contrast to that approach, we explicitly make use of national accounts information onmixed income—with expanded data coverage from archival records—and a simple, transpar-ent statistical imputation procedure for the remaining missing data on mixed income. Table 2presents a snapshot of existing methodological choices in the related literature, including Bengts-son and Waldenstrom (2015, henceforth BW), Cette, Koehl and Philippon (2019, henceforthCKP) and ILO (2019), in addition to the studies cited in the preceding Table 1.
Nonetheless, it could be argued that a limitation of the conceptual framework discussed hereis the extent to which we must assume that ↵ is a stable parameter and accurately representedat 70%. If the labor share in the corporate sector is significantly greater than (or less than) 70%,perhaps there would be less reason to believe that ↵ = 70% accurately represents the unincorpo-rated enterprises’ sector—and one might imagine that the bias could go either way. If corporatelabor share is low, perhaps that is because the unincorporated sector labor share is high and self-employed workers are unwilling to enter a poorly remunerated sector. Or perhaps the reverseis the case, and the self-employed sector simply reflects the labor share of the corporate sectorproportionally (or worse). These unknowns would strike at the robustness of the assumption inour benchmark specification of ↵ above; however, we would like to show that the results are notsensitive to the range of that parameter, and that there is perhaps little reason to be skepticalabout self-employment labor income in the first place. We will return to further discussion andalternative specifications below.
With this conceptual framework in mind, we can move to a presentation of our data sourcesand then a more detailed discussion of the method.
3 Data
In this section we describe the raw sources to create a unique, harmonized panel of national ac-counts data: from the World Inequality Database, UN System of National Accounts, HarvardLibrary archives, and complementary sources.
From the World Inequality Database (WID), we draw an extensive historical and geographiccoverage of aggregate variables on gross domestic product (GDP) and net national income (NNI),including depreciation (consumption of fixed capital, CFC) and net foreign income (NFI),3 aswell as variables on population and purchasing power parity (PPP) and local currency unit (LCU,current and constant) price indices. We transform all WID variables into percentages of GDP, forcomparison purposes.
From the United Nations System of National Accounts (UN SNA), we retrieve online na-tional accounts statistics that cover approximately 4,000 country-years (across approximately180 countries) for aggregate variables from the production and income accounts of their “Main
3For data on the labor share of net foreign income, we referred to IMF Balance of Payments data. SeeBlanchet-Chancel (2016). We take from current accounts “primary income, compensation of employees abroad, net(credit - debit)” as the labor share of net foreign income (and subtract this NFItotal to reach the capital share),under the working hypothesis that self-employment income accounts for a negligible proportion of income fromabroad, particularly in developing countries.
6

Aggregates and Detailed Tables” (UN 2019, henceforth MADT). These variables include grossvalue added; compensation of employees; gross operating surplus of corporations and quasi-corporations; that of private unincorporated enterprises; consumption of fixed capital; and in-direct taxes net of subsidies—as well as some further-disaggregated components of these, all ofwhich may be occasionally expressed net of CFC instead of gross.
Beyond what is available online, the System of National Accounts o�ce (at the UN StatisticsDivision in New York, henceforth UNSD) has provided us with electronic archival material onthe components of GDP, with more than 2000 country-year observations from the 1960s and1970s. These observations are framed in the SNA1968 format (UN SNA 1968). To this we haveadded manually digitized data records from the Harvard Library archive, where national accountscoverage dates even to the 1950s and the format of the UN SNA data predates even the SNA1968framework.
Further extensions are also possible, including to retrieve disaggregated labor and industryvariables from additional UN sources and survey datasets. However, for the time being we onlycomplement the WID and UN SNA data with some additional information on indirect taxes(when information on these are missing from those sources).
For missing data on indirect taxes, we draw from a parallel construction in the same project,a harmonized set of tax revenue variables from sources including OECD, IMF, ICTD, and na-tional statistical o�ces’ historical records both online and in the Harvard University governmentdocuments archive (manually digitized, as above).
From these several complementary but nonetheless distinct reference materials, some harmo-nization across statistical yearbooks and sources is therefore required.
4 Method
In this section we will discuss the steps we follow to achive a factor shares estimate for everycountry-year for which we ever have any data on the cost components of GDP in the nationalaccounts. In order to get there, we need to: (a) harmonize data across sources; then (b) retrieveoccasional missing values that are in fact implicitly available; and finally (c) compensate for re-maining missing values, which can be imputed from other values in the same countries’ long-runseries.
To harmonize across sources we identify and smooth over any artificial statistical outliers;pay attention to database footnotes; draw from external data; and prioritize conflicting data.
To recover missing values that are in fact implicitly available, we leverage national account-ing identities that help us extend coverage beyond the data that is available on the surface level.
Last, to compensate for any remaining missing values in our critical variables of interest, weapply a simple and transparent imputation procedure.
7

First, to harmonize series and units across sources, we need a common frame of reference.We first put all variables in terms of GDP. To abstract away from raw levels particularly helps incases where currency units or price indices varied across sources. This is particularly the case forcomparing WID (constant LCU or PPP) with UN SNA (current LCU) variables, as well as acrosscountry-years of SNA data where the currency changes.
In order to select among the several available sources of data discussed above—and in somecases, several available series within a single country-year—we prioritize as follows: First, weprefer online data. Where this is unavailable, we turn to archival data provided by the UNSD.Where this is unavailable, we refer to the manually digitized material from the Harvard Libraryarchives.4 In some cases, there is more than one ‘series’ available within a given country-year,even from the same ‘source.’
That is, the UN SNA has revised its framework national accounting guidelines several timessince the initial accounts. National statistical agencies have followed suit with parallel time seriesthat map one era with one methodological ‘series’, and then map another with a usually slightlyrevised methodological ‘series.’ To the extent that these series can di↵er during the year(s) oftheir overlap, it is important to ‘re-base’ them across the transition year(s), in order to avoidsharp jumps in the time series that are only artifacts of national accounting procedure and not ofthe actual economies (and data-generating processes) they represent.
We use a reverse smoothing procedure to dampen (if not entirely remove) the e↵ect of anyartificial shocks during these ‘series change’ years. Rather than using the well-known Hodrick-Prescott filter (to remove stationary business cycle shocks), nor a constant arithmetic term im-puted backwards, we refer to Hamilton (2018) to implement a simple and intuitive technique.That is, following Hamilton’s benchmark specification, but in reverse to suit this context,5 weregress earlier values (from the earlier series) on later ones (from the later series):
yt�h = �0 + �1yt+1 + �2yt+2 + · · ·+ �hyt+h + vt�h (5)
where t is a five-year window of years prior to the series change; h = 5, per Hamilton(2018); and y represents each of the national accounting variables in our analysis.
In all cases of multiple series within a country-year-source, we prefer the later series to the earlierseries, for the likely measurement accuracy improvements that revised series reflect.
However, when in some cases the earlier series include variables that the later series do notinclude, we incorporate this information in a way that is faithful to the aggregate levels of thelater series, by way of equation (5). This is especially true for the long-run measurements ofmixed income (operating surplus of private unincorporated enterprises, OSPUE), whose impor-tance we will return to below.
Online and archival data from UN SNA includes a raft of footnotes—many of them reflectingnecessary adjustments to the raw data. For instance: In some cases we needed to remove FISIM
4Where no data is available, we impute the (earlier) missing values based on the (later) observed values, withineach country. More on this in Section 4 below.
5We use lead variables instead of lag variables.
8
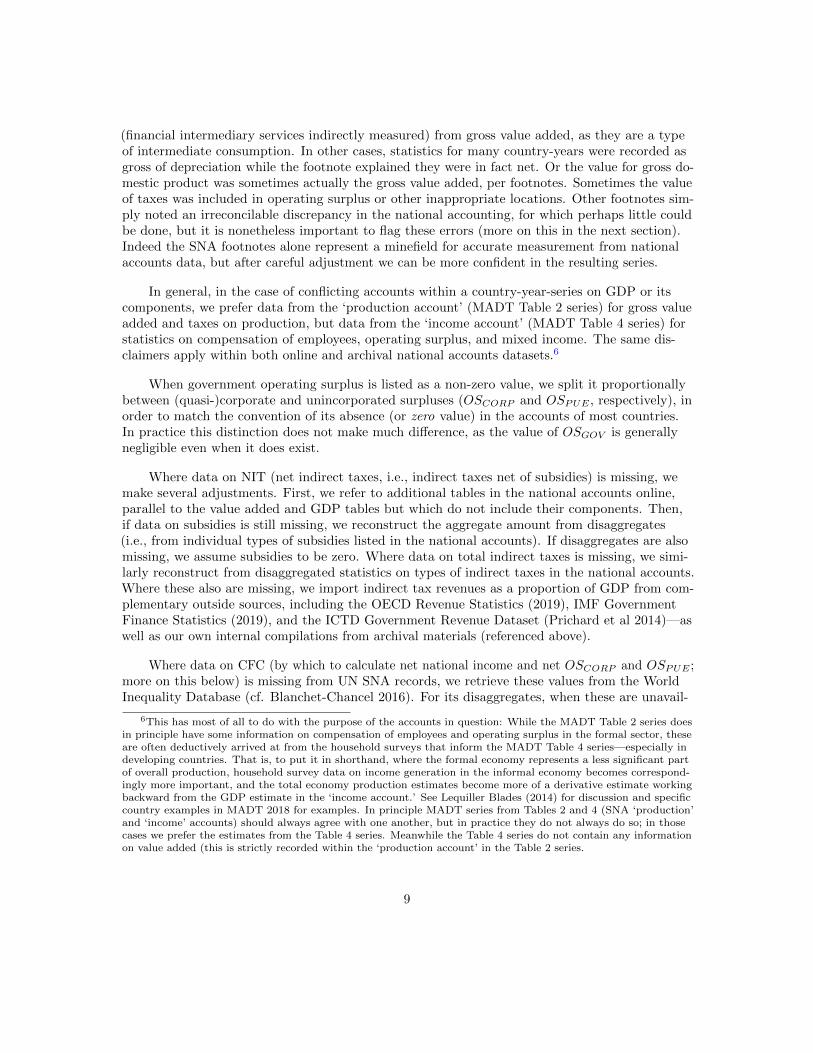
(financial intermediary services indirectly measured) from gross value added, as they are a typeof intermediate consumption. In other cases, statistics for many country-years were recorded asgross of depreciation while the footnote explained they were in fact net. Or the value for gross do-mestic product was sometimes actually the gross value added, per footnotes. Sometimes the valueof taxes was included in operating surplus or other inappropriate locations. Other footnotes sim-ply noted an irreconcilable discrepancy in the national accounting, for which perhaps little couldbe done, but it is nonetheless important to flag these errors (more on this in the next section).Indeed the SNA footnotes alone represent a minefield for accurate measurement from nationalaccounts data, but after careful adjustment we can be more confident in the resulting series.
In general, in the case of conflicting accounts within a country-year-series on GDP or itscomponents, we prefer data from the ‘production account’ (MADT Table 2 series) for gross valueadded and taxes on production, but data from the ‘income account’ (MADT Table 4 series) forstatistics on compensation of employees, operating surplus, and mixed income. The same dis-claimers apply within both online and archival national accounts datasets.6
When government operating surplus is listed as a non-zero value, we split it proportionallybetween (quasi-)corporate and unincorporated surpluses (OSCORP and OSPUE , respectively), inorder to match the convention of its absence (or zero value) in the accounts of most countries.In practice this distinction does not make much di↵erence, as the value of OSGOV is generallynegligible even when it does exist.
Where data on NIT (net indirect taxes, i.e., indirect taxes net of subsidies) is missing, wemake several adjustments. First, we refer to additional tables in the national accounts online,parallel to the value added and GDP tables but which do not include their components. Then,if data on subsidies is still missing, we reconstruct the aggregate amount from disaggregates(i.e., from individual types of subsidies listed in the national accounts). If disaggregates are alsomissing, we assume subsidies to be zero. Where data on total indirect taxes is missing, we simi-larly reconstruct from disaggregated statistics on types of indirect taxes in the national accounts.Where these also are missing, we import indirect tax revenues as a proportion of GDP from com-plementary outside sources, including the OECD Revenue Statistics (2019), IMF GovernmentFinance Statistics (2019), and the ICTD Government Revenue Dataset (Prichard et al 2014)—aswell as our own internal compilations from archival materials (referenced above).
Where data on CFC (by which to calculate net national income and net OSCORP and OSPUE ;more on this below) is missing from UN SNA records, we retrieve these values from the WorldInequality Database (cf. Blanchet-Chancel 2016). For its disaggregates, when these are unavail-
6This has most of all to do with the purpose of the accounts in question: While the MADT Table 2 series doesin principle have some information on compensation of employees and operating surplus in the formal sector, theseare often deductively arrived at from the household surveys that inform the MADT Table 4 series—especially indeveloping countries. That is, to put it in shorthand, where the formal economy represents a less significant partof overall production, household survey data on income generation in the informal economy becomes correspond-ingly more important, and the total economy production estimates become more of a derivative estimate workingbackward from the GDP estimate in the ‘income account.’ See Lequiller Blades (2014) for discussion and specificcountry examples in MADT 2018 for examples. In principle MADT series from Tables 2 and 4 (SNA ‘production’and ‘income’ accounts) should always agree with one another, but in practice they do not always do so; in thosecases we prefer the estimates from the Table 4 series. Meanwhile the Table 4 series do not contain any informationon value added (this is strictly recorded within the ‘production account’ in the Table 2 series.
9
able, we assign CFC from corporations vs. CFC from unincorporated enterprises to be equivalentto the ratio of operating surplus in these two sectors. It should be noted that this a preliminaryassumption, as one may also suspect that the use (and depreciation) of fixed capital could di↵eracross corporate and unincorporated enterprises. In practice, the sensitivity or propensity of CFCto di↵er by formal vs. informal industry will not a↵ect our results in the calculation of factorshares.
While UN SNA benchmark values are most easily (and up to here) treated in terms of GDP,our benchmark measure is to prefer all values in terms of national income. This simple transfor-mation is to subract depreciation from GDP and to add back net foreign income (also retrievedfrom WID).
Now that we have harmonized data across sources, we can turn to the problem of missingvalues within the multi-source harmonized dataset. This is the second step. For these remainingmissing values, we can often make use of accounting identities to (implicitly) retrieve SNA values,or we can impute these values based on neighboring values within a country time series.
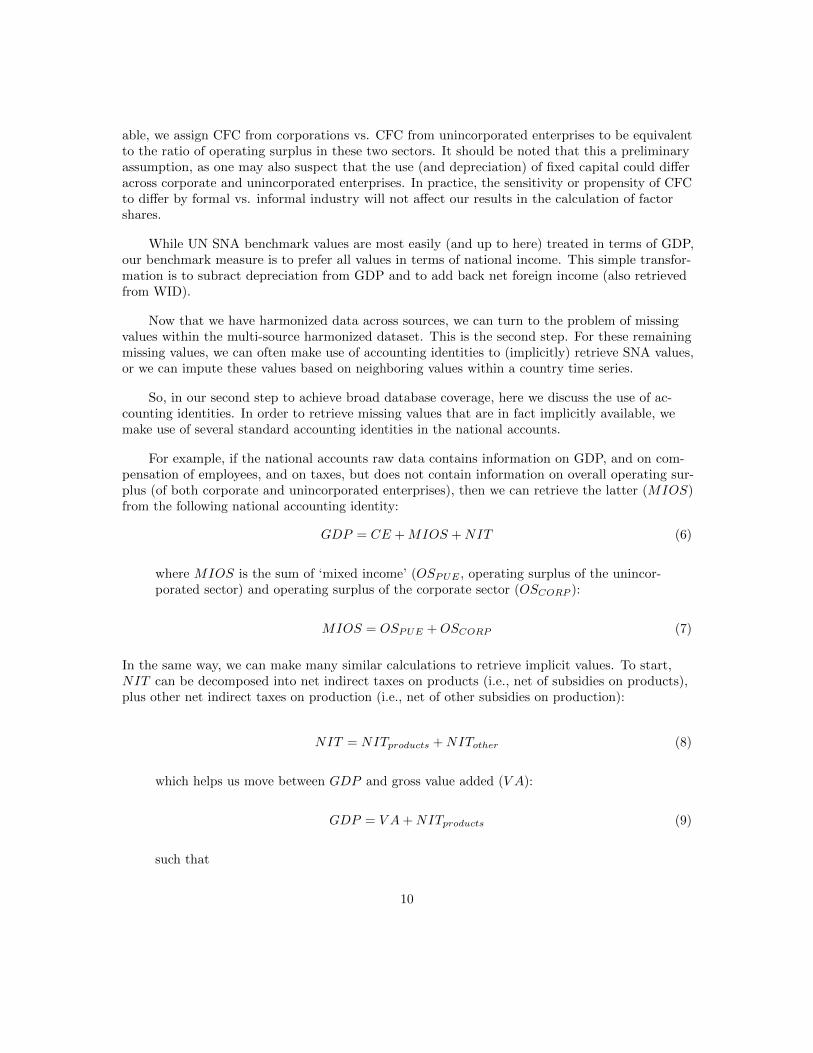
So, in our second step to achieve broad database coverage, here we discuss the use of ac-counting identities. In order to retrieve missing values that are in fact implicitly available, wemake use of several standard accounting identities in the national accounts.
For example, if the national accounts raw data contains information on GDP, and on com-pensation of employees, and on taxes, but does not contain information on overall operating sur-plus (of both corporate and unincorporated enterprises), then we can retrieve the latter (MIOS)from the following national accounting identity:
GDP = CE +MIOS +NIT (6)
where MIOS is the sum of ‘mixed income’ (OSPUE , operating surplus of the unincor-porated sector) and operating surplus of the corporate sector (OSCORP ):
MIOS = OSPUE +OSCORP (7)
In the same way, we can make many similar calculations to retrieve implicit values. To start,NIT can be decomposed into net indirect taxes on products (i.e., net of subsidies on products),plus other net indirect taxes on production (i.e., net of other subsidies on production):
NIT = NITproducts +NITother (8)
which helps us move between GDP and gross value added (V A):
GDP = V A+NITproducts (9)
such that
10

V A = CE +MIOS +NITother (10)
So far, all terms are gross of depreciation, but their net values can be used (or retrieved) as fol-lows:
MIOSgross = MIOSnet + CFC (11)
CFC = CFCPUE + CFCCORP (12)
OSgross
PUE= OS
net
PUE+ CFCPUE (13)
OSgross
CORP= OS
net
CORP+ CFCCORP (14)
CFCPUE is the fraction of overall CFC attributable to private unincorporated enterprises—andalso can be retrieved as follows:
CFCPUE
CFC=
(1� ↵) ·OSgross
PUE
MIOSgross � (↵ ·OSgross
PUE)
(15)
As discussed above, we are tentatively assuming that consumption of fixed capital in (self-employed)unincorporated enterprises is similar to consumption of fixed capital in the corporate sector. Wetherefore assign unincorporated enterprises’ share in total capital depreciation according to unin-corporated enterprises’ share in overall capital income. Capital income within operating surplusof unincorporated enterprises is represented as (1 � ↵) · OSPUE while overall capital income isrepresented as MIOS � (↵ ·OSPUE).
Gross capital income could equally be denoted as OSCORP + (1� ↵) ·OSPUE by way of equation(7).
With these accounting identities we can therefore move from approximately 4,000 (raw, on-line) to approximately 5,500 (implicitly filled, and including archival data) complete country-yearobservations in which no more than one value of our important accounting identities is missing.
In addition to our use of national accounting identities to retrieve (implicitly non-)missingvalues, we also use accounting identities to replace some obviously erroneous values. Both beforeand after implicitly filling in the observations that had only one missing value (via accountingidentities, above), we winsorize the distribution of each variable at p < 0.01 in each tail, andreplace with the value retrieved via accounting identity. True values return the same as before;extreme and implausible values return with a corrected value to fit within the identity. For anyremaining identities in which the sum of the parts is not 100 percent of the whole (now alwayswithin five percent), for precision we re-scale the parts to 100 percent of the whole,7 proceedingin a hierarchical manner (e.g., re-scaling (6) before (7) and (8)).
However, even after filling in the gaps in national accounts with implicitly available informa-tion, we still often lack some information on mixed income. This brings us to our third step.
That is, in the final step, for missing values that are still missing after our work with ac-counting identities above, we follow the imputation procedure from Blanchet and Chancel (2016).
7Since we are working in percentages of GDP and not in levels, by construction it becomes immaterial whetherwe re-scale GDP to match its components, or re-scale the components to match GDP; and so forth at every subse-quent level of national accounting components’ decomposition.
11

They put forward a straightforward, simple and transparent method for imputing consumption offixed capital (depreciation) in the World Inequality Database (WID) series on GDP (without de-composing GDP into factor shares). In the same way as they observed three stylized facts aboutCFC to impute its missing values, so we also used a similar set of stylized facts about mixed in-come OSPUE in order to statistically model its missing values. Our stylized facts for OSPUE areas follows:
1. Mixed income (OSPUE) tends to represent a lower share of GDP (and of MIOS) in moredeveloped countries (with a higher GDP per capita at purchasing power parity). This is anartifact of the outsized role of the informal economy and household enterprise in developingcountries, where formalization and modernization and industrialization and/or corporatiza-tion are highly correlated with each other and with income.
2. Some countries have structurally high (or low) levels of mixed income (as a share of GDP ,or as a share of MIOS)—whether due to long-term economic trends (e.g., the informaleconomy, as above, or the role of certain industries that that are themselves characterizedby informality or household enterprise) or even due to a certain long-term tendency or prac-tice in the national statistical o�ce (e.g., in some countries many household enterprises areclosely followed by tax authorities and therefore mapped by statisticians into the corporatesector; or vice-versa for countries where some quasi-corporations are poorly accounted for).
3. Mixed income as a share of GDP (and of MIOS) is persistent, such that the value in yeart will be closely correlated to the value in year t+ 1. Exogenous shocks that a↵ect OSPUE
without similarly a↵ecting GDP per capita are rare, so its decrease is a slow process asGDP per capita increases.
Therefore, we can model OSPUE as a function of both log GDP per capita (at PPP) and MIOS
(as a percentage of GDP), with a random e↵ect to capture constant country characteristics:
OSPUEit= �0 + �1GDPpcit + �2MIOSit + ui + "it (16)
where there is a random e↵ect term u for each country i, and " is the error term foreach country-year it.
To account for persistence in OSPUE we model the error term "it in (16) as an AR(1) process:
"it = ⇢"i,t�1 + ⌘it (17)
where ⌘it is i.i.d. white noise.
As in Blanchet-Chancel (2016), when we know part of the OSPUE series for a given country (ob-serving it in later years), we can estimate the country’s random e↵ect ui and use that in theimputation. When no later value of OSPUE is observed, we assume ui = 0. OSPUE returns to itsexpected long-run value at a rate of ⇢t.
12

We run the same imputation procedure for OSCORP as in equations (16) and (17) for OSPUE ,and then scale imputed OSPUE and imputed OSCORP to match 100 percent of MIOS via na-tional accounting identity (7). In this way, we can impute a value for mixed income in the country-years where it is missing.
We generate an estimate of factor shares, as in (4), for every country-year in which we havethe complete GDP components CE, MIOS and NIT , as in (6). In fact, we insert a first-stageestimate for the missing observations of CE, MIOS and NIT , using a similar procedure as inequations (16) and (17):
Zit = �0 + �1GDPpcit + ui + "it (18)
where the vector of first-stage Zit variables represent those cost components of GDP .
After re-scaling the imputed cost components to match 100 percent of GDP per (4), the imputedvalue of MIOS can be inserted into (16) to expand our factor share coverage. It is worth notingthat there is a slight loss of precision in this two-stage imputation procedure. However, we testthe procedure on observed values and note that the AR(1) persistence model e↵ectively predictsmissing values to a first-order approximation for both Zit and OSPUE . In all cases, we keep the80 percent prediction interval to show an estimation range of plausible upper and lower boundsfor these imputed values.
In sum, we achieve a factor share estimate for all countries in which we ever have any dataon the cost components of GDP , and for all country-years in which we have an estimate of GDP
from WID.
The benchmark factor shares series, then, is completed according to the definition in equa-tion (4) discussed in Section 2 above. From here we can analyze the series for a long-run decom-position of global income growth and its distribution.
For now, we leave that task for further research.
13

References
Alvaredo F, et al. 2020. National Accounts (DINA) guidelines: Concepts and methods used inWID.world. World Inequality Lab Working Paper. (Forthcoming.)
Alvaredo F, et al. 2018. World Inequality Report. Harvard University Press.
Bengtsson E and D Waldenstrom. 2018. Capital shares and income inequality: Evidence fromthe long run. Journal of Economic History 78(3): 712-743.
Blanchet T and L Chancel. 2016. National Accounts Series Methodology. World Inequality LabWorking Paper.
Cette G, L Koehl and T Philippon. 2019. Labor shares in some advanced economies. NBERWorking Paper No. 26136.
Feenstra RC, R Inklaar and MP Timmer. The next generation of the Penn World Table. Ameri-can Economic Review 105(10): 3150-82.
Guerriero M. 2019. The labor share of income around the world: Evidence from a panel dataset.Asian Development Bank Institute (ADBI) Working Paper No. 920.
Guerriero M and K Sen. 2012. What determines the share of labour in national income? A cross-country analysis. IZA Discussion Paper No. 6643.
Hamilton JD. 2018. Why you should never use the Hodrick-Prescott filter. Review of Economicsand Statistics 100(5): 831-843.
International Labour Organization (ILO). 2019. The Global Labour Income Share and Distribu-tion. Methodological Description.
International Monetary Fund (IMF). 2019. Government Finance Statistics.
Karabarbounis L and B Neiman. 2014. The global decline of the labor share. Quarterly Journalof Economics 129(1): 61-103.
Organization for Economic Cooperation and Development (OECD). 2019. Government RevenueStatistics.
Piketty T, E Saez and G Zucman. 2018. Distributional national accounts: methods and estimatesfor the United States. Quarterly Journal of Economics 133(2): 553-609.
Piketty T and G Zucman. 2014. Capital is back: Wealth-income ratios in rich countries 1700a2010.Quarterly Journal of Economics 129(3): 1255-1310.
Prichard W, A Cobham and A Goodall. The ICTD Government Revenue Dataset.
14

United Nations Statistics Division. 2019. National Accounts Statistics: Analysis of Main Aggre-gates and Detailed Tables
Solow R. A contribution to the theory of economic growth. Quarterly Journal of Economics70(1): 65-94.
Zucman G. 2014. Taxing across borders: Tracking personal wealth and corporate profits. Journalof Economic Perspectives 28(4): 121-48.
15
Tables
List of Tables
1 Countries covered (N), by World Bank (2019) income classification . . . . . . . . . . 17
2 Methodological comparison across related literature . . . . . . . . . . . . . . . . . . . 18
16

Tab
le1:
Cou
ntries
covered(N
),by
World
Ban
k(2019)
incomeclassification
WID(2020)
Gollin(2002)
KN(2014)
PW
T(2015)
Guerriero(2019)
HighIncome(81)
68
1735
5758
Upper-M
iddle
Income(56)
55
515
3634
Low
er-M
iddle
Income(47)
46
77
2816
Low
Income(34)
33
11
155
Total(218)
202
30
58
136
113
17

Tab
le2:
Method
ological
comparison
across
relatedliterature
Authors
Nyears
Benchmarkapproach
toOSPUE
WID
(2020)
202
1950-
See
equation(4)ab
ove:
Whilethelabor
sharein
thecorporatesector
issim-
ply
CE
CE+OSC
OR
P
,thelabor
shareof
unincorporated
enterprises(m
ixed
in-
come,
OSPUE)isassumed
tobe↵=
0.7.
OSPUEisim
putedwheremissing
based
onwithin-cou
ntrypersistence
andtimetrendsof
observed
values.We
use
net
national
incomein
lieu
ofGDP:Net
indirecttaxes
anddepreciation
areexcluded,whilenet
foreignincome(anditslabor
share)
areincluded.
Gollin
(2002)
301970-
Adjusted
series
assumes
labor
shareof
mixed
incomeis
sameas
inthecorpo-
rate
sector.In
other
words,
↵=
CE
CE+OSC
OR
P
.Preferred
specification
wou
ldmultiply
CE
bytotalnu
mber
ofworkers,butdatadeemed
lacking.
KN
(2014)
581975-
Benchmarkseries
only
tracks
corporatesector
labor
share:
CE
CE+OSC
OR
P
.
PW
T
(2015)
136
1950-
Definitiondi↵ersacross
countriesan
dover
time.
For
somecountries,ad
ds
agriculturalvaluead
ded
toCE
(dou
ble-cou
ntingagriculturalem
ployee
in-
come).Often
extrap
olates
aconstan
tsharefor>25
years.
Guerriero
(2019)
113
1960-
Preferred
specification
follow
sGollin’s(2002,
above),butsubtracts
self-
employed(non
-corporatesector)em
ployersfrom
thetotalnu
mber
ofworkers.
BW
(2015)
211900-
Gollin’s
(200
2)preferred
“lab
ormethod
”(Y
L=
CE
em
ployees·w
orkerstotal)where
available,otherwiseou
r“p
roportion
almethod
”(Y
L=
CE
+↵·O
SPUE).
ILO
(2019)
952004-
UsesILO
Harmon
ized
Microdatato
estimatetotallabor
income,
including
mixed
income—
whichispredictedas
aself-employmentpseudo-‘wage’
by
imputingon
matched
observab
lecharacteristicsof
employees.Separatepre-
diction
safterdisaggregatingself-employmentinto:ow
n-accou
ntworkers;
contributingfamilyworkers;an
dem
ployers.
CKP
(2019)
101949-
Imputestheaverageform
al-sector(i.e.,em
ployee)wages
(CE)to
all
workers—
ala
Gollin(2002,
above)
bestpractice—
butindexed
byindustry.
Calculatedvariou
slyfortotalecon
omy,
corporatesector
only,an
dcorporate
sector
withou
treal
estate
sector.
18
Copyright © 2022 FDOKUMEN