FACT FINDING OF THE EXPONENTIAL GROWTH OF THE ACCOUNTING SERVICES FIRMS- A TREND ANALYSIS
14
32 SCHOLEDGE PUBLISHING WORLDWIDE- SCHOLARLY INTERNATIONAL JOURNAL WWW.SCHOLEDGE.ORG SCHOLEDGE INTERNATIONAL JOURNAL OF BUSINESS POLICY & GOVERNANCE VOL. 2, ISSUE 1 (JANUARY 2015) ISSN-2394-3351 ------------------------------------------------------------------------------------------------------ FACT FINDING OF THE EXPONENTIAL GROWTH OF THE ACCOUNTING SERVICES FIRMS- A TREND ANALYSIS 1 Dr. Yvone Wong Li , 2 Aurora Ho & 3 Prof. Polly Yau 1 Visiting Professor & Director at Private Educational Institute 2 Research Scholar of Accounting 3 Research Fellow & University Professor TIANJIN, CHINA. ABSTRACT Along with other services sector participant, accounting and financial records related services have witnessed a sharp growth over the time in the recent time. Through this work, it has been analysed as to what the factors are influencing the exponential growth of the industry. What are the levels of the services quality? Also it is found the attitude related aspects of the industry. Keywords : Accounting, Services Firms, Trend Analysis, Exponential Growth 1. INTRODUCTION According to the Survey on the Business of Accounting Firms published by the Financial Supervisory Commission (FSC) in March 2009, the number of accounting firms increased from 736 in 2004 to 854 in 2007. The number of accounting firm branches also grew from 916 to 1,024 during the same period. The number 1,024 represents the total number of major practice premises and branches. The number of accounting firms increased by 47 (5.8%) from the end of 2006, and the number of practice premises and branches increased by 53 (5.5%) in 2007. The survey also indicates that at the end of 2007, some 607 sole ownership firms (71.1%) were established by accountants, and 247 partnership firms (28.9%) were established by two or more accountants. These numbers increased by 34 (5.9%) and 13 (5.6%), respectively, from the levels at the end of 2006. It is hardly surprising that the competition is intensifying given the increasing number of accounting firms. It is imperative for accounting firms to seek optimal business modes. Services provided by accounting firms consist of auditing, taxation, management consulting and accounting services. The growing interaction between companies and accounting firms over recent years signifies an increasing reliance of companies on accounting firms. Therefore, accounting firms are paying more and more attention to their service quality. This quality has a direct impact on the reputations of accounting firms and the trust of their clients. Taiwanese companies are moving towards internationalization, particularly with regard to outward investments in mainland China. To meet the needs of clients, some accounting firms have set up practices in mainland China, providing services in auditing, inspecting and consulting (Survey on the Business of Accounting Firms 2009). Some firms also send staff to branches in mainland China to assist in operations and provide business support. To respond to such changes in operations and client demand, accounting firms have had to adjust their business modes. Accounting firms are increasingly important to companies as they provide expertise in business diagnosis. In addition, corporate clients are asking accounting firms to provide diverse services outside the traditional scope of auditing. According to a Survey on the Business of Accounting Firms (2009), 34 accounting firms established practices in mainland China, 4% of the total of 854 firms. Among these 34 firms, 26 were partnership firms and only 8 were sole ownership firms. In terms of the number of employees, 9 firms had fewer than 20 employees, and 25 firms had more than 20 employees. In terms of revenue, 5 firms reported annual revenues of NTD1~10 million, 12 firms in the range of NTD10~50 million, 5 firms in the range of NTD50~100 million and 11 firms above NTD100 million. These numbers show that most companies with operations in mainland China are partnership firms rather than sole ownership firms. The larger the firms, the more
-
Upload
independent -
Category
Documents
-
view
1 -
download
0
Transcript of FACT FINDING OF THE EXPONENTIAL GROWTH OF THE ACCOUNTING SERVICES FIRMS- A TREND ANALYSIS

32 SCHOLEDGE PUBLISHING WORLDWIDE- SCHOLARLY INTERNATIONAL JOURNAL WWW.SCHOLEDGE.ORG
SCHOLEDGE INTERNATIONAL JOURNAL OF BUSINESS POLICY & GOVERNANCE
VOL. 2, ISSUE 1 (JANUARY 2015) ISSN-2394-3351
------------------------------------------------------------------------------------------------------
FACT FINDING OF THE EXPONENTIAL GROWTH OF THE ACCOUNTING
SERVICES FIRMS- A TREND ANALYSIS
1Dr. Yvone Wong Li , 2Aurora Ho & 3Prof. Polly Yau
1 Visiting Professor & Director at Private Educational Institute
2 Research Scholar of Accounting
3 Research Fellow & University Professor
TIANJIN, CHINA.
ABSTRACT
Along with other services sector participant, accounting and financial records related services have witnessed a sharp growth over the time in the recent time. Through this work, it has been analysed as to what the factors are influencing the exponential growth of the industry. What are the levels of the services quality? Also it is found the attitude related aspects of the industry. Keywords : Accounting, Services Firms, Trend Analysis, Exponential Growth
1. INTRODUCTION According to the Survey on the Business of Accounting Firms published by the Financial Supervisory Commission (FSC) in March 2009, the number of accounting firms increased from 736 in 2004 to 854 in 2007. The number of accounting firm branches also grew from 916 to 1,024 during the same period. The number 1,024 represents the total number of major practice premises and branches. The number of accounting firms increased by 47 (5.8%) from the end of 2006, and the number of practice premises and branches increased by 53 (5.5%) in 2007. The survey also indicates that at the end of 2007, some 607 sole ownership firms (71.1%) were established by accountants, and 247 partnership firms (28.9%) were established by two or more accountants. These numbers increased by 34 (5.9%) and 13 (5.6%), respectively, from the levels at the end of 2006. It is hardly surprising that the competition is intensifying given the increasing number of accounting firms. It is imperative for accounting firms to seek optimal business modes.
Services provided by accounting firms consist of auditing, taxation, management
consulting and accounting services. The growing interaction between companies and accounting firms over recent years signifies an increasing reliance of companies on accounting firms. Therefore, accounting firms are paying more and more attention to their service quality. This quality has a direct impact on the reputations of accounting firms and the trust of their clients.
Taiwanese companies are moving towards internationalization, particularly with regard to outward investments in mainland China. To meet the needs of clients, some accounting firms have set up practices in mainland China, providing services in auditing, inspecting and consulting (Survey on the Business of Accounting Firms 2009). Some firms also send staff to branches in mainland China to assist in operations and provide business support. To respond to such changes in operations and client demand, accounting firms have had to adjust their business modes. Accounting firms are increasingly important to companies as they provide expertise in business diagnosis. In addition, corporate clients are asking accounting firms to provide diverse services outside the traditional scope of auditing.
According to a Survey on the Business of Accounting Firms (2009), 34 accounting firms established practices in mainland China, 4% of the total of 854 firms. Among these 34 firms, 26 were partnership firms and only 8 were sole ownership firms. In terms of the number of employees, 9 firms had fewer than 20 employees, and 25 firms had more than 20 employees. In terms of revenue, 5 firms reported annual revenues of NTD1~10 million, 12 firms in the range of NTD10~50 million, 5 firms in the range of NTD50~100 million and 11 firms above NTD100 million. These numbers show that most companies with operations in mainland China are partnership firms rather than sole ownership firms. The larger the firms, the more

33 SCHOLEDGE PUBLISHING WORLDWIDE- SCHOLARLY INTERNATIONAL JOURNAL WWW.SCHOLEDGE.ORG
likely they are to have established practices in mainland China.
With a view to the abovementioned major changes in business environments and policies, this paper intends to examine the operating efficiency of accounting firms in three stages. The focus is on partnership firms with two or more practicing accountants. The data envelopment analysis (DEA) method is applied during the first stage in order to assess the operating efficiency of the partnership accounting firms, identify the reasons for inefficiency and gauge the room for improvement (i.e. percentage and magnitude) in input and output. An analysis is performed to evaluate the effects of input and output items on operating efficiency. It is hoped that the list of critical input and output items can serve as a reference for accounting firms to improve their operating efficiency. Firms with good operating efficiency can provide a benchmark or target for firms with poor efficiency.
Accounting firms are a sector of the service industry known for their intense use of human capital. The calibre of human resources determines the service quality. Hence, human capital is a key input element for accounting firms. It is necessary for accounting firms to come up with appropriate manpower allocations. Meanwhile, increased demand contributes to the growing number of branches. A large number of practice premises can serve more clients and expand clientele; however, a corresponding investment in branches is also required. The branches may also have different operating types. The analyses in the second stage focus on the human capital structures of firms with good operating efficiency and firms with poor operating efficiency. Relevant factors include the percentage of accountants possessing Certified Public Accountant (CPA) qualifications and senior managers, and the characteristics of the branch operating types. Are there any variances in human capital allocations and branch operating types? Are there any significant differences in the operating efficiency of branches operating different operating types? What are the major operating challenges for firms with both good and poor operating efficiency? What are the future strategic focuses? All of these issues are addressed in the second stage empirical analysis.
During the third stage, this paper develops regression models to assess the effects of practices in mainland China on operating efficiency. There are four dimensions for analysis: the percentage of revenues from mainland China, the reasons for setting up practice in mainland China, the percentages of each project from mainland China and the operating modes in mainland China. In order to assist accounting firms in their strategies in
mainland China, it is critical to identify the key factors making positive contributions to operating efficiency.
The remainder of this paper is organized as follows. Section 2 reviews the related DEA literature. Section 3 introduces the DEA models, data sources and choice of decision-making units (DMUs), the definitions of output and input items, and also constructs empirical regression models. Section 4 conducts the related empirical analysis and discusses the results. Conclusions and management implications are presented in Section 5. 2. Literature review The DEA method is widely used in many domains in the evaluation of operating performance. These domains include: banks (e.g. Bonin, Hasan, & Wachtel, 2005; Camanho & Dyson, 1999; Cook, Seiford, & Zhu, 2004; Garden & Ralston, 1999; Grace & Timme, 1992; Grifell-Tatjé & Lovell, 1996; Lin, Lee, & Chiu, 2009; Miller & Noulas, 1996; Noulas, 1997; Paradi, Rouatt, & Zhu, 2011; Portela, Thanassoulis, & Simpson, 2004; Staub, Souza, & Tabak, 2010; Yang, 2009; Yeh, 1996), public services (e.g. Cooper & Ray, 2008; Smith & Street, 2005), human development (e.g. Despotis, 2005), human resource practices (e.g. Tseng & Lee, 2009), the gas distribution industry (e.g. Erbetta & Rappuoli, 2008), insurance companies (e.g. Noulas, Hatzigayios, Lazaridis, & Lyroudi, 2001; Wu, Yang, Vela, & Liang, 2007), the high-tech industry (e.g. Kozmetsky & Yue 1998), the medical industry (e.g. Banker, Conrad, & Strauss, 1986; Pulina, Detotto, & Paba, 2010; Shimshak, Lenard, & Klimberg, 2009; Valdmanis, 1990), hotels (e.g. Anderson & Fok, 2000; Morey & Dittman, 2003; Sigala, Jones, Lockwood, & Airey, 2005), schools (e.g. Anderson, Walberg, & Weinstein, 1998; Kirjavainen & Loikkanent, 1998), realtors (e.g. Anderson et al. 1998; Lewis, Anderson, & Zumpano, 1999), the accounting industry (e.g. Banker, Chang, & Natarajan, 2005; Banker, Chang, & Natarajan, 2007; Chen & Lin, 2007; Cheng, Wang, & Weng, 2000; Dopuch, Gupta, Simunic, & Stein, 2003; Lee, 2009), internal auditing (e.g. Sueyoshi, Shang, & Chiang, 2009), and so on.
Cheng et al. (2000) applied DEA to the performance evaluations of accounting firms by sampling firms in Taiwan in 1994. They examined the technical efficiencies of these accounting firms and found that there was 27.8% room for improvement in terms of input reduction. This suggests relatively poor technical efficiency for most accounting firms in Taiwan. Dopuch et al. (2003) introduced quantitative techniques, such as DEA and the stochastic parametric frontier method (SFA) into research on the auditing market, in order to investigate production efficiency and audit

34 SCHOLEDGE PUBLISHING WORLDWIDE- SCHOLARLY INTERNATIONAL JOURNAL WWW.SCHOLEDGE.ORG
service pricing of accounting firms. Banker et al. (2005) sampled 64 out of the top 100 accounting firms in the US in 1995-1999 and analyzed the revenues and human resources data by applying the Malmquist productivity index. Their purpose was to examine changes in productivity, technical advances and corresponding changes in efficiency, using the DEA method.
Banker et al. (2007) used revenue and personnel data for the top U.S. public accounting firms during 1995-1998. The results indicated the existence of statistically significant allocative inefficiency in the public accounting industry. Chen and Lin (2007) indicated that Taiwan’s audit firms experienced a productivity growth of 27% and a technical progress of 31% but a 5% decline of relative efficiency during the sample period. They also reported a positive relationship between technical efficiency of the firms and human capital embodied in partnerships. Lee (2009) used DEA to evaluate the operational efficiency of 173 Taiwanese medium-sized audit firms in 2005. The results indicated that there were 24 audit firms with an overall technical efficiency value of 1. The average scale efficiency of all samples was higher than the average in terms of pure technical efficiency. Most medium-sized audit firms are in the stage of decreasing returns to scale. In addition, Lee (2009) found that the larger the scale, the higher the operational efficiency.
For internal auditing, Sueyoshi et al. (2009) used case studies to develop a multi-criteria decision-making aid that could identify the most critical business units within a corporation. They explored the potential of DEA and analytic hierarchy process (AHP) for determining business units that need auditing. The proposed combined model incorporates a much wider range of quantitative and qualitative criteria, and provides a more detailed and thorough study. Sueyoshi et al. (2009) also pointed out that the proposed evaluation framework is comprehensive and flexible and shows great potential for internal audit prioritization and resource allocation. 3. Methodology and data resource This paper performs a three-stage empirical analysis. During the first stage, a DEA model is used to derive the efficiency values of individual accounting firms, in order to determine operating efficiency. An analysis of inputs and outputs aims to highlight the room for improvement and their respective contributions to operating efficiency. During the second stage, this paper analyzes the relationships among human capital, branch operating types, operating difficulties and future strategies for improving operating efficiency. During the third stage, an analysis is conducted to examine the effect of practices on operating efficiency in
mainland China. Four empirical models are established for regression analyses. Below are the details of the DEA model and the regression models. 3.1 Charnes-Cooper-Rhodes’ (CCR) model of DEA Seiford and Zhu (2003), Cook and Zhu (2006) and Cook, Liang, and Zhu (2010) indicated that the DEA is a mathematical approach for measuring the relative efficiency of peer decision-making units (DMUs). The measurement of efficiency starts with the efficiency measurement model developed by Farrell (1957). The model assumes that given only two inputs and one output, constant returns to scale (CRS) relationships exist between outputs and inputs. The CRS concept means that output directly reflects input (i.e. double inputs produce exactly double outputs). Farrell (1957) was the first scholar to suggest the use of production frontiers in the evaluation of efficiency levels. Charnes, Cooper, and Rhodes (1978) applied the concept proposed by Farrell (1957) and expanded the efficiency measurement model with multiple inputs and multiple outputs on the same CRS assumption. They utilized linear combinations to convert it to a single virtual input and output, and estimated the efficiency frontier from the ratio of two linear combinations (Lee, 2009; Lin et al. 2009); it is called Data Envelopment Analysis, and is generally grouped into the CCR model. The efficiency value of the CCR model is the overall technical efficiency of the evaluated unit. If the efficiency value equals 1, the evaluated unit is efficient; if the efficiency value is less than 1, the evaluated unit is inefficient.
Seiford and Zhu (2003) presented that context-dependent DEA refers to a DEA approach where a set of DMUs is evaluated against a particular evaluation context. Each evaluation context represents an efficient frontier composed of DMUs at a specific performance level. Cook et al. (2004) presented that mathematical programming models are used in benchmarking where multiple performance measures are needed to examine performance and productivity changes.
3.2 Data sources and choice of decision-making units (DMUs) This paper sources data from the Survey on the Business of Accounting Firms (FSC, 2007). This database establishes the increasing importance of service industries in Taiwan’s economy. As part of government efforts to promote the development of service industries and the modernization of commerce, the Ministry of Finance started this annual survey of accounting firms under the auspices of the Executive Yuan in 1990. The purpose of this survey is to gather information regarding businesses and operating

35 SCHOLEDGE PUBLISHING WORLDWIDE- SCHOLARLY INTERNATIONAL JOURNAL WWW.SCHOLEDGE.ORG
targets of accounting firms, provide a reference for the government in the formation of policies and assist accounting firms in their business development. The governance of accounting firms was transferred to the FSC in July 2003, and the FSC took over responsibility for the survey (FSC, March 2009).
This paper selects 220 accounting firm partnerships with two or more practicing accountants from the 2007 survey as DMUs. Given the criteria required by the DEA method for input/output items and the restrictions of Frontier Analyst in execution, this paper selects only input and output items with positive values. No zero value or negative values have been allowed. 3.3 Definitions of output and input items Lee (2009) used four output items: attestation revenues, tax business revenues, management consultancy revenues, and corporate registration and other business services. Lee’s four input items include number of branches, number of total employees, number of partners and total expenditures of the auditing firm. This paper uses the total practice revenues (based on Lee’s (2009) output points) to represent the overall operating results of accounting firms; the database also provides information regarding the number of cases from business practices. The service charges depend on the nature of services and the relationship with clients. Sometimes, the total practice revenues from a large number of cases are not necessarily higher than the total practice revenues from a small number of cases. Therefore, this paper involves indices, total practice revenues and number of cases to present a complete picture of the overall operating results. In accordance with Lee’s (2009) input points, this paper also includes number of employees as one of the input items. Finally, this paper incorporates the area of space in use to represent the size of premises. Table 1 provides detailed definitions of two output items and two input items. <<Table 1 about here>>
According to the DEA method, the selection of inputs and outputs takes into account the effects of these items on efficiency and isotonicity (i.e. no output declines in the event of an increase in inputs). All inputs and outputs should be highly and positively correlated. The Pearson coefficients in Table 2 suggest that there is a significantly positive correlation between inputs and outputs. All of the coefficients are above 0.4. It is inferred that the inputs and outputs selected by this paper meet the requirement for isotonicity in the DEA method. The VIF tests on the relationship between input and input items, as well as on the relationship between output and output items, indicate that all of the VIF values are smaller
than 10. Hence, no serious collinearity exists among the items, and it is possible to proceed with further DEA steps. <<Table 2 about here>> 3.4 Empirical regression models During the third stage of the empirical analysis, this paper examines four dimensions: the percentage of revenues from mainland China, the reasons for setting up practice in mainland China, the percentages of each project from mainland China and operating modes in mainland China. The purpose is to validate whether practices in mainland China improve operating efficiency, and whether the strategies in mainland China are beneficial. The CCR efficiency values derived in the first stage DEA method are the dependent variables in the empirical model during the third stage. The factors associated with the practices in mainland China are the independent variables. The range of efficiency values calculated by Frontier Analyst 4.1.0 software is 0-100 points. This paper runs the ordinary least squares approach (OLS) regression models and develops four relational models (1)-(4) concerning the relationships between the practices in mainland China and the operating efficiency of accounting firms. These four models are established using the factors of the abovementioned four dimensions. The four models are listed as follows: Model 1: percentage of revenues from mainland China OE=a0+a1TR+e1 (1) Model 2: reasons for setting up practice in mainland China OE=b0+b1S1+b2S2+b3S3+b4S4+e2 (2) Model 3: percentages of each project from mainland China OE=c0+c1R1+c2R2+c3R3+c4R4+c5R5+c6R6+c7R7+c
8R8+e3 (3) Model 4: operating modes in mainland China OE=d0+d1M1+d2M2+e4
(4) OE: Operating efficiency derived from the CCR model with the DEA method TR: The percentage of revenues from mainland China S1: Whether practices in mainland China are established to address the needs of clients S2: Whether practices in mainland China are established to extend business markets S3: Whether practices in mainland China are established to compete with peers S4: Whether practices in mainland China are established for other reasons

36 SCHOLEDGE PUBLISHING WORLDWIDE- SCHOLARLY INTERNATIONAL JOURNAL WWW.SCHOLEDGE.ORG
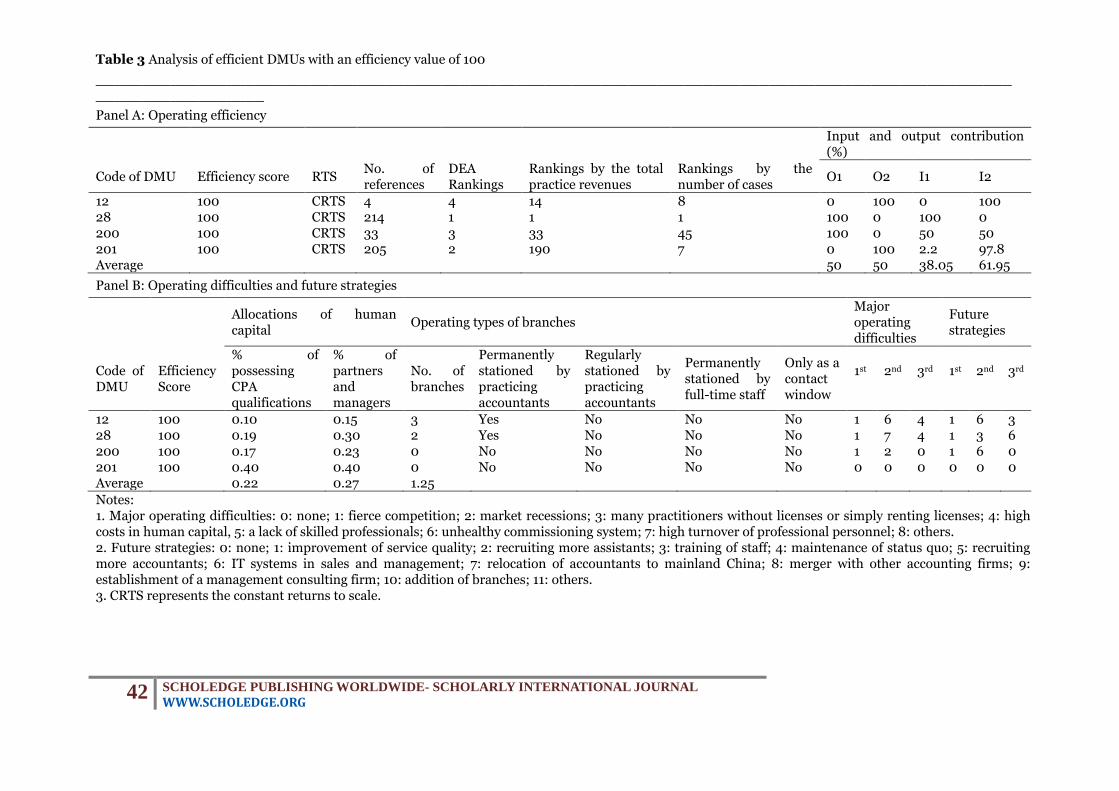
R1: The percentage of projects in mainland China – auditing of the accounts for Taiwanese transfers to investment companies R2: The percentage of projects in mainland China – auditing of financial reports for appointed companies R3: The percentage of projects in mainland China – evaluation of investment projects and consultation R4: The percentage of projects in mainland China – implementation of statutory audit practices. R5: The percentage of projects in mainland China – assistance in training the personnel of local accounting firms R6: The percentage of projects in mainland China – inspection of financial reports of local companies R7: The percentage of projects in mainland China – assistance to local accountants’ practices R8: The percentage of projects in mainland China – others M1: Operating modes in mainland China – personnel sent from Taiwan M2: Operating modes in mainland China – cooperation with local firms in mainland China and the training of local professionals a0, b0, c0 and d0: are the intercepts a1, b1, …, b4, c1, …, c8, d1 and d2: are the parameters of the regression models e1, e2, e3 and e4: are the error terms 4. Empirical results and discussions 4.1 Results for accounting firms with better operating efficiency 4.1.1 Analysis of operating efficiency This paper refers to efficiency values calculated with Frontier Analyst 4.1.0 software and rates these values in the range of 0-100 points. The efficiency scores are the measure for operating efficiency. Panel A in Table 3 indicates that four DMUs report an efficiency score of 100 in the CCR model, implying that these firms have optimized their allocations of input and output items. DMU28 is referenced 214 times, the highest count among all four efficient firms. The number of references indicates the number of times the efficient firm is referred to as a benchmark by inefficient firms. DMU201, the second highest in ranking, is referenced 205 times. The third highest in ranking, DMU200, is referenced 33 times. DMU12, the fourth in ranking, is referenced 4 times. DMU28, DMU201 and DMU200 are the learning benchmarks for all of the accounting firms.
DMU28 ranks top in the league for both total practice revenues and number of cases. This is consistent with the rankings based on DEA results. However, the rankings of the other three accounting firms differ from those on the list ranking the DEA results. The DEA method takes into account the relationship between
inputs and outputs. The total practice revenues and the number of cases are also representative of firm size. Generally, a larger firm has higher total practice revenues and a larger number of cases. Based on these two metrics, the other three accounting firms are small-and-medium size in scale. This also means that not all large firms are efficient; it all depends on whether the allocations of input and output items are optimal and whether the invested resources can generate maximum benefits.
In terms of input and output contributions, the efficiency value of the highest-ranking DMU28 is mainly subject to the contribution of total practice revenues (O1; 100%) and the number of employees (I1; 100%). Both contributions are 100%. In other words, the operating efficiency of DMU28 is a result of the efforts to expand revenues and the high caliber of employees. However, in the case of the second-highest ranking DMU201, the highest contributing factor is the number of cases (O2; 100%). There is no contribution from total practice revenues (O1; 0%). As far as input items are concerned, the contribution of the number of employees (I1; 2.2%) is significantly lower than that for the area of space in use (I2; 97.8%). This accounting firm focuses on the effective utilization of its space. On average, the four accounting firms with an efficiency value of 100 see an average of 50% contribution from total practice revenues (O1; 50%) and 50% contribution from the number of cases (O2; 50%). The average contribution to operating efficiency from the number of employees (I1; 38.05%) is lower than that from the area of space in use (I2; 61.95%). This means that firm sizes and spatial arrangements are key input factors. 4.1.2 Analysis of human capital, operating types of branches, major operating difficulties and future strategies Panel B in Table 3 shows the allocation of human capital. DMU28 is the highest in ranking and largest in scale, with a total of 2,674 employees, 19% of them being CPA qualified accountants. Partners and managers account for 30% of the total, a very high percentage. The DMU201, the second highest in ranking, is much smaller in scale; it has only 5 employees. On average, 22% of the employees of the four accounting firms with an efficiency value of 100 are CPA qualified accountants, and 27% are partners and managers.
Both DMU12 and DMU28 have branches with practicing accountants on a permanent basis; DMU200 and DMU201 have no branches. Practicing accountants of DMU28 often visit branches to look after business, and their operating efficiency is superior. In terms of major operating difficulties, three out of the four firms quote fierce competition as the major

37 SCHOLEDGE PUBLISHING WORLDWIDE- SCHOLARLY INTERNATIONAL JOURNAL WWW.SCHOLEDGE.ORG
challenge, followed by market recessions, an unhealthy commissioning system, high turnover of professional personnel and high costs in human capital. It is critical to maintain competitive advantages in highly competitive markets. The focus of future strategic endeavors is on the improvement of service quality. This is followed by the training of staff and IT systems in sales and management. Given the high homogeneity of the service items, accounting firms are advised to prioritize service quality for both auditing and non-auditing services. They should step up efforts in the development of management consulting services in order to gain the trust and loyalty of customers and maintain long-term and collaborative relationships. <<Table 3 about here>> 4.2 Results for accounting firms with poor operating efficiency 4.2.1 Analysis of operating efficiency As shown in Panel A in Table 4, 216 accounting firms report efficiency values smaller than 100 under the CCR model. Only 1 DMU reports an efficiency value in the 90-100 range. Three DMUs report efficiency values of 80-90 and 189 DMUs report efficiency values below 60. In other words, the operating efficiency of most accounting firms is poor. The average efficiency value of the sampled 216 firms is 40.06. In terms of improvement percentages and space, total practice revenues (O1) should increase by 223.05% (or NTD 43,927,885.32) and the number of cases (O2) should increase by 549.85% (or 902.76 cases). There is no need for any improvement in the number of employees (I1). The area of space in use (I2) should be reduced by 58.35% (or 96.08 square feet). Overall, the priority in the improvement of outputs is to increase the number of cases (O2) and reduce the area of space in use (I2). This means that accounting firms may not fully utilize their space or may have excess space.
In terms of input and output contributions, the average contribution from total practice revenues (O1; 94.01%) of the sampled 216 firms is significantly higher than the number of cases (O2; 5.99%). The average contribution of the number of employees (I1; 92.75%) is also significantly larger than for the area of space in use (I2; 7.25%). This indicates that the major performance contributors for inefficient firms are practice revenues and human resources. 4.2.2 Analysis of human capital, operating types of branches, major operating difficulties and future strategies Panel B in Table 4 summarizes the allocations of human capital. On average, 21% of the employees in all of the sampled 216 firms are CPA qualified accountants, very close to the 22% for the four efficient firms. The percentage of
partners and managers is 30% for all the firms, slightly higher than the 27% for the four efficient firms. The results indicate that the percentage of senior managers is slightly higher in inefficient firms. Therefore, the cost of human capital may be too high if senior managers are not effectively empowered. Inefficient firms are advised to scale back the percentage of senior managers.
The average number of branches is less than 1. As many as 66 firms have practicing accountants stationed permanently at branches; 15 firms have practicing accountants stationed regularly; 20 firms have dedicated staff stationed permanently and 7 firms using branches as contact windows only. The firms with efficient values of 90-100 do not have branches. In the case of firms with efficiency values below 60, 73 have practicing accountants permanently or regularly stationed at branches. This could be one of the reasons for their inefficiency. This implies that in addition to headquarters affairs, practicing accountants should also take care of branch businesses. This would allow them to stay on top of operations of all operating units; however, it may also cause them to lose focus on main operations.
To compete with efficient firms, inefficient firms should endeavour to maintain their competitive advantages. They should strive to secure and maintain existing clients and develop new customers to combat recessions. Meanwhile, they should provide appropriate training to enhance the professional knowledge and skills of employees, in order to be able to meet client needs and cope with various situations. Accounting firms are a human capital intensive industry. Only with high-calibre professionals can accounting firms survive recessions and thrive in competitive markets.
Future strategies are the same for both inefficient firms and efficient firms. The top priority is the improvement of service quality, followed by training of staff, recruiting more assistants and utilizing IT systems in sales and management. Given the high homogeneity of the service items, accounting firms are advised to prioritize service quality. They should enhance the intelligence and skills of professionals in order to gain the trust and loyalty of customers for firm business services. This can secure the operations of accounting firms. <<Table 4 about here>> 4.3 Analysis of operating difficulties and the effects of branch operating types on operating efficiency Table 5 summarizes the operating difficulties quoted by the sampled 220 firms. The most quoted operating difficulties are fierce competition (93 firms) and market recessions (66 firms), followed by fierce competition (48 firms), market recessions (57 firms) and high costs in human capital (33 firms). The third

38 SCHOLEDGE PUBLISHING WORLDWIDE- SCHOLARLY INTERNATIONAL JOURNAL WWW.SCHOLEDGE.ORG
most quoted operating difficulties are high costs in human capital (35 firms) and high turnovers of professional personnel (28 firms).
Table 6 shows the variances in operating efficiency for different operating types of branches. The independent sample t-test shows no significant difference in the means of both sampled groups. It does not seem to matter whether practicing accountants are permanently or regularly stationed at branches, or whether dedicated personnel are permanently stationed at branches. It also does not seem to matter whether or not the branches are anything more than contact windows. This means that the operating type of a branch makes no significant difference on the operating efficiency of the accounting firm. <<Table 5 about here>> <<Table 6 about here>> 4.4 Effects of practices in mainland China on operating efficiency The operating difficulties shown in Tables 3 and 4 are fierce competition, market recessions, high costs in human capital and a lack of skilled professionals. The first two are external factor; the third an internal factor, something within the control of accounting firms. Even though external factors are beyond the control of accounting firms, it is still necessary to resolve the problems they present. Many companies in Taiwan have shifted most of their operations to mainland China; as a result, accounting firms also have had to adjust their strategies and meet the demand by setting up practice in mainland China. This paper summarizes the findings on the relationship between operating efficiencies and the four dimensions: the percentage of revenues from mainland China, the reasons for setting up practice in mainland China, the percentages of each project from mainland China and the operating modes in mainland China.
Table 7 shows the percentage of revenues from mainland China in Model 1. There is a significant and positive correlation between TR and OE. In other words, the higher the percentage of revenues from mainland China, the better the operating efficiency of the accounting firms; practice in mainland China makes positive contributions. According to Model 2, in regard to the reasons for setting up practice in mainland China is the significant and positive correlation between S1 and S3 (two variables) and OE. This means that accounting firms have extended their footprint to mainland China in order to address the needs of clients (S1) and to respond to competition from their peers (S3). This is consistent with the major operating difficulties listed in Tables 3 and 4. The offering of services in mainland China to meet the demands of customers in a highly competitive market can indeed boost the operating efficiency
of accounting firms. According to the percentages of each project
from mainland China in Model 3, there is a significant and positive correlation between R1, R5, R7 and R8 (four variables) and OE. The higher the number of projects in the auditing of the accounts for Taiwanese transfers to investment companies (R1), the greater the assistance in training the personnel of local accounting firms (R5), the more assistance to local accountants’ practices (R7) and businesses other than R1~R7 (R8), the better the improvement to operating efficiency. The auditing of the accounts for Taiwanese transfers to investment companies (R1) is a natural progression for accounting firms serving Taiwanese clients operating in mainland China. Assistance in training the personnel of local accounting firms (R5) and assistance to local accountants’ practices (R7) may also boost the operating efficiency of accounting firms.
According to the operating modes in mainland China covered by Model 4, there is a significant and positive correlation between M1 and OE. The dispatch of personnel from Taiwan to mainland China boosts operating efficiency. However, cooperation with local firms in mainland China and the training of local professionals (M2) do not have any significant influence on operating efficiency. This means that Chinese practices still require support from operations in Taiwan. The visits of Taiwanese professionals to mainland China to provide assistance involves, in essence, the mentoring and sharing of professional expertise. This saves the time required to formulate new operating modes and the costs needed to train local professionals in mainland China. It is also a method of quickly applying the operating modes and intellectual capital of firms in Taiwan to practices in mainland China, and shortening the learning curve for adjusting to new environments and familiarizing with relevant laws and regulations. Visiting Taiwanese personnel in mainland China can also avoid barriers to sharing and communication between the employees in Taiwan and the employees in mainland China. To sum up, the dispatching of personnel from Taiwan is beneficial to the operating efficiency of accounting firms.
Finally, this paper incorporates all 15 independent variables in the four models for stepwise regression analysis. Table 7 screens out the three key factors determining the operating efficiency of accounting firms. Response to peer competition (S3) is the main reason for setting up practice in mainland China. The assistance to local accountants’ practices (R7) is the main factor in the percentages of each project from mainland China. The major operating mode in mainland China is sending personnel from Taiwan (M1). All three key factors can enhance the operating efficiency of accounting firms.

39 SCHOLEDGE PUBLISHING WORLDWIDE- SCHOLARLY INTERNATIONAL JOURNAL WWW.SCHOLEDGE.ORG
<<Table 7 about here>> 5. Conclusions and management implications Unlike past studies, this paper combines three research methods: DEA, univariate testing and regression analysis, to perform robust evaluations on the operating efficiency of accounting firm partnerships. During the first stage, this paper identifies reasons for inefficiency by using DEA to analyse accounting firm partnerships. The results can serve as a reference for managers in improving efficiency. During the second stage, this paper analyzes the allocation of human capital, the operating types of branches, their major operating difficulties and future strategies for accounting firm partnerships. During the third stage, this paper constructs regression models for evaluating the effects of practice strategies in mainland China on operating efficiency, in order to identify key factors.
The findings in the first stage indicate that only 4 out of 220 firms reported better operating efficiency. The remaining 216 firms were not efficient. DMU28, the highest ranking firm in terms of operating efficiency, reports an efficiency value of 100; it is referenced 214 times. In terms of total practice revenues and number of cases, DMU28 is the best performer. This is consistent with the rankings derived using the DEA method. The other three firms with an efficiency value of 100 are small-and-medium in size. Large firms are not necessarily efficient. The efficient accounting firms see an average of 50% contribution from total practice revenues and 50% contribution from the number of cases. Firm size and spatial arrangement are the key input factors. For inefficient firms, the main outputs are still dependent on total practice revenues. The contribution of major input is human capital.
The research in the second stage finds that the percentage of senior managers is higher for firms with poor operating efficiency than for firms with good operating efficiency. This implies that firms with poor operating efficiency may suffer from a high cost in human capital. If senior managers are not empowered, a high percentage of senior managers may be redundant and have a negative effect on operating efficiency. Practicing accountants from firms with good operating efficiency often visit branches to take care of business. Most of the branches of the firms with efficiency values below 60 have permanent or regularly stationed practicing accountants. This implies that in addition to headquarters affairs, practicing accountants should also take care of branch businesses. This would allow them to stay on top of operations of all operating units; however, it might also cause them to lose focus on main
operations. Both efficient and inefficient firms indicate
that their biggest challenge is fierce competition, followed by market recessions. Accounting firms are advised to seek ways to maintain competitive advantages. To combat recessions, it is critical to maintain existing clients and develop new clients. Appropriate educational training should be provided to upgrade the professional expertise and competency of staff. Accounting firms are human capital intensive in nature. Only with high-calibre personnel can accounting firms survive in such a fierce competitive environment, and in spite of economic recessions.
For both efficient and inefficient firms, the top priority should be the improvement of service quality, followed by staff training, recruiting more assistants and developing effective IT systems for sales and management. Therefore, accounting firms are advised to constantly strive for improvement of service quality and enhancement of staff competency in order to gain the trust and loyalty of their clients regarding the professional services provided by accounting firms. In addition, it is necessary for the operating types of branches, whether permanently or regularly stationed by practicing accountants or full-time staff or just used as contact windows, not to cause any significant differences in the operating efficiency of accounting firms.
This paper screens out the three critical factors that influence the operating efficiency of accounting firm partnerships by performing a stepwise regression in the third stage. Response to peer competition is the main reason for setting up practice in mainland China. Assistance to local accountant practices is the main factor in the percentages of each project from mainland China. The major operating mode in mainland China is bringing personnel from Taiwan.These three key factors drive the improvement of operating efficiency.
These findings can serve as a reference and benchmark for accounting firms in regard to operating difficulties or poor efficiency, and assist accounting firms in identifying their core competences and enhancing their competitive advantages. The results can also help accounting firms in mapping out their future strategies and developing suitable operating modes. For practices in mainland China, this paper developed four regression models. A stepwise regression analysis was also performed in order to identify the key factors of operating efficiency. Such efforts aim to assist accounting firms in developing business and expanding service scope so that they will no longer be limited by the traditional auditing and non-auditing markets in Taiwan. To survive in a highly competitive market, accounting firms should have broader perspectives in order to devise

40 SCHOLEDGE PUBLISHING WORLDWIDE- SCHOLARLY INTERNATIONAL JOURNAL WWW.SCHOLEDGE.ORG
thorough business plans for future operating strategies. References :-
I. Alexander, John R., "History of Accounting" (ClubExpress, 2002) Ch.12; From "A History of Accounting and Accountants" by Richard Brown, 1905.
II. Alan Sangster, Using accounting history and Luca Pacioli to teach double entry,Middlesex University Business School, September 2009, p.9.
III. BenDaniel, David J., Jesse E. Reyes, and Michael R. D´Angelo (2000), Concentration in the venture capital industry, Journal of Private Equity 3(3), 7-13
IV. Busenitz, Lowell W. (2007), The impact of
venture capital investments on ventures and economic development, in Hans Lundström (ed.), Handbook of Research on Venture Capital, Cheltenham, UK and Northampton, MA: Edward Elgar (forthcoming)
V. Farag, Shawki M., The accounting profession in Egypt: Its origin and development,University of Illinois, 2009.

41 SCHOLEDGE PUBLISHING WORLDWIDE- SCHOLARLY INTERNATIONAL JOURNAL WWW.SCHOLEDGE.ORG
Tables
Table 1 Definitions of input and output items
Item Name Definition
Outputs Total practice revenues (O1) (Unit: NTD)
Including the sub-business revenues from auditing for publicly issued firms, auditing for financing projects, auditing for other financial requirements, auditing for income tax reporting, tax planning, taxation and administrative remedies, other taxation services, management consulting, business registrations, and other service practices.
Number of cases (O2)
Including the sub-business cases from auditing for publicly issued firms, auditing for financing projects, auditing for other financial requirements, auditing for income tax reporting, tax planning, taxation and administrative remedies, other taxation services, management consulting, business registrations, and other service practices.
Inputs Number of employees (I1)
Including the number of accountants, managers, senior auditors, assistants, and other employees.
Area of space in use (I2) (Unit: square feet)
Including the area of space owned, rented, and provided by accountants.
Table 2 Pearson correlation coefficients between input and output items
Total practice revenues (O1) Number of cases (O2)
Number of employees (I1) 0.987*** 0.906*** (0.000) (0.000) Area of space in use (I2) 0.558*** 0.405*** (0.000) (0.000)
Note: *** denotes significant at 1% level.
42 SCHOLEDGE PUBLISHING WORLDWIDE- SCHOLARLY INTERNATIONAL JOURNAL WWW.SCHOLEDGE.ORG
Table 3 Analysis of efficient DMUs with an efficiency value of 100
____________________________________________________________________________________________________________________
Panel A: Operating efficiency
Input and output contribution (%)
Code of DMU Efficiency score RTS No. of references
DEA Rankings
Rankings by the total practice revenues
Rankings by the number of cases
O1 O2 I1 I2
12 100 CRTS 4 4 14 8 0 100 0 100 28 100 CRTS 214 1 1 1 100 0 100 0 200 100 CRTS 33 3 33 45 100 0 50 50 201 100 CRTS 205 2 190 7 0 100 2.2 97.8 Average 50 50 38.05 61.95
Panel B: Operating difficulties and future strategies
Allocations of human capital
Operating types of branches Major operating difficulties
Future strategies
Code of DMU
Efficiency Score
% of possessing CPA qualifications
% of partners and managers
No. of branches
Permanently stationed by practicing accountants
Regularly stationed by practicing accountants
Permanently stationed by full-time staff
Only as a contact window
1st
2nd
3rd
1st
2nd
3rd
12 100 0.10 0.15 3 Yes No No No 1 6 4 1 6 3 28 100 0.19 0.30 2 Yes No No No 1 7 4 1 3 6 200 100 0.17 0.23 0 No No No No 1 2 0 1 6 0 201 100 0.40 0.40 0 No No No No 0 0 0 0 0 0 Average 0.22 0.27 1.25
Notes: 1. Major operating difficulties: 0: none; 1: fierce competition; 2: market recessions; 3: many practitioners without licenses or simply renting licenses; 4: high costs in human capital, 5: a lack of skilled professionals; 6: unhealthy commissioning system; 7: high turnover of professional personnel; 8: others. 2. Future strategies: 0: none; 1: improvement of service quality; 2: recruiting more assistants; 3: training of staff; 4: maintenance of status quo; 5: recruiting more accountants; 6: IT systems in sales and management; 7: relocation of accountants to mainland China; 8: merger with other accounting firms; 9: establishment of a management consulting firm; 10: addition of branches; 11: others. 3. CRTS represents the constant returns to scale.

43 SCHOLEDGE PUBLISHING WORLDWIDE- SCHOLARLY INTERNATIONAL JOURNAL WWW.SCHOLEDGE.ORG
Table 4 Analysis of inefficient DMUs with an efficiency value below 100
___________________________________________________________________________________________________
_________________
Panel A: Operating efficiency
Improvement percentages (%) Improvement space Input and output contribution (%)
Efficiency score range (No. of DMUs)
Average efficiency score
O1 O2 I1 I2 O1 O2 I1 I2 O1 O2 I1 I2
90<=E<100(1) 99.5 0.5 82.3 0 0 139,990 272 0 0.00 100 0 88.3 11.7 80<=E<90(3) 83.62 19.67 85.33 0.00 0.00 314,671,424.86 9,067.34 0.00 0.00 96.27 3.73 49.20 50.80 70<=E<80(8) 73.44 36.34 55.40 0.00 -54.91 156,177,699.70 2,782.34 0.00 -762.69 93.24 6.76 87.35 12.65 60<=E<70(15) 63.60 57.53 57.53 0.00 -65.29 18,705,292.47 380.92 0.00 -98.78 92.27 7.73 90.72 9.28 0<=E<60(189) 35.78 248.49 619.70 0.00 -59.18 37,112,529.00 738.36 0.00 -69.68 94.11 5.89 93.86 6.14 Average (216) 40.06 223.05 549.85 0.00 -58.35 43,927,885.32 902.76 0.00 -96.08 94.01 5.99 92.75 7.25
Panel B: Operating difficulties and future strategies
Allocations of human capital Operating types of branches
Major operating difficulties
Future strategies
Efficiency score range (No. of DMUs)
Average efficiency score
% of possessing CPA qualifications
% of partners and managers
No. of branches
Permanently stationed by practicing accountants
Regularly stationed by practicing accountants
Permanently stationed by full-time staff
Only as a contact window
90<=E<100(1) 99.5 0.12 0.24 0 No No No No 1,2,4 1,6,2 80<=E<90(3) 83.62 0.13 0.22 1.33 3 No No No 1,5,8 1,11 70<=E<80(8) 73.44 0.24 0.36 0.75 1 1 2 No 1,2 1,2,3 60<=E<70(15) 63.60 0.26 0.33 0.27 3 No No No 1,2 1,3,4 0<=E<60(189) 35.78 0.21 0.29 0.58 59 14 18 7 1,2,3,4,5 1,3 Average (216) 40.06 0.21 0.30 0.57
Notes: 1. Major operating difficulties: 0: none; 1: fierce competition; 2: market recessions; 3: many practitioners without licenses or simply renting licenses; 4: high costs in human capital, 5: a lack of skilled professionals; 6: unhealthy commissioning system; 7: high turnover of professional personnel; 8: others. 2. Future strategies: 0: none; 1: improvement of service quality; 2: recruiting more assistants; 3: training of staff; 4: maintenance of status quo; 5: recruiting more accountants; 6: IT systems in sales and management; 7: relocation of accountants to mainland China; 8: merger with other accounting firms; 9: establishment of a management consulting firm; 10: addition of branches; 11: others.

44 SCHOLEDGE PUBLISHING WORLDWIDE- SCHOLARLY INTERNATIONAL JOURNAL WWW.SCHOLEDGE.ORG
Table 5 Operating difficulties for the accounting firm partnerships
The first The second The third
No. of DMUs
Average efficiency score
No. of DMUs
Average efficiency score
No. of DMUs
Average efficiency score
0: none 13 46.683 23 47.083 49 44.080 1: fierce competition 93 44.010 48 39.647 26 36.070 2: market recessions 66 38.482 57 43.529 19 40.933 3: many practitioners without licenses or simply renting licenses
11 30.678 11 37.132 26 38.967
4: high costs in human capital
9 40.412 33 37.147 35 48.261
5: a lack of skilled professionals
12 45.690 18 38.343 17 45.759
6: unhealthy commissioning system
6 23.360 19 36.610 17 39.576
7: high turnover of professional personnel
7 36.464 11 51.528 28 34.519
8: others 3 56.493 - - 3 19.680 Sum of DMUs / Average efficiency score
220 41.155 220 41.155 220 41.155
Table 6 Difference in operating efficiency of different operating types of branches
Yes/No No. of DMUs Average efficiency score Average difference t value p value (one-tailed)
Branch type-Permanently stationed by practicing accountants Yes 68 42.712 2.254 0.822 0.206 No 152 40.458 Branch type-Regularly stationed by practicing accountants Yes 15 43.309 2.312 0.660 0.259 No 205 40.997 Branch type-Permanently stationed by full-time staff Yes 22 41.897 0.825 0.195 0.423 No 198 41.072 Branch type-Only as a contact window Yes 7 45.043 4.016 0.556 0.289 No 213 41.027
Table 7 Regression results on relationships between practices in mainland China and operating
efficiency
_____________________________________________________________________
OE=a0+a1TR+e1 (1)
OE=b0+b1S1+b2S2+b3S3+b4S4+e2 (2)
OE=c0+c1R1+c2R2+c3R3+c4R4+c5R5+c6R6+c7R7+c8R8+e3 (3)
OE=d0+d1M1+d2M2+e4 (4)
Dimensions Variables Model 1 Model 2 Model 3 Model 4 Stepwise regression
Intercept 40.264*** (31.422)
39.869*** (30.414)
40.130*** (30.773)
39.835*** (30.156)
39.859*** (30.689)
The percentage of TR 3.564***

45 SCHOLEDGE PUBLISHING WORLDWIDE- SCHOLARLY INTERNATIONAL JOURNAL WWW.SCHOLEDGE.ORG
revenues from mainland China
(2.923)
The reasons for setting up practice in mainland China
S1 9.594** (2.196)
S2 -15.290 (-1.059)
S3 32.890** (2.279)
25.128** (2.232)
S4 -0.243 (-0.013)
The percentages of each project from mainland China
R1 0.083* (1.614)
R2 -0.449 (-0.581)
R3 7.868 (0.943)
R4 -0.244 (-0.758)
R5 1.934* (1.646)
R6 -0.175 (-0.950)
R7 7.318** (1.932)
7.506** (2.014)
R8 1.289** (2.070)
The operating modes in mainland China
M1 11.322*** (2.720)
7.174** (1.681)
M2 4.635 (0.477)
Observations 220 220 220 220 220
Notes: 1. The figures in parentheses are t-values. 2. The variable VIFs are all less than 10, implying that no serious multi-collinearity exists among variables. 3. *p<0.1, **p<0.05, ***p<0.01.