Face tracking with automatic model construction
19
Face Tracking with Automatic Model Construction Jesus Nuevo, Luis M. Bergasa * , David F. Llorca, Manuel Oca˜ na Department of Electronics, Universidad de Alcala. Esc. Politecnica, Crta Madrid-Barcelona, Km 33,600. 28871 Alcala de Henares, Madrid Abstract Driver inattention is one of the major causes of traffic crashes, claiming thousands of lives every year. Face tracking is one of the first stages in safety systems that relay on computer vision to detect inattention. This paper describes an active model with a robust texture model built on-line. The model uses one camera and it is able to operate without active illumination. The texture model is defined by a series of clusters, which are built in a video sequence using previously encountered samples. This model is used to search for the corresponding element in the following frames. An on-line clustering method, named leaderP is described and evaluated on an application of face tracking. A 20-point shape model is used. This model is built offline, and a robust fitting fuction is used to restrict the position of the points. Our proposal is to serve as one of the stages in a driver monitoring system. To test it, a new set of sequences of drivers recorded outdoors and in a realistic simulator has been compiled. Experimental results for typical outdoor driving scenarios, with frequent head movement, turns and occlusions are presented. Our approach is tested and compared with the Simultaneous Modeling and Tracking (SMAT) [1], and the recently presented Stacked Trimmed Active Shape Model (STASM) [2], and shows better results than SMAT and similar fitting error levels to STASM, with much faster execution times and improved robustness. Keywords: Face tracking, appearance modeling, incremental clustering, robust fitting, driver monitoring 1. Introduction 1 Driver inattention is a major cause of traffic accidents, and it has been found to be 2 involved in some form in 80 percent of the crashes and 65 percent of the near crashes within 3 3 seconds of the event [3]. Monitoring a driver to detect inattention is a complex problem 4 that involves physiological and behavioural elements. Different works have been presented in 5 recent years, focused mainly in drowsiness, with a broad range of techniques. Physiological 6 * Corresponding author: Tel. (+34) 91885 6569 Email addresses: [email protected] (Jesus Nuevo), [email protected] (Luis M. Bergasa), [email protected] (David F. Llorca), [email protected] (Manuel Oca˜ na) Preprint submitted to Image and Vision Computing August 18, 2010
-
Upload
independent -
Category
Documents
-
view
3 -
download
0
Transcript of Face tracking with automatic model construction

Face Tracking with Automatic Model Construction
Jesus Nuevo, Luis M. Bergasa∗, David F. Llorca, Manuel Ocana
Department of Electronics, Universidad de Alcala. Esc. Politecnica, Crta Madrid-Barcelona, Km 33,600.
28871 Alcala de Henares, Madrid
Abstract
Driver inattention is one of the major causes of traffic crashes, claiming thousands of livesevery year. Face tracking is one of the first stages in safety systems that relay on computervision to detect inattention. This paper describes an active model with a robust texturemodel built on-line. The model uses one camera and it is able to operate without activeillumination. The texture model is defined by a series of clusters, which are built in avideo sequence using previously encountered samples. This model is used to search forthe corresponding element in the following frames. An on-line clustering method, namedleaderP is described and evaluated on an application of face tracking. A 20-point shapemodel is used. This model is built offline, and a robust fitting fuction is used to restrict theposition of the points. Our proposal is to serve as one of the stages in a driver monitoring
system. To test it, a new set of sequences of drivers recorded outdoors and in a realisticsimulator has been compiled. Experimental results for typical outdoor driving scenarios,with frequent head movement, turns and occlusions are presented. Our approach is testedand compared with the Simultaneous Modeling and Tracking (SMAT) [1], and the recentlypresented Stacked Trimmed Active Shape Model (STASM) [2], and shows better resultsthan SMAT and similar fitting error levels to STASM, with much faster execution times andimproved robustness.
Keywords: Face tracking, appearance modeling, incremental clustering, robust fitting,driver monitoring
1. Introduction1
Driver inattention is a major cause of traffic accidents, and it has been found to be2
involved in some form in 80 percent of the crashes and 65 percent of the near crashes within3
3 seconds of the event [3]. Monitoring a driver to detect inattention is a complex problem4
that involves physiological and behavioural elements. Different works have been presented in5
recent years, focused mainly in drowsiness, with a broad range of techniques. Physiological6
∗Corresponding author: Tel. (+34) 91885 6569Email addresses: [email protected] (Jesus Nuevo), [email protected] (Luis M. Bergasa),
[email protected] (David F. Llorca), [email protected] (Manuel Ocana)
Preprint submitted to Image and Vision Computing August 18, 2010

measurements such as electro-encephalography (EEG) [4] or electro-oculography (EOG),7
provide the best data for detection [4]. The problem with these techniques is that they are8
intrusive to the subject. Moreover, medical equipment is always expensive.9
Lateral position of the vehicle inside the lane, steering wheel movements and time-to-line10
crossing are commonly used, and some commercial systems have been developed [5, 6]. These11
techniques are not invasive, and to date they obtain the most reliable results. However, the12
measurements they use may not reflect behaviors such as the so-called micro-sleeps [7]. They13
also require a training period for each person, and thus are not applicable to the occasional14
driver.15
Drivers in fatigue exhibit changes in the way their eyes perform some actions, like moving16
or blinking. These actions are known as visual behaviors, and are readily observable in drowsy17
and dristracted drivers. Face pose [8] and gaze direction also contain information and have18
been used as another element of inattention detection systems [9]. Computer vision has19
been the tool of choice for many researchers to be used to monitor visual behaviours, as it20
is non-intrusive. Most systems use one or two cameras to track the head and eyes of the21
subject [10, 11, 12, 13, 14]. A few companies commercialize systems [15, 16] as accessories22
for installation in vehicles. These systems require user-specific calibration, and some of them23
use near-IR lighting, which is known to produce eye fatigue. Reliability of these systems is24
still not high enough for car companies to take on the responsibility of its production and25
possible liability in case of malfunctioning.26
Face location and tracking are the first processing stages of most computer vision systems27
for driver monitoring. Some of the most successful systems to date use near-IR active28
illumination [17, 18, 19], to simplify the detection of the eyes thanks to the bright pupil29
effect. Near-IR illumination is not as useful during the day because sunlight also has a30
near-IR component. As mentioned above, near-IR can produce eye fatigue and thus limits31
the amount of time these systems can be used on a person.32
Given the complexity of the problem, it has been divided in parts and in this work only33
the problem of face tracking is addressed.34
This paper presents a new active model with the texture model built incrementally. We35
use it to characterize and track the face in video sequences. The tracker can operate without36
active illumination. The texture model of the face is created online, and thus specific for each37
person without requiring a training phase. A new online clustering algorithm is described,38
and its performance compared with the method proposed in [1]. Two shape models, trained39
online and off-line, are compared. This paper also presents a new video sequence database,40
recorded in a car moving outdoors and in a simulator. The database is used to assess41
the performance of the proposed face tracking method in the challenging environment a42
driver monitoring application would meet. No evaluations of face pose estimation and driver43
inattention detection are performed.44
The rest of the paper is structured as follows. Section 2 presents a few remarkable45
works in face tracking in the literature that are related to our proposal. Section 3 describes46
our approach. Section 4 describes the video dataset used for performance evaluation, and47
experimental results. This paper closes with conclusions and future work.48
2

2. Background49
Human face tracking is a broad field in computing research [20], and a myriad of tech-50
niques have been developed in the last decades. It is of the greatest interest, as vast amounts51
of information are contained in face features, movements and gestures, which are constantly52
used for human communication. Systems that work on such data often use face track-53
ing [21, 22].54
Non-rigid object tracking has been a major focus of research in latter years, and general55
purpose template-based trackers have been used to track faces in the literature with success.56
Several efficient approaches have been presented [23, 24, 25, 26].57
Statistical models have been used for face modeling and tracking. Active Shape Mod-58
els [27] (ASM) are similar to the active contours (snakes), but include constraints from a59
Point Distribution Model (PDM) [28] computed in advance from a training set. Advances in60
late years have increased their robustness and precision to remarkable levels (STASM,[2]).61
Extensions of ASM that include modeling of texture have been presented, of which Active62
Appearance Models (AAMs) [29] are arguably the best known. Active Appearance Models63
are global models in the sense that the minimization is performed over all pixels that fall64
inside the mesh defined by the mean of the PDM. All these models have an offline training65
phase, which require comprehensive training sets so they can generalize properly to unseen66
instances of the object. This is time consuming process, and there is still the risk that67
perfectly valid instances of the object would not be modeled correctly.68
Several methods that work without a priori models have been presented in the literature.69
Most of them focus on patch tracking on a video sequence. The classic approach is to use70
the image patch extracted on the first frame of the sequence to search for similar patches71
on the following frames. Lukas-Kanade method [30] was one of the first proposed solutions72
and it is still widely used. Jepson et al. [31] presented a system with appearance model73
based on three components: a stable component that is learned over a long period based on74
wavelets, a 2-frame tracker and an outlier rejection process. Yin and Collins [32] build an75
adaptive view-dependent appearance model on-line. The model is made of patches selected76
around Harris corners. Model and target patches are matched using correlation, and the77
change in position, rotation and scale is obtained with the Procrustes algorithm.78
Another successful line of work in object tracking without a priori training is based79
on classification instead of modeling. Collins and Liu [33] presented a system based on80
background/foreground discrimination. Avidan [34] presents one of the many systems that81
use machine learning to classify patches [35, 36]. Avidan uses weak classifiers trained every82
frame and AdaBoost to combine them. Pilet et al. [37] train keypoint classifiers using83
Random Trees that are able to recognize hundreds of keypoints in real-time.84
Simultaneous Modeling and Tracking (SMAT) [1] is in line with methods like Lucas-85
Kanade, relaying on matching to track patches. Lukas-Kanade extracts a template at the86
beginning of the sequence and uses it for tracking, and will fail if the appearance of the patch87
changes considerably. Matthews et al. [38] proposed an strategic update of the template,88
which keeps the template from the first frame to correct errors that appear in the localization.89
When the error is too high, the update is blocked. In [39], a solution is proposed with fixed90
3

template that adaptively detected and selected the window around the features. SMAT91
builds a more complex model based on incremental clustering.92
In this paper we combine concepts from active models with the incremental clustering93
proposed in SMAT. The texture model is created online, making the model adaptative,94
while the shape model is learnt offline. The clustering used by SMAT has some limitations,95
and we propose some modifications to obtain a more robust model and better tracking. We96
name the approach Robust SMAT for this reason.97
Evaluation of face tracking methods is performed in most works with images captured98
indoors. Some authors use freely available image sets, but most of them test on internal99
datasets created by them, which limits the validity of a comparison with other systems. Only100
a few authors [40][41] have used images recorded in a vehicle, but the number of samples is101
limited. To the best of our knowledge, there is no publicly available video dataset of people102
driving, either in a simulator or in a real road. We propose a new dataset that covers such103
scenarios.104
3. Robust Simultaneous Modeling and Tracking105
This section describes the Simultaneous Modeling and Tracking (SMAT) of Dowson and106
Bowden [1], and some modifications we propose to improve its performance. SMAT tries to107
build a model of appearance of features and how their positions are related (the structure108
model, or shape), from samples of texture and shape obtained in previous frames.109
The models of appearance and shape are independent. Fitting is performed in the same110
fashion of ASM: the features are first found separatedly using correlation, and then their111
final positions are constrained by the shape model. If the final positions are found to be112
reliable and not caused by fitting errors, the appearance model is updated, otherwise it is113
left unchanged. Figure 1 shows a flow chart of the algorithm.114
Feature tracking
Evaluatepatch positions
Correctposition?
Point DistributionModel
YesNo
Update App Modelwith new patches
Update PDMwith new positions
Appearance Model
New image
Figure 1: SMAT block diagram
4

3.1. Appearance modeling115
Each one of the possible appearances of an object, or a feature of it, can be considered116
as a point in a feature space. Similar appearances will be close in this space, away from117
other points representing dissimilar appearances of the object. These groups of points, or118
clusters, form a mixture model that can be used to define the appearance of the object.119
SMAT builds a library of exemplars obtained from previous frames, image patches in this120
case. Dowson and Bowden defined a series of clusters by their median patch, also known121
as representative, and their variance. A new incoming patch is made part of the cluster if122
the distance between it and the median of the cluster is below a threshold that is a funcion123
of the variance. The median and variance of a cluster are recalculated everytime a patch is124
added to it. Up to M exemplars per cluster are kept. If the size limit is reached, the most125
distant element from the representative is removed.126
Everytime a cluster is updated, the weight of the clusters is recalculated as in equation127
1:128
w(t+1)k =
{
(w(t)k + α) 1
1+αif k = ku
w(t)k
11+α
otherwise(1)
where α ∈ [0, 1) is the learning rate, and ku is the index of the updated cluster. The129
number of clusters is also limited to K. If K is reached, the cluster with the lowest weight130
is discarded.131
In a later work, Dowson et al. [42], introduced a different condition for membership,132
that compares the probability of the exemplar belonging to foreground (a cluster) or to the133
background134
p(fg |d(x, µn), σfgn
)
p(bg |d(x, µn), σbgn
)(2)
where σfgn
is obtained from the distances between the representative and the other exemplars135
in the cluster, and σbgn
is obtained from the distances between the representative and the136
exemplars in the cluster offset by 1 pixel.137
We have found that this clustering method can be improved in several ways. The adapt-138
ing nature of the clusters could theoretically lead two or more clusters to overlap. However,139
in our tests we have observed that the opposite is much more frequent: the representative140
of the cluster rarely changes after the cluster has reached a certain number of elements.141
Outliers can be introduced in the model in the event of an occussion of the face by a142
hand or other elements like a scarf. In most cases, these exemplars would be far away from143
the representative in the cluster. To remove them and reduce memory footprint, SMAT144
keeps up to M exemplars per cluster. If the size limit is reached, the most distant element145
from the representative is removed. When very similar patches are constantly introduced,146
one of them will be finally chosen as the median, and the variance will decrease, overfitting147
the cluster and discarding valuable exemplars. At a frame rate of 30 fps, with M set to 50,148
the cluster will overfit in less than 2 seconds. This would happen even if the exemplar to be149
removed is chosen randomly. This procedure will discard valuable information and future,150
subtle changes to the feature will lead to the creation of another cluster.151
5

We propose an alternative clustering method, named leaderP, to partially solve these and152
other problems. The method is a modification of the leader algorithm [43, 44], arguably the153
simplest and most frequently used incremental clustering method. In leader, each cluster Ci154
is defined by only one exemplar, and a fixed membership threshold T . It starts by making the155
first exemplar the representative of a cluster. If an incoming exemplar fulfills being within156
the threshold T it is marked as member of that cluster, otherwise it becomes a cluster on157
its own. The pseudocode is shown in algorithm 1.158
Algorithm 1 Leader clustering
1: Let C = {C1, . . . , Cn} be a set of n clusters, with weights {wt1, . . . , w
tn}
2: procedure leader(E,C ) ⊲ cluster patch E
3: for all Ci ∈ C do
4: if d(Ck, E) < T then ⊲ Check if patch E ∈ Ck5: UpdateWeights(wt
1, . . . , wtn) ⊲ As in equation 1
6: return
7: end if
8: end for
9: Create new cluster Cn+1, with E as representative.10: Set wt+1
n+1 ← 0 ⊲ Weight of new cluster Cn+1
11: C ← C ∪ Cn+1 ⊲ Add new cluster to the model12: if n + 1 > K then ⊲ Remove the cluster with lowest weight13: Find Ck | wk ≤ wi i = 1, . . . , n14: C ← C \ Ck15: end if
16: end procedure
On the other hand, leaderP keeps the first few exemplars added to the cluster are kept,159
up to P . The median of the cluster is chosen as the representative, as in the original160
clustering of Dowson and Bowden. When the number of exemplars in the cluster reaches P ,161
all exemplars but the representative are discarded, and it starts to work under the leader162
algorithm. P is chosen as a small number (we use P = 10). The membership threshold is163
however flexible: the distances between the representative and each of the exemplars that164
are found to be members of the cluster is saved, and the variance of those distances is used165
to calculate the threshold. Because the representative is fixed and distance is a scalar, many166
values can be kept in memory without having a impact on the overall performance. Keeping167
more values reduces the risk of overfitting.168
The original proposal of SMAT used Mutual Information (MI) as a distance measure to169
compare the image patches, and found it to perform better that Sum of Squared Differences170
(SSD), and slightly better than correlation in some tests. Any definition of distance could be171
used. We have also tested Zero-mean Normalized Cross-Correlation (ZNCC). Several types172
of warping were tested in [42]: translation, euclidean, similarity and affine. The results173
showed an increasing failure rate as the degrees of freedom of the warps increased. Based174
6

on this, we have chosen to use the simplest, and the patches are only translated depending175
on the point distribution model.176
3.2. Shape model177
In the original SMAT of Dowson and Bowden, the shape was also learned on-line. The178
same clustering algorithm was used, but the membership of a new shape to a cluster was179
calculated using Mahalanobis distance.180
Our method relies on the pre-learned shape model. The restrictions on using a pre-181
learned model for shape are less than those for an appearance model, as it is of lower182
dimensionality and the deformations are easier to model. It has been shown [45] that183
location and tracking errors are mainly due to appearance, and that a generic shape model184
for faces is easier to construct. We use the method of classic ASM [27], which applies PCA185
to a set of samples created by hand and extracts the mean s0 and an orthogonal vector186
basis (s1, . . . , sN). The shapes are first normalized and aligned using Generalized Procrustes187
Analysis [46].188
Let s = (x0, y0, . . . , xn−1, yn−1) be a shape. A shape can be generated from this base as189
s = s0 +m
∑
i=1
pi · si (3)
Using L2 norm, the coefficients p = (p1, . . . , pN) can be obtained for a given shape s as190
a projection of s on the vector basis191
p = ST (s− s0), pi = (s− s0) · si (4)
where S is a matrix with the eigenvectors si as rows. The estimation of p with equation192
4 is very sensitive to the presence of outlier points: a high error value from one point will193
severely influence the values of p. We use M-estimators [47] to solve this problem. This194
technique has been applied to ASM and AAM in previous works [48, 49], so it is only briefly195
presented here.196
Let s be a shape, obtained by fitting each feature independently. The function to mini-197
mize is198
arg minp
2n∑
i=1
ρ(ri, θ) (5)
where ρ : R × R+ → R
+ is an M-estimator, and θ is obtained from the standard deviation199
of the residues [50]. ri is the residue for coordinate i of the shape200
ri = xi − (sio +
m∑
j=1
pjsij)) (6)
where xi are the points of the shape s, and sij is the ith element of the vector sj.201
Minimizing function 5 is a case of re-weighted least squared. The weight decreases more202
rapidly than the square of the residue, and thus a point with error tending to infinite will203
have zero weight in the estimation.204
7

Several robust estimators have been tested: Huber, Cauchy, Gaussian and Tukey func-205
tions [50]. A study was made in [19] that resulted in similar performance for all of them206
in a similar scenario to that of this paper, and Huber function was chosen. Huber function207
performs correctly up to a number of outliers of 50% of the points.208
We use the 20-point distribution of the BioID database [51]. Data from this database209
was used to train the model. This distribution places the points in some of the most salient210
locations of the face, and has been used in several other works [40].211
4. Tests and results212
This section presents the video sequences used to test different tracking algorithms in213
a driving scenario. The dataset contains most actions that appear in everyday driving214
situations. A comparison between our approach and SMAT is presented. Additionally, we215
compare R-SMAT results with the recently introduced Stacked Trimmed ASM (STASM).216
4.1. Test set217
Driving scenarios present a series of challenges for a face tracking algorithm. Drivers218
move constantly, rotate their head (self-occlusing part of the face) or occlude their face with219
their hands (or other elements such as glasses). If other people are in the car, talking and220
gesturing are common. There are also constant background changes and, more importantly,221
frequent illumination changes, produced by shadows of trees or buildings, streets lights,222
other vehicles, etc. A considerable amount of test data is needed to properly evaluate the223
performance of a system under all these situations.224
A new video dataset has been created, with sequences of subjects driving outdoor, and225
in a simulator. The RobeSafe Driver Monitoring Video (RS-DMV) dataset contains 10226
sequences, 7 recorded outdoors (Type A) and 3 in a simulator (Type B).227
Outdoor sequences were recorded on RobeSafe’s vehicle moving at the campus of the228
University of Alcala. Drivers were fully awake, talked frequently with other passengers in229
the vehicle and were asked to look regularly to the rear-view mirrors and operate the car230
sound system. The cameras are placed over the dashboard, to avoid occlusions caused by231
the wheel. All subjects drove the same streets, shown in figure 2.232
(a) Trayectory of the vehicle during recordings
Figure 2: Trayectory of the vehicle (map from maps.google.com)
8
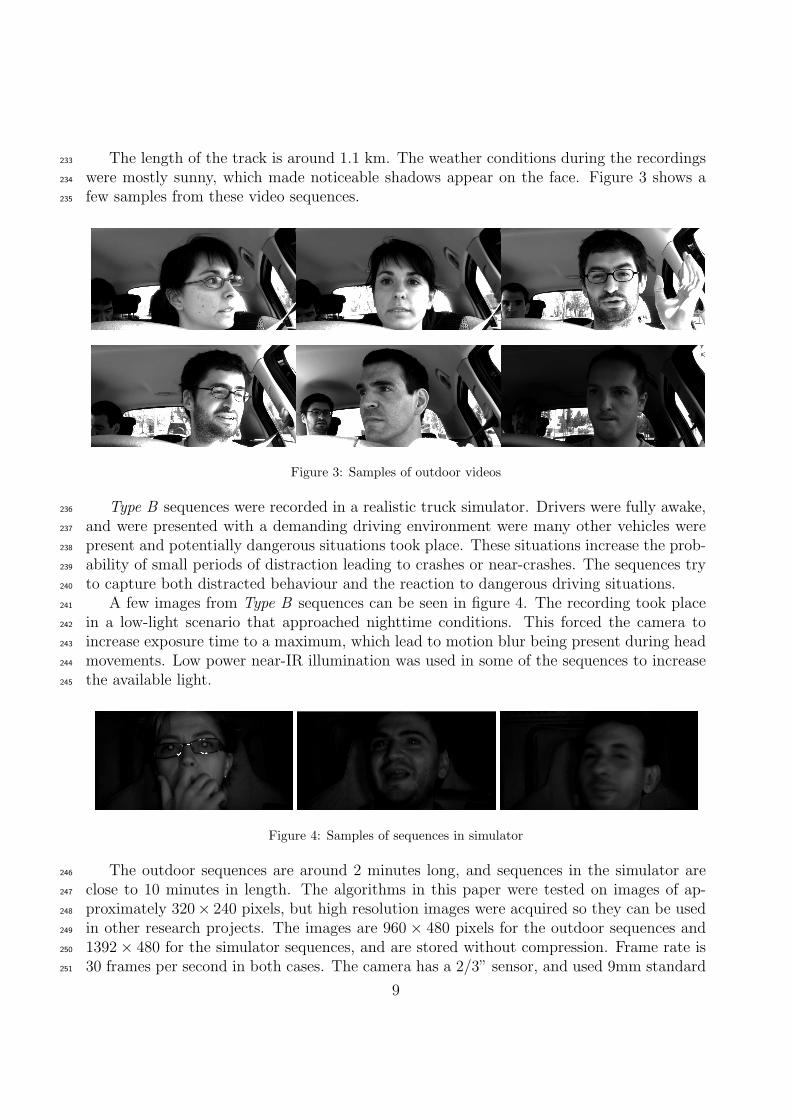
The length of the track is around 1.1 km. The weather conditions during the recordings233
were mostly sunny, which made noticeable shadows appear on the face. Figure 3 shows a234
few samples from these video sequences.235
Figure 3: Samples of outdoor videos
Type B sequences were recorded in a realistic truck simulator. Drivers were fully awake,236
and were presented with a demanding driving environment were many other vehicles were237
present and potentially dangerous situations took place. These situations increase the prob-238
ability of small periods of distraction leading to crashes or near-crashes. The sequences try239
to capture both distracted behaviour and the reaction to dangerous driving situations.240
A few images from Type B sequences can be seen in figure 4. The recording took place241
in a low-light scenario that approached nighttime conditions. This forced the camera to242
increase exposure time to a maximum, which lead to motion blur being present during head243
movements. Low power near-IR illumination was used in some of the sequences to increase244
the available light.245
Figure 4: Samples of sequences in simulator
The outdoor sequences are around 2 minutes long, and sequences in the simulator are246
close to 10 minutes in length. The algorithms in this paper were tested on images of ap-247
proximately 320× 240 pixels, but high resolution images were acquired so they can be used248
in other research projects. The images are 960 × 480 pixels for the outdoor sequences and249
1392× 480 for the simulator sequences, and are stored without compression. Frame rate is250
30 frames per second in both cases. The camera has a 2/3” sensor, and used 9mm standard251
9

lenses. Images are grayscale. The recording software controlled camera gain using values of252
the pixels that fell directly on the face of the driver.253
The RS-DMV is publicly available, free of charge, for research purposes. Samples and254
information on how to obtain the database are available at the authors’ webpage1.255
4.2. Performance evaluation256
Performance of the algorithms is evaluated as the error between the estimated position257
of the features and their actual position, as given by a human operator. Hand-marking is a258
time consuming task, and thus not all frames in all videos have been marked. Approximately259
1 in 30 frames (1 per second) has been marked in the sequences in RS-DMV. We call this260
frames keyframes.261
We used the metric me, introduced by Cristinacce and Cootes [40]. Let xi be the points262
of the ground-truth shape s, and let xi be the points of the estimated shape s. Then,263
me =1
ns
n∑
i=1
di, di =√
(xi − xi)T (xi − xi) (7)
where n is the number of points and s is the inter-ocular distance. We also discard the point264
on the chin and the exterior of the eyes, because their location changes much from person265
to person. Moreover, the variance of their position when marked by human operators is266
greater than for the other points. Because only 17 points are used, we note the metric as267
me17. In the event of a tracking loss, of if the face can not be found, the value of me17 for268
that frame is set to ∞.269
During head turns, the inter-eye distance reduces with the cosine of the angle. In these270
frames, s is not valid and is calculated from its value on previous frames.271
Handmarked points and software used to ease the marking process are distributed with272
the RS-DMV dataset.273
4.3. Results274
We tested the performance of R-SMAT approach on the RS-DMV dataset, as well as275
that of SMAT. We compared these results with those obtained by STASM, using the imple-276
mentation in [2].277
One of the most remarkable problems of (R-)SMAT is that it needs to be properly278
initialized, and the first frames of the sequence are key to building a good model. We279
propose STASM to initialize (R-)SMAT in the first frame. STASM has been shown to be280
very accurate when the face is frontal. Nonetheless, a slightly incorrect initialization will281
make (R-)SMAT track the (slightly) erroneous points. To decouple this error from the282
evaluation of accuracy of (R-)SMAT in the tests, the shape was initialized in the first frame283
with positions from the ground-truth data. At the end of this section, the performance of284
R-SMAT with automatic initialization is evaluated.285
1www.robesafe.com/personal/jnuevo
10
First, a comparison of the shape models is presented. With the best shape model, the286
original clustering algorithm and the proposed alternative are evaluated. Results are pre-287
sented for outdoor and simulator sequences separatedly, as each has specific characteristics288
on their own.289
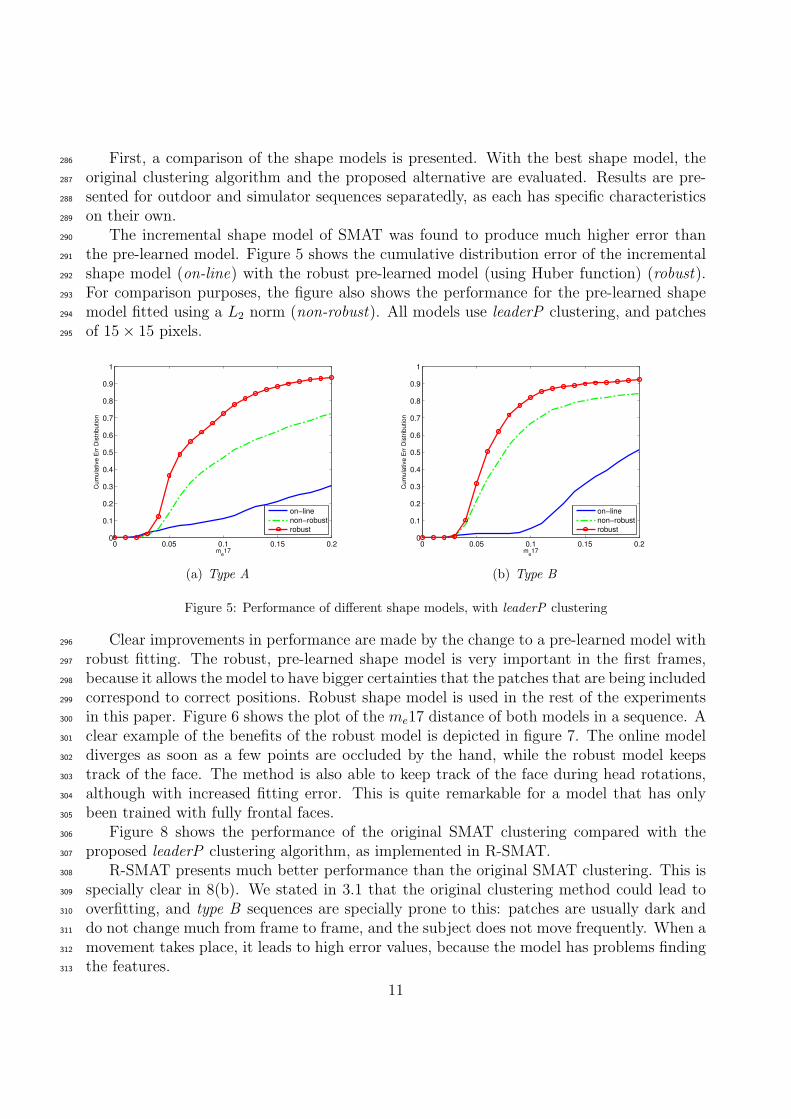
The incremental shape model of SMAT was found to produce much higher error than290
the pre-learned model. Figure 5 shows the cumulative distribution error of the incremental291
shape model (on-line) with the robust pre-learned model (using Huber function) (robust).292
For comparison purposes, the figure also shows the performance for the pre-learned shape293
model fitted using a L2 norm (non-robust). All models use leaderP clustering, and patches294
of 15× 15 pixels.295
0 0.05 0.1 0.15 0.20
0.1
0.2
0.3
0.4
0.5
0.6
0.7
0.8
0.9
1
me17
Cu
mu
lative
Err
Dis
trib
utio
n
on−line
non−robust
robust
(a) Type A
0 0.05 0.1 0.15 0.20
0.1
0.2
0.3
0.4
0.5
0.6
0.7
0.8
0.9
1
me17
Cu
mu
lative
Err
Dis
trib
utio
n
on−line
non−robust
robust
(b) Type B
Figure 5: Performance of different shape models, with leaderP clustering
Clear improvements in performance are made by the change to a pre-learned model with296
robust fitting. The robust, pre-learned shape model is very important in the first frames,297
because it allows the model to have bigger certainties that the patches that are being included298
correspond to correct positions. Robust shape model is used in the rest of the experiments299
in this paper. Figure 6 shows the plot of the me17 distance of both models in a sequence. A300
clear example of the benefits of the robust model is depicted in figure 7. The online model301
diverges as soon as a few points are occluded by the hand, while the robust model keeps302
track of the face. The method is also able to keep track of the face during head rotations,303
although with increased fitting error. This is quite remarkable for a model that has only304
been trained with fully frontal faces.305
Figure 8 shows the performance of the original SMAT clustering compared with the306
proposed leaderP clustering algorithm, as implemented in R-SMAT.307
R-SMAT presents much better performance than the original SMAT clustering. This is308
specially clear in 8(b). We stated in 3.1 that the original clustering method could lead to309
overfitting, and type B sequences are specially prone to this: patches are usually dark and310
do not change much from frame to frame, and the subject does not move frequently. When a311
movement takes place, it leads to high error values, because the model has problems finding312
the features.313
11

0 500 1000 1500 2000 2500 3000 3500 40000
0.5
1
1.5
2
2.5
me1
7
Frame
Robust
Incremental
Figure 6: me17 error for a sequence
(a) Frame 227 - online (b) Frame 230 - online (c) Frame 233 - online
(d) Frame 227 - robust (e) Frame 230 - robust (f) Frame 233 - robust
Figure 7: Samples of type A sequence #1. Outlier points are drawn in red.
Table 1 shows the tracking losses of SMAT and R-SMAT, as a percentage of the keyframes314
in the sequences. Tracking losses were monitored by counting the points inside the face area,315
detected with Viola&Jones algorithm [52]. Tracking was considered lost when more than316
33% of the points were out of the box, or when the rotation of the model exceeded a pre-set317
value. The model was then repositioned, simply by centering it on the Viola&Jones box.318
Mean Maximum Minimum
R-SMATType A 0.99% 2.08%(seq. #7) 0%(seq. #1,#2,#6)Type B 0.71% 1.96%(seq. #9) 0%(seq. #10)
SMATType A 1.77% 5.03%(seq. #4) 0%(seq. #1,#2,#5)Type B 1.03% 2.45%(seq. #9) 0%(seq. #10)
Table 1: Track losses for different clustering methods
12

0 0.05 0.1 0.15 0.20
0.1
0.2
0.3
0.4
0.5
0.6
0.7
0.8
0.9
1
me17
Cu
mu
lative
Err
Dis
trib
utio
n
leaderP
original
(a) Type A
0 0.05 0.1 0.15 0.20
0.1
0.2
0.3
0.4
0.5
0.6
0.7
0.8
0.9
1
me17
Cu
mu
lative
Err
Dis
trib
utio
n
leaderP
original
(b) Type B
Figure 8: Comparison of the performance of clustering algorithms
4.3.1. R-SMAT with automatic initialization319
Results presented above have been obtained initializing SMAT and R-SMAT with land-320
marks from the handmarked ground-truth data. In a real scenario, an automatic algorithm321
would be used to initialize SMAT and R-SMAT.322
We have used STASM for this task. STASM has demonstrated high accuracy, but only323
works properly when the face is frontal to the camera, and does not find the face otherwise.324
Another problem, critical to our application, is that it does not work in real time. However,325
a one-time delay can be considered acceptable. STASM was run on the first frame of each326
sequence, and its estimation seeded the position of R-SMAT in that video. Figure 9 plots327
the error distributions of R-SMAT when initialized with STASM and from ground-truth328
(manual). The error of STASM is also shown.329
0 0.05 0.1 0.15 0.20
0.1
0.2
0.3
0.4
0.5
0.6
0.7
0.8
0.9
1
me17
Cum
ula
tive E
rr D
istr
ibution
R−SMAT manual init
R−SMAT STASM init
STASM
STASM without losses
(a) Type A
0 0.05 0.1 0.15 0.20
0.1
0.2
0.3
0.4
0.5
0.6
0.7
0.8
0.9
1
me17
Cum
ula
tive E
rr D
istr
ibution
R−SMAT manual init
R−SMAT STASM init
STASM
STASM without losses
(b) Type B
Figure 9: Comparison of the performance of STASM and SMAT
As expected, the figure shows the results worsen for both types of sequences. But the330
lost accuracy is relatively small, with a 5% loss at me17 = 0.1 for type A sequences, and331
13
10% loss for type B. The mean of the me17 error of STASM in the first frame is 0.0571 for332
type A sequences and 0.0805 for type B .333
STASM is plotted in figure 9 with and without considering frames where the face was334
not found (losses). For all types of sequences, R-SMAT initialized manually outperforms335
STASM when losses are considered. Expectedly, STASM shows better accuracy than R-336
SMAT when tracking is not lost (i.e., when the face is frontal). R-SMAT initialized with337
STASM performs almost identically as STASM in figure 9(b), and slightly worse for type A338
sequences.339
(a) Seq. #1, frame 2570 (b) Seq. #5, frame 280 (c) Seq. #5, frame 450
(d) Seq. #6, frame 1654 (e) Seq. #6, frame 2579 (f) Seq. #7, frame 290
(g) Seq. #7, frame 2610 (h) Seq. #9, frame 7440 (i) Seq. #9, frame 11730
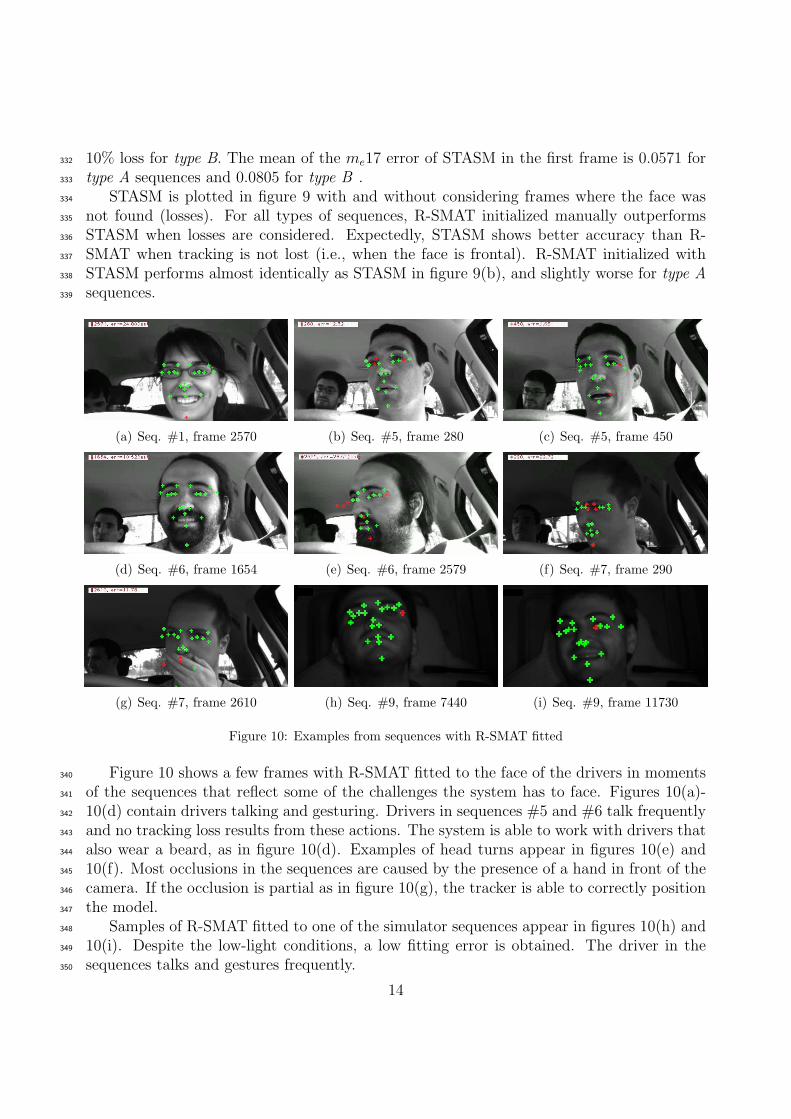
Figure 10: Examples from sequences with R-SMAT fitted
Figure 10 shows a few frames with R-SMAT fitted to the face of the drivers in moments340
of the sequences that reflect some of the challenges the system has to face. Figures 10(a)-341
10(d) contain drivers talking and gesturing. Drivers in sequences #5 and #6 talk frequently342
and no tracking loss results from these actions. The system is able to work with drivers that343
also wear a beard, as in figure 10(d). Examples of head turns appear in figures 10(e) and344
10(f). Most occlusions in the sequences are caused by the presence of a hand in front of the345
camera. If the occlusion is partial as in figure 10(g), the tracker is able to correctly position346
the model.347
Samples of R-SMAT fitted to one of the simulator sequences appear in figures 10(h) and348
10(i). Despite the low-light conditions, a low fitting error is obtained. The driver in the349
sequences talks and gestures frequently.350
14

Figures 11 and 12 plot the error for R-SMAT and STASM for sequences #6 and #7.351
Dots on the STASM curve mark keyframes where the face was not found. A case of quick352
illumination change, due to shadows of trees by the road is found in sequence #6 around353
frame 1400. A R-SMAT track loss can be observed around frame 2400 of the latter sequence,354
due to a total occlusion of the face. Figure 12 also shows that fitting error is higher during355
head turns, but in most cases track is not lost.356
Figure 11: Error plots for STASM and R-SMAT in sequence #6
Figure 12: Error plots for STASM and R-SMAT in sequence # 7
4.4. Timings357
One of the most important requirements for R-SMAT is for it to run in real-time. Table358
2 summarizes the average execution speed for R-SMAT in frames per second, for some359
representative configurations. The worst frame processing times are close to the limit, but360
15

these are extreme cases that occur infrequently. Processing times for STASM are also361
included for comparison. STASM executes the whole initialization process for each frame,362
and does not use the position found in the previous frame. This would result in a shorter363
search time.364
Configuration Mean (fps) Sdv (fps) Worst frame (fps)
R-SMAT 112.56 32.80 36.86STASM 2.17 0.13 1.96
Table 2: Execution time of R-SMAT and STASM in frames per second
The tests were run on a Xeon 2.2 GHz, running GNU/Linux, with GCC 4.2 as compiler.365
Multi-threading was not used and compiler optimizations were disabled (-O0). Times on366
the table refer to the actual tracking and the tracking loss detection, and do not consider367
time employed in the display of results, loading of data and saving results to the hard drive.368
5. Conclusions and future work369
This paper has presented a face tracking method based on automatic appearance mod-370
eling, to be used as part of a driver monitoring application.371
Monitoring a driver with computer vision is a complex task, and proper performance372
evaluation of a method requires a comprehensive set of test data. A new video dataset373
(RS-DMV) has been created, comprised of sequences recorded in a real scenario, and in a374
truck simulator in low light conditions. In the first set of sequences, subjects were asked to375
drive a vehicle at the University campus. Drivers in the simulator were fully awake, and were376
presented with dangerous situations that would highlight distractions. RS-DMV dataset has377
been used to test the methods in this paper, and is freely available for research purposes.378
The proposed face tracking method is an active model. The shape model is built offline379
from handmarked data, and Huber fuction is used for fitting. The texture model is created380
online using incremental clustering, in a similar fashion to SMAT. We have presented and381
alternative incremental clustering algorithm, which addresses some of the weaknesses of382
the SMAT proposal. The improvements of R-SMAT over the original SMAT have been383
evaluated, and the performance of R-SMAT and STASM has been compared on the sequences384
in RS-DMV. R-SMAT is able to process more than 100 frames per second, and obtains similar385
accuracy to STASM .The source code of R-SMAT is available from the authors.386
Future work will explore ways to make R-SMAT fully autonomous by improving the387
incremental shape model. Texture clustering has shown to be reliable, but better techniques388
to remove outliers from the model are needed. Including a multi-scale approach to appear-389
ance modeling and model fitting would be of help in other scenarios where the size of the390
face changes noticiably. The R-SMAT has been used to track and model faces in this paper,391
but can be extended to other deformable objects. The RS-DMV dataset will be extended392
with more sequences, more drivers and more diverse scenarios. Finally, the R-SMAT is to393
be made part of a driver monitoring system.394
16

Acknowledgments395
The authors would like to thank Pedro Jimenez, Ivan Garcıa and Noelia Hernandez of396
RobeSafe for their work in recording the sequences, Sebastian Bronte for his help in marking397
the images, as well as the drivers that participated. The outdoor recordings were made398
under project MOVI2CON (TRA2005-08529-C02-02) and the simulator recordings under399
CABINTEC project (PSE-370100-2007-2). This work was supported in part by the Spanish400
Ministry of Science and Innovation under DRIVER-ALERT Project (TRA2008-03600), and401
Comunidad de Madrid under project RoboCity2030 (S-0505/CPI/000176). J. Nuevo was402
working under a researcher training grant from the Education Department of the Comunidad403
de Madrid and the European Social Fund.404
[1] R. Dowson, N.D.H.; Bowden, Simultaneous modeling and tracking (SMAT) of feature sets, in: IEEE405
Conference on Computer Vision and Pattern Recognition 2005, Vol. 2, 2005, pp. 99–105.406
[2] S. Milborrow, F. Nicolls, Locating facial features with an extended active shape model, in: ECCV,407
2008, pp. 504–513, http://www.milbo.users.sonic.net/stasm.408
[3] T. A. Dingus, S. Klauer, V. L. Neale, A. Petersen, S. E. Lee, J. Sudweeks, M. A. Perez, J. Hankey,409
D. Ramsey, S. Gupta, C. Bucher, Z. R. Doerzaph, J. Jermeland, R. Knipling, The 100-car naturalistic410
driving study, Tech. rep., Virginia Tech Transportation Institute, NHTSA (Apr. 2006).411
[4] A. Kircher, M. Uddman, J. Sandin, Vehicle control and drowsiness, Tech. Rep. VTI-922A, Swedish412
National Road and Transport Research Institute (2002).413
[5] Volvo Car Corp., Driver alert control, http://www.volvocars.com (2008).414
[6] DaimerAG, Attention assist, http://www.daimler.com (Jun. 2009).415
[7] H. Ueno, M. Kaneda, M. Tsukino, Development of drowsiness detection system, in: Proceedings of416
Vehicle Navigation and Information Systems Conference, 1994, pp. 15–20.417
[8] E. Murphy-Chutorian, M. Trivedi, Head pose estimation in computer vision: A survey, IEEE Trans.418
Pattern Anal. Mach. Intell. 31 (4) (2009) 607–626. doi:10.1109/TPAMI.2008.106.419
[9] P. Smith, M. Shah, N. da Vitoria Lobo, Determining driver visual attention with one camera, IEEE420
Trans. Intell. Transp. Syst. 4 (4) (2003) 205–218.421
[10] J. Wu, T. Chen, Development of a drowsiness warning system based on the fuzzy logic images analysis,422
Expert Systems with Applications 34 (2) (2008) 1556–1561.423
[11] Y. Matsumoto, A. Zelinsky, An algorithm for real-time stereo vision implementation of head pose and424
gaze direction measurements, in: Procs. IEEE 4th Int. Conf. Face and Gesture Recognition, 2000, pp.425
499–505.426
[12] T. Victor, O. Blomberg, A. Zelinsky, Automating the measurement of driver visual behaviours using427
passive stereo vision, in: Procs. Int. Conf. Series Vision in Vehicles VIV9, Brisbane, Australia, 2001.428
[13] M. Kutila, Methods for Machine Vision Based Driver Monitoring Applications, Ph.D. thesis, VTT429
Technical Research Centre of Finland (2006).430
[14] T. D’Orazio, M. Leo, C. Guaragnella, A. Distante, A visual approach for driver inattention detection,431
Pattern Recognition 40 (8) (2007) 2341–2355.432
[15] Seeing Machines, Driver state sensor, http://www.seeingmachines.com/dss.html (Aug. 2007).433
[16] SmartEyeAG, AntiSleep, www.smarteye.se (2009).434
[17] Smart Eye AB, Image capturing device with reflex reduction, Patent, EP 1349487B1 (Dec. 2001).435
[18] Q. Ji, Z. Zhu, P. Lan, Real-time nonintrusive monitoring and prediction of driver fatigue, IEEE Trans.436
Veh. Technol. 53 (4).437
[19] L. M. Bergasa, J. Nuevo, M. A. Sotelo, R. Barea, E. Lopez, Real-time system for monitoring driver438
vigilance, IEEE Trans. Intell. Transp. Syst. 7 (1) (2006) 1524–1538.439
[20] M. Yang, D. Kriegman, N. Ahuja, Detecting faces in images: a survey, IEEE Trans. Pattern Anal.440
Mach. Intell. 24 (1) (2002) 34–58. doi:http://doi.ieeecomputersociety.org/10.1109/34.982883.441
[21] P. Belhumeur, J. Hespanha, D. Kriegman, Eigenfaces vs. fisherfaces: Recognition using class specific442
17

linear projection, IEEE Trans. Pattern Anal. Mach. Intell. 19 (7) (1997) 711–720, special Issue on Face443
Recognition.444
[22] J. M. Buenaposada, E. Munoz, L. Baumela, Recognising facial expressions in video sequences, Pattern445
Analysis and Applications 11 (1) (2008) 101–116.446
[23] G. D. Hager, P. N. Belhumeur, Efficient region tracking with parametric models of geom-447
etry and illumination, IEEE Trans. Pattern Anal. Mach. Intell. 20 (10) (1998) 1025–1039.448
doi:http://dx.doi.org/10.1109/34.722606.449
[24] J. M. Buenaposada, E. Munoz, L. Baumela, Efficiently estimating facial expression and illumination in450
appearance-based tracking, in: Proc. British Machine Vision Conference, Vol. 1, 2006, pp. 57–66.451
[25] F. Jurie, M. Dhome, Hyperplane approximation for template matching, IEEE Trans. Pattern Anal.452
Mach. Intell. (2002) 996–1000.453
[26] S. Baker, I. Matthews, Equivalence and efficiency of image alignment algorithms, in: IEEE Computer454
Society Conference on Computer Vision and Pattern Recognition, Vol. 1, 2001, pp. 1090–1097.455
[27] T. Cootes, C. Taylor, D. Cooper, J. Graham, Active Shape Models-Their Training and Application,456
Computer Vision and Image Understanding 61 (1) (1995) 38–59.457
[28] I. Dryden, K. Mardia, Statistical Shape Analysis, John Wiley & Sons, 1998.458
[29] T. F. Cootes, G. J. Edwards, C. J. Taylor, Active appearance models, IEEE Trans. Pattern Anal.459
Mach. Intell. 23 (2001) 681–685.460
[30] B. Lucas, T. Kanade, An iterative image registration technique with an application to stereo vision,461
in: International Joint Conference on Artificial Intelligence, Vol. 3, 1981, pp. 674–679.462
[31] A. Jepson, D. Fleet, T. El-Maraghi, Robust Online Appearance Models for Visual Tracking, IEEE463
Trans. Pattern Anal. Mach. Intell. (2003) 1296–1311.464
[32] Z. Yin, R. Collins, On-the-fly Object Modeling while Tracking, in: Computer Vision and Pattern465
Recognition, 2007. CVPR’07. IEEE Conference on, 2007, pp. 1–8.466
[33] R. Collins, Y. Liu, M. Leordeanu, Online Selection of Discriminative Tracking Features, IEEE Trans.467
Pattern Anal. Mach. Intell. (2005) 1631–1643.468
[34] S. Avidan, Ensemble Tracking, IEEE Trans. Pattern Anal. Mach. Intell. (2007) 261–271.469
[35] H. Grabner, H. Bischof, On-line boosting and vision, in: Proc. CVPR, Vol. 1, 2006, pp. 260–267.470
[36] M. Pham, T. Cham, Online Learning Asymmetric Boosted Classifiers for Object Detection, in: Com-471
puter Vision and Pattern Recognition CVPR, 2007, pp. 1–8.472
[37] J. Pilet, V. Lepetit, P. Fua, Real-time non-rigid surface detection, in: IEEE Conference on Computer473
Vision and Pattern Recognition 2007, San Diego, CA, 2005, pp. 822–828.474
[38] I. Matthews, T. Ishikawa, S. Baker, The Template Update Problem, IEEE Trans. Pattern Anal. Mach.475
Intell. (2004) 810–815.476
[39] S. Segvic, A. Remazeilles, F. Chaumette, Enhancing the point feature tracker by adaptive modelling of477
the feature support, in: European Conf. on Computer Vision, ECCV’2006, Vol. 3952 of Lecture Notes478
in Computer Science, Graz, Austria, 2006, pp. 112–124.479
[40] D. Cristinacce, T. Cootes, Feature Detection and Tracking with Constrained Local Models, in: 17th480
British Machine Vision Conference, 2006, pp. 929–938.481
[41] L. Bergasa, J. Buenaposada, J. Nuevo, P. Jimenez, L. Baumela, Analysing Driver’s Attention Level482
using Computer Vision, in: Intelligent Transportation Systems. ITSC 2008. 11th International IEEE483
Conference on, 2008, pp. 1149–1154.484
[42] N. Dowson, R. Bowden, N-tier simultaneous modelling and tracking for arbitrary warps, in: Proc. of485
the 17th British Machine Vision Conference. British Machine Vision Association, Vol. 1, 2006, p. 6.486
[43] J. Hartigan, Clustering Algorithms, John Wiley & Sons, Inc. New York, NY, USA, 1975.487
[44] H. Spath, V. Bull, Cluster analysis algorithms for data reduction and classification of objects, Ellis488
Horwood, 1980.489
[45] R. Gross, I. Matthews, S. Baker, Generic vs. person specific active appearance models, Image and490
Vision Computing 23 (11) (2005) 1080–1093.491
[46] J. Gower, Generalized procrustes analysis, Psychometrika 40 (1) (1975) 33–51.492
[47] P. J. Huber, Robust Statistics, Wiley Series in Probability and Mathematical Statistics, Wiley-493
18

Interscience, 1981.494
[48] M. Rogers, J. Graham, Robust active shape model search, Lecture Notes in Computer Science (2002)495
517–530.496
[49] R. Gross, I. Matthews, S. Baker, Constructing and fitting active appearance models with occlusion, in:497
Proceedings of the IEEE Workshop on Face Processing in Video, 2004, p. 72.498
[50] Z. Zhang, Parameter estimation techniques: A tutorial with application to conic fitting, Image and499
vision Computing 15 (1) (1997) 59–76.500
[51] O. Jesorsky, K. Kirchberg, R. Frischholz, et al., Robust face detection using the haus-501
dorff distance, Proceedings of Audio and Video based Person Authentication (2001) 90–502
95http://www.bioid.com/downloads/facedb/.503
[52] P. Viola, M. Jones, Robust real-time face detection, International Journal of Computer Vision 57 (2)504
(2004) 137–154.505
19