Experiments with Face-To-Face Collaborative AR Interfaces
21
EXPERIMENTS WITH FACE-TO-FACE COLLABORATIVE AR INTERFACES. M. Billinghurst a , H. Kato b , K. Kiyokawa a,c , D. Belcher a , I. Poupyrev d a Human Interface Technology Laboratory, University of Washington, Box 352-142, Seattle, WA 98195, USA b Faculty of Information Sciences, Hiroshima City University, 3-4-1 Ozuka-Higashi, Asaminami-ku, Hiroshima 731-3194, Japan c Emergency Communication Section, Communications Research Laboratory, 4-2-1 Nukui-Kitamachi, Koganei, Tokyo 184-8795, Japan d Interaction Laboratory, Sony Computer Science Laboratory, 3-14-13 Higashi-Gotanda, Tokyo 141-0022, Japan ABSTRACT We describe a design approach, Tangible Augmented Reality, for developing face-to-face collaborative Augmented Reality (AR) interfaces. Tangible Augmented Reality combines Augmented Reality techniques with Tangible User Interface elements to create interfaces in which users can interact with spatial data as easily as real objects. Tangible AR interfaces remove the separation between the real and virtual worlds and so enhance natural face-to-face communication. We present several examples of Tangible AR interfaces and results from a user study that compares communication in a collaborative AR interface to more traditional approaches. We find that in a collaborative AR interface people use behaviors that are more similar to unmediated face-to-face collaboration than in a projection screen interface. 1 INTRODUCTION Computers are increasingly being used to support communication and collaboration. Although many researchers have explored how computers can be used to enhance remote collaboration there has been less work in providing support for face-to-face collaboration. This is particularly true for viewing and manipulating spatial data. Early attempts at supporting face-to-face collaboration were based around computer conference rooms. The Colab room at Xerox (Stefik 1987) used a network of workstations running distributed software applications designed to support brainstorming, document preparation, and other tasks for small group face-to-face meetings. However users who were collaborating on separate workstations, even if they were side by side, did not perform as well as if they were huddled around a single machine (Inkpen 1997). This is because the computer introduces an artificial separation between the task space and communication space, preventing people from being aware of the normal communication cues that are used in a face-to-face setting. 1
-
Upload
independent -
Category
Documents
-
view
0 -
download
0
Transcript of Experiments with Face-To-Face Collaborative AR Interfaces

EXPERIMENTS WITH FACE-TO-FACE COLLABORATIVE AR INTERFACES.
M. Billinghursta, H. Katob, K. Kiyokawaa,c, D. Belchera, I. Poupyrevd
a Human Interface Technology Laboratory, University of Washington,
Box 352-142, Seattle, WA 98195, USA b Faculty of Information Sciences, Hiroshima City University,
3-4-1 Ozuka-Higashi, Asaminami-ku, Hiroshima 731-3194, Japan c Emergency Communication Section, Communications Research Laboratory,
4-2-1 Nukui-Kitamachi, Koganei, Tokyo 184-8795, Japan d Interaction Laboratory, Sony Computer Science Laboratory,
3-14-13 Higashi-Gotanda, Tokyo 141-0022, Japan
ABSTRACT
We describe a design approach, Tangible Augmented Reality, for developing face-to-face collaborative Augmented Reality (AR) interfaces. Tangible Augmented Reality combines Augmented Reality techniques with Tangible User Interface elements to create interfaces in which users can interact with spatial data as easily as real objects. Tangible AR interfaces remove the separation between the real and virtual worlds and so enhance natural face-to-face communication. We present several examples of Tangible AR interfaces and results from a user study that compares communication in a collaborative AR interface to more traditional approaches. We find that in a collaborative AR interface people use behaviors that are more similar to unmediated face-to-face collaboration than in a projection screen interface.
1 INTRODUCTION
Computers are increasingly being used to support communication and collaboration. Although many researchers have explored how computers can be used to enhance remote collaboration there has been less work in providing support for face-to-face collaboration. This is particularly true for viewing and manipulating spatial data.
Early attempts at supporting face-to-face collaboration were based around computer conference rooms. The Colab room at Xerox (Stefik 1987) used a network of workstations running distributed software applications designed to support brainstorming, document preparation, and other tasks for small group face-to-face meetings. However users who were collaborating on separate workstations, even if they were side by side, did not perform as well as if they were huddled around a single machine (Inkpen 1997). This is because the computer introduces an artificial separation between the task space and communication space, preventing people from being aware of the normal communication cues that are used in a face-to-face setting.
1

One way of removing this artificial seam is by using Augmented Reality (AR) technology to overlay virtual imagery directly onto the real world. In this way the display space and communication space can become one. In the Studierstube project co-located users can view and manipulate virtual models while seeing each other in the real world, facilitating very natural face-to-face communication (Schmalsteig 1996). The AR2 Hockey work (Ohshima 1998) is also very similar. In this case two users wear see-through head mounted displays to play an AR version of the classic game of air hockey. Like Schmalsteig, they report that users are able to naturally interact and collaborate with each other. In earlier work we found that users prefer collaboration in an AR setting to an immersive virtual environment and can perform better on some tasks because they can see each other’s non-verbal cues (Billinghurst 1997). However, although AR interfaces provide a natural environment for viewing spatial data it is often challenging to interact with the virtual content.
Another approach for supporting seamless interaction is through Tangible User Interfaces (TUI) (Ishii 1997). In this case physical objects and ambient spaces are used to interact with digital information. Collaborative Tangible User Interface projects have been developed that use digitally enhanced real objects to support face-to-face collaboration or provide a tangible representation of remote collaborators. For example in the Triangles project several users can gather around a table and play with electronic triangular objects to compose poetry or interactive stories (Gorbet 1998).
Tangible interfaces are powerful because the physical objects used in them have properties that support easy manipulation. Physical objects are also integral to the face-to-face communication process. Brereton (2000) finds that the objects in the environment influence design thinking, and that designers actively seek out physical props to aid in face-to-face collaboration. Gav (1997) finds that people commonly use the resources of the physical world to establish a socially shared meaning. Physical objects support collaboration by their appearance, the physical affordances they have, their use as semantic representations, their spatial relationships, and their ability to help focus attention. Thus Tangible User Interfaces combine these properties with an intuitive interface for manipulating digital data.
However, displaying information in Tangible User Interface can be a challenge. It is difficult to dynamically change an object’s physical properties, so most information display is confined to image projection on objects or augmented surfaces. In those TUI that use three-dimensional graphics there is also often a disconnect between the task space and display space. In the Triangles work, visual representations of the stories are shown on a separate monitor distinct from the physical interface (Gorbet 1998). Presentation and manipulation of three-dimensional virtual objects on projection surfaces is difficult, particularly when trying to support multiple users each with independent viewpoints. Most importantly, because the information display is limited to a projection surface, users are not able to pick virtual images off the surface and manipulate them in three-dimensional space as they would a real object.
To overcome the limitations of the AR and TUI approaches and retain the benefits of physical objects in face-to-face collaboration we have been exploring an interface metaphor we call Tangible Augmented Reality (Tangible AR). In the next section we describe this in more detail and follow that by describing some sample Tangible AR interfaces for intuitive face-to-face collaboration. Next we present a detailed user study that compares communication behavior in a collaborative AR interface to more traditional face-to-face and screen based collaboration. Finally, we end the paper with a discussion of directions for future work.
2

2 TANGIBLE AUGMENTED REALITY
Tangible Augmented Reality interfaces are those in which each virtual object is registered to a physical object and the user interacts with virtual objects by manipulating the corresponding tangible objects. Thus Tangible AR combines the intuitiveness of Tangible User Interfaces with the enhanced display possibilities afforded by Augmented Reality. In the Tangible AR approach the physical objects and interactions are equally as important as the virtual imagery and provide a very intuitive way to interact with the AR interface. The intimate relationship between the real and virtual also naturally supports face-to-face collaboration.
This approach solves a number of problems. Tangible User Interfaces provide seamless interaction with objects, but may introduce a separation between the interaction space and display space. In contrast most AR interfaces overlay graphics on the real world interaction space and so provide a spatially seamless display. However they often force the user to learn different techniques for manipulating virtual content than from normal physical object manipulation or use a different set of tools for interacting with real and virtual objects.
A Tangible AR interface provides true spatial registration and presentation of virtual objects anywhere in the physical environment, while at the same time allowing users to interact with this virtual content using the same techniques as they would with a real physical object. So an ideal Tangible AR interface facilitates seamless display and interaction. This is achieved by using the design principles learned from TUI interfaces, including:
• • • • • • •
The use of physical controllers for manipulating virtual content. Support for spatial interaction techniques (such as using object proximity). Support for both time-multiplexed and space-multiplexed interaction. Support for multi-handed interaction. Matching the physical constraints of the object to the requirements of the interaction task. The ability to support parallel activity where multiple objects are being manipulated. Collaboration between multiple participants
Our central hypothesis is that AR interfaces that follow these design principles will naturally support enhanced face-to-face collaboration.
3 SAMPLE INTERFACES
We have tested the Tangible AR approach in a variety of prototype interfaces, including;
• Shared Space: A collaborative AR game designed to be used by complete novices • AR PRISM: An AR interface for geospatial visualisation.
Both of these projects were built on top of ARToolKit, a free open source software library we have developed for computer-vision based AR applications (Kato 1999, ARToolKit 2001). ARToolKit tracks camera position and orientation relative to a marked card and so can be used to exactly overlay virtual images on real world objects, making it ideal for developing Tangible AR interfaces.
3

3.1 Shared Space
The Shared Space interface was a game developed to explore how Tangible AR principles could be applied in an application that could be usable by novices. In this experience multiple users stood across a table from one another (fig. 1). On the table were marked cards that could be freely moved and picked up. Each of the users wore a lightweight head mounted display (HMD) with a video camera attached in which they can see a view of the real world. When users look at the cards they see three-dimensional virtual objects exactly overlaid on them. The goal of the game is to collaboratively match up the virtual models, by placing related models side by side. When users get a correct match the pair of models is replaced by an animation of the two objects (fig 2).
Figure 1: The Shared Space Application Figure 2: Proximity-based Virtual Object Interaction. Placing two related objects side by side plays an
animation of the objects interacting.
Although we have not conducted formal user studies with this interface, over 3,500 people have tried the Shared Space game. Users had no difficulty with the interface. They found it natural to pick up and manipulate the physical cards to view the virtual objects. Once they held a card in view and could see a virtual object, it was common to see people rotating the cards at all angles to see the virtual objects from different viewpoints. Since the matches were not obvious some users needed help from others at the table and players would often spontaneously collaborate with strangers who had the matching card they needed. They would pass cards between each other, and collaboratively view virtual objects and completed animations. By combining tangible object interaction with virtual image viewing we found that even young children could play and enjoy the game. Users did not need to learn any complicated computer interface or command set. The only instructions people needed to be given to play the game was to turn the cards over, to not cover the tracking patterns and to find objects that matched each other. After trying the experience 157 people filled out a short user survey. They were asked to answer the following questions on a scale of one to seven (1 = not very easily, 7 = very easily):
Q1: How easily could you play with other people? Q2: How real did the virtual objects seem to you (1 = not very real, 7 = very real)? Q3: How easily could you interact with the virtual objects?
Table 1 summarizes the results. As can be seen, users felt that they could very easily play with the other people and interact with the virtual objects. Both of these are significantly higher than the
4

expected average value of 4; the t-test value row showing the results from a one sample two-tailed t-test.
Q1 (n=132) Q2 (n=157) Q3 (n=157) Average 5.64 4.01 5.62
Std Dev. 1.19 1.20 1.20
t-test val. 11.20 0.05 12.04
P-value P < 0.0001 P = 0.96 P < 0.0001
Table 1: Shared Space Survey Results
Figures 3 and 4 show the complete results for questions one and three. Both graphs are skewed far to the right, showing that users felt that they could easily collaborate with others and interact with the virtual models.
Fig. 3. Ease of Collaboration with Others Fig. 4. Ease of Interaction with Virtual Objects
3.2 AR PRISM
The AR PRISM interface explored how Tangible AR techniques could be used to support face-to-face collaboration on a scientific visualization task. The application domain was geographic data visualization and the underlying idea was that multiple users gathered around a real map should be able to see and manipulate three-dimensional virtual geographic information superimposed on the map while seeing each other in the real world. This manipulation should be based on physical markers and tangible interaction techniques. To achieve this the interface combined the ARToolKit tracking technology with an overhead camera that could track object positions and hand gestures relative to a real map. Users stood around the real map looking at it through HMDs with small cameras attached. As the user moved their hand across the surface of the map in their HMD they saw a graphic overlay of longitude and latitude information for the location their hand was pointing at and icons representing data available at that point. If the user wanted to view some of the geological dataset they placed a terrain marker on the map (figure 5) and in their
5

HMD they would see a virtual terrain model of that location (figure 6). Users could then pick up the models, look at them from any angle, and pass them to each other.
Figure 5: Using AR PRISM
Figure 6: The view inside the Head Mounted Display. As a user places a tile over the real map, a virtual terrain model is shown at that location.
If the user wanted to see a new portion of the virtual terrain they simply moved the marker to a new map location, the system recognized the new location and swapped terrain models. The AR scene and real map were aligned so that features seen on the map could be seen in the three-dimensional virtual model overlaying the same map location. In addition to showing virtual terrain models we also implemented a “Sensor-Data” metaphor where other markers could be placed beside the virtual terrain marker to load additional data. For every grid location in the real map there was three-dimensional topographic information available, and for some locations there was also soil, hydrology and well information. Placing a soil tile beside the terrain model would cause the texture on the terrain model to change to show soil type information. Similarly, placing the well marker beside the terrain model would show sub-surface wells.
Although we have not conducted formal user studies with the AR PRISM interface, almost one hundred people have tried the software informally. These users generally found the software very easy to use and felt that being able to lift pieces of virtual terrain off the real map was a very compelling experience. Associating a virtual dataset with a physical object meant that this data was as easy to manipulate as the real object. They also liked the ability to see other users in the real world at the same time as seeing the AR model, and felt that this supported natural face-to-face collaboration. However they felt that the HMDs were encumbering and did not provide high enough resolution to clearly read the real map. More details about the AR PRISM interface can be found in (Hedley 2001).
4 COMPARATIVE USER STUDY
The two projects above and the work of other researchers have shown the value of AR for supporting face-to-face collaboration. However, much of this work is preliminary and has not been evaluated in rigorous user studies. Those studies that have been conducted have not compared communication behavior between AR and non-AR interfaces but have focused on other measures. For example, Kiyokawa (1999) has performed experiments that found that the collaborative AR interface transmitted gaze cues better than an immersive Virtual Environment. In addition, most of
6

these interfaces do not use real objects to support the face-to-face interaction, or are based around tangible user interface metaphors.
In this section we compare collaboration with an AR interface to a more traditional projection display and to unmediated face-to-face interaction. It is hoped that these user studies will both provide useful results for others to build on as well as give some guidance on the metrics that may be used in such comparative studies.
4.1 Background
When people collaborate around a table, the space between them is used for sharing communication cues such as gaze, gesture and non-verbal behaviors (Olson 2000). If the people are communicating about objects placed on the table then the task-space (the space containing the objects) is a subset of the communication space (Minneman 1996). The collaborators can see each other and the shared communication cues at the same time as the objects (figure 7).
However when users are collaborating in front of a desktop or projection screen they are often sitting side by side and their attention is focused on the screen space (figure 8). In this case the task space is part of the screen space, and may be separate from the interpersonal communication space. Thus we may expect collaborators to exhibit different communication behaviors when collaborating with a screen-based interface.
Figure 7: Face-to-face Collaboration Figure 8: Desktop Collaboration In this experiment we want to measure communication behaviors in a face-to-face collaborative task and use this as a baseline against which to compare AR technology and projection-based collaboration. AR technology can be used to create an interface in which users sitting across a table from one another can see each other at the same time as virtual objects in their midst. So we can compare collaboration in three different conditions:
FtF: Unmediated face-to-face collaboration AR: Augmented Reality face-to-face collaboration Proj: Projection screen-based collaboration
By considering the innate characteristics or affordances of each condition we can predict the impact on communication behaviors. The main differences between these conditions are in the viewpoints of the collaborators and the methods for object interaction (see table 2).
7
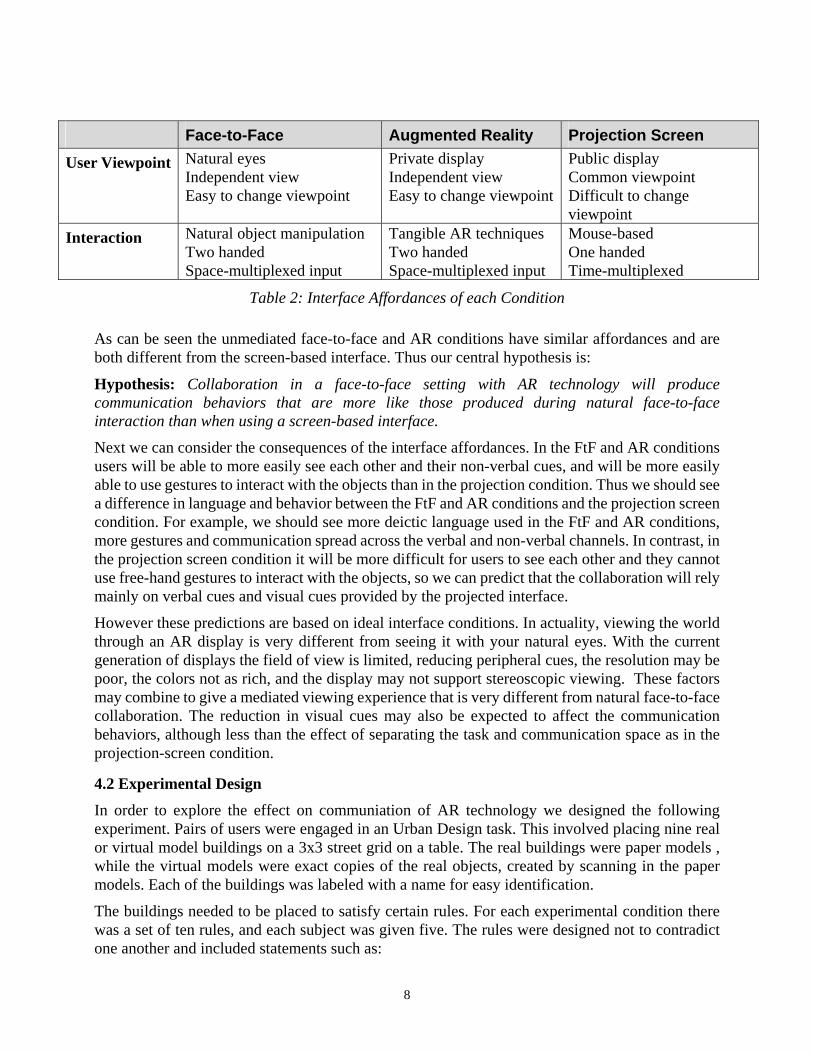
Face-to-Face Augmented Reality Projection Screen User Viewpoint Natural eyes
Independent view Easy to change viewpoint
Private display Independent view Easy to change viewpoint
Public display Common viewpoint Difficult to change viewpoint
Interaction Natural object manipulation Two handed Space-multiplexed input
Tangible AR techniques Two handed Space-multiplexed input
Mouse-based One handed Time-multiplexed
Table 2: Interface Affordances of each Condition
As can be seen the unmediated face-to-face and AR conditions have similar affordances and are both different from the screen-based interface. Thus our central hypothesis is:
Hypothesis: Collaboration in a face-to-face setting with AR technology will produce communication behaviors that are more like those produced during natural face-to-face interaction than when using a screen-based interface.
Next we can consider the consequences of the interface affordances. In the FtF and AR conditions users will be able to more easily see each other and their non-verbal cues, and will be more easily able to use gestures to interact with the objects than in the projection condition. Thus we should see a difference in language and behavior between the FtF and AR conditions and the projection screen condition. For example, we should see more deictic language used in the FtF and AR conditions, more gestures and communication spread across the verbal and non-verbal channels. In contrast, in the projection screen condition it will be more difficult for users to see each other and they cannot use free-hand gestures to interact with the objects, so we can predict that the collaboration will rely mainly on verbal cues and visual cues provided by the projected interface.
However these predictions are based on ideal interface conditions. In actuality, viewing the world through an AR display is very different from seeing it with your natural eyes. With the current generation of displays the field of view is limited, reducing peripheral cues, the resolution may be poor, the colors not as rich, and the display may not support stereoscopic viewing. These factors may combine to give a mediated viewing experience that is very different from natural face-to-face collaboration. The reduction in visual cues may also be expected to affect the communication behaviors, although less than the effect of separating the task and communication space as in the projection-screen condition.
4.2 Experimental Design
In order to explore the effect on communiation of AR technology we designed the following experiment. Pairs of users were engaged in an Urban Design task. This involved placing nine real or virtual model buildings on a 3x3 street grid on a table. The real buildings were paper models , while the virtual models were exact copies of the real objects, created by scanning in the paper models. Each of the buildings was labeled with a name for easy identification.
The buildings needed to be placed to satisfy certain rules. For each experimental condition there was a set of ten rules, and each subject was given five. The rules were designed not to contradict one another and included statements such as:
8

The CHURCH is next to the THEATER The FIRE HOUSE and the BANK are across the street. The CITY HALL is in the middle of town.
Splitting rules between the subjects forced them into collaborative problem solving behavior, focused on the task space.
Subjects were told that they could freely use speech and gesture to collaborate with their partner, but they could not show them the piece of paper that the rules were written on. They were given seven minutes to complete the task. Before beginning they were given several minutes to learn the real model buildings so they could easily recall what each building was.
Subjects were asked to arrange the same set of buildings under the following three conditions:
FtF/ Face-to-face interaction: The subjects sat on opposite sides of a table with a real street map marked on it (See figures 9,10). They were free to layout a set of nine real model buildings subject to the constraints mentioned above. After starting seated, subjects were free to stand and move around the table at will.
Fig. 9: Face-to-Face condition Fig. 10: Model buildings used
AR/ Augmented Reality Interaction: The subjects sat on opposite sides of a table with a real street map marked on it. They were given a set of nine cards with Japanese Kanji characters marked on them (see figure 11). They also wore DaeYang Cy-Visor headmounted displays with a small video camera attached (see figure 12). The Cy-Visor is a full color, biocular display, with SVGA (800x600 pixel) resolution and a 30-degree field of view. The displays and cameras were connected to a desktop computer running an ARToolKit application that overlaid virtual model buildings on the real cards (see figure 13). Kanji characters were chosen to ensure that users could not associate buildings with particular cards without seeing the buildings through the HMDs. Before beginning this condition subjects were given several minutes to use the interface so they were comfortable with viewing models in the head mounted display.
9

Figure 11: Tracking cards Figure 12: AR Condition Figure 13: AR View
Proj/ Projection Screen Interface: Subjects sat side-by-side at one end of a table facing a large projection screen (figure 14). On the table were two Polhemus Fastrak magnetic trackers, each attached to a piece of colored cardboard with a button mounted on it. These trackers were used to find the position and orientation of the card relative to a fixed magnetic source. Projected on the screen was an interface that allowed subjects to pick and place three-dimensional virtual models of buildings on a flat ground plane with a texture map of a street plan on it (figure 15). On the screen was shown two virtual rectangles (markers) corresponding to the subject’s real cardboard input devices. As they moved these pieces of cardboard in the real world the virtual markers moved in the same way.
To place the buildings subjects need to move the virtual marker to intersect with a virtual model. Clicking the button attached the building to the marker and enabled them to position the buildings wherever they liked on the street plan. In addition, a keyboard was placed on the table between the subjects. Using key presses either subject could rotate and zoom the virtual viewpoint over the street grid, enabling them to see the buildings from any vantage point. This interface was developed using Sense8’s WorldUp software (Sense8 2001). The same virtual models that were used in the AR condition were also used in this condition. Before beginning this condition subjects were given training on how to use the interface and practiced placing buildings and moving the camera viewpoint until they felt comfortable with the software.
10

Fig. 14: Projection Condition Fig. 15: The Projection Interface
An interface using two six degree of freedom input devices was chosen because it enabled the users to pick and place the buildings a lot easier than if they were using a traditional mouse based interface. Unlike a mouse-based interface it also supported simultaneous user input, enabling users to move and place the buildings in parallel. The application was developed during several months of informal user testing to ensure that users could interact with the virtual models in an intuitive manner.
A projection screen was used rather than a desktop monitor to ensure that both users could easily see the task space, and to create a greater separation between the task space and communication space. This condition duplicates the typical viewing conditions of most current conference rooms, and the separation between the task space (the projection screen), and the communication space (the users at the table) is clear.
A within-subjects design was used so that each pair of subjects experienced all three interface conditions. The conditions were presented in a counterbalanced manner to reduce order effects.
4.3 Experimental Measures
In order to fully understand the effect of technology on communication behaviors we used a range of different subjective and objective measures.
4.3.1 Subjective Measures After each condition subjects filled out a survey that asked them to rate how well they felt they could collaborate together, how easy the interface was to use and how well they could perceive each other’s non-verbal communication cues. After all the conditions we complete subjects were interviewed for ten to twenty minutes to record their impressions of the collaboration in each condition.
4.3.2 Objective Measures Communication and Collaboration Behaviors: Video and audio recordings was made of each of the conditions from two different cameras. Views from the head mounted displays were also captured. These tapes were then analyzed for communication and collaboration behaviors.
11

Complete transcriptions were made of the tapes so that various low-level speech and gesture behaviors could be recorded, including:
• • •
•
• •
The number of gestures The average number of words per phrase The number of speaker turns in the conversation
A speaker turn was defined as one user taking control of the conversation and speaking until either the other user interrupted, or he stoped speaking for more than three seconds. A gesture was defined as a significant hand motion that started and ended at a natural rest position.
Performance Time: From the video record, the amount of time spent solving the task was also recorded. Although users had a fixed time to complete the task (7 minutes), in practice it took far less time than this.
4.4 Results
The subjects in this experiment were 14 pairs of adults, 6 pairs of women and 8 pairs of men. Ages ranged from 21 year to 38 years old. Several of these pairs were later dropped from the study due to errors in data collection, so the final results were drawn from 12 pairs of subjects.
4.4.1 Performance The subjects were given seven minutes to complete the logic puzzle task and were told that it was important to satisfy all the ten rules. These factors mean that subjects typically went through the following phases on the way to a final solution:
Prep: The preparation phase before the first building is placed. This is typically used to talk about puzzle strategy, or to read each other the rules. Solve: Place the buildings and collaboratively solve the logic puzzle. Check: Reading and checking the rules against the placed buildings to make sure all the rules are satisfied.
After an initial short Prep phase the subjects spent most of their time in the Solve and Check phases, typically oscillating between the two as they placed buildings and then needed to check that the building rules were still satisfied. From the video records and the transcripts made we measured the amount of time each pair spent in each of these states.
There was a significant difference between puzzle solution time across conditions. As figure 16 shows, users were able to solve the puzzle much faster in the face-to-face condition. Using a one factor ANOVA on the solution times, we find a significant difference; F(2,33) = 10.53, P< 0.001. However there was no difference in checking times. Figure 17 shows a graph of the average time spent checking the solutions, an ANOVA test finds no significant difference between the checking times, F(2,33) = 1.84, P = 0.17.
12

0
50
100
150
200
250
300
350
FtF Proj AR
Tim
e (s
ec.)
0
20
40
60
80
100
120
FtF Proj AR
Tim
e (s
ec.)
Figure 16: Average Solving Time Figure 17: Average Checking Time
4.4.2 Communication Measures Complete transcriptions were made of the speech communication between pairs from each of the conditions. These were then coded for low and hi-level speech behaviors. The video of each pair of collaborators was also watched and coded for non-verbal and gestural behaviors. The communication measures collected included:
• The number and type of gestures made • The number of Deictic phrases spoken
• The average number of words per phrase • The number of speaker turns
4.4.2.1 Turn-taking From the video transcriptions the rate of speaker turns was measured (turns/second) and the average number of words per phrase. Table 3 shows these results. There was no difference in the average number of words per phrase across conditions. Using a one-factor ANOVA, F(2,30) = 1.37, P = 0.27. There was no difference in turn rate across conditions. A one-factor ANOVA gives F(2,30) = 0.23, P = 0.79.
Face-to-Face Projection Augmented Reality Average number of words/phrase
9.51 8.99 8.21
Average number of turns/second
0.30 0.31 0.32
Table 3: Average words per phrase and speaker turns per second. 4.4.2.2 Deictic The number of deictic phrases used were counted. These included phrases with the words “this”, “that” or “there” that could not be fully understood by considering the speech alone. Figure 18 shows the average percentage of deitic phrases out of the total number of phrases spoken by each subject in each condition. As can be seen, users in the AR and FtF conditions use more deictic phrases than in the Projection condition. The difference is statistically significant; a one-factor ANOVA test finds F(2,33) = 5.77, P < 0.01.
13

0%
5%
10%
15%
20%
25%
30%
FtF Proj AR
Figure 18: Percentage of phrases that are deictic phrases across all conditions.
4.4.2.3 Gestural Communication Patterns Along with counting the Deitic phrases used, we also counted the nunber of gestures made in the subject video for each condition. Gestures we categorized into one of four types:
POINT: A pointing gestures PICK: A gesture that involved picking or moving an object COLLAB: A collaborative gesture such as passing an object from one person to the other OTHER: Any other gesture.
Figure 19 shows the number of gestures made per minute in each condition. There is a large variance between subjects, but despite this we find a significant difference across all conditions for each of the four classes of gestures. Users on average made almost twice as many PICK gesture in the Face-to-Face condition than in the Projection or AR conditions. This is a highly significant difference; a one-factor ANOVA gives F(2,63)=14.91, P < 1x10⁻⁵. There is no difference in average number of gestures made between the Projection and AR conditions.
In the POINT case users also make more pointing gestures in the Face-to-Face condition than in the Projection or AR case. Again this is highly significant; F(2,63)=22.62, P < 1x10⁻⁷. However there is also a far higher number of pointing gestures made in the AR case than in the Projection condition. Using a paired one-tailed t-test we find that this is a significant difference; t(42) = -2.20, P(T<t) < 0.05.
Finally, there is also a significant difference across conditions in the number of collaborative gestures made per minute; a one-factor ANOVA giving F(2,63) = 24.51, P < 1x10⁻⁷. There is also no difference in number of collaborative gestures between the Face-to-Face and AR conditions. However this is not surprising as it was impossible to make collaborative gestures in the Projection condition; a building could only be picked up by one user at a time and could not be passed between users.
14

0.0
1.0
2.0
3.0
4.0
5.0
6.0
7.0
Other Pick Point Collab
FtFProjAR
Figure 19: Average number of gestures made per minute.
Another way to look at the gesture behavior is to factor in individual differences. Much of the variance in figure 19 could be accounted for by some subjects who naturally gesture more or less than others, regardless of any interface media. We can factor this out by calculating for each subject a ratio of gestures made in the Projection or AR condition to those made in the Face-to-Face condition and then average these ratios over all users. In effect this is considering the Face-to-Face condition as a baseline against which to compare the other conditions. If subjects make exactly the same amount of gestures in the Projection and AR conditions then the number of gestures will be 100% of the Face-to-Face conditon. When we do this we find the average gesture percentages shown in table 4. There are no results shown for the COLLAB gestures because there were none made in the Projection condition Using a one tailed t-test we again find that there are significantly higher percentage of pointing gestures made in the AR condition than the Projection condition. There are no significant differences between the other gesture types.. GESTURE PROJECTION AUGMENTED REALITY T Stat (n=22) P(T<t)
OTHER 33.3%, var = 35.5% 15.3%, var = 10.4% T = 1.10 P = 0.14
PICK 80.0%, var = 40.0% 68.3%, var = 17.7% T = 0.72 P = 0.24
POINT 27.9%, var = 6.2% 57.3%, var = 9.6% T = -3.45 P < 0.001
Table 4: Gestures as a percentage of gestures made in the Face-to-Face condition.
4.4.3 Subjective Measures After each conditon user filled out a survey on how they felt about the interface and how well they could collaborate with their partner. All of the questions were answered on a scale of one to seven, with one generally being “Not Very Easily” and seven being “Very Easily”. For example, one of the questions was:
15

Q6/ How easily could you move the buildings (1=not very easily, 7=very easily)?
1 2 3 4 5 6 7
Not Very Easily Very Easily
When asked the question “How easily could you work with the other person?” People felt that it was easiest to work together in the Face-to-Face condition. There was a significant difference in working together between conditions (figure 19). A one factor ANOVA produced an F value of F(2,69) = 5.96, P < 0.005. Users felt that the it was almost as difficult to work together in the AR and Projection conditions. Similarly, when asked “How easily could you understand your partner?”, users felt that it easier to understand each other in the face-to-face condition, while the Projection and AR conditions were as difficult to understand each other (figure 19). As before there was a significant difference in average values (A one factor ANOVA, F(2,69) = 6.31, P < 0.005).
When asked how easily they could tell where their partner was looking and pointing, users felt that perceiving these non-verbal cues was far easier in the face-to-face condition and there was little or no advantage in using the AR display compared to the Projection display condition (figure 20). A one factor ANOVA finds a highly significant difference in the average answers to both these questions. For How easily could you tell where the other person was looking, F(2,69)= 25.4, P<1x10⁻⁸, while for How easily could you tell where the other person was pointing, F(2,69)= 14.2, P<1x10⁻⁴.
0
1
2
3
4
5
6
7
8
Working Understanding
FtFProjAR
0
1
2
3
4
5
6
7
8
Looking Pointing
FtFProjAR
Fig 19: How easy to work together and understand each other (1=Not very easy, 7 = Very easy)
Fig. 20: How easy to recognize where your partner was looking and pointing.
Users were also asked how easy they felt it was to pick and move the buildings. As figure 21 shows, they felt that it was nearly as easy to pick and move the AR objects as it was the real models, and significantly easier than with the projection screen interface. In response to the question, How easily could you pick up the buildings, a one factor ANOVA gives (F(2,39)= 37.8, P<1x10⁻⁸). While for the question, How easily could you move the buildings, we find (F(2,39) = 28.4, P<1x10⁻⁷).
16

Pick and Move Survey Feedback
012345678
Pick Move
FtFProjAR
Figure 21: How easy it was to pick and move the buildings (1=not very easy, 7=very easy).
4.4.3.1 Comparative Rankings After all the conditions were completed the subjects were asked to rank the three conditions in order in response to the following questions:
Q1/ In which condition was it easiest to work together (1=easiest, 3= hardest)? Q2/ Which condition did you like the best (1=most enjoyable, 3=least enjoyable)? Q3/ In which condition did you understand your partner the most (1 = most, 3 = least )? Q4/ Which condition had the most intuitive interface (1 = most, 3 = least) ?
Table 5 shows the average response to each of these questions. As can be seen, on average the subjects felt that the Face-to-Face condition ranked the best for all four questions. For three of these questions (Q1, Q3, Q4) there was a significant difference between conditions. There is little difference between the Projection and Augmented Reality conditions.
Face-to-Face
Projection AR ANOVA F(2,66)
P Value
Ease of working together 1.09 2.39 2.53 56.07 P < 1x10-14
Liked the best 1.74 2.00 2.26 2.41 P = 0.10
Understanding your partner 1.09 2.30 2.61 60.86 P < 1x10-15
Most intuitive interface 1.04 2.61 2.35 78.19 P < 1x10-18
Table 5: ANOVA results for comparative ranking questions
4.4.4 Subject Comments After subjects completed the experiment they were interviewed for 15-20 minutes to capture their impressions of the experiment. In general, users felt that while the AR condition was enjoyable there were some usability issues that should be addressed. In ten out of fourteen interviews users mentioned perceptual problems with the AR interface. These included problems such as limited
17

field of view, low resolution and blurry imagery. Several users felt that the limited field of view forced them to consciously switch modes in the AR task, for example between reading the rules or placing buildings, or between collaborating with their partner and placing houses. An interesting comment was from two users who felt that the AR condition created a form of tunnel vision. One user felt that in the AR condition he was barely aware of himself.
In addition to the perceptual issues, many users commented on the limitations of the vision-based tracking. In half of the interviews the problem of the virtual buildings flicking in and out of view was mentioned (seven out of fourteen). Several people mentioned that this made the buildings feel less real, and that they were reluctant to point at virtual objects because this would make the buildings disappear. One person commented on how different virtual buildings appeared on the same real card. These factors taken together meant that users felt they had to “concentrate on seeing” in the AR case.
Despite these perception problems users felt that interaction with the virtual objects was easier in the AR condition that in the Projection condition. This was partly due to the tangible interaction metaphor used that made the virtual buildings seem more real. For example, one user said that:
“AR’s biggest limit was lack of peripheral vision. The interaction physically (trading buildings back and forth) as well as spatial movement was natural, it was just a little difficult to see. By contrast in the Projection condition you could see everything beautifully but interaction was tough because the interface didn’t feel instinctive.”
Another user said that “AR is more real since you are actually holding something just like the real thing.” In contrast, in eight out of the fourteen interviews subjects mentioned the difficulty of interacting with objects in the Projection condition. For some people this was because of the mouse like interface used, while in six interviews people mentioned how their hands kept on bumping into their collaborator’s hands. Some subjects said that this was due to the difficulty of seeing their real hands while focusing on the projection screen in front of them, highlighting a limitation of the separation of the task and communication space.
Another factor that was commented on was the difference in viewpoints between the conditions. In seven interviews subjects said that in the face-to-face condition they were able to make eye contact and see the gaze direction of their partner sitting across the table. However in the AR condition the narrow field of view and bulky display made it impossible to see gaze direction. In both the AR and Face-to-Face conditions the subjects said that most of their attention was focused on the task space between them, and they felt that they could see the gestures that were being made. In two of the interviews subjects talked about how having different viewpoints made them feel that they were working independently, or as one person put it “working solo together”. This was not the case with the projection condition. Some users commented that sharing the same viewpoint in the projection condition helped performance because they felt that they were working toward the same goal, and in four of the interviews subjects said that they did not need to see the gaze of their collaborator because they were looking at the scene from the same viewpoint. Others felt that not facing their partner made the Projection condition the most difficult to collaborate in. For example one subject wrote:
“The AR condition was better than the Projection condition because I could point and see my partner and where she pointed.”
18

4.5 Discussion
These results partially validate our intial hypothesis. In their deictic speech patterns there was no difference between the Face-to-Face and AR conditions, and their pointing behavior in the AR condition was more similar to the Face-to-Face condition than the Projection condition. However, the performance in the AR conditon was worse than the other two conditons and show that subjectively the users did not feel that the AR and Face-to-Face conditions are very similar.
The tangible interface metaphor seems particularly successful. Even though they were hampered by the AR display affordances, users felt that they could pick and move objects as easily in the AR condition as in the Face-to-Face condition and far more easily than the Projection condition. This allowed them to easily pass objects betweeen each other resulting in the same number per minute of collaborative gestures in the AR and Face-to-Face conditions.
The perceived difference between the AR condition and other two conditions can be explained by the reduced perceptual cues supported by current AR technology. For example, even though subjects were sitting across the table from one another, in the AR case they had no peripheral vision, making it significantly more difficult for them to perceive when their partner was looking at them. It is encouraging that even with reduced perceptual cues subjects are exhibiting behaviors in the AR case that are similar to unmediated Face-to-Face collaboration and significantly different from traditional interfaces. It is anticipated that higher resolution AR displays with a larger field of view will produce results even more similar to unmediated Face-to-Face collaboration.
5 CONCLUSIONS
In this paper we have advocated a new approach for face-to-face collaboration based on a Tangible Augmented Reality metaphor. As our prototype systems have shown, by combining TUI and AR design principles we can develop interfaces that naturally support face-to-face collaboration and spatial data manipulation. The results from the more detailed user study are encouraging, particularly with how easily users feel it is to manipulate the virtual objects and with some of their communication behaviors. However there is still a large amount of work that needs to be done to compare how collaboration with these types of interfaces is different from more traditional computer supported tools. In this paper we have focused on object-centered collaboration where users are actively engaged in working together. However past work on teleconferencing has found that negotiation and conversational tasks are even more sensitive to differences between communication media. We need to conduct further experiments where object manipulation is a small part of the task at hand. The results from this experiment show the impact of interface form factor on collaboration. Using a head mounted display to show AR content made many users feel distanced from their collaborator and severely reduced their perceptual cues. However there are other display form factors that could be used such as handheld or flat panel displays. These may restore some of the peripheral cues lost with HMDs. For example, with a handheld LCD display the user has a small AR window into the real world and would easily be able to see their collaborator across the top of the display as well as AR content on the display. We need to conduct follow-on experiments to measure the effect of display form factor. In this work not only did we reduce perceptual cues by removing peripheral vision, but the AR displays were also showing a biocular rather than stereoscopic view of the real world. Since this task involved close-in object manipulation the lack of stereo would have made it more difficult to
19

pick up and move objects. This may also explain why users across the table appeared to be flat and more distant. We need to conduct further experiments where we compare stereo versus non-stereo and video see-through versus optical see-through displays.
Finally, in the future we intend to explore how Tangible AR interfaces can be combined with projective technology and normal desktop displays. One of the greatest benefits of Augmented Reality interfaces is that they can be seamlessly be combined with other more traditional interface technology and existing workplace displays. However there are a large number of research questions that need to be answered beore before truely useful hybrid interfaces can be developed.
6 ACKNOWLEDGEMENTS This study was partially supported and monitored by the Advanced Research and Development Activity (ARDA) and the National Imagery and Mapping Agency (NIMA) under contract Number NMA201-01-C-0006.
7 REFERENCES
ARToolKit (2001) ARToolKit website: http://www.hitl.washington.edu/artoolkit/
Billinghurst, M., Weghorst, S., Furness, T. (1998) Shared Space: An Augmented Reality Approach for Computer Supported Cooperative Work. Virtual Reality : Research, Development and Application, 1998.
Brereton, M., McGarry, B. (2000) An Observational Study of How Objects Support Engineering Design Thinking and Communication: Implications for the design of tangible media. In Proceedings of CHI 2000, April 1-6, 2000, The Hague, The Netherlands. ACM Press, 2000.
Gav, G., Lentini, M. (1997) Use of Communication Resources in a Networked Collaborative Design Environment. http://www.osu.edu/units/jcmc/IMG_JCMC/ResourceUse.html
Gorbert, M. G., Orth, M., Ishii, H. (1998) Triangles: Tangible Interface for Manipulation and Exploration of Digital Information Topography. In Proceedings of CHI 98. Los Angeles, CA, USA. ACM Press, 1998, pp. 49-56.
Inkpen, K. (1997) Adapting the Human Computer Interface to Support Collaborative Learning Environments for Children. PhD Dissertation, Dept. of Computer Science, University of British Columbia, 1997.
Ishii, H., Ullmer, B. (1997) Tangible Bits: Towards Seamless Interfaces between People, Bits and Atoms. In proceedings of CHI 97, Atlanta, Georgia, USA, ACM Press, 1997, pp. 234-241.
Kato, H., Billinghurst, M., Asano, M., Tachibana, K. (1999) An Augmented Reality System and its Calibration based on Marker Tracking, Transactions of the Virtual Reality Society of Japan, Vol.4, No.4, pp.607-616, 1999
Kiyokawa, K, Takemura, H., Yokoya, N., "A Collaboration Supporting Technique by Integrating a Shared Virtual Reality and a Shared Augmented Reality", Proceedings of the IEEE International Conference on Systems, Man and Cybernetics (SMC '99), Vol.VI, pp.48-53, Tokyo, 1999.
Minneman, S., Harrison, S (1996) A Bike in Hand: a Study of 3-D Objects in Design. In Analyzing Design Activity, N. Cross, H., Christiaans, K. Dorst (Eds), J. Wiley, Chichester, 1996.
20

21
Ohshima, T., Satoh, K., Yamamoto, H., and Tamura, H. AR2 Hockey system:A collaborative mixed reality system. Trans. VRSJ, vol.3, no.2, pp.55-60, 1998.
Olson, G.M., Olson, J.S., (2000) Distance Matters. Human Computer Interaction, 2000, Vol. 15, pp. 139-178.
Schmalsteig, D., Fuhrmann, A., Szalavari, Z., Gervautz, M., (1996) Studierstube - An Environment for Collaboration in Augmented Reality. In CVE ’96 Workshop Proceedings, 19-20th September 1996, Nottingham, Great Britain.
Sense8 (2001) Sense8 website: http://www.sense8.com/
Stefik, M., Foster, G., Bobrow, D., Kahn, K., Lanning, S., Suchman, L. (1987) Beyond the Chalkboard: Computer Support for Collaboration and Problem Solving in Meetings. In Communications of the ACM, January 1987, Vol 30, no. 1, pp. 32-47.