Fabrication and Validation of Rapid Test for Monitoring Ammonium Water Quality.
41
Fabrication and Validation of Rapid Test for Monitoring Ammonium Water Quality. Hossam E.M. Sayour Biomedical chemistry unit, Dept. of Chemistry and Nutritional Deficiency Disorders, Animal Health Research Institute,12618 Dokki, Gizza, Cairo, Egypt Abstract: A rapid, field, equipment-free and micro- colorimetric assay that are based on a standard 96-well micro-titer plate format and color matching that simplify the quantification of total ammonium/ammonia was proposed. Rapid analysis of such parameters in aquatic systems is essential for monitoring and maintaining both healthy aquatic environments and fish stocks in aquacultures. Monitoring of municipal and industrial wastewater facilities to comply with local, state or federal water quality effluent regulations for total ammonium/ammonia of certain threshold limits are highly recommended. Traditional techniques for quantifying ammonium/ammonia concentrations often require laborious or expensive specialized equipment making these analyses difficult. An alternative colorimetric method to those traditional techniques that based on Berthelot’s reaction was investigated to optimize the reaction conditions for better performance characteristics. Both the reaction time (7-minute per sample) and the test cost were 1
-
Upload
independent -
Category
Documents
-
view
3 -
download
0
Transcript of Fabrication and Validation of Rapid Test for Monitoring Ammonium Water Quality.

Fabrication and Validation of Rapid Test for MonitoringAmmonium Water Quality.
Hossam E.M. SayourBiomedical chemistry unit, Dept. of Chemistry and Nutritional
Deficiency Disorders, Animal Health Research Institute,12618 Dokki,Gizza, Cairo, Egypt
Abstract:
A rapid, field, equipment-free and micro-
colorimetric assay that are based on a standard 96-well
micro-titer plate format and color matching that simplify
the quantification of total ammonium/ammonia was
proposed. Rapid analysis of such parameters in aquatic
systems is essential for monitoring and maintaining both
healthy aquatic environments and fish stocks in
aquacultures. Monitoring of municipal and industrial
wastewater facilities to comply with local, state or
federal water quality effluent regulations for total
ammonium/ammonia of certain threshold limits are highly
recommended. Traditional techniques for quantifying
ammonium/ammonia concentrations often require laborious
or expensive specialized equipment making these analyses
difficult. An alternative colorimetric method to those
traditional techniques that based on Berthelot’s reaction
was investigated to optimize the reaction conditions for
better performance characteristics. Both the reaction
time (7-minute per sample) and the test cost were
1

minimized (less than 0.5 L.E per sample). The proposed
method allow parallel multi-determination of small
sample volumes (50 µL), working range 0.5-10 ppm,
detection limit ≤0.1 ppm of total ammonium/ammonia in
both fresh water and brackish water of maximum salinity
of 40 parts per thousand, precision of at least 10% and
compares favorably with standard reference analytical
procedures upon performing test of validation. Routine
use of this method in the laboratory, aquaculture
associated with microalgae growth or wastewater streams
for monitoring total ammonium/ammonia concentrations
demonstrates feasibility, accuracy and highly
reproducibility among different users.
Keywords: field rapid test, micro-titer plate, visual,
ammonium kits, equipment free, aquaculture, water
quality.
Introduction:
Ammonia is one of the most typical of spoilage
products since it arises from a variety of sources common
to all biological tissues. It is produced by the action
of microorganism as well as endogenous enzymes through
de-amination of proteins and amino acids and though
breakdown of purines and various amines. Ammonia plays an
important part in the nitrogen cycle of many biological
and industrial processes as well as in shallow and
2
eutrophicated waters (. Ivančič and Degobbis, 1984;
Clinch et al, 1988; van Staden and Taljaard, 1997; Strauss et
al, 1991) and is one of the main components in many
industrial effluent streams.
The introduction of increasingly stringent
legislation on water quality has enhanced the need for
on-line analytical monitors (van Staden and Taljaard,
1997). In aquaculture control water quality includes all
physical, chemical and biological factors that influence
the beneficial use of water. Fish influence water quality
through processes like nitrogen metabolism and
respiration. Some water quality parameters are more
likely to be involved with fish losses such as dissolved
oxygen, temperature, salinity, ammonia, nitrite and
nitrate. Others, such as pH, alkalinity, hardness and
clarity affect fish, but usually are not directly toxic.
High concentrations of total ammonium/ammonia can
adversely affect growth and stocking density in a variety
of species. The toxic levels of un-ionised ammonia (UIA)
for short-term exposure usually are reported to lie
between 0.6 and 2 mg/l (Pillay, 1992; Gijzen et. al., 2004).
The lethal ammonia concentration for most warm water fish
is between 0.6–2.0 mg/L ammonia nitrogen (NH3-N). Tilapia
begins to die when unionized ammonia concentrations are
higher than 2.0 mg/L NH3-N. However, unionized ammonia
concentrations as low as 1.0 mg/L NH3-N will decrease
3
growth and performance in tilapia as reported before
(Riche and Garling, 2003). The acute toxicity of UIA to
Nile tilapia was measured in a 96-h static test. The
median lethal concentration (LC50) was 1.46 mg/L UIA at
24 and 48 h post-exposure, 1.33 mg/L at 72 h post-
exposure, and 0.98 mg/L at 96 h post-exposure (Evans et.
al., 2006). In general, NH3-N concentrations should be
held below 0.05 mg /L and total ammonia nitrogen (TAN)
concentrations below 1.0 mg/ L for long-term exposure
(Timmons et al. 2002; Isla, et. al., 2008). Consequently,
strategies have been developed to monitor and remove this
potentially harmful chemical.
Several procedures have been proposed for the
determination of the ammonium ion /ammonia (Ivančič and
Degobbis, 1984; Clinch et al, 1988; van Son et al, 1983). The
three spectrophotometric methods that appear to be used
almost universally are the indophenol blue method based
on Berthelot reaction (Babko and Pilipenko, 1976; Krug et
al, 1979; Aminot et al, 1997; Monliner-Martínez et al ,2005),
the gas diffusion/acid-base indicator procedure (Standing
Committee of Analysts, 1981) and the use of Nessler’s
reagent (Schmidt et al, 1984). Other methods include
titrations, potentiometric determinations (Yost, 2007),
the use of ammonia selective electrodes (Perry and
Phillips, 1995) and determination of ammonia using carbon
dioxide laser photocoustic spectroscopy.
4

Ammonia determination based on Berthelot reaction is
known to be a standard method in many institutions
(Swedish Standard Methods, 1976; Krug et al, 1979; United
States Environmental Protection Agency, 1983; American
Public Health Association, 2005) until today. Traditional
methods for quantifying ammonium ion /ammonia
concentrations typically use colorimetric based
techniques in conjunction with standard
spectrophotometers, which although precise and reliable,
often require laborious procedures or specialized
equipment making these analyses difficult. For example,
many of these classical manual techniques require large
sample and reagent volumes and each sample must be
processed separately (Strickl and Parsons, 1972, American
Public Health Association, 2005). Alternatively, more
modern techniques use flow injection or segmented flow
auto-analyzers to automate ammonium/ammonia analysis
process (Hager, et al, 1972; Woodward and Rees, 2001;
Yebra-Biurrun, 2009). But these instruments are expensive
and require specialized training to successfully operate.
Towards developing more streamlined alternatives, several
researchers have advanced 96-well microplate-based
ammonium/ammonia analyses techniques (Baudinet and
Galgani, 1991; Hernandez-Lopez and Vargas-Albores, 2003;
Laskov, et al, 2007; Poulin and Pelletier, 2007; Johnson,
et al, 2011). These techniques can greatly reduce sample
5

volume, have proven to be a quick, of relatively low-cost
alternative to conventional auto-analyzer techniques
because they speed up the analysis and do not require
expensive specialized equipment. But when small-scale
farmers control their aquacultures the cost of these
laboratory-based monitoring techniques that requiring
micro-titer plate reader will be still high. Moreover, in
critical situations where decisions have to be made in
the shortest possible time frame, the conventional way of
doing laboratory analysis is often unsatisfactory due to
the fact that by the time the analysis result is
available, the problem might have disappeared
[ammonium/ammonia within an aquaculture pond is
continuously changing “Pond Dynamics” and must be
understood and monitored if a pond system is to be
controlled effectively (Boyed, 1998)]
In such cases rapid field test kits can provide
waning alarm and immediate answers to the cause and
corrective control action can be made. A commercial lab-
fabricated rapid test colorimetric micro-titer plate
based, user-friendly, on-site, robust, equipment-free,
specific and semi-quantitative will be proposed,
fabricated and validated for screening water quality of
different sources. This proposed rapid field test for
monitoring ammonium/ammonia to judge the waters quality
(Fresh/brackish ponds in aquacultures and
6

surface/underground waters streams from different
sources) will be validated according to EURACHEM
Recommendation, United States Environmental Verification
Program and AOAC Performance Tested Methods Program
(EURACHEM, 1998; Unger-Heumann, 1996; Soler, 2006;
U.S.EPA ETV, 2008; AOAC, 2009).
Experimental:Materials:
Phenol, acetone, methyl alcohol and ammonium sulphate
supported by Merck. Sodium hypochlorite not less than 5%
chlorine of commercial grade was supported from local
markets. Sodium nitroprusside was supported by Prolabo,
France. Micro-titer flat bottomed plates were purchased
from bio-gene, Germany.
Reagents:
All regents are prepared according to previously reported
methods before (Koroleff, 1969; Babko and Pilipenko,
1976)
Instruments:
All pH measurements were performed on Jenway 3510
(UK). All colorimetric measurements were made with micro-
titer plate reader Dynatech MR5000 (USA) absorbance wasmeasured at 630 nm.
Technology Description:
7

The test kit is a field technology for determining
total NH4+ content in water samples. The test kit is self-
contained and does not require additional analysis
instruments. Analysis results are obtained in 7 minutes,
and used equipment is recyclable. The complete ammonia
NH4+/NH3 rapid test kit contains 96-well micro-titer plate
of 350 µL-reaction well, three reaction reagents droppers
(R1, R2, R3), 1-3 ml Pasteur- plastic dropper for watersample and a color scale comparison card. The color scale
comparison card for NH4+/NH3 rapid test kit reads 0.5 ppm,
1 ppm, 5 ppm and 10 ppm.. The limit of detection of the
test kit is 100 ppb for water samples .
Fabricated rapid test directions for use:The NH4
+/NH3 rapid test kit is a field technology for
determining total NH4+ content in water samples. An
instruction manual is included with each test kit.
1. In chosen well (A 1-12 to H 1-12), take one drop of
sample by Pasteur- plastic pipette.
2. Drop one drop from reagent (1), reagent (2) and (3);
respectively to each sample.
3. Shake the plate gently to avoid splash.
4. After seven minutes, put the plate on the colour scale
card to match sample color with colors correspond to
ammonium standards 0.5-10 ppm.
8

5. Whenever you need to re-test the validity of reagents,
1 ppm ammonium standard provided with the test by
carrying steps 1-4 using another clean Pasteur pipette.
6. Rinse many times the used plate and Pasteur pipettes
after testing to avoid erroneous results.
7. Hit the plate many times while inverted on a tissue
paper to repel water droplets outside the wells, and then
leave it to dry in inverted position.
Validation Test Design:
All preparation, calibration, and analyses were
performed according to the ammonia NH4+/NH3 rapid test
directions for use stated above. The test kit was verified
in terms of its performance where results were recorded
manually. The results from the ammonia NH4+/NH3 test kits
were compared with those from the indophenols blue reference
method (American Public Health Association, 2005) toquantitatively assess precision, accuracy, linearity, and
detection limit.
Multiple aliquots of performance test samples
(fresh/brakish ponds in aquacultures and
surface/underground waters and were analyzed to assess
precision. Two operators used multiple the ammonia NH4+/NH3
rapid tests in order to analyze all the samples, so it wasassumed that kit-to-kit variability was similar for both
9
operators. Consequently, qualitative observations could be
made on operator bias.
Matrix interference effects were assessed by
challenging the ammonia NH4+/NH3 test kit with performance
test samples of known ammonium concentrations containing
both low-level and high-level interferences. False positives
and negatives were evaluated relative to the recently
established 5 ppm maximum contaminant level and 0.5 ppm as
minimum contaminant level (safe limit) for ammonium in
majority of aquaculture ponds waters
Test Samples:
Three types of samples were used in the
verification test, as shown in Table 1: quality control
(QC) samples, performance test (PT) samples, and
environmental water samples. The QC and PT samples were
prepared from certified standards. The QC sample
concentrations for ammonium were targeted at that 0.5
ppm level as stated above in the matrix interference
effect. The PT samples were targeted to range from 10%
to 1,000% of that level, i.e., from 0.05 to 5 ppm. The
environmental water samples were collected from various
sources [fresh (Kafr El-Shiekh) / brackish of maximum
salinity 40 parts per thouthands (Qarun lake) ponds in
aquacultures, surface (Burulus lake) / underground (El-
Natron valley) waters]. All samples were analyzed using
the ammonia NH4+/NH3 test kits and a reference method.
10
Every tenth sample was analyzed twice by the reference
method to document the reference method’s precision. The
criterion in sampling rates is presented in table 1.
Results and discussion:
Effect of increasing phenate concentration on indophenols
formation:
The influence of phenate on the formation of
sensitized indophenols has been investigated using 1 ppm
ammonium, 0.6% sodium hypochlorite (Babko and Pilipinko,
1976) which represented short reaction time (20 min) and
0.0169% sodium nitroprusside at optimum pH (more than 12)
(Koroleff, 1969). The phenate concentration ranged
between 0.35-3.75% measured at arbitrary short 3 min.
time and room temperature 22-27°C. The results are shown
in fig.1 where maximum and constant absorbance of the
sensitized indophenols using 1.95- 3.75% thus, 1.95% of
phenate reagent was recommended for further
investigation. The result is in consistent with the fact
that the indophenols dye formed in presence of excess
phenol where ρ-aminophenol is formed first then it
further reacts with sodium hypochlorite to form
quinochloroimine in the second step. Finally
quinochloroimine reacts with the second molecule of
phenol to form indo phenol (Babko and Pilipinko, 1976).
11
Effect of increasing hypochlorite concentration onindophenols formation:
The effect of sodium hypochlorite on the formation of
sensitized indophenols has been investigated using 1 ppm
ammonium, 1.95% phenate and 0.0169% sodium nitroprusside
at optimum pH (more than 12). The sodium hypochlorite
concentration ranged between 0.01-2% measured at 3 min.
time and room temperature 22-27°C. The results are shown
in fig.2 where maximum and constant absorbance of the
sensitized indophenols using 1.25- 2 % thus, 1.25% of
hypochlorite reagent was recommended for the proposed
method. Ammonia determination was conducted according to
(Koroleff, 1969). Some modifications have been studied
such as adjustment of the reagent concentrations
suggested by Koroleff, the formation of indophenols blue
takes several hours at room temperature. The reaction can
be accelerated (i) by increasing the concentration of the
reagents as has been done in the majority of recent
procedures, (ii) by increasing the reaction pH to more than
12, (Scheiner, 1975), (iii) by increasing the reaction
temperature as in most automatic determinations and (iv) by
irradiation of samples with long-wave ultraviolet light
(Liddicoat et al., 1975). Babko and Pilipinko (1976)
previously concluded the maximum reaction conditions for
indophenols sensitization at room temperature 22-27°C and
20 min. reaction time which is coherent with our need for
12

ammonia rapid field test. Moreover, in previous studies
(Koroleff 1976; Baudinet and Galgani, 1991; Grasshoff,
1999; Hernandez-Lopez, 2003; Jonson 2011) 0.001- 0.068 %
sodium nitroprusside was used for color enhancement it
has no share in the indophenol formation reaction as
shown in (table 2). So a moderate concentration 0.0169%
sodium nitroprusside (Korokeff, 1969) will be
recommended; for the further investigations.
Calibration curves at different times:
Complete calibrations of ammonium concentration
ranges 0.5-10 ppm were carried out at different reaction
times to study the stability of indophenols formation at
the shortest time (fig.3). The calibration graph obtained
under optimum conditions given in the recommended
procedure adhered to Beer’s law up to 10 ppm of ammonium
after only 7 minutes. All these alternatives have been
studied it was found that a two-fold increase of the main
reagent concentrations (phenate and hypochlorite) is
advantageous as the reaction is completed in shortest
time ever. The reaction time proposed in this work (7
min.) is one-third shorter than the reaction time in
previous study (Babko and Pilipinko, 1976) without need
for either temperature control (at room temperature 22-
13

27°C) or irradiation for shortening reaction time
(Liddicoat et al., 1975).
Fabrication and evaluation of rapid field test for total
ammonium/ammonia monitoring in waters:
Instruments used for measuring device colors
include colorimeters or micro-titer plate reader, auto-
analyzers and spectrophotometers in addition
alternatively less expensive digital cameras and image
scanners. A simple experiment in which the principle of
absorbance may be demonstrated using digital color image
analysis of a photographed picture of solutions obtained
by a digital camera using a desktop scanner was published
before (Jansen et.al., 1998; Mathews et.al, 2004; Kohl et.al.,
2006). After scanning a standard 96-well micro-titer
plate, color gradations in the slots can be analyzed
quantitatively and be used for the estimation of enzyme
kinetics, binding assays or concentration determination.
Image analysis of the intensity of the complementary
color (blue) for each solution produced data that
conformed to the Beer–Lambert law.
Colorimetry is based on subjective visual
experiences - so called "color matching" (Sällström,
1998). Human trichromatic vision enables detection of
more than two million surface colors, wavelength
14
discrimination with precision <1 nm, and the unique
capacity to exploit color information for multiple
applications in myriad settings. A number of chemical
test kits can be bought that work according to the
principle of color matching. There are kits to test water
(e.g. in rivers, lakes, ponds and even swimming pools).
Gardeners use kits to test the quality of soil and some
kits are used in medical diagnosis, e.g. showing glucose
in urine which is a symptom of diabetes. The kits give
semi-quantitative results which mean that they give only
an approximate value. Although they give approximate
values but they fit to purpose. For example, universal
indicator solutions are mixtures of acid-base indicators
and their colour depends on pH. They can be used,
therefore, to find, very quickly, the approximate pH of a
solution (Sayour et. al., 2010). However, if a more exact
determination of the pH was needed, it should be
determined by using instruments.
Color matching sometimes gives only a “yes/no” answer
which can be entirely satisfactory in some instances, as
in the case of a pregnancy test or diagnosis of
infectious diseases. In addition these tests are cheap,
quick, easy to carry out and therefore more practical and
preferable, in certain cases, than other, more
sophisticated methods (Kenkel, 1994).
15

WHO recommends the screening infectious diseases or
food contaminants which are a leading cause of death in
developing countries by rapid test kits to avoid epidemic
crises even in the developed countries. The EPA’s
National Exposure Research Laboratory and its
verification organization partner, Battelle, operate the
Advanced Monitoring Systems (AMS) Center under
Environmental Technology Verification (ETV). The AMS
Center recently evaluated the performance of portable
analyzers based on sensors or biosensors, quick “smart”
test kits for pollutants in water purpose of meeting
legal requirements.
Small-scale farmers control their aquacultures the
cost of these laboratory-based monitoring techniques that
requiring micro-titer plate reader will be still high.
Moreover, in critical situations where decisions have to
be made in the shortest possible time frame, the
conventional way of doing laboratory analysis is often
unsatisfactory due to the fact that by the time the
analysis result is available, the problem might have
disappeared [ammonium/ammonia within an aquaculture pond
is continuously changing “Pond Dynamics” and must be
understood and monitored if a pond system is to be
controlled effectively (Boyed, 1998)]. In such cases
rapid screening field test kits can provide warning alarm
and immediate answers to the cause and corrective control
16
action can be made. Even in the laboratory the rapid
tests are suitable for checking plausibility, e.g. if a
mix- up of samples is suspected, they allow fast
clarification.
A commercial lab-fabricated rapid test colorimetric
micro-titer plate based, user-friendly, on-site, robust,
equipment-free, specific and very cheap is proposed for
determining concentrations of total ammonium/ammonia in
waters. The results of total ammonium/ammonia
concentrations are simply red visually by matching the
colors developed (according to above test directions for
use) on micro-titer plate by mounting it over color scale
card (image 1). For some field applications, visual
reading of the color of the reaction product in the wells
of the micro-titer plates is acceptable. Taking in
consideration that human trichromatic vision ability is
predicated on a normal complement of L, M and S cones
(Rabin, 2010). Hereditary color vision deficiency (CVD;
8% of males, 0.5% females) derives from a lack of L cones
(protanopia 1%) or M cones (deuteranopia 1%); or from a
cone spectral sensitivity shift (protanomaly: L shifted
toward M in 1%; deuteranomaly: M shifted toward L in 5%).
This why the choice calibration points on color scale
card should be sharp colors enough to be not confused and
misjudged. Two million surface colors and wavelength
discrimination (‹ 1 nm) in healthy persons can judge the
17

in between hues of colors corresponding to ammonium
concentrations even if they are not included in the color
scale card (Rabin, 2010; Ruitenberg, 1976).
This proposed rapid test is characterized by the
ease of multi-determination of 96 samples simultaneously
over other commercial available synonymous kits in the
markets which are used in sample by sample mode. The
applied concentration range (0.5-10 ppm of total
ammonium/ammonia) is covering most application fields for
water quality field monitoring (Fresh/marine ponds in
aquacultures and surface/underground waters). Moreover,
to the best of the author knowledge this proposed
equipment-free kit which is consuming the lowest both
sample and reagent volumes ever in addition to that the
fact that test kit needs only 7 minutes for the color
stability (shortest time ever) at room temperature 22-27
°C (no need for incubation) as shown in (table 2).
Validation of proposed rapid test kit for monitoring
waters of different sources:
According to EURACHEM Recommendations, United States
Environmental Verification Program and AOAC Performance
Tested Methods Program (EURACHEM, 1998; Unger-Heumann,
1996; Soler, 2006; U.S.EPA ETV, 2008; AOAC, 2009) the
proposed rapid test for total ammonium/ammonia will be
validated.
18

The validation will be performed according to criterion
of results of test samples stated before (table 1) for
both technical and non-technical operators and both QC,
PT and real samples. These results are presented in table
3 for both QC and PT while the real samples are presented
in table 4. The validation parameters are calculated
based on all data presented in both table 3, 4 and a
summary of qualitative accuracy results is presented in
table 5. Precision is evaluated in terms of relative
standard deviation (RSD) for both PT and QC samples where
RSD is found to equal 0%. The results for three of the
replicate sets were <0.5 ppm. The remaining replicate
sets for the non-technical operator had an RSD ranging
from 29 to 50%, and the remaining replicate set for the
technical operator had an RSD of 29%. For the freshwater
and brackish pond samples all results for two of the
replicate sets were <0.5 ppm. The remaining sets had an
RSD of 29 to 100% for the non-technical operator and 0 to
18% for the technical operator. The linearity of the
rapid test kit readings was assessed by means of a linear
regression of results against the reference method .
Rapid test kit for the non-technical operator, ppm = 0.90
(±0.086) x (reference, ppm) – 0.52 (±0.41) ppm, with r =
0.974, on the other hand for the technical operator, ppm
19
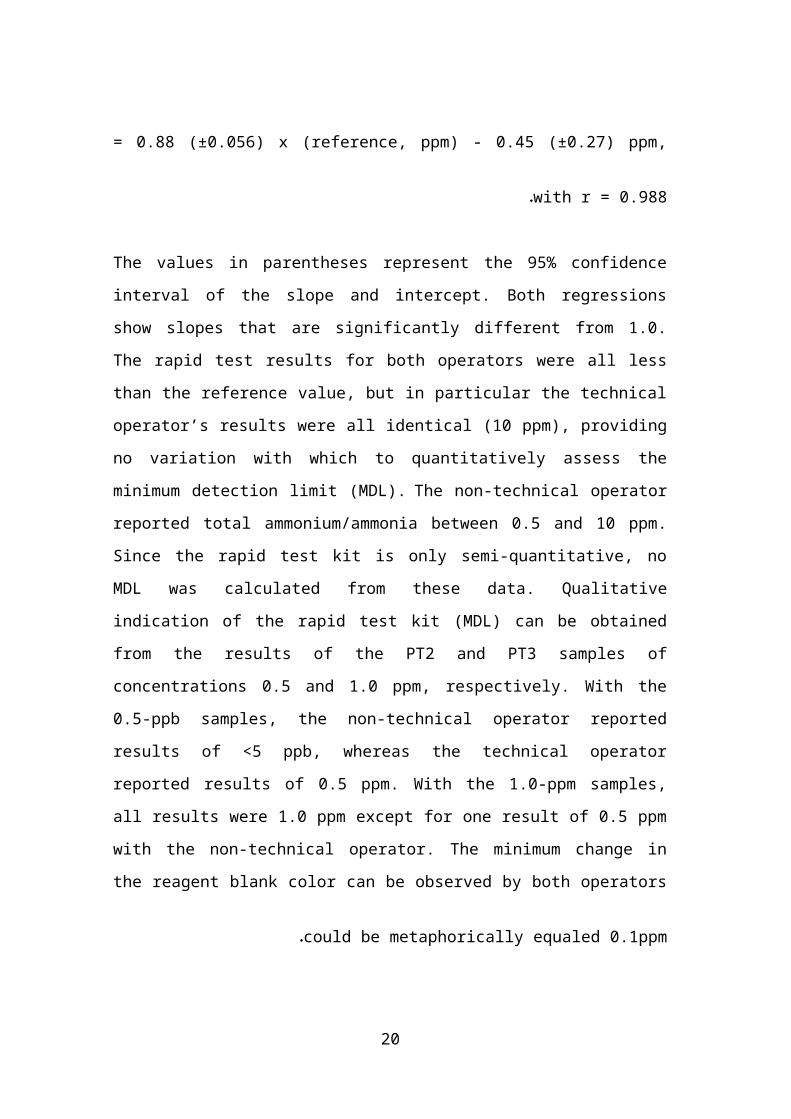
= 0.88 (±0.056) x (reference, ppm) - 0.45 (±0.27) ppm,
with r = 0.988.
The values in parentheses represent the 95% confidence
interval of the slope and intercept. Both regressions
show slopes that are significantly different from 1.0.
The rapid test results for both operators were all less
than the reference value, but in particular the technical
operator’s results were all identical (10 ppm), providing
no variation with which to quantitatively assess the
minimum detection limit (MDL). The non-technical operator
reported total ammonium/ammonia between 0.5 and 10 ppm.
Since the rapid test kit is only semi-quantitative, no
MDL was calculated from these data. Qualitative
indication of the rapid test kit (MDL) can be obtained
from the results of the PT2 and PT3 samples of
concentrations 0.5 and 1.0 ppm, respectively. With the
0.5-ppb samples, the non-technical operator reported
results of <5 ppb, whereas the technical operator
reported results of 0.5 ppm. With the 1.0-ppm samples,
all results were 1.0 ppm except for one result of 0.5 ppm
with the non-technical operator. The minimum change in
the reagent blank color can be observed by both operators
could be metaphorically equaled 0.1ppm.
20

Conclusion:
A rapid, field, equipment free and micro-
colorimetric assays that are based on a standard 96-well
micro-titer plate format and color matching that simplify
the quantification of total ammonium/ammonia with a
working linear range (0.5-10 ppm) was erased. Reaction
conditions of rapid test were optimized to give an ideal
rapid field test. The proposed rapid field test kit
showed fair validation parameters (accuracy, precision,
linearity and MLD) for different waters samples of
different sources upon using by both technical and non-
technical operators. This equipment-free technique offers
an alternative to standard commercial ammonium tests and
significantly decreases the cost (about 0.5 L.E per
sample) and time (7-min time test) of processing while
maintaining high precision and sensitivity.
In the future more rapid tests for other critical
parameters in environmental, food safety, health care
and industrial quality control applications era should
be investigated, fabricated and validated. These kinds
of tests may give approximate results (semi-
quantitative) but fit many purposes for smart decisions
21

to deal efficiently with environmental crises, save our
lives and money in production activities .
22
References:American Public Health Association (APHA) (2005).Standard Methods for the Examination of Water andWastewater 21th Ed. APHA-AWWA-WPCF, Washington, DC, 1200.
Aminot, A.; Kirkwood, D.S. & Krouel, R. (1997).Determination of ammonia in seawater by the indophenol-blue method: Evaluation of the ICES NUTS I/C 5questionnaire. Marine chemistry, 56: 59-75.
Association of Official Analytical Chemists (AOAC)Research Institute (2009). Performance Tested MethodsProgram Policies and Procedures, North Frederick Avenue
Suite 500 Gaithersburg, Maryland 20877-2417 USA.Babko, A.K. & Pilipenko A.T. (1976) Photometric analysis:methods of determining non-metals. Mir Publishers,
Moscow, p.p.22-26.Baudinet, D. & Galgani, F. (1991) A new application ofmicroplate reader in oceanography: Colorimetricassays to determine some nitrogen forms. Estuarine,Coastal Shelf Sci., 33, 459–466.
Boyd, C.E. (1998). Water Quality for Pond Aquaculture.Research and Development Series No. 43. InternationalCenter for Aquaculture and Aquatic Environments, Alabama.
Clinch, J.R., Worsfold, P.J. & Sweeting, F.W. (1988). Anautomated spectromphotometric field monitor for waterquality parameters: Determination of ammonia . Anal. Chim.Acta, 214, 401- 407.
23

El-Shafai, S. A.; El-Gohary, F. A.; Nasr, F. A.; vander Steen, N. P. & Gijzen, H. J. (2004): Chronicammonia toxicity to duckweed-fed tilapia (Oreochromisniloticus). Aquaculture 232:117–127.
Environmental Technology Verification Program, NationalRisk Management Research Laboratory U.S. EPA Office ofResearch and Development (2008) Cincinnati, Ohio 45268,
USA.EURACHEM (1998) guide: The Fitness for Purpose ofAnalytical Methods. Institute of Chemical TechnologyTechnicka , Prague, Czech Republic.
Evans, J. J.; Pasnik, D. J.; Brill, G. C. & Klesius, P.H. (2006): Un-ionized Ammonia Exposure in Nile Tilapia:Toxicity, Stress Response, and Susceptibility toStreptococcus agalactiae. North American Journal ofAquaculture, 68:23–33.Grasshoff, K., Kremling, K., Ehrhardt, M. (1999) Methodsof Seawater analysis. WILEY-VCH Verlag GmbH, D-69469Weinheim (Federal Republic of Germany, p. p. 188-192.
Hager, S. W., Atlas, E. L., Gordon, L. I., Mantyla A. W.& Park, P. K. (1972) A comparison at sea of manual andAutoAnalyzer analysis of phosphate, nitrate and silicate.Limnol. Oceanogr., 17, 931–937.
Hernandez-Lopez J. & Vargas-Albores, F. A. (2003).Microplate Technique to quantify nutrients (NO2
-, NO3-, NH4
+
and PO4 3-) in Seawater. Aquacult. Res, 34, 1201–1204.
Isla M. M.; Thorarensen, H.& Johannsson, R. (2008):Water Quality in Recirculating Aquaculture Systems (RAS)for Arctic Charr (Salvelinus alpinus L.) Culture. Oceandocs E-
24
repository of ocean publications.
http://www.oceandocs.org/handle/1834/3102 Ivančič, I. & Degobbis, D. (1984). An optimal manual procedure for ammonia analysis in natural waters by the indophenol blue method.Water Res., 18(9), 1143-1147.
Jansen S., Kriegesmann, B. & Brenig B. (1998): Emulationof an ELISA Reader and Quantitative Image Analysis Usingthe Computer Program Digital-OD. BioTechniques 2: 998-1001.
Johnson, Z. I., Sassano, L. & Ringuet, S. (2011): A suiteof microplate reader-based colorimetric methods toquantify ammonium, nitrate, orthophosphate and silicateconcentrations for aquatic nutrient monitoring. J.Environ. Monit., 13, 370-376.
Kenkel, J. (1994.): Analytical Chemistry forTechnicians ,Lewis Publishers, Boca Raton, US.
Kohl, Sh.K., Landmark J. D. & Stickle D. F. (2006):Demonstration of Absorbance Using Digital Color ImageAnalysis and Colored Solutions. J. Chem. Educ. 83 (4) , 644.Koroleff, F. (1969) International Council for the Exploration of the Sea, C.M. I969/C, 9, 4.
Krug F.J., Růžička, J. & Hansen, E.H. (1979). Determination of ammonia in low concentrations with Nessler's reagent by flow injection analysis. Analyst, 104, 47-54.
Laskov, C., Herzog, C., Lewandowski J. and Hupfer, M.(2007) Miniaturized photometrical methods for the rapidanalysis of phosphate, ammonium, ferrous iron, andsulfate in pore water of freshwater sediments. Limnol.Oceanogr.: Methods, 5, 63–71.
25
Mathews, K. R., Landmark, J. D. & Stickle, D. F. (2004):Quantitative Assay for Starch by Colorimetry Using aDesktop Scanner. J. Chem. Educ., 81 (5), 702.Moliner-Martínez, Y.; Herráez-Hernández, R. & Campíns-Falcós, P. (2005) Improved detection limit for ammonium/ammonia achieved by Berthelot’s reaction by use of solid-phase extraction coupled to diffused reflectance
spectroscopy. Anal. Chim. Acta. 534, 327-334.Perry, D. L. & Phillips, S. L. (1995). Handbook of inorganic compounds. CRC Press. p 17. Pillay, T.V.R., (1992): Aquaculture and the Environment.1st ed. University Press, Cambridge, p. 189.
Rabin, J. (2010): Rapid Quantification of Color Vision:The Cone Contrast Test. IOVS Manuscript (10-6283 inPress).
Riche, M. & Garling, D. (2003): Feeding Tilapia inIntensive Recirculating Systems. North Central RegionalAquaculture Center Fact Sheet Series #114 USDA grant #00-38500-8984.
Ruitenberg, E. J.; Brosi, B. J. M. & Steerenberg, P.A.(1976): Direct Measurement of Microplates and ItsApplication to Enzyme-Linked Immunosorbent Assay. Journalof Clinical Microbiology, 3(5):541-542.
Sällström, P. (1998): Using a Personal Computer as aVisual Colorimeter. Report (USIP 98-09)http://home.swipnet.se/pehrs/English/colorim.htm
Sayour, H. E. M.; El-Saied, K. M.; Kamal, A.M.; Fahmy, B.G. A.; Metawie, R. A.; Amin, A. M.; Hosny, A. M.;Youssef, S. F.; Ali, S. A. A. & AbdAllah, N. S. (2010):Fabrication and Validation of ustom-made pH Rapid Test asSmart Solution in Aquaculture Control. Proc. of the 3rd
26

Animal Wealth Research Conf. in the Middle East & NorthAfrica pp. 414-420.
Schmidt, W.J., Meyer, H.-D., Schtlgerl, K., Kuhlmann, W. & Bellgardt, K.-H. (1984). On-line analysis of fermentation media. Anal. Chim. Acta, 163, 101-109.
Soler, E. T. (2006). Ph.D. thesis, Universitat Rovira i
Virgili Tarragona, Spain.
Standing Committee of Analysts. (1981) Ammonia in Waters: Methods for the Examination of Waters and Associated Materials, HMSO, London.
Strauss, E., Favier,J.P., Bicanic, D.D., van Asselt, K. &Lubbers, M. (1991). Sensitive colorimetric determinationof ammonium ion in water by laser photothermal detection.Analyst, 116, 77-79.
Strickland, J. D. H. & Parsons, T. R. (1972) A PracticalHandbook of Seawater Analysis, Fisheries Research Boardof Canada, Ottawa.
Swedish Standard Methods (1976). Determination of ammonianitrogen content of water. SIS 028.
Timmons, M.B.; Ebeling, J.M.; Wheaton, F.W.; Summerfelt,S.T. & Vinci, B.J. (2002): Recirculating AquacultureSystems, 2nd Edition. Cayuga Aqua Ventures, Ithaca, NY 14850,USA. 800 p. NRAC Publication No. 01-002.
Unger-Heumann M., (1996) Strategy of analytical test kits. Fresenius J. Anal Chem 354, 803–806.
United States Environmental Protection Agency (U.S.EPA)(1983). Method for chemical analysis of water and wastes,U.S.EPA, Washington, DC, EPA 600/4-79-020, Method 365.3.
27
van Son, M., Schothorst, R.C. & den Beef, G. (1983). Determination of total ammoniacal introgen in water by flow injection analysis and a gas diffusion membrane. Anal. Chim. Acta, 153, 271- 275.
van Staden, J.F. & Taljaard, R.E. (1997). Determination of ammonia in water and industrial effluent streams. Analytica Chimica Acta, 344: 281-289. Woodward, E. M. S. & Rees, A. P. (2001) Nutrientdistributions in an anticyclonic eddy in the northeastAtlantic Ocean, with reference to nanomolar ammoniumconcentrations. Deep-Sea Res., Part II, 48, 775–793.
Yebra-Biurrun, M. C. (2009) Flow Injection Analysis ofMarine Samples. Nova Science Publishers, Inc. New York.
Yost, D. M. (2007). "Ammonia and Liquid Ammonia Solutions". Systematic Inorganic Chemistry. Prentice Hall, Inc.
28

Figure1: Effect of phenate conc. on indophenol formation upon
reaction with 1ppm ammonium with 0.6% hypochorite and 0.0169% sodium
nitroprusside, after 3min.
29

Figure 2: Effect of hypochlorite conc. on indophenol formation upon
reaction with 1ppm ammonium with 1.95% phenate and 0.0169% sodium
nitroprusside, after 3min.
Figure 3. Calibration curves 0.5, 1, 5, 10 ppm ammonium upon additionof 1.95% phenate and 1.25% hypochlorite and 0.0169% sodium nitroprusside at different times (1-9 min).
30

Image 1: Color card scale of total ammonium/ammonia.Table1: Criterion of Test Samples protocol for
Verification of the NH4+/NH3 test kit
Type of Sample
Sample Characteristics
Concentration
ppmNo. of Samples
Quality
control
Reagent blank 0 10% of total
number
Laboratory FortifiedMatrix
0.25 1 for each
site
Quality Control Sample
0.5 10% of total
number
St. ammonium
solution (1)
0. 5 3
31
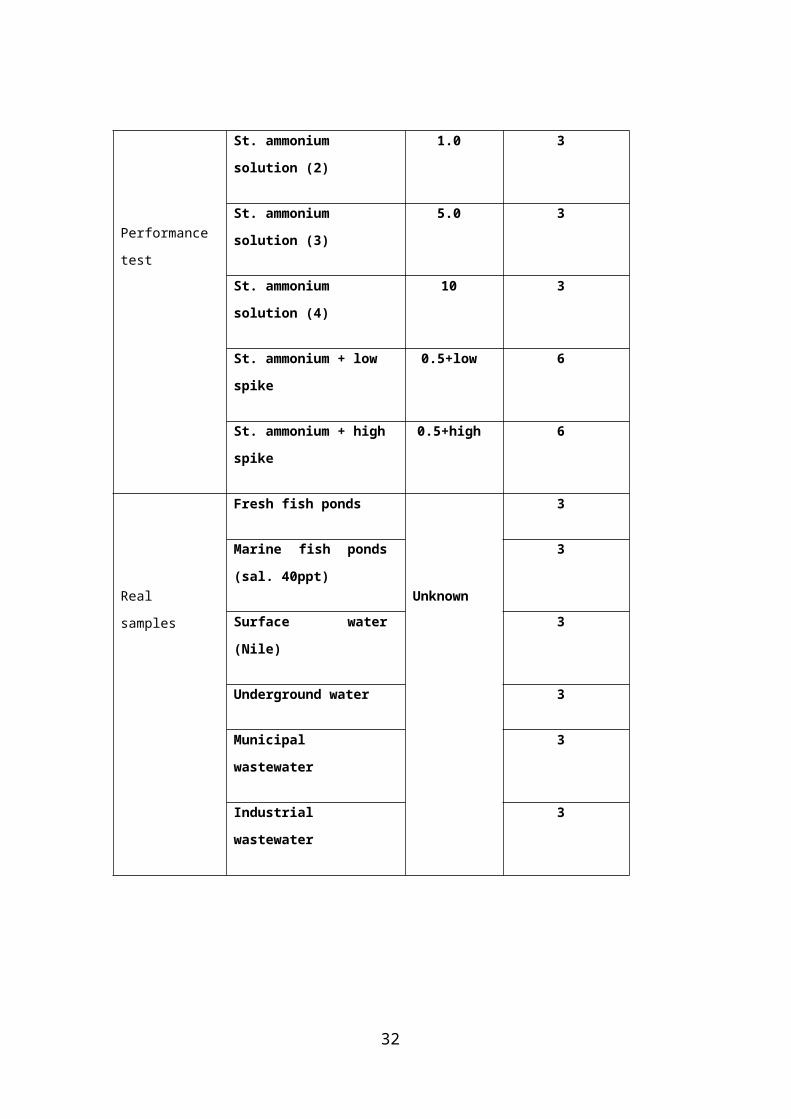
Performance
test
St. ammonium
solution (2)
1.0 3
St. ammonium
solution (3)
5.0 3
St. ammonium
solution (4)
10 3
St. ammonium + low
spike
0.5+low 6
St. ammonium + high
spike
0.5+high 6
Real
samples
Fresh fish ponds
Unknown
3
Marine fish ponds
(sal. 40ppt)
3
Surface water
(Nile)
3
Underground water 3
Municipal
wastewater
3
Industrial
wastewater
3
32

Table2: Compromise of previous studies reaction conditions, volume measured and working range to those of the proposed
Ref
.
Final phenol conc. Hypochlor
ite
Nitroprus
side
Sample
volume
Vol.
measure
d
Wave
lengt
h
Temp Time Conc.
Range
µg
1969
0.33% in 95% ethyl 0.084% 0.0169% 50 ml 10 cm
1cm
640
nm
22-
27°C1 hr 5-500
0.5-50
197
6
1% in
0.296%acetone,
1.28% methyl,
0.43%NaOH
0.6% Not used 25 ml 2 cm
cuv.
610
nm
22-
27°C
20
minUp to 4
199 1.36% 0.136% 0.068% 260µL 440 µL 620
nm
60°C 2hr 0-0.05
33

1999
0.29% in30%ethyl 0.010 % 0.002% 50 ml 10 cm
1 cm
630
nm
37°C 1 hr 0.042-
127.5
34
200
3
0.625% 0.093% 0.031% 250 µL 320 µL 650
nm
60°C 1 hr 0.015-
0.425
201
1
0.165% 0.217% 0.0013% 200 µL 230 µL 630
nm
37°C 2 hr 0.004-
0.2
201
2This
metho
d
1.95% in 0.592%
acetone in 2.5%
methyl in 1.25%NaOH
1.25% 0.0169% 50 µL 200 µL 630
nm
22-
27°C
7
min
Up to2
µg
34
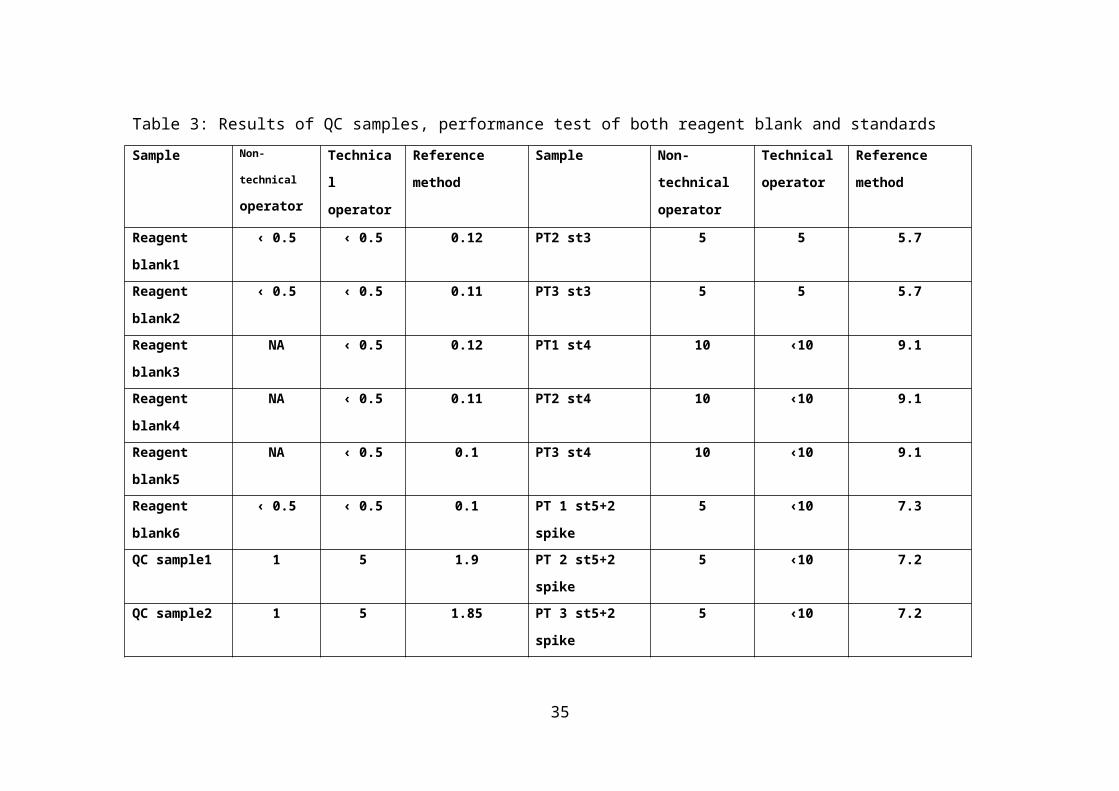
Table 3: Results of QC samples, performance test of both reagent blank and standardsSample Non-
technical
operator
Technica
l
operator
Reference
method
Sample Non-
technical
operator
Technical
operator
Reference
method
Reagent
blank1
‹ 0.5 ‹ 0.5 0.12 PT2 st3 5 5 5.7
Reagent
blank2
‹ 0.5 ‹ 0.5 0.11 PT3 st3 5 5 5.7
Reagent
blank3
NA ‹ 0.5 0.12 PT1 st4 10 ‹10 9.1
Reagent
blank4
NA ‹ 0.5 0.11 PT2 st4 10 ‹10 9.1
Reagent
blank5
NA ‹ 0.5 0.1 PT3 st4 10 ‹10 9.1
Reagent
blank6
‹ 0.5 ‹ 0.5 0.1 PT 1 st5+2
spike
5 ‹10 7.3
QC sample1 1 5 1.9 PT 2 st5+2
spike
5 ‹10 7.2
QC sample2 1 5 1.85 PT 3 st5+2
spike
5 ‹10 7.2
35
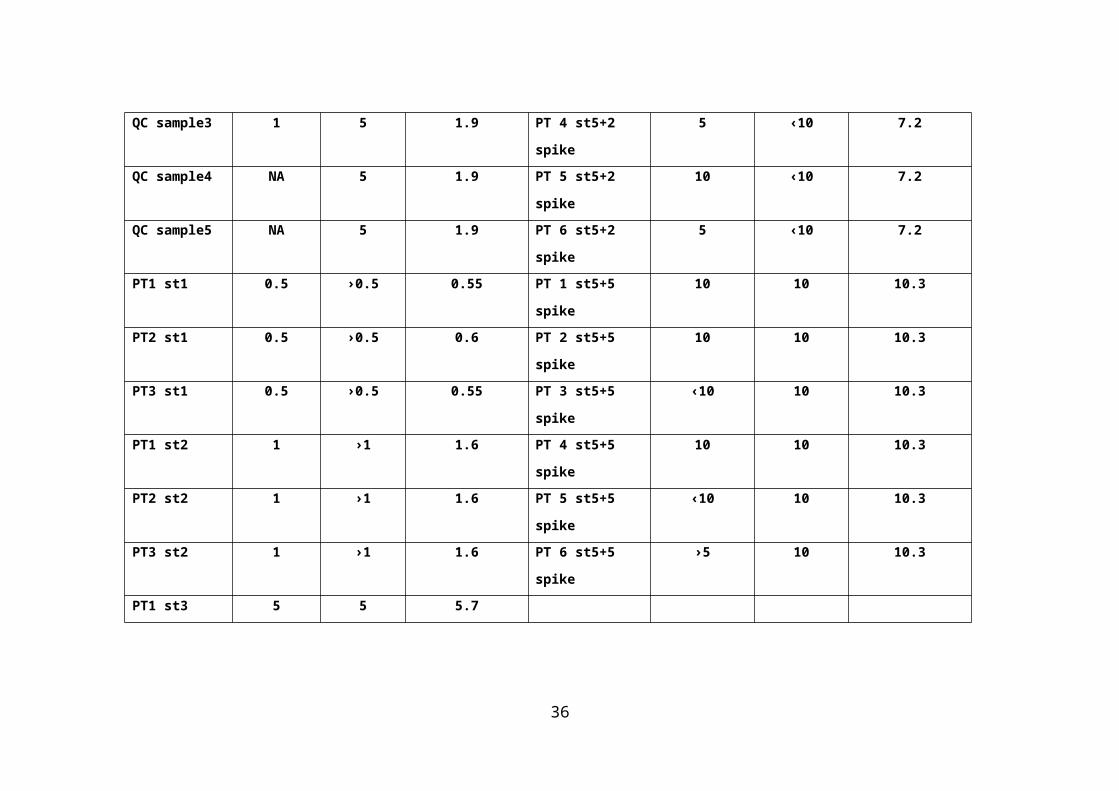
QC sample3 1 5 1.9 PT 4 st5+2
spike
5 ‹10 7.2
QC sample4 NA 5 1.9 PT 5 st5+2
spike
10 ‹10 7.2
QC sample5 NA 5 1.9 PT 6 st5+2
spike
5 ‹10 7.2
PT1 st1 0.5 ›0.5 0.55 PT 1 st5+5
spike
10 10 10.3
PT2 st1 0.5 ›0.5 0.6 PT 2 st5+5
spike
10 10 10.3
PT3 st1 0.5 ›0.5 0.55 PT 3 st5+5
spike
‹10 10 10.3
PT1 st2 1 ›1 1.6 PT 4 st5+5
spike
10 10 10.3
PT2 st2 1 ›1 1.6 PT 5 st5+5
spike
‹10 10 10.3
PT3 st2 1 ›1 1.6 PT 6 st5+5
spike
›5 10 10.3
PT1 st3 5 5 5.7
36

Table 4: Results of real samples from freshwater& brackish ponds, surface& underground
waters Sample Non-technical
operator
Technical
operator
Reference standard method
Reagent blank ‹0.5 ‹0.5 ‹0.1QC sample 1 1 1.1Fresh water pond1 (Kafr El-Shiekh) 1 ›0.5 0.72
Fresh water pond2(Kafr El-Shiekh) 1 1 1.25
Fresh water pond3(Kafr El-Shiekh) ‹0.5 ‹0.5 0.33
Reagent blank ‹0.5 ‹0.5 ‹0.5QC sample ›0.5 ›0.5 1Brackish water pond1 (Qarun lake) 1 1 1.2
Brackish water pond2(Qarun lake) 5 ‹5 2.1
Brackish water pond3(Qarun lake) ›5 ›5 5.1
Reagent blank ›0.5 ›0.5 0.1QC sample ›0.5 1 0.9Surface water1 (Buruls lake) 0.5 0.5 0.52
Surface water2(Buruls lake) ›0.5 1 1.1
37

Surface water3(Buruls lake) 1 ›1 2.1
Reagent blank ‹0.5 ‹0.5 0.1QC sample 1 1 1Under ground water1 (El-Natron
valley)
‹0.5 ‹0.5 ‹0.1
Under ground water2 (El-Natron
valley)
›0.5 ›0.5 0.68
Under ground water 3(El-Natron
valley)
›0.5 ›0.5 1.1
38

Table 5 Summary of qualitative accuracy results within 25%
Samples % accuracy non-technical
operator within 25%
% accuracy
technical operator
within 25%PT 71 55Fresh ponds (Kafr El-
Skiekh)
95 58
Brackish ponds (qarun lake) 72 93Surface water (Burulus
lake)
55 56
Underground water (El-
Natron valley)
92 97
39
ع ي� صن � ق� ت حق� ة� م ن� وال ت� ار ص لاح ي� ب" ت� ع اخ ي&� وم ل رص د سر ي� د الام ون حدي�4 � ة� وت وع ي� اه. ن ال مب�
ور ي?�ن� س ي� ح سام ع ز ال دة� �EEEي Fطت اء ال �EEEمب ده� ال كي� EEEوخ " اح ثM ن " EEEوان�–ي �EEEحي حة� ال EEEص MوثEEEح " - م عهEEEد ت ائ4]ي� د EEEغ ص ال ق� اء وامEEEراض ال ي �EEEمب حEEEوثM ال كي� " سEEEم ت � ق
ي� ال دق� " ي
صا :ل ملخم � فEت M Eكواش لة� م ن� ال ب� ن] EEاث� ص �EEمب هلكr ك ه� وي �سEEت� هEEز " ج اج� لاي� ا] �Eحت � ع لات ي&� ار سر ب" ت� حداثM اخ اس ت�
اث� EEEب د ي � و وال غت� ن و سEEEت� ق� ذ ي� � دق EEEره� ال� ق� ال مغEEاي "EEي ة� ط �EEEي ت ق� � دام ت ح ت� EEلي� اس ار ع "EEEب ت� ة�96الاخ EEي ة� و ع ت� EEEارن مق� " كr ب EEEل ذوان� EEEEل اث� والا] EEEEب ف ل لغت� M EEEEكواش ة� ال اف EEEEد اصEEEEغ " ي� ي � ت ت� EEEEة� عكسال �EEEEمي وما ك �EEEEي م ون ا / لا] ب� م ون عالا] EEEEة� م �EEEEكلي ال
. ة� ي� EEاس ب� اث� ال ف EEب ة� م ن� ال غت� "EEح � ات وان� ال ب EEلال ان� الال حلب� ع ت� ي&� ة� ال سEEر �EEكمي وما ل �EEي م ون ا / لا] ب� م ون ة�الا] �EEكلي الي� ي� ق ت� EEة� ال ارع ال سEEمكي� هاال مEEز ي ع ت ت EEلي لا ع اظ¢ ع EEحق ة� وال "EEي � ة� ل مزاق �EEي ن4] ة� ال ما [EEي ن¤ ة� ال ب" حي� EEي�ص اصEEة� ق ماك r خ EEس ل لا]
ها ره� م ت ي� FEEEEEكب مغEEEEEاث� ال ج" ة� . ال ت� �EEEEEمي كمن� اه � لال ك مEEEEEا ي حلب� ع ت� ي&� ة� ال سEEEEEر �EEEEEكمي وما ل �EEEEEي م ون ا / لا] ب� م ون ي�الا] ة� ق �EEEEEكلي الاع ت� رص د اه ال صEEEرفE ال صEEEب �EEEب اه ال صEEEرف ال صEEEحي� ، م �EEEب ة�م �EEEي و ال دول ة� ا] �EEEمحلي ي�رال ن&¤ هEEEا ل لمغا ت� ف� " وم دي� م طات
ةE�ان� . وال دولEEEEEEEEEEEEEEEEEEEEEEEة� � EEEEEEEEEEEEEEEEEEEEEEEدن لب� ق� اس ال طEEEEEEEEEEEEEEEEEEEEEEEزق� ال ي� �EEEEEEEEEEEEEEEEEEEEEEEب اث� ل ف� ي�ر EEEEEEEEEEEEEEEEEEEEEEEرك� ا ي ب� م ون ا الا] EEEEEEEEEEEEEEEEEEEEEEEا م "EEEEEEEEEEEEEEEEEEEEEEEب ال عطلب" ت� � اث� ن �EEEب ت ق� � ده� ت �EEEعق و م صصEEEة� ا] خ ة� م غEEEداث� م ت� EEEكلف غل م ح" � ل م ن� ال صEEEعث" م مEEEا ت MEEEب زاء م " EEEهاج د EEEه
لاث� حلب� دمي � .ال ت� حثM ق� لة� ال ت" ي?� د " ة� ي ف� ت?� دم ط ز ح ست� � ره� ي ي� غ EEاث� ص صEEل ك مب� ف ل ت� M EEكواش اث� وال EEب م ن� ال غت�كرولEEEEي�ر، 200 الي� فع لاوه� ع لي� ان� م ب� MEEEEش د ك EEEEل الي� خEEEEص � ة� ت �EEEEف ت?� ون� 0.1 ال طز �EEEEملي ي� ال ء ق ز " EEEEلل جEEEEك
40

اث�م ت EEن اه ال مال حEEة� عت� �EEمب ة� وال " EEن اه ال غد �EEمب ء ال ز " EEة� الي� جEEملوح هEEا م ن� ال ت� صEEي� ق � صEEل ال حEEد الاق � ي� ت ت� EEي� 40 وال ق، و ف EEل ة� الا] �EEا ذف EEة� م �EEف ت?� ل ع ن�ي �لا ال طز �EEب� ٪10 ق ورن اق� EEا م ال طزق� اذ " EEة�ي �EEلي حلب� ة� ال ت� ي� EEاس ب� دام .ال ف� ح ت� EEالاس
ة� �EEEEEEEEEي ت ق� ه ال ي� ي� ل هEEEEEEEEEد ت �EEEEEEEEEن � ر ال روي ي" �EEEEEEEEEب ي� ال مح عكEEEEEEEEEاسوا]ق راع ال سEEEEEEEEEمكي� لات ل الاسEEEEEEEEEي�ر EEEEEEEEEي� مراخ اث� ق ر ي� EEEEEEEEEرك � ية� و �EEكلي ا ال �EEب وم/الام ون �EEي طEEة� الام ون ت" � ة� يموي " ال مزن �EEف ي� � ن� ال طحEEال ب" ال دق دل ع لي ا] � EEة� يEEي�رح ة� ال مف� �EEي ت ق� غة� ال ي� ت?� ,سEEر
ة� �EEف ي� � عمال,ذق ي� EEهلة� الاس EEل س لEEة� ل " اي � ق� وق ي� طEEت" ي¤ن�ت� " ن� ي دم ي� ح لEEف ال مسEEت� ت� ة� .م ح �EEي ت ق� ه ال ي� د EEلي� اي�ه عي�مEEد ع � ي� لات ت� EEال ه� هEEز " ج لا ل ا] ي?� د " EEدم ي �EEق � ة� ت ي� EEاس ب� ة� ال ف� � EEارن ح" حلت�EEلطEEرق� ال ت� وم لل ت� �EEي م ون لEEة�، الا] لب� � هEEا ق ثM ان ة� ح ي� EEكلف ة0.5 )ال ت� �EEي ت " خ
) ة� ي غزق� ول لغت� سي� � ث�ي � صر )وق � ق ل كr 7 ا] ة� ( وذ ي ق� ل كل ع ت� [ ان � اظ¢ ع لي ذق ة� ال م ع ال حق ة� الدف� .عال ي�
41