
Extreme price clustering in the London equity index futures and options markets
14
Extreme price clustering in the London equity index futures and options markets Owain ap Gwilym a , Andrew Clare b , Stephen Thomas a, * ,1 a Department of Management, University of Southampton, Highfield, Southampton S017 1BJ, UK b ISMA Centre, Department of Economics, University of Reading, UK Received 27 May 1997; accepted 18 March 1998 Abstract Price clustering and optimal tick sizes have recently been topics of substantial public policy interest, and this paper presents evidence which is relevant to both debates. Around 98% of quoted and traded prices for LIFFE stock index derivatives are found to occur at even ticks. We report that clustering increases with volatility and transaction frequency, and decreases with trade size, and find that the proportion of odd ticks is significantly lower near the market open and higher near the close. Further, an inverse relationship is reported between bid–ask spreads and the number of odd ticks, and spreads cluster at even-tick values. This evidence of extreme price clustering is the first to be presented for financial derivatives. The results support both the price resolution and the negotiation hypotheses of price clustering. Ó 1998 Elsevier Science B.V. All rights reserved. JEL classification: G12 Keywords: Clustering; NASDAQ; Tick size; Bid–ask spreads; Intraday data Journal of Banking & Finance 22 (1998) 1193–1206 * Corresponding author. Tel.: 44 1703 593068; fax: 44 1703 593844; e-mail: [email protected] ton.ac.uk. 1 This paper benefited considerably from the comments and suggestions of two anonymous referees. We are grateful for helpful comments from participants at the 1997 Cornell–Queen’s Derivatives Securities Conference, the 1997 BNP-Imperial College Forecasting Financial Markets Conference, and the 1997 International Symposium on Forecasting. The authors also gratefully acknowledge the financial support of the Leverhulme Trust (Grant F391/I). 0378-4266/98/$19.00 Ó 1998 Elsevier Science B.V. All rights reserved. PII S0378-4266(98)00054-5
Transcript of Extreme price clustering in the London equity index futures and options markets
Extreme price clustering in the London equity
index futures and options markets
Owain ap Gwilym a, Andrew Clare b, Stephen Thomas a,*,1
a Department of Management, University of Southampton, High®eld, Southampton S017 1BJ, UKb ISMA Centre, Department of Economics, University of Reading, UK
Received 27 May 1997; accepted 18 March 1998
Abstract
Price clustering and optimal tick sizes have recently been topics of substantial public
policy interest, and this paper presents evidence which is relevant to both debates.
Around 98% of quoted and traded prices for LIFFE stock index derivatives are found
to occur at even ticks. We report that clustering increases with volatility and transaction
frequency, and decreases with trade size, and ®nd that the proportion of odd ticks is
signi®cantly lower near the market open and higher near the close. Further, an inverse
relationship is reported between bid±ask spreads and the number of odd ticks, and
spreads cluster at even-tick values. This evidence of extreme price clustering is the ®rst to
be presented for ®nancial derivatives. The results support both the price resolution and
the negotiation hypotheses of price clustering. Ó 1998 Elsevier Science B.V. All rights
reserved.
JEL classi®cation: G12
Keywords: Clustering; NASDAQ; Tick size; Bid±ask spreads; Intraday data
Journal of Banking & Finance 22 (1998) 1193±1206
* Corresponding author. Tel.: 44 1703 593068; fax: 44 1703 593844; e-mail: [email protected]
ton.ac.uk.1 This paper bene®ted considerably from the comments and suggestions of two anonymous
referees. We are grateful for helpful comments from participants at the 1997 Cornell±Queen's
Derivatives Securities Conference, the 1997 BNP-Imperial College Forecasting Financial Markets
Conference, and the 1997 International Symposium on Forecasting. The authors also gratefully
acknowledge the ®nancial support of the Leverhulme Trust (Grant F391/I).
0378-4266/98/$19.00 Ó 1998 Elsevier Science B.V. All rights reserved.
PII S 0 3 7 8 - 4 2 6 6 ( 9 8 ) 0 0 0 5 4 - 5

1. Introduction
Price clustering is the occurrence of signi®cantly greater than 50% of quotedand/or traded prices at even price fractions, or of certain integers. This phe-nomenon has become a topic of substantial public policy interest following thepublication of research ®ndings by Christie and Schultz (1994) that marketmakers in actively traded NASDAQ stocks may have implicitly colluded tomaintain bid-ask spreads of at least $0.25 by avoiding odd-eighth quotes.Shortly after the Christie and Schultz (1994) results were publicised, dealers ina number of major stocks, including Apple and Microsoft, rapidly increasedtheir use of odd-eighth quotes which led to a decline in mean inside and ef-fective spreads of nearly 50% (see Christie et al., 1994). Evidence of priceclustering has also been documented in other markets, e.g. Goodhart andCurcio (1991) for foreign exchange markets, Ball et al. (1985) for the goldmarket, and Grossman et al. (1996) for equity, foreign exchange and goldmarkets. However, no previous study has examined the phenomenon in ®-nancial derivatives markets.
Several theories have been proposed to explain the observation of priceclustering. The attraction theory proposed by Goodhart and Curcio (1991)suggests that discrete trading prices are obtained from continuously distributedunderlying values by rounding to the nearest available ®nal unit (as in Gottlieband Kalay, 1985), but the basic attraction of each integer varies. Ball et al.(1985) suggest that clustering results from the achievement of the optimaldegree of price resolution, i.e. the desired level of price accuracy. The negoti-ation hypothesis by Harris (1991) suggests that a smaller price set is chosen bymarket participants to limit the number of bids and asks that can be made andthus lowers the costs of negotiation.
In this paper we ®nd evidence of extreme clustering in the quoted and tradedprices of the equity index futures and options contracts traded on the LondonInternational Financial Futures and Options Exchange (LIFFE), and thuspresent the ®rst evidence of this phenomenon for ®nancial derivatives. We ®ndthat although the minimum tick size for FTSE derivatives is half an indexpoint, 98.3% of quotes and 98.4% of trades occur at even ticks (full indexpoints) for the FTSE100 futures contract. Similar ®ndings are reported foroptions on the FTSE100 index and for the FTSE250 futures contracts, withadditional clustering at the values 0 and 5 for the fourth index digit in the lattercase. In general our results support the price resolution hypothesis by Ball et al.(1985) which implies that the price clustering in this market results from theachievement of the desired level of price accuracy. However, we also ®nd re-lationships between clustering and trade sizes and volatility which support thenegotiation hypothesis by Harris (1991).
The remainder of this paper is organised as follows. Section 2 outlines themarket structure of LIFFE and the dataset, while Section 3 presents results on
1194 O. ap Gwilym et al. / Journal of Banking & Finance 22 (1998) 1193±1206

the extent of price clustering with interpretations in the light of existing theory.Section 4 examines intraday variability in price clustering, which has notpreviously been considered, and Section 5 concludes.
2. Market structure and the dataset
Consideration of market structure is important because it has been arguedthat the high degree of clustering at NASDAQ was due to some defect in itsmarket structure. LIFFE operates an open outcry trading system similar tothose at US futures markets e.g. Chicago Mercantile Exchange (CME). AtLIFFE, there are currently two futures contracts traded on equity indices. Byfar the most heavily traded is the FTSE100 stock index futures contract, whichis based upon the top 100 UK companies by market capitalisation. A morerecently introduced and less heavily traded futures contract is based upon theFTSE250, which is an index of the next 250 largest stocks by market capi-talisation. LIFFE also trades both American- and European-style options onthe FTSE100 stock index. Dependent on series and maturity, there can be up to®fty price makers active at any time in the FTSE100 stock index futures andoptions markets, but often only two or three in the FTSE250 index futures.
Trading in the FTSE100 futures market occurs by open outcry from 08:35±16:10GMT, and by Automated Pit Trading (APT) from 16:32±17:30GMT. Thevast majority of trading in this derivative occurs in the front month contract upto its last trading day, at which point a switch occurs to the immediatelysucceeding contract. The contract is currently valued at, £25 per index point,with a minimum price movement of 0.5 index points. At the average price forFTSE100 futures in our sample of 2966.4, the tick value is 1.7 basis points(12.5/(25 ´ 2966.4)). Most stocks in London are quoted in ticks of 1 pence andwith an average price of around £4, this translates to 25 basis points. Pittrading hours for the options contract are the same as for the FTSE100 futures,while the FTSE250 futures market opens and closes ®ve minutes earlier. Ticksize for the FTSE100 options and the FTSE250 index futures is half an indexpoint, with a tick value of £5 for both contracts.
The FTSE100 index futures and options are traded in two separate pits thatare adjacent to one another to facilitate trading and hedging. Traders com-monly delta hedge options positions using the index futures. All contractmaturities are traded in the same pit by the same traders. Large orders are splitamong multiple buyers/sellers in the pit on a pro rata basis.
The dataset includes all quotes and trades on the FTSE100 stock indexfutures contracts from 24 January 1992 to 30 June 1995 (consisting of 923,703trades and 1,780,785 quotes). The source is the LIFFE Time and Sales data onCD-ROM, which contains information on the time to the nearest second,contract type, ¯oor or APT trading, commodity code, delivery month, price,
O. ap Gwilym et al. / Journal of Banking & Finance 22 (1998) 1193±1206 1195

transaction code (bid, ask or trade), and traded volume. Trades and quotestaking place during APT are not considered here. Similar data for theFTSE250 stock index futures contract is available from its inception on 25February 1994 to 30 June 1995 (consisting of 1,358 trades and 7,512 quotes).Data on the American-style option on the FTSE100 stock index from 4 Jan-uary 1993 to 31 March 1994 (consisting of 97,574 trades and 223,681 matchedbids and asks) is obtained from a separate source. These options are chosenrather than the European-style equivalent due to greater liquidity.
3. Results
3.1. Clustering and the price resolution hypothesis
Table 1 presents results for the number and percentage of trades whichoccur at odd and even ticks for the FTSE100 futures contract. Over the entiresample, 98.4% of trades on all contracts occur at even ticks, a result which isrobust across sub-samples. Out of a total of 1.78 million bids and asks, only30,222 (1.7%) occurred at odd ticks. The results in Table 1 are supportive ofthe price resolution hypothesis by Ball et al. (1985), i.e. the market does notseem to require the additional price re®nement of half index points.
Splitting of large orders among multiple buyers or sellers in the pit couldimpact on the level of observed price clustering. The transaction record doesnot make any distinction between multiple trades at a given price based on asingle order and multiple trades at a given price based on di�erent orders. Toaccount for this, we re-examined clustering frequencies following aggregationof all trades at the same price within one-minute intervals. 2 The results werematerially unchanged: over the entire sample, 97.7% of trades occurred at eventicks, with little variation across sub-samples.
The FTSE250 index futures contract also displays a high degree of priceclustering, with 98.5% (99.4%) of trades in all contracts (front-month only)
Table 1
Number and percentage of FTSE100 stock index futures trades occurring at odd and even ticks
Sample All contracts Front month contract only
Even ticks Odd ticks Even ticks Odd ticks
Full sample 909005 14698 884918 10614
1/92±6/95 98.41% 1.59% 98.81% 1.19%
2 We are grateful to an anonymous referee for this suggestion.
1196 O. ap Gwilym et al. / Journal of Banking & Finance 22 (1998) 1193±1206

occurring at even ticks. Only 15 (0.2%) quotes occurred at odd ticks over thissample. For the American-style FTSE100 index options contract, we ®nd that97.7% of bids, 98.1% of asks and 95.9% of trades occur at even ticks, onceagain supporting the hypothesis by Ball et al. (1985). Table 2 presents a moredetailed analysis of this by contract moneyness and maturity. The largestproportion of odd ticks is for out-of-the-money, near-maturity options whichis the lowest priced category. Clustering tends to decrease as maturity ap-proaches and is less severe for out-of-the-money contracts. For in-the-moneycontracts with longer than a month to maturity, occurrence of odd ticks is closeto zero. Overall, the observations which do occur at odd ticks tend to be inrelatively low price option contracts, which is consistent with the evidence byHarris (1991) from the NYSE/AMEX markets that price clustering tends toincrease with the price level.
3.2. The attraction hypothesis
Given that odd ticks are so rare in the FTSE derivative contracts, we con-duct further analysis based on the ®nal digit of the price (e�ectively assumingthat the minimum price movement is one index point). In Table 3, traded andquoted prices are split into the ten possible integer values for the ®nal digit. Forthe FTSE100 stock index futures contract we ®nd little evidence of a preferencefor any integer values, with trades and quotes generally occurring approxi-mately 10% of the time in each of the ten digits. The largest deviations are forthe integers 1 and 9, discussed as the least popular digits in Goodhart andCurcio (1991).
However, the FTSE250 futures and FTSE100 options show a di�erentpattern. For the FTSE250 contract, 78% of bids and asks, and 69% of tradeshave either 0 or 5 as the ®nal digit, while 2 is the next most popular digit at 7%of trades. For the FTSE100 options, over 30% of trades occur at a ®nal digit ofzero, with 5 being the next popular digit at 9.6%. Clustering is less severe inquotes, but there are still 28% with ®nal integers taking the values of 0 or 5.These two contracts thus o�er strong support for the Goodhart and Curcio(1991) attraction hypothesis in the ®nal integers of the price.
3.3. The negotiation hypothesis
The negotiation hypothesis by Harris (1991) suggests that a smaller priceset limits the number of bids and asks which can be made and thus lowers thecosts of negotiation; hence participants will tend to prefer a smaller price set.However, for larger trades market participants may ®nd it worthwhile ne-gotiating on a wider range of prices. We examine the relationship betweenodd and even tick trades and the respective mean trade size for the FTSE100
O. ap Gwilym et al. / Journal of Banking & Finance 22 (1998) 1193±1206 1197

Ta
ble
2
Pri
cecl
ust
erin
gin
Am
eric
an
-sty
leF
TS
E10
0st
ock
ind
exo
pti
on
scl
ass
i®ed
by
mo
ney
nes
san
dm
atu
rity
S/K
Ma
turi
tyT
ota
l
Nea
r2
nd
3rd
4th
Oth
er
Bid
Ask
Tra
de
Bid
Ask
Tra
de
Bid
Ask
Tra
de
Bid
Ask
Tra
de
Bid
Ask
Tra
de
Bid
Ask
Tra
de
IN9
9.1
99
.19
7.0
10
09
9.9
99
.1100
100
100
100
100
99.0
99.9
99.7
99.0
99.6
99.5
98.0
AT
97
.49
7.8
95
.59
9.5
99
.69
8.7
99.7
99.8
99.0
99.7
99.6
98.0
99.8
99.9
98.3
98.3
98.6
96.8
OU
T7
8.8
82
.77
6.2
93
.39
4.7
89
.296.1
96.3
91.5
97.8
98.9
92.9
98.6
98.9
97.5
92.2
93.7
87.4
To
tal
96
.79
7.3
94
.79
8.7
99
.09
7.6
98.9
99.0
97.4
99.1
99.4
96.7
99.3
99.5
98.0
97.7
98.1
95.9
Th
ista
ble
pre
sen
tsth
ep
erce
nta
ge
of
bid
,a
sked
an
dtr
ad
edp
rice
sw
hic
ho
ccu
rat
even
tick
s,cl
ass
i®ed
by
mo
ney
nes
san
dm
atu
rity
.F
or
Am
eric
an
-sty
le
FT
SE
10
0st
ock
ind
exo
pti
on
s,th
ea
va
ila
ble
exp
iry
date
sat
an
ygiv
enti
me
are
Jun
ean
dD
ecem
ber
plu
sad
dit
ion
al
mo
nth
ssu
chth
at
the
fou
rn
eare
st
cale
nd
ar
mo
nth
sa
rea
lwa
ys
av
ail
ab
lefo
rtr
ad
ing
.T
he
matu
rity
cate
go
ries
use
dh
ere
re¯
ect
this
,w
ith
the
®rs
tca
tego
ryd
e®n
edas
the
nea
rest
exp
iry,
the
seco
nd
cate
go
ryis
the
seco
nd
nea
rest
exp
iry
,a
nd
soo
n.
Th
em
on
eyn
ess
cate
go
ries
are
de®
ned
as
IN(i
n-t
he-
mo
ney
),A
T(n
ear-
the-
mo
ney
)an
dO
UT
(ou
t-o
f-th
e-m
on
ey)
acc
ord
ing
toth
era
tio
of
the
un
der
lyin
gp
rice
toth
eex
erci
sep
rice
(S/K
)as
foll
ow
s:0<
S/K6
0.9
5is
OU
Tfo
rca
lls
an
dIN
for
pu
ts,
0.9
5<
S/K
<1
.05
isA
Tfo
rb
oth
call
sa
nd
pu
ts,
an
d1.0
56
S/K
<1
isIN
for
call
san
dO
UT
for
pu
ts.
1198 O. ap Gwilym et al. / Journal of Banking & Finance 22 (1998) 1193±1206

futures contract. 3 If the negotiation hypothesis is valid we would expect to®nd a higher probability of odd-ticks for trades of a larger size, and Table 4presents direct evidence on this. For the limited number of trades that occurat odd-ticks in the FTSE100 futures market, mean trade size is far higherthan for even-tick trades. For the entire sample, the average trade for eventicks is for 6.5 contracts, whereas for odd tick trades the equivalent value is19.5 contracts, a result which is robust across sub-samples. These results areconsistent with those of Brown et al. (1991) for COMEX silver futures. Forthe NASDAQ stocks in their sample whose market makers rarely use odd-eighths, Christie and Schultz (1994) ®nd that large trades are far more likelyto occur on odd eighths than are small trades. Such evidence suggests thatthe bene®ts of larger trades justify additional negotiation costs.
Table 3
Price clustering on fourth digit of index value for FTSE100 and FTSE250 stock index futures
contracts, and ®nal whole digit of option price
FTSE100 futures FTSE250 futures FTSE100 options
Trades Quotes Trades Quotes Trades Quotes
0 10.2 10.0 39.9 45.5 30.8 15.3
1 8.9 8.9 3.2 1.6 7.1 8.0
2 9.9 10.0 7.2 4.2 8.6 10.8
3 10.0 10.0 3.0 2.6 7.8 9.7
4 10.2 10.2 3.8 2.5 7.5 8.6
5 10.5 10.6 28.8 32.5 9.6 12.6
6 10.4 10.4 3.4 2.2 7.3 7.9
7 10.3 10.4 3.8 3.8 7.4 9.3
8 10.3 10.5 4.3 3.5 8.0 10.7
9 9.3 9.2 2.7 1.7 5.8 7.1
The table presents the percentages of traded and quoted price occurring at the ®nal whole digit of
the price, i.e. e�ectively assuming a minimum price movement of one index point rather than half
an index point.
Table 4
Mean trade sizes for FTSE100 stock index futures trades at odd and even ticks
Sample All contracts Front month contract only
Even ticks Odd ticks Even ticks Odd ticks
Full sample 6.50 19.47 6.17 14.31
1/92±6/95
3 There are too few odd-tick trades in the FTSE250 futures to conduct a similar meaningful
analysis of the relationship between even and odd tick trades and trade size. In addition, volume
data is not available for the FTSE100 options contract and therefore we cannot undertake the
analysis for this contract either.
O. ap Gwilym et al. / Journal of Banking & Finance 22 (1998) 1193±1206 1199

4. Intraday variability in price clustering
4.1. The intraday occurrence of odd ticks
Though Grossman et al. (1996) report variation in clustering over time,previous studies have not considered the possibility of variability in the level ofclustering on an intraday basis. If the negotiation hypothesis holds, we wouldexpect to observe a greater proportion of odd ticks during low volume and lowvolatility periods. Previous studies (e.g. Ekman, 1992) document that themiddle of the day tends to be a time of relatively low volume and volatility instock index futures markets, with periods of high volume and volatility nearthe open and close.
Fig. 1 plots the number of odd and even tick trades for the FTSE100 futurescontract per 5-min interval during the day. The pattern for even-tick tradesfollows a familiar U-shaped intraday pattern in trading volume. Notable peaksoccur during the intervals ending 09:35GMT, 11:35GMT, and 13:35GMT,which correspond to the principal UK releases in the period from Autumn1993, UK releases prior to Autumn 1993, and principal US releases, respec-tively. 4 However, the pattern for odd-tick trades di�ers markedly in that thereis an elevated number of trades in the last interval of the day only, which isapproximately double the level for most of the rest of the day. 5 A relativelylow percentage of odd-tick trades is found near the market open, with rela-tively high percentages around lunchtime (a period of low volume) and nearthe close of trading. Since negotiation costs would generally be higher in pe-riods of high volume and volatility, the observation of few odd-ticks near theopen lends additional support to the negotiation hypothesis. However, theobservation of an increase in odd-ticks near the market close is clearly incon¯ict with this hypothesis. 6
The signi®cance of the low percentage of odd-ticks at the market open, andhigh percentage at the close is now tested for the FTSE100 futures contract. 7
4 During the sample period used for FTSE100 index futures in this paper, both the Central
Statistical O�ce (CSO) and the Bank of England changed the release time for announcements from
11:30GMT to 09:30GMT. All the main CSO releases were at 09:30GMT from the ®rst
announcement day after 23 August 1993. The monetary statistics released by the Bank of England
changed to a 09:30GMT release time from 3 September 1993. Labour market statistics were
released at 09:30GMT from 18 November 1993.5 The above was repeated for the FTSE250 futures contract. The even-tick trades showed a
crude U-shaped pattern across the day, but there were too few odd-tick trades to produce any
discernible pattern.6 Similar patterns are observed for the quotes and trades in the American-style FTSE100 index
option contract.7 Data availability prevents us from undertaking similar analysis for the other two derivatives in
our sample.
1200 O. ap Gwilym et al. / Journal of Banking & Finance 22 (1998) 1193±1206
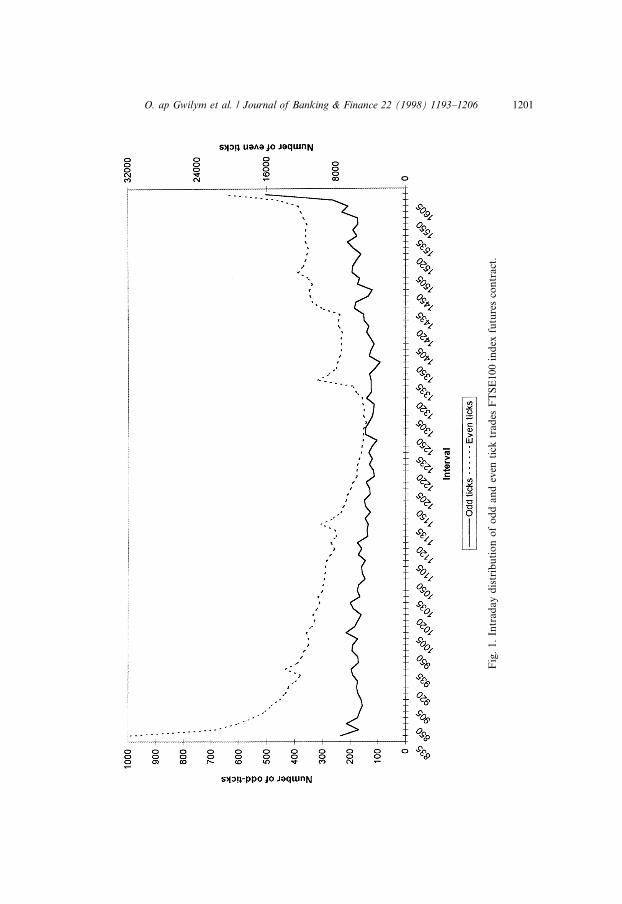
Fig
.1
.In
trad
ay
dis
trib
uti
on
of
od
dan
dev
enti
cktr
ad
esF
TS
E100
ind
exfu
ture
sco
ntr
act
.
O. ap Gwilym et al. / Journal of Banking & Finance 22 (1998) 1193±1206 1201

We also examine the relationship between the percentage of odd-tick tradesand trade size, price, transaction frequency and volatility (in line with Harris(1991)). Section 3 above reported that mean trade size was larger for odd-ticktrades, implying an expected positive coe�cient here. Harris (1991) shows thata greater proportion of odd-ticks occurs in low priced trades, but as the indexfutures price only varies over a relatively narrow range such a relationship isnot expected here. Harris (1991) also ®nds that clustering decreases withtransaction frequency and uses the inverse square root transformation due toinformation-theoretic considerations, showing that price uncertainty is pro-portional to the inverse square root of the number of transactions. 8 Thisimplies a negative coe�cient for this variable here. Clustering is expected toincrease in periods of high volatility, and the coe�cient on mean absolutereturn is thus expected to have a negative coe�cient. The following regressionis estimated:
ODDt � a� b1D1� b2D2� c1St � c2Pt � c3Tt � c4ARt � �t; �1�where ODDt is the percentage of trades which occur at an odd tick for intervaln �n � 1; . . . ; 23� on day i �i � 1; . . . ; 846�; D1 is a (0, 1) dummy variable for theopening interval of the day; D2 is a dummy for the closing interval; St is themean trade size in interval n on day i; Pt is the mean trade price in interval n onday i; Tt is the inverse square root of the number of transactions per 5 min (seebelow) in interval n on day i; and ARt is the absolute return across interval n onday i. 9
Table 5 reports the results, and shows a strongly signi®cant higher per-centage of odd-tick trades near the close, and also the percentage of odd-ticktrades near the open is signi®cantly lower than the rest of the day. There is asigni®cant positive relationship between the percentage of odd-tick trades andmean trade size, an insigni®cant relationship with the price level, and a stronglysigni®cant negative relationship with volatility. Although the above resultscon®rm prior expectations, the strong positive relationship between the inverseof transaction frequency and odd ticks implies that odd ticks are used morefrequently during quiet trading periods, a result which is in contrast to theevidence by Harris (1991). Although higher trading frequency is hypothesisedto reveal greater price certainty (Harris, p. 402), it seems that in this open
8 Harris (1991) states: ``Suppose that each transaction conveys information about underlying
value plus some noise. Underlying value estimators computed from the transaction sequence would
then have standard errors that are proportional to the square root of the number of transactions
observed''. The inverse transformation is also useful because clustering should not decrease without
limit as transaction frequency increases because other factors also determine minimum tick sizes.9 We only use front-month contracts for this regression, and due to the low frequency of odd-
ticks it was necessary to use 20-min intervals across the trading day, with an opening interval of 15
min. The number of transactions per ®ve minutes is used due to this shorter opening interval.
1202 O. ap Gwilym et al. / Journal of Banking & Finance 22 (1998) 1193±1206

outcry setting the use of odd ticks is cumbersome during busy periods anddiscussion with LIFFE sta� con®rmed this proposition.
4.2. The relationship between bid±ask spreads and odd ticks
A concern arising from the reporting of extreme clustering at NASDAQ wasthe implications for transactions costs in the form of wider spreads. The in-traday pattern in odd tick frequency identi®ed here may be consistent with theexistence of wide bid±ask spreads near the market open and a narrowing ofspreads at the close. We examine the FTSE100 futures contract to gauge theimpact of the avoidance of odd-tick quotes on bid±ask spreads. Since ourdataset includes a complete record of bid and ask quotes, the quoted spreadcan be measured directly. We take the ®rst bid and ®rst ask of each day as theopening spread, and then split the remainder of the day into 5-min intervals.For each interval on each day, the last bid and last ask are used to compute thespread. Because trading in this contract is concentrated in the front-monthcontract through to expiry, this contract is used until the day before its expiry,when the series moves on to the next contract.
With the exception of the opening and closing intervals, the mean spread foreach interval is around 1.3 index points. The mean spread is far wider at theopen than during the rest of the day, and this also corresponds with a periodcontaining a signi®cantly low proportion of odd-tick trades as discussed above.Wide spreads at the open are likely to be due to a need for protection againstovernight information. A narrowing of the spread observed in the closing in-terval is consistent with the increased proportion of odd-ticks discussed above.The closing interval is the only case where the mean spread is below one indexpoint. Also, whereas spreads at the open are highly variable across days,closing spreads are consistently narrow.
Table 5
The relationship between odd-tick trades and market closure, trade size, price, transaction fre-
quency and volatility for FTSE100 stock index futures
Variable Coe�cient t-statistic
a 0.085 0.20
b1 (08:35±08:50) )0.156 )2.06 b
b2 (15:50±16:10) 0.571 5.23 a
c1 0.049 2.98 a
c2 0.001 0.87
c3 2.668 7.36 a
c4 )1.218 )7.30 a
The estimation is by Generalised Method of Moments (GMM) to ensure robustness to he-
teroscedasticity and autocorrelation. Intervals with no trade were omitted, resulting in estimation
over 19,392 observations (846 days ´ 23 intervals (19458) minus 66 missing). Times are GMT.a Signi®cant at 1%.b Signi®cant at 5%.
O. ap Gwilym et al. / Journal of Banking & Finance 22 (1998) 1193±1206 1203

We now test the signi®cance of the relationship between the spread and thefrequency of odd-tick quotes, and the signi®cance of wide spreads at the openand narrow spreads at the close, by estimating the following regression 10
St � a� b1D1� b2D2� cODDt � �t; �2�where St is the absolute quoted spread for interval n �n � 1; . . . ; 31� on day i(i� 1, 845); and (0, 1) dummy variables are included for the opening (D1) andclosing (D2) intervals of the trading day. 11 The variable ODDt represents thenumber of odd-tick quotes per 5-min interval for interval n on day i. 12 Table 6presents the results, which con®rm prior expectations. The coe�cient on thedummy for the opening interval is signi®cantly positive, and the coe�cient forthe closing interval is signi®cantly negative. The coe�cient for the number ofodd-ticks is also signi®cantly negative, con®rming the hypothesis of an inverserelationship between the number of odd-tick quotes in an interval and the levelof the bid±ask spread.
Given the extreme price clustering at even-tick quotes documented for theFTSE100 futures contract, we also expect bid±ask spreads to cluster at eventick values, since an odd-tick value of the spread requires one side of the spreadto be at an even-tick and the other to be at an odd-tick. We ®nd that 97.8% ofspreads are at even-ticks, and almost two-thirds are at two ticks (one index
10 Due to the low frequency of odd-ticks, it was necessary to use 15-min intervals across the
trading day. The opening spread was retained and associated with the number of odd-ticks in the
®rst 5-min interval of the day. The remainder of the day was split into thirty equal intervals of 15
min, with the spread being based on the last bid and last ask in an interval as above, and the
number of odd-tick quotes was divided by 3 for consistency with the opening interval.11 We have 845 days for quotes, while there were 846 days for trades, because the quotes data for
27 March 1992 is absent from the time and sales tape.12 Following the comments of an anonymous referee, we re-estimated this equation replacing the
opening spread with the spread at the end of the ®rst 5-min interval of the day. The coe�cients were
virtually unchanged.
Table 6
The relationship between bid±ask spreads and odd-ticks, and market closure for the FTSE100
stock index futures contract
Variable Coe�cient t-statistic
a 1.381 321.30 a
b1 (08:35±08:40) 1.267 13.27 a
b2 (15:55±16:10) )0.269 )14.37 a
c )0.056 )12.55 a
The estimation is by Generalised Method of Moments (GMM) to ensure robustness to he-
teroscedasticity and autocorrelation. Intervals with no bid and/or no ask were omitted, resulting in
estimation for 24,921 observations (845 days ´ 31 intervals (26195) minus 1274 missing). Times are
GMT.a Signi®cant at 1%.
1204 O. ap Gwilym et al. / Journal of Banking & Finance 22 (1998) 1193±1206

point). Only 1.37% of spreads are at the minimum value of one tick. Similarresults are found for the FTSE100 index options.
5. Summary and conclusions
This paper is the ®rst to document price clustering in ®nancial derivatives.We ®nd that quotes and trades in the FTSE100 stock index futures and optionscontracts and the FTSE250 stock index futures contract are heavily concen-trated at full index points despite a minimum tick of 0.5 index points. For eachcontract, around 98% of trades occur at full index points. The FTSE250 futuresand FTSE100 options also exhibit clustering at the decimals 0 and 5 for the®nal whole digit of price. The options contracts show a tendency for any tradesand quotes at odd tick values to be for low priced contracts such as those whichare out-of-the-money and/or nearing maturity, which is consistent with theevidence by Harris (1991) for US stocks. These results suggest that the marketdoes not seem to require the additional price re®nement of half index points,and support the price resolution hypothesis by Ball et al. (1985).
A major innovation of this study is the examination of clustering on anintraday basis. For the FTSE100 futures contracts, we report a signi®cantrelationship between the percentage of trades at an odd tick and mean tradesize. This is consistent with the negotiation hypothesis by Harris (1991) in thatlarger trade sizes justify the costs of negotiating prices. We also ®nd that theproportion of odd ticks is signi®cantly lower near the market open, and sig-ni®cantly higher near the close. Clustering increases with volatility and withtransaction frequency. The former supports expectations, but the latter iscontrary to Harris (1991).
A signi®cant inverse relationship is reported between the bid±ask spread andthe number of odd ticks. Wide spreads at the open correspond with a lowpercentage of odd ticks, while narrow spreads near the close correspond with arelatively high percentage of odd ticks. This intraday pattern suggests that theuse of odd ticks is driven more by the desired quoted spread than by volume oftrading (which is high at both open and close). We also document clustering ofthe bid±ask spread, with 98% of spreads at even-tick values.
The results support both the price resolution hypothesis by Ball et al. (1985),and to a lesser extent, the negotiation hypothesis by Harris (1991). We ®ndonly limited evidence for the attraction hypothesis by Goodhart and Curcio(1991), speci®cally in the price clustering characteristics of the FTSE250 futuresand FTSE100 options contracts. Although odd ticks are used rarely in thesemarkets, those instances when they are used more frequently, for example atthe close of trading and for larger volume trades, may be extremely importantfor a trader needing to unwind a position rapidly. Therefore, although an in-crease in the minimum tick to a full index point may reduce negotiation costs
O. ap Gwilym et al. / Journal of Banking & Finance 22 (1998) 1193±1206 1205

by reducing the available price set, this would be achieved at the expense ofwider spreads at the close of trading and for relatively large trades.
References
Ball, C.A., Torous, W.A., Tschoegl, A.E., 1985. The degree of price resolution: The case of the gold
market. Journal of Futures Markets 5, 29±43.
Brown, S., Laux, P., Schachter, B., 1991. On the existence of an optimal tick size. Review of
Futures Markets 10, 50±72.
Christie, W.G., Schultz, P.H., 1994. Why do NASDAQ market makers avoid odd-eighth quotes?
Journal of Finance 49, 1813±1840.
Christie, W.G., Harris, J.H., Schultz, P.H., 1994. Why did NASDAQ market makers stop avoiding
odd-eighth quotes? Journal of Finance 49, 1841±1860.
Ekman, P.D., 1992. Intraday patterns in the S&P500 index futures market. Journal of Futures
Markets 12, 365±382.
Goodhart, C., Curcio, R., 1991. The clustering of bid-ask prices and the spread in the foreign
exchange market. Discussion paper 110. London School of Economics, London.
Gottlieb, G., Kalay, A., 1985. Implications of the discreteness of observed stock prices. Journal of
Finance 40, 135±153.
Grossman, S.J., Miller, M.H., Fischel, D.R., Cone, K.R., Ross, D.J., 1996. Clustering and
competition in asset markets. A Lexecon report.
Harris, L.E., 1991. Stock price clustering and discreteness. Review of Financial Studies 4, 389±415.
1206 O. ap Gwilym et al. / Journal of Banking & Finance 22 (1998) 1193±1206