Column configurations of continuous heterogeneous extractive distillation
Upload
independentCategory
view
1download
0
Available on line at
Association of the Chemical Engineers of Serbia AChE www.ache.org.rs/CICEQ
Chemical Industry & Chemical Engineering Quarterly 18 (2) 179−191 (2012) CI&CEQ
179
RAGAA EL SHEIKH1 NAHLA S. ESMAIL2 AYMAN A. GOUDA1
WALID ABDEL BASSET2 1Chemistry Department, Faculty of
Science, Zagazig University, Zagazig, Egypt
2National Organization for Drug Control and Research, Dokki, Giza,
Egypt
SCIENTIFIC PAPER
UDC 543.422.3:661.12
DOI 10.2298/CICEQ110917060E
EXTRACTIVE SPECTROPHOTOMETRIC DETERMINATION OF SOME α-ADRENERGIC--ANTAGONISTS IN PURE FORMS AND IN PHARMACEUTICAL FORMULATIONS
A simple, rapid, and extractive spectrophotometric method was developed for the determination of some postsynaptic α-1 adrenoreceptor antagonists: doxa-zosin mesylate (DOX), terazosin (TRZ) and alfuzosine HCl (ALF) in pure forms and pharmaceutical formulations. The developed methods are based on the formation of yellow colored chloroform ion-pair complexes between the basic nitrogen of the drugs and dyes, namely: bromocresol green (BCG), bromothy-mol blue (BTB), methyl orange (MO) and alizarine red S (ARS), in acidic buffer of pH range 3.0-5.0. The formed complexes were extracted with chloroform or dichloromethane and measured at 418, 414, 425 and 426 nm for DOX, at 419, 415, 425 and 428 nm for TRZ and at 418, 412, 421 and 427 nm for ALF using BCG, BTB, MO and ARS, respectively. The analytical parameters and their effects on the reported systems are investigated. Beer’s law was obeyed in the range 1.0–130 µg mL−1 with correlation coefficient (n = 6) ≥ 0.9991. The molar absorpitivity, Sandell sensitivity, detection and quantification limits were also calculated. The composition of the ion associates was found 1:1 by Job’s me-thod. The proposed methods have been applied successfully for the analysis of the studied drugs in pure forms and in pharmaceutical formulations with percentage recoveries ranging from 99.18–100.61. The results of the analysis were validated statistically. The results were in good agreement and compared with those obtained with reported methods.
Keywords: doxazosin mesylate, terazosin, alfuzosine HCl, spectro-photometry, ion pair complex, acid dyes, pharmaceutical formulations.
Doxazosin mesylate (DOX) is known chemically as 1-(4-amino-6,7-dimethoxy-2-quinazolinyl)-4-(1,4-ben-zodioxan-2-ylcarbonyl) piperazine methanesulfonate. DOX reduces peripheral vascular resistance and blood pressure. As a result of its vasodilating effects, the drug produces both arterial and venous dilation. DOX reduces blood pressure in both supine and standing patients. The effect is most pronounced on standing blood pressure and postural hypotension can occur. DOX generally causes a change in heart rate of car-diac output in the supine position [1].
Correspondening author: A.A. Gouda, Chemistry Department, Faculty of Science, Zagazig University, Zagazig, Egypt. E-mail: [email protected] Paper received: 17 September, 2011 Paper revised: 1 November, 2011 Paper accepted: 8 December, 2011
High–performance liquid chromatography has been developed for the determination of DOX in bio-logical fluid by fluorescence detector [2-4], in which DOX in human plasma was extracted by liquid-liquid extraction. Solid-phase extraction was used to sepa-rate DOX from plasma samples and Zorbax CN co-lumn was used as stationary phase [5]. Spectrophoto-metric methods were used for determination of DOX in tablets by ion-pair and charge-transfer complex-ation reactions [6].
Terazosin hydrochloride dihydrate (TRZ) is known chemically as 2-[4-(2-tetrahydrofuranyl)carbonyl]-1-pi-perazinyl-6,7-dimethoxy-4-quinazolinamine monohyd-rochloride dihydrate. TRZ is a highly selective potent α-1 adrenoreceptor antagonist. It is an effective drug for hypertension (high blood pressure) and benign prostatic hyperplasia (enlarged prostate). It causes the blood vessels (veins and arteries) to relax and ex-

R. EL SHEIKH et al.: EXTRACTIVE SPECTROPHOTOMETRIC DETERMINATION… CI&CEQ 18 (2) 179−191 (2012)
180
pand, improving blood flow. TRZ also relaxes mus-cles in the prostate and bladder neck, making it easier to urinate [7].
Several analytical methods have been reported for the determination of TRZ in human plasma fol-lowing intravenous or oral dosing. The methods des-cribed include high performance liquid chromatogra-phy (HPLC) with fluorescence detection [8–10], mass spectrometric detection [11] and UV detection [12], al-though such detector systems may not be available in most laboratories. X-ray fluorescence spectrometry is based on the formation of ion-pair associates with zinc-thiocyanate [13]. Electrochemical method uses potentiometric sensors and other voltammetric techni-ques [14,15]. Terazosin has been determined by fluo-rimetry [16] and spectrophotometric methods [17-22].
Alfuzosin HCl (ALF), (R,S)-N-{3-[(4-amino-6,7- -dimethoxy-2-quinazolinyl)methylamino]propyl} tetra-hydro-2-furancarboxamide hydrochloride, is used in the treatment of benign prostatic hyperplasia (BPH). ALF is an α1-adrenoreceptor blocker, can cause smooth muscles in the bladder neck and prostate to relax, resulting in an improvement in urine flow and a reduction in symptoms of BPH [23].
Literature survey revealed a selective, sensitive and rapid liquid chromatography–tandem mass spec-trometry method for the determination of ALF in hu-man plasma [24]. A direct high-performance liquid chromatographic method is also reported for the de-termination of enantiomers of ALF in plasma [25,26]. High-performance liquid chromatographic determina-tion with fluorimetric detection is available for estima-tion of ALF in biological fluids [27]. ALF is estimated by HPLC with column switching [28] and by reverse phase performance liquid chromatography (RPHPLC) and high performance thin layer chromatography (HPTLC) [29-31]. Determination of ALF in pharmaceu-ticals, human serum and simulated gastric juice by voltammetry method is also found in literature [32]. ALF is determined by spectrophotometric and colo-rimetric methods in pharmaceutical preparations [33- -37]. A Stability indicating spectrophotometric and spectrofluorimetric and HPTLC methods are also found for ALF in bulk as well as pharmaceutical formulations [38,39].
The studied drugs, DOX, TRZ and ALF, are se-lective antagonists of α1-adrenoreceptors and are quinazoline derivatives represented by the following structural formulas shown in Figure 1.
Spectrophotometry is characterized by its speed and simplicity, accuracy and inexpensive instruments needed, and hence it is an important alternative to other analytical techniques with clear advantages in terms of cost of analysis. Extractive spectro-
photometric procedures are popular for their sensi-tivity in the assay of drugs and, therefore, ion-pair extractive spectrophotometry has received consi-derable attention for the quantitative determination of many pharmaceutical compounds [40-43].
N
NH3CO
NH2
NH3CO NH
CH3
OO
HCl
ALF
N
NH3CO
NH2
NH3CO N C
O
O
O
.CH2SO3H DOX
N
NH3CO
NH2
NH3CO N C
O
O .HCl.2H2O TRZ
Figure 1. The chemical structure of the studied drugs.
In the present investigation, we report that the development of four accurate, reproducible, less time consuming and adequately sensitive extractive spec-trophotometric methods based on the formation of ion-pair complexes between DOX, TRZ and ALF with anionic dyes, namely bromocresol green (BCG), bro-mothymol blue (BTB), methyl orange (MO) and ali-zarine red S (ARS) compared with other reported me-thods. The proposed methods were applied to the determination of DOX, TRZ and ALF in pure forms and in pharmaceutical formulations. These methods are validated by the statistical data.
EXPERIMENTAL
Apparatus
All absorption spectra were made using a Uni-cam 930 (UV-Visible) spectrophotometer (Germany) with a scanning speed of 200 nm/min and a band-width of 2.0 nm and a Perkin-Elmer single beam spectrophotometer, equipped with 10 mm matched quartz cells. A Hanna pH-meter instrument (Portugal) (HI: 9321) was used for checking the pH of buffer solutions pH ranges from (2.0–7.0).
Materials and reagents
All chemicals and reagents were of analytical grade and water was always bidistilled water.
R. EL SHEIKH et al.: EXTRACTIVE SPECTROPHOTOMETRIC DETERMINATION… CI&CEQ 18 (2) 179−191 (2012)
181
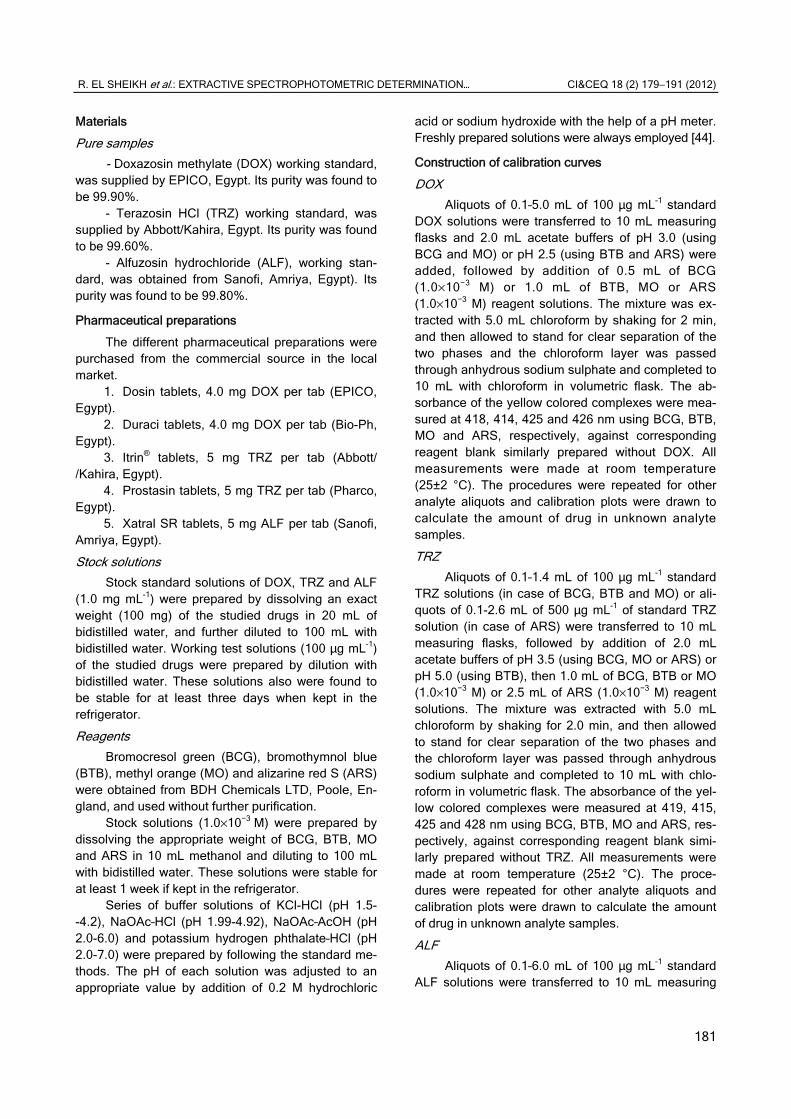
Materials
Pure samples
- Doxazosin methylate (DOX) working standard, was supplied by EPICO, Egypt. Its purity was found to be 99.90%.
- Terazosin HCl (TRZ) working standard, was supplied by Abbott/Kahira, Egypt. Its purity was found to be 99.60%.
- Alfuzosin hydrochloride (ALF), working stan-dard, was obtained from Sanofi, Amriya, Egypt). Its purity was found to be 99.80%.
Pharmaceutical preparations
The different pharmaceutical preparations were purchased from the commercial source in the local market.
1. Dosin tablets, 4.0 mg DOX per tab (EPICO, Egypt).
2. Duraci tablets, 4.0 mg DOX per tab (Bio-Ph, Egypt).
3. Itrin® tablets, 5 mg TRZ per tab (Abbott/ /Kahira, Egypt).
4. Prostasin tablets, 5 mg TRZ per tab (Pharco, Egypt).
5. Xatral SR tablets, 5 mg ALF per tab (Sanofi, Amriya, Egypt).
Stock solutions
Stock standard solutions of DOX, TRZ and ALF (1.0 mg mL-1) were prepared by dissolving an exact weight (100 mg) of the studied drugs in 20 mL of bidistilled water, and further diluted to 100 mL with bidistilled water. Working test solutions (100 µg mL-1) of the studied drugs were prepared by dilution with bidistilled water. These solutions also were found to be stable for at least three days when kept in the refrigerator.
Reagents
Bromocresol green (BCG), bromothymnol blue (BTB), methyl orange (MO) and alizarine red S (ARS) were obtained from BDH Chemicals LTD, Poole, En-gland, and used without further purification.
Stock solutions (1.0×10⁻³ M) were prepared by dissolving the appropriate weight of BCG, BTB, MO and ARS in 10 mL methanol and diluting to 100 mL with bidistilled water. These solutions were stable for at least 1 week if kept in the refrigerator.
Series of buffer solutions of KCl-HCl (pH 1.5- -4.2), NaOAc–HCl (pH 1.99-4.92), NaOAc–AcOH (pH 2.0-6.0) and potassium hydrogen phthalate–HCl (pH 2.0-7.0) were prepared by following the standard me-thods. The pH of each solution was adjusted to an appropriate value by addition of 0.2 M hydrochloric
acid or sodium hydroxide with the help of a pH meter. Freshly prepared solutions were always employed [44].
Construction of calibration curves
DOX
Aliquots of 0.1–5.0 mL of 100 µg mL-1 standard DOX solutions were transferred to 10 mL measuring flasks and 2.0 mL acetate buffers of pH 3.0 (using BCG and MO) or pH 2.5 (using BTB and ARS) were added, followed by addition of 0.5 mL of BCG (1.0×10⁻³ M) or 1.0 mL of BTB, MO or ARS (1.0×10⁻³ M) reagent solutions. The mixture was ex-tracted with 5.0 mL chloroform by shaking for 2 min, and then allowed to stand for clear separation of the two phases and the chloroform layer was passed through anhydrous sodium sulphate and completed to 10 mL with chloroform in volumetric flask. The ab-sorbance of the yellow colored complexes were mea-sured at 418, 414, 425 and 426 nm using BCG, BTB, MO and ARS, respectively, against corresponding reagent blank similarly prepared without DOX. All measurements were made at room temperature (25±2 °C). The procedures were repeated for other analyte aliquots and calibration plots were drawn to calculate the amount of drug in unknown analyte samples.
TRZ
Aliquots of 0.1–1.4 mL of 100 µg mL-1 standard TRZ solutions (in case of BCG, BTB and MO) or ali-quots of 0.1-2.6 mL of 500 µg mL-1 of standard TRZ solution (in case of ARS) were transferred to 10 mL measuring flasks, followed by addition of 2.0 mL acetate buffers of pH 3.5 (using BCG, MO or ARS) or pH 5.0 (using BTB), then 1.0 mL of BCG, BTB or MO (1.0×10⁻³ M) or 2.5 mL of ARS (1.0×10⁻³ M) reagent solutions. The mixture was extracted with 5.0 mL chloroform by shaking for 2.0 min, and then allowed to stand for clear separation of the two phases and the chloroform layer was passed through anhydrous sodium sulphate and completed to 10 mL with chlo-roform in volumetric flask. The absorbance of the yel-low colored complexes were measured at 419, 415, 425 and 428 nm using BCG, BTB, MO and ARS, res-pectively, against corresponding reagent blank simi-larly prepared without TRZ. All measurements were made at room temperature (25±2 °C). The proce-dures were repeated for other analyte aliquots and calibration plots were drawn to calculate the amount of drug in unknown analyte samples.
ALF
Aliquots of 0.1–6.0 mL of 100 µg mL-1 standard ALF solutions were transferred to 10 mL measuring
R. EL SHEIKH et al.: EXTRACTIVE SPECTROPHOTOMETRIC DETERMINATION… CI&CEQ 18 (2) 179−191 (2012)
182
flasks, followed by addition of 2.0 mL acetate buffers of pH 2.5 (using BCG or BTB) or pH 3.0 (using MO or ARS), respectively, then 1.0 mL of BCG, BTB, MO or ARS (1.0×10⁻³ M) reagent solutions. The mixture was extracted with 5.0 mL chloroform by shaking for 2.0 min, and then allowed to stand for clear separation of the two phases and the chloroform layer was passed through anhydrous sodium sulphate and completed to 10 mL with chloroform in volumetric flask. The absor-bance of the yellow colored complexes were mea-sured at 418, 412, 421 and 427 nm using BCG, BTB, MO and ARS, respectively, against corresponding reagent blank similarly prepared without ALF. All mea-surements were made at room temperature (25±2 °C). The procedures were repeated for other analyte aliquots and calibration plots were drawn to calculate the amount of drug in unknown analyte samples.
Procedures for pharmaceutical formulations (tablets)
The contents of twenty tablets: dosin tablets or duraci tablets, 4.0 mg DOX per tablet; itrin® tablets or prostasin tablets, 5.0 mg TRZ per tablet; and xatral SR tablets, 5.0 mg ALF per tablet, were crushed, fi-nely powdered, weighed out and the average weight of one tablet was determined for each drug. An ac-curate weight equivalent to 5.0 mg DOX, TRZ or ALF was transferred into a 50 mL calibrated flask, dis-solved in 20 mL methanol with shaking for 5 min and filtered using Whatman No. 42 filter paper. The first 10 mL portion of the filtrate was rejected and the fil-trate was diluted to 50 mL with bidistilled water in a 50 mL measuring flask to give 100 μg mL-1 stock solu-tion. Aliquots of the cited solutions were taken and analyzed as described under the above recom-mended procedures for construction of calibration curves. For the proposed methods, the content of a tablet was calculated using the corresponding regres-sion equation of the appropriate calibration graph.
Stoichiometric relationship
Job’s method of continuous variation [45] of equimolar solutions was employed: a 5.0×10⁻⁴ M standard solution of drugs base and 5.0×10⁻⁴ M so-lutions of BCG, BTB, MO and ARS, respectively, were used. A series of solutions was prepared in which the total volume of the studied drugs and the dyes was kept at 5.0 mL. The drug and reagent were mixed in various complementary proportions (0:5, 1:4, 2:3, 5:0, inclusive) and completed as directed under the recommended procedures. The absorbance of the resultant ion-pair complex was measured at optimum wavelengths.
RESULTS AND DISCUSSION
Absorption spectra
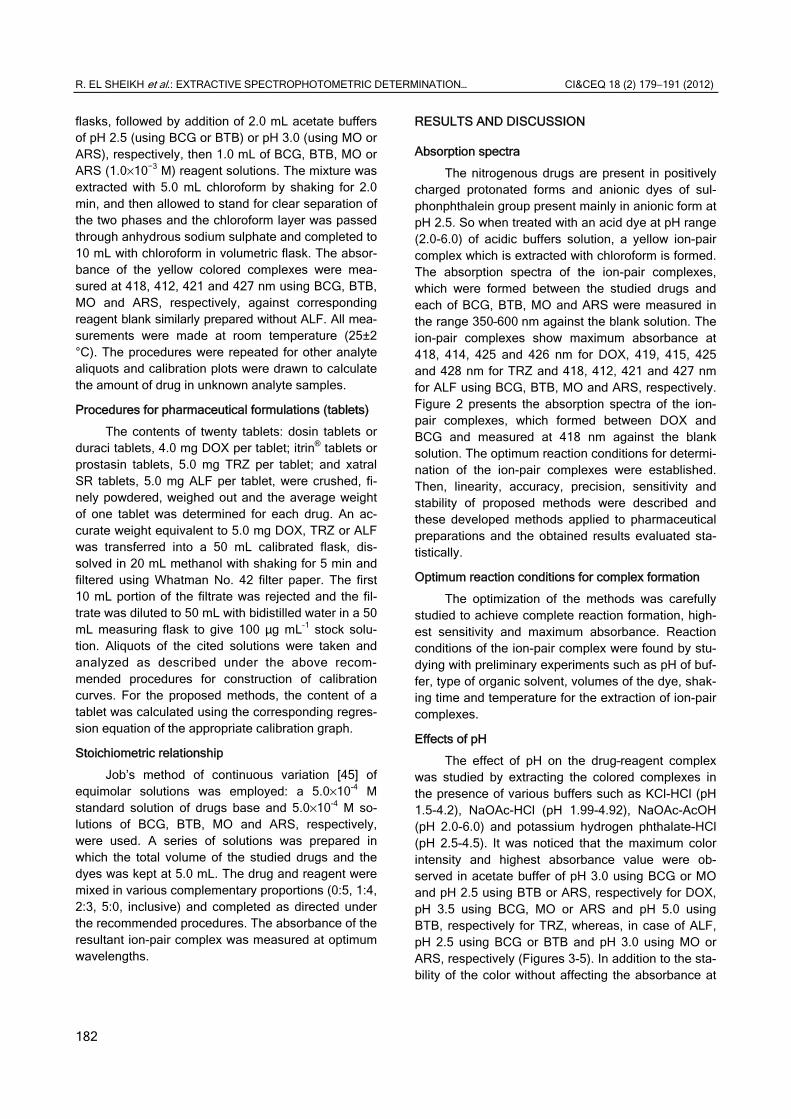
The nitrogenous drugs are present in positively charged protonated forms and anionic dyes of sul-phonphthalein group present mainly in anionic form at pH 2.5. So when treated with an acid dye at pH range (2.0-6.0) of acidic buffers solution, a yellow ion-pair complex which is extracted with chloroform is formed. The absorption spectra of the ion-pair complexes, which were formed between the studied drugs and each of BCG, BTB, MO and ARS were measured in the range 350–600 nm against the blank solution. The ion-pair complexes show maximum absorbance at 418, 414, 425 and 426 nm for DOX, 419, 415, 425 and 428 nm for TRZ and 418, 412, 421 and 427 nm for ALF using BCG, BTB, MO and ARS, respectively. Figure 2 presents the absorption spectra of the ion-pair complexes, which formed between DOX and BCG and measured at 418 nm against the blank solution. The optimum reaction conditions for determi-nation of the ion-pair complexes were established. Then, linearity, accuracy, precision, sensitivity and stability of proposed methods were described and these developed methods applied to pharmaceutical preparations and the obtained results evaluated sta-tistically.
Optimum reaction conditions for complex formation
The optimization of the methods was carefully studied to achieve complete reaction formation, high-est sensitivity and maximum absorbance. Reaction conditions of the ion-pair complex were found by stu-dying with preliminary experiments such as pH of buf-fer, type of organic solvent, volumes of the dye, shak-ing time and temperature for the extraction of ion-pair complexes.
Effects of pH
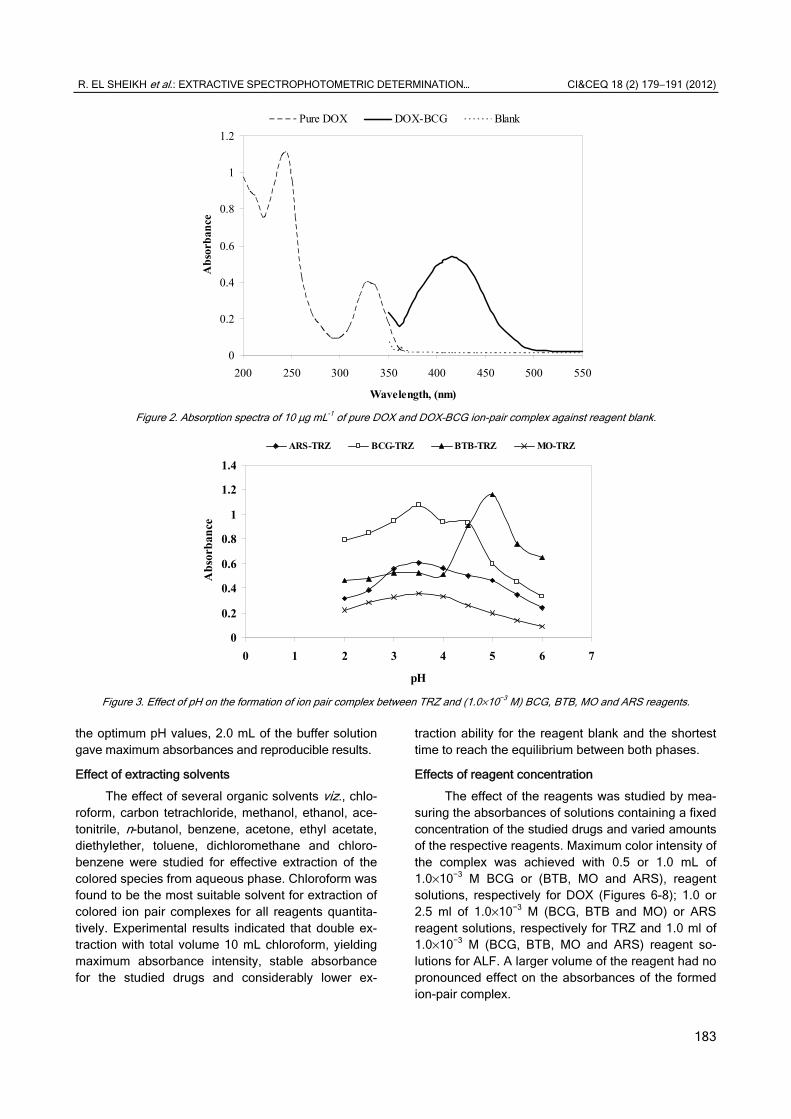
The effect of pH on the drug–reagent complex was studied by extracting the colored complexes in the presence of various buffers such as KCl-HCl (pH 1.5-4.2), NaOAc-HCl (pH 1.99-4.92), NaOAc-AcOH (pH 2.0-6.0) and potassium hydrogen phthalate-HCl (pH 2.5-4.5). It was noticed that the maximum color intensity and highest absorbance value were ob-served in acetate buffer of pH 3.0 using BCG or MO and pH 2.5 using BTB or ARS, respectively for DOX, pH 3.5 using BCG, MO or ARS and pH 5.0 using BTB, respectively for TRZ, whereas, in case of ALF, pH 2.5 using BCG or BTB and pH 3.0 using MO or ARS, respectively (Figures 3-5). In addition to the sta-bility of the color without affecting the absorbance at
R. EL SHEIKH et al.: EXTRACTIVE SPECTROPHOTOMETRIC DETERMINATION… CI&CEQ 18 (2) 179−191 (2012)
183
the optimum pH values, 2.0 mL of the buffer solution gave maximum absorbances and reproducible results.
Effect of extracting solvents
The effect of several organic solvents viz., chlo-roform, carbon tetrachloride, methanol, ethanol, ace-tonitrile, n-butanol, benzene, acetone, ethyl acetate, diethylether, toluene, dichloromethane and chloro-benzene were studied for effective extraction of the colored species from aqueous phase. Chloroform was found to be the most suitable solvent for extraction of colored ion pair complexes for all reagents quantita-tively. Experimental results indicated that double ex-traction with total volume 10 mL chloroform, yielding maximum absorbance intensity, stable absorbance for the studied drugs and considerably lower ex-
traction ability for the reagent blank and the shortest time to reach the equilibrium between both phases.
Effects of reagent concentration
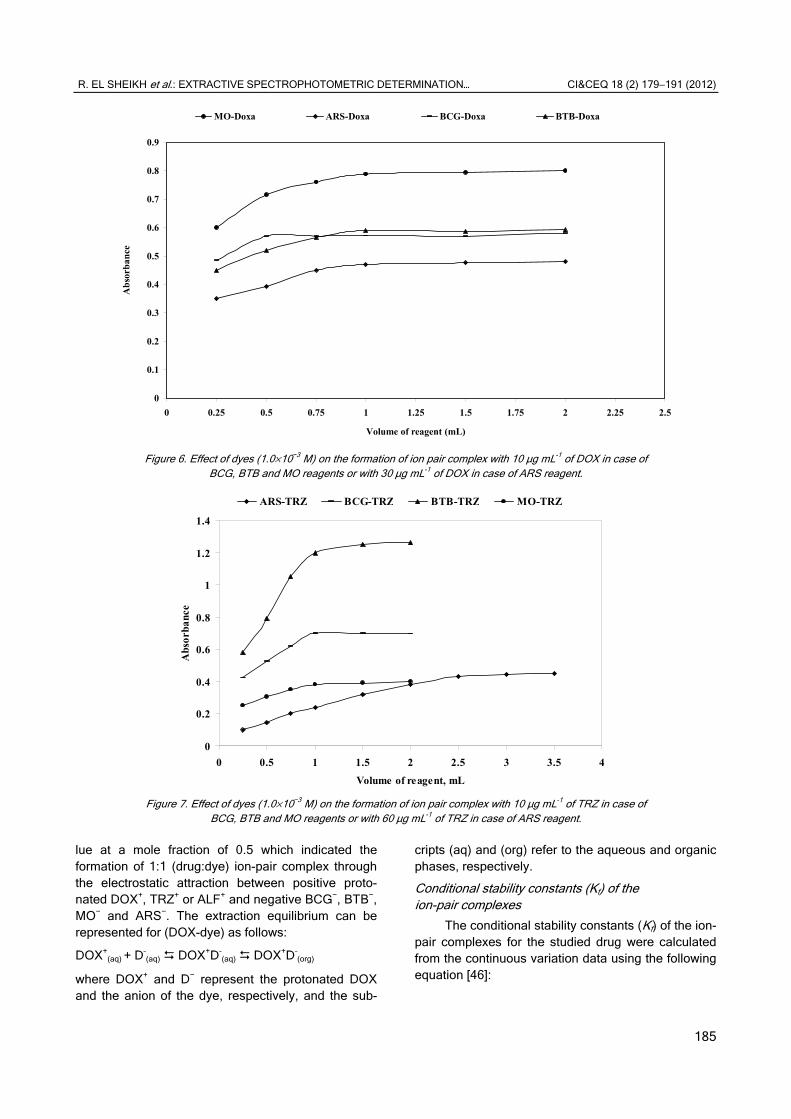
The effect of the reagents was studied by mea-suring the absorbances of solutions containing a fixed concentration of the studied drugs and varied amounts of the respective reagents. Maximum color intensity of the complex was achieved with 0.5 or 1.0 mL of 1.0×10⁻³ M BCG or (BTB, MO and ARS), reagent solutions, respectively for DOX (Figures 6-8); 1.0 or 2.5 ml of 1.0×10⁻³ M (BCG, BTB and MO) or ARS reagent solutions, respectively for TRZ and 1.0 ml of 1.0×10⁻³ M (BCG, BTB, MO and ARS) reagent so-lutions for ALF. A larger volume of the reagent had no pronounced effect on the absorbances of the formed ion-pair complex.
0
0.2
0.4
0.6
0.8
1
1.2
200 250 300 350 400 450 500 550
Wavelength, (nm)
Ab
sorb
ance
Pure DOX DOX-BCG Blank
Figure 2. Absorption spectra of 10 μg mL-1 of pure DOX and DOX–BCG ion-pair complex against reagent blank.
0
0.2
0.4
0.6
0.8
1
1.2
1.4
0 1 2 3 4 5 6 7
pH
Ab
sorb
ance
ARS-TRZ BCG-TRZ BTB-TRZ MO-TRZ
Figure 3. Effect of pH on the formation of ion pair complex between TRZ and (1.0×10⁻³ M) BCG, BTB, MO and ARS reagents.

R. EL SHEIKH et al.: EXTRACTIVE SPECTROPHOTOMETRIC DETERMINATION… CI&CEQ 18 (2) 179−191 (2012)
184
0
0.1
0.2
0.3
0.4
0.5
0.6
0 1 2 3 4 5 6 7
pH
Abs
orba
nce
ARS-DOX MO-DOX BCG-DOX BTB-DOX
Figure 4. Effect of pH on the formation of ion pair complex between DOX and (1.0×10⁻³ M) BCG, BTB, MO and ARS reagents.
0
0.1
0.2
0.3
0.4
0.5
0.6
0.7
0.8
0 1 2 3 4 5 6 7
pH
Abs
orba
nce
ARS-ALF MO-ALF BCG-ALF BTB-ALF
Figure 5. Effect of pH on the formation of ion pair complex between ALF and (1.0×10⁻³ M) BCG, BTB, MO and ARS reagents.
Effect of time and temperature
The optimum reaction time was investigated from 0.5 to 5.0 min by following the color develop-ment at ambient temperature (25±2 °C). Complete co-lor intensity was attained after 2.0 min of mixing for all complexes. The effect of temperature on colored complexes was investigated by measuring the absor-bance values at different temperatures. It was found that the colored complexes were stable up to 30 °C. At higher temperatures, the drug concentration was found to increase due to the volatile nature of the
chloroform. The stability of the ion-pair complexes was evaluated. The formation of the ion-pairs were rapid and the yellow color extracts were stable at least for least 6.0 h at room temperature for all drug-dye reagents without any change in color intensity and the maximum absorbance at room temperature.
Stoichiometric relationship
In order to establish the molar ratio between the studied drugs and dyes, Job’s method of continuous variation of equimolar solutions was applied. In all cases, the plot reached a maximum absorbance va-
R. EL SHEIKH et al.: EXTRACTIVE SPECTROPHOTOMETRIC DETERMINATION… CI&CEQ 18 (2) 179−191 (2012)
185
0
0.1
0.2
0.3
0.4
0.5
0.6
0.7
0.8
0.9
0 0.25 0.5 0.75 1 1.25 1.5 1.75 2 2.25 2.5
Volume of reagent (mL)
Ab
sorb
ance
MO-Doxa ARS-Doxa BCG-Doxa BTB-Doxa
Figure 6. Effect of dyes (1.0×10⁻³ M) on the formation of ion pair complex with 10 μg mL-1 of DOX in case of BCG, BTB and MO reagents or with 30 μg mL-1 of DOX in case of ARS reagent.
0
0.2
0.4
0.6
0.8
1
1.2
1.4
0 0.5 1 1.5 2 2.5 3 3.5 4
Volume of reagent, mL
Abs
orba
nce
ARS-TRZ BCG-TRZ BTB-TRZ MO-TRZ
Figure 7. Effect of dyes (1.0×10⁻³ M) on the formation of ion pair complex with 10 μg mL-1 of TRZ in case of BCG, BTB and MO reagents or with 60 μg mL-1 of TRZ in case of ARS reagent.
lue at a mole fraction of 0.5 which indicated the formation of 1:1 (drug:dye) ion-pair complex through the electrostatic attraction between positive proto-nated DOX+, TRZ+ or ALF+ and negative BCG−, BTB−, MO− and ARS−. The extraction equilibrium can be represented for (DOX-dye) as follows:
DOX+(aq) + D–
(aq) DOX+D–(aq) DOX+D–
(org)
where DOX+ and D− represent the protonated DOX and the anion of the dye, respectively, and the sub-
cripts (aq) and (org) refer to the aqueous and organic phases, respectively.
Conditional stability constants (Kf) of the ion-pair complexes
The conditional stability constants (Kf) of the ion-pair complexes for the studied drug were calculated from the continuous variation data using the following equation [46]:

R. EL SHEIKH et al.: EXTRACTIVE SPECTROPHOTOMETRIC DETERMINATION… CI&CEQ 18 (2) 179−191 (2012)
186
m2
m M
/
(1 / )f n n
A AK
A A c n+=−
where A is the observed maximum absorbance, Am is the absorbance value when all the drug present is associated, cM is the molar concentration of drug corresponding to maximum absorbance and n is the stoichiometry with which the dye ion associates with the drug. The log Kf values for drug-dye ion-pair as-sociates are presented in Table 1.
Method validation procedures
The analytical method was validated according to the International Conference for Harmonization (ICH) guidelines [47] under the optimized experi-mental conditions: linearity, accuracy, precision, spe-cificity and stability of ion pair complex.
Linearity
At the described experimental conditions for DOX, TRZ and ALF determination, calibration graphs for DOX, TRZ and ALF with BCG, BTB, MO and ARS,
0
0.2
0.4
0.6
0.8
1
1.2
0 0.5 1 1.5 2 2.5
Volume of reagent, mL
Ab
sorb
ance
MO-AlF ARS-ALF BCG-ALF BTB-ALF
Figure 8. Effect of dyes (1.0×10⁻³ M) on the formation of ion pair complex with 10 μg mL-1 of ALF in case of BCG, BTB and MO reagents or with 30 μg mL-1 of ALF in case of ARS reagent.
Table 1. Statistical Analysis for determination of DOX, TRZ and ALF; the theoretical values of t and F at P = 0.05 are 2.31 and 6.39, respectively; LOD: limit of detection; LOQ: limit of quantification; ε: molar absorptivity
Parameter DOX TRZ ALF
BCG BTB MO ARS BCG BTB MO ARS BCG BTB MO ARS
Wavelength, λmax / nm 418 414 425 426 419 415 425 428 418 412 421 427
pH 3.0 2.5 3.0 2.5 3.5 5.0 3.5 3.5 2.5 2.5 3.0 3.0
Beer’s law limits, µg mL−1 1.0-12 1.0-16 1.0-12 4.0-50 2.0-14 1.0-12 1.0-10 5.0-130 1.0-16 1.0-16 2.0-16 2.0-60
Molar absorptivity, ε×104 / L mol-1 cm-1 3.063 2.195 4.89 1.3497 3.331 4.644 2.66 0.319 3.457 3.717 3.341 1.379
Sandell’s sensitivity, ng cm-2 17.88 24.95 11.20 40.57 13.81 10.30 17.30 144.96 12.32 11.46 12.75 30.88
Regression equation: y = a + bC, where C is the concentration in µg mL−1, y is the absorbance
Slope (b) 0.0306 0.0324 0.0694 0.0125 0.0388 0.0481 0.0304 0.0021 0.0548 0.0512 0.0895 0.0118
Intercept (a) 0.0792 0.0260 0.0632 0.1402 0.1819 0.1545 0.076 0.0998 0.0824 0.1132 -0.0603 0.1337
Correlation coefficient (r) 0.9995 0.9996 0.9998 0.9998 0.9997 0.9999 0.9996 0.9991 0.9999 0.9997 0.9998 0.9996
Mean±SD 99.65 ±1.38
99.95±0.758
100.07±0.888
99.18±1.01
99.87±1.15
99.786±0.638
99.99±1.23
99.82 ±0.708
100.61 ±0.843
100.21 ±0.73
99.92±1.17
100.50±1.40
RSD, % 1.38 0.758 0.887 1.02 1.15 0.639 1.23 0.709 0.838 0.728 1.17 1.39
RE, % 1.45 0.796 0.931 1.07 1.21 0.671 1.29 0.744 0.879 0.765 1.23 1.46
SD of blank 0.0028 0.0032 0.0038 0.0028 0.0024 0.0017 0.0029 0.0009 0.0041 0.0051 0.0075 0.0022
LOD, µg mL−1 0.275 0.296 0.164 0.672 0.186 0.106 0.286 1.286 0.224 0.299 0.251 0.559
LOQ, µg mL−1 0.915 0.988 0.547 2.24 0.619 0.353 0.954 4.286 0.748 0.996 0.838 1.86
log Kf 5.63 5.94 6.39 5.16 5.77 6.58 5.91 5.84 6.37 5.58 5.89 6.25
R. EL SHEIKH et al.: EXTRACTIVE SPECTROPHOTOMETRIC DETERMINATION… CI&CEQ 18 (2) 179−191 (2012)
187
were constructed from six points covering the concen-tration ranges 1.0-50, 1.0-130 and 1.0-60 μg mL-1 for DOX, TRZ and ALF, respectively. Regression analysis of the Beer’s law data indicated a linear relationship between absorbance and concentration (Table 1). The calibration graph is described by the equation:
Y = a + bX
where Y = absorbance, a = intercept, b = slope and X = concentration in μg mL-1 obtained by the method of least squares. Correlation coefficient, intercept and slope for the calibration data are summarized in Table 1. Sensitivity parameters such as apparent molar absorptivity and Sandell sensitivity of the resulting ion-pair complexes and relative standard deviation of response factors for each method are also summa-rized in Table 1. The molar absorptivity of MO > BCG > BTB > ARS ion-pair complexes for DOX, BTB > BCG > MO > ARS ion-pair complexes for TRZ, while for ALF the molar absorptivity of BTB > BCG > MO > ARS ion-pair complexes. The statistical parameters were given in the regression equation calculated from the calibration graphs.
Sensitivity
The detection limit (LOD) for the proposed me-thods was calculated using the following equation [47]:
LOD = 3.3s/k where s is the standard deviation of the response of the blank or the standard deviation of intercepts of regression lines and k is the sensitivity, namely the slope of the calibration curve. In accordance with the formula, the detection limits are presented in Table 1.
The limit of quantitation, LOQ, was defined as [47]:
LOQ = 10s/k The calculated values are given in Table 1.
Accuracy and precision
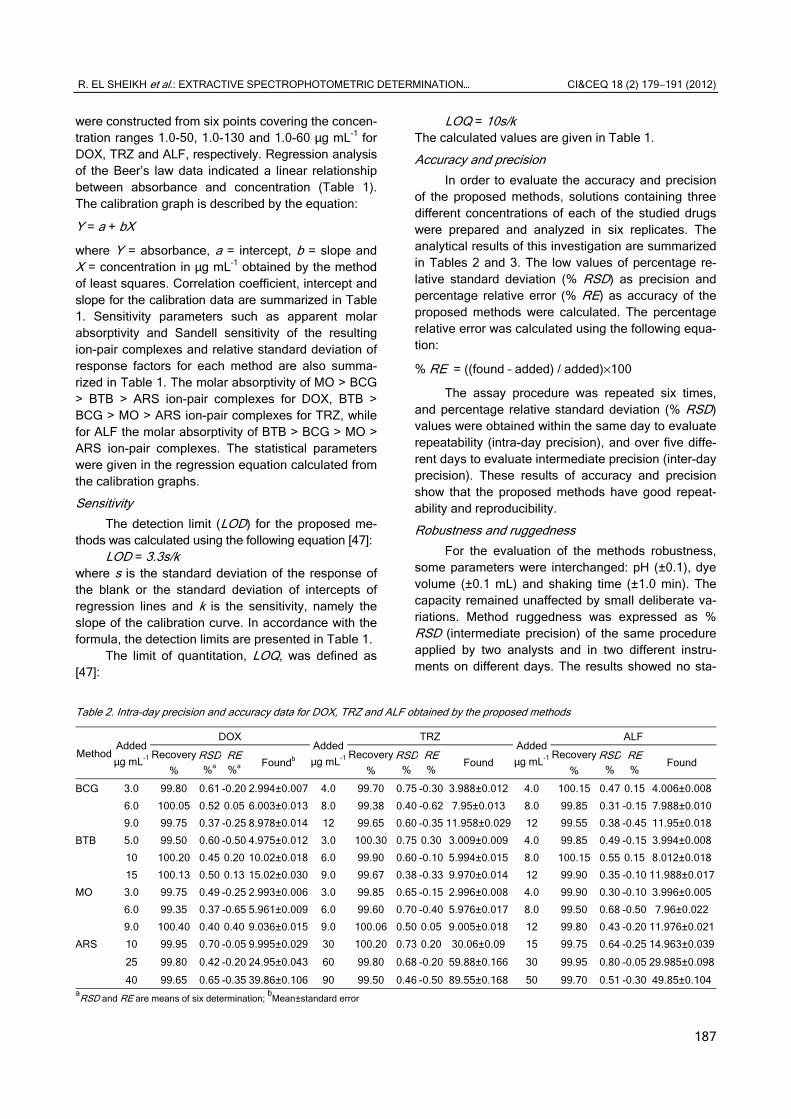
In order to evaluate the accuracy and precision of the proposed methods, solutions containing three different concentrations of each of the studied drugs were prepared and analyzed in six replicates. The analytical results of this investigation are summarized in Tables 2 and 3. The low values of percentage re-lative standard deviation (% RSD) as precision and percentage relative error (% RE) as accuracy of the proposed methods were calculated. The percentage relative error was calculated using the following equa-tion:
% RE = ((found – added) / added)×100
The assay procedure was repeated six times, and percentage relative standard deviation (% RSD) values were obtained within the same day to evaluate repeatability (intra-day precision), and over five diffe-rent days to evaluate intermediate precision (inter-day precision). These results of accuracy and precision show that the proposed methods have good repeat-ability and reproducibility.
Robustness and ruggedness
For the evaluation of the methods robustness, some parameters were interchanged: pH (±0.1), dye volume (±0.1 mL) and shaking time (±1.0 min). The capacity remained unaffected by small deliberate va-riations. Method ruggedness was expressed as % RSD (intermediate precision) of the same procedure applied by two analysts and in two different instru-ments on different days. The results showed no sta-
Table 2. Intra-day precision and accuracy data for DOX, TRZ and ALF obtained by the proposed methods
Method Added
μg mL-1
DOX Added
μg mL-1
TRZ Added
μg mL-1
ALF
Recovery
%
RSD %a
RE%a
Foundb Recovery
%
RSD%
RE%
Found Recovery
%
RSD %
RE %
Found
BCG 3.0 99.80 0.61 -0.20 2.994±0.007 4.0 99.70 0.75 -0.30 3.988±0.012 4.0 100.15 0.47 0.15 4.006±0.008
6.0 100.05 0.52 0.05 6.003±0.013 8.0 99.38 0.40 -0.62 7.95±0.013 8.0 99.85 0.31 -0.15 7.988±0.010
9.0 99.75 0.37 -0.25 8.978±0.014 12 99.65 0.60 -0.35 11.958±0.029 12 99.55 0.38 -0.45 11.95±0.018
BTB 5.0 99.50 0.60 -0.50 4.975±0.012 3.0 100.30 0.75 0.30 3.009±0.009 4.0 99.85 0.49 -0.15 3.994±0.008
10 100.20 0.45 0.20 10.02±0.018 6.0 99.90 0.60 -0.10 5.994±0.015 8.0 100.15 0.55 0.15 8.012±0.018
15 100.13 0.50 0.13 15.02±0.030 9.0 99.67 0.38 -0.33 9.970±0.014 12 99.90 0.35 -0.10 11.988±0.017
MO 3.0 99.75 0.49 -0.25 2.993±0.006 3.0 99.85 0.65 -0.15 2.996±0.008 4.0 99.90 0.30 -0.10 3.996±0.005
6.0 99.35 0.37 -0.65 5.961±0.009 6.0 99.60 0.70 -0.40 5.976±0.017 8.0 99.50 0.68 -0.50 7.96±0.022
9.0 100.40 0.40 0.40 9.036±0.015 9.0 100.06 0.50 0.05 9.005±0.018 12 99.80 0.43 -0.20 11.976±0.021
ARS 10 99.95 0.70 -0.05 9.995±0.029 30 100.20 0.73 0.20 30.06±0.09 15 99.75 0.64 -0.25 14.963±0.039
25 99.80 0.42 -0.20 24.95±0.043 60 99.80 0.68 -0.20 59.88±0.166 30 99.95 0.80 -0.05 29.985±0.098
40 99.65 0.65 -0.35 39.86±0.106 90 99.50 0.46 -0.50 89.55±0.168 50 99.70 0.51 -0.30 49.85±0.104aRSD and RE are means of six determination;
bMean±standard error

R. EL SHEIKH et al.: EXTRACTIVE SPECTROPHOTOMETRIC DETERMINATION… CI&CEQ 18 (2) 179−191 (2012)
188
tistical differences between different analysts and ins-truments suggesting that the developed methods were robust and rugged.
Specificity and effects of interference
To assess the usefulness of the method, the effect of diluents, excipients and additives which often accompany DOX, TRZ and ALF in its dosage forms such as magnesium sterate lactose, microcrystalline cellulose, talc, glucose, dextrose and starch was stu-died. The good percentage recoveries were obtained indicating no interference was observed from any of these excipients and additives, indicating a high se-lectivity for determining the studied DOX, TRZ and ALF in its dosage forms.
Analysis of pharmaceutical preparations
The proposed methods have been successfully applied to the determination of DOX, TRZ and ALF in pharmaceutical dosage forms (tablets). Six replicate determinations were made. Moreover, to check the validity of the proposed methods, dosage forms were tested for possible interference with standard addition method (Table 4). Therefore, it is concluded that the excipients in pharmaceutical dosage forms of DOX, TRZ and ALF were not found any interference in the analysis of DOX, TRZ and ALF. The results were
compared with those obtained using a published me-thods. Statistical analysis of the results did not detect any significant difference between the performance of the proposed methods and reference methods or DOX [6], TRZ [17] and ALF [33] in pharmaceutical formulations (Table 5), with respect to accuracy and precision as revealed by the Student’s t-value and variance ratio F-value at 95% confidence level [48]. The results show that the Student’s t- and F-values at 95% confidence level are lower than the tabulated values.
Comparison of the methods
Comparing the results of the present proposed methods with the reference methods for DOX through ion-pair and charge-transfer complexation reactions [6], spectrophotometric methods for TRZ [17-22] and spectrophotometric and colorimetric methods for ALF [33-37] reveals that the present methods are simple and precise. The Beer’s law limits were more exten-sive for the proposed methods and the ion-pair com-plexes were more stable and different buffer systems were used in proposed methods. Additionally, the LOD and LOQ values for proposed methods were lower than these methods in literature.
Table 4. Determination of the studied drugs in their pharmaceutical dosage forms applying the standard addition technique using BCG,BTB, MO and ARS
Sample Taken
µg mL−1
Added
µg mL−1
BCG BTB MO Taken
µg mL−1
Taken
µg mL−1
ARS
Recoverya±RSD, % Recovery±RSD, %
Dosin tablets (4.0 mg DOX per tab.)
2.0 2.0 99.92±0.32 100.20±043 99.90±0.41 5.0 10 99.93±0.53
6.0 99.85±0.46 99.97±0.80 99.65±0.39 20 100.07±0.35
Table 3. Inter-day precision and accuracy data for DOX, TRZ and ALF obtained by the proposed methods
Method Added
μg mL-1
DOX Added
μg mL-1
TRZ Added
μg mL-1
ALF
Recovery
%
RSD %a
RE%a
Foundb Recovery
%
RSD%
RE%
Found Recovery
%
RSD %
RE %
Found
BCG 3.0 99.70 0.53 -0.30 2.991±0.006 4.0 99.40 0.79 -0.60 3.976±0.013 4.0 100.10 0.48 0.10 4.004±0.008
6.0 99.50 0.50 -0.50 5.976 ±0.012 8.0 99.80 0.48 -0.20 7.984±0.016 8.0 99.75 0.30 -0.25 7.980±0.010
9.0 99.65 0.41 -0.35 8.969±0.015 12 99.90 0.63 -0.10 11.988±0.03 12 99.35 0.29 -0.65 11.922±0.014
BTB 5.0 99.60 0.70 -0.40 4.98±0.014 3.0 100.20 0.65 0.20 3.006±0.008 4.0 99.75 0.59 -0.25 3.99±0.01
10 100.30 0.55 0.30 10.03±0.022 6.0 99.70 0.40 -0.30 5.982±0.010 8.0 100.10 0.43 0.10 8.008±0.014
15 100.05 0.40 0.05 15.008±0.025 9.0 99.40 0.33 -0.60 8.946±0.012 12 99.60 0.30 -0.40 11.952±0.015
MO 3.0 99.90 0.54 -0.10 2.997±0.007 3.0 99.80 0.60 -0.20 2.994±0.007 4.0 99.80 0.60 -0.20 3.992±0.01
6.0 99.50 0.35 -0.50 5.97±0.009 6.0 99.50 0.50 -0.50 5.970±0.012 8.0 99.45 0.38 -0.55 7.956±0.012
9.0 100.20 0.30 0.20 9.018±0.011 9.0 100.10 0.45 0.10 9.009±0.017 12 99.50 0.28 -0.50 11.94±0.014
ARS 10 99.80 0.80 -0.20 9.98±0.033 30 100.00 0.70 0.00 30.0 ± 0.086 15 99.70 0.54 -0.30 14.955±0.033
25 99.60 0.46 -0.40 24.90±0.047 60 99.65 0.64 -0.35 59.79±0.156 30 99.90 0.40 -0.10 29.97±0.049
40 99.55 0.51 -0.45 39.82±0.083 90 99.35 0.42 -0.65 89.42±0.153 50 99.30 0.31 -0.70 49.65±0.063aRSD and RE are means of six determination;
bMean±standard error
R. EL SHEIKH et al.: EXTRACTIVE SPECTROPHOTOMETRIC DETERMINATION… CI&CEQ 18 (2) 179−191 (2012)
189
Table 4. Continued
Sample Taken
µg mL−1
Added
µg mL−1
BCG BTB MO Taken
µg mL−1
Taken
µg mL−1
ARS
Recoverya±RSD, % Recovery±RSD, %
Dosin tablets (4.0 mg DOX per tab.)
10 100.05±0.50 100.02±0.54 99.85±0.26 30 100.03±0.58
12 99.90±0.63 99.75±0.38 99.80±0.52 40 99.80±0.49
Duraci tablets (4.0 mg DOX per tab.)
2.0 2.0 99.67±0.40 100.02±0.82 100.06±0.38 5.0 10 99.92±0.49
6.0 99.80±0.53 99.89±0.66 99.94±0.72 20 100.01±0.80
10 99.75±0.61 99.90±0.25 99.85±0.64 30 99.90±0.57
12 100.10±0.72 100.10±0.83 99.75±0.28 40 99.80±0.61
Itrin® tablets (5 mg TRZ per tab.)
2.0 2.0 99.94±0.39 99.97±0.46 99.65±0.94 20 20 99.86±0.33
6.0 100.05±0.54 100.03±0.35 99.73±1.03 40 99.90±0.47
10 100.09±0.67 99.88±0.95 99.95±0.58 60 99.93±0.86
12 98.95±0.72 99.25±0.60 99.50±0.51 80 100.04±0.91
Prostasin tablets (5 mg TRZ per tab.)
2.0 2.0 99.95±0.61 98.90±0.75 98.85±0.96 20 20 100.10±0.34
6.0 99.80±0.73 99.60±0.93 99.55±0.18 40 99.70±0.26
10 99.25±0.48 100.10±0.35 99.86±0.38 60 99.15±0.19
12 100.06±0.56 99.58±087 100.13±0.59 80 99.30±0.48
Xatral SR tablets (5 mg ALF per tab.)
2.0 2.0 99.30±0.48 100.10±0.34 99.90±0.47 5.0 10 99.65±0.84
6.0 99.15±0.19 99.70±0.26 99.93±0.86 20 99.77±0.45
10 100.01±0.80 99.80±0.61 100.04±0.91 30 99.45±0.38
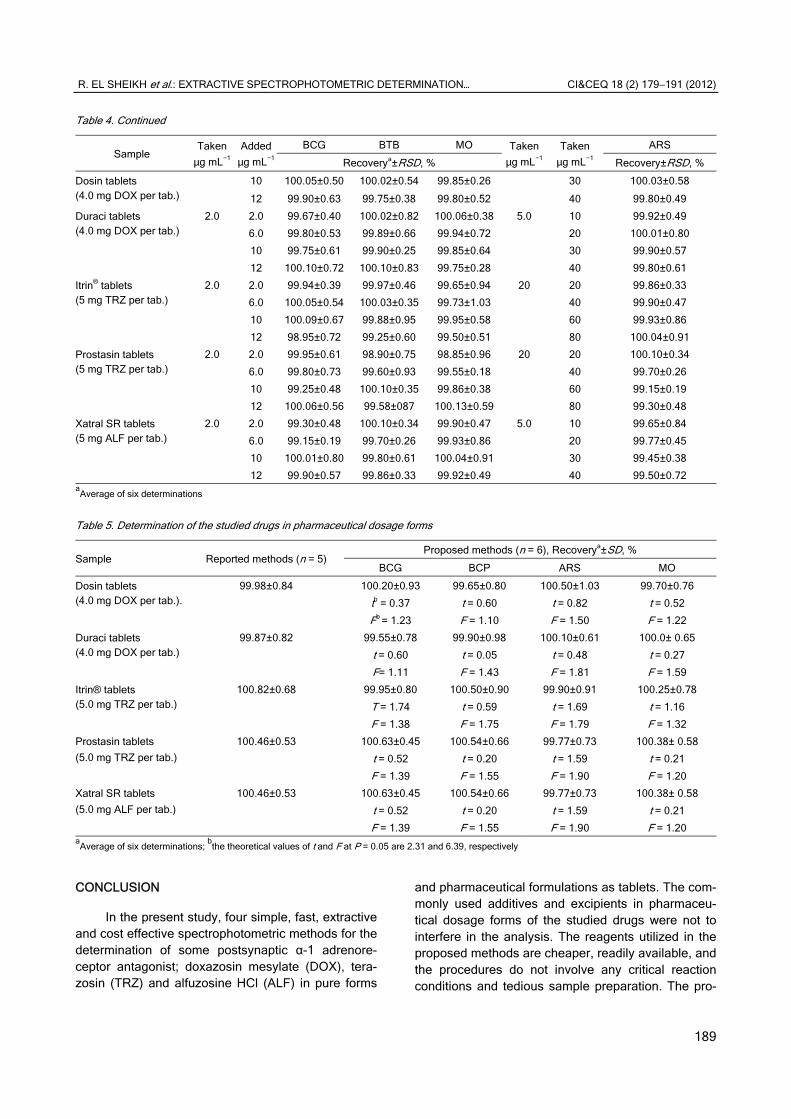
12 99.90±0.57 99.86±0.33 99.92±0.49 40 99.50±0.72 aAverage of six determinations
Table 5. Determination of the studied drugs in pharmaceutical dosage forms
Sample Reported methods (n = 5) Proposed methods (n = 6), Recoverya±SD, %
BCG BCP ARS MO
Dosin tablets (4.0 mg DOX per tab.).
99.98±0.84 100.20±0.93 99.65±0.80 100.50±1.03 99.70±0.76
tb = 0.37 t = 0.60 t = 0.82 t = 0.52
Fb = 1.23 F = 1.10 F = 1.50 F = 1.22
Duraci tablets (4.0 mg DOX per tab.)
99.87±0.82 99.55±0.78 99.90±0.98 100.10±0.61 100.0± 0.65
t = 0.60 t = 0.05 t = 0.48 t = 0.27
F= 1.11 F = 1.43 F = 1.81 F = 1.59
Itrin® tablets (5.0 mg TRZ per tab.)
100.82±0.68 99.95±0.80 100.50±0.90 99.90±0.91 100.25±0.78
T = 1.74 t = 0.59 t = 1.69 t = 1.16
F = 1.38 F = 1.75 F = 1.79 F = 1.32
Prostasin tablets
(5.0 mg TRZ per tab.)
100.46±0.53 100.63±0.45 100.54±0.66 99.77±0.73 100.38± 0.58
t = 0.52 t = 0.20 t = 1.59 t = 0.21
F = 1.39 F = 1.55 F = 1.90 F = 1.20
Xatral SR tablets
(5.0 mg ALF per tab.)
100.46±0.53 100.63±0.45 100.54±0.66 99.77±0.73 100.38± 0.58
t = 0.52 t = 0.20 t = 1.59 t = 0.21
F = 1.39 F = 1.55 F = 1.90 F = 1.20 aAverage of six determinations;
bthe theoretical values of t and F at P = 0.05 are 2.31 and 6.39, respectively
CONCLUSION
In the present study, four simple, fast, extractive and cost effective spectrophotometric methods for the determination of some postsynaptic α-1 adrenore-ceptor antagonist; doxazosin mesylate (DOX), tera-zosin (TRZ) and alfuzosine HCl (ALF) in pure forms
and pharmaceutical formulations as tablets. The com-monly used additives and excipients in pharmaceu-tical dosage forms of the studied drugs were not to interfere in the analysis. The reagents utilized in the proposed methods are cheaper, readily available, and the procedures do not involve any critical reaction conditions and tedious sample preparation. The pro-

R. EL SHEIKH et al.: EXTRACTIVE SPECTROPHOTOMETRIC DETERMINATION… CI&CEQ 18 (2) 179−191 (2012)
190
posed methods are simple and rapid. The maximum color development of ion-pair complex formation is completed immediately after all reagents were added. All the measurements were made in 30 min after the preparation of the solutions in all the experiments. No heating and standing was needed. Other methods in the literature, such as high performance liquid chro-matography and gas chromatography methods, in-volve more procedural steps and take more operator time and expertise. However, the proposed spectro-photometric methods provide economic procedures, are less time consuming, and more sensitive and accurate compared with other reported methods of each drug. In this study precise and accurate results were validated by statistical analysis as per as the current ICH guidelines. The wide applicability of the new procedures for routine quality control is well es-tablished by the assay of the studied drugs in bulk forms, as well as in pharmaceutical preparations.
REFERENCES
[1] British Pharamacopoeia, Monographs: medicinal and pharmaceutical substances, Her Majesty’s Stationery office, London, 11 (2007) 583
[2] H.G. Fouda, T.M. Twomey, R.P. Schneider, J. Chroma-togr. Sci. 26 (1988) 570-573
[3] C. Wongsinsup, W. Taesotikul, S. Kaewvichit, S. Sangs-rijan, S. Sangsrijan, CMU. J. Nat. Sci. 6 (2007) 231-239
[4] D. Bhavesh, S. Pinal, V. Saroj, Ind. J. Pharm. Sci. 64 (2002) 354-356
[5] G.P. Jackman, F. Colagrande, W.J. Louis. J. Chromatogr. 566 (1991) 234-238
[6] Z. Aydodmup, A. Barla, J. AOAC Int. 92 (2009) 131-137
[7] http://www.drugs.com/terazosin.html
[8] E.C. Sekhar, T.R. Rao, K.R. Sekhar, M.U. Naidu, J.C. Shobha, P.U. Rani, T.V. Kumar, V.P. Kumar, J. Chro-matogr., B 710 (1998) 137-142
[9] S.E. Patterson J. Chromatogr., B 311 (1984) 206-212
[10] R.K. Bhamra, R.J. Flanagan, D.W. Holt, J. Chromatogr., B 380 (1986) 216-221
[11] A.P. Zavitsanos, A.K. Tanja, J. Chromatogr., A 794 (1998) 454-456
[12] M. Bakshi, T. Ojha and S. Singh, J. Pharm. Biomed. Anal. 34 (2004) 19
[13] A. S. Raul, N. M. Adriana, X-Ray Spectrom. 36 (2007) 279
[14] F. Faridbod, M. R. Ganjali, L. Safaraliee, S. Riahi, M. Hosseini, P. Norouzi, Int. J. Electrochem. Sci. 4 (2008) 1419
[15] M.R. Ganjali, F. Faridbod, B. Larijani, S. Riahi, M. Hos-seini, E. Nasli-Esfahani, P. Norouzi, Int. J. Electrochem. Sci. 5 (2010) 200–214
[16] C.V.N. Prasad, A. Guatham, V. Bharadwaj, P. Praimoo, Indian J. Pharm. Sci. 60 (1998) 167-170
[17] J.V. Rao, G.K. Reddy, V. Jayasree, K.P.R. Chowdary, In-dian J. Pharm. Sci. 63 (2001) 164-165
[18] P.S. Sarsambi, G.K. Kapse, S.A. Raju, Asian J. Chem. 14 (2002) 545-547
[19] P.S. Sarsambi, G.K. Kapse, M Shobha., S. Appala Raju, Asian J. Chem. 12 (2000) 1325-1326
[20] V. Sankar, S. Raghuraman, V. Sivan, V. Ravichandran, Ind. J.Pharm. Sci. 62 (2000) 463-464
[21] H.H. Abdine, F.A. El-Yazbi, S.M. Blaih, R.A. Shaalan, Spectroscopy Lett. 31 (1998) 969-980
[22] P.S. Sarsambi, S. Appala Raju, Asian J. Chem 13 (2001) 760-762
[23] Martindale; The Complete Drug Reference, S.C. Sweet-man, Ed., 34th ed., Pharamceutical Press, The Royal Pharmaceutical Society of great Britain, 2005, p. 1549
[24] J.L. Wiesner, F.C.W. Sutherland, G.H., Van Essen H.K.L. Hundt, K.J. Swart, F. Hundt, J. Chromatogr., B 788 (2003) 361-368
[25] A. Rouchouse, M.Manoha, A. Durand, J. P. Thenot, J. Chromatogr., A 506 (1990) 601-610
[26] A.K. Shakya, T.A. Arafat, A. Abuawaad, H. Al-Hroub, M. Melhim, Jordan J. Pharm. Sci. 3 (2010) 25-36
[27] P. Guinebault, M. Broquaire, C. Colafranceschi, J.P. Thénot, J. Chromatogr., A 353 (1986) 361-369
[28] G. Carlucci, E.D. Giuseppe, P. Mazzeo, J. Liquid Chromatogr. Rel. Techn. 17 (1994) 3989–3997
[29] D.B. Patel, N.J. Patel, Int. J. Chem. Tech. Res. 1 (2009) 985-990
[30] A.S.F. Mostafa, A.S. Nagiba, Y. Hassan, S.A. El-Wesh-ahy, J. Sep. Sci. 29 (2006) 2716-2724
[31] M. Ganesh, S. Uppatyay, R. Tivari, K. Kamalakannan, G. A. Rathinavel, S. Ganagully, T. Sivakumar, Pak. J. Pharm. Sci. 22 (2009) 263-266
[32] B. Uslu, Electroanalysis 12 (1990) 866-870
[33] M.V. krishna, D.G. Sankar, E. J. Chem. 4 (2007) 397-407
[34] M.V. krishna, D.G. Sankar, E. J. Chem. 4 (2007) 496-501
[35] A. Safwan, M.F. Chehna, R. Bayram, Int. J. Biomed. Sci. 2 (2006) 273-282
[36] B.M. Ishaq, K.V. Prakash, C.H. Kumar, G.U. Rani, P. Ramakrishna, J. Pharm. Res. 4 (2011) 226-228
[37] D.R. Kumar, V. M. Vardhan, D. Ramachandran, C. Rambabu, Oriental J. Chem. 24 (2008) 725-728
[38] A.S. Fayed, M.A. Shehata, N.Y. Hassan, S.A. Weshahy, Pharamzie 62 (2005) 830-835
[39] M.P. Patel, A.S. Mehta, P.V. Patel, V.K. Mandowara, M.B. Patel, Int. J. Pharm. Research 1 (2009) 72-79
[40] A.S. Amin, A.A. El-Fetouh, R. Gouda, F.Z. El-Sheikh, Spectrochim. Acta, A 67 (2007) 1306-1312
[41] S. Ashour, R. Alkhalil, Farmaco. 60 (2005) 771-775
[42] A.A. Gouda, Z. El Shafey, N. Hossny, R. El-Azzazy, Spectrochim. Acta, A 70 (2008) 785–792
[43] A. Al kaf, A.A. Gouda, Chem. Ind. Chem. Eng. Q. 17 (2011) 125-132
[44] H.T.S. Britton, Hydrogen Ions, 4th ed., Chapman and Hall, 1952
R. EL SHEIKH et al.: EXTRACTIVE SPECTROPHOTOMETRIC DETERMINATION… CI&CEQ 18 (2) 179−191 (2012)
191
[45] P. Job, Ann. Chem. 16 (1936) 97; in: Advanced Physico-chemical Experiments, 2nd ed., Edinburgh, Oliner and Boyd, 1964, p. 54
[46] A. Espinosa-Manisilla, M.I. Acedvalenzuela, F. Salinas, F. Canada, Anal. Chim. Acta 376 (1998) 365–375
[47] International Conference on Harmonisation of Technical Requirements for Registration of Pharmaceuticals for Human Use, Ich Harmonised Tripartite Guideline. Vali-
dation of Analytical Procedures: Text and Methodology, Q2 (R 1), Complementary Guideline on Methodology dated, 6 November 1996, London, incorporated in No-vember 2005
[48] J.C. Miller, J.N. Miller, Significance tests In: Statistics in Analytical Chemistry, Ch. 3, 3rd ed., Ellis Horwood, Chi-chester, 1993.
RAGAA EL SHEIKH1
NAHLA S. ESMAIL2
AYMAN A. GOUDA1
WALID ABDEL BASSET
1Chemistry Department, Faculty of Science, Zagazig University, Zagazig,
Egypt 2National Organization for Drug Control
and Research, Dokki, Giza, Egypt
NAUČNI RAD
SPEKTROFOTOMETRIJSKO ODREĐIVANJE α-ADRENORECEPTORSKIH ANTAGONISTA U ČISTIM FORMAMA I FARAMCEUTSKIM FORMULACIJAMA
U radu je opisana brza i jednostavna ekstrakcijsko spektrofotometrijska metoda za odre-
đivanje potsinaptičnih α-1 adrenoreceptorskih antagonista:doksazosin mesilata (DOX),
terazosina (TRZ) i alfuzosin HCl(ALF) u čistoj formi i farmaceutskim formulacijama. Raz-
vijene metode se zasnivaju na interakciji baznog azotovog atoma iz leka i boja, kao što
su: bromokrezol zeleno (BCG), bromtimol plavo (BTB), metil-oranž (MO) i alizarin crveno
S (ARS), u kiselom puferu u opsegu pH od 3,0-5,0, pri čemu se grade žuto obojeni jon-
par kompleksi. Dobijeni kompleksi su ekstrahovani hloroformom ili dihlormetanom, a nji-
hove koncentracije su merene na sledećim talasnim dužinama: za komplekse dobijene u
reakciji boja BCG, BTB, MO, ARS i DOX-a na 418, 414, 425 i 426 nm, redom, za
komplekse dobijene u interakciji navedenih boja i TRZ-a na 419, 415, 425 i 428 nm, re-
dom, i za komplekse dobijene u interakciji ispitivanih boja i ALF-a na 418, 412, 421 i 427
nm, redom. Ispitani su analitički parametri i njihovi efekti na proučavane sisteme. Nađe-
no je da pod optimalnim uslovima važi Beer-ov zakon u opsegu koncentracija 1,0–130 µg
mL−1 sa korelacionim koeficijentom ≥ 0,9991 (n = 6). Izračunate su molarne absorptiv-
nosti, odgovarajući Sandell-ovi indeksi, limiti detekcije i limiti kvantifikacije.Job-ovom me-
todom je nađeno da je sastav jonskog para 1:1. Predložene metode su uspešno prime-
njene za analize ispitivanih lekova u čistoj formi i u farmaceutskim formulacijama sa re-
covery vrednostima u opsegu 99,18–100,61. Rezulatati analiza su statistički validirani i u
dobroj su saglasnosti sa rezultatima dobijenim referentnim metodama.
Ključne reči: doksazosin-mesilat, terazosin, afuzosin HCl, spektrofotometrija, jon-par kompleks, kisele boje, farmaceutske formulacije.
Copyright © 2022 FDOKUMEN