Expression of neuronal nitric oxide synthase in the hippocampal formation in affective disorders
9
Braz J Med Biol Res 41(4) 2008 www.bjournal.com.br Brazilian Journal of Medical and Biological Research (2008) 41: 333-341 ISSN 0100-879X Expression of neuronal nitric oxide synthase in the hippocampal formation in affective disorders R.M.W. Oliveira 1 , F.S. Guimarães 2 and J.F.W. Deakin 3 1 Departamento de Farmácia e Farmacologia, Universidade Estadual de Maringá, Maringá, PR, Brasil 2 Faculdade de Medicina de Ribeirão Preto, Universidade de São Paulo, Ribeirão Preto, SP, Brasil 3 Neuroscience and Psychiatry Unit, The University of Manchester, Manchester, UK Correspondence to: R.M.W. Oliveira, Departamento de Farmácia e Farmacologia, Universidade Estadual de Maringá, Avenida Colombo, 5790, 87020-900 Maringá, PR, Brasil Fax: +55-44-3261-4999. E-mail: [email protected] Hippocampal output is increased in affective disorders and is mediated by increased glutamatergic input via N-methyl-D- aspartate (NMDA) receptor and moderated by antidepressant treatment. Activation of NMDA receptors by glutamate evokes the release of nitric oxide (NO) by the activation of neuronal nitric oxide synthase (nNOS). The human hippocampus contains a high density of NMDA receptors and nNOS-expressing neurons suggesting the existence of an NMDA-NO transduction pathway which can be involved in the pathogenesis of affective disorders. We tested the hypothesis that nNOS expression is increased in the human hippocampus from affectively ill patients. Immunocytochemistry was used to demonstrate nNOS-expressing neurons in sections obtained from the Stanley Consortium postmortem brain collection from patients with major depression (MD, N = 15), bipolar disorder (BD, N = 15), and schizophrenia (N = 15) and from controls (N = 15). nNOS-immunoreactive (nNOS- IR) and Nissl-stained neurons were counted in entorhinal cortex, hippocampal CA1, CA2, CA3, and CA4 subfields, and subiculum. The numbers of Nissl-stained neurons were very similar in different diagnostic groups and correlated significantly with the number of nNOS-IR neurons. Both the MD and the BD groups had greater number of nNOS-IR neurons/400 μm 2 in CA1 (mean ± SEM: MD = 9.2 ± 0.6 and BD = 8.4 ± 0.6) and subiculum (BD = 6.7 ± 0.4) when compared to control group (6.6 ± 0.5) and this was significantly more marked in samples from the right hemisphere. These changes were specific to affective disorders since no changes were seen in the schizophrenic group (6.7 ± 0.8). The results support the current view of the NMDA-NO pathway as a target for the pathophysiology of affective disorders and antidepressant drug development. Key words: Affective disorders; Major depression; Neuronal nitric oxide synthase; Immunohistochemistry; Hippocampus Research supported by the Stanley Foundation, Muscatine, IA, USA, and CAPES. R.M.W. Oliveira was the recipient of a fellowship from CAPES. Publication supported by FAPESP. Received September 10, 2007. Accepted March 4, 2008 Introduction Affective disorders, consisting mainly of major depres- sion (MD) and bipolar disorder (BD), are among the most severe diseases regarding disability-adjusted life years. Despite better diagnostic options and increasing awareness of MD and BD, their pathophysiology remains elusive (1). Although almost certainly not solely responsible for the myriad of symptoms observed in affective disorders, the highly plastic, stress-sensitive hippocampal formation may play a central role in affective disorders and in the action of antidepressant drugs (1). Despite variation in the meas- urement techniques and patient samples, structural mag- netic resonance imaging studies have shown a significant reduction of the hippocampal volume in subjects with a history of affective disorder (2,3) although some studies have reported negative findings (for a review, see Ref. 1). It appears that hippocampal atrophy is observed preferen-
-
Upload
independent -
Category
Documents
-
view
1 -
download
0
Transcript of Expression of neuronal nitric oxide synthase in the hippocampal formation in affective disorders
333
Braz J Med Biol Res 41(4) 2008
Hippocampal nNOS in affective disorders
www.bjournal.com.br
Brazilian Journal of Medical and Biological Research (2008) 41: 333-341ISSN 0100-879X
Expression of neuronal nitric oxidesynthase in the hippocampal formationin affective disordersR.M.W. Oliveira1, F.S. Guimarães2 and J.F.W. Deakin3
1Departamento de Farmácia e Farmacologia, Universidade Estadual de Maringá, Maringá, PR, Brasil2Faculdade de Medicina de Ribeirão Preto, Universidade de São Paulo, Ribeirão Preto, SP, Brasil3Neuroscience and Psychiatry Unit, The University of Manchester, Manchester, UK
Correspondence to: R.M.W. Oliveira, Departamento de Farmácia e Farmacologia, Universidade Estadualde Maringá, Avenida Colombo, 5790, 87020-900 Maringá, PR, BrasilFax: +55-44-3261-4999. E-mail: [email protected]
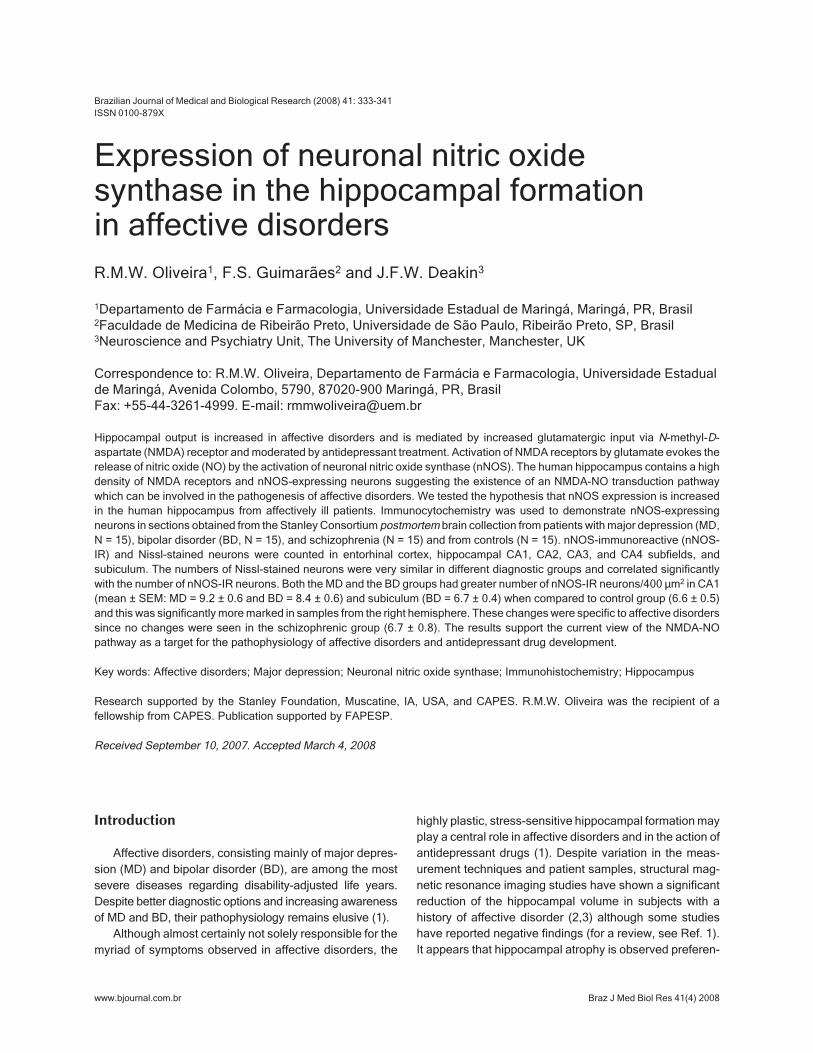
Hippocampal output is increased in affective disorders and is mediated by increased glutamatergic input via N-methyl-D-aspartate (NMDA) receptor and moderated by antidepressant treatment. Activation of NMDA receptors by glutamate evokes therelease of nitric oxide (NO) by the activation of neuronal nitric oxide synthase (nNOS). The human hippocampus contains a highdensity of NMDA receptors and nNOS-expressing neurons suggesting the existence of an NMDA-NO transduction pathwaywhich can be involved in the pathogenesis of affective disorders. We tested the hypothesis that nNOS expression is increasedin the human hippocampus from affectively ill patients. Immunocytochemistry was used to demonstrate nNOS-expressingneurons in sections obtained from the Stanley Consortium postmortem brain collection from patients with major depression (MD,N = 15), bipolar disorder (BD, N = 15), and schizophrenia (N = 15) and from controls (N = 15). nNOS-immunoreactive (nNOS-IR) and Nissl-stained neurons were counted in entorhinal cortex, hippocampal CA1, CA2, CA3, and CA4 subfields, andsubiculum. The numbers of Nissl-stained neurons were very similar in different diagnostic groups and correlated significantlywith the number of nNOS-IR neurons. Both the MD and the BD groups had greater number of nNOS-IR neurons/400 µm2 in CA1(mean ± SEM: MD = 9.2 ± 0.6 and BD = 8.4 ± 0.6) and subiculum (BD = 6.7 ± 0.4) when compared to control group (6.6 ± 0.5)and this was significantly more marked in samples from the right hemisphere. These changes were specific to affective disorderssince no changes were seen in the schizophrenic group (6.7 ± 0.8). The results support the current view of the NMDA-NOpathway as a target for the pathophysiology of affective disorders and antidepressant drug development.
Key words: Affective disorders; Major depression; Neuronal nitric oxide synthase; Immunohistochemistry; Hippocampus
Research supported by the Stanley Foundation, Muscatine, IA, USA, and CAPES. R.M.W. Oliveira was the recipient of afellowship from CAPES. Publication supported by FAPESP.
Received September 10, 2007. Accepted March 4, 2008
Introduction
Affective disorders, consisting mainly of major depres-sion (MD) and bipolar disorder (BD), are among the mostsevere diseases regarding disability-adjusted life years.Despite better diagnostic options and increasing awarenessof MD and BD, their pathophysiology remains elusive (1).
Although almost certainly not solely responsible for themyriad of symptoms observed in affective disorders, the
highly plastic, stress-sensitive hippocampal formation mayplay a central role in affective disorders and in the action ofantidepressant drugs (1). Despite variation in the meas-urement techniques and patient samples, structural mag-netic resonance imaging studies have shown a significantreduction of the hippocampal volume in subjects with ahistory of affective disorder (2,3) although some studieshave reported negative findings (for a review, see Ref. 1).It appears that hippocampal atrophy is observed preferen-
334
Braz J Med Biol Res 41(4) 2008
R.M.W. Oliveira et al.
www.bjournal.com.br
tially in older, recurrently depressed subjects or subjectswho are refractory to antidepressant medications (4).
Experimentally, recurrent episodes of stress or elevatedglucocorticoid levels, also characteristic of MD, are associ-ated with damage to the hippocampus. A loss of hippocam-pal neurons is observed in monkeys submitted to pro-longed psychosocial stress (5), whereas repeated restraintstress in rats causes hippocampal CA3 pyramidal neuronsto undergo dendritic atrophy (6). These specific effectshave been suggested to be mediated by activation of thehypothalamic–pituitary–adrenal axis acting in concert withexcitatory amino acid input via the N-methyl-D-aspartate(NMDA) receptors (6).
In the brain, activation of the NMDA receptor by gluta-mate can release nitric oxide (NO) by the activation ofcalmodulin-calcium-dependent enzyme neuronal NO syn-thase (nNOS) (7). nNOS catalyzes the oxidation of L-arginine resulting in the formation of L-citrulline and NO,which is a diffusible, free-radical messenger involved incell–cell communication and in numerous physiologic andneuropsychiatric conditions (8,9).
The human hippocampus contains a high density ofNMDA receptors (10) and nNOS-expressing cells (11,12),suggesting the existence of an NMDA-NO transductionpathway. A crucial involvement of the NMDA-NO signalingpathway in the pathophysiology of MD and in the mechan-ism of action of antidepressant drugs has been suggested.For example, NMDA receptor antagonists or NOS inhibi-tors exhibit antidepressant-like properties in animal screen-ing procedures (13-15). In addition, chronic treatment withan NOS inhibitor also down-regulates ß-adrenergic recep-tors in the frontal cortex of mice with a magnitude compa-rable to imipramine (16). Clinically, ketamine, an NMDAreceptor antagonist, exhibits antidepressant activity in hu-mans (17) as does methylene blue, an NOS inhibitor thatwas found to be therapeutically effective in severe MD(18). Finally, NO production may increase MD since thepatients show elevate plasma nitrate levels (19).
Studies in animals and humans have shown that thehippocampus may be also an important site of action ofantidepressant drugs. Systemic and intra-hippocampaladministration of antidepressants prevent the anxiety incu-bation effect of restraint stress and the development oflearned helplessness (15). Compellingly, in a PET study ofMD, Mayberg et al. (20) reported that clinical recovery onfluoxetine was associated with a reduction in hippocampalmetabolism. This suggests that antidepressants decreasehippocampal glutamatergic function and consequently NOfunction since regional cortical metabolism mainly accountsfor glutamatergic neurotransmission (21). In this way, ithas been demonstrated that inhibition of the NMDA–NO
pathway appears to be one of the common actions ofantidepressants. Despite remarkable structural diversity,three main kinds of antidepressants (desipramine, fluoxe-tine and moclobemide) not only antagonized the NMDA-induced lesion in PC12 cells, but also inhibited the functionof the NMDA–NO signal pathway (22). These findings areconsistent with the hypothesis first proposed by Paul andSkolnick (14) that clinically used antidepressants mayshare a common ability to block or down-regulate NMDAglutamate receptor function.
In 1991, Deakin and Graeff (23) proposed that impair-ment of hippocampal serotonin function weakens behav-ioral resilience and results in MD. It has been long pro-posed that impaired serotonin function in MD may bemediated by stress-induced hypercortisolemia acting onthe high concentration of glucocorticoid receptors in thehippocampus (1). Studies by Joca and Guimarães (15)and others (6) have suggested that stress-induced changesin hippocampal glutamate mechanisms may precedechanges in serotonin function.
Recently, it has been suggested that hippocampal NOunder non-stressed conditions may be under tonic inhibi-tion by serotonergic neurons since an increased NOSactivity in the context of long-term 5-HT2 receptor inhibitionby ritanserin was observed in rats submitted to forcedswimming stress (24). Furthermore, this control might belost following states of serotonergic depletion, manifestingas learned helplessness in animals and as depression inhumans.
Taken together, these findings suggest that activation ofthe NMDA-NO pathway in the hippocampus can be involvedin the pathogenesis of affective disorders, possibly triggeredby glucocorticoid-mediated effects of stress and mediatedby impaired serotonin function. To investigate this hypo-thesis in humans, we have tested the prediction that expres-sion of nNOS is increased in the hippocampus obtained postmortem from patients suffering from MD and BD.
Material and Methods
Tissue samplesSections of the hippocampus were obtained from the
Stanley Medical Research Institute Neuropathology Con-sortium (25). The material was obtained from 15 controls,15 schizophrenic (SCZ), 15 MD, and 15 BD cases. Clinicaland demographical data are shown in Table 1. The psychi-atric diagnosis was based on retrospective case notereview applying the criteria of the Diagnostic and Statisti-cal Manual of Mental Disorders, 4th edition, 1994. Normalcontrols had no history of neurological or psychiatric ill-ness and neuropathological examination excluded Alzhei-
335
Braz J Med Biol Res 41(4) 2008
Hippocampal nNOS in affective disorders
www.bjournal.com.br
mer’s disease or other cerebral pathology. The blockswere fixed in 10% phosphate-buffered formalin, pH 7.0, for1 to 31 months (average 8 months) and then embedded inparaffin. Ten-micrometer sections were cut, mounted ontogelatin-coated slides and stored at room temperature untilprocessed for nNOS immunohistochemistry.
ImmunohistochemistryThe sections were initially dewaxed in two changes of
xylene (20 min each), rehydrated through graded alcohols(100, 95, 80, and 70% ethanol, 5 min each), washed indistilled water and pre-treated with 3% H2O2 in 50% metha-nol (30 min) to decrease endogenous peroxidase. Afterrepeated washings (3X 15 min) in 0.1 M phosphate-buff-ered saline (PBS), pH 7.4, the sections were incubatedwith 5% normal goat serum in 0.1 M PBS containing 0.3%Triton X-100 (PBS-T) for 1 h, to block nonspecific bindingsites. After rinsing in 0.1 M PBS-T, the sections wereincubated with the primary antibody (1:25, mouse anti-nNOS, clone 16, Transduction Laboratories, San Diego,CA, USA) for 40 h at 4°C. The primary antibody waswashed off with PBS-T (3X 15 min) and the sections werethen incubated with biotinylated goat anti-mouse immuno-globulin G (1:100, PharmiGen, San Diego, CA, USA) for 2h. They were then rinsed in PBS-T before 1-h incubationwith the avidin-biotin-peroxidase complex (1:500, VectorLaboratories, Burlingame, CA, USA). Peroxidase activitywas developed using 3'-3' diaminobenzidine tetrahydro-chloride (Sigma, USA) containing 0.05% H2O2. Finally, thesections were dehydrated through a series of alcohols (70,80, 95, and 100%), cleared in xylene and cover-slipped.
All reactions were carried out at the same time. Controlexperiments were performed by omitting the primary anti-body from the staining protocol. Adjacent sections werestained with Cresyl violet (Nissl preparation) to help iden-tify the location of the areas of interest.
QuantificationMicroscope images were captured using a video cam-
era (Sony Hyper HAD) linked to a Leica DMRB (Nussloch,Germany) microscope. nNOS-immunoreactivity (nNOS-IR) was considered to be present when the cell showed aclear unstained nucleus with granular immunoreactivity inthe cytoplasm. A two-dimensional counting method wasused to estimate immunopositive cell number within 400-µm2 counting frames. Sections were viewed at 200X mag-nification and images were captured using the Bioquant(Nova Prime, Nashville, TN, USA) image analysis system.Cells were counted in three to five fields (400 µm2) distrib-uted across each area of interest per section, in three of thefour sections available per subject. The fourth section was
used for Nissl staining. All, nNOS-IR or Nissl-stained neu-rons lying within counting frames were counted, excludingthose that crossed either the top or left side of the frame(26). The images were carefully checked to ensure that allneurons were recognized, that contiguous cells were splitand that the classification was corrected with the exclusionof vessels and glia. These criteria were in accordance withpreviously published studies (27,28). Cell counts werecarried out in a blind manner, without access to any infor-mation about diagnosis by RMWO and the statistical anal-ysis was carried out by JFWD who had no involvement incounting.
The following regions were selected for analysis withreference to the maps published by Paxinos and Mai (29):CA4, CA3, CA2, and CA1 pyramidal layers of the hippo-campus, pyramidal layer III of the subiculum and layers IIand III of the entorhinal cortex. Laminar boundaries wereconfirmed with the aid of an encoder measuring the posi-tion from the pial surface to the borders of each layer ofadjacent Nissl-stained sections which in all cases closelyoverlay the nNOS sections. In the dentate gyrus, cellswere too densely packed to be counted. It was not possibleto identify all sub-regions in every subject because ofvariation in the anteroposterior level of sectioning. How-ever, there were no systematic group differences in sec-tioning level.
Statistical analysisTo identify potential confounders to be included as
covariates, analysis of variance (ANOVA) was used todetermine group differences in age, pH, interval betweendeath and fixation (postmortem interval, PMI), and dura-tion of storage in formalin. In addition, correlations werecomputed between cell counts and the potential confound-ers. The average number of nNOS-IR and Nissl-stainedneurons in each region was obtained, and the mean foreach of the four groups including controls, SCZ, MD, andBD was further calculated. Data were analyzed usingANOVA with factors for diagnosis (4 levels) and side (2levels). Side was a between-subject factor because left-and right-sided samples came from different brains sincein the Stanley collection one hemisphere is fixed and theother frozen. In the SCZ group, there were insufficientobservations (N = 3-4 per region) in the right hippocampusto permit reliable identification of lateralized abnormalities(i.e., diagnosis by side interactions). Therefore, to deter-mine whether diagnosis by side interactions in the mainanalysis was due to lateralized changes in the MD and BDgroups, the main ANOVA was repeated including only MD,BD and controls. The origin of diagnosis by side interac-tions was determined by unilateral ANOVA with planned
336
Braz J Med Biol Res 41(4) 2008
R.M.W. Oliveira et al.
www.bjournal.com.br
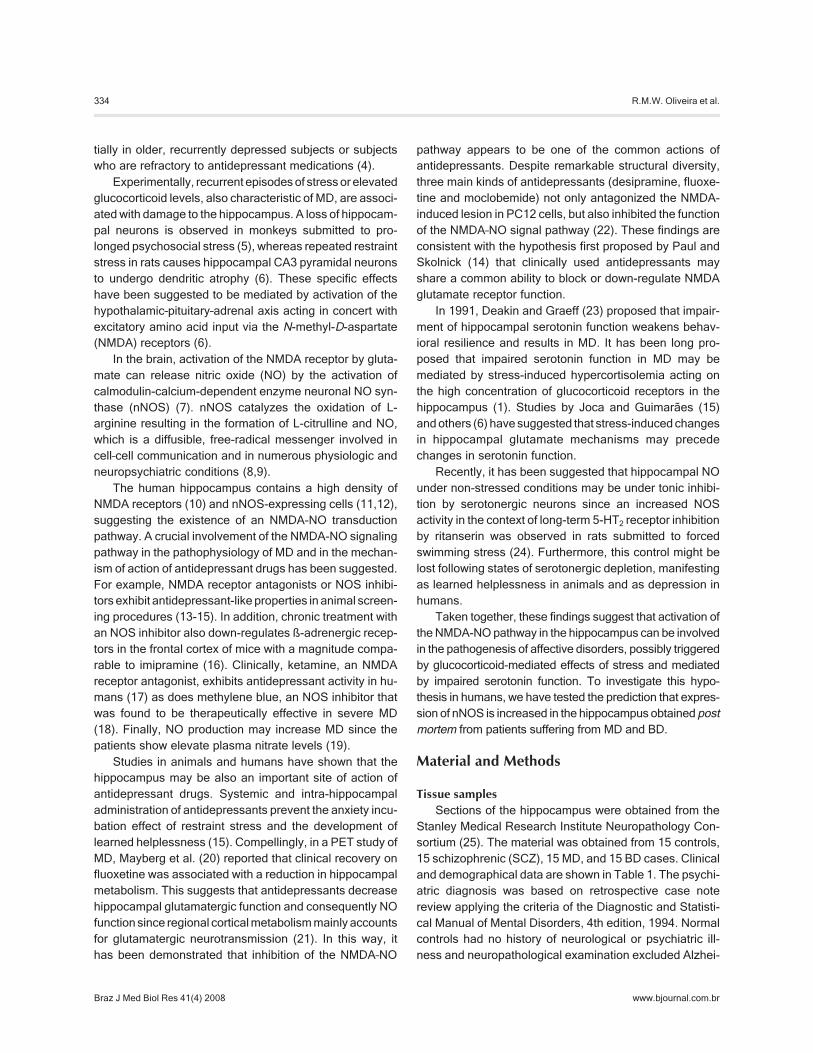
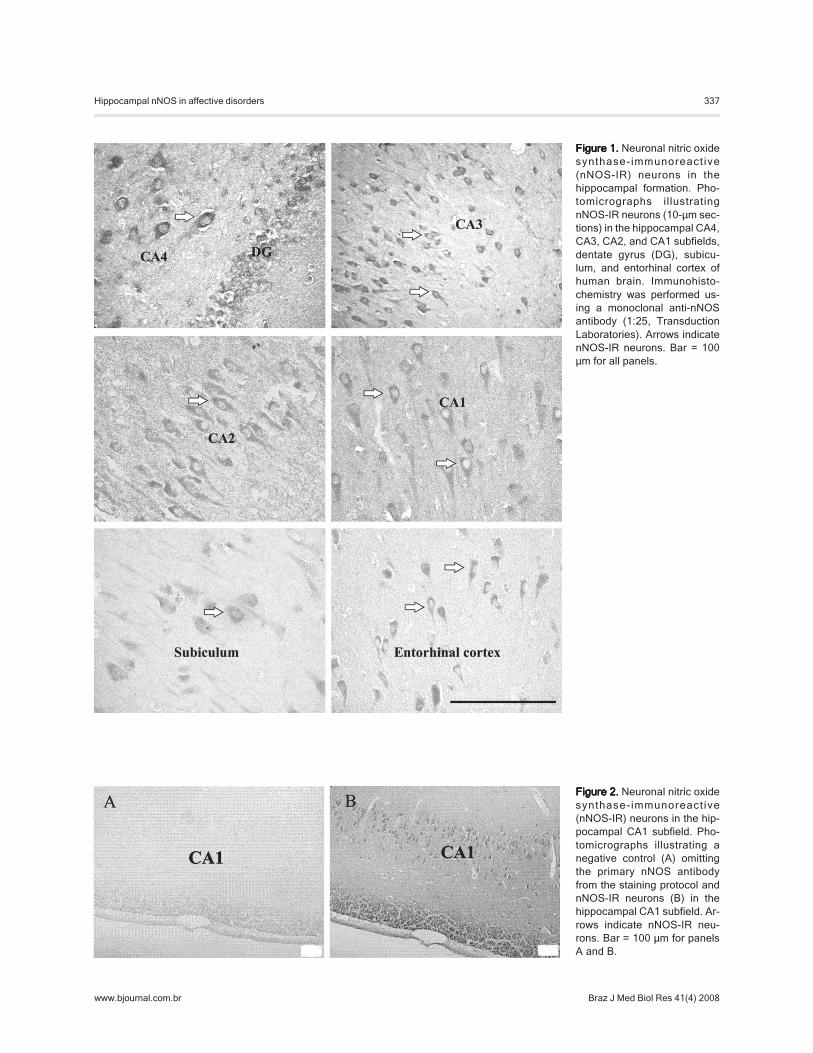
Labeling was seen predominantly in pyramidal neuronsalthough some interneurons were observed interspersedbetween the pyramidal cells as well as in the stratumradiatum, stratum lacunosum, and molecular layers. Granu-lar immunoreactivity was seen in the cytoplasm of nNOS-IR pyramidal neurons, showing the characteristic singleapical dendrite projecting perpendicular to the axis of thehippocampus, as previously described by Doyle and Slater(12). The granule cells of the dentate gyrus were weaklyimmunostained for nNOS. Few nNOS-IR fibers were alsoobserved within the hippocampus.
No staining was observed when the primary antiserumwas omitted from the reaction solution (Figure 2).
Nissl-stained and nNOS-IR neuronsAs shown in Table 2, the numbers of Nissl-stained
neurons in each sector were similar in the diagnosticgroups and there were no trends of main effects of diagno-sis or interactions with side (P > 0.05). In most sectors, thenumber of Nissl-stained neurons correlated significantlywith the number of nNOS-IR neurons.
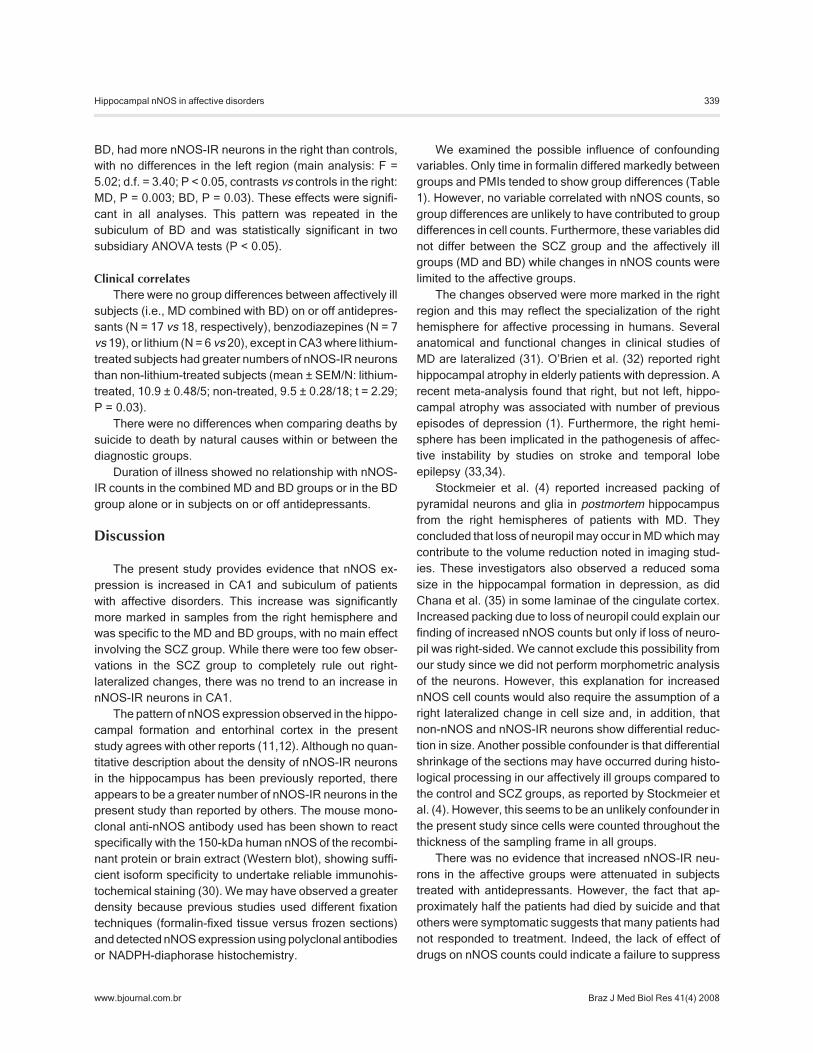
In general, the MD and BD groups tended to have morenNOS-IR neurons in all regions, especially in the right, andthis was most statistically compelling in CA1 and subicu-lum while the SCZ group showed no trends of differencesfrom controls (Figure 3). The detailed results are pre-sented below in the order of the multisynaptic hippocampalpathway: entorhinal cortex-dentate gyrus-CA4-CA3-CA2-CA1-subiculum.
There were no changes in cell neuron numbers in theentorhinal cortex or in CA4, except for a main effect ofdiagnosis after covarying for Nissl-stained neurons (F =2.06; d.f. = 2.33; P < 0.05). The MD and BD groups hadgreater numbers of nNOS-IR neurons in relation to Nissl-stained neurons than controls (planned contrasts, P = 0.03and P = 0.04, respectively). In CA3 there was a diagnosisby side interaction (P = 0.04) in the main analysis but thiswas due to nNOS-IR neuron numbers in the three subjects
for which there was no data in the righthemisphere in the SCZ group. This interac-tion was reduced in significance (P = 0.11)when ANOVA was repeated without the SCZgroup. This trend probably reflects non-sig-nificant increases in the right hemisphereand decreases in the left hemisphere, espe-cially in the BD group (Table 2). There wereno significant group differences in neuronalnumber in CA2.
There were clear-cut changes in the num-ber of nNOS-IR neurons in CA1 (Table 2,Figure 3). The affectively ill groups, MD and
contrasts. Finally, analysis of covariance was carried outfor the affective and control groups with Nissl-stainedneuron numbers as a covariate.
To test the hypothesis that nNOS-IR neurons would bereduced in subjects taking antidepressants and lithium,counts from the BD and MD groups were combined andcompared in the treatment groups by the t-test. To test thehypothesis that nNOS counts would be reduced in sub-jects with a long duration of illness, Spearman correlationsbetween counts and duration of illness were calculated forthe combined BD plus MD group.
Results
ConfoundersAge and gender did not differ between the diagnostic
and control groups and did not correlate with nNOS counts.Patients tended to have longer PMIs and although themain effect of diagnosis was not statistically significant,planned contrasts showed that greater PMIs were signifi-cant in the SCZ group (P = 0.04) and borderline in the BDgroup (P = 0.07; Table 1). However, PMI did not correlatewith nNOS counts and was not retained as a covariate.Brains that had been exposed to formalin for substantiallylonger periods than brains from controls (main effect ofdiagnosis: F = 3.55, d.f. = 3.56, P = 0.02) and 9 of the 15controls had shorter fixation times than any of the SCZgroup and most of the other groups. However, time informalin did not correlate with nNOS counts and was notincluded as a covariate. As an additional check, ANOVAwas repeated excluding controls since the clinical groupsdid not differ in fixation time.
Distribution of nNOS-IR neurons in the hippocampalformation
Neurons expressing nNOS-IR were distributed in allfields of the hippocampus (CA4, CA3, CA2, and CA1),dentate gyrus, subiculum, and entorhinal cortex (Figure 1).
Table 1.Table 1.Table 1.Table 1.Table 1. Clinical and demographic data of patients and controls from StanleyConsortium postmortem brain collection.
Psychiatric diagnosis
Negative SCZ MD BD
Age (years) 49.0 ± 2.5 45.6 ± 3.5 46.5 ± 2.4 41.0 ± 3.1Gender (male/female) 10/5 9/6 9/6 11/4PMI (h) 22.7 ± 2.2 33.7 ± 3.8a 27.5 ± 2.8 32.5 ± 4.2b
Data are reported as means ± SEM. PMI = postmortem interval; SCZ = schizo-phrenia; MD = major depression; BD = bipolar depression.Planned contrast, aP = 0.04 and bP = 0.07.
337
Braz J Med Biol Res 41(4) 2008
Hippocampal nNOS in affective disorders
www.bjournal.com.br
Figure 1.Figure 1.Figure 1.Figure 1.Figure 1. Neuronal nitric oxidesynthase-immunoreact ive(nNOS-IR) neurons in thehippocampal formation. Pho-tomicrographs illustratingnNOS-IR neurons (10-µm sec-tions) in the hippocampal CA4,CA3, CA2, and CA1 subfields,dentate gyrus (DG), subicu-lum, and entorhinal cortex ofhuman brain. Immunohisto-chemistry was performed us-ing a monoclonal anti-nNOSantibody (1:25, TransductionLaboratories). Arrows indicatenNOS-IR neurons. Bar = 100µm for all panels.
Figure 2.Figure 2.Figure 2.Figure 2.Figure 2. Neuronal nitric oxidesynthase-immunoreact ive(nNOS-IR) neurons in the hip-pocampal CA1 subfield. Pho-tomicrographs illustrating anegative control (A) omittingthe primary nNOS antibodyfrom the staining protocol andnNOS-IR neurons (B) in thehippocampal CA1 subfield. Ar-rows indicate nNOS-IR neu-rons. Bar = 100 µm for panelsA and B.
338
Braz J Med Biol Res 41(4) 2008
R.M.W. Oliveira et al.
www.bjournal.com.br
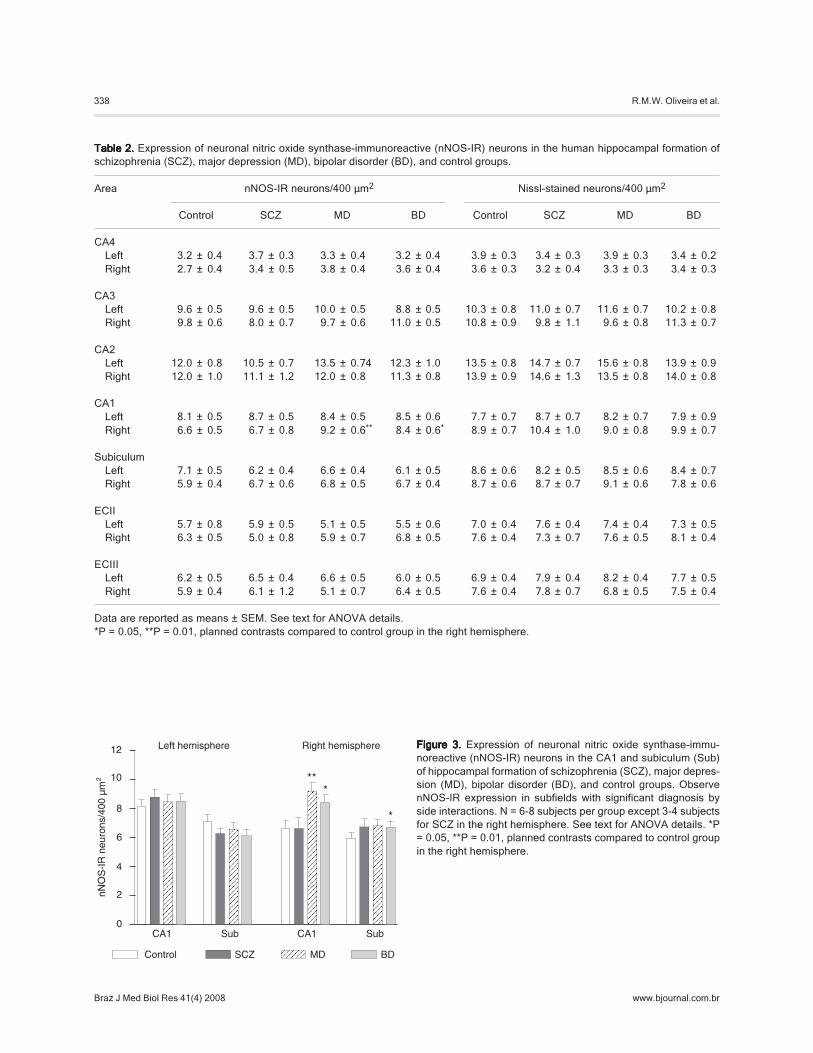
Table 2.Table 2.Table 2.Table 2.Table 2. Expression of neuronal nitric oxide synthase-immunoreactive (nNOS-IR) neurons in the human hippocampal formation ofschizophrenia (SCZ), major depression (MD), bipolar disorder (BD), and control groups.
Area nNOS-IR neurons/400 µm2 Nissl-stained neurons/400 µm2
Control SCZ MD BD Control SCZ MD BD
CA4Left 3.2 ± 0.4 3.7 ± 0.3 3.3 ± 0.4 3.2 ± 0.4 3.9 ± 0.3 3.4 ± 0.3 3.9 ± 0.3 3.4 ± 0.2Right 2.7 ± 0.4 3.4 ± 0.5 3.8 ± 0.4 3.6 ± 0.4 3.6 ± 0.3 3.2 ± 0.4 3.3 ± 0.3 3.4 ± 0.3
CA3Left 9.6 ± 0.5 9.6 ± 0.5 10.0 ± 0.5 8.8 ± 0.5 10.3 ± 0.8 11.0 ± 0.7 11.6 ± 0.7 10.2 ± 0.8Right 9.8 ± 0.6 8.0 ± 0.7 9.7 ± 0.6 11.0 ± 0.5 10.8 ± 0.9 9.8 ± 1.1 9.6 ± 0.8 11.3 ± 0.7
CA2Left 12.0 ± 0.8 10.5 ± 0.7 13.5 ± 0.74 12.3 ± 1.0 13.5 ± 0.8 14.7 ± 0.7 15.6 ± 0.8 13.9 ± 0.9Right 12.0 ± 1.0 11.1 ± 1.2 12.0 ± 0.8 11.3 ± 0.8 13.9 ± 0.9 14.6 ± 1.3 13.5 ± 0.8 14.0 ± 0.8
CA1Left 8.1 ± 0.5 8.7 ± 0.5 8.4 ± 0.5 8.5 ± 0.6 7.7 ± 0.7 8.7 ± 0.7 8.2 ± 0.7 7.9 ± 0.9Right 6.6 ± 0.5 6.7 ± 0.8 9.2 ± 0.6** 8.4 ± 0.6* 8.9 ± 0.7 10.4 ± 1.0 9.0 ± 0.8 9.9 ± 0.7
SubiculumLeft 7.1 ± 0.5 6.2 ± 0.4 6.6 ± 0.4 6.1 ± 0.5 8.6 ± 0.6 8.2 ± 0.5 8.5 ± 0.6 8.4 ± 0.7Right 5.9 ± 0.4 6.7 ± 0.6 6.8 ± 0.5 6.7 ± 0.4 8.7 ± 0.6 8.7 ± 0.7 9.1 ± 0.6 7.8 ± 0.6
ECIILeft 5.7 ± 0.8 5.9 ± 0.5 5.1 ± 0.5 5.5 ± 0.6 7.0 ± 0.4 7.6 ± 0.4 7.4 ± 0.4 7.3 ± 0.5Right 6.3 ± 0.5 5.0 ± 0.8 5.9 ± 0.7 6.8 ± 0.5 7.6 ± 0.4 7.3 ± 0.7 7.6 ± 0.5 8.1 ± 0.4
ECIIILeft 6.2 ± 0.5 6.5 ± 0.4 6.6 ± 0.5 6.0 ± 0.5 6.9 ± 0.4 7.9 ± 0.4 8.2 ± 0.4 7.7 ± 0.5Right 5.9 ± 0.4 6.1 ± 1.2 5.1 ± 0.7 6.4 ± 0.5 7.6 ± 0.4 7.8 ± 0.7 6.8 ± 0.5 7.5 ± 0.4
Data are reported as means ± SEM. See text for ANOVA details.*P = 0.05, **P = 0.01, planned contrasts compared to control group in the right hemisphere.
Figure 3.Figure 3.Figure 3.Figure 3.Figure 3. Expression of neuronal nitric oxide synthase-immu-noreactive (nNOS-IR) neurons in the CA1 and subiculum (Sub)of hippocampal formation of schizophrenia (SCZ), major depres-sion (MD), bipolar disorder (BD), and control groups. ObservenNOS-IR expression in subfields with significant diagnosis byside interactions. N = 6-8 subjects per group except 3-4 subjectsfor SCZ in the right hemisphere. See text for ANOVA details. *P= 0.05, **P = 0.01, planned contrasts compared to control groupin the right hemisphere.
339
Braz J Med Biol Res 41(4) 2008
Hippocampal nNOS in affective disorders
www.bjournal.com.br
BD, had more nNOS-IR neurons in the right than controls,with no differences in the left region (main analysis: F =5.02; d.f. = 3.40; P < 0.05, contrasts vs controls in the right:MD, P = 0.003; BD, P = 0.03). These effects were signifi-cant in all analyses. This pattern was repeated in thesubiculum of BD and was statistically significant in twosubsidiary ANOVA tests (P < 0.05).
Clinical correlatesThere were no group differences between affectively ill
subjects (i.e., MD combined with BD) on or off antidepres-sants (N = 17 vs 18, respectively), benzodiazepines (N = 7vs 19), or lithium (N = 6 vs 20), except in CA3 where lithium-treated subjects had greater numbers of nNOS-IR neuronsthan non-lithium-treated subjects (mean ± SEM/N: lithium-treated, 10.9 ± 0.48/5; non-treated, 9.5 ± 0.28/18; t = 2.29;P = 0.03).
There were no differences when comparing deaths bysuicide to death by natural causes within or between thediagnostic groups.
Duration of illness showed no relationship with nNOS-IR counts in the combined MD and BD groups or in the BDgroup alone or in subjects on or off antidepressants.
Discussion
The present study provides evidence that nNOS ex-pression is increased in CA1 and subiculum of patientswith affective disorders. This increase was significantlymore marked in samples from the right hemisphere andwas specific to the MD and BD groups, with no main effectinvolving the SCZ group. While there were too few obser-vations in the SCZ group to completely rule out right-lateralized changes, there was no trend to an increase innNOS-IR neurons in CA1.
The pattern of nNOS expression observed in the hippo-campal formation and entorhinal cortex in the presentstudy agrees with other reports (11,12). Although no quan-titative description about the density of nNOS-IR neuronsin the hippocampus has been previously reported, thereappears to be a greater number of nNOS-IR neurons in thepresent study than reported by others. The mouse mono-clonal anti-nNOS antibody used has been shown to reactspecifically with the 150-kDa human nNOS of the recombi-nant protein or brain extract (Western blot), showing suffi-cient isoform specificity to undertake reliable immunohis-tochemical staining (30). We may have observed a greaterdensity because previous studies used different fixationtechniques (formalin-fixed tissue versus frozen sections)and detected nNOS expression using polyclonal antibodiesor NADPH-diaphorase histochemistry.
We examined the possible influence of confoundingvariables. Only time in formalin differed markedly betweengroups and PMIs tended to show group differences (Table1). However, no variable correlated with nNOS counts, sogroup differences are unlikely to have contributed to groupdifferences in cell counts. Furthermore, these variables didnot differ between the SCZ group and the affectively illgroups (MD and BD) while changes in nNOS counts werelimited to the affective groups.
The changes observed were more marked in the rightregion and this may reflect the specialization of the righthemisphere for affective processing in humans. Severalanatomical and functional changes in clinical studies ofMD are lateralized (31). O’Brien et al. (32) reported righthippocampal atrophy in elderly patients with depression. Arecent meta-analysis found that right, but not left, hippo-campal atrophy was associated with number of previousepisodes of depression (1). Furthermore, the right hemi-sphere has been implicated in the pathogenesis of affec-tive instability by studies on stroke and temporal lobeepilepsy (33,34).
Stockmeier et al. (4) reported increased packing ofpyramidal neurons and glia in postmortem hippocampusfrom the right hemispheres of patients with MD. Theyconcluded that loss of neuropil may occur in MD which maycontribute to the volume reduction noted in imaging stud-ies. These investigators also observed a reduced somasize in the hippocampal formation in depression, as didChana et al. (35) in some laminae of the cingulate cortex.Increased packing due to loss of neuropil could explain ourfinding of increased nNOS counts but only if loss of neuro-pil was right-sided. We cannot exclude this possibility fromour study since we did not perform morphometric analysisof the neurons. However, this explanation for increasednNOS cell counts would also require the assumption of aright lateralized change in cell size and, in addition, thatnon-nNOS and nNOS-IR neurons show differential reduc-tion in size. Another possible confounder is that differentialshrinkage of the sections may have occurred during histo-logical processing in our affectively ill groups compared tothe control and SCZ groups, as reported by Stockmeier etal. (4). However, this seems to be an unlikely confounder inthe present study since cells were counted throughout thethickness of the sampling frame in all groups.
There was no evidence that increased nNOS-IR neu-rons in the affective groups were attenuated in subjectstreated with antidepressants. However, the fact that ap-proximately half the patients had died by suicide and thatothers were symptomatic suggests that many patients hadnot responded to treatment. Indeed, the lack of effect ofdrugs on nNOS counts could indicate a failure to suppress

340
Braz J Med Biol Res 41(4) 2008
R.M.W. Oliveira et al.
www.bjournal.com.br
decreased in the postmortem hippocampus but this oc-curred in all diagnostic groups including SCZ, albeit indifferent subregions (38). However, nNOS counts in anyhippocampal subfield did not show any tendency to de-crease. We conclude that our results are not likely to bedue to cytotoxic effects of elevated glucocorticoid expo-sure. However, it remains possible that increased nNOSexpression is initiated by glucocorticoids.
In conclusion, we provide evidence for an increasednumber of neurons expressing nNOS-IR in the hippocam-pus of patients with MD and BD. These results are compat-ible with our main prediction that hippocampi from affectivelyill patients would show increased nNOS expression andreinforce current interest in the NMDA-NO pathway as atarget for the pathophysiology of affective disorders andantidepressant drug development.
Acknowledgments
Postmortem brains were donated by the Stanley Foun-dation Brain Collection, Stanley Foundation, Muscatine,IA, USA, courtesy of Drs. Michael B. Knable, E. FullerTorrey, Maree J. Webster, and Robert H. Yolken.
hippocampal function, as seen in a PET study of fluoxetinenon-responders (20). This assumption is supported by thefact that imipramine withdrawal was associated with asignificant increase in NOS activity in the hippocampus ofrats (23).
Increased numbers of nNOS-IR neurons in CA1 of MDand BD seem to contradict the prediction that high circulat-ing glucocorticoid concentrations in affective disordersmight have neurotoxic effects through NMDA-mediatednNOS expression in the hippocampus (8). It is possible,however, that nNOS-positive neurons are resistant to cyto-toxicity and so become more densely packed as otherneurons die. Resistance of nNOS neurons has been re-ported in Alzheimer’s disease (36), Huntington’s disease(37) and NMDA-mediated neurotoxicity itself (8). Never-theless, the asymmetric changes provide a strong argu-ment against increased packing as the mechanism ofincreased nNOS-IR neurons; it is difficult to envisage aunilateral neurotoxic effect of stress. It is very likely that thehippocampi from the MD and BD groups had undergoneprolonged exposure to glucocorticoids, especially becausemany were from suicide victims. Indeed, it has been re-ported that glucocorticoid receptor mRNA expression is
References
1. Campbell S, Macqueen G. The role of the hippocampus inthe pathophysiology of major depression. J PsychiatryNeurosci 2004; 29: 417-426.
2. Sheline YI, Wang PW, Gado MH, Csernansky JG, VannierMW. Hippocampal atrophy in recurrent major depression.Proc Natl Acad Sci U S A 1996; 93: 3908-3913.
3. Bremner JD, Narayan M, Anderson ER, Staib LH, Miller HL,Charney DS. Hippocampal volume reduction in major de-pression. Am J Psychiatry 2000; 157: 115-118.
4. Stockmeier CA, Mahajan GJ, Konick LC, Overholser JC,Jurjus GJ, Meltzer HY, et al. Cellular changes in the post-mortem hippocampus in major depression. Biol Psychiatry2004; 56: 640-650.
5. Uno H, Tarara R, Else JG, Suleman MA, Sapolsky RM.Hippocampal damage associated with prolonged and fatalstress in primates. J Neurosci 1989; 9: 1705-1711.
6. McEwen BS, Magarinos AM, Reagan LP. Structural plastic-ity and tianeptine: cellular and molecular targets. Eur Psy-chiatry 2002; 17 (Suppl 3): 318-330.
7. Garthwaite J. Glutamate, nitric oxide and cell-cell signallingin the nervous system. Trends Neurosci 1991; 14: 60-67.
8. Dawson VL, Dawson TM. Nitric oxide in neurodegeneration.Prog Brain Res 1998; 118: 215-229.
9. Yanik M, Vural H, Tutkun H, Zoroglu SS, Savas HA, HerkenH, et al. The role of the arginine-nitric oxide pathway in thepathogenesis of bipolar affective disorder. Eur Arch Psy-chiatry Clin Neurosci 2004; 254: 43-47.
10. Law AJ, Weickert CS, Webster MJ, Herman MM, KleinmanJE, Harrison PJ. Expression of NMDA receptor NR1, NR2Aand NR2B subunit mRNAs during development of the hu-man hippocampal formation. Eur J Neurosci 2003; 18: 1197-1205.
11. Egberongbe YI, Gentleman SM, Falkai P, Bogerts B, PolakJM, Roberts GW. The distribution of nitric oxide synthaseimmunoreactivity in the human brain. Neuroscience 1994;59: 561-578.
12. Doyle CA, Slater P. Localization of neuronal and endothelialnitric oxide synthase isoforms in human hippocampus. Neu-roscience 1997; 76: 387-395.
13. Harkin A, Connor TJ, Walsh M, St John N, Kelly JP. Seroto-nergic mediation of the antidepressant-like effects of nitricoxide synthase inhibitors. Neuropharmacology 2003; 44:616-623.
14. Paul IA, Skolnick P. Glutamate and depression: clinical andpreclinical studies. Ann N Y Acad Sci 2003; 1003: 250-272.
15. Joca SR, Guimarães FS. Inhibition of neuronal nitric oxidesynthase in the rat hippocampus induces antidepressant-like effects. Psychopharmacology 2006; 185: 298-305.
16. Karolewicz B, Bruce KH, Lee B, Paul IA. Nitric oxide syn-thase inhibitors have antidepressant-like properties in mice.2. Chronic treatment results in downregulation of corticalbeta-adrenoceptors. Eur J Pharmacol 1999; 372: 215-220.
17. Zarate CA Jr, Singh JB, Carlson PJ, Brutsche NE, Ameli R,Luckenbaugh DA, et al. A randomized trial of an N-methyl-
341
Braz J Med Biol Res 41(4) 2008
Hippocampal nNOS in affective disorders
www.bjournal.com.br
D-aspartate antagonist in treatment-resistant major depres-sion. Arch Gen Psychiatry 2006; 63: 856-864.
18. Naylor GJ, Smith AH, Connelly P. A controlled trial of meth-ylene blue in severe depressive illness. Biol Psychiatry1987; 22: 657-659.
19. Suzuki E, Yagi G, Nakaki T, Kanba S, Asai M. Elevatedplasma nitrate levels in depressive states. J Affect Disord2001; 63: 221-224.
20. Mayberg HS, Brannan SK, Tekell JL, Silva JA, Mahurin RK,McGinnis S, et al. Regional metabolic effects of fluoxetine inmajor depression: serial changes and relationship to clinicalresponse. Biol Psychiatry 2000; 48: 830-843.
21. Bonvento G, Sibson N, Pellerin L. Does glutamate imageyour thoughts? Trends Neurosci 2002; 25: 359-364.
22. Li YF, Zhang YZ, Liu YQ, Wang HL, Cao JB, Guan TT, et al.Inhibition of N-methyl-D-aspartate receptor function appearsto be one of the common actions for antidepressants. JPsychopharmacol 2006; 20: 629-635.
23. Deakin JFW, Graeff FG. 5-HT and mechanisms of defense.J Psychopharmacol 1991; 5: 305-315.
24. Harvey BH, Retief R, Korff A, Wegener G. Increased hippo-campal nitric oxide synthase activity and stress responsive-ness after imipramine discontinuation: role of 5HT 2A/C-receptors. Metab Brain Dis 2006; 21: 211-220.
25. Torrey EF, Webster M, Knable M, Johnston N, Yolken RH.The Stanley Foundation Brain Collection and Neuropathol-ogy Consortium. Schizophr Res 2000; 44: 151-155.
26. Benes FM, Lange N. Two-dimensional versus three-dimen-sional cell counting: a practical perspective. TrendsNeurosci 2001; 24: 11-17.
27. Thorns V, Hansen L, Masliah E. nNOS expressing neuronsin the entorhinal cortex and hippocampus are affected inpatients with Alzheimer’s disease. Exp Neurol 1998; 150:14-20.
28. Katsuse O, Iseki E, Kosaka K. Immunohistochemical studyof the expression of cytokines and nitric oxide synthases in
brains of patients with dementia with Lewy bodies. Neuro-pathology 2003; 23: 9-15.
29. Paxinos G, Mai JK. The human nervous system. San Diego:Academic Press; 2003.
30. Coers W, Timens W, Kempinga C, Klok PA, Moshage H.Specificity of antibodies to nitric oxide synthase isoforms inhuman, guinea pig, rat, and mouse tissues. J HistochemCytochem 1998; 46: 1385-1392.
31. Drevets WC. Neuroimaging studies of mood disorders. BiolPsychiatry 2000; 48: 813-829.
32. O’Brien JT, Lloyd A, McKeith I, Gholkar A, Ferrier N. Alongitudinal study of hippocampal volume, cortisol levels,and cognition in older depressed subjects. Am J Psychiatry2004; 161: 2081-2090.
33. Ghika-Schmid F, Bogousslavsky J. Affective disorders fol-lowing stroke. Eur Neurol 1997; 38: 75-81.
34. MacHale SM, O’Rourke SJ, Wardlaw JM, Dennis MS. De-pression and its relation to lesion location after stroke. JNeurol Neurosurg Psychiatry 1998; 64: 371-374.
35. Chana G, Landau S, Beasley C, Everall IP, Cotter D. Two-dimensional assessment of cytoarchitecture in the anteriorcingulate cortex in major depressive disorder, bipolar disor-der, and schizophrenia: evidence for decreased neuronalsomal size and increased neuronal density. Biol Psychiatry2003; 53: 1086-1098.
36. Tao Z, Van GD, Lammens M, Dom R. NADPH-diaphorase-containing neurons in cortex, subcortical white matter andneostriatum are selectively spared in Alzheimer’s disease.Dement Geriatr Cogn Disord 1999; 10: 460-468.
37. Ferrante RJ, Kowall NW, Beal MF, Richardson EP Jr, BirdED, Martin JB. Selective sparing of a class of striatal neu-rons in Huntington’s disease. Science 1985; 230: 561-563.
38. Webster MJ, Knable MB, O’Grady J, Orthmann J, WeickertCS. Regional specificity of brain glucocorticoid receptormRNA alterations in subjects with schizophrenia and mooddisorders. Mol Psychiatry 2002; 7: 985-994, 924.