Export Costs of Visa Restrictions -the case of Russia
19
Export Costs of Visa Restrictions - the case of Russia How influence or not influence the visa restrictions the Russian export Topics in the Russian Economy (Aktuelle Forschungsfragen der internationalen Finanzpolitik) WIWISS_V_107046_13W Dénes Attila TORDAI Immatriculation number: 4761699 (ERASMUS)
-
Upload
uni-corvinus -
Category
Documents
-
view
2 -
download
0
Transcript of Export Costs of Visa Restrictions -the case of Russia
Export Costs of Visa Restrictions -
the case of Russia
How influence or not influence the visa restriction s the Russian export
Topics in the Russian Economy
(Aktuelle Forschungsfragen der internationalen Finanzpolitik)
WIWISS_V_107046_13W
Dénes Attila TORDAI
Immatriculation number: 4761699 (ERASMUS)
Contents
Introduction ........................................................................................................................................3
Model Analysis ...................................................................................................................................4
Short Analysis of the Basic Study .......................................................................................................5
Russian Export and Visa Restrictions ..................................................................................................8
The practice of the Russian visa regime ...........................................................................................8
Visa and trade with Commonwealth of Independent States ..............................................................8
Trade with visa-free countries .........................................................................................................9
Trade with the most important Western European partners ............................................................ 10
Trade with Central and Eastern European countries ....................................................................... 10
Other Possible Problems for Russian Firms ....................................................................................... 11
Competitiveness ............................................................................................................................ 11
Productivity .................................................................................................................................. 11
Cost to export ............................................................................................................................... 12
Diversification .............................................................................................................................. 12
Conclusion........................................................................................................................................ 14
Bibliography ..................................................................................................................................... 15
Appendix .......................................................................................................................................... 16
Introduction
Restriction on international trade, primarily in the form of non-tariff barriers, have multiplied
rapidly from the 1980s. In recent years, non-tariff barriers have increased, as tariffs have
fallen, primarily to the GATT, than the operation of World Trade Organization since 1995.
But the increasing use of protectionist trade policies raises national as well as international
issues. Non-tax measures imposed by governments to favor domestic over foreign suppliers.
Non-tariff measures such as quotas, voluntary export restraints, trade restraints, non-automatic
import authorizations, visa restrictions have significant effects. These “hard-core” non-tariff
measures are designed to reduce imports and, thereby, benefit domestic producers (Coughlin-
Wood, 1989).
As many observers have noted, international trade restrictions generally have costly national
consequences. Non-tariff barriers (NTBs) and other regulatory differences can have two main
effects. Non-tariff barriers can either increase the cost of doing business for firms (for
example visa regimes), or they can restrict market access. Traditional NTBs, like import
quotas, are an example where NTBs market access. In contrast, regulations that require
expensive reconfiguration of products for export are an example of cost raising NTBs (CEPR,
2013). Visa restrictions also can have a negative effect on market access, and as a non-tariff
restriction, can have an effect on the trade relations between countries.
The ongoing negotiation of the Transatlantic Trade and Investment Partnership (TTIP)
between the United States of America and the European Union also bring to focus the
importance of the non-tariff barriers, because not only the removing of the trade barriers being
negotiated, much more emphasis are on the non-tariff barriers (in the case of TTIP the
technical regulations, standards, approval procedures, bureaucracy). The reason is simple: the
economies could have substantial benefits from some liberalization of non-tariff barriers. Due
to the problems of collecting data on these barriers, a wide-scale impact of removing them are
hard to quantify. Some studies showed that removal of NTBs would generate 90 billion dollar
global gains or lowering the trade transaction costs by 1% would increase of $40 billion in
global welfare (Love-Lattimore, 2009). To estimate this gains is very difficult, but if we see,
that according to the World Trade Organization, Russia's share in the world total export was
2.88% in 2012, the benefits from the elimination of non-trade barriers could be billions of
dollars for the Russian economy and for the Russian companies. Therefore also it is
interesting and timely to analyze the role of visa restrictions to the export in Russia's point of
view. During this paper, I try to find the answer, how influence or not influence the visa
restrictions the Russian export.
Generally visa restriction are imposed by governments to control the inbound travel of non-
citizens, but also express the relationship between the countries. Visa restriction impose
significant burden on business and also private travelers, not only because of the cost of the
visa, but application process, personally on an embassy, consulate or via post, can take weeks
or month. Furthermore the visa in the passport may not guarantee to entering the country, but
there is a high probability, that you will be able to enter. The main problem of the visa
restriction, that the much of the international trade (and also investments) transaction requires
personal contact with the foreign partners, accordingly, visa regimes may impose extra costs
on business during the negotiations, render such physical contact more difficult restrict the
exchange of information, reputation building and business expansion in foreign countries.
Therefore bilateral trade activities are likely to be negatively affected by visa restrictions
(Neumayer, 2011; Kapelko-Volchkova, 2013).
Model Analysis
I found, that recently papers on analysis of international trade use two big types of model
during analyzing the trade: CGE model and the gravity-type model.
The CGE model is one of the most used quantitative methods to evaluate the impact of
economic and policy shocks and reforms in the economy. The CGE model is mostly used to
evaluate the effects of fiscal policy, climate change shocks, shocks in international prices and
trade policy, if the research question involves analyzing the static and dynamic, direct and
indirect, short and long term effects caused by the policy changes. The CGE approach is
especially useful when the expected effects of policy implementation are complex and
materialize through different transmission channels. The reason, why CGE model is not
suitable to analyze the impact of visa restriction to trade, is that CGE models perform
economic cost-benefit analysis for trade integration options, estimating aggregate effects not
only on trade, but production, employment, fiscal balance, household income and poverty and
inequality. Otherwise, it is a excellent model to evaluate effects at different levels (sectorial,
firm, household and geographic) and help for the governments, authorities to define trade
negotiation strategies (Inter-American Development Bank).
In contrast, the gravity model is a good choice to analyze the impact of the visa regimes to the
international and bilateral trade. Starting with Tinbergen in 1962, the gravity model has given
the base to literally thousands of publications and working papers covering the trade from a
wide variety of regions, time periods, and sectors. The gravity model was initially presented
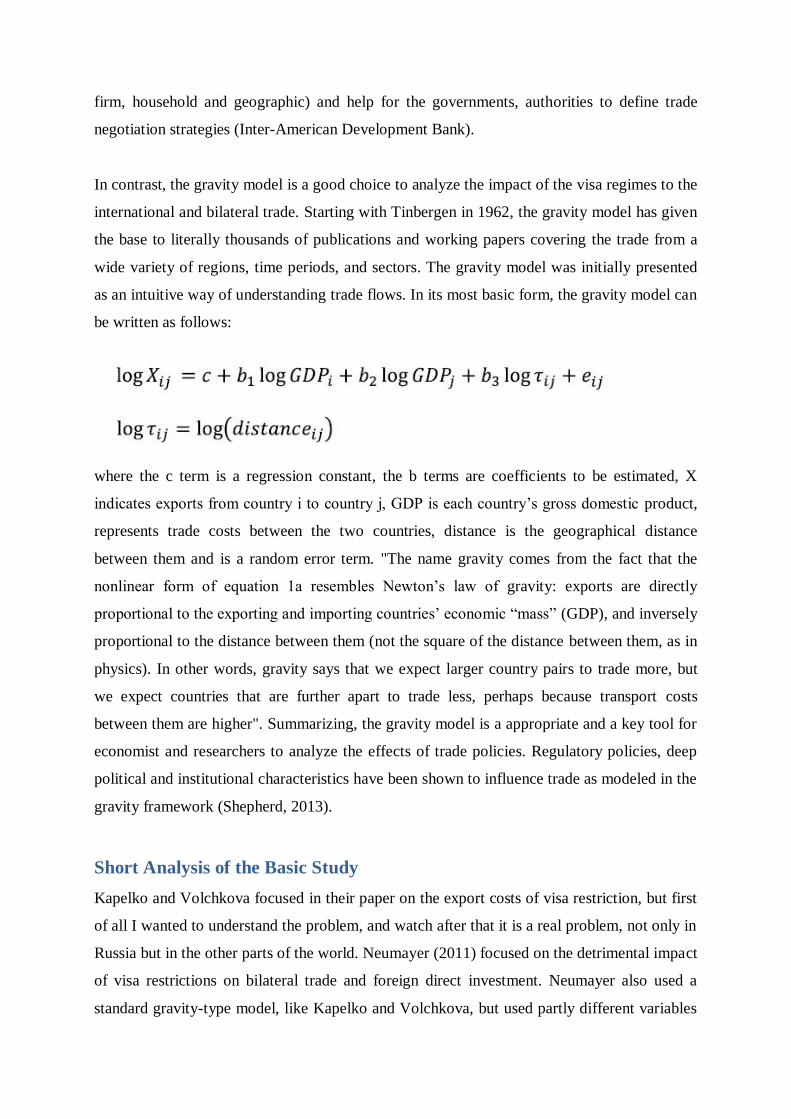
as an intuitive way of understanding trade flows. In its most basic form, the gravity model can
be written as follows:
where the c term is a regression constant, the b terms are coefficients to be estimated, X
indicates exports from country i to country j, GDP is each country’s gross domestic product,
represents trade costs between the two countries, distance is the geographical distance
between them and is a random error term. "The name gravity comes from the fact that the
nonlinear form of equation 1a resembles Newton’s law of gravity: exports are directly
proportional to the exporting and importing countries’ economic “mass” (GDP), and inversely
proportional to the distance between them (not the square of the distance between them, as in
physics). In other words, gravity says that we expect larger country pairs to trade more, but
we expect countries that are further apart to trade less, perhaps because transport costs
between them are higher". Summarizing, the gravity model is a appropriate and a key tool for
economist and researchers to analyze the effects of trade policies. Regulatory policies, deep
political and institutional characteristics have been shown to influence trade as modeled in the
gravity framework (Shepherd, 2013).
Short Analysis of the Basic Study
Kapelko and Volchkova focused in their paper on the export costs of visa restriction, but first
of all I wanted to understand the problem, and watch after that it is a real problem, not only in
Russia but in the other parts of the world. Neumayer (2011) focused on the detrimental impact
of visa restrictions on bilateral trade and foreign direct investment. Neumayer also used a
standard gravity-type model, like Kapelko and Volchkova, but used partly different variables
in his model. As long as Kapelvo and Volchkova used visa, tariffs, WTO membership, GDP
PPP, Former Soviet Union membership, landlocked, contiguity and distance as variables, in
his more general model Neumayer used also contiguity and distance, and the colonial link is
very similar to the Former Soviet Union membership, but the additional variables are some
region, trade agreement, diplomatic representation, bilateral migrant stock, and finally the
visa, but separately on unilateral and bilateral level.
Neumayer (2011) finds, that both visa regimes, the unilateral and bilateral has a negative
effect on the bilateral trade between the countries. Without reciprocal visa restriction, when
just one country impose restriction, the bilateral trade estimated to be decreased
approximately 19%, and when both country have visa restriction, trade is estimated to be
reduced by up to 29%. Although the topic of FDI is not primary issue, but the fact, that the
effects of visa restrictions are essentially the same, the estimation shows an average 40%
decrease of FDI. The effects of visa restrictions on trade and investment are smaller than the
estimated effect of such restrictions on travel by visitors as reported by Neumayer, who finds
that visa restrictions could reduce travel by between 52 and 63 per cent. In Neumayer (2011)
the distance has also a negative correlation to trade, like in Kapelko and Volchkova (2013).
According to Neumayer (2011), one argue, that most trade business will be economically
profitable to compensate the trading partner for the costs of vista restrictions, but this
predication supposes the perfect information between the partners, which in the most cases is
lacking, and the potential gains will often only discovered after personal contact during
visiting the foreign partners. Generally, for developing countries even small additional costs
such (for example costs of visa regimes) can defeat the small profit margins of trade.
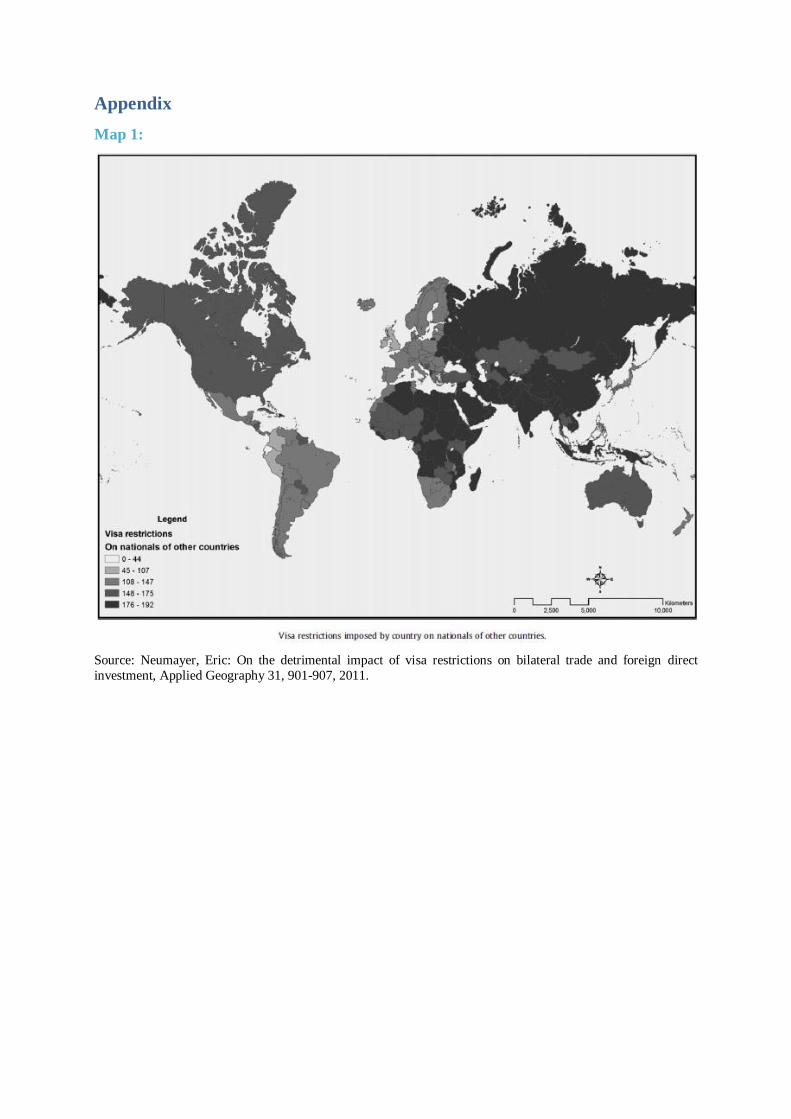
Map 1 and Map 2 show that Russia is strongly concerned with visa restrictions, also
restrictions imposed by country on national of other countries and nationals of country
travelling to other countries. In that case, the result of my basic paper is not surprise: the
probability of a Russian firm to export to visa restricted destinations is about 36 percent below
of the probability of export to visa-free destinations. The gap is higher, 40% for relationship
specific goods (logical, because they require special relationship between the buyer and the
seller) and with the 26% the non-relationship specific good are less influenced by visa
restrictions.
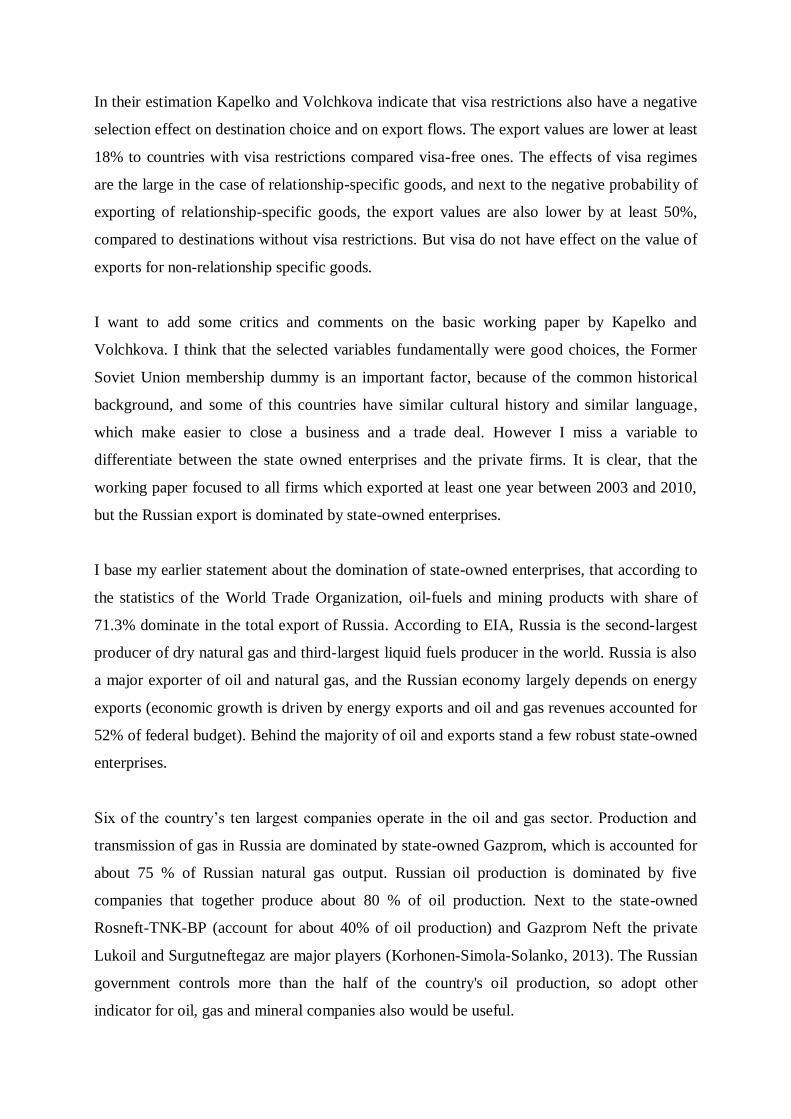
In their estimation Kapelko and Volchkova indicate that visa restrictions also have a negative
selection effect on destination choice and on export flows. The export values are lower at least
18% to countries with visa restrictions compared visa-free ones. The effects of visa regimes
are the large in the case of relationship-specific goods, and next to the negative probability of
exporting of relationship-specific goods, the export values are also lower by at least 50%,
compared to destinations without visa restrictions. But visa do not have effect on the value of
exports for non-relationship specific goods.
I want to add some critics and comments on the basic working paper by Kapelko and
Volchkova. I think that the selected variables fundamentally were good choices, the Former
Soviet Union membership dummy is an important factor, because of the common historical
background, and some of this countries have similar cultural history and similar language,
which make easier to close a business and a trade deal. However I miss a variable to
differentiate between the state owned enterprises and the private firms. It is clear, that the
working paper focused to all firms which exported at least one year between 2003 and 2010,
but the Russian export is dominated by state-owned enterprises.
I base my earlier statement about the domination of state-owned enterprises, that according to
the statistics of the World Trade Organization, oil-fuels and mining products with share of
71.3% dominate in the total export of Russia. According to EIA, Russia is the second-largest
producer of dry natural gas and third-largest liquid fuels producer in the world. Russia is also
a major exporter of oil and natural gas, and the Russian economy largely depends on energy
exports (economic growth is driven by energy exports and oil and gas revenues accounted for
52% of federal budget). Behind the majority of oil and exports stand a few robust state-owned
enterprises.
Six of the country’s ten largest companies operate in the oil and gas sector. Production and
transmission of gas in Russia are dominated by state-owned Gazprom, which is accounted for
about 75 % of Russian natural gas output. Russian oil production is dominated by five
companies that together produce about 80 % of oil production. Next to the state-owned
Rosneft-TNK-BP (account for about 40% of oil production) and Gazprom Neft the private
Lukoil and Surgutneftegaz are major players (Korhonen-Simola-Solanko, 2013). The Russian
government controls more than the half of the country's oil production, so adopt other
indicator for oil, gas and mineral companies also would be useful.
Russian Export and Visa Restrictions
The practice of the Russian visa regime
Russia has a reciprocal visa policy, which means, that the country has a similar policy with
respect to the citizens of another country as that country has with respect to Russian citizens.
It could be argument, that this reciprocity principle of Russian foreign policy is remunerative
or not, but next to the national and governmental pride probably the cost-benefit analysis
shows, that now it is the right policy. However, Neumayer (2011) finds, that the unilateral
visa can has a moderate negative effect (-19%) to trade on contrary bilateral visa (-29%), and
in long-term the other country can also change its own visa policy due to the positive effects.
Nowadays Russian citizen can visit 55 out of countries in the selected export destinations of
the basic working paper without visa requirements. From 2000 to 2010, in the 48 cases, it was
usually about visa abolishment, except five countries, Costa Rica, Czech Republic, Georgia,
Kyrgyzstan and Romania.
Visa and trade with Commonwealth of Independent States
Most of the members of the Commonwealth of Independent States (CIS) have no visa
restrictions with Russia. Armenia, Azerbaijan, Belarus, Kazakhstan, Moldova, Tajikistan and
Uzbekistan do not prevent the Russian citizens since 2000, only between Russia and
Kyrgyzstan and Turkmenistan is in effect visa obligation. Although the working paper by
Kapelko and Volchkova analyze the impact of visa restrictions from 2003 to 2010, analyze
the trade trends between Russia and the CIS from 2000 to 2012 can give comprehensive
picture. According to the database of Interstate Statistical Committee of the Commonwealth
of Independent States, the share of the CIS countries in the total Russian export was 13%,
which increased by 14% in 2005, and from 2005 it is continuously 15%.
Despite the positive correlation of contiguity, landlocked and Former Soviet Union indicators
and the visa-free regime, the share of the CIS countries from the total export of Russia do not
change dramatically from 2000 to 2012. Based on the database of CIS statistical bureau, from
2000 to 2012 the export to the CIS from Russia increased by an average of 18.23%, and the
export to the other countries of the world increased by 18.69%. This results strengthen the
outcome of my basic study, that there is an easier market access for Russian firms to market
of the former Soviet Union countries, but the visa-free status and the former historical
background do not have any effect on the value of the export. This result is somewhat
surprising.
Trade with visa-free countries
During my analysis in this and the next two parts I will use the data from Observatory of
Economic Complexity, which use the United Nations Comtrade Database. In this subsection I
will analyze the trade trends between the Russia and visa-free countries, primarily focus on
European countries and the Middle East, because of the distance variable and in same cases of
the former historical background after the second world war.
First I analyze Bulgaria, Bosnia And Herzegovina, Moldova and Serbia, but I am not going to
observe the trade between Montenegro and Russia, because the Russian export was $90
million in 2008, just the 0.022% of the total export of the country. The visa restriction was
cancelled against Russians in Moldova in 2000, in Bulgaria in 2001, in Bosnia And
Herzegovina in 2007 and in Serbia in 2009. The Russian export to Moldova was the 0.27%
($200 million) of the total export in 1999, but after the obliteration of the visa restriction, the
ratio of the export was 0.16% ($170 million) in 2000, 0.17% ($370 million) in 2005 and
0.16% ($580 million) in 2010, so the ratio do not increased, just the value of the export. One
year before Bulgaria cancelled the visa restrictions, the country's share of the Russian export
was 0.94% ($980 million), which reduced to 0.62% ($630 million) in the first visa-free year,
but in 2010 Bulgaria's share was 1.2% and $4.2 billion in value.
Bosnia And Herzegovina has a spectacular development in the Russian export after the
cancellation of the visa restrictions. In the first visa-free year, the country's share of the total
Russian export was only 0.058% ($180 million), but in 2010 was already 0.18% and $650
million in value. In the rate and amount Bosnia And Herzegovina does not play a major rule
in the Russian export, but it could be a positive example of the benefit of visa-free trade. We
can not say the same thing about Serbia, because there was no significant change in the
Russian export after 2008, when the Serbian share of total export of Russia was 0.75% ($3.1
billion), and in 2006 and in 2007 these data are as follows: 0.62% ($1.7 billion) and 0.5% (1.8
billion).
I do not find positive correlation also in the case of Egypt (visa-free from 2007) and Israel
(visa-free from 2008). The Russian export to Egypt was only the 0.81% ($ 2.5 billion) of the
total export, and the value of the export slightly increased to $3 billion in the next year, the
share from the total export decreased, in 2010 was 0.73% ($ 2.6 billion). After the Arab
Spring it could be an interesting question, what kind of role has the visa waiver status to
rebuild the international political and economical relations. In the case of Israel, the ratio of
the export was 0.52% ($2.1 billion) in 2008, 0.36% ($960 million) in 2009 and 0.46% ($1.6
billion) in 2010.
Trade with the most important Western European partners
The analysis the Russian export to the Western European countries made it clear, that not only
the visa requirements have serious influence to the trade changes, because all Western
European countries, also the non-European Union members have visa requirements to the
Russian citizens. However, from 2000 to 2010 there is a significant change in the destination
of the Russian export, without change of the visa regime.
In 2000 Germany was the most important western trade partner of Russia with 11% of the
total export and the value of $11 billion, ahead of Italy with 7.2% ($7.5 billion), and
Netherlands, France, Switzerland, UK and France was also important partner with their shares
between 3-4% (see Table 1). Already in 2005 Netherlands became the most important
European destination for Russian export with 9.2%, and its share increased to 13% in 2010.
Germany's and Italy's share fell between 2000 and 2010, though the volume of the Russian
export increased significant. The share of France and Finland essentially unchanged, the UK
decreased moderate, but Switzerland significant.
Trade with Central and Eastern European countries
After the analysis of the Russian export to the Western European countries, I look at the
Central and Eastern European countries curiosity, whether a similar trend could be observed. I
choosed Czech Republic, Hungary, Poland, Romania and Slovakia, and the results are
collected in Table 2.
Unlike the case of Western European countries, there are no significant changes in the
Russian export to the Central and Eastern European countries. Examining the export of Russia
from 2000 until 2010, we can observe a continuous, but no large-scale reduction in the CEE
share of the total export of Russia. Only Romania changed the visa regime during this period,
but the change in the share of the total export is not really remarkable. But the value of the
export to the CEE countries continuously increased for all countries. The explanation may be
that the most of the Russian export to this region is oil and gas, which dominate the total
export of Russia also. I think, that the mineral resources belong to the non-relationship
specific goods, because basically every host country has proper skills and infrastructure for
the processing, and the non-relationship specific goods are less affected by the visa
restrictions. Furthermore the politics and foreign policy play more important role in this topic.
Other Possible Problems for Russian Firms
Next to the visa requirements, there are more factor, which have major influence on the
Russian trade and export. I will explain in details the topics of competitiveness, productivity,
cost to export and diversification.
Competitiveness
In every year the World Economic Forum analyze the competitiveness of the countries in
their Global Competitiveness Report. In the 2013-2014 issue Russia take the 64th place,
improves by three positions since last year. The improvement is due to the satisfactory
macroeconomic environment, the low level of governmental debt, and the surplus in the
national budget. Other strength are the high level of education enrollment, a quite good
infrastructure and its large domestic market.
O the other hand, Russia continues to receive a poor evaluation of its public institution, a lack
of innovation capacity, furthermore the country suffers from inefficiencies in the goods, labor
and financial markets. The weak level of competition is due to inefficient anti-monopoly
policies, high restrictions on trade and foreign ownerships and a lack of trust in the financial
system.
Productivity
Productivity is the real value of output produced by a unit of labor in a unit of time, and it is
used to measure efficiency of the economy. The indicator varies across different countries, in
most cases refers to GDP produced per employed person. It can also measure output per
worker, output per filled job and output per hour worked. Figure 1 shows, that Russia has a
very modest position if we see the position of the country compared to the United States.
According to the OECD database, the gap compared to the US GDP per capita is close 60%,
and although the labor utilization is 20% better, the gap with respect to US GDP per hour
worked is more than 60% less. Russia should improve its performance in the case of labor
productivity.
An economy could be characterized by higher levels of competition pushes firms to improve
productivity and innovation. The World Bank study finds that productivity is a significant
factor in explaining export propensity in the sample of 19 countries, including Russia. They
described that the relationship between productivity and export tendency is likely explained
by the observation that improvements in productivity translate into improvements in offering
to the market. The improvements in productivity prepare the companies to compete in
international markets (World Bank, 2012).
Cost to export
The direct cost of starting export in Russia was $16 200 per month per foreign destination, if
the company decided to export their goods. Furthermore it takes at least months for a Russian
small or medium enterprise to become profitable of doing business abroad. Next to the
starting cost, Russian firms have to face with another high cost.
According to the World Bank, the cost to export (US$ per container) measures the fees levied
on a 6.1 meter-long container in U.S. dollars. These include costs for documents,
administrative fees for customs clearance and technical control, customs broker fees, terminal
handling charges and inland transport. The cost measure does not include tariffs or trade
taxes. Only official costs are recorded.
Figure 2 shows that Russian companies have significant disadvantage in this form of export
costs. To export one container was $2615 for a Russian firm in 2013, while the world average
was $1515. Russia has a serious disadvantage compare to the United States ($1090) and
Germany ($905), and among the BRIC countries Russia has the worst result, slightly ahead of
Brazil, but India perform close to the United States, and China with its $620 has a strong
position.
Diversification
Oil, fuels, gas and mining products dominate with the 71.3% share of the total export of
Russia, and behind the majority of oil and exports stand a few robust state-owned enterprises.
Although industries such as machinery, electronics, transportation equipment and chemicals
reached a combined growth rate in export value of 10 percent in the last decade, the mineral
resources continue to dominate, as Figure 3 shows. (World Bank, 2012).
Although the study from Kapelko and Volchkova mentioned that 48% of the 14 184 unique
Russian firms exported only in one year over the period 2003-2010, and another 20% of firms
exported in any two years over this period. The reason that the Russian exporters face
difficulties are not only the visa requirements, they can not maintain a permanent foreign
presence. In the period 1999-2009, 57 percent of export attempts to establish a foothold in a
market outside of Russia survived for more than two years, while in China the export survival
rate is over 70%, and Brazil and India also perform better than Russia. The low export
survival rate indicates a possible lack of international competitiveness in the non-oil and gas
sectors. In turn, International experience shows that the entry of new exporters has been a
driving force behind several export booms, and basically the oil and gas sectors spill-over
effect is weak (World Bank, 2012).
According to the World Bank study, Russia under-trade with China, India and several G8
countries, and the under-trading effect increase when the oil and gas sectors are excluded
from the model, and this phenomenon shows that Russia needs diversification in its export to
become more successful in the export. The first step could be to help to develop a healthy
domestic competition, because a better business environment allows firms to quickly adapt to
the market changes, improve the productivity and the competitiveness. Experience shows that
there are no magic recipe to promote export diversification, but without political support it is
unthinkable in Russia, and it needs changes in the incentive regime, in the state-owned
enterprise strategy.
Conclusion
The negative effect of visa restrictions to bilateral trade unquestionable, in general case and in
the case of Russian Federation. Primarily, its greatest negative effect is on relation specific,
instead of non-relationship specific goods. As a significant part of the Russian export is oil
and gas, which are in my view non-relationship specific goods, the visa restrictions has not so
great impact to the export of Russia. This statement strengthens that the Russian export is
dominated by the state owned enterprises (oil and gas sector), and in the case of export the
mineral resources the politics also plays a great role. During the analysis of the Russian export
to different countries there are examples for both cases of the effect of the visa regimes.
In addition, in some relation specific case the Russian government also strongly pressure on
other governments, in the last case the state-owned Rosatom won the a $ 3-4 billion dollar-
business in Hungary without tendering, to construct two new power units for Paks Nuclear
Power Plant. However, such pressure helps only for the state-owned and big private
companies.
If disregard the value of the export, the private owned Russian companies really faces with
high market access costs due to higher travel and visa costs, and due their low
competitiveness, the rate of return takes long time, problematic and questionable. Next to the
competitiveness, the productivity and the cost of export has also a negative influence on trade.
In addition, the visa regimes also have negative effect to support the diversification of the
Russian export, because the most of the small and medium enterprises are afflicted the most
by the visa costs.
To boost the number of the Russian exporter firms, which are able to export in the long run, it
is not enough to reduce the visa restrictions. It is necessary to improve the flexibility of the
Russian market and firms. With stimulating the competition in the domestic market, the
Russian companies could be more competitive abroad, which can improve equally the number
of the Russian export companies and the value of the export. To achieve this goals, the
Russian government may contribute with the transformation of the incentives, and tentatively
change some visa restrictions, which may lead to change the visa regime also by the other
country.
Bibliography
Centre for Economic Policy Research (CEPR): Reducing Transatlantic Barriers to Trade and
Investment - An Economic Assessment; Final Project Report, March 2013.
Coughlin, Cleins C. - Wood, Geoffrey E.: An Introduction to Non-Tariff Barriers to Trade,
Federal Reserve Bank of St. Louis Jurnal Review, Pages 32-46 January 1989.
http://research.stlouisfed.org/publications/review/89/01/Trade_Jan_Feb1989.pdf
Google Public Data:
http://www.google.com/publicdata/directory#!dp=Vil%25C3%25A1gbank
Inter-American Development Bank: Understanding a Computable General Equilibrium
Model, http://www.iadb.org/en/topics/trade/understanding-a-computable-general-equilibrium-
model,1283.html
Kapelkova, Natalia - Volchkova, Natalya: Export Costs of Visa Restrictions, Centre for
Economic and Financial Research at New Economic School, Working Paper No. 195, 2013.
Korhonen, Vesa - Simola, Heli - Solanko, Laura: Perspectives on Russia’s energy sector,
Bank of Finland, Institute for Economies in Transition, BOFIT Online, 2013 No. 3.
Love, Patrick - Lattimore, Ralph: “Protectionism? Tariffs and Other Barriers to Trade”, in
International Trade: Free, Fair and Open?, OECD Publishing, 2009.
Neumayer, Eric: On the detrimental impact of visa restrictions on bilateral trade and foreign
direct investment, Applied Geography 31, 901-907, 2011.
Observatory of Economic Complexity (OEC) by Massachusetts Institute of Technology:
http://atlas.media.mit.edu/
OECD Productivity Database: http://www.oecd.org/std/productivity-stats/
President of Russia: http://eng.kremlin.ru/transcripts/6527
Shepherd, Ben: The Gravity Model of International Trade: A User Guide; United Nations
publication, 2013
U.S. Energy Information Administration (EIA): Russia - Full Report, 2013.
http://www.eia.gov/countries/analysisbriefs/Russia/russia.pdf
World Bank: Russian Federation - Export Diversification through Competition and
Innovation: Overview, April 2012
World Bank Open Data: http://data.worldbank.org/
World Economic Forum: The Global Competitiveness Report 2013–2014
World Trade Organization, http://www.wto.org
Appendix
Map 1:
Source: Neumayer, Eric: On the detrimental impact of visa restrictions on bilateral trade and foreign direct
investment, Applied Geography 31, 901-907, 2011.
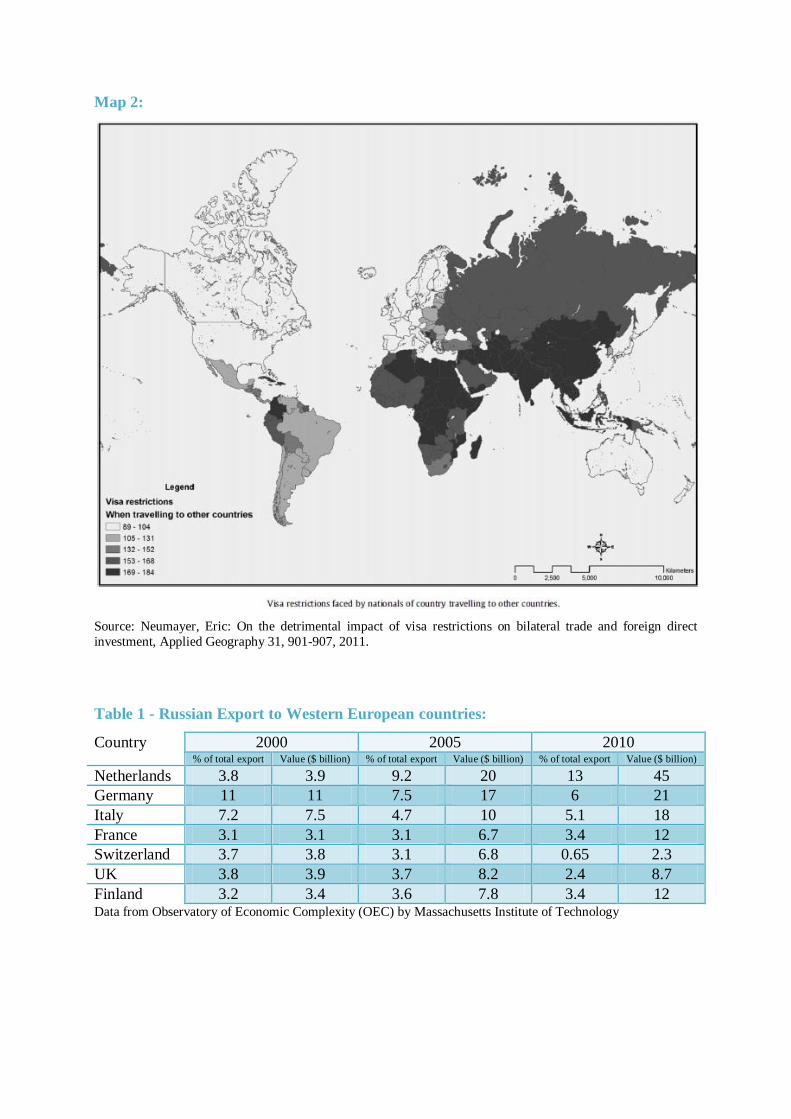
Map 2:
Source: Neumayer, Eric: On the detrimental impact of visa restrictions on bilateral trade and foreign direct
investment, Applied Geography 31, 901-907, 2011.
Table 1 - Russian Export to Western European countries:
Country 2000 2005 2010 % of total export Value ($ billion) % of total export Value ($ billion) % of total export Value ($ billion)
Netherlands 3.8 3.9 9.2 20 13 45
Germany 11 11 7.5 17 6 21
Italy 7.2 7.5 4.7 10 5.1 18
France 3.1 3.1 3.1 6.7 3.4 12
Switzerland 3.7 3.8 3.1 6.8 0.65 2.3
UK 3.8 3.9 3.7 8.2 2.4 8.7
Finland 3.2 3.4 3.6 7.8 3.4 12 Data from Observatory of Economic Complexity (OEC) by Massachusetts Institute of Technology
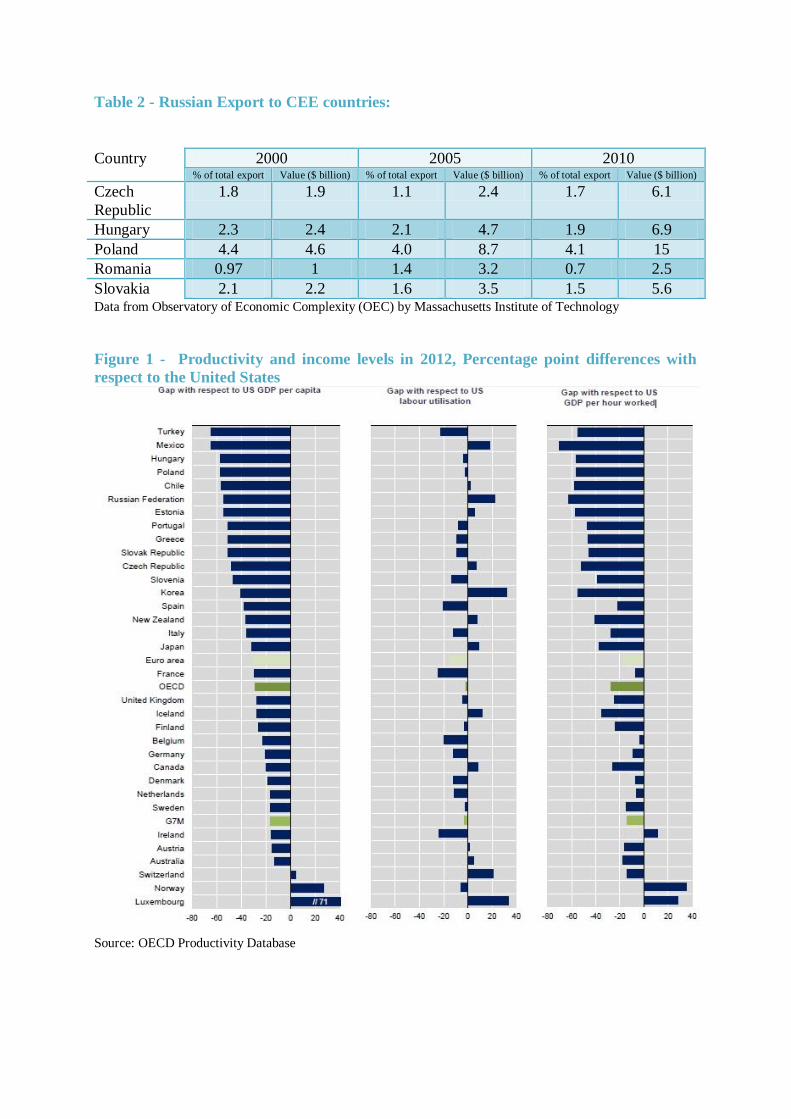
Table 2 - Russian Export to CEE countries:
Country 2000 2005 2010 % of total export Value ($ billion) % of total export Value ($ billion) % of total export Value ($ billion)
Czech
Republic
1.8 1.9 1.1 2.4 1.7 6.1
Hungary 2.3 2.4 2.1 4.7 1.9 6.9
Poland 4.4 4.6 4.0 8.7 4.1 15
Romania 0.97 1 1.4 3.2 0.7 2.5
Slovakia 2.1 2.2 1.6 3.5 1.5 5.6 Data from Observatory of Economic Complexity (OEC) by Massachusetts Institute of Technology
Figure 1 - Productivity and income levels in 2012, Percentage point differences with
respect to the United States
Source: OECD Productivity Database
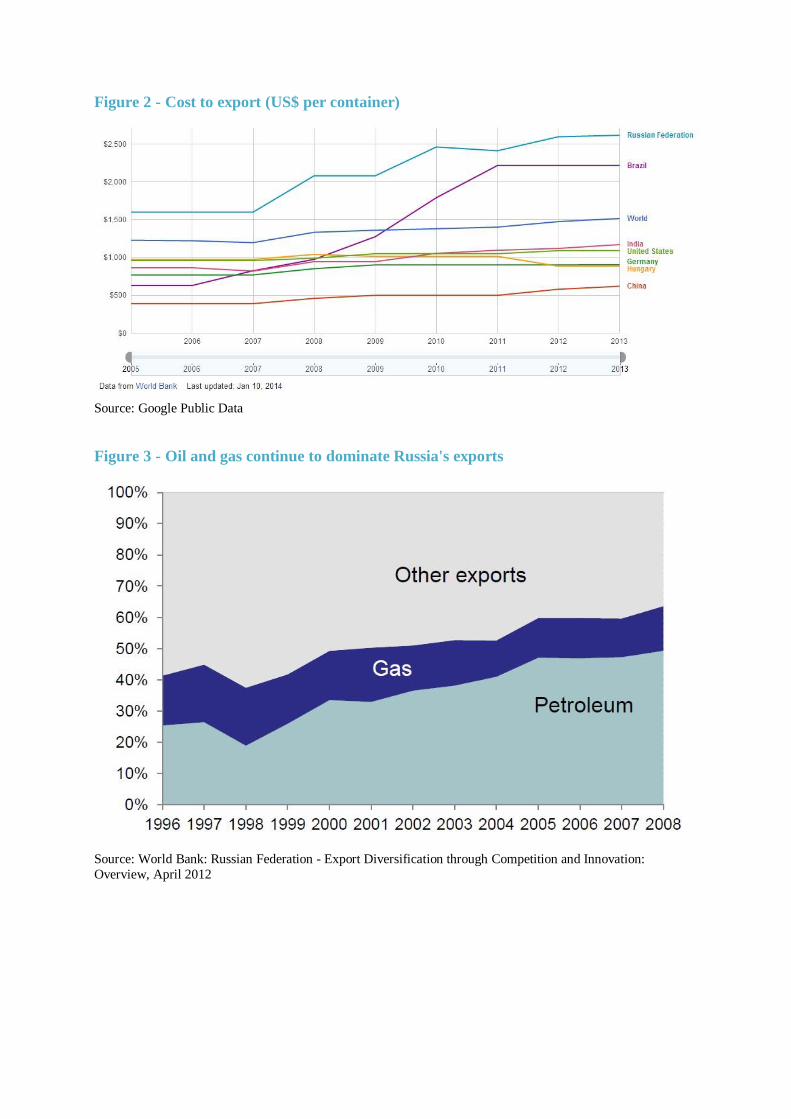
Figure 2 - Cost to export (US$ per container)
Source: Google Public Data
Figure 3 - Oil and gas continue to dominate Russia's exports
Source: World Bank: Russian Federation - Export Diversification through Competition and Innovation:
Overview, April 2012