Exploring the economic case for early investment in climate change mitigation in middle-income...
15
This article was downloaded by: [Universiti Teknologi Malaysia] On: 15 June 2015, At: 21:32 Publisher: Taylor & Francis Informa Ltd Registered in England and Wales Registered Number: 1072954 Registered office: Mortimer House, 37-41 Mortimer Street, London W1T 3JH, UK Click for updates Climate and Development Publication details, including instructions for authors and subscription information: http://www.tandfonline.com/loi/tcld20 Exploring the economic case for early investment in climate change mitigation in middle-income countries: a case study of Johor Bahru, Malaysia Sarah Colenbrander a , Andy Gouldson a , Andrew Heshedahl Sudmant a , Effie Papargyropoulou b , Loon Wai Chau c & Chin Siong Ho c a School of Earth and Environment, University of Leeds, Leeds LS2 9JT, UK b Malaysia-Japan International Institute of Technology, Universiti Teknologi Malaysia, 54100 Kuala Lumpur, Malaysia c Department of Urban and Regional Planning, Universiti Teknologi Malaysia, 81310 Johor Bahru, Malaysia Published online: 02 Jun 2015. To cite this article: Sarah Colenbrander, Andy Gouldson, Andrew Heshedahl Sudmant, Effie Papargyropoulou, Loon Wai Chau & Chin Siong Ho (2015): Exploring the economic case for early investment in climate change mitigation in middle-income countries: a case study of Johor Bahru, Malaysia, Climate and Development, DOI: 10.1080/17565529.2015.1040367 To link to this article: http://dx.doi.org/10.1080/17565529.2015.1040367 PLEASE SCROLL DOWN FOR ARTICLE Taylor & Francis makes every effort to ensure the accuracy of all the information (the “Content”) contained in the publications on our platform. Taylor & Francis, our agents, and our licensors make no representations or warranties whatsoever as to the accuracy, completeness, or suitability for any purpose of the Content. Versions of published Taylor & Francis and Routledge Open articles and Taylor & Francis and Routledge Open Select articles posted to institutional or subject repositories or any other third-party website are without warranty from Taylor & Francis of any kind, either expressed or implied, including, but not limited to, warranties of merchantability, fitness for a particular purpose, or non-infringement. Any opinions and views expressed in this article are the opinions and views of the authors, and are not the views of or endorsed by Taylor & Francis. The accuracy of the Content should not be relied upon and should be independently verified with primary sources of information. Taylor & Francis shall not be liable for any losses, actions, claims, proceedings, demands, costs, expenses, damages, and other liabilities whatsoever or howsoever caused arising directly or indirectly in connection with, in relation to or arising out of the use of the Content. This article may be used for research, teaching, and private study purposes. Terms & Conditions of access and use can be found at http://www.tandfonline.com/page/terms-and-conditions It is essential that you check the license status of any given Open and Open Select article to confirm conditions of access and use.
Transcript of Exploring the economic case for early investment in climate change mitigation in middle-income...

This article was downloaded by: [Universiti Teknologi Malaysia]On: 15 June 2015, At: 21:32Publisher: Taylor & FrancisInforma Ltd Registered in England and Wales Registered Number: 1072954 Registered office: Mortimer House,37-41 Mortimer Street, London W1T 3JH, UK
Click for updates
Climate and DevelopmentPublication details, including instructions for authors and subscription information:http://www.tandfonline.com/loi/tcld20
Exploring the economic case for early investment inclimate change mitigation in middle-income countries:a case study of Johor Bahru, MalaysiaSarah Colenbrandera, Andy Gouldsona, Andrew Heshedahl Sudmanta, EffiePapargyropouloub, Loon Wai Chauc & Chin Siong Hoc
a School of Earth and Environment, University of Leeds, Leeds LS2 9JT, UKb Malaysia-Japan International Institute of Technology, Universiti Teknologi Malaysia, 54100Kuala Lumpur, Malaysiac Department of Urban and Regional Planning, Universiti Teknologi Malaysia, 81310 JohorBahru, MalaysiaPublished online: 02 Jun 2015.
To cite this article: Sarah Colenbrander, Andy Gouldson, Andrew Heshedahl Sudmant, Effie Papargyropoulou, Loon Wai Chau& Chin Siong Ho (2015): Exploring the economic case for early investment in climate change mitigation in middle-incomecountries: a case study of Johor Bahru, Malaysia, Climate and Development, DOI: 10.1080/17565529.2015.1040367
To link to this article: http://dx.doi.org/10.1080/17565529.2015.1040367
PLEASE SCROLL DOWN FOR ARTICLE
Taylor & Francis makes every effort to ensure the accuracy of all the information (the “Content”) contained inthe publications on our platform. Taylor & Francis, our agents, and our licensors make no representations orwarranties whatsoever as to the accuracy, completeness, or suitability for any purpose of the Content. Versionsof published Taylor & Francis and Routledge Open articles and Taylor & Francis and Routledge Open Selectarticles posted to institutional or subject repositories or any other third-party website are without warrantyfrom Taylor & Francis of any kind, either expressed or implied, including, but not limited to, warranties ofmerchantability, fitness for a particular purpose, or non-infringement. Any opinions and views expressed in thisarticle are the opinions and views of the authors, and are not the views of or endorsed by Taylor & Francis. Theaccuracy of the Content should not be relied upon and should be independently verified with primary sourcesof information. Taylor & Francis shall not be liable for any losses, actions, claims, proceedings, demands,costs, expenses, damages, and other liabilities whatsoever or howsoever caused arising directly or indirectly inconnection with, in relation to or arising out of the use of the Content. This article may be used for research, teaching, and private study purposes. Terms & Conditions of access anduse can be found at http://www.tandfonline.com/page/terms-and-conditions It is essential that you check the license status of any given Open and Open Select article to confirmconditions of access and use.

RESEARCH ARTICLE
Exploring the economic case for early investment in climate change mitigation in middle-incomecountries: a case study of Johor Bahru, Malaysia
Sarah Colenbrandera*, Andy Gouldsona, Andrew Heshedahl Sudmanta, Effie Papargyropouloub, Loon Wai Chauc and ChinSiong Hoc
aSchool of Earth and Environment, University of Leeds, Leeds LS2 9JT, UK; bMalaysia-Japan International Institute of Technology,Universiti Teknologi Malaysia, 54100 Kuala Lumpur, Malaysia; cDepartment of Urban and Regional Planning, Universiti TeknologiMalaysia, 81310 Johor Bahru, Malaysia
(Received 30 August 2014; accepted 22 January 2015)
The assumption that climate mitigation can only be afforded at a particular level of income is implicit in global climatenegotiations. This suggests that middle-income countries may reach a tipping point in their development process wherelow-carbon investment becomes more viable. In order to avoid dangerous levels of climate change, this tipping pointneeds to be brought forward in time: upper-middle-income countries are already responsible for 37.8% of global CO2
emissions. We explore the scope for large-scale investment in climate mitigation in Johor Bahru, a fast-growing industrialcity in Malaysia. We find that the city could reduce per capita emissions by 10.0% by 2025, relative to 2014 levels,through cost-effective investments. If the returns could be recovered and reinvested in low-carbon measures, Johor Bahrucould reduce per capita emissions by 35.2% by 2025, relative to 2014 levels. This result suggests that the tipping pointmay be a function of political will and institutional capacity as well as income. This has substantial implications forglobal climate policy discussions, particularly the opportunities and responsibilities of middle-income countries. Ifcomparable savings can be delivered across cities in middle-income countries, this would equate to a reduction in globalemissions of 6.3% with the exploitation of cost-effective options and 11.3% with the exploitation of cost-neutral options.Investing in economically attractive low-carbon measures could also provide cities in middle-income countries with anopportunity to build the political momentum and institutional capacities necessary for deeper decarbonization.
Keywords: energy; climate policy; cities; carbon Kuznets curve; low-carbon investment
1. Introduction
1.1. Trade-offs between economic growth andclimate change mitigation
The assumption that there are trade-offs between economicdevelopment and climate change mitigation is implicit ininternational climate change negotiations. Greenhouse gasemission reductions are perceived to be costly, so the allo-cation of future emissions and responsibility for emissionreductions are fiercely disputed (Beltran, den Elzen, Hof,van Vuuren, & van Vliet, 2011; Lipford & Yandle, 2010).Consequently, only countries with a high-income percapita are expected to reduce their emissions, while devel-oping countries with a low average income per capita areexpected to prioritize human development over environ-mental action. This is explicit in the Kyoto Protocol inthe form of legally binding emission reduction obligationsfor developed countries and the promise of financialresources to meet additional costs incurred for developingcountries (UNFCCC, 1992).
The idea that investment in climate change mitigationcan only be afforded at a particular level of incomeimplies that middle-income countries may reach a tippingpoint in their development process where such investmentbecomes more viable. In order to avoid exceeding a globaltemperature rise of more than 2°C, it is important that thistipping point is (a) better understood and (b) broughtforward in time. Upper-middle-income countries such asBrazil, China, Malaysia, Mexico and Turkey are alreadyresponsible for 37.8% of global CO2 emissions (WorldBank, 2014a), and emerging economies will be responsiblefor more than 90% of the projected growth in energydemand over the next two decades (IEA, 2013). With thisanticipated expansion of energy use and without a tran-sition to low-carbon energy sources, the world is on a tra-jectory consistent with an average temperature increase of3.6°C by 2100 (IEA, 2013). Although they currentlyhave no binding targets under the Kyoto Protocol,middle-income countries must therefore identify and
© 2015 The Author(s). Published by Taylor & Francis.
*Corresponding author. Email: [email protected]
This is an Open Access article distributed under the terms of the Creative Commons Attribution License (http://creativecommons.org/Licenses/by/4.0/), which permits unrestricteduse, distribution, and reproduction in any medium, provided the original work is properly cited.
Climate and Development, 2015http://dx.doi.org/10.1080/17565529.2015.1040367
Dow
nloa
ded
by [
Uni
vers
iti T
ekno
logi
Mal
aysi
a] a
t 21:
32 1
5 Ju
ne 2
015

transition to lower carbon development paths to avoiddangerous levels of climate change.
Decision-makers can avoid perceived trade-offs withhuman development goals if climate policies do not incureconomic costs – and can actively support the realizationof development goals if climate policies generate economicbenefits. We therefore need to identify low-carbon optionsthat are at least cost-neutral and at best cost-effective.Exploitation of these options would allow developingcountries to reduce carbon emissions at a lower level andat an earlier stage of development than we have historicallyobserved for developed countries, as represented inFigure 1.
1.2. Tunnelling through the carbon Kuznets curve
The theory that pollution reduction can only be afforded athigher levels of income has been represented by theenvironmental Kuznets curve (EKC). The EKC was firstproposed by Grossman and Krueger (1991) and was thenpopularized in the World Development Report (Shafik &Bandyopadhyay, 1992; World Bank, 1992). The EKC pro-poses an inverted U-shaped relationship between environ-mental degradation and income per capita. In otherwords, the early stages of economic growth entail increas-ing pollution and declining environmental quality until, atsome level of income per capita, the trend reverses andeconomic growth leads to improving environmentalquality. These environmental improvements are not inevita-ble. Shafik and Bandyopadhyay (1992) highlight thatenvironmental gains require costly policies and invest-ments that are typically only undertaken where there aregeneralized local costs and substantial private or socialbenefits.
The EKC hypothesis is unlikely to apply to greenhousegas emissions in light of their long-term effects, minimal
immediate impact on quality of life and relatively highabatement cost (Arrow et al., 1995; Dinda, 2004). Smithand Ezzati (2005) particularly questioned the implicationthat ‘countries could grow their way out of environmentalproblems’ (p. 324). The empirical evidence to date is notcompelling: efficiency improvements or decarbonizationof energy rarely outstrip increasing energy use and econ-omic activity (e.g. Azomahou, Laisney, & Nguyen Van,2006; Lamb et al., 2014; Mundaca, Markandya, &Nørgaard, 2013a), while others find the distinct inverseU-shaped curve only in the presence of specific climatepolicies or energy scenarios (e.g. Liddle & Messinis,2014; López-Menéndez, Pérez, & Moreno, 2014). Theseresults are supported by broader work on the EKCwhich has found that decoupling of economic growthand pollutants depends on effective environmental regu-lation, technological diffusion and avenues for public par-ticipation in policy-making, which may or may notcorrelate with higher incomes (Carson, 2010; Gani,2012; Steer, 2013).
While the empirical evidence for an EKC may belacking, the theory of an inverted U-shaped carbonKuznets curve (CKC) has relevance with respect to theconcept of a tipping point. Previous theoretical work hasproposed that newly industrialized countries can avoidpeak emissions by ‘tunnelling through’ the EKC (Muna-singhe, 1999) through establishing environmental regu-lation at an earlier stage of development and leapfroggingto cleaner technologies. To date, there is little evidenceeither of the economic potential to ‘green’ economicgrowth or of decoupling between GDP and carbon-inten-sive energy use (Scrieciu, Rezai, & Mechler, 2013). Weaim to respond to this gap in the literature by establishingwhether a city in an upper-middle-income country canachieve a tipping point in its carbon emissions – effectivelytunnel through the CKC – at no net cost.
This research seeks to test the assumption that reducinggreenhouse gases entails economic costs that can only beafforded with further development and increased income.Evidence of a strong economic case for low-carbonmeasures would suggest that there are not always trade-offs between development and mitigation. This may helpto foster a new discourse focusing on the economic benefitsof climate action, which will hopefully help mobilizedecision-makers in emerging economies to make the pol-icies and investments necessary to reduce carbonemissions.
1.3. Achieving low-carbon urban development
Cities are currently responsible for 67–76% of energy useand 71–76% of energy-related CO2 emissions (IPCC,2014). Their share of global energy demand and carbonemissions is likely to increase due to, among otherfactors, rapid urbanization in developing countries: cities
Figure 1. A comparison of the high-carbon development pathhistorically pursued by developed countries and the low-carbondevelopment path that emerging economies need to pursue inorder to mitigate climate change.
2 S. Colenbrander et al.
Dow
nloa
ded
by [
Uni
vers
iti T
ekno
logi
Mal
aysi
a] a
t 21:
32 1
5 Ju
ne 2
015
in the developing world are projected to increase by 2.7billion people by 2050 (IPCC, 2014; UNDESA, 2013;WHO, 2014). While cities’ share of global emissions ishigh and rising fast, their socio-economic dynamism andconcentration of infrastructure also mean that cities areuniquely positioned to tackle climate change.
Municipal authorities can reduce the carbon intensityof cities through land-use regulation, the issue of planningpermits and enforcement of energy regulation, which inturn will influence urban spatial structure, transportationsystems and energy technologies (Phdungsilp, 2009;Zusman, Srinivasa, & Dhakal, 2012). This is particularlytrue in fast-growing emerging economies such as Malay-sia, where massive investment is necessary to redress his-torical infrastructure deficits and address rapid populationand economic growth. While established cities in thedeveloped world are struggling to break out of high-carbon economic models, developing world cities likeJohor Bahru can avoid ‘lock-in’ by integrating climateconsiderations at an early stage of urban development.Their institutional capacities and responsibilities meanthat cities have the ability to act on climate change; theirrelatively large and fast-growing carbon footprints meanthat their actions have significant potential to reduceemissions.
This paper evaluates the existence and extent of theeconomic case for low-carbon investment in the city ofJohor Bahru, Malaysia, to determine whether the citycould reduce emissions per capita without affectinggrowth of GDP per capita – in other words, whetherJohor Bahru could tunnel through the CKC in a cost-effec-tive or cost-neutral way. Malaysia is pursuing an exception-ally carbon-intensive development path, with most of itsprojected growth in population, economic activity andgreenhouse gas emissions projected to come fromsecond-tier cities such as Johor Bahru. Evidence of aneconomic case for climate action should prompt decision-makers at local and national levels to re-evaluate therelationship between economic growth and climatechange mitigation, thereby – hopefully – helping to buildthe political will for climate action at an earlier stage ofdevelopment.
The remainder of this paper is structured as follows.Section 2 presents the case study and the methodsemployed for data collection and analysis. Section 3 pro-vides the empirical results. Section 4 discusses the impli-cations for climate change negotiations and offers somepolicy recommendations to help realize these opportunities.The conclusions are presented in Section 5. This workbuilds on the Low Carbon Society Blueprint for IskandarMalaysia 2025 (Ho et al., 2013; UTM, IRDA, Kyoto Uni-versity, Okayama University, & National Institute forEnvironmental Studies, 2013) and the Climate SmartCities programme (Gouldson, Colenbrander, Sudmant, &Papargyropoulou, 2014).
2. Methods
This paper explores the scope for large-scale investment inclimate mitigation at the city scale, using the case study ofJohor Bahru, Malaysia. It presents a bottom-up assessmentof the investment needs, returns and carbon savings of awide range of low-carbon measures. The impacts of thesemeasures are compared against ‘business as usual’ modesof development for the city’s energy use, energy bills andcarbon emissions in the next 10 years. The findings aredrawn together to determine the economic case for low-carbon investment in the city, and the impact on emissionson a per capita and city-scale basis.
The quantitative research presented here focuses on thedirect economic costs and benefits of different low-carbonmeasures in a city, and does not formally consider the socialand environmental impacts of each option. This is notmeant to downplay the importance of assessing thesocial case for low-carbon investment. However, the aimhere is to test whether carbon emissions can bereduced in a cost-effective or cost-neutral way in order totest the assumption that climate policies entail economiccosts.
2.1. Case study: Johor Bahru, Malaysia
Energy consumption per capita is relatively high in Malay-sia at 2.63 toe per capita, compared to other upper-middle-income countries such as Brazil at 1.37, Turkey at 1.54 orChina at 1.7 (World Bank, 2014b). High energy consump-tion combined with relatively carbon-intensive energymeans that Malaysian emissions per capita are 64%higher than the world average (UNDESA, 2014). Nonethe-less, per capita energy consumption in Malaysia is only61% of the average for Organisation for EconomicCooperation and Development (OECD) countries (WorldBank, 2014b), and Malaysians produce only 76% of theOECD’s average per capita emissions (UNDESA, 2014).There is therefore significant potential for the country totransition to a lower carbon development path thanOECD nations.
In a Malaysian context, meaningful emissionreductions will depend on action in urban areas. 73%(21.1 million) of the 29.2 million people of Malaysia livein cities (World Bank, 2014c) and over 90% of nationaleconomic activity is conducted in cities (Muller, 2013).Energy consumption and greenhouse gas emissions aretherefore likely to be concentrated in cities for the foresee-able future. Although Kuala Lumpur dominates the Malay-sian economic landscape – Klang Valley is home to 7.2million people and produces 38% of national GDP(SPAD, 2013) – 48% of the Malaysian population live insecond-tier cities, which generate 52% of national GDP.These cities therefore have a critical role to play if thecountry is to avoid locking into a high-carbon developmentpath.
Climate and Development 3
Dow
nloa
ded
by [
Uni
vers
iti T
ekno
logi
Mal
aysi
a] a
t 21:
32 1
5 Ju
ne 2
015

This study focuses on the city of Johor Bahru as anexample of fast-growing, medium-sized Malaysian city. Itwas chosen as a case study in response to interest in the pro-posed method and outputs from the Iskandar RegionalDevelopment Authority, the government body responsiblefor development planning and policies in the special econ-omic corridor, Iskandar Malaysia. Johor Bahru is located atthe southern tip of Peninsular Malaysia on the Straits ofSingapore and has an accordingly hot, humid climatewith a mean daily maximum temperature between 30°Cand 33°C all year round and an average of 116 rainydays per year (WMO, 2014). Johor Bahru is the thirdlargest city in Malaysia and serves as an important indus-trial, logistics and commercial centre. The major industriesin the city are plastics manufacturing, electrical and elec-tronic equipment, petrochemical refining and food proces-sing. The main services are wholesale and retail trade,tourism and hospitality, professional and business, trans-port, medical, educational and financial services (IRDA,2007). The population in the three key administrativeareas (Johor Bahru City Council, Johor Bahru TengahMunicipal Council and Pasir Gudang Municipal Council)is an estimated 1.8 million in 2014 and is expected toreach nearly 2.8 million by 2025 (AECOM, 2009). Thisexpansion is intended to exploit Johor Bahru’s strategiclocation near Singapore, the South China Sea and theStraits of Malacca. Johor Bahru’s current GDP per capita(Purchasing Power Parity) is USD 14,790 (IRDA, 2013).
If Johor Bahru achieves its target annual growth rate of7–8% (IRDA, 2013), more than half of the urban economythat will exist in 2025 has not been built yet. While impos-ing substantial challenges, the scale of planned infrastruc-ture investment offers an opportunity to shift the city onto a lower carbon development path – if the variouslevels of government are willing to make the necessaryclimate policies and investments.
2.2. Baseline analysis
We developed city-scale emission inventories for JohorBahru for the years 2000–2013 using the methodology out-lined in the Greenhouse Gas Protocol for Communities(GPC) v0.9 (C40 Cities Climate Leadership Group andICLEI Local Governments for Sustainability, 2012). Thestudy therefore considers Scope 1 and 2 emissions,although industrial process emissions had to be excludedbecause data were not available.
Data on population and GDP per capita for 2005 and2025 were obtained from the Low Carbon Society Blue-print for Iskandar Malaysia 2025 (UTM et al., 2013) andthe Iskandar Regional Development Authority (IRDA,2013). Data on residential and industrial energy use inIskandar Malaysia between 2005 and 2025 were obtainedfrom the Low Carbon Society Blueprint (UTM et al.,2013). This was scaled to Johor Bahru using population
data from AECOM (2009) and economic data fromIRDA (2007) and Khazanah Nasional (2006). Where datawere available for 2005 and 2025, a linear relationshipwas assumed. Data on commercial floor space for 2003–2013 were obtained from the National Property Infor-mation Centre Property Stock Reports (NAPIC, 2014).These figures were multiplied by the average buildingenergy intensity (Saidur, 2009; UNDP & MalaysianPublic Works Department, 2009). Data on the number ofvehicles in Johor Bahru between 2005 and 2012 wereobtained from the Road Transport Department Malaysia(2014), and data on the fuel efficiency of vehicles fromChen et al. (2003), Silitonga, Atabani, and Mahlia (2012)and Mahlia, Tohno, and Tezuka (2012). The ratio ofpetrol to diesel cars was assumed to be 3:1. Calculationsof waste generation and emissions from the waste collec-tion fleet were based on data from the Integrated SolidWaste Management Blueprint for Iskandar Malaysia(AECOM, 2009) and WRAP (2010). Waste composition,average waste collection rates and recycling rates werebased on data provided by the Department of Solid WasteManagement (2014).
In order to calculate energy expenditure, nominalenergy prices for 2000–2012 were obtained from theEnergy Commission (2006–2011) and Ministry ofEnergy, Green Technology and Water (KeTTHA, 2012).All energy prices were based on those paid by the consu-mer, and consequently, excluded the additional costsincurred by the government in the form of subsidies.Nominal prices were converted into real prices at 2013levels using the Consumer Price Index from MalaysianDepartment of Statistics (2014). An exchange rate ofRM1.0 = USD 0.302576 was used, as the average midpointof bid and ask prices for 2013 (OANDA, 2014).
‘Business as usual’ baselines for each sector, and for thecity as a whole, were developed for the period between2015 and 2025. Levels and composition of energy use inthe commercial, domestic, industrial, transport and wastesectors were forecast to 2025 based on a continuation ofhistorical trends between 2000 and 2014. This method cap-tures business as usual trends in, for example, populationgrowth, economic growth, improvements in energy effi-ciency and changing consumer behaviour. Projectionsassume that business as usual trends can continue to 2025and therefore do not account for, for example, the likelyimpacts of increasing congestion on growing vehicleownership.
Trends in greenhouse gas emissions and energy expen-diture between 2015 and 2025 are calculated based on theprojected changes in the levels and composition of energyuse. A 3% annual increase in real energy prices is assumedbetween 2014 and 2025, which is conservative comparedwith historical increases between 2000 and 2013. Projectedchanges in the carbon intensity of electricity are based onplanned investments in new generation capacity for the
4 S. Colenbrander et al.
Dow
nloa
ded
by [
Uni
vers
iti T
ekno
logi
Mal
aysi
a] a
t 21:
32 1
5 Ju
ne 2
015

Peninsular Malaysia grid (Energy Commission, 2006,2007, 2008, 2009, 2010, 2011). The resulting baselinespredict energy consumption, energy bills and carbon foot-prints through to 2025 under business as usual conditions.
All future activities are compared against these base-lines. In practice, Johor Bahru might not be able tosustain its current development trajectory due to, forexample, congestion in the transport system. However,the purpose of these baselines is to provide business asusual scenarios against which to measure the potentialimpacts of the low-carbon measures.
2.3. Identification and assessment of measures
Long lists of the energy efficiency, renewable energy andlow-carbon measures that could potentially be deployedin each sector of the city are revised through stakeholderconsultations to add locally specific measures and removeoptions that are not applicable in the Malaysian context.The resulting short list is not necessarily exhaustive –some measures may have been overlooked, while othersmay not have been included in the analysis due to theabsence of data on their performance. Given the focus ofthe study on economic valuation of low-carbon measures,this analysis does not consider the impact of significantchanges in land-use planning or the spatial distribution ofactivities within the city. Such modifications to urbanform and function are outside the scope of this study.
Again drawing on extensive literature reviews and sta-keholder consultations, the performance of each measureon the shortlist is assessed. This involved a cost–benefitanalysis of each measure based on the direct, private econ-omic costs and returns from deploying that measure. Thecosts incorporated the capital, running and maintenancecosts of each measure, focusing on the marginal or extracosts of adopting a more energy-efficient or lower carbonalternative. The benefits incorporated the economicsavings from reduced energy expenditure over the lifetimeof the measure, taking into account installation and per-formance gaps. The data sources and assumptions aredetailed in Appendix A.
As each measure could be in place for many years, themodels incorporate the changing carbon intensities ofenergy use, an average annual rise of 3% in real prices(including energy prices) and a standard real discount orinterest rate of 5%. For reference, the Central Bank ofMalaysia’s interest rate was 3.25% as of July 2014(BNM, 2014).
2.4. Assessment of the scope for deployment
The potential scope for deploying each of the measures inJohor Bahru in the period to 2025 is calculated at a sub-sector level, taking into account, for example, the scopefor change in households with different levels of income.
Realistic rates of deployment are developed based onreadily achievable levels of uptake. These assessmentstake into account the lifespans and replacement rates ofexisting measures that could be replaced with moreenergy-efficient or lower carbon alternatives, and alsorates of change and growth in the relevant sectors of thecity. These are subject to participatory review in the stake-holder workshops to ensure that they are as realistic aspossible. The rate of deployment for each measure isdetailed in Appendix A and the experts participating inthe workshops are detailed in Appendix B.
2.5. Aggregation of findings
The results from the assessment of the performance of eachmeasure, and the scope for deploying each measure, areaggregated to determine the potential impact across thedifferent sectors and for the whole city. This underpins cal-culations of overall investment needs and paybacks, as wellas impacts on energy supply and demand in the differentsectors in the city. The results are then divided by projectedpopulation numbers to determine per capita emissionsunder the different investment scenarios.
Many low-carbon measures interact with each other, sotheir performance depends on whether/to what extentanother option is also adopted (Bajželj, Allwood, &Cullen, 2013). For example, the carbon savings fromadopting green building standards depend on whetherthere are also energy efficiency standards for air condi-tioners. For the purposes of Table 2, the impact of eachmeasure is calculated if it were adopted independentlywith business as usual conditions in energy supply. Whendetermining the potential savings across the sector or city,the effect of each measure on the potential energysavings of other measures is included to develop realisticassessment of their combined impacts.
In many cases, a single measure has been consideredunder varying policy conditions: for example, solar photo-voltaic (PV) panels with and without feed-in tariffs or wasteinfrastructure with high and low gate fees. When compilingthe sector and city-wide summaries, the cost-effectiveoptions that require the least enabling policies have beenincluded unless these policies are already established atscale. Therefore, the total investment needs, energysavings and payback periods reflect those of solar PVpanels without feed-in tariffs and waste infrastructurewith low gate fees.
3. Results
3.1. Business as usual trends in urban development
With the continuation of business as usual trends, totalenergy consumption, energy expenditure and greenhousegas emissions in Johor Bahru will increase significantly
Climate and Development 5
Dow
nloa
ded
by [
Uni
vers
iti T
ekno
logi
Mal
aysi
a] a
t 21:
32 1
5 Ju
ne 2
015
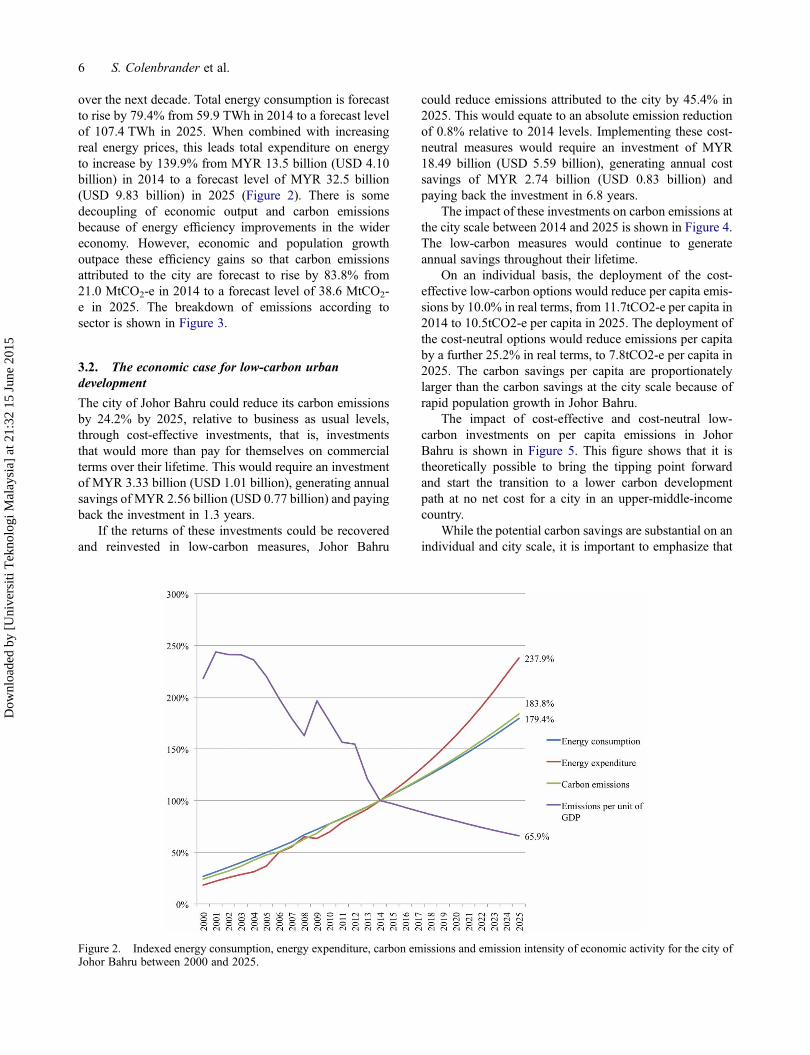
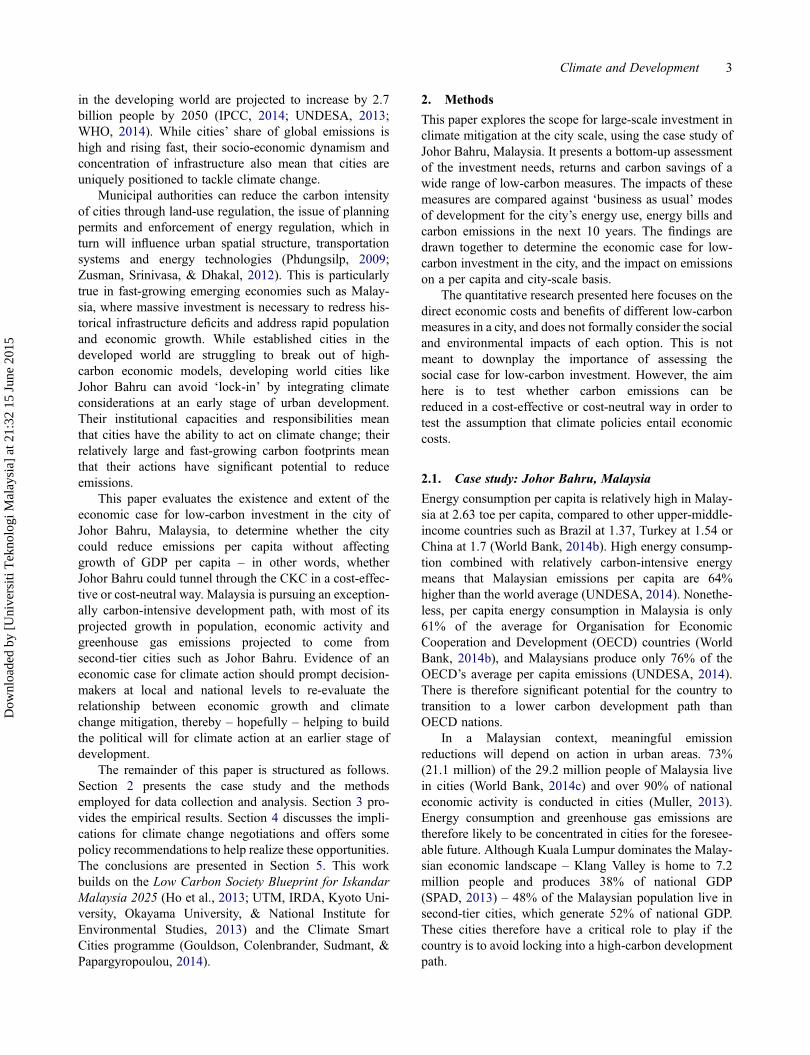
over the next decade. Total energy consumption is forecastto rise by 79.4% from 59.9 TWh in 2014 to a forecast levelof 107.4 TWh in 2025. When combined with increasingreal energy prices, this leads total expenditure on energyto increase by 139.9% from MYR 13.5 billion (USD 4.10billion) in 2014 to a forecast level of MYR 32.5 billion(USD 9.83 billion) in 2025 (Figure 2). There is somedecoupling of economic output and carbon emissionsbecause of energy efficiency improvements in the widereconomy. However, economic and population growthoutpace these efficiency gains so that carbon emissionsattributed to the city are forecast to rise by 83.8% from21.0 MtCO2-e in 2014 to a forecast level of 38.6 MtCO2-e in 2025. The breakdown of emissions according tosector is shown in Figure 3.
3.2. The economic case for low-carbon urbandevelopment
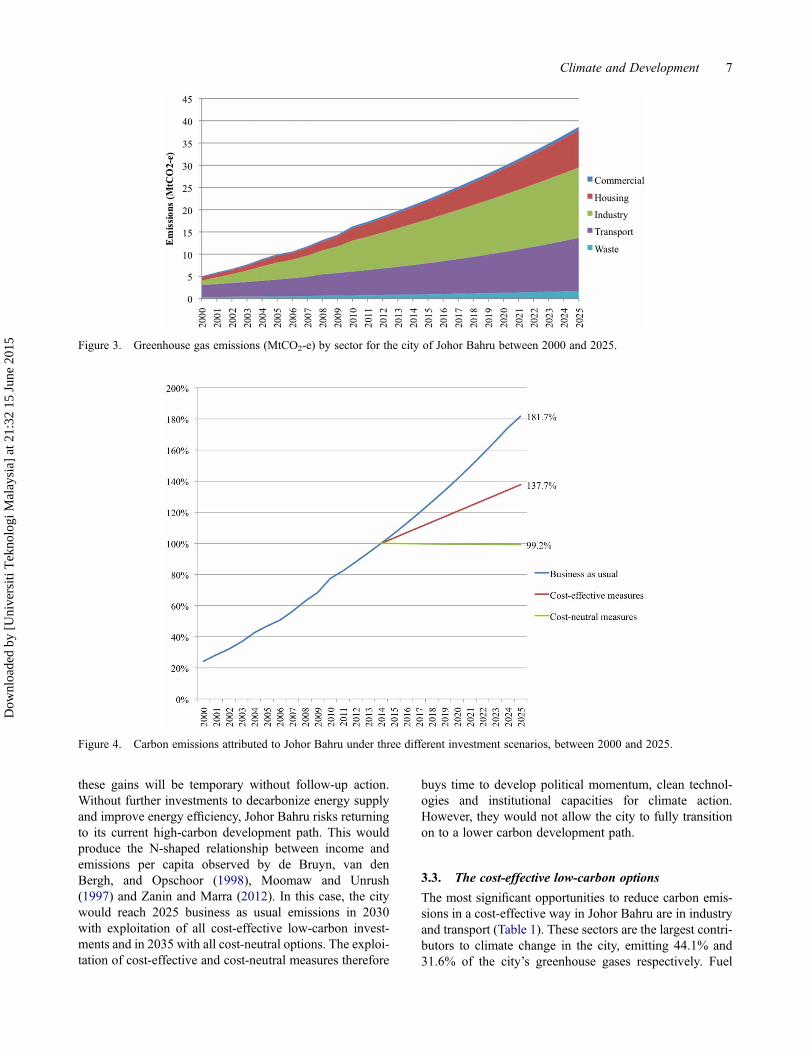
The city of Johor Bahru could reduce its carbon emissionsby 24.2% by 2025, relative to business as usual levels,through cost-effective investments, that is, investmentsthat would more than pay for themselves on commercialterms over their lifetime. This would require an investmentof MYR 3.33 billion (USD 1.01 billion), generating annualsavings of MYR 2.56 billion (USD 0.77 billion) and payingback the investment in 1.3 years.
If the returns of these investments could be recoveredand reinvested in low-carbon measures, Johor Bahru
could reduce emissions attributed to the city by 45.4% in2025. This would equate to an absolute emission reductionof 0.8% relative to 2014 levels. Implementing these cost-neutral measures would require an investment of MYR18.49 billion (USD 5.59 billion), generating annual costsavings of MYR 2.74 billion (USD 0.83 billion) andpaying back the investment in 6.8 years.
The impact of these investments on carbon emissions atthe city scale between 2014 and 2025 is shown in Figure 4.The low-carbon measures would continue to generateannual savings throughout their lifetime.
On an individual basis, the deployment of the cost-effective low-carbon options would reduce per capita emis-sions by 10.0% in real terms, from 11.7tCO2-e per capita in2014 to 10.5tCO2-e per capita in 2025. The deployment ofthe cost-neutral options would reduce emissions per capitaby a further 25.2% in real terms, to 7.8tCO2-e per capita in2025. The carbon savings per capita are proportionatelylarger than the carbon savings at the city scale because ofrapid population growth in Johor Bahru.
The impact of cost-effective and cost-neutral low-carbon investments on per capita emissions in JohorBahru is shown in Figure 5. This figure shows that it istheoretically possible to bring the tipping point forwardand start the transition to a lower carbon developmentpath at no net cost for a city in an upper-middle-incomecountry.
While the potential carbon savings are substantial on anindividual and city scale, it is important to emphasize that
Figure 2. Indexed energy consumption, energy expenditure, carbon emissions and emission intensity of economic activity for the city ofJohor Bahru between 2000 and 2025.
6 S. Colenbrander et al.
Dow
nloa
ded
by [
Uni
vers
iti T
ekno
logi
Mal
aysi
a] a
t 21:
32 1
5 Ju
ne 2
015
these gains will be temporary without follow-up action.Without further investments to decarbonize energy supplyand improve energy efficiency, Johor Bahru risks returningto its current high-carbon development path. This wouldproduce the N-shaped relationship between income andemissions per capita observed by de Bruyn, van denBergh, and Opschoor (1998), Moomaw and Unrush(1997) and Zanin and Marra (2012). In this case, the citywould reach 2025 business as usual emissions in 2030with exploitation of all cost-effective low-carbon invest-ments and in 2035 with all cost-neutral options. The exploi-tation of cost-effective and cost-neutral measures therefore
buys time to develop political momentum, clean technol-ogies and institutional capacities for climate action.However, they would not allow the city to fully transitionon to a lower carbon development path.
3.3. The cost-effective low-carbon options
The most significant opportunities to reduce carbon emis-sions in a cost-effective way in Johor Bahru are in industryand transport (Table 1). These sectors are the largest contri-butors to climate change in the city, emitting 44.1% and31.6% of the city’s greenhouse gases respectively. Fuel
Figure 3. Greenhouse gas emissions (MtCO2-e) by sector for the city of Johor Bahru between 2000 and 2025.
Figure 4. Carbon emissions attributed to Johor Bahru under three different investment scenarios, between 2000 and 2025.
Climate and Development 7
Dow
nloa
ded
by [
Uni
vers
iti T
ekno
logi
Mal
aysi
a] a
t 21:
32 1
5 Ju
ne 2
015

switching proves to be an important low-carbon option inboth sectors, with significant scope to switch from dieselto natural gas in industry and to increase the share of bio-fuels in transport. However, while the emission reductionpotential in the transport sector is dominated by a singlemeasure (hybrid private cars), the carbon savings in theindustry sector would be generated from a wide array ofenergy efficiency measures, particularly in the rubber andpetrochemical industries.
Green building standards in the commercial sectorproved to be the most cost-effective low-carbon measureavailable to the city: this option had to be excluded fromFigure 6 because the high savings per unit of emissions dis-torted the y-axis. However, energy-efficient air conditionersprove to be the most carbon-effective option, followed byvarious lighting efficiency measures. Energy-efficient airconditioners and green building standards in the domestic
sector offered significant carbon savings, as did raisingthermostat temperatures and deployment of solar PVpanels.
The waste sector yields disproportionately large poten-tial for emission reductions relative to its contribution to thecity’s emissions (4.5%). This is because energy-from-waste(combined heat and power) and landfill gas utilizationoptions not only reduce methane emissions from landfillbut also generate electricity that could displace coal as asource of energy.
The most cost- and carbon-effective measures are ident-ified in Table 2. In this table, cost-effective measures have anegative value: these options save money for every unit ofcarbon emissions they avoid. Cost-neutral measures have apositive economic value because these options incur a costto avoid carbon emissions. Those measures with positiveeconomic savings in this table could be paid for throughreinvesting the returns from the cost-effective measures.The impact of interactions between these measures hasbeen accounted for in the aggregated investment needsand carbon savings at the sector and city scale.
4. Discussion
4.1. Decoupling economic activity and carbonemissions in Johor Bahru
Economic growth is outstripping increases in emissions, sothe carbon intensity of economic activity in Johor Bahru isprojected to fall by 34.1% over the next decade. Relative
Figure 5. Per capita carbon emissions in Johor Bahru, Malaysia, under three different investment scenarios. Note the resemblance to theCKC.
Table 1. Potential carbon and economic savings available inJohor Bahru in 2025, according to sector.
SectorCarbon savings
(ktCO2-e)Economic
savings (USD)
Commercial 598 57,289Domestic 12,004 916,720Industrial 25,184 4,715,647Transport 26,080 7,191,129Waste 19,507 516,706
8 S. Colenbrander et al.
Dow
nloa
ded
by [
Uni
vers
iti T
ekno
logi
Mal
aysi
a] a
t 21:
32 1
5 Ju
ne 2
015

decoupling of economic output and carbon emissions istherefore apparent in business as usual trends between2000 and 2025. However, absolute levels of emissionsattributed to the city are projected to rise at a rate of5.8% per annum between 2014 and 2025. This meansthat emissions per capita in Johor Bahru are projected toreach 13.9tCO2-e in 2025, that is, 36.9% higher than
average per capita emissions in OECD countries in 2010(World Bank, 2014d). Johor Bahru is therefore on a high-carbon development path.
Reaching the tipping point in absolute carbon emis-sions will require absolute rather than relative decoupling.There is substantial potential to curb growth in emissionsper capita through exploitation of economically attractive
Figure 6. The distribution of cost-effective opportunities according to cost- and carbon effectiveness. The size of the ‘bubble’ reflects thetotal economic savings from that measure if deployed independently.
Table 2. League table with the most cost- and carbon-effective measure from each sector.a
Sector Measure MYR/tCO2-e USD/tCO2-e ktCO2-e
Commercial Green Buildings Standard 2 (100% of new buildings) −171,678.44 −51,945.78 173Industrial Rubber industry – heat recovery −13,136.28 −3974.72 14.2Transport Hybrid private cars with current tax incentive −1441.31 −436.11 15,051Industrial Fertilizer industry – steam reforming (moderate improvements) −1162.95 −351.88 93.4Domestic Raising thermostat 1°C −333.65 −100.95 1582Transport Euro IV vehicle standards – cars with sales tax relief −969.46 −293.34 9169Commercial Banning incandescent light bulbs −542.82 −164.24 65.76Domestic 4 kWp solar PV panel with FiT (10 MW by 2025) −505.19 −152.86 1712Commercial Air conditioner – EE standard 2 −483.11 −146.18 199Domestic Solar water heating with FiT (15% of households by 2025) −435.20 −131.68 438Domestic Air conditioner – EE Standard 2 −319.87 −96.78 3849Waste Centralized composting – high gate fee −250.77 −75.88 1462Waste Waste prevention −209.59 −63.42 589Waste Landfill gas utilization −128.66 −38.93 7607Waste Energy from waste (combined heat and power) – high gate fee −24.11 −7.30 8359Commercial Turning off lights −0.53 −0.16 145Industrial Fuel switching – diesel replaced with biodiesel 48.21 14.59 43,798Industrial Rubber industry – adoption of variable speed drive in
electric motors (30% speed reduction)183.52 55.53 11,232
Transport B100 fuel 207.86 62.89 19,874Transport BRT (50 km) 342.05 103.50 3154
Note: Where two measures are mutually exclusive, the more carbon-effective option has been included.aFull details are available upon request.
Climate and Development 9
Dow
nloa
ded
by [
Uni
vers
iti T
ekno
logi
Mal
aysi
a] a
t 21:
32 1
5 Ju
ne 2
015

options. If the city were to invest the equivalent of 0.4% ofGDP in cost-effective low-carbon measures annually for 10years, it would yield reductions in the city’s energy billequal to 1.0% of GDP per year. These measures wouldreduce emissions at the city scale by 24.2% relative tobusiness as usual trends. This would not halt the growthin emissions at the city scale: emissions still increase by37.7% relative to 2014 levels in 2025 (Figure 2) becausecarbon savings are outstripped by rapid populationgrowth. On a per capita basis, however, these investmentswould reduce emissions by 10.0%. This suggests thatabsolute decoupling of economic activity and carbon emis-sions is possible in a cost-effective way in a city in anupper-middle-income country.
If the returns from the cost-effective measures could berecovered without substantial transaction costs andreinvested in low-carbon measures, there is scope toreduce emissions even further. In this cost-neutral scenario,Johor Bahru could reduce its emissions to 45.4% relative tobusiness as usual levels in 2025. This is equivalent to areduction of 0.8% in real terms relative to 2014 levels. Inother words, the city as a whole can achieve real emissionreductions and decouple economic development fromcarbon emissions at no net cost (Figure 4). These resultsare even more compelling at an individual scale. Withexploitation of all of the cost-effective and cost-neutralcarbon saving potential in Johor Bahru, emissions percapita could be reduced by 35.2% relative to 2014 levels.To put this in context, the Malaysian government hasvoluntarily committed to reducing the emission intensityof GDP by up to 40% based on 2005 levels by 2020 (Min-istry of Natural Resources and Environment, 2010). Bycomparison, our results indicate that – at least within thecity of Johor Bahru – the Malaysian government couldreduce emissions per capita below 2005 levels by 2025 inabsolute terms (Figure 5).
This finding highlights an important opportunity tomitigate climate change without incurring costs to econ-omic development. Currently, 1.5 billion people live incities in upper-middle-income countries, and emissionsper capita are increasing by 3.5% per year (WorldBank, 2014a). If this trend continues, CO2 emissionsfrom upper-middle-income countries will increase by46.0% by 2025. However, if the results of this researchhold broadly true, there is scope to reduce emissionsfrom these cities by 24.2% in a cost-effective way andby 45.4% in a cost-neutral way relative to business asusual levels. These savings equate to a reduction respect-ively equivalent to 6.3% and 11.3% of global carbonemissions in 2013. Considering that future growth inenergy use and emissions is likely to be concentratedin urban areas of emerging economies, this finding hashuge implications for our collective capacity to avoiddangerous climate change.
4.2. The implications for shifting the tipping point
The assumption that climate change mitigation can only beafforded at a certain level of income is often evident ininternational climate policy (e.g. the Kyoto Protocol) andtheory (e.g. the hypothesized CKC). It suggests that,under business as usual conditions, middle-incomecountries will reach a tipping point when low-carboninvestment becomes affordable. In practice, of course,many high-income countries have not yet reached atipping point, so we continue to see a linear relationshipbetween economic growth and carbon emissions at highlevels of income, rather than the inverted U-shape of theCKC (Azomahou et al., 2006).
Our findings refute the assumption that this tippingpoint requires middle-income countries to reach developedcountry levels of income before they invest in low-carbondevelopment by challenging the premise that emissionreductions are costly. This paper identifies a wide rangeof opportunities that are cost-effective in their own rightin an upper-middle-income country. Assuming that thesecan be deployed in a socially and environmentally respon-sible way, public authorities could reasonably be expectedto invest in these measures purely on economic groundsand this would coincidentally deliver real reductions inper capita emissions. If the returns from these investmentscan be captured and reinvested in additional low-carbonmeasures, more substantial emission reductions can be rea-lized at no net cost to the city. The example of Johor Bahrusuggests that there can be a compelling economic case forshifting the tipping point to an earlier stage of development.If these savings were sustained, the city would reach ‘peakemissions’ at a significantly lower level than in a businessas usual scenario. It is important to highlight that thesecarbon savings do not result from reducing territorial emis-sions by, for example, exporting pollution-intensive indus-tries, which Cole and Neumayer (2005) predicted andKnight and Schor (2014) demonstrated to be the majordriver of decoupling in high-income countries. Rather,these are potentially real savings in consumption-basedemissions achieved by reducing the carbon intensity ofenergy use and through energy efficiency improvements.These findings demonstrate that climate policies andinvestments to reduce emissions can actually be economi-cally attractive, including in the developing world.
These results imply that the tipping point is not a func-tion of income, but of political will and institutionalcapacity. It can be brought forward in time at no net costif decision-makers are willing and able to make the necess-ary low-carbon policies and investments. This is an impor-tant extension of existing literature, which shows that it ispossible to ‘tunnel through’ the CKC (e.g. see Aubourg,Good, & Krutilla, 2008; Lipford & Yandle, 2010), butdoes not provide an economic case for such ambitiousclimate action.
10 S. Colenbrander et al.
Dow
nloa
ded
by [
Uni
vers
iti T
ekno
logi
Mal
aysi
a] a
t 21:
32 1
5 Ju
ne 2
015
4.3. Policy recommendations
The suggestion that the tipping point is policy dependent
and can be cost-neutral should change the nature of
global climate policy discussions. The existence of a com-
pelling economic case for low-carbon investments may
create the political space for decision-makers to pursue
emission reductions at an earlier stage of development
than has historically been observed (Gupta, 2012). In
other words, demonstrating that the local benefits of
action can outweigh the local costs may help to build pol-
itical will for climate action, which in turn will shift devel-
oping countries on to lower carbon development paths. We
must therefore consider the ways that, and extent to which,
different levels of government can exploit and build upon
these opportunities.It is important to emphasize two points here. First,
many of the measures considered here have potentially sig-nificant co-costs and benefits, and important distributionalconsequences and environmental impacts. The direct econ-omic case for different low-carbon options should be onlyone factor in decision-making: the presence of a widersocial case for a low-carbon transition is equally important.For example, an expansion of public transport may improvemobility for the poor while tax incentives for hybrid carsmay be largely captured by the relatively wealthy. Theseimpacts should be considered when preparing climate andenergy policies.
Second, the approach used here may not fully capturesome of the market imperfections associated with theimplementation of low-carbon measures, such as trans-action costs, agency issues or financing hurdles (Kesicki& Ekins, 2012). The nature and value of transaction costsis typically specific to different low-carbon measures(Mundaca, Mansoz, Neij, & Timilsina, 2013b). Forexample, the introduction of green building standards inMalaysia faces the challenge of split incentives, wherebyproperty developers incur the additional costs while theowner or tenant captures the benefits. Similarly, the repla-cement of compact fluorescent (CFL) lights with light-emitting diode (LED) bulbs in commercial and publicbuildings will require much more upfront capital, even ifthe investment pays for itself within a few years. While evi-dence from the USA and Europe suggests that ex post trans-action costs from climate policy instruments are relativelyminor (Joas & Flachsland, 2014), these considerationsmean that governments have a role to play in mobilizingprivate investment. Public policies and resources can beemployed to increase returns, reduce costs, de-risk invest-ments and close knowledge or capacity gaps to encouragewidespread uptake of low-carbon options (Buchner et al.,2013). There is therefore a need for more research onclimate policy design and project implementation in aMalaysian context.
National governments can reduce the payback periodsof low-carbon options by, for example, reducing fossilfuel subsidies or offering feed-in tariffs for renewableenergy generation. They can also de-risk low-carboninvestments by, for example, setting long-term renewableenergy quotas or permitting tax-increment financing forenergy efficiency retrofits. National governments alsohave the capacity to induce private investment throughregulation: the adoption of green building standards andmore stringent vehicle emission standards are promisingexamples in a Malaysian context.
These policy tools are not always available to local gov-ernments, which have limited resources and powers.However, municipal authorities have considerable capacityto promote more efficient forms of urban development byincreasing the stringency of planning and approval pro-cesses, enforcing energy regulation and establishingpublic–private partnerships for large infrastructure projectsin the transport and waste sectors. Municipal authoritiescan also promote energy efficiency by establishing greenpublic procurement policies or by acting as the anchorclient for building retrofit programmes. There is evidencethat this project-based approach may entail fewer trans-action costs and yield more significant co-benefits than,say, national emission trading schemes in the context ofnon-Annex I countries (Knopf et al., 2010; Spaargaren &Mol, 2013). The presence of a strong economic case forlow-carbon investment provides a compelling incentive tomake the necessary regulations and investments at both anational and sub-national level, and it is to be hoped thatthese will in turn help cities to achieve real emissionreductions.
The international community also has a role to play inincreasing the returns, reducing the risks or costs and pro-viding a body of evidence that low-carbon options can beeconomically and socially attractive. There is therefore anurgent need for knowledge transfer to developing countriesso that they can exploit more carbon-efficient technologiesand establish greener policy frameworks, where these canbe deployed at no net cost. Multilateral institutions anddevelopment agencies should prioritize the developmentof locally specific, bottom-up evidence on the economicsof different low-carbon options. This will allow local andnational policy-makers to identify cost-effective low-carbon opportunities. Thereafter, strong domestic environ-mental and energy governance is the key to shifting thetipping point and transitioning to a lower carbon develop-ment path.
Where there is less political will or institutionalcapacities are less developed, policy-makers can cherry-pick low-carbon options that are both economically attrac-tive and institutionally straightforward – for example,energy-from-waste infrastructure, hybrid private cars,green building standards for the commercial sector andminimum performance standards for air conditioners – as
Climate and Development 11
Dow
nloa
ded
by [
Uni
vers
iti T
ekno
logi
Mal
aysi
a] a
t 21:
32 1
5 Ju
ne 2
015

a means to build local capacity and demonstrate economicor technical feasibility. This can provide a platform for themore ambitious and politically complex initiatives, such astransit-oriented urban planning, large-scale deployment ofdecentralized renewable energy technologies or reductionsin energy subsidies.
5. Conclusions
Although they are responsible for 37.8% of global CO2
emissions, upper-middle-income countries currently haveno binding emission reductions under international law.This is because of a widely held perception that investmentin climate change mitigation can only be afforded when acountry reaches a particular level of income. This researchsuggests that cities in upper-middle-income countries canachieve real emission reductions without hindering econ-omic development; indeed, it outlines a substantialpackage of low-carbon options that are attractive solelyon economic terms that would deliver real emissionreductions for the city of Johor Bahru.
This result has important implications for climatepolicy and practice. First, these findings demonstrate thatthere are significant carbon savings available from econ-omically attractive low-carbon options. It is reasonable toexpect upper-middle-income countries to commit to realemission reductions (rather than emission intensityreductions) that can be achieved in a cost-effective orcost-neutral way.
Second, this work highlights that substantial privateinvestment in low-carbon options can be mobilized withenabling policy frameworks. The presence of a compellingeconomic case for climate action will hopefully help toinspire the necessary political leadership at earlier stagesof development.
Third, it is important to emphasize that ongoing low-carbon investments will be required to maintain the lowercarbon intensity of economic growth. These may notalways be cost-effective or cost-neutral. Empirical researchindicates that countries may achieve some emissionreductions which are subsequently lost by a return tocarbon-intensive economic growth – resulting in the N-shaped CKC (de Bruyn et al., 1998; Moomaw & Unrush,1997; Zanin & Marra, 2012). With careful design anddelivery, exploitation of cost-effective low-carbon optionscan increase public acceptance of climate action, supportsocial and economic development and build institutionalcapacities for implementing and financing climate mitiga-tion. The economic case for low-carbon investment there-fore provides a means to build political momentum fordeeper structural changes that may or may not be economi-cally attractive, but are necessary to achieve the levels ofdecarbonization necessary to avoid dangerous climatechange.
Disclosure statementNo potential conflict of interest was reported by the authors.
ReferencesAECOM. (2009). Iskandar Malaysia Integrated Solid Waste
Management Blueprint. Retrieved July 24, 2014, fromhttp://www.sisa.my/sisanet/1upload/lokasi/Johor/document/mesyuarat_pengarah_negeri/Arkib/Iskandar%20Malayisa%20Integrated%20Solid%20Waste%20Management%20Blueprint_Stage%203%20Final%20Report.pdf
Arrow, K., Bolin, B., Costanza, R., Dasgupta, P., Folke, C.,Holling, C. S.,… Pimentel, D. (1995). Economic growth, car-rying capacity and the environment. Ecological Economics,15, 91–95.
Aubourg, R. W., Good, D. H., & Krutilla, K. (2008). Debt, demo-cratization and development in Latin America: How policycan affect global warming. Journal of Policy Analysis andManagement, 27(1), 7–19.
Azomahou, T., Laisney, F., & Nguyen Van, P. (2006). Economicdevelopment and CO2 emissions: A nonparametric panelapproach. Journal of Public Economics, 90, 1347–1363.
Bajželj, B., Allwood, J. M., & Cullen, J. M. (2013). Designingclimate change mitigation plans that add up. EnvironmentalScience and Technology, 47(14), 8062–8069.
Beltran, A. M., den Elzen, M. G. J., Hof, A. F., van Vuuren, D. P.,& van Vliet, J. (2011). Exploring the bargaining space withininternational climate negotiations based on political, econ-omic and environmental considerations. Energy Policy, 39(11), 7361–7371.
BNM. (2014). Conventional interbank rates. Bank NegaraMalaysia. Retrieved July 25, 2014, from http://www.bnm.gov.my/index.php?ch=statistic&pg=stats_convinterbkrates
de Bruyn, S. M., van den Bergh, J. C. J. M., & Opschoor, J. B.(1998). Economic growth and emissions: Reconsidering theempirical basis of environmental Kuznets curves.Ecological Economics, 25, 161–175.
Buchner, B., Herve-Mignucci, M., Trabacchi, C., Wilkinson, J.,Stadelmann, M., Boyd, R.,…Micale, V. (2013). The globallandscape of climate finance 2013. Climate PolicyInitiative. Retrieved January 14, 2015, from http://climatepolicyinitiative.org/wp-content/uploads/2013/10/The-Global-Landscape-of-Climate-Finance-2013.pdf
C40 Cities Climate Leadership Group and ICLEI LocalGovernments for Sustainability. (2012). GreenhouseGas Protocol for Communities v0.9. Retrieved February 3,2014, from http://www.ghgprotocol.org/files/ghgp/GPC%20v9%2020120320.pdf
Carson, R. T. (2010). The environmental Kuznets curve: Seekingempirical regularity and theoretical structure. Review ofEnvironmental Economics and Policy, 4(1), 3–23.
Chen, K. S., Wang, W. C., Chen, H. M., Lin, C. F., Hsu, H. C.,Kao, J. H., & Hu, M. T. (2003). Motorcycle emissions andfuel consumption in urban and rural driving conditions. TheScience of the Total Environment, 312, 113–122.
Cole, M. A., & Neumayer, E. (2005). Environmental policy andthe environmental Kuznets curve: Can developing countriesescape the detrimental consequences of economic growth?In P. Dauvergne (Ed.), Handbook of global environmentalpolitics (pp. 298–318). Cheltenham: Edward Elgar.
Department of Statistics. (2014). Consumer price index. Malaysia:Author. Retrieved April 16, 2014, from http://www.statistics.gov.my/portal/index.php?option=com_content&view=article&id=583&Itemid=111&lang=en
12 S. Colenbrander et al.
Dow
nloa
ded
by [
Uni
vers
iti T
ekno
logi
Mal
aysi
a] a
t 21:
32 1
5 Ju
ne 2
015

Department of Solid Waste Management. (2014). Solid wastecomposition report. Ministry of Urban Wellbeing, Housingand Local Government, Malaysia. Retrieved April 30,2014, from http://www.kpkt.gov.my/jpspn_en_2013/main.php?Content=articles&ArticleID=43&IID=
Dinda, S. (2004). Environmental Kuznets curve hypothesis: Asurvey. Ecological Economics, 49, 431–455.
Energy Commission. (2006). Electricity supply industry inMalaysia – performance and statistical information 2006.Malaysia Energy Hub. Retrieved July 24, 2014, from http://meih.st.gov.my/documents/10620/969e79a4-aa17–46ec-a201–6384bb18e6dc
Energy Commission. (2007). Electricity supply industry inMalaysia – performance and statistical information 2007.Malaysia Energy Hub. Retrieved July 24, 2014, from http://meih.st.gov.my/documents/10620/b10baadc-ab2c-488b-a4af-57e1f4d4d7a3
Energy Commission. (2008). Electricity supply industry inMalaysia – performance and statistical information 2008.Malaysia Energy Hub. Retrieved July 24, 2014, from http://meih.st.gov.my/documents/10620/c569e1d5–542f-407c-ad31-acdd2d4353a6
Energy Commission. (2009). Electricity supply industry inMalaysia – performance and statistical information 2009.Malaysia Energy Hub. Retrieved July 24, 2014, from http://meih.st.gov.my/documents/10620/5c011fd7–4cae-4a09–891a-8794c1404d58
Energy Commission. (2010). Electricity supply industry inMalaysia – performance and statistical information 2010.Malaysia Energy Hub. Retrieved July 24, 2014, from http://meih.st.gov.my/documents/10620/e92bbc28-ff35–4e80–8981-a849b2fce14b
Energy Commission. (2011). Electricity supply industry inMalaysia – performance and statistical information 2011.Malaysia Energy Hub. Retrieved July 24, 2014, from http://meih.st.gov.my/documents/10620/a2d10c59–1931–4e73–94ba-630d6be34575
Gani, A. (2012). The relationship between good governance andcarbon dioxide emissions: Evidence from developing econ-omies. Journal of Economic Development, 77(37), 77–93.
Gouldson, A., Colenbrander, S., Sudmant, A., & Papargyropoulou,E. (2014). The economics of low carbon cities: Johor Bahruand Pasir Gudang, Malaysia. The Centre for Low CarbonFutures. Retrieved August 20, 2014, from http://www.climatesmartcities.org/sites/default/files/Malaysia%20-%20Executive%20Summary%20(English).pdf
Grossman, G. M., & Krueger, A. B. (1991). Environmentalimpacts of a North American free trade agreement(National Bureau of Economic Research Working Paper3914). Cambridge, MA: NBER.
Gupta, J. (2012). Negotiating challenges and climate change.Climate Policy, 12(5), 630–644.
Ho, C. S., Matsuoka, Y., Chau, L. W., Teh, B. T., Simpson, J. J., &Gomi, K. (2013, March 4–6). Bridging science and policy-making: Low Carbon Society Blueprint for IskandarMalaysia. Proceeding of 7th South East Asia TechnicalUniversity Consortium (SEATUC) 2013 symposium,Institut Teknologi Bandung, Indonesia.
IEA. (2013).World energy outlook 2013. Paris: Author. RetrievedJuly 28, 2015, from http://www.worldenergyoutlook.org/publications/weo-2013/
IPCC. (2014). Climate change 2014: Mitigation of climatechange. Author. Retrieved May 15, 2014, from http://mitigation2014.org
IRDA. (2007). Iskandar Malaysia comprehensive developmentplan. Retrieved April 30, 2014, from http://www.iskandarmalaysia.com.my/comprehensive-development-plan-cdp
IRDA. (2013). What is Iskandar Malaysia: Facts & figures.Malaysia: Author. Retrieved November 14, 2013, fromhttp://www.iskandarmalaysia.com.my/what-is-iskandar-malaysia-fact-figures
Joas, F., & Flachsland, C. (2014). The (ir)relevance of transactioncosts in climate policy instrument choice: An analysis of theEU and the US. Climate Policy. doi:10.1080/14693062.2014.968762
Kesicki, F., & Ekins, P. (2012). Marginal abatement cost curves: acall for caution. Climate Policy, 12(2), 219–236. doi:10.1080/14693062.2011.582347
KeTTHA. (2012). National energy balance 2011. Ministry ofEnergy, Green Technology and Water. Retrieved April 9,2014, from http://meih.st.gov.my/documents/10620/6ee119f3–8bcf-4a7b-930e-ae375dbbc544
Khazanah Nasional. (2006). Comprehensive development plan forSouth Johor economic region. Retrieved April 16, 2014, fromhttp://www.iskandarmalaysia.com.my/pdf/cdp/7._Chapter4_-_Economic_Development_Strategies.pdf
Knight, K. W., & Schor, J. B. (2014). Economic growth andclimate change: A cross-national analysis of territorial andconsumption-based carbon emissions in high-incomecountries. Sustainability, 6(6), 3722–3731. doi:10.3390/su6063722
Knopf, B., Edenhofer, O., Flachsland, C., Kok, M. T. J., Lotze-Campen, H., Luderer,… van Vuuren, D. P. (2010).Managing the low-carbon transition – from model results topolicies. The Energy Journal [The Economics of LowStabilization], 31(1), 233–245.
Lamb, W. F., Steinberger, J. K., Bows-Larkin, A., Peters, G. P.,Roberts, J. T., & Wood, F. R. (2014). Transitions inpathways of human development and carbon emissions.Environmental Research Letters, 9(1). doi:10.1088/1748–9326/9/1/014011
Liddle, B., & Messinis, G. (2014). Revisiting carbon Kuznetscurves with endogenous breaks modeling: Evidence of decou-pling and saturation (but few invested-us) for individualOECD countries (United States Association for EnergyEconomics – USAEE Research Paper No. 14-178).
Lipford, J. Y., & Yandle, B. (2010). Environmental Kuznetscurves, carbon emissions and public choice. Environmentand Development Economics, 15(4), 417–438.
López-Menéndez, A. J., Pérez, R., & Moreno, B. (2014).Environmental costs and renewable energy: Re-visiting theenvironmental Kuznets curve. Journal of EnvironmentalManagement, 145(1), 368–373. doi:10.1016/j.jenvman.2014.07.017
Mahlia, T. M. I., Tohno, S., & Tezuka, T. (2012). A global reviewof success story on implementation of fuel economy standardfor passenger cars: Lessons for other countries. EnergyEducation Science and Technology Part A: Energy Scienceand Research, 29(2), 947–972.
Ministry of Natural Resources and Environment. (2010). Secondnational communication to the UNFCCC. Malaysia.Retrieved April 9, 2014, from http://www.nre.gov.my/Malay/Alam-Sekitar/Documents/Penerbitan/SECOND%20NATIONAL%20COMMUNICATION%20TO%20THE%20UNFCCC%20%28NC2%29.pdf
Moomaw, W. R., & Unruh, G. C. (1997). Are environmentalKuznets curves misleading us? The case of CO2 emissions.Environment and Development, 2, 451–463.
Climate and Development 13
Dow
nloa
ded
by [
Uni
vers
iti T
ekno
logi
Mal
aysi
a] a
t 21:
32 1
5 Ju
ne 2
015

Muller, S. (2013). Urbanization, infrastructure and economicgrowth in Southeast Asia. Institute for SustainableCommunities. Retrieved July 5, 2014, from http://www.iscvt.org/news/urbanization-infrastructure-and-economic-growth-in-asia/
Munasinghe, M. (1999). Growth-oriented economic policies andtheir environmental impacts. In C. J. M. van den Bergh(Ed.), Handbook of environmental economics (pp. 678–708). Cheltenham: Edward Elgar.
Mundaca, T. L., Mansoz, M., Neij, L., & Timilsina, G. R. (2013b).Transaction costs analysis of low-carbon technologies.Climate Policy, 13(4). doi:10.1080/14693062.2013.781452
Mundaca, T. L., Markandya, A., & Nørgaard, J. (2013a). Walkingaway from a low-carbon economy? Recent and historicaltrends using a regional decomposition analysis. EnergyPolicy, 61, 1471–1480. doi:10.1016/j.enpol.2013.04.083
NAPIC. (2014). Property stock reports 2003–2013. NationalProperty Information Centre. Retrieved April 16, 2014, fromhttp://napic.jpph.gov.my/portal/portal/eps/Online+Services/Publication/PublicationPortletWindow?uri=/Publication_EN/ComPSR_EN.htm&action=2
OANDA. (2014). Historical exchange rates. Retrieved April 16,2014, from http://www.oanda.com/currency/historical-rates/
Phdungsilp, A. (2009). Comparative study of energy and carbonemissions. Fifth urban research symposium 2009. RetrievedJuly 5, 2014, from http://siteresources.worldbank.org/INTURBANDEVELOPMENT/Resources/336387–1256566800920/6505269–1268260567624/Phdungsilp.pdf
Road Transport Department Malaysia. (2014). Statistics.Retrieved July 25, 2014, from http://www.jpj.gov.my/
Saidur, R. (2009). Energy consumption, energy savings, and emis-sion analysis in Malaysian office buildings. Energy Policy, 37(10), 4104–4113.
Scrieciu, S., Rezai, A., & Mechler, R. (2013). On the economicfoundations of green growth discourses: The case of climatechange mitigation and macroeconomic dynamics in economicmodelling. WREs Energy and Environment, 2(3), 251–268.doi:10.1002/wene.57
Shafik, N., & Bandyopadhyay, S. (1992). Economic growth andenvironmental quality: Time series and cross-country evi-dence (Background paper for the World DevelopmentReport 1992). Washington, DC: The World Bank.
Silitonga, A. S., Atabani, A. E., &Mahlia, T. M. I. (2012). Reviewon fuel economy standard and label for vehicle in selectedASEAN countries. Renewable and Sustainable EnergyReviews, 16, 1683–1695.
Smith, K. R., & Ezzati, M. (2005). How environmental healthrisks change with development: The epidemiologic andenvironmental risk transitions revisited. Annual Review ofEnvironment and Resources, 30, 291–333.
Spaargaen, G., & Mol, A. P. J. (2013). Carbon flows, carbonmarkets, and low-carbon lifestyles: Reflecting on the role ofmarkets in climate governance. Environmental Politics[Coming of Age? Environmental Politics at 21], 22(1),174–193. doi:10.1080/09644016.2013.755840
SPAD. (2013). Land public transport master plan. Land PublicTransport Commission. Retrieved July 24, 2014, fromhttp://eps.mbpj.gov.my/SlideTod/MBPJ_GKLKV_Nov2013_SPAD.pdf
Steer, A. (2013). Resource depletion, climate change and econ-omic growth. Global Citizen Foundation (Working Paper 5).Retrieved December 4, 2014, from http://www.gcf.ch/wp-content/uploads/2013/06/GCF_Steer-working-paper-5_6.20.13.pdf
UNDESA. (2013). World population prospects: The 2012revision. United Nations Department of Economic andSocial Affairs. Retrieved May 15, 2014, from http://esa.un.org/wpp/
UNDESA. (2014). Emissions per capita (tCO2-e). United NationsDepartment of Economic and Social Affairs. Retrieved April9, 2014, from http://unstats.un.org/unsd/default.htm
UNDP, & Malaysian Public Works Department. (2009). Buildingsectors energy efficiency project. United NationsDevelopment Programme, Malaysian Public WorksDepartment. Retrieved April 16, 2014, from http://www.thegef.org/gef/sites/thegef.org/files/repository/11–30–09%20ID3598%20-%20Council%20letter.pdf
UNFCCC. (1992). United Nations Framework Convention onClimate Change. Retrieved July 21, 2014, from http://unfccc.int/resource/docs/convkp/conveng.pdf
UTM, IRDA, Kyoto University, Okayama University, & NationalInstitute for Environmental Studies. (2013). Low CarbonSociety Blueprint for Iskandar Malaysia 2025 (2nd ed.).Johor Bahru: UTM-Low Carbon Asia Research Centre.Retrieved October 14, 2014, from http://www.utm.my/partners/satreps-lcs/publications/
WHO. (2014).Urban population growth. Geneva: Author. RetrievedMay 15, 2014, from http://www.who.int/gho/urban_health/situation_trends/urban_population_growth_text/en/
WMO. (2014). Johor Bahru, Malaysia. Author. RetrievedDecember 4, 2014, from http://worldweather.wmo.int/en/city.html?cityId=78
World Bank. (1992). World development report. New York, NY:Oxford University Press.
World Bank. (2014a). Upper middle income. Washington, DC:Author. Retrieved July 21, 2014, from http://data.worldbank.org/income-level/UMC
World Bank. (2014b). Energy use (kg of oil equivalent per capita).Washington, DC. Retrieved April 9, 2014, from http://data.worldbank.org/indicator/EG.USE.PCAP.KG.OE
World Bank. (2014c).Urban population (% of total). Washington,DC. Retrieved April 9, 2014, from http://data.worldbank.org/indicator/SP.URB.TOTL.IN.ZS
World Bank. (2014d). CO2 emissions (metric tons per capita).Washington, DC. Retrieved April 9, 2014, from http://data.worldbank.org/indicator/EN.ATM.CO2E.PC
WRAP. (2010). Waste collection vehicle fuel efficiency trial.Author. Retrieved April 30, 2014, from http://www.wrap.org.uk/sites/files/wrap/WRAP%20FH%20and%20Premier%20Trial%20Draft%20Report%20Final%20for%20approval%2006_07_10%20HG.pdf
Zanin, L., & Marra, G. (2012). Assessing the functional relation-ship between CO2 emissions and economic developmentusing an additive mixed model approach. EconomicModelling, 29, 1328–1337.
Zusman, E., Srinivasa, A., & Dhakal, S. (2012). Low carbontransport in Asia: Strategies for optimizing co-benefits.London: Earthscan.
14 S. Colenbrander et al.
Dow
nloa
ded
by [
Uni
vers
iti T
ekno
logi
Mal
aysi
a] a
t 21:
32 1
5 Ju
ne 2
015