Exploring Student Demand for Postgraduate Study - UK ...
212
1 BIS RESEARCH PAPER NO. 154 Exploring Student Demand for Postgraduate Study DECEMBER 2013
-
Upload
khangminh22 -
Category
Documents
-
view
3 -
download
0
Transcript of Exploring Student Demand for Postgraduate Study - UK ...

1
BIS RESEARCH PAPER NO. 154
Exploring Student Demand for Postgraduate Study
DECEMBER 2013

Contents Contents .......................................................................................................................................... 2
List of Tables................................................................................................................................. 9
List of Figures.............................................................................................................................. 10
Executive Summary...................................................................................................................... 11
Overall trends in the volume of applications ............................................................................... 12
Trends in applications by detailed qualification type ................................................................... 13
Trends in applications by subject area........................................................................................ 13
Trends in applications by domicile .............................................................................................. 14
Trends in applications by previous HE experience ..................................................................... 15
Trends in applications by demographics..................................................................................... 16
Age.......................................................................................................................................... 16
Gender .................................................................................................................................... 16
Ethnicity................................................................................................................................... 17
Disability status ....................................................................................................................... 17
Proportion of applications resulting in an offer ............................................................................ 17
Postgraduate demand in the future............................................................................................. 18
Chapter 1: Background and Introduction................................................................................... 20
Aims and objectives of the project .............................................................................................. 20
Key recent policy changes .......................................................................................................... 20
Feasibility Study .......................................................................................................................... 24
Profile of HEIs providing application data ................................................................................... 26
Approach to data weighting and analysis.................................................................................... 28
Over-arching caveats on data presented .................................................................................... 29
2

Understanding Postgraduate Demand
Report structure .......................................................................................................................... 30
Chapter 2: Trends in applications by course type..................................................................... 31
2.1 Overall application numbers................................................................................................. 31
2.1.1. Applications to Postgraduate Research (PGR) Programmes ................................... 34
2.1.2. Applications to Taught Postgraduate (PGT) Programmes ........................................ 34
2.2. Ratio of application numbers to places taken up.............................................................. 34
2.2.1. Postgraduate Research (PGR) Programmes............................................................ 35
2.2.2. Taught Postgraduate (PGT) Programmes ................................................................ 37
2.3. Application rates by detailed qualification type................................................................. 38
2.3.1. Postgraduate Research (PGR) Programmes............................................................ 38
2.3.2. Taught Postgraduate (PGT) Programmes ................................................................ 40
2.4. Ratio of application numbers to places taken up by detailed qualification type................ 42
2.4.1. Postgraduate Research (PGR) Programmes............................................................ 42
2.4.2. Taught Postgraduate (PGT) Programmes ................................................................ 43
2.5. Mode of study ................................................................................................................... 44
2.5.1. Postgraduate Research (PGR) Programmes............................................................ 44
2.5.2. Taught Postgraduate (PGT) Programmes ................................................................ 48
2.5.3. Qualitative feedback from HEIs about mode of study ............................................... 50
Chapter 3: Trends in applications by subject area.................................................................... 53
3.1. Caveats on the data ......................................................................................................... 53
3.2. Application rates by detailed subject breakdown.............................................................. 53
3.2.1. Applications to Postgraduate Research (PGR) Programmes by subject .................. 53
3.2.2. Applications to Postgraduate Research (PGT) Programmes by subject................... 56
3.3. Ratio of application numbers to places taken up by detailed qualification type................ 60
3.3.1. Postgraduate Research (PGR) Programmes............................................................ 60
3

Understanding Postgraduate Demand
3.3.2. Taught Postgraduate (PGT) Programmes ................................................................ 62
3.4. Qualitative feedback from HEIs discussions on the changing nature of demand by subject area 64
Chapter 4: Trends in applications by domicile .......................................................................... 66
4.1. Caveats on the data ......................................................................................................... 66
4.2. Application rates by Domicile ........................................................................................... 66
4.2.1. Applications to Postgraduate Research (PGR) Programmes by Domicile ................ 66
4.2.2. Applications to Taught Postgraduate (PGT) Programmes by Domicile..................... 68
4.3. Ratio of application numbers to places taken up by domicile ........................................... 71
4.3.1. Postgraduate Research (PGR) Programmes............................................................ 71
4.3.2. Taught Postgraduate (PGT) Programmes ................................................................ 72
4.3.3. Trends in PGR Applications by Domicile by Course Type ........................................ 74
4.3.4. Trends in PGT Applications by Domicile by Course Type......................................... 75
4.3.5. Trends in PGR Applications by Domicile By Subject ................................................ 77
4.3.6. Trends in PGT Applications by Domicile By Subject ................................................. 81
4.4. Qualitative findings from HEIs discussions regarding use of overseas agents ................ 85
4.4.1. What do agents do? .................................................................................................. 85
4.4.2. How are agents paid? ............................................................................................... 86
4.4.3. Impact of agents on applications............................................................................... 86
Chapter 5: Trends in applications by Previous HE experience................................................ 87
5.1. Caveats and limitations of the data .................................................................................. 87
5.2. Proportions of applications submitted by alumni .............................................................. 87
5.2.1. Proportion of applications submitted to PGR by alumni ............................................ 87
5.2.2. Proportion of applications submitted to PGT by alumni............................................. 88
5.3. Proportions of applications submitted by alumni by mission group .................................. 89
5.3.1. Proportion of applications submitted by alumni to PGR courses by mission group .. 89
4

Understanding Postgraduate Demand
5.3.2. Proportion of applications submitted by alumni to PGT courses by mission group... 89
5.4. Ratios of applications to enrolments by alumni status (PGR)........................................... 90
5.4.1. Ratios of PGR applications to enrolments by alumni status...................................... 90
5.4.2. Ratio of PGT applications to enrolments by alumni status........................................ 90
5.5. Trends in proportion of applications submitted by alumni by domicile.............................. 91
5.5.1. Trends in proportion of PGR applications submitted by alumni by domicile.............. 91
5.5.2. Trends in proportion of PGT applications submitted by alumni by domicile .............. 92
5.6. Trends in proportion of applications submitted by alumni by detailed qualification type .. 93
5.6.1. Trends in proportion of PGR applications submitted by alumni by detailed qualification type ..................................................................................................................... 93
5.6.2. Trends in proportion of PGT applications submitted by alumni by detailed course breakdown............................................................................................................................... 93
5.7. Trends in proportion of applications submitted by alumni by detailed subject breakdown94
5.7.1. Trends in proportion of PGR applications submitted by alumni by detailed subject breakdown............................................................................................................................... 94
5.7.2. Trends in proportion of PGT applications submitted by alumni by detailed subject breakdown............................................................................................................................... 96
Chapter 6: Trends in applications by Demographics................................................................ 98
6.1. Caveats and limitations of the data .................................................................................. 98
6.2. Profile of Applications to Postgraduate Study by Age at Point of Application .................. 99
6.2.1. Applications to PGR Programmes by Age ................................................................ 99
6.2.2. Applications to PGT Programmes by Age............................................................... 100
6.2.3. Ratios of Applications to PGR to Places Taken Up by Age .................................... 101
6.2.4. Ratios of Applications to PGT to Places Taken Up by Age..................................... 102
6.2.5. Trends in PGR Applications by Age by Course Type.............................................. 103
6.2.6. Trends in PGT Applications by Age by Course Type .............................................. 105
6.2.7. Trends in PGR Applications by Age By Subject ...................................................... 107
5

Understanding Postgraduate Demand
6.2.8. Trends in PGT Applications by Age by Subject....................................................... 110
6.3. Profile of Applications to Postgraduate Study by Gender............................................... 115
6.3.1. Applications to PGR Programmes by Gender......................................................... 115
6.3.2. Applications to PGT Programmes by Gender ......................................................... 116
6.3.3. Ratios of Applications to PGR to Places Taken Up by Gender ............................... 117
6.3.4. Ratios of Applications to PGT to Places Taken Up by Gender ............................... 118
6.3.5. Trends in PGR Applications by Gender by Course Type ........................................ 119
6.3.6. Trends in PGT Applications by Gender by Course Type......................................... 120
6.3.7. Trends in PGR Applications by Gender By Subject ................................................ 121
6.3.8. Trends in PGT Applications by Gender By Subject................................................. 124
6.4. Profile of UK-domiciled Applications to Postgraduate Study by Ethnicity....................... 128
6.4.1. UK- domiciled Applications to PGR Programmes by Ethnicity ................................ 128
6.4.2. UK-domiciled Applications to PGT Programmes by Ethnicity ................................. 130
6.4.3. Ratios of Applications to PGR to Places Taken Up by Ethnicity ............................. 131
6.4.4. Ratios of Applications to PGT to Places Taken Up by Ethnicity.............................. 133
6.5. Profile of Applications to Postgraduate Study by Disability Status ................................. 134
6.5.1. Applications to PGR Programmes by Disability Status ........................................... 134
6.5.2. Applications to PGT Programmes by Disability Status............................................ 135
6.5.3. Ratios of Applications to PGR to Places Taken Up by Disability Status ................. 136
6.5.4. Ratios of Applications to PGT to Places Taken Up by Disability Status.................. 137
Chapter 7: Proportion of applications resulting in an offer .................................................... 138
7.1. Caveats and limitations of the data ................................................................................ 138
7.2. Proportion of applications that result in an offer ............................................................. 138
7.2.1. Proportion of PGR applications that result in an offer ............................................. 138
7.2.2. Proportion of PGT applications that result in an offer.............................................. 140
6

Understanding Postgraduate Demand
7.3. Application to offer ratio by detailed qualification type.................................................... 141
7.3.1. Application to offer ratio by detailed qualification type (PGR) ................................. 141
7.3.2. Application to offer ratio by detailed qualification type (PGT).................................. 142
7.4. Application to offer ratio by Subject ................................................................................ 143
7.4.1. Application to offer ratio by Subject (PGR).............................................................. 143
7.4.2. Application to offer ratio by Subject (PGT) .............................................................. 145
7.5. Application to offer ratio by Domicile .............................................................................. 146
7.5.1. Application to offer ratio by Domicile (PGR)............................................................ 146
7.5.2. Application to offer ratio by Domicile (PGT) ............................................................ 147
Chapter 8: Postgraduate Demand in the Future ...................................................................... 149
8.1. Postgraduate demand in the future ................................................................................ 149
Widening participation........................................................................................................... 150
Demographics....................................................................................................................... 150
Subject choice....................................................................................................................... 150
Qualification type................................................................................................................... 151
Part-time / Full Time.............................................................................................................. 152
Candidate quality .................................................................................................................. 152
International students............................................................................................................ 153
HEI response ........................................................................................................................ 153
Repeating the data collation exercise ................................................................................... 155
Recommendations on analysing postgraduate demand in the future ................................... 157
Appendix I: Volumetric tables ................................................................................................... 159
Chapter 2 .................................................................................................................................. 159
Chapter 3 .................................................................................................................................. 161
Chapter 4 .................................................................................................................................. 163
7

Understanding Postgraduate Demand
Chapter 5 .................................................................................................................................. 170
Chapter 6 .................................................................................................................................. 171
Appendix II: Postgraduate typology ........................................................................................ 185
Appendix III Table of student numbers..................................................................................... 186
Appendix IV Research instruments .......................................................................................... 187
Data specification sent to participating HEIs............................................................................. 187
Qualitative discussion guide used at HEI site visits .................................................................. 204
8

Understanding Postgraduate Demand
List of Tables
Table 1:1 Number of HEIs providing data for each time period, by mission group and quartile ...............................................................................................................................27 Table 2.1: Total number of applications submitted to English HEIs for postgraduate study...........................................................................................................................................33 Table 2.2: Ratio of applications to places taken up by qualification type (PGR) ................42 Table 2.3: Ratio of applications to places taken up by qualification type (PGT).................43 Table 2.4: Mode of study according to specific qualification type (PGR) ...........................46 Table 2.5: Mode of study according to specific qualification type (PGT)............................49 Table 2.6: Mode of study according to Domicile (PGR) .....................................................51 Table 2.7: Mode of study according to Domicile (PGT) .....................................................52 Table 3.1: PGR Applications by Subject Area....................................................................54 Table 3.2: PGT Applications by Subject Area ....................................................................57 Table 3.3: Ratio of applications to places taken up by subject area (PGR) .......................60 Table 3.4: Ratio of applications to places taken up by subject area (PGT)........................62 Table 4.1: Proportion of PGR Applications by Domicile .....................................................68 Table 4.2: Proportion of PGT Applications by Domicile .....................................................70 Table 4.3: Proportion of PGR Applications by Domicile by Course Type...........................74 Table 4.4: Proportion of PGT Applications by Domicile by Course Type ...........................75 Table 4.5: Proportion of PGR Applications split by Subject Area within Domicile ..............77 Table 4.6: Proportion of PGT Applications split by Subject Area within Domicile ..............81 Table 5.1: Percentage of applications received from alumni by year (PGR)......................87 Table 5.2: Percentage of applications received from alumni by year (PGT) ......................88 Table 5.3: Percentage of PGR applications submitted alumni by mission group ...............89 Table 5.4: Percentage of PGT applications submitted alumni by mission group ...............90 Table 5.5: Ratio of applications to places taken up by alumni status (PGR)......................90 Table 5.6: Ratio of applications to places taken up by existing student status (PGT)........91 Table 5.7: Percentage of applications submitted by alumni by domicile (PGR) .................92 Table 5.8: Percentage of applications submitted by alumni by domicile (PGT) .................92 Table 5.9: Percentage of applications submitted by alumni by course type (PGR)............93 Table 5.10: Percentage of applications submitted by alumni by course type (PGT) ..........94 Table 5.11: Percentage of applications submitted by alumni by subject area (PGR).........95 Table 5.12: Percentage of applications submitted by alumni by subject area (PGT) .........97 Table 6.1: Proportion of PGR Applications by Age by Course Type ................................104 Table 6.2: Proportion of PGT Applications by Age by Course Type ................................106 Table 6.3: Proportion of PGR Applications by Age by Subject Area ................................107 Table 6.4: Proportion of PGT Applications by Age by Subject Area ................................111 Table 6.5: Proportion of PGR Applications by Gender by Qualification Type ..................119 Table 6.6: Proportion of PGT Applications by Qualification Type by Gender...................120 Table 6.7: Proportion of PGR Applications by Subject Area by Gender ..........................121 Table 6.8: Proportion of PGT Applications by Subject Area by Gender...........................125 Table 7.1: Ratio of applications to offers by qualification type (PGR) ..............................141 Table 7.2: Ratio of applications to offers by qualification type (PGT)...............................142 Table 7.3: Ratio of applications to offers received by Subject Area (PGR)......................143 Table 7.4: Ratio of applications to offers by Subject Area (PGT).....................................145
9

Understanding Postgraduate Demand
List of Figures
Figure 2.1: Ratio of applications to places taken up (PGR) ...............................................36 Figure 2.2: Ratio of applications to places taken up (PGT)................................................37 Figure 2.3: Applications by qualification type (PGR)..........................................................39 Figure 2.4: Applications by qualification type (PGT) ..........................................................40 Figure 2.5: Applications by mode of study (PGR) ..............................................................45 Figure 2.6: Applications by mode of study (PGT) ..............................................................48 Figure 4.1: PGR Applications by Domicile (absolute numbers) .........................................67 Figure 4.2: PGT Applications by Domicile (absolute numbers)..........................................68 Figure 4.3: Percentage of Applications to PGR Programmes Leading to Enrolment According to Domicile ........................................................................................................71 Figure 4.4: Percentage of Applications to PGT Programmes Leading to Enrolment According to Domicile ........................................................................................................72 Figure 6.1: Proportion of Applications to PGR programmes by Age ..................................99 Figure 6.2: Proportion of applications to PGT programmes by age .................................100 Figure 6.3: Percentage of PGR Applications Leading to Enrolment ................................102 Figure 6.4: Percentage of PGT Applications Leading to Enrolment.................................103 Figure 6.5: Proportion of Applications to PGR by Gender................................................115 Figure 6.6: Proportion of Applications to PGT by Gender ................................................116 Figure 6.7: Percentage of PGR Applications Leading to Enrolment by Gender...............117 Figure 6.8: Percentage of PGT Applications Leading to Enrolment by Gender ...............118 Figure 6.9: Proportion of UK-domiciled Applications to PGR by Ethnicity........................128 Figure 6.10: Proportion of UK-domiciled Applications to PGT by Ethnicity ......................130 Figure 6.11: Percentage of UK-domiciled PGR Applications Leading to Enrolment split by ethnicity............................................................................................................................132 Figure 6.12: Percentage of UK-domiciled PGT Applications Leading to Enrolment split by ethnicity............................................................................................................................133 Figure 6.13: Proportion of Applications to PGR by Disability Status ................................134 Figure 6.14: Proportion of Applications to PGT by Disability Status ................................135 Figure 6.15: Percentage of PGR Applications Leading to Enrolment split by disability status ...............................................................................................................................136 Figure 6.16: Percentage of PGT Applications Leading to Enrolment split by disability status.........................................................................................................................................137 Figure 7.1: Ratio of applications to offers made (PGR) ...................................................139 Figure 7.2: Ratio of applications to offers made (PGT)....................................................140 Figure 7.3: Percentage of applications resulting in an offer by Domicile (PGR)...............147 Figure 7.4: Percentage of applications resulting in an offer by Domicile (PGT)...............148
10

Understanding Postgraduate Demand
Executive Summary While applications for undergraduate study are managed centrally by UCAS, there is no equivalent for postgraduate study and individual Higher Education Institutions (HEIs) largely manage their own application processes. This means that there is no straightforward way to look at how applications to postgraduate study have changed over time.
In this context, BIS commissioned this research project which looked to collate information on postgraduate applications from individual HEIs and to analyse it with a view to:
Looking to establish the trends in postgraduate applications over recent years and how these might be linked to Higher Education policy changes;
Setting a benchmark against which the impact of future changes in Higher Education policy on postgraduate might be measured.
Prior to the collation of postgraduate application data from HEIs, a feasibility study was conducted to determine the extent of data available and its analysis potential. This stage of the project comprised a quantitative online survey followed by site visits to selected HEIs.
On the basis of findings from the feasibility study about the nature of data held and willingness to share information, requests for the exchange of data were sent to a total of 24 HEIs. A total of 20 HEIs submitted their application data. Only English HEIs were asked to submit data.
Based on findings from the feasibility study about the type of information held consistently across HEIs, organisations were asked to provide information on applications relating to:
Demographics (Gender, Date of birth, ethnicity and disability status);
Course type (Qualification type, Subject area and Mode of study);
Domicile; (UK domiciled, other EU, Non EU – which can be understood as a proxy for Funding Status)
Previous HEI (previous HEI attended and date of previous qualification);
Outcomes (whether offers made and whether offers were taken up)
Of those providing data, six provided data for applications made from 2005/06 onwards, a further six provided data from 2008/09 onwards, and a further eight provided data from 2010/11 onwards. The data for each application year have been weighted to represent the full population of HEIs with postgraduate students. This allows us to produce estimates of the total number of applications in each year and also to make assessments about the trends in applications over the 7 year period covered using data for each year from all those institutions who were able to provide it. Some caution should be adopted when
11

Understanding Postgraduate Demand
interpreting volumes of applications; these should be understood as indicative, rather than reflecting the absolute numbers of applications. Therefore the bulk of the commentary in the report focuses its analysis on proportions, ratios and percentages (which are likely to be representative of general trends). Inevitably the data for the most recent two application years i.e. 2010/11 and 2011/12 is more robust (17 HEIs provided PGR data and 20 PGT data) than for earlier years.
In interpreting the data collected as part of this study, it is important to note that the data collected represents applications and not individual applicants. HEIs reported that many individuals make multiple applications to postgraduate study and they felt that this practice has become increasingly common since the advent of online application forms. However, given that the data for this study was obtained from a sub-set of institutions it would not be possible to conduct the cross-referencing necessary to establish applicant-based data. Furthermore it would have meant sharing of data that identified individual students and most participating HEIs felt that the anonymity of individual applications was a prerequisite for them sharing data at all.
It is also worth noting that, while data was collected for most types of postgraduate qualification, applications for PGCE courses and for Integrated Masters courses were excluded from the research. The reason for excluding PGCE courses is that the use of a pan-HEI application process handled by GTTR for these programmes meant that HEIs often retained less information about PGCE applicants than they did for applicants to other courses. Similarly, most HEIs did not retain information on applications to Integrated Masters courses as part of their postgraduate databases (these were generally considered to be part of the undergraduate admissions process).
Overall trends in the volume of applications
PGR The data indicates that the volume of applications to postgraduate research (PGR) programmes increased by 73% over the seven year period so that during the 2011/12 academic year over 195,000 applications were received by English HEIs (compared with 114,000 in the academic year 2005/06). After year-on-year increases in the volume of applications, it appears that there was a fall in applications to PGR study in 2010/11. The volume of applications recovered slightly in 2011/12 although still remains behind the peak in 2009/10 (when over 220,482 applications were received). PGT The number of applications to postgraduate taught (PGT) programmes increased more dramatically over the 7 year period covered by the research than those submitted for PGR. The data indicates that the volume of applications increased by 164% over this time. During the 2011/12 academic year more than 1.3 million applications were made to PGT study.
The data indicates that the volume of PGT applications increased consistently year on year throughout the 7-year period covered. The most marked increase in applications to PGT programmes occurred in the 2008/09 academic year; applications in this year were up by 51% on the number submitted in 2007/08. However, since the 2009/10 academic
12

Understanding Postgraduate Demand
year the number of applications to PGT programmes has only increased by a comparatively modest amount each year.
Trends in applications by detailed qualification type
PGR PGR applications were most commonly made for PhDs (which have been categorised to incorporate MPhil qualifications alongside traditional PhDs). Overall, they represented 86% of all applications submitted across the seven year period. Over the seven year period, the number of applications to both Professional Doctorates and Higher Doctorates accounted for only a very small proportion of PGR applications. Submissions to Research Masters comprised 12% of applications submitted across the period and applications to Professional Doctorate qualifications represented just 2%.
The numbers of applications submitted to PhDs increased by 88% over the period and even more markedly, applications to Professional Doctorates increased by 343% over the seven years (albeit volumes were considerably smaller). Conversely applications to Research Masters declined by 8%.
However, the data suggests that, in 2010/11 the volume of applications for all PGR qualification types dropped considerably; with a decrease of 28% in the number of applications to Research Masters, 19% to Professional Doctorates and 17% to PhDs.
PGT Of all PGT applications within the scope of the project (i.e. Masters Degrees, MBAs and Postgraduate Diplomas and Certificates), the vast majority of applications in each year were submitted to Masters Courses. On average across the period, they accounted for 92% of all PGT applications. In comparison, just 5% of applications were made to Postgraduate Certificates and Diplomas and 3% were made to MBAs.
Overall, applications to all PGT qualifications increased over the course of the seven years period; by 169% for Masters Degrees, 150% for Postgraduate Diplomas and Certificates and 72% for MBA programmes.
The dramatic decline in applications to all PGR qualifications in 2010/11 was not reflected at PGT level. Rather, there was a year on year increase in applications Masters Courses and Diplomas and Certificates; although there was a greater degree fluctuation in the number of applications submitted to MBAs.
Trends in applications by subject area
PGR In 2005/06, applications to study in the field of Social / Political / Economic studies accounted for almost half of all PGR applications, at 48%. However, this proportion then declined year on year, almost halving by 2011/12, when it stood at 23%. As well as this large reduction in the proportion of applications for Social / Political / Economic studies, the data indicates that there has been a steady reduction in the overall volume of these applications from around 55,000 in 2005/06 to 45,000 in 2011/12. However, despite this, in the most recent academic year, submissions to Social / Political / Economic studies still represented the largest proportion of applications.
13

Understanding Postgraduate Demand
Over the course of the seven year period, some notable increases in the number of applications can be identified in certain subject areas. Subjects aligned to Medicine increased markedly over the period having represented <1% of applications in 2005/06 but 6% in 2011/12. In a similar vein, applications to Medicine and Dentistry also increased, albeit to a slightly lesser degree, constituting 1% of applications in 2005/6 but 4% in 2011/12. In addition, PGR applications to Biological sciences increased notably from 4% in 2005/06 to 9% in 2011/12.
PGT In contrast the PGR level, the most popular PGT subject area was Business / Administrative studies. Across the seven years a third of all applications (33%) were for intended study on such courses and a gradual year on year increase was also evident across the period. A fifth of PGT applications (18%) were submitted to Social / Political / Economic studies, the second most popular subject area. Reflecting trends evident at PGR level, applications to this area decreased dramatically over the period. In 2005/6 applications to Social / Political and Economic studies represented a quarter of all submissions (25%), but by 2011/12 they represented just 16%. However, there is no evidence of the pronounced increase within some of the Medical / Biological subject areas apparent as PGR level. Although growth is evident, in 2005/6 applications to Medicine and Dentistry represented <1% of applications but seven years later they only constituted 2% of submissions. Similarly, across the period, the proportion of applications made to Subject allied to Medicine grew from 3% to 4%. In direct contrast to trends evident at PGR level, applications to Biological Sciences actually decreased from 3% to 2% between 2005/6 and 2011/12.
Trends in applications by domicile
PGR At an overall level, the only point when there was a decline in numbers of applications was in 2010/11 when the number of PGR applications across all groups dropped, before recovering again in 2011/12. Looking at applications from UK domiciled individuals in particular, there was a 5% decrease in 2010/11 followed by an 8% increase in 2011/12. Across the course of the seven years, 63% of all applications were submitted by non-EU candidates, a fifth (20%) were submitted by UK domiciled applicants and 17% from persons domiciled in the rest of the EU. Contrasted against a steady increase in the proportion of applications received from UK domiciled candidates (increasing from 16% in 2005/6 to 24% in 2011/12), there has been a modest decline in the proportion of PGR submissions from both International and non-EU candidates across the seven years. The proportion of application submitted by other EU candidates decreased from 21% to 15% and the proportion of applications from International applicants has also declined slightly from 64% in 2005/06 to 61% per cent in 2011/12. However, as discussed above, the overall volume of applications to PGR study has grown over the period and, in terms of absolute numbers, the volume of applications from all 3
14

Understanding Postgraduate Demand
domicile groups has increased – it is just that the rate of growth of applications from UK domiciled candidates has been more rapid than for students from abroad. PGT In terms of absolute volumes of applications, the numbers of UK domiciled and other EU applications each rose year on year until 2009/10; however, for both groups, numbers of applications then fell in 2010/11 and again in 2011/12. The number of applications submitted by UK domiciled candidates decreased by 15% over the two years. This is compared to a year on year increase in the number of applications submitted by non-EU candidates throughout the period. PGT submissions from non-EU candidates comprised an even higher proportion of total applications than for PGR programmes. On average across the period, non-EU applications represented over seven in ten submissions (72%). Moreover, the proportion of PGT applications submitted by non-EU candidates has increased rapidly over the period from 68% in 2005/6 to 77% in the most recent academic year. This provides indication that the international market is even more significant from PGT programmes than it is for PGR. In 2011/12 just 14% of applications were submitted by UK domiciled candidates; as a point of comparison, 24% of applications were submitted by UK domiciled candidates in the same year at PGR level. The proportion of PGT applications submitted by UK domiciled candidates has declined over the period; in 2005/6 they represented 18% of PGT applications. Approximately one in ten applications (9%) received in 2011/12 were submitted by other EU candidates. The proportion of applications received by other EU candidates also declined over the period, but to a lesser degree than Home applications; 13% of submissions were made by other EU applicants in 2005/6.
Trends in applications by previous HE experience
HEIs were asked to indicate whether applications where made by individuals studying at their own institution. Only sufficient information was collated to be able to provide robust analysis from 2008/9 onwards for both PGR and PGT applications; as such 2005/6, 2006/7 and 2007/8 academic years have been excluded.
PGR On average across the four year period approximately 15% of PGR applications were submitted by candidates intending to study at their current / previous HE provider. This proportion remained fairly consistent across the four years with alumni representing between roughly 14% and 16% of total submissions.
PGT In comparison to PGR, a lower proportion of PGT applications were submitted by alumni. Since 2008/9 approximately 5% of PGT applications were made by persons wishing to study at their current or previous institution.
15

Understanding Postgraduate Demand
During qualitative site visit discussions, a number of HEIs mentioned that they had been making increasing efforts to market postgraduate study to their own undergraduates. Some institutions had implemented (or were considering introducing) fee discounts for existing students wishing to progress straight from undergraduate study. It was understood that this might help to persuade, a higher proportion of existing undergraduates (who may have alternatively considered postgraduate study elsewhere) to remain at their current HE provider.
Trends in applications by demographics
HEIs were asked to provide demographic data pertaining to applicants’ age, gender, ethnicity and disability status.
At the feasibility study for this project, the potential to collect other demographic data was explored and in particular data that might give an indication of applicants socio-economic status. However, very few HEIs held data that could be used for this purpose and, in any case, there was some uncertainty as to what measures would be appropriate (using data relating to parental background or schooling was felt to be far less relevant to postgraduate applicants than to undergraduates for example).
Age
PGR On average across the seven year period, 24% of PGR applications were submitted by candidates aged 23 and younger (who are likely to have progressed straight from undergraduate study). Half of applications were made by those aged between 24 and 30 (49 per cent) indicating that a large number of applicants do not apply to postgraduate study directly after completion of a first degree. Approximately 27% of applications were submitted by those aged over 30. The age profile of applications to PGR study has not changed markedly over the 7 year period covered by the research. PGT As might be expected, compared to PGR applications, a much higher proportion of applications to PGT programmes were submitted by candidates aged 23 and under (approximately 49% on average across the period).
The proportion of PGT applications from those aged 23 and has increased steadily over the 7 year period. In the most recent academic year (2011/12), applications from this age group represented 55%, in 2005/6 they comprised only 40% of applications. As such a large proportion of the growth in volumes of applications for PGT can be attributed to this increased interest amongst younger persons.
Gender
PGR Throughout the 7-year period, applications for PGR programmes were more likely to be submitted by men than by women; approximately six in ten (61%) applications were submitted by men. However, the proportion of applications submitted by women has increased slightly over the seven years, rising from 37% of applications in 2005/06 to 40% of applications in 2011/12.
16
Understanding Postgraduate Demand
PGT At the beginning of the period, more than half of all PGT applications were submitted by men (representing 54% of applications in 2005/06). Yet, over time, the proportion of applications from women has steadily increased so that in 2009/10 there was a relatively even gender split in PGT applications and by 2011/12 applications from women accounted for 54 per cent of applications.
This has entailed that over the period covered, in contrast to PGR, an equal proportion of men and women submitted applications to PGT programmes (50% respectively).
Ethnicity
PGR Over the period covered by this research, there have not been any major changes to the ethnic profile of PGR applications made by UK-domiciled applicants. Overall, 72% of applicants were White; 7% Asian; 6% Black; 3% Mixed; 2% Chinese and 2% Other ethnic group. In 2011/12, 70% of applications were submitted by White applicants, 7% Asian and 8% Black illustrating the level of consistency across the period.
PGT In contrast with PGR study, there has been some change in the ethnic profile of UK Domiciled PGT applicants over the period. The proportion of applications made by white candidates has fallen fairly steadily across the seven years, from nearly three-quarters (73%) of applications in 2005/06 to just over three-fifths (63%) in 2011/12. Conversely, the proportion of applications submitted by Black candidates has increased over the period (from 6% in 2005/06 to 11% in 2011/12). Changes in the proportions of applications accounted for by other ethnic groups are relatively slight or they have remained consistent.
Disability status
On average across the seven year period, 3% of PGR applicants and 2% of PGR applicants declared a disability. For both PGR and PGT, this remained at a similar level each year, representing between 3-4% of PGR applications and 2-3% of PGT applications.
Proportion of applications resulting in an offer
PGR The ratio of PGR applications received to offers made has remained broadly consistent over the course of the past seven application years. Since 2005/06, the ratio of applications to offers has varied between 2.71 and, at its most competitive, 3.40 applications to every place offered. Hence, as a general rule, where the volume of applications increased so has the volume of offers made. However, there is an indication that over time the proportion of offers leading to enrolment has decreased slightly. Comparing applications to places taken up shows an increase in the ratio from 5.83 in 2005/06 to 6.36 in 2011/12.
PGT The ratio of PGT applications received to offers made has also remained consistent over time. There is again a correlation between the proportion of applications and the number of offers made; as the number of applications increased each year, the number of offers
17

Understanding Postgraduate Demand
made also increased accordingly. Since 2005/06, the ratio of applications to offers varies between 1.71 and 1.89 applications to every place offered. There has been less consistency in the ratio of applications to places taken up for PGT study than for PGR study (with ratios varying from 4.29:1 in 2005/06 to 5.34:1 in 2010/11).
Postgraduate demand in the future
While demand for postgraduate study has increased in recent years, the HEIs who shared their application data for this project all expressed concern about the future of postgraduate study in the UK. Although many felt that the impact of 2006 increases in undergraduate fees on the demand for postgraduate study had been quite slight (at least at an overall level), there was a general consensus that the effect of £9,000 fees introduced in Autumn 2012 will be much more heavily felt..
HEIs generally expected to see a reduction in the demand for postgraduate study among UK-domiciled students progressing straight from undergraduate study from the application year 2015/16 onwards. They felt that the impact of increased undergraduate fees could be particularly acute in the context of other environmental factors affecting demand for postgraduate study and in particular:
The reduction in financial support offered by the Research Councils1;
A lack of a standardised loan system for (primarily) taught postgraduate study (akin to that available for undergraduate study);
The withdrawal of the post study work visa which previously allowed international students to stay in the UK for up to two years after completion of their studies to find employment2;
1 There is suggestion by representatives at Research Councils that this fear may prove to be unfounded. However, there is evidence to suggest that changes have been considered which could have prompted these concerns, for example the Research Councils UK Strategic Vision suggests that emphasis should be placed on supporting quality PhD provision, in preference of support for taught Masters Courses. Moreover their delivery plans outlined changes to the overall level of funding offered to PhD training.
http://www.rcuk.ac.uk/Publications/policy/Pages/StratVision.aspx (section 4.2)
http://www.rcuk.ac.uk/about/aboutRCUK/Pages/DeliveryPlan.aspx
Other news articles have appeared in the national media potentially further fuelling the notion that less support will be available to prospective postgraduate applicants.
http://www.bbc.co.uk/news/education-14309883
http://www.theguardian.com/education/2013/feb/26/how-to-find-postgraduate-funding
http://www.capitaeducation.co.uk/news/hundreds-of-phds-and-masters-courses-cut-news-800637603
http://www.universityworldnews.com/article.php?story=20130116103406881
http://www.theguardian.com/education/2013/jan/05/university-protest-disastrous-neglect-postgraduates
18

Understanding Postgraduate Demand
Uncertainty in international currency exchange rates.
There was, however, a lack of consensus about how the profile of applications might change in the future. Most HEIs anticipated that the proportion of applications submitted to areas such Arts and Humanities would decline in favour of applications for more “vocational” STEM subjects. In addition, most felt that there was a threat to efforts that have been made over recent years to widen participation in postgraduate study to those from more disadvantaged socio-economic backgrounds. Beyond this there was a mix of views in how the demographic profile of applications might change, the impact on demand for different qualification types and the impact on demand for alternatives to full-time study. There were also mixed views on the potential impact on the quality of postgraduate applications.
2 This has been replaced by a new system enabling PhD students to apply to stay in the UK for an additional 12 months after completion of their course
19

Understanding Postgraduate Demand
Chapter 1: Background and Introduction Aims and objectives of the project
It has been acknowledged that over the course of the past decade, reviews and reports exploring the student population in the UK have tended to focus predominantly on those studying for undergraduate degrees. This is despite statistical evidence indicating that the postgraduate sector is growing quicker than the undergraduate sector. Professor Adrian Smith summarised in his 2010 submission to the Secretary of State that “compared to the undergraduate sector, postgraduate provision has had relatively little attention paid to it…despite the fact that postgraduate education is of enormous value to the UK”.
Reflecting the suggestions made by Professor Smith and others, attention has begun to shift towards the postgraduate sector and particularly the impact that the introduction of the new tuition fee system for undergraduates might have on the demand for postgraduate study. However, while there is good data available on the volumes and profile of those taking up postgraduate study through the returns compiled by HESA, there has been little available on the pattern of applications. In part this is because there is currently no centralised applications database used by all Higher Education Institutions (HEIs) offering provision at postgraduate level3. Most students apply directly to their institution of choice and in the main; universities manage their own internal admissions systems.
In this context, BIS commissioned this research project which looked to collate information on postgraduate applications from individual HEIs and to analyse it with a view to:
Looking to establish the trends in postgraduate applications over recent years;
Setting a benchmark against which the impact of future changes in Higher Education policy on postgraduate might be measured.
Key recent policy changes
The data that has been analysed for this study covers the period from the academic year 2005-06 through to the academic year 2011-12. During that time, a number of significant HE policy changes took place that form the backdrop to the trends in applications described in this report.
The principal changes concerned the level of fees charged for undergraduate study. A Labour white paper in 2003 proposed increasing fees to £3,000, and students starting their undergraduate study in autumn 2006 then became the first to pay these higher level fees. The 2008/09 academic year would have been the first year in which students paying these increased level fees submitted applications to postgraduate study (in the final year of their
3 Although around 20 HEIs use UKPASS, a search engine for postgraduate courses.
20

Understanding Postgraduate Demand
undergraduate studies, for all those on a three-year course). Therefore, a negative impact on postgraduate applications in 2008/09 might be expected.
In October 2010, the Browne review was published, recommending that £3,375 annual cap on tuition fees be removed. It further suggested that there should be no cap on the fees that institutions could charge. The implications of the proposed system were that:
The government would provide upfront loans to cover tuition fees and living costs of students. Means tested grants would be available for students from lower income families.
Students would repay loans after graduation and only when earning more than £21,000 annually. Repayments would be made at a rate of 9% on any income over £21,000 and any debt not repaid after 30 years would be written off.
Part-time students would no longer have to pay upfront tuition fees, but would be eligible for loans.
In response to the recommendations outlined by Browne, in December 2010, the coalition government voted to amend the structure of HEI funding which incorporated many of Browne’s recommendations (although not the abolition of caps on tuition fees altogether). It was resolved that:
The universities teaching grant was reduced by 80 per cent and as of September 2012 universities in England were able to charge up to £9000 a year in tuition fees.4
Those HEIs that opted to charge fees of over £6000 are required to contribute to a National Scholarships program and more rigorous sanctions are to be introduced to encourage these universities to widen access.
The government will offer upfront loans; this will start to be repaid once graduates earn £21,000 annual income (rising from the former £15,000 threshold) at a rate of 9%. Any outstanding debt will be written off after 30 years.
Part-time students will be entitled to loans on a similar basis to full-time student.
The new regime was effective as of the Autumn term 2012. The coalition government have stressed that the changes will not only serve as a means to reduce the deficit, but that it will also work to enforce the principle that funding should follow the student, thereby incentivising universities to improve their teaching.5
There has been considerable discussion as to the impact of the revised fee structure upon the future student population (both at undergraduate and postgraduate level) but very little
4 http://www.bbc.co.uk/news/education-11483638
5 The government’s proposals for higher education funding and student finance – an analysis. John Thompson and Bahram Bekhradnia
21

Understanding Postgraduate Demand
robust research has been conducted to assess whether or not cost and access to finance deter potential students from embarking on postgraduate study6.
A 2010 HEPI report summarised that although HESA statistics had suggested that the introduction of the £3,000 undergraduate fees in 2006 had not duly affected postgraduate numbers, it was also reported that 58% of undergraduate students (2009) had been deterred from taking a postgraduate course because of the cost7.
It may be even more difficult to predict the impact of the increased £9,000 undergraduate fees on the postgraduate landscape. Although the Browne Review concluded that “if fees can be deferred, then participation can be protected”, in contrast, the Institute of Fiscal Studies (IFS) concludes that “a £1,000 increase in loans or grants is not sufficient to counteract the impact of a £1,000 increase in fees”8.
Thompson and Bekhradnia suggest that there “must be some prospect that some students will baulk at paying a fee of up to £9,000 for a course that is likely to lead to rather uncertain financial benefits” but also highlight that the loan repayment terms are relatively generous (student will pay less each month, though they will pay for longer). Moreover for many, in the long term, attending university will still be a better option in financial terms than not attending and the government offers assurances that students from lower income households will receive more support and that the new system will enable greater social mobility. 9
Overall, there is little consensus as to if and how the regime, introduced in September 2012, will affect ultimately affect postgraduate student numbers and demographics. In the context of this significant change to the undergraduate fee system, stakeholders agree that it is very difficult to predict how the postgraduate landscape will be affected as a result.
Significant changes to student visa rules also took place during the period covered by this research, which also have a potential impact on international demand for postgraduate study.
Since February 2009, all education providers wanting to bring non-EEA students into the UK have had to apply to become licensed sponsors, and to comply with their sponsorship duties under the Tier 4 category of the points-based system.10 From this point onwards it
6 One Step Beyond: Making the most of postgraduate education. Professor Adrian Smith (2010) p.7
7 Postgraduate Education in the United Kingdom. Higher Education Policy Institute and the British Library (2010)
8 Cited, The government’s proposals for higher education funding and student finance – an analysis. John Thompson and Bahram Bekhradnia
9 Foreword, Higher Education: Students at the Heart of the System. Department for Business, Innovation and Skills (2011)
10 http://www.migrationexpert.com/uk/visa/uk_immigration_news/2009/Jan/1/229/Sponsoring_students_under_the_points-based_system_for_immigration
22
Understanding Postgraduate Demand
became extremely important for HEIs to be certain that any international applications met all of the entry criteria before considering an offer of a place. Failure to do this can lead to a revocation of their status as a trusted sponsor.
It is commented both in reports and amongst stakeholders that UK HEIs will face increasing competition from international institutions11. A growing number of European countries are delivering courses in English and some are delivered for free or at a comparatively low cost12.
Moreover, the recent revisions of immigration rulings entail that it is increasingly likely that international students will have to return to their country of origin after graduating, whereby previously it much easier to gain employment and remain in the UK. This follows the removal in 2012 of the post study work visa that had allowed international students to stay in the UK for up to two years after completion of their studies to find employment. Stakeholders comment that countries such as Australia (where immigration rules are less stringent) are now attracting students that may have previously applied to the UK. In response to this, recommendations have been made that the UK Border Agency should monitor the postgraduate student visa system carefully to ensure that processes run smoothly13.
It is particularly difficult to assess the impact of changing fee structure on the international market. It has been suggested that if fees continue to rise unchecked, this may not result in an immediate dip in international students numbers (as the cost of courses may be understood as a mark of quality) but numbers are likely to eventually drop14.
However, on the other hand, stakeholders comment that the UK will remain an attractive prospective option to International students. Accreditations from UK institutions will remain desirable and so long as it retains its reputation internationally, students from abroad will always wish to study here.
Currently, as the Smith report comments, the UK’s assurance processes are not widely replicated internationally but recommends that measures should be taken to develop a strong UK postgraduate brand to market internationally.15
Moreover, at an institutional level, UK HEIs are developing new strategies to attract International Students abroad. For example, stakeholders comment that overseas provision is developed in line with a country’s anticipated interest or requirements:
11 One Step Beyond: Making the most of postgraduate education. Professor Adrian Smith (2010)
12 Postgraduate Education in the United Kingdom. Higher Education Policy Institute and the British Library (2010)
13 One Step Beyond: Making the most of postgraduate education. Professor Adrian Smith (2010) p.10
14 Postgraduate Education in the United Kingdom. Higher Education Policy Institute and the British Library (2010)
15 One Step Beyond: Making the most of postgraduate education. Professor Adrian Smith (2010)
23

Understanding Postgraduate Demand
Tourism and Hospitality courses are devised specifically for the Malaysian markets and Gas Extraction courses are tailored for an emerging African market.
Feasibility Study
Prior to the collation of postgraduate application data from HEIs for this project, a feasibility study was conducted to determine the extent of data available and its analysis potential. This stage of the project comprised a quantitative online survey followed by site visits to selected HEIs.
The online survey was distributed to all 141 HEIs across the UK with postgraduate students. The purpose of this survey was to provide an initial overview of the information each institution held on postgraduate applications. The survey also established the earliest point from which data was held, and requested preliminary details about the fields of data that were collected. A total of 86 HEIs responded to the survey (an overall response rate of 61%).
From those responding to the survey, some HEIs were selected for follow-up site visits. Site visits explored in more detail the application data held by each institution, including the information fields held, categories collected for each field, detail on how the information is collected, and the completeness of data. In total site visits with 28 HEIs were conducted.
There were a number of positive findings from the feasibility study in terms of the quality of data held by institutions, which included:
Application data was generally held centrally in the institutions taking part (rather than held at a department level or similar) which gave reassurance about internal consistency;
Current students at HEIs (e.g. those currently following their first degree) were generally required to go through the same postgraduate application process as external students offering reassurance on the completeness of databases;
Although some institutions used UKPASS alongside their own internal systems, this did not impact on the completeness of their internal application database because applications submitted through UKPASS were then replicated on their own system;
Applications for postgraduate research programmes (for example PhDs) were generally made through the same process as other postgraduate programmes offering potential for analysis of both types of applications (albeit that there was perhaps slightly more scope for potential applicants likely to be unsuccessful to be filtered out through informal discussions with supervisors than is the case for other types of postgraduate study)
The HEIs that were willing to participate in the main study represented a good spread of organisations by overall size of postgraduate population and by Mission Group.
24

Understanding Postgraduate Demand
However, the feasibility study also uncovered a number of complications that resulted from;
Variations in the time-period for which HEIs felt confident in the quality and completeness of their data. The project explored the possibility of analysing application data stretching back over a decade to applications made for study in 2003. While some HEIs held some information dating back this far, it was rare for them to be confident in the quality of data this far back. In most HEIs, the last decade had seen considerable changes in their application processes and their record-keeping more generally. Most of those taking part in the site visits had moved to an application system that is predominantly administered online at some point during this period and they were generally much more confident in the quality of their data after this point. There were very few HEIs confident in their data prior to 2005. In addition, some HEIs only retained application records for 2 years.
Different procedures for some postgraduate courses. Although most HEIs held some records of their PGCE applicants, the use of a pan-HEI application process handled by GTTR meant that HEIs often retained less information about PGCE applicants than they did for applicants to other courses. Similarly, HEIs did not retain information on applications to Integrated Masters courses as part of their postgraduate databases (these were generally considered to be part of the undergraduate admissions process). Some HEIs had other gaps in their databases (for example professional qualifications that are run in partnership with employers where the employer takes responsibility for the application process and only passes on details of students to be enrolled) but these generally accounted for a very small proportion of the overall postgraduate population.
Limited participation from Scottish institutions. Ideally some Scottish institutions would have been included in the study as it might have been valuable to be able to compare the impact of differing HE policy on future applications to Scottish and English HEIs. However, for this to be feasible a number of HEIs would need to be willing to participate (to enable us to ensure anonymity in the reporting of findings that was a prerequisite for most HEIs to consider participation).
On the basis of these findings, a decision was reached to proceed with the collection of application data but to:
Alter the scope of the study to cover the period from the 2005/06 academic year up to the 2011/12 academic year (rather than obtaining a full decade of application data) and to try to accommodate the fact that different HEIs had different lengths of data available (rather than simply excluding those who could not provided data back to 2005/06).
To exclude applications for PGCE, and applications for integrated Masters from the study.
To focus the remainder of the study just on HEIs in England.
25

Understanding Postgraduate Demand
Profile of HEIs providing application data
On the basis of findings from the feasibility study about the nature of data held and willingness to share information, requests for exchange of data were sent to a total of 24 HEIs. Of these HEIs, four were then unable to take part in the next stage. Therefore, a total of 20 HEIs submitted their application data. The initial aim was to collect data from around 30 institutions for this stage but there were insufficient institutions with the breadth of data desired who were willing to exchange data.
Of those providing data, seven provided data from 2005/06 onwards, a further six provided data from 2008/09 onwards, and a further seven provided data from 2010/11 onwards.
Based on findings from the feasibility study about the type of information held consistently across HEIs, organisations were asked to provide information on applications relating to:
Demographics (Gender, Date of birth, ethnicity and disability status);
Course type (Qualification type, Subject area and Mode of study);
Domicile(Home, EU, Non EU – which can be understood as a proxy for Funding Status16)
Previous HEI (previous HEI attended and date of previous qualification);
Outcomes (whether offers made and whether offers were taken up)
It had been hoped to also collect information relating to the socio-economic status of applicants but very few institutions systematically recorded information that could be used for this purpose. Similarly it had been hoped to append data about the fees charged for courses to the application data. However, some institutions did not have historical data on fees accessible and some of those that did were not willing to share it.
HEIs were asked to provide the data in such a way that individual students could not be identified.
The table below shows the number of HEIs providing data, broken down by mission group and size of current postgraduate population (using quartiles).
16 HEIs commented that it would prove burdensome or even impossible to accurately match applicants’ Funding Status to their data file. In most cases Funding Status is assigned to (an often separate) database once a place has been confirmed. However, most HEI representatives said that ‘Domicile’ would serve as a Inreasonably accurate indicator of candidates’ final funding status (should they choose to made be an offer and accept a place to study at the institution).
26

Understanding Postgraduate Demand
Table 1:1 Number of HEIs providing data for each time period, by mission group and quartile
Provided data from 2005/06
onwards
Provided data from 2008/09
onwards
Provided data from 2010/11
onwards Total
Russell Group 2 4 4 10
Guild HE 2 1 1 4
Million + 2 - 1 3
1994 Group - - 1 1
Mis
sio
n G
rou
p
Unaffiliated 2 1 - 3
1st (HEIs with largest PG populations)
- 1 3 4
2nd 3 3
3rd 1 2 1 4
Po
stg
rad
uat
e T
aug
ht
p
op
ula
tio
n q
uar
tile
4th (HEIs with lowest PG populations)
3 3 3 9
1st (HEIs with largest PG populations)
- 1 1 2
2nd 1 1 3 5
3rd 2 1 1 4
Po
stg
rad
uat
e R
esea
rch
p
op
ula
tio
n q
uar
tile
4th (HEIs with lowest PG populations)
3 1 2 6
NB: The breakdown by mission group over-adds because one institution was a member of 2 mission groups. In addition, three HEIs provided only their PGT data (and not their PGR data)
27
Understanding Postgraduate Demand
Approach to data weighting and analysis
To enable us to look at trends over time going back to 2005/6 using all the data (and not just data from the 7 institutions providing data across the full time period), the data has been weighted.
Since there is no definitive source of population data on applications, there were limited options available for this exercise. The approach that has been taken is to weight data according to the current size of the postgraduate population at each of the participating institutions using data from HESA returns.
The data relating to postgraduate taught (PGT) and postgraduate research (PGR) applications have been weighted separately. For each group of data, the approach that has been taken is to:
1. Rank order all English HEIs with PGR/PGT students by the size of their PGR/PGT population
2. Divide institutions into quartiles defined by the PGR/PGT population (so the first quartile contains the institutions that collectively have a quarter of the total PGR/PGT population)17
3. Use this to devise a weight for the records for the first block of application years (05/06-07/08).
4. Re-do this exercise for the other 2 year blocks where data was collected from more institutions.
Once the weighting had been applied, preliminary checks indicated that the approach generated figures that were plausible (based on comparing figures for applications taken-up generated from the application data for 2010/11 with figures for the student population taken from the HESA data).
It is also the case that the data we have for each set of applications years has been provided by institutions who account for a large proportion of the student population. The institutions providing data for the 05/06,06/07 and 07/08 years represent 6% of the 2010/11 PGR population and 7% of the PGT population. Those providing data or 08/09 and 09/10 account for 19% of the 2010/11 PGR population and 12% of the PGT population and those providing data for 10/11 and 11/12 account for 33% of the 2010/11 PGR population and 21% of the PGT population
Nonetheless it is worth bearing in mind that this approach to data weighting is not ideal and hence volumetric estimates presented in this report should probably be treated as indicative. Data that show changes in the profile of students are more reliable.
17 *Although it was necessary to combine the first and second quartiles for the 05/06 -07/08 data for both PGR and PGT (and the 08/09-09/10 data for PGR) in order to derive weights.
28

Understanding Postgraduate Demand
Over-arching caveats on data presented
Due to the complexities of combining applications databases from a number of different institutions, and the nature of the data itself, a number of caveats need to be taken into consideration when considering the findings presented in this report.
The most important point to note is that the data presented here are based on applications and not applicants. HEIs reported that many individuals make multiple applications to postgraduate study; and they felt that this practice has become increasingly common since the advent of online application forms. However, given that the data for this study was obtained from a sub-set of institutions it would not be possible to conduct the cross-referencing necessary to establish applicant-based data. Even if all HEIs had shared data, those participating in the research indicated that they are not always able to systematically identify multiple applications within their own databases. In addition, it would be very difficult to identify multiple applications across institutions due to the variety of approaches HEIs take to capturing data. It would mean that a means of identifying individual students would need to be shared and most HEIs felt that the anonymity of individual applications was a prerequisite for them sharing data at all.
Other caveats to be borne in mind are that:
Some institutions indicated that the data on postgraduate research applications may be less complete than that for postgraduate taught applications . In some cases applications to research would be submitted to individual departments rather than going straight into the central system; this can again mean that lower quality applications never get transferred onto the system, and, in some cases, students might enrol and be entered onto the student records database despite having never been entered onto the applications database. Research candidates are also more likely to begin by making an informal enquiry to a department or potential supervisor; therefore candidates who are unlikely to be successful may be discouraged from making an application at this stage. However institutions generally felt that most reasonable applications would appear on their applications database (and that they were actively working towards ensuring that this was the case).
Filtering of applications can also occur when overseas applications are submitted through agents. A number of institutions stated that they believe that an agent will only send through those applications that they deem to be likely of success (and in some cases this is actively encouraged); therefore, a number of lower quality overseas applications may never make it into the institution’s applications database. HEIs found it hard to place a figure on the proportion of applications received by an agent that would then be submitted to them – one suggested a figure of around 50%, while others believed that only a very small number would be filtered out.
The methods for collecting the data vary between institutions. In some cases, electronic applications forms are used, which then automatically populate the applications database; however, other institutions still use, either entirely or partly, a paper-based application system, where paper forms must then be entered manually into the database. This can lead to different levels of quality in the data (potentially lower quality as there is the possibility of human error during the input stage, as well as potentially higher quality, as the manual input stage presents an opportunity for
29

Understanding Postgraduate Demand
obvious errors to be corrected); this system can also lead to poor quality applications being excluded, if it is decided to be not worth the effort of entering onto the database.
Some HEIs conduct a review of applications data at the point when individuals enrol for a postgraduate course. Where this happens it tends to mean that HEIs are more confident in the quality and completeness of data for students who actually enrol because the data is checked/corrected at enrolment stage, and students are chased up to provide any missing information. This is particularly the case for fields such as ethnicity and disability, as HEIs find candidates are sometimes reluctant to state this information on the application form.
There are some additional caveats on individual data fields but these are mentioned at the beginning of the appropriate chapters.
Report structure
The data in this report has been structured into 7 chapters of findings
Chapter 2 which looks at trends in applications by course type. This chapter explores volumes and profiles of applications by broad grouping – Postgraduate Research compared with Postgraduate Taught courses – and at the level of more detailed qualification types. It also looks at trends in applications by full or part-time study;
Chapter 3 which looks at trends in applications by subject area;
Chapter 4 which looks at trends in the profile of applications by whether they are from students based in the UK, in the rest of Europe or overseas;
Chapter 5 which explores trends in the profile of applications by whether students have studied previously at the HEI or elsewhere;
Chapter 6 which explores trends in applications by demographics (age, gender, ethnicity and disability status);
Chapter 7 which looks at trends in the ratio of applications that result in an offer of a place to study;
Chapter 8 which reports qualitative information on HEIs’ opinions on the trends in postgraduate applications that they anticipate for the future. It also looks at the impact on HEIs of participating in this study and makes recommendations for any future data collection exercise.
The large volume of data collected makes it possible to conduct a great deal of sub-group analysis. Throughout the report, we have endeavoured only to conduct sub-group analysis by variables that have already been reported in previous chapters.
30

Understanding Postgraduate Demand
Chapter 2: Trends in applications by course type
This chapter provides information on trends in the overall volume of applications to both PGR and PGT programmes and also explores trends in applications at the more detailed qualification level. In addition to volumetric estimates, the chapter also looks at trends in the ratio of application numbers to places taken up by course type. Finally, it investigates patterns in applications by full and part-time study
2.1 Overall application numbers
Table 2.1 overleaf sets out estimates produced for the total number of applications to postgraduate study at English HEIs during each of the seven academic years from 2005/06 to 2011/12 inclusive. Figures are provided at the overall level and individually for both PGR and PGT programmes.
Applications to PGR programmes have been defined as including all applications for PhDs; Professional doctorates and Research Masters18. Applications to PGT programmes include Masters degrees; Masters of Business Administration (MBAs); Postgraduate diplomas and certificates and Postgraduate credits. As discussed in Chapter 1, PGCE courses and Integrated Masters courses were excluded from the data that HEIs were asked to provide.
The data indicates that over the seven year period, in the region of 7.7 million applications were submitted to study at postgraduate level at English HEIs (combining both PGR and PGT applications). After year on year increases since the 2005/06 academic year, the total number of applications submitted in 2011/12 was encroaching 1.5 million.
In all years, the volume of applications to PGT programmes considerably exceeded the volume of applications to PGR programmes. Across all 7 years, applications to PGT study accounted for 85% of all postgraduate applications.
18 The unweighted base size for Higher and Honorary Doctorates was just 4 records. For the purposes of any analysis by PGR qualification type, these records have been excluded.
31

Understanding Postgraduate Demand
32

Table 2.1: Total number of applications submitted to English HEIs for postgraduate study
PGR PGT All
Year
Base: Participating
HEIs
Base: All
Applications
N % change N % change N % change
05/06 49,036 113,616 492,559 606,175
06/07 57,386 129,276 14% 563,794 14% 693,070 14%
07/08
7
67,432 149,015 15% 669,978 19% 818,993 18%
08/09 152,070 185,293 24% 1,013,656 51% 1,198,949 46%
09/10
13
180,298 220,482 19% 1,219,792 20% 1,440,275 20%
10/11 301,653 180,341 -18% 1,287,848 6% 1,468,189 2%
11/12
20
309,497 196,875 9% 1,302,612 1% 1,499,486 2%
Total 20 1,117,372 1,174,898 73% 6,550,239 164% 7,725, 137 147%
33

2.1.1. Applications to Postgraduate Research (PGR) Programmes
The data indicates that the volume of applications to PGR programmes increased by 73% over the seven year period so that during the 2011/12 academic year over 195,000 applications were received by English HEIs. In total, the data suggests that approximately 1.2 million submissions were received in total between academic years 2005/06 and 2011/12.
Table 2.1 indicates that the volume of applications increased every year, with the notable exception of 2010/11 when the volume of applications was approximately a fifth lower than in 2009/10. Prior to this anomaly, between 2005/6 and 2009/10 the rate of increase was marked each year, with a particularly prominent rise in PGR applications between 07/08 and 08/09 when application numbers increased by just under a quarter (24%). It is interesting that this year saw such a large increase in numbers as this is the first year when the first cohort of undergraduates experiencing increased undergraduate tuition fees (that came into force in 2006) could have been applying to postgraduate study and a decrease in applications might have been hypothesised. When discussing trends with HEIs in case study visits, several identified 2008/09 as a year of increased levels of applications and some felt that this was the result of the onset of economic recession and the lack of graduate jobs available.
In terms of absolute numbers, the highest number of PGR applications was received in 2009/10 when 220,482 applications were received.
In the wake of the dip in applications in 2010/11, the following year in 2011/12 the number of applications once again increased, although at a less marked rate than previous years. Moreover, the total number of applications received fell short of the peak in volume evidenced in 2009/10.
2.1.2. Applications to Taught Postgraduate (PGT) Programmes
Between 2005/6 and 2011/12 the number of applications to study PGT courses increased by 164% over the seven year period. During the most recent academic year (2011/12) when the volume of applications peaked, more than 1.3 million applications were made to PGT study.
Table 2.1 illustrates that unlike PGR applications, the volume of PGT applications increased year on year throughout the 7-year period covered. In fact, there does not appear to be any correlation with the patterns in volume evidenced in PGR applications across the period. For PGT, the most significant increase in applications occurred in the 2008/09 academic year when applications in this year were 51% higher than the number submitted in 2007/08.
Since the 2010/11 academic year the number of applications to PGT programmes has only increased by a proportionately modest amount.
2.2. Ratio of application numbers to places taken up
The vast majority of institutions included in the research were able to cross-reference their application databases with their student databases (where necessary) so that information could also be supplied on whether an application to study was successful i.e. the candidate received an offer to study at the institution and eventually went on to take up a
34

Understanding Postgraduate Demand
place on the course. Out of the 17 HEIs that provided PGR data, just one institution was unable to provide information pertaining to student registrations and of the 20 HEIs that provided information for PGT applications, just two were unable to provide this data.
2.2.1. Postgraduate Research (PGR) Programmes
As Figure 2.1 shows overleaf, the ratio of applications for PGR study to places taken up has fluctuated over the 7-year period without an obvious pattern.
Proportionately the lowest number of PGR applications submitted per enrolment was in 2009/10 when approximately 5.4 applications were submitted per registration). Although in 2009/10 both the number of enrolments and total number of applications increased, the number of enrolments did so at a greater rate (32% growth on the previous year in comparison with 19% rise in applications) subsequently resulting in a lower ratio than the previous year.
Comparatively, the highest proportion of applications was submitted in 2006/7 when over 7 applications were received to every one registration. In comparison with the previous year (2005/6), the number of applications had increased by 14% and yet the number of enrolments had decreased by -8% accounting for the notably high ratio.
35

Understanding Postgraduate Demand
Figure 2.1: Ratio of applications to places taken up (PGR)
-
50,000
100,000
150,000
200,000
250,000
2005/06 2006/07 2007/08 2008/09 2009/10 2010/11 2011/12
Total number of applications Total number of places taken up
5.83 6.365.915.416.016.967.24
Ratio of applications to places taken up
Base: All applications to PGR programmes where enrolment status is yes/no (168,992) (05/06: 5,282), (06/07: 6,563), (07/08: 7639), (08/09:25,658), (09/10: 30,368), (10/11:44,688), (11/12:48794) Participating HEIs: (05/06 – 07/08: 6), (08/09 – 09/10: 10), (10/11 – 11/12: 16)
36

Understanding Postgraduate Demand
2.2.2. Taught Postgraduate (PGT) Programmes
A comparison of the number of applications to and places taken up on taught postgraduate programmes is shown in Figure 2.2.
Figure 2.2: Ratio of applications to places taken up (PGT)
-
200,000
400,000
600,000
800,000
1,000,000
1,200,000
1,400,000
2005/06 2006/07 2007/08 2008/09 2009/10 2010/11 2011/12
Total number of applications Total number of places taken up
4.29 4.375.345.154.974.484.38
Ratio of applications to places taken up
Base: All applications to PGT programmes where enrolment status is yes/no (831,700) (05/06: 42,182), (06/07:49,071), (07/08: 57,517), (08/09:120,774), (09/10:143,186), (10/11:209,108), (11/12:209,862) Participating HEIs: (05/06 – 07/08: 7), (08/09 – 09/10: 12), (10/11 – 11/12: 18)
The ratio of applications to places taken up on taught postgraduate courses increased steadily year on year until the most recent academic year (2011/12) when the fewest number of applications were received per enrolment (4.37:1). Although volumes of applications remained consistent with the previous year, the number of enrolments increased by 23% from approximately 220,000 in 2010/11 to 270,000 registrations in 2011/12.
37

Understanding Postgraduate Demand
2.3. Application rates by detailed qualification type
To better understand the patterns in the demand for specific types of study within PGR and PGT programmes, institutions were asked to provide information on the particular qualification types candidates had applied to.
Qualifications were categorised as outlined below:
PGR programmes19
PhDs (e.g. PhD, DPhil, MPhil)
Professional doctorates (e.g. EngD, DNursSci, VetMD, EdD, DBA, DClinPsy)
Research masters (e.g. MRes, MLitt)
PGT programmes
Masters degrees (taught e.g. MA, MSc)
Masters of Business Administration (MBA)
Postgraduate diplomas and certificates
2.3.1. Postgraduate Research (PGR) Programmes
The overwhelming majority of applications to PGR study are made to PhD programmes (which incorporate MPhil courses alongside traditional PhDs). Overall, they comprise 86% of applications made to PGR study across the seven year period. Applications to Research Masters represented 12% of applications submitted across the period and only a tiny minority (2%) of applications were made to study toward Professional Doctorate qualifications.
Overall numbers of applications submitted to PhDs and Professional Doctorates increased over the course of the seven year period; submissions to PhDs increased by 88% and even more so, applications to Professional Doctorates increased by 343% (albeit volumes were considerably smaller). In contrast however, applications to Research Masters actually declined by 8% between 2005/6 and 2011/12.
Figure 2.3 below shows estimates for the number of applications received by English HEIs for each PGR qualification type (PhDs, Professional Doctorates and Research Masters).
19 Only 4 applications across all seven years were submitted for Higher Doctorates (unweighted total). These have been excluded from any analysis based on qualification type.
38
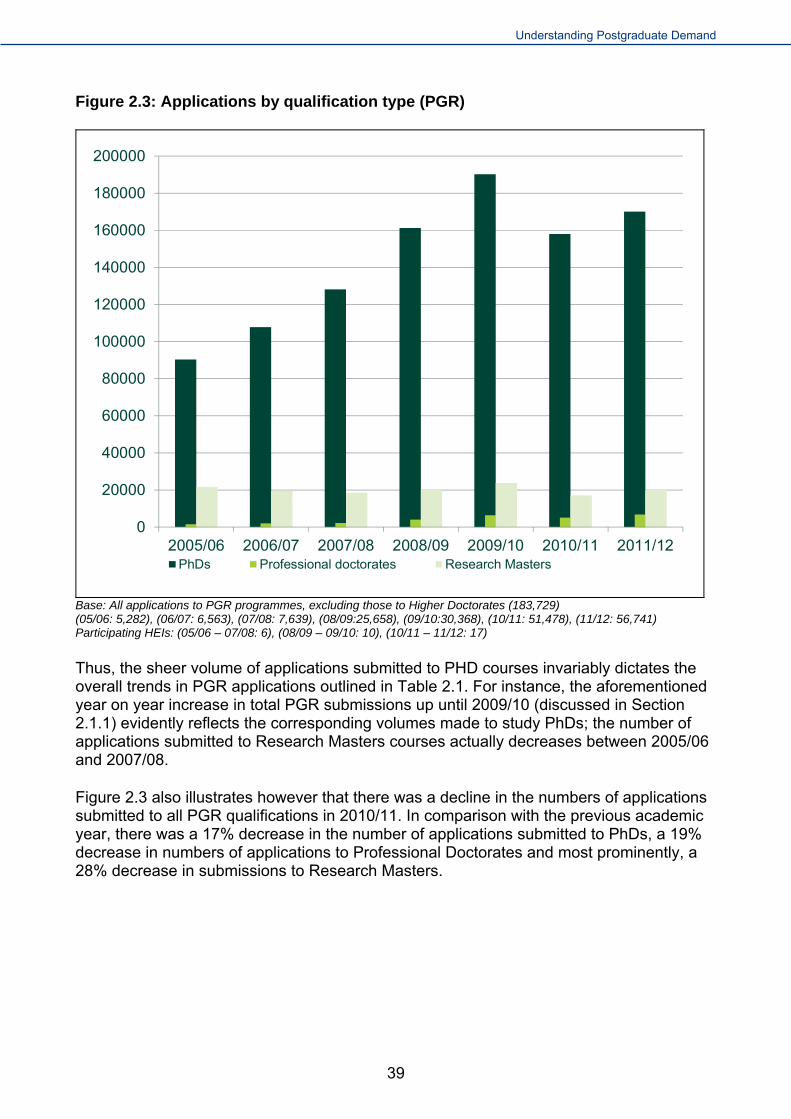
Understanding Postgraduate Demand
Figure 2.3: Applications by qualification type (PGR)
0
20000
40000
60000
80000
100000
120000
140000
160000
180000
200000
2005/06 2006/07 2007/08 2008/09 2009/10 2010/11 2011/12PhDs Professional doctorates Research Masters
Base: All applications to PGR programmes, excluding those to Higher Doctorates (183,729) (05/06: 5,282), (06/07: 6,563), (07/08: 7,639), (08/09:25,658), (09/10:30,368), (10/11: 51,478), (11/12: 56,741) Participating HEIs: (05/06 – 07/08: 6), (08/09 – 09/10: 10), (10/11 – 11/12: 17)
Thus, the sheer volume of applications submitted to PHD courses invariably dictates the overall trends in PGR applications outlined in Table 2.1. For instance, the aforementioned year on year increase in total PGR submissions up until 2009/10 (discussed in Section 2.1.1) evidently reflects the corresponding volumes made to study PhDs; the number of applications submitted to Research Masters courses actually decreases between 2005/06 and 2007/08.
Figure 2.3 also illustrates however that there was a decline in the numbers of applications submitted to all PGR qualifications in 2010/11. In comparison with the previous academic year, there was a 17% decrease in the number of applications submitted to PhDs, a 19% decrease in numbers of applications to Professional Doctorates and most prominently, a 28% decrease in submissions to Research Masters.
39

Understanding Postgraduate Demand
2.3.2. Taught Postgraduate (PGT) Programmes
Across the period covered, applications to Masters Degrees accounted for 92 per cent of all applications to Taught postgraduate programmes. Applications to Postgraduate Certificates and Diplomas represented 5% of submissions across the period and MBAs comprised approximately 3%
Overall, applications to all PGT qualifications increased over the course of the seven year period. Between 2005/6 and 2011/12, the volume of applications submitted to MBA programmes increased by 72%, by 150% for PG Diplomas and Certificates and most markedly, by 169% for Masters Degrees.
Figure 2.4: Applications by qualification type (PGT)
0
200000
400000
600000
800000
1000000
1200000
1400000
2005/06 2006/07 2007/08 2008/09 2009/10 2010/11 2011/12
Masters degrees MBAs Postgraduate diplomas and certificates
Base: All applications to PGT programmes (933,639) (05/06: 43,754), (06/07:50,823), (07/08: 59,793), (08/09:126,412), (09/10:149,930), (10/11:250,173), (11/12:252,754) Participating HEIs: (05/06 – 07/08: 7), (08/09 – 09/10: 13), (10/11 – 11/12: 20)
Figure 2.4 indicates that the number of applications to Masters Degrees increased year on year and notably so between 2007/08 and 2008/9 when application numbers increased by 53%. The volume of applications submitted in 2009/10 also denoted a less pronounced, but marked increase of 21% on the previous year. Between 2010/11 and 2011/12 however, this plateaued and the proportion of applications to Masters Degrees increased by less than 1%.
40

Understanding Postgraduate Demand
Although they account for a relatively small proportion of all PGT applications, the volume of applications submitted to study toward Postgraduate Diplomas and Credits increased year on year. This was most notably the case between 2006/7 and 2007/8 when the number of applications increased by a third (34%). When discussing trends in data with HEIs, some attributed an increase in applications for postgraduate diplomas and credits to a growing influence of employer sponsored and Continuing Professional Development (CPD) type postgraduate courses. Institutions mentioned recent efforts to enter into dialogue with local businesses about the types of courses they would like to see resulting in the development of more modular postgraduate courses. Institutions offering courses under NHS contracts felt that these had resulted in an increased demand for postgraduate diplomas and certificates.
That said, not all HEIs reported an increase in demand for postgraduate diplomas and certificates. Some reported a decrease in interest in these types of qualification, which they ascribed to the fact that Masters courses offered bring more potential earning power making them a more attractive option in a tighter labour market.
Accounting for the smallest proportion of total PGT applications, the number of submissions to MBAs fluctuated between years. In 2010/11 almost a quarter fewer applications were received than in the previous year (a decrease of 23%). In the most recent academic year (2011/12), applications to MBAs increased modestly by 5%.
41
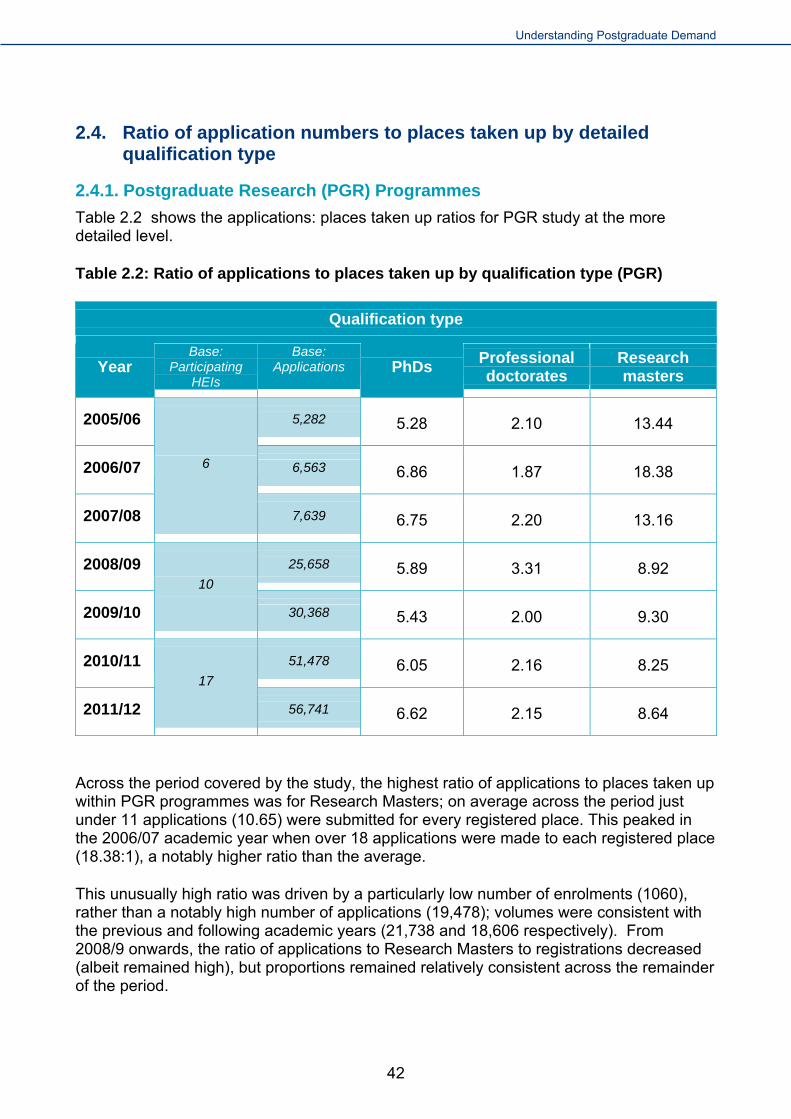
Understanding Postgraduate Demand
2.4. Ratio of application numbers to places taken up by detailed qualification type
2.4.1. Postgraduate Research (PGR) Programmes
Table 2.2 shows the applications: places taken up ratios for PGR study at the more detailed level.
Table 2.2: Ratio of applications to places taken up by qualification type (PGR)
Qualification type
Year Base:
Participating HEIs
Base: Applications PhDs
Professional doctorates
Research masters
2005/06 5,282 5.28 2.10 13.44
2006/07 6,563 6.86 1.87 18.38
2007/08
6
7,639 6.75 2.20 13.16
2008/09 25,658 5.89 3.31 8.92
2009/10
10
30,368 5.43 2.00 9.30
2010/11 51,478 6.05 2.16 8.25
2011/12
17
56,741 6.62 2.15 8.64
Across the period covered by the study, the highest ratio of applications to places taken up within PGR programmes was for Research Masters; on average across the period just under 11 applications (10.65) were submitted for every registered place. This peaked in the 2006/07 academic year when over 18 applications were made to each registered place (18.38:1), a notably higher ratio than the average.
This unusually high ratio was driven by a particularly low number of enrolments (1060), rather than a notably high number of applications (19,478); volumes were consistent with the previous and following academic years (21,738 and 18,606 respectively). From 2008/9 onwards, the ratio of applications to Research Masters to registrations decreased (albeit remained high), but proportions remained relatively consistent across the remainder of the period.
42

Understanding Postgraduate Demand
Taken as an average across the seven year period, approximately 6 applications to PhDs were submitted to every place taken up (6.05:1). In contrast with applications to Research Masters, this ratio was relatively consistent across the period, albeit the proportion of submissions was also at its highest in 2006/07 (6.86:1).
Conversely, the fewest applications to Professional Doctorates were received in 2006/07 when less than two applications were submitted to every registration (1.87:1). The greatest proportions of applications were received in 2008/09 when over 3 applications were received to every enrolment (3.31:1).
2.4.2. Taught Postgraduate (PGT) Programmes
Table 2.3 below shows application to places taken up ratios by PGT qualification type.
Table 2.3: Ratio of applications to places taken up by qualification type (PGT)
Qualification type
Year Base:
Participating HEIs
Base: Applications
Masters Degrees
MBAs Postgraduate Diplomas and Certificates
2005/06 43,754 4.91 2.74 1.51
2006/07 50,823 4.94 3.01 1.63
2007/08
7
59,793 5.02 3.36 1.77
2008/09 126,412 5.36 6.17 1.88
2009/10
13
149,930 5.69 4.22 1.85
2010/11 250,173 5.96 3.36 1.84
2011/12
20
252,754 4.83 2.46 1.73
Across the seven year period, the ratio of PGT applications to registrations was highest for Masters Degrees programmes where approximately 5 applications were received to each enrolment (5.30:1). Comparatively, 3.5 applications were received to each MBA registration (3.48:1) and approximately 2 submissions were received to every registration for a Postgraduate Diploma or Certificate (1.76:1).
For both Masters Degrees and Postgraduate Diplomas and Certificates, the ratio of applications to enrolment was consistent across the period.
43
Understanding Postgraduate Demand
However, Table 2.3 indicates that in 2008/09 the ratio of MBA applications to enrolment was particularly high (6.17:1). Once again this unusually high ratio was driven by a particularly low number of enrolments (-25% in comparison with 2007/8), rather than a notably high number of applications.
2.5. Mode of study
The next section focusses on the volume of applications to PGR and PGT programmes by the intended mode of study. The following section distinguishes between applications made for full-time study, part-time study and ‘other’ modes (which predominantly constitute sandwich courses and distance learning).
There are a few caveats to note in interpreting this data:
A couple of HEIs mentioned that in their experience it is fairly common for a candidate to apply for full-time study initially, but then switch to part-time once their study is underway. The data presented here is just based on preferences expressed at the application stage.
A number of HEIs mentioned that some courses labelled as ‘full-time’ in fact only require students to be present on campus for one or two days per week; these courses would therefore still provide a level of flexibility for students who are also in employment, in a way perhaps typically associated with part-time courses.
Offering flexibility in delivery is a key consideration for many HEIs as they seek to develop their course offerings during increasingly challenging economic times. Many are using a range of tools to enable students to structure their studies in a way that suits them best. As such, some HEIs felt a distinction between full-time and part-time study might be less meaningful in more recent years (and even more so in the future) than it had been in the past.
2.5.1. Postgraduate Research (PGR) Programmes
Figure 2.5 shows that the vast majority of applications to PGR programmes (95 per cent) were to full-time study in each year covered by the research). It also indicates that applications to each mode of study were consistent year on year; applications to full-time study comprised either 94% or 95% of applications each year.
44

Understanding Postgraduate Demand
45
Figure 2.5: Applications by mode of study (PGR)
0%
10%
20%
30%
40%
50%
60%
70%
80%
90%
100%
2005/06 2006/07 2007/08 2008/09 2009/10 2010/11 2011/12
Other
Part-time
Full-time
Base: All applications to PGR programmes where mode of study known (183,625) (05/06: 5,282), (06/07: 6,563), (07/08: 7,639), (08/09: 25,658), (09/10: 30,368), (10/11: 51,478), (11/12: 56,637) Participating HEIs: (05/06 – 07/08: 6), (08/09 – 09/10: 10), (10/11 – 11/12: 17)

Table 2.4: Mode of study according to specific qualification type (PGR)
Qualification type / Mode of Study
PhDs Professional Doctorates Research Masters
Base: Participating
HEIs
Base: Applications F/T P/T Other F/T P/T Other F/T P/T Other
2005/06 5,282 95% 5% <1% 63% 37% 1% 100% <1% <1%
2006/07 6,563 96% 4% <1% 56% 44% <1% 99% 1% <1%
2007/08
6
6,639 95% 5% <1% 65% 35% <1% 99% 1% <1%
2008/09 25,658 96% 3% <1% 73% 27% <1% 99% 1% <1%
2009/10
10
30,368 96% 4% <1% 50% 50% <1% 98% 1% <1%
2010/11 51,478 96% 4% <1% 54% 41% 6% 97% 3% 1%
2011/12
17
56,637 96% 4% <1% 58% 37% 5% 96% 3% 1%
46

Table 2.4 on the previous page shows the breakdown in mode of study by each PGR qualification.
On average, across the seven year period, applications to study full-time accounted for;
98% of Research Masters
96% of PhDs;
58% of Professional Doctorates
Across the seven year period, the vast majority of applications submitted to both PhDs and Research Masters were for intended full time study. For both, these proportions were relatively consistent year on year – although notably nearly 100% of candidates applying in 2005/6 to undertake a Research Masters proposed to study full time.
On average, approximately six in ten applications (58%) made to study Professional Doctorates were for full-time courses but there was some differentiation year on year. In 2008/9 just less than three quarters (73%) of applications were for intended full-time study, but in 2009/10, half of applicants intended to study part-time. Whilst it is difficult to understand why these fluctuations occurred year on year, at a more general level, Professional Doctorates are frequently undertaken mid-career and thus more likely to be conducted on a part-time basis.
47

Understanding Postgraduate Demand
48
2.5.2. Taught Postgraduate (PGT) Programmes
Figure 2.6 below shows the breakdown of applications for PGT programmes by the mode of study applied for.
Figure 2.6: Applications by mode of study (PGT)
0%
10%
20%
30%
40%
50%
60%
70%
80%
90%
100%
2005/06 2006/07 2007/08 2008/09 2009/10 2010/11 2011/12
Other
Part-time
Full-time
Base: All applications to PGT programmes where mode of study known (933,629) (05/06: 43,754), (06/07:50,823), (07/08: 59,792), (08/09:126,412), (09/10:149,930), (10/11:250,164), (11/12:252,754) Participating HEIs: (05/06 – 07/08: 7), (08/09 – 09/10: 13), (10/11 – 11/12: 20)
As seen in relation to PGR applications, the vast majority of applications made to PGT programmes were for full-time study (91%). This has remained consistent across the period; between 89% and 92% of applications were for intended full-time study in each of the seven years.
As an average across the seven years, 8% of applications were submitted for part-time study and just 1% submitted to other study options.

Table 2.5: Mode of study according to specific qualification type (PGT)
Qualification type / Mode of Study
Masters Degrees MBAs
Postgraduate diplomas and certificates
Base: Participating
HEIs
Base: Applications F/T P/T Other F/T P/T Other F/T P/T Other
2005/06 43,754 93% 7% 1% 75% 19% 6% 31% 68% 1%
2006/07 50,823 93% 7% 1% 78% 17% 5% 37% 62% 1%
2007/08
7
59,792 92% 7% 1% 81% 15% 4% 41% 59% <1%
2008/09 126,412 93% 6% 1% 92% 7% 1% 49% 43% 8%
2009/10
13
149,930 93% 6% 1% 89% 10% 1% 46% 47% 7%
2010/11 250,164 95% 5% 1% 88% 11% <1% 46% 49% 5%
2011/12
20
252,754 95% 4% 1% 80% 20% <1% 46% 48% 6%
49

On average, across the seven year period, applications to study full-time accounted for;
94% of Masters Degrees;
84% of MBAs and
44% of Postgraduate Diplomas and Certificates
Between 2005/6 and 2011/12 the proportion of full time applicants to Masters courses were relatively consistent, albeit highest in the two most recent academic years (95%).
There was more variation in relation to MBAs; in 2008/9 92% of submissions were to part time study in comparison with just 75% in 2005/6 when proportionately the least full time applications were received. In the most recent academic year eight out of ten MBA applications were for intended full-time study, slightly lower than the seven year average (84%).
A comparatively smaller proportion of full time applications are submitted to Postgraduate Certificates, peaking in 2008/9 when half of applications (49%) were for intended full time study. However there has been a general increase since 2005/6 when just three in ten applications (31%) were to full time courses, comparatively in the last three years 46% of applications have been consistently made for intended full-time study. Yet, the increase in applications to full time study has been less marked than the decrease in applications to part-time study which between 2005/6 and 2011/12 which declined from representing 68% of applications to Postgraduate Certificates and Diplomas to 48%. Since 2008/9 Applications to ‘Other’ modes of study (such as Distance Learning) became more prominent comprising between 5-8% of applications for the last four years.
2.5.3. Qualitative feedback from HEIs about mode of study
During site visit discussions, HEIs reported mixed experiences of the changes in demand for different modes of postgraduate study. Hence it seems possible that the relatively stable picture in terms of the split between full-time and non-full-time study shown at overall level may disguise more change at the levels of individual HEIs (in both directions).
Several universities felt that they had seen a trend of increasing demand for part-time study. They felt this was driven by financial necessity with reductions in funding available and the economic downturn leading more students to work to support themselves throughout their studies.
However, some other institutions felt they had seen a decrease in the proportion of students studying part-time. This was generally the case where increasing volumes of international students were driving growth in the proportion of applications for full-time study. Table 2.6 and Table 2.7 overleaf support this notion; at both PGR and PGT level, a significantly higher (and consistent) proportion of International and EU candidates apply to full time.
Moreover, some HEIs felt that an increasing attempt to provide courses that employers are prepared to sponsor had led to a decrease in part-time study offers as they felt that employers prefer to release their staff for shorter periods of full-time study.
50

Table 2.6: Mode of study according to Domicile (PGR)
Domicile / Mode of Study
UK domiciled Other EU Non-EU
Base: Participating
HEIs
Base: Applications F/T P/T Other F/T P/T Other F/T P/T Other
2005/06 5,225 86% 14% <1% 96% 4% <1% 98% 2% <1%
2006/07 6,528 87% 12% <1% 96% 4% <1% 98% 2% <1%
2007/08
6
7,579 88% 12% <1% 94% 6% <1% 97% 3% <1%
2008/09 25,481 89% 10% <1% 96% 4% <1% 98% 2% <1%
2009/10
10
30,190 84% 16% <1% 96% 4% <1% 98% 2% <1%
2010/11 50,745 87% 13% 1% 96% 4% <1% 97% 2% <1%
2011/12
17
55,913 87% 12% <1% 96% 3% <1% 97% 2% <1%
51

Understanding Postgraduate Demand
52
Table 2.7: Mode of study according to Domicile (PGT)
Domicile / Mode of Study
UK domiciled Other EU Non-EU
Base: Participating
HEIs
Base: Applications F/T P/T Other F/T P/T Other F/T P/T Other
2005/06 42,543 55% 42% 4% 94% 6% <1% 97% 3% <1%
2006/07 49,475 56% 40% 4% 95% 5% <1% 97% 3% <1%
2007/08
7
58,178 53% 43% 3% 93% 7% <1% 97% 3% <1%
2008/09 123,818 66% 32% 2% 93% 5% 2% 98% 2% <1%
2009/10
13
147,219 64% 34% 2% 92% 6% 1% 98% 2% 1%
2010/11 245,134 64% 34% 2% 93% 6% 1% 98% 1% 1%
2011/12
20
247,052 61% 36% 3% 92% 7% 1% 98% 2% 1%

Chapter 3: Trends in applications by subject area
This chapter provides information on trends in the profile of applications by broad subject area. It looks separately at the subject distribution of PGR and PGT applications.
3.1. Caveats on the data
The data provided on subject area for applications was generally good quality and complete.
For ease of analysis, applications for courses that covered more than one subject area have been classed as ‘unknown and combined subjects’.
It is also worth noting that base sizes for some of the less common subject areas are quite low, particularly in the earlier years of the period covered. This means that some of the analysis on ratios of applications to places taken up for these subjects should be treated as indicative only.
3.2. Application rates by detailed subject breakdown
3.2.1. Applications to Postgraduate Research (PGR) Programmes by subject
Table 3.1 overleaf shows estimates for both the volume and proportions of PGR applications submitted for each subject area in each application year.
53

Understanding Postgraduate Demand
Table 3.1: PGR Applications by Subject Area
2005/06 2006/07 2007/08 2008/09 2009/10 2010/11 2011/12
Base: Participating HEIs
6 10 17
Base: All Applications 5282 6563 7639 25,658 30,368 51,480 56,743
1,515 2,035 6,198 9,005 6,918 7,723 Medicine and Dentistry
1% 1% 3% 4% 4% 4%
5,082 8,107 8,247 11,175 Subjects allied to medicine
3% 4% 5% 6%
4,188 7,878 11,268 10,300 12,436 16,748 17,051 Biological sciences
4% 6% 8% 6% 6% 9% 9%
955 1,167 655 620 Veterinary sciences / agriculture / related subjects 1% 1% <1% <1%
1,624 2,345 2,395 2,977 3,709 4,513 4,871 Chemistry
1% 2% 2% 2% 2% 3% 2%
1,512 1,760 2,752 2,974 2,509 3,006 Physics
1% 1% 1% 1% 1% 2%
2,265 4,434 5,557 4,511 5,482 7,391 8,187 Other physical sciences
2% 3% 4% 2% 2% 4% 4%
3,883 4,129 5,123 6,148 5,755 5,738 5,632 Mathematical sciences
3% 3% 3% 3% 3% 3% 3%
Computer science 4,905 5,993 6,602 6,507 7,821 7,434 7,793
54

Understanding Postgraduate Demand
2005/06 2006/07 2007/08 2008/09 2009/10 2010/11 2011/12
/ librarianship / information science
4% 5% 4% 4% 4% 4% 4%
11,823 15,495 17,627 21,516 26,224 22,374 25,972 Engineering / technology / building / architecture 10% 12% 12% 12% 12% 12% 13%
54,871 52,813 58,139 55,176 63,295 42,118 44,735 Social / political / economic studies 48% 41% 39% 30% 29% 23% 23%
5,608 6,327 7,357 7,712 7,711 6,085 7,253 Law
5% 5% 5% 4% 3% 3% 4%
11,032 15,111 16,503 20,999 24,082 18,992 19,895 Business / administrative studies 10% 12% 11% 11% 11% 11% 10%
1,947 2,857 3,511 7,484 9,398 7,020 7,628 Languages
2% 2% 2% 4% 4% 4% 4%
5,497 4,333 6,070 9,088 12,483 9,264 10,106 Humanities
5% 3% 4% 5% 6% 5% 5%
1,622 2,240 3,060 2,451 2,885 Creative arts / design
1% 1% 1% 1% 1%
1,409 2,237 3,160 4,201 4,887 4,602 5,346 Education
1% 2% 2% 2% 2% 3% 3%
11,447 12,886 7,288 7,002 Unknown and combined subjects
6% 6% 4% 4%
Grey shaded cells indicate where figures have been suppressed due to low base sizes
Across the seven year period, submissions to Social / Political / Economic studies accounted for the largest single proportion of PGR applications representing approximately a third (32%) of all applications received between 2005/6 and 2011/12.
55

Understanding Postgraduate Demand
However, a smaller proportion of applications were submitted Social / Political / Economic studies each year. Between 2005/6 and 2011/1 the proportion of applications made to this area nearly halved from 48% to 23% respectively. That said, this subject area still represented the highest proportion of applications (by some distance) in the most recent academic year.
In addition to this large decrease in the proportion of applications, the data indicates that there has been a steady reduction in the overall volume of applications for to Social / Political / Economic studies from approximately 55,000 in 2005/06 to less than 45,000 in 2011/12 (an 18% decline in numbers over the course of the period)
Following Social / Political / Economic studies, the second highest proportion of PGR applications were submitted to Engineering / Technology / Building / Architecture accounting for 12% of all applications submitted across the period. Across the seven years, the proportion of applications submitted to this subject area gradually increased from 10% in 2005/06 to 13% in 2011/12.
Applications to Business and Administrative studies comprised the third largest proportion of PGR submissions, accounting for 11% per cent of applications submitted across the period.
Applications for Biological sciences increased notably during the 7 year period; they comprised 4% of all PGR applications in 2005/06, but 9% in 2011/12. .
Subjects allied to medicine also increased steadily from representing 3% of PGR applications in 2008/09 to 6% in 2011/12. Table 3.1 indicates that the proportion of applications submitted to the remaining subject areas remained relatively consistent across the seven year period.
3.2.2. Applications to Postgraduate Research (PGT) Programmes by subject
Table 3.2 overleaf shows both the numbers and proportions of PGT applications submitted to each subject area each year.
56
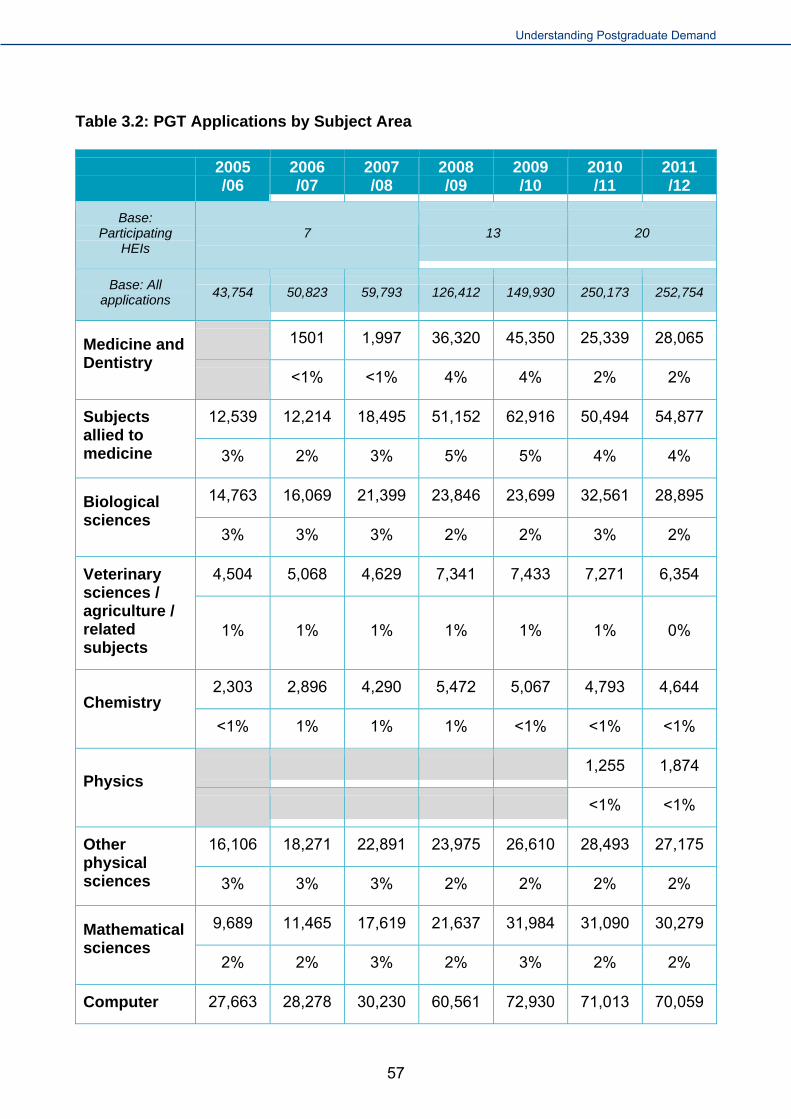
Understanding Postgraduate Demand
Table 3.2: PGT Applications by Subject Area
2005 /06
2006 /07
2007 /08
2008 /09
2009 /10
2010 /11
2011 /12
Base: Participating
HEIs 7 13 20
Base: All applications 43,754 50,823 59,793 126,412 149,930 250,173 252,754
1501 1,997 36,320 45,350 25,339 28,065 Medicine and Dentistry
<1% <1% 4% 4% 2% 2%
12,539 12,214 18,495 51,152 62,916 50,494 54,877 Subjects allied to medicine 3% 2% 3% 5% 5% 4% 4%
14,763 16,069 21,399 23,846 23,699 32,561 28,895 Biological sciences
3% 3% 3% 2% 2% 3% 2%
4,504 5,068 4,629 7,341 7,433 7,271 6,354 Veterinary sciences / agriculture / related subjects
1% 1% 1% 1% 1% 1% 0%
2,303 2,896 4,290 5,472 5,067 4,793 4,644 Chemistry
<1% 1% 1% 1% <1% <1% <1%
1,255 1,874 Physics
<1% <1%
16,106 18,271 22,891 23,975 26,610 28,493 27,175 Other physical sciences 3% 3% 3% 2% 2% 2% 2%
9,689 11,465 17,619 21,637 31,984 31,090 30,279 Mathematical sciences
2% 2% 3% 2% 3% 2% 2%
Computer 27,663 28,278 30,230 60,561 72,930 71,013 70,059
57

Understanding Postgraduate Demand
2005 /06
2006 /07
2007 /08
2008 /09
2009 /10
2010 /11
2011 /12
science / librarianship / information science
6% 5% 5% 6% 6% 6% 5%
50,500 62,247 73,155 126,122 139,792 156,986 158,209Engineering / technology / building / architecture 10% 11% 11% 12% 11% 12% 12%
125,061 135,994 138,004 150,252 170,052 217,639 211,250Social / political / economic studies 25% 24% 21% 15% 14% 17% 16%
31,495 35,194 40,270 81,559 87,191 67,264 64,951 Law
6% 6% 6% 8% 7% 5% 5%
151,685 181,254 230,099 314,082 404,112 430,726 461,705Business / administrative studies 31% 32% 34% 31% 33% 33% 35%
9,645 11,406 13,024 30,904 40,811 43,704 40,782 Languages
2% 2% 2% 3% 3% 3% 3%
14,633 18,243 19,877 26,051 27,449 26,021 23,306 Humanities
3% 3% 3% 3% 2% 2% 2%
7,118 7,916 10,866 12,058 14,290 22,193 22,949 Creative arts / design
1% 1% 2% 1% 1% 2% 2%
13,870 15,649 22,886 32,171 39,736 42,387 39,038 Education
3% 3% 3% 3% 3% 3% 3%
9,996 19,698 28,618 28,198 Unknown and combined subjects 1% 2% 2% 2%
Grey shaded cells indicate where figures have been suppressed due to low base sizes
58

Understanding Postgraduate Demand
Across the seven year period, submissions to Business / Administrative studies accounted for the largest single proportion of PGT applications representing approximately a third (33%) of all applications received between 2005/6 and 2011/12. Table 3.2 indicates that there has been a gradual increase in the proportion of applications submitted to the subject area over the course of the seven year period; submissions to Business / administrative studies represented 31% of all PGT applications in 2005/6 in comparison with 35% in 2011/12.
The second most popular PGT subject area was Social / Political / Economic studies, comprising just less than a fifth of applications (18%) submitted across the seven year period. However, mirroring trends evidenced in PGR submissions, there was also a decline in the associated proportion of applications submitted to Social / Political / Economic studies each year. In 2005/6, a quarter (25%) of all PGR applications were for intended study on Social / Political / Economic courses; by 2011/12 they represented on only 16%. Yet crucially unlike PGR applications, the absolute number of PGT applications to Social / Political / Economic studies did not decline over the period (volumes increased by 69% over the course of the seven years), but notably, as an expression of total applications, it did not increase at the same rate as other subject areas.
On average, 12% of applications submitted across the period were to Engineering / Technology / Building / Architectural courses; Table 3.2 reveals a slight increase in the proportion of applications submitted between 2005/6 and 2011/12.
59

Understanding Postgraduate Demand
3.3. Ratio of application numbers to places taken up by detailed qualification type
3.3.1. Postgraduate Research (PGR) Programmes
Table 3.3 below provides detail on the ratio of applications to places taken up according to specific subject areas within PGR programmes. Scoping all subject areas across all seven years, on average roughly six PGR applications were submitted for every registration (6.12:1).
Table 3.3: Ratio of applications to places taken up by subject area (PGR)
2005/06 2006/07 2007/08 2008/09 2009/10 2010/11 2011/12
Base: Participating HEIs
6 10 16
Base: All
Applications
5,282 6,563 7639 25,658 30,368 44,688 48794
Medicine and Dentistry
3.7 2.7 4.6 3.4 4.2 4.3
Subjects allied to medicine
4.3 3.5 4.6 5.2
Biological sciences
2.3 4.2 4.9 4.2 3.8 5.1 5.1
Veterinary sciences / agriculture / related subjects
9.3 16.0 6.7 5.6 7.2 8.0
Chemistry 2.9 5.5 5.1 4.7 3.9 4.8 5.7
Physics 2.6 3.5 4.0 4.6 4.6 5.3 6.2
Other physical sciences
2.6 7.2 5.8 5.5 5.8 5.3 6.7
Mathematical sciences
5.8 5.9 6.8 8.3 9.4 9.7 7.9
Computer science /
8.4 8.5 10.2 7.6 7.2 6.5 6.5
60

Understanding Postgraduate Demand
2005/06 2006/07 2007/08 2008/09 2009/10 2010/11 2011/12
librarianship / information science
Engineering / technology / building / architecture
4.1 4.9 5.1 5.4 5.1 5.5 6.3
Social / political / economic studies
9.3 11.4 9.6 8.8 8.8 10.6 10.4
Law 11.9 8.5 11.2 9.3 10.8 8.6 13.4
Business / administrative studies
6.8 10.7 12.3 10.6 9.2 8.4 10.4
Languages 4.3 4.1 4.0 3.6 3.6 4.0 4.6
Humanities 3.6 4.3 3.8 3.8 3.0 3.2 3.5
Creative arts / design
2.9 3.1 3.0 3.3 4.0
Education 5.1 6.8 6.9 4.1 3.6 3.4 3.5
Unknown and combined subjects
4.1 4.0 4.7 4.4
Grey shaded cells indicate where figures have been suppressed due to low base sizes
Within almost all subject areas, the ratio of applications to enrolments increased between 2005/06 and 2011/12 (with Veterinary Science20, Computer Science and Education as exceptions).
As Table 3.3 indicates, the ratio of applications to registrations varies quite considerably between subject areas. Across the period, the highest application to enrolment ratios were evidenced in Law (13.4:1), Business Administration (10.4:1) and Social / Political / Economic studies (10.4:1) indicating that although the highest number of applications are
20 A degree of caution should be exercised in the analysis of applications to Veterinary Sciences / Agriculture / related subjects as data presented has been based on notably low unweighted base sizes.
61

Understanding Postgraduate Demand
submitted to these subject areas, proportionately the number of registrations on these courses are relatively low.
As discussed earlier in the chapter, there has been a marked decline over the 7 year period in the number of PGR applications submitted to Social / Political / Economic studies. However, the ratios shown in Table 3.3 demonstrate that throughout the period, the ratio of applications to places taken up has remained relatively consistent and does not appear to bear correlation with the volume of applications received. Hence, this would seem to suggest that the supply of places on these courses has adjusted in line with changes in demand.
Medicine and Dentistry, Subjects Allied to Medicine and Creative Arts and Design showed the three lowest ratios of applications to places taken up within PGR programmes. However, in all three cases the ratio of applications to enrolments increased over the course of the seven years. In 2006/07, the ratio of applications to enrolments for Medicine and Dentistry was 3.7:1, which had increased to 4.3:1 in 2011/12. Similarly, the ratio of applications to enrolments for Subjects allied to Medicine in 2008/09 was 4.3:1, which increased to 5.2:1 in 2011/12. In turn, the ratio of applications to Creative Arts and Design increased from 2.9:1 in 2007/08 to 4:1 in 2011/12.
3.3.2. Taught Postgraduate (PGT) Programmes
Table 3.4 below shows the ratios of applications to places taken up for PGT programmes by subject area.
Table 3.4: Ratio of applications to places taken up by subject area (PGT)
2005/06 2006/07 2007/08 2008/09 2009/10 2010/11 2011/12
Base: Participating HEIs
7 12 18
Base: All applications 42,182 49,071 57,517 120,774 143,186 209,108 209,862
Medicine and Dentistry
7.3 6.6 3.0 3.4 3.2 1.7
Subjects allied to medicine
2.4 2.4 2.4 3.4 3.1 3.2 2.5
Biological sciences
4.0 3.7 3.8 4.1 3.9 4.2 4.0
Veterinary sciences / agriculture / related subjects
5.1 5.5 4.8 5.4 5.3 4.6 5.6
62

Understanding Postgraduate Demand
2005/06 2006/07 2007/08 2008/09 2009/10 2010/11 2011/12
Chemistry 5.0 4.9 4.3 6.7 7.4 7.7 8.2
Physics 4.5 7.5
Other physical sciences
4.2 4.8 4.5 4.8 5.3 5.1 5.2
Mathematical sciences 5.4 6.8 12.2 9.4 5.9 6.8 4.5
Computer science / librarianship / information science
5.1 4.4 4.9 5.1 5.7 6.3 4.6
Engineering / technology / building / architecture
4.7 4.4 4.5 6.1 5.4 5.6 5.4
Social / political / economic studies
5.5 5.6 5.6 5.5 6.4 6.0 5.0
Law 3.9 5.0 5.8 4.2 4.9 5.5 3.5
Business / administrative studies
4.5 4.5 4.7 7.0 6.9 6.9 5.2
Languages 3.0 3.0 3.2 3.5 4.1 5.3 4.2
Humanities 2.4 2.6 2.9 2.9 3.1 3.0 2.8
Creative arts / design
2.2 2.2 2.4 2.8 3.2 3.8 4.3
Education 2.3 2.7 2.6 2.6 2.6 2.5 2.6
Unknown and combined subjects
5.2 4.9 5.0 5.0
Grey shaded cells indicate where figures have been suppressed due to low base sizes
63

Understanding Postgraduate Demand
The ratios of applications to places taken up for Taught programmes were generally slightly lower than for postgraduate Research programmes. Across all subject areas over the seven year period, just less than 5 applications were submitted for each enrolment. (4.8:1).
At an overall level, Table 3.4 indicates that by academic year the peaks in the proportions of applications appear to be unconnected. However, the lowest ratios of applications to enrolments are generally more prevalent in the earlier years of the period (2005/06 and 2006/07) than later.
As was the case for PGR study, the decline in the proportion of applications for Social / Political / Economic studies over the 7 year period was not accompanied by an oscillation in the application to places taken up ratio which stood at between 5:1 and 6:1 in all years apart from 2009/10. Again this indicates that the supply of places on PGT courses in Social / Political / Economic studies has adjusted in line with changes in demand.
Across the period, the highest ratio of applications was for Mathematical Sciences; on average 6.5 applications were received for each registration. Yet, between years these proportions fluctuated more so than any other subject area. In 2007/08 over 12 applications (12.2:1) applications were received for every registration, but in notable contrast, just 4.5 applications (4.5:1) were received to each enrolment in 2011/12.
In 2011/12, the highest ratio of applications to enrolments was for Chemistry, at 8.2:1.The ratio of applications to enrolments had increased year on year since 2007/08. On average across the period, approximately 6.2 Chemistry applications were received for every registration, only exceeded by the overall proportion of applications to Mathematical Sciences.
In 2011/12 the lowest ratio of applications to places taken up was for Medicine and Dentistry; less than two applications were received for every registration (1.7:1), Since 2006/07 the ratio for Medicine and Dentistry had decreased in all years but one (and notably so between 2007/08 and 2008/09). As an average across the period just less than 3 applications were received to each enrolment (2.8:1); only the ratio of applications to Education courses was lower (2.6:1).
3.4. Qualitative feedback from HEIs discussions on the changing nature of demand by subject area
Qualitative discussions with HEIs about their application data confirmed the trends described earlier in this chapter.
HEIs mentioned that increases in the demand for STEM subjects in both PGR and PGT courses had been fuelled both by international and domestic demand. HEIs mentioned a preference among international students (and particularly those from India and China) for STEM subjects (in some cases because they are more likely to receive funding from their own governments for these courses). Some HEIs also felt that an increasing focus on STEM offers was the result of greater reliance on employer sponsorship of postgraduate study (with employers investing in postgraduate study to upskill their workplace being more likely to sponsor courses in the STEM subjects).
64

Understanding Postgraduate Demand
HEIs expressed concern that increases in the demand for STEM subjects was occurring at the expense of subjects such as the arts, humanities and languages. One HEI spoke of the potential loss of “passion” postgraduate taught study, undertaken by students with an interest in the subject area, or out of a general desire to learn more, or explore new fields. To some extent this is evidenced by the decline as a proportion of all applications in demand for Social / Political / Economic studies at both PGR and PGT level. The data collected for this study shows less evidence of a negative impact on demand for other Arts or Humanities subjects.
65

Understanding Postgraduate Demand
Chapter 4: Trends in applications by domicile This chapter provides information on trends in the profile of applications by the domicile of applications i.e. whether they are from students that are UK domiciled, based in other EU countries or in non-EU countries. Again it looks separately at the subject distribution of PGR and PGT applications. Within this, the chapter also analyses trends by domicile within detailed course type and subject area.
4.1. Caveats on the data
In some cases, HEIs did not have the actual domicile available as a field in their applications databases, and so instead the domicile was derived from nationality. Only a very small proportion of records in this field were blank or unknown (0.8% of PGR records and one per cent of PGT records).
However, as mentioned in the introduction to this report, the role of agents in the processing of applications from potential students based outside the EU means might have some impact on the trends shown in demand for postgraduate study. The use of agents is widespread and most HEIs felt that some filtering of applications was conducted by agents so that not all original submissions would appear in the institution’s records. HEIs found it hard to place a figure on the proportion of applications received by an agent that would then be submitted to them – one suggested a figure of around 50%, while others believed that only a very small number would be filtered out. Some qualitative information on the role of agents in postgraduate applications is included at the end of this chapter.
4.2. Application rates by Domicile
4.2.1. Applications to Postgraduate Research (PGR) Programmes by Domicile
Figure 4.1 overleaf shows the volumes of PGR applications by domicile.
This figure shows that, following a general upward trend, in 2010/11 there was a drop in the number of PGR applications across all domicile groups. The number of applications from all three groups then recovered slightly in 2011/12 bringing levels of applications back to the levels seen in 2008/9.
Looking at UK domiciled applications particularly, these experienced a 5% decrease in 2010/11 followed by an 8% increase in 2011/12.
66

Understanding Postgraduate Demand
Figure 4.1: PGR Applications by Domicile (absolute numbers)
0
20000
40000
60000
80000
100000
120000
140000
160000
2005/06 2006/07 2007/08 2008/09 2009/10 2010/11 2011/12
UK domiciled
Other EU
Non-EU
Year UK domiciled Other EU Non-EU
2005/06 17,622 23,775 72,067
2006/07 20,672 22,799 85,605
2007/08 24,727 25,703 98,115
2008/09 33,166 32,081 119,201
2009/10 45,054 37,880 136,868
2010/11 42,945 26,530 108,636
2011/12 46,567 29,313 119,275
Base: All applications to PGR programmes where domicile is known (182,422) (05/06: 5,269), (06/07: 6,543), (07/08: 7,592), (08/09: 25,507), (09/10: 30,243), (10/11: 51,015), (11/12: 56,253) Participating HEIs: (05/06 – 07/08: 6), (08/09 – 09/10: 10), (10/11 – 11/12: 17)
67

Understanding Postgraduate Demand
Applications submitted by non-EU candidates made up the majority of applications to PGR programmes in each of the years covered by the research, demonstrating the reliance of the UK postgraduate sector on the international market. Across the seven years, just less than two thirds (64%) of applications were submitted by non-EU candidates, peaking in 2006/7 and 2007/8. On average, 19% were submitted by UK domiciled candidates and 17% from other EU applicants.
Since 2006/7, Table 4.1 overleaf indicates that there has been a modest decline in the proportion of submissions from both other EU and non-EU candidates across the seven years, contrasted against a more pronounced increase in the proportion of applications from UK domiciled candidates (increasing from 16% to 24% in 2011/12). As discussed in section 4.2.2, an inverse trend can be identified for PGT UK-domiciled submissions.
Table 4.1: Proportion of PGR Applications by Domicile
Year UK domiciled Other EU Non-EU
2005/06 16% 21% 64%
2006/07 16% 18% 66%
2007/08 17% 17% 66%
2008/09 18% 17% 65%
2009/10 20% 17% 62%
2010/11 24% 15% 61%
2011/12 24% 15% 61%
4.2.2. Applications to Taught Postgraduate (PGT) Programmes by Domicile
Figure 4.2 overleaf shows that the numbers of UK domiciled and other EU applications each rose year on year until 2009/10; however, for both groups numbers of applications then fell in 2010/11 and again in 2011/12. The number of applications submitted by UK domiciled candidates decreased by 15% over the two years (with a drop of 8% in both 2010/11 and 2011/12) .
Meanwhile, applications submitted by non-EU candidates increased year on year throughout the period, showing that the small amount of overall growth for PGT applications in 2010/11 (see Table 2.1) was driven entirely by continued growth in non-EU applications, and masked a fall in applications from the other two domiciles.
Figure 4.2: PGT Applications by Domicile (absolute numbers)
68

Understanding Postgraduate Demand
0
200,000
400,000
600,000
800,000
1,000,000
1,200,000
2005/06 2006/07 2007/08 2008/09 2009/10 2010/11 2011/12
UK domiciled
Other EU
Non-EU
Year UK domiciled Other EU Non-EU
2005/06 89,489 65,219 330,410
2006/07 97,566 75,072 382,881
2007/08 112,848 85,038 461,182
2008/09 189,194 117,039 696,116
2009/10 210,068 143,960 855,078
2010/11 194,090 120,119 962,042
2011/12 178,693 112,604 1,000,515
Base: All applications to PGT programmes where domicile is known (924,289) (05/06: 42,991), (06/07: 49,977), (07/08: 58,694), (08/09: 124,918), (09/10: 148,423), (10/11: 248,296), (11/12: 250,990) Participating HEIs: (05/06 – 07/08: 7), (08/09 – 09/10: 13), (10/11 – 11/12: 20)
Applications submitted by non-EU candidates represented the largest proportion of applications in each year and accounted for an even greater proportion of all applications
69

Understanding Postgraduate Demand
than was the case for PGR study. As an average across the seven year period, applications submitted by non-EU students accounted for 71% of all PGT applications. Moreover, the proportion of applications received from non-EU candidates has increased rapidly in the last few years, peaking in 2011/12 when non-EU submissions constituted over three quarters of all applications (77%).
In contrast to UK PGR applications, PGT submissions from UK domiciled students decreased year on year since 2008/09 when the proportion of UK domiciled applications peaked at 19%. In the most recent academic year, only 14% of applications were submitted by UK domiciled candidates.
There was also a general decline in the proportion of applications submitted by other EU candidates over the period, with the most notable drop occurring between 2009/10 (12%) and 2010/11 (9%). A two percentage point drop was also evident for PGR applications between these two years.
Table 4.2: Proportion of PGT Applications by Domicile
Year UK domiciled Other EU Non-EU
2005/06 18% 13% 68%
2006/07 18% 14% 69%
2007/08 17% 13% 70%
2008/09 19% 12% 69%
2009/10 17% 12% 71%
2010/11 15% 9% 75%
2011/12 14% 9% 77%
70

Understanding Postgraduate Demand
4.3. Ratio of application numbers to places taken up by domicile
4.3.1. Postgraduate Research (PGR) Programmes
Figure 4.3 below indicates that the ratio of applications to places taken up varies by domicile indicating that the postgraduate population does not entirely reflect the profile of applications.
Figure 4.3: Percentage of Applications to PGR Programmes Leading to Enrolment According to Domicile
40%37%
35% 37%
41%
36%
33%
19%17% 17%
20% 20%18% 18%
11%
8% 8%10% 10% 10% 9%
0%
10%
20%
30%
40%
50%
60%
2005/06 2006/07 2007/08 2008/09 2009/10 2010/11 2011/12
UK domiciled
Other EU
Non-EU
Base: All applications to PGR programmes where enrolment status is yes/no (167,681) (05/06: 5,269), (06/07: 6,543), (07/08: 7,592), (08/09:25,507), (09/10: 30,243), (10/11:44,223), (11/12: 48,304) Participating HEIs: (05/06 – 07/08: 6), (08/09 – 09/10: 10), (10/11 – 11/12: 16)
In all 7 years, although applications for PGR programmes were most likely to be submitted by non-EU candidates, applications from this group were the least likely to lead to enrolment. On average, just 9% of non-EU applications led to a registration, the same proportion as in the most recent academic year; in 2005/6 the highest proportion of applications resulted in an enrolment, at 11%.
Applications submitted by UK domiciled students are considerably more likely to result in a registration; 37% of applications resulted in enrolment. There was some fluctuation year on year however; at most 41% of applications led to registration (2009/10) but only a third (33%) of applications submitted in 2011/12 did so.
71

Understanding Postgraduate Demand
As an average across the period, a fifth (18%) of applications submitted by other EU candidates resulted in enrolment. This was relatively consistent across the period, at least 17% of applications led to registration and 20% at most.
4.3.2. Taught Postgraduate (PGT) Programmes
Figure 4.4 below shows the same analysis of the proportion of applications that result in places taken up by domicile for PGT programmes
Figure 4.4: Percentage of Applications to PGT Programmes Leading to Enrolment According to Domicile
55%54% 54%
46% 45%48%
54%
28% 26% 26% 25% 24%25%
35%
14% 15% 14%12% 12% 12%
16%
0%
10%
20%
30%
40%
50%
60%
2005/06 2006/07 2007/08 2008/09 2009/10 2010/11 2011/12
UK domiciled
Other EU
Non-EU
Base: All applications to PGT programmes where enrolment status is yes/no (855,909) (05/06: 42,991), (06/07:49,997), (07/08: 58,694), (08/09:124,264), (09/10:147,431), (10/11:215,498), (11/12:217,034) Participating HEIs: (05/06 – 07/08: 7), (08/09 – 09/10: 12), (10/11 – 11/12: 18)
As with PGR applications, submissions to PGT programmes submitted by UK domiciled applicants were much more likely to lead to enrolment than those submitted by other EU or non-EU applicants. On average, 51% of PGT applications submitted by Home candidates between 2005/06 and 2011/12 resulted in enrolment; in comparison with 27% of other EU applications and 14% of non-EU submissions.
In contrast to PGR trends, in the three most recent academic years there has been a notable increase in the proportion of enrolments made by UK domiciled students, rising from 45% in 2009/10 to 54% in 2011/12. This increase had been preceded by a sharp decline in the proportion of enrolments made between 2007/8 and 2008/09 when the percentage of registrations dropped from 54% to 46%.
72

Understanding Postgraduate Demand
However, an even more dramatic increase was evidenced for other EU applications between 2010/11 and 2011/12. In the space of a single academic year, the percentage of other EU applications resulting in enrolment increased from a quarter (25%) to over a third (35%). In comparison, at PGR level, the proportion of other EU enrolments had remained consistent during these two academic years (18% respectively).
A smaller increase in the conversion rate of non-EU PGT enrolments was evidenced in the two most recent academic years; in 2010/11 12% of applications resulted in registration, in 2011/12 this has increased to 16%.
73

Understanding Postgraduate Demand
4.3.3. Trends in PGR Applications by Domicile by Course Type
Table 4.3 provides a breakdown by domicile of the proportion of applications submitted to each PGR qualification.
Table 4.3: Proportion of PGR Applications by Domicile by Course Type
Year
2005
/06
2006
/07
2007
/08
2008
/09
2009
/10
2010
/11
2011
/12
Base: Participating HEIs 6 10 17
Base: All applications 5,269 6,543 7,592 25,507 30,243 51,015 56,253
PhDs 80% 83% 86% 87% 86% 88% 86%
Professional doctorates
1% 2% 1% 2% 3% 3% 3% All
Research Masters 19% 15% 13% 11% 11% 10% 10%
PhDs 88% 87% 90% 87% 84% 86% 83%
Professional doctorates
6% 6% 5% 6% 9% 7% 9% UK domiciled
Research Masters 7% 7% 5% 7% 7% 7% 8%
PhDs 70% 75% 78% 82% 83% 85% 84%
Professional doctorates
1% <1% 1% 1% 1% 1% 2% Other EU
Research Masters 29% 25% 22% 17% 16% 14% 14%
PhDs 81% 85% 87% 88% 88% 89% 88%
Professional doctorates
1% 1% 1% 1% 1% 2% 2% Non-EU
Research Masters 19% 14% 12% 10% 11% 9% 10%
74

Understanding Postgraduate Demand
As reported earlier in Chapter 2, there was a 9% decrease in applications to Research Masters programmes submitted between 2005/6 and 2011/12. It is evident from Table 4.1 above that this decrease has been driven by the proportionate decline in applications submitted by UK domicled candidates who submit the bulk (64%) of all PGR applications). Moreover, proportionately fewer other EU candidates were submitting applications to Research Masters however applications numbers are comparatively small.
Furthermore, the increase in applications to PhDs is also predominantly the result of the increase in the proportion of applications submitted by non-EUl students to this qualification type (rising from 81% to 88% across the period). Combined with the proportionate increase in applications from other EU students, this offsets the decrease in Home applications to PhDs.
4.3.4. Trends in PGT Applications by Domicile by Course Type
Figure 4.4 below shows a breakdown in PGT qualifications applied for by domicile.
Table 4.4: Proportion of PGT Applications by Domicile by Course Type
Year
2005
/06
2006
/07
2007
/08
2008
/09
2009
/10
2010
/11
2011
/12
Base: Participating HEIs 7 13 20
Base: All applications 42,991 49,977 58,694 124,918 148,423 248,296 250,990
Masters degrees 91% 91% 90% 91% 92% 93% 93%
Masters of Business
Administration 4% 5% 4% 4% 3% 2% 3%
All
Postgraduate certs and diplomas
5% 5% 5% 5% 5% 4% 5%
Masters degrees 73% 75% 74% 85% 83% 79% 74%
Masters of Business
Administration 6% 6% 5% 2% 2% 2% 2% UK
domiciled
Postgraduate certs and diplomas
21% 19% 21% 13% 15% 19% 24%
75

Understanding Postgraduate Demand
Year
2005
/06
2006
/07
2007
/08
2008
/09
2009
/10
2010
/11
2011
/12
Masters degrees 98% 98% 97% 95% 96% 95% 94%
Masters of Business
Administration 1% 1% 1% 1% 1% 1% 1%
Other EU
Postgraduate certs and diplomas
2% 2% 1% 4% 3% 4% 4%
Masters degrees 95% 93% 93% 93% 94% 96% 96%
Masters of Business
Administration 4% 5% 5% 5% 4% 3% 3%
Non-EU
Postgraduate certs and diplomas
1% 2% 2% 2% 2% 2% 2%
The vast majority of applications submitted by all PGT candidates were for intended study on Masters courses. Expressed as a proportion of total applications, the highest percentage of applications submitted to Masters courses were made by other EU students constituting 96% of applications submitted across the period. This was followed closely by Non-EU students; 94% of applications submitted by Non-EU students were for intended study on Masters degree programmes. Approximately eight in ten applications (78%) submitted by UK domiciled candidates were for proposed study on Masters programmes; a high but noticeably lower proportion than foreign students.
Moreover, whilst the proportion of other EU and non-EU applications to Masters courses remained relatively consistent across the period, there was some oscillation evident in the proportion of applications submitted by UK domiciled students between years. The highest proportions of UK domiciled applications were submitted in 2008/9 when Masters applications represented 85% of all submissions, however by 2011/12 this had declined to 74%.
UK domiciled candidates were however significantly more likely to submit applications to study towards postgraduate certificates and diplomas, representing just less than a fifth (19%) of UK domiciled applications across the period. Comparatively just 3% of other EU and 2% of non-EU applications were for study on such courses. Again, there is some evidence of fluctuation; in 2008/9 when the proportion of UK domiciled submissions to Masters programmes was at its peak, applications towards postgraduate certificates and
76

Understanding Postgraduate Demand
diplomas were at the lowest (13%). Yet, by 2011/12, they represented a quarter of applications (24%).
4.3.5. Trends in PGR Applications by Domicile By Subject
Table 4.5 below shows proportions of PGR applications for each subject area split by domicile.
Table 4.5: Proportion of PGR Applications split by Subject Area within Domicile
Year
2005
/06
2006
/07
2007
/08
2008
/09
2009
/10
2010
/11
2011
/12
Base: Participating HEIs 6 10 17
Base: All applications 5,269 6,543 7,592 25,507 30,243 51,015 56,253
Medicine and dentistry 2% 2% 3% 6% 8% 6% 6%
Subjects allied to Medicine 1% <1% <1% 5% 7% 7% 9%
Biological sciences 9% 15% 16% 9% 10% 15% 16%
Veterinary Sciences / agriculture / related subjects
<1% <1% <1% <1% <1% <1% <1%
Chemistry 5% 4% 3% 3% 2% 4% 4%
Physics 5% 4% 3% 3% 2% 2% 3%
Other physical sciences 4% 6% 6% 4% 4% 8% 7%
Mathematical sciences 4% 3% 3% 3% 2% 2% 2%
Computer science / librarianship / info science
3% 3% 3% 2% 2% 3% 2%
Engineering / technology / building / architecture
13% 13% 13% 11% 10% 10% 8%
Social / political / economic studies
30% 25% 24% 19% 17% 13% 13%
Law 4% 4% 4% 4% 3% 2% 2%
Business / administrative studies
6% 7% 6% 4% 4% 4% 4%
UK
do
mic
iled
Languages 3% 4% 5% 7% 7% 5% 6%
77

Understanding Postgraduate Demand
Year
2005
/06
2006
/07
2007
/08
2008
/09
2009
/10
2010
/11
2011
/12
Humanities 8% 6% 7% 8% 10% 9% 8%
Creative arts / design 2% 3% 3% 3% 4% 3% 3%
Education 1% 2% 1% 2% 2% 3% 3%
Unknown and combined subjects
1% <1% - 5% 5% 3% 3%
Medicine and dentistry <1% <1% <1% 2% 2% 2% 2%
Subjects allied to Medicine <1% - <1% 1% 2% 3% 4%
Biological sciences 2% 5% 6% 4% 5% 7% 9%
Veterinary Sciences / agriculture / related subjects
<1% - <1% <1% <1% <1% <1%
Chemistry 1% 1% 1% 1% 1% 2% 2%
Physics 1% 1% 1% 1% 1% 1% 1%
Other physical sciences 1% 1% 2% 1% 1% 3% 4%
Mathematical sciences 3% 4% 4% 4% 4% 4% 4%
Computer science / librarianship / info science
4% 4% 3% 3% 3% 4% 4%
Engineering / technology / building / architecture
6% 6% 6% 6% 7% 7% 8%
Social / political / economic studies
61% 57% 56% 44% 42% 37% 35%
Law 5% 5% 5% 5% 4% 3% 4%
Business / administrative studies
8% 10% 10% 11% 10% 10% 7%
Languages 1% 1% 1% 3% 3% 4% 3%
Humanities 5% 4% 4% 5% 7% 6% 6%
Oth
er E
U
Creative arts / design 1% 1% 1% 1% 1% 1% 1%
78

Understanding Postgraduate Demand
Year
2005
/06
2006
/07
2007
/08
2008
/09
2009
/10
2010
/11
2011
/12
Education <1% <1% 1% 1% 1% 1% 1%
Unknown and combined subjects
<1% - - 5% 6% 4% 4%
Medicine and dentistry 1% 1% 1% 3% 3% 3% 3%
Subjects allied to Medicine <1% <1% <1% 2% 3% 4% 5%
Biological sciences 3% 4% 6% 5% 5% 6% 6%
Veterinary Sciences / agriculture / related subjects
<1% <1% <1% 1% 1% <1% <1%
Chemistry 1% 2% 2% 1% 2% 2% 2%
Physics 1% 1% 1% 1% 1% 1% 1%
Other physical sciences 2% 3% 3% 2% 2% 3% 3%
Mathematical sciences 3% 3% 3% 3% 2% 3% 3%
Computer science / librarianship / info science
5% 5% 5% 4% 4% 5% 5%
Engineering / technology / building / architecture
11% 13% 13% 13% 14% 15% 16%
Social / political / economic studies
49% 40% 39% 29% 29% 25% 24%
Law 5% 5% 5% 4% 4% 4% 4%
Business / administrative studies
11% 13% 13% 13% 13% 13% 13%
Languages 1% 2% 2% 3% 3% 3% 3%
Humanities 4% 3% 3% 4% 4% 4% 4%
Creative arts / design 1% 1% 1% 1% 1% 1% 1%
Education 2% 2% 3% 3% 2% 3% 3%
No
n-E
U
Unknown and combined subjects
<1% <1% <1% 7% 6% 4% 4%
79

Understanding Postgraduate Demand
Applications submitted by UK domiciled candidates tended to be spread more evenly across a broader range of subjects, whereas applications submitted by other EU and non-EU candidates tended to be more strongly focused on a particular subject area.
Namely, over the seven year period, on average 47% of other EU applications and 33% of non-EU applications were intended for study on Social / Political / Economic programmes. Comparatively among UK domiciled applications, submissions to the same subject area represented 20% of applications (making it the most popular subject area amongst UK domiciled students also). Despite its prominent popularity, there was a comparatively more diverse spread of submissions made to other subject areas.
As Table 4.5 indicates, it is apparent that the decline in applications submitted to Social / Political / Economic studies is evidenced in a reduced number of submissions made by applicants based in all three domiciles. Over the 7 year period, in each group of candidates, the proportion of applications to this area has approximately halved.
As described in Chapter 3, across all three domiciles, the second highest proportion of PGR applications were submitted to Engineering / Technology / Building / Architecture courses accounting for 12% of all applications submitted across the period. Proportionately, non-EU candidates submitted the most applications to this area on average representing 14% of all non-EU applications. Table 4.5 indicates that recently this proportion had increased; 16% of International applications were for intended study on such programmes in 2011/12 in comparison with 11% in 2005/6. Conversely, the proportion of UK domiciled applications has recently decreased; in 2011/12 only 8% of applications were submitted to Engineering / Technology / Building / Architecture courses in comparison with 13% in 2005/6.
Table 4.5 also indicates that the increase in applications to Biological Sciences is evidenced across applications submitted by candidates from all three domicile groups.
Overall, applications to Business and Administrative studies comprise the third largest proportion of PGR submissions, accounting for 11% per cent of applications submitted across the period. Table 4.3 indicates that this area is considerably more popular amongst non-EU candidates; on average 13% of applications were made to this area, in comparison with 9% of other EU submissions and 5% of Home applications.
80

Understanding Postgraduate Demand
4.3.6. Trends in PGT Applications by Domicile By Subject
Table 4.6 shows proportions of PGT applications for each subject area split by domicile.
Table 4.6: Proportion of PGT Applications split by Subject Area within Domicile
Year
2005
/06
2006
/07
2007
/08
2008
/09
2009
/10
2010
/11
2011
/12
Base: Participating HEIs 7 13 20
Base: All applications 42,991 49,977 58,694 124,918 148,243 248,296 250,990
Medicine and dentistry <1% <1% <1% 8% 10% 5% 7%
Subjects allied to Medicine
6% 4% 6% 12% 14% 12% 16%
Biological sciences 4% 4% 5% 4% 4% 5% 6%
Veterinary Sciences / agriculture / related subjects
1% 1% 1% 1% 1% 1% 1%
Chemistry <1% <1% <1% <1% <1% <1% <1%
Physics - - <1% <1% <1% <1% <1%
Other physical sciences
5% 5% 5% 3% 3% 3% 3%
Mathematical sciences 1% 1% 1% 2% 2% 2% 2%
Computer science / librarianship / info science
3% 3% 3% 5% 4% 4% 3%
Engineering / technology / building / architecture
8% 9% 9% 8% 6% 7% 6%
Social / political / economic studies
21% 19% 17% 17% 15% 19% 17%
Law 8% 6% 6% 7% 7% 6% 5%
UK
do
mic
iled
Business / administrative studies
24% 26% 27% 14% 13% 13% 14%
81

Understanding Postgraduate Demand
Year
2005
/06
2006
/07
2007
/08
2008
/09
2009
/10
2010
/11
2011
/12
Languages 4% 4% 3% 5% 4% 4% 4%
Humanities 6% 7% 5% 6% 5% 5% 5%
Creative arts / design 4% 3% 4% 3% 3% 4% 4%
Education 6% 6% 7% 7% 7% 9% 8%
Unknown and combined subjects
<1% <1% - 1% 1% 1% 1%
Medicine and dentistry <1% <1% <1% 3% 3% 2% 2%
Subjects allied to Medicine
1% <1% 1% 4% 5% 4% 4%
Biological sciences 3% 2% 2% 2% 2% 3% 2%
Veterinary Sciences / agriculture / related subjects
1% 1% 1% 1% 1% 1% 1%
Chemistry <1% <1% <1% <1% <1% <1% <1%
Physics - - <1% - <1% <1% <1%
Other physical sciences
2% 2% 2% 2% 1% 2% 2%
Mathematical sciences 2% 3% 3% 2% 3% 3% 4%
Computer science / librarianship / info science
5% 4% 4% 5% 5% 5% 5%
Engineering / technology / building / architecture
10% 9% 9% 9% 9% 11% 12%
Social / political / economic studies
35% 35% 30% 23% 22% 22% 23%
Law 8% 8% 8% 15% 13% 9% 10%
Oth
er E
U
Business / administrative studies
23% 25% 30% 24% 25% 24% 24%
82

Understanding Postgraduate Demand
Year
2005
/06
2006
/07
2007
/08
2008
/09
2009
/10
2010
/11
2011
/12
Languages 2% 3% 2% 4% 4% 3% 3%
Humanities 3% 4% 4% 3% 3% 3% 3%
Creative arts / design 1% 1% 1% 1% 1% 2% 2%
Education 2% 2% 2% 2% 2% 2% 2%
Unknown and combined subjects
<1% - - 1% 1% 2% 2%
Medicine and dentistry <1% <1% <1% 2% 2% 1% 1%
Subjects allied to Medicine
2% 2% 2% 3% 3% 2% 2%
Biological sciences 3% 3% 3% 2% 2% 2% 2%
Veterinary Sciences / agriculture / related subjects
1% 1% 1% 1% 1% <1% <1%
Chemistry 1% 1% 1% 1% 1% <1% <1%
Physics <1% <1% <1% <1% <1% <1% <1%
Other physical sciences
3% 3% 3% 2% 2% 2% 2%
Mathematical sciences 2% 2% 3% 2% 3% 2% 2%
Computer science / librarianship / info science
6% 6% 5% 7% 7% 6% 6%
Engineering / technology / building / architecture
11% 12% 12% 14% 13% 13% 13%
Social / political / economic studies
25% 23% 20% 13% 13% 16% 15%
Law 6% 6% 6% 7% 6% 4% 4%
No
n-E
U
Business / administrative studies
34% 35% 37% 37% 39% 39% 41%
83

Understanding Postgraduate Demand
Year
2005
/06
2006
/07
2007
/08
2008
/09
2009
/10
2010
/11
2011
/12
Languages 1% 1% 2% 3% 3% 3% 3%
Humanities 2% 2% 2% 2% 1% 1% 1%
Creative arts / design 1% 1% 1% 1% 1% 1% 1%
Education 2% 2% 3% 2% 2% 2% 2%
Unknown and combined subjects
<1% - <1% 1% 2% 2% 2%
Aforementioned in Chapter 3, across the seven year period, submissions to Business / Administrative studies accounted for the largest single proportion of PGT applications representing approximately a third (33%) of all applications. This subject area is the most popular across all three domiciles, but notably so amongst non-EU candidates. On average, across the seven year period 38% of applications were for intended study in this area. Comparatively, one quarter (25%) of all other EU applications were to this subject area alongside 19% of UK domiciled applications.
Table 4.6 indicates that whilst non-EU applications to Business / Administrative studies have generally increased year on year (peaking in the most recent academic year, comprising 41% of submissions), proportionately UK domiciled applications have decreased over the course of the period and dramatically so between 2007/8 and 2008/9 (from 27% to 14%). Despite this, as explored in Chapter 2, at an overall level the proportion of PGT applications has remained relatively consistent throughout the period, increasing slightly in recent years. This serves as a nod to the sheer volume of non-EU applications received and the ensuring influence they bear on overall trends.
Also as discussed Chapter 3, the second most popular subject area overall was Social / Political / Economic studies, despite the downward trend in applications across the course of the seven years. Reflecting the trend identified at PGR level, there was a decline in the number of applications submitted by candidates based in all three domiciles across the period, albeit it was less pronounced for UK domiciled applicants.
Table 4.6 indicates that there has been considerable growth in the proportion of PGT applications submitted by UK domiciled candidates for both Medicine and Dentistry and Subjects allied to medicine (this growth was not really evident among other EU and non-EU applications). In 2011/12 16% of PGT applications from UK domiciled students were for subjects allied to medicine (making it the second largest recipient of applications submitted by UK domiciled candidates). It is probable that this increase may be connected to the increase in applications that has been reported by HEIs for NHS postgraduate CPD programmes.
84

Understanding Postgraduate Demand
As previously discussed 12% of applications submitted across the period were to Engineering / Technology / Building / Architectural courses and a slight overall increase in the proportion of applications submitted between 2005/6 and 2011/12 is apparent. This increase is again driven by the proportionate increase in applications received from non-EU and other EU students; Table 4.6 reveals a decline in UK domiciled applications.
4.4. Qualitative findings from HEIs discussions regarding use of overseas agents
As mentioned at the beginning of this chapter, many of the institutions who shared their application data make use of agents to attract and process applications for postgraduate study from some countries.
One of the key benefits that HEIs see in using agents is that it gives them the opportunity to cover far larger areas, and a greater number of areas, when recruiting students. The local contacts and knowledge of agents was described as being extremely valuable. They are particularly able to help in countries where individuals are generally not well informed about education opportunities, and may have limited resources to research options (for example in countries where home internet access is not commonplace). Agents are also seen as essential in countries where travel is very difficult.
The number of agents that are used, their geographical spread, and the proportion of applications they account for varies from HEI to HEI. Use of agents also differs according to the overseas territory, with use of agents being very popular in some areas, and unheard of in others. Two HEIs cited the USA as an example of a country where agents are not used. Others stated that use of agents was less common in markets such as Hong Kong and Singapore, where students tend to be very well informed about their educational opportunities, and are often more equipped to do their own research and applications.
In most cases, the HEIs seem to have a rolling contract with each agency, that can be renewed or cancelled depending on performance. Some HEIs seem to have a closer relationship than others with their agents – in these cases terms such as ‘partner’ and ‘representative’ were used often, rather than ‘agent.’
Most HEIs indicated that they are very selective about which agents to use, and employ tight monitoring procedures; several mentioned ending contracts with agents who were not seen to be performing adequately. In most cases, agents seem to work closely with the universities’ International Officers and regional offices, helping to ensure the quality of the agents’ work, and that the HEI is being properly represented to potential students. Two HEIs had specific website interfaces or portals for use by their official agents (as a way of filtering out any unofficial agent approaches).
4.4.1. What do agents do?
A key role of agents appears to be in guiding and informing the candidates in their choice of HEI, as well as assisting with the actual application process; agents often represent multiple HEIs (sometimes from multiple countries) and so can advise applicants on the most suitable place for them to go. It was noted that agents tend to be more involved with applications for PGT courses than with PGR study.
85

Understanding Postgraduate Demand
HEIs reported that agents often offer candidates help with filling out the application forms. One HEI mentioned instances of agents filling in forms entirely for candidates; it is believed that some candidates (or their families) feel that the candidate will have a better chance of success if the application is written by ‘a professional.’
HEIs felt that agents can perform a valuable role in checking that forms are correctly filled in and that candidates have the correct documentation, prior to submitting the application to an HEI. A number of institutions also mentioned that their agents will filter applications for quality (e.g. checking minimum qualifications, or assessing a candidate’s likelihood of gaining a visa); this appears to be widely encouraged by HEIs, as it cuts down on unnecessary administration for the central admissions team.
4.4.2. How are agents paid?
The majority of agents are paid commission on the successful enrolment of a student. However, one HEI also mentioned offering other performance related bonuses – for example, to reward particularly high volume or high quality applications, or applications for hard-to-reach subject areas.
4.4.3. Impact of agents on applications
It is dependent on individual markets and HEIs as to whether the majority of overseas applications come through an agent or are made direct. Agents can have a particularly crucial effect for HEIs with poor international name recognition – students themselves might not think of going there, but an agent can advise them, recommend that HEI, and tell them about the sort of experience they can hope to get there. For HEIs with higher name or brand recognition, agents were felt to have less of an impact on applications; and those HEIs with the very highest level of name and brand recognition tended not to use agents at all.
Among the different HEIs who shared their data for this exercise, there was variety in the proportion of their non-EU applications that they felt came through agents – figures given ranged from approximately 25% to 75% of applications being submitted via an agent. The most common proportion given was around 50%. However institutions were often unsure of the exact figures.
Some HEIs mentioned activities that they had undertaken to try to encourage agents to place more applications with their institution. These included arranging training sessions for agents in order to improve their knowledge of the HEI and the types of applications they are looking for. Some HEIs had also arranged agent events, such as inviting groups of top agents to visit the university campus in the UK, thus helping to build the relationship between the HEI and their agent, as well as giving the agents first-hand experience of the institution to report back to potential overseas students – and potentially an extra incentive to continue to send students there.
Some HEIs mentioned that they were currently reviewing their use of agents and that they might look to reduce this in the future (to avoid the costs of paying commission).
86
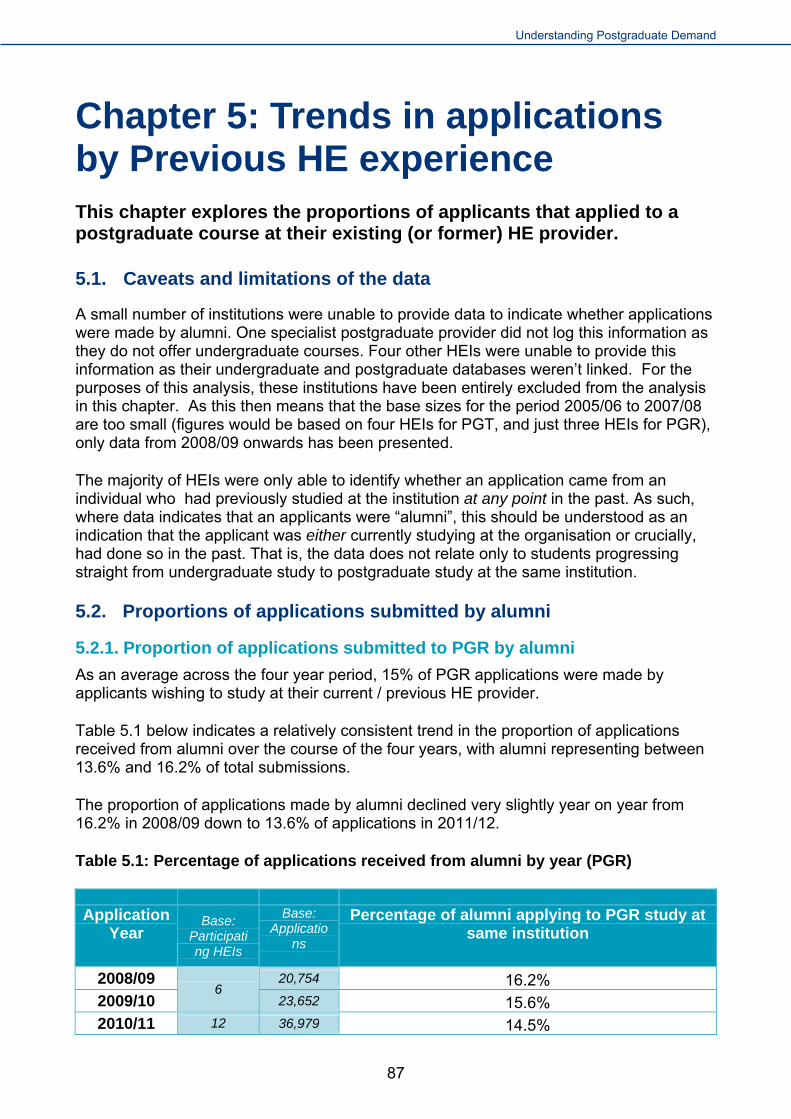
Understanding Postgraduate Demand
Chapter 5: Trends in applications by Previous HE experience This chapter explores the proportions of applicants that applied to a postgraduate course at their existing (or former) HE provider.
5.1. Caveats and limitations of the data
A small number of institutions were unable to provide data to indicate whether applications were made by alumni. One specialist postgraduate provider did not log this information as they do not offer undergraduate courses. Four other HEIs were unable to provide this information as their undergraduate and postgraduate databases weren’t linked. For the purposes of this analysis, these institutions have been entirely excluded from the analysis in this chapter. As this then means that the base sizes for the period 2005/06 to 2007/08 are too small (figures would be based on four HEIs for PGT, and just three HEIs for PGR), only data from 2008/09 onwards has been presented.
The majority of HEIs were only able to identify whether an application came from an individual who had previously studied at the institution at any point in the past. As such, where data indicates that an applicants were “alumni”, this should be understood as an indication that the applicant was either currently studying at the organisation or crucially, had done so in the past. That is, the data does not relate only to students progressing straight from undergraduate study to postgraduate study at the same institution.
5.2. Proportions of applications submitted by alumni
5.2.1. Proportion of applications submitted to PGR by alumni
As an average across the four year period, 15% of PGR applications were made by applicants wishing to study at their current / previous HE provider.
Table 5.1 below indicates a relatively consistent trend in the proportion of applications received from alumni over the course of the four years, with alumni representing between 13.6% and 16.2% of total submissions.
The proportion of applications made by alumni declined very slightly year on year from 16.2% in 2008/09 down to 13.6% of applications in 2011/12.
Table 5.1: Percentage of applications received from alumni by year (PGR)
Application
Year Base:
Participating HEIs
Base: Applicatio
ns
Percentage of alumni applying to PGR study at same institution
2008/09 20,754 16.2% 2009/10
6 23,652 15.6%
2010/11 12 36,979 14.5%
87

Understanding Postgraduate Demand
Application
Year Base:
Participating HEIs
Base: Applicatio
ns
Percentage of alumni applying to PGR study at same institution
2011/12 40,530 13.6% 5.2.2. Proportion of applications submitted to PGT by alumni
By comparison to PGR applications, a lower proportion of applications for PGT study were accounted for by alumni. Since 2008/09, on average just 5.1% of PGT applications were made by individuals wishing to study at their current or previous HE provider. This lower proportion could be due to the fact that choice of taught postgraduate courses is less dependent upon existing relationships with tutors than is often the case for research courses.
As Table 5.2 below shows, this proportion remained relatively consistent over the first two of the years covered in this section (at around 6%). As was the case for PGR applications, this proportion then decreased from 2010/11 onwards. In 2011/12 applications from alumni represented just 4.2% of total applications.
Table 5.2: Percentage of applications received from alumni by year (PGT)
Application
Year Base:
Participating HEIs
Base: Application
s
Percentage of alumni applying to PGT at same institution
2008/09 99,516 6.0%
2009/10 9
114,557 5.7%
2010/11 179,429 4.8%
2011/12 15
181,459 4.2%
88
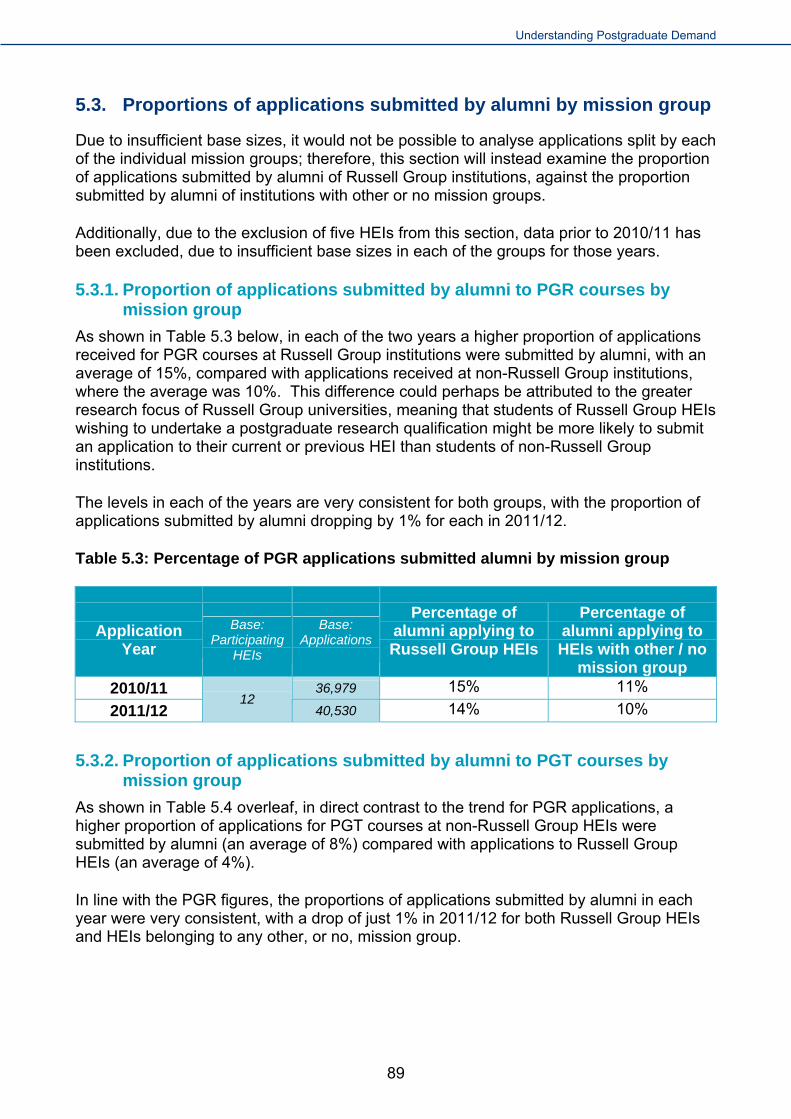
Understanding Postgraduate Demand
5.3. Proportions of applications submitted by alumni by mission group
Due to insufficient base sizes, it would not be possible to analyse applications split by each of the individual mission groups; therefore, this section will instead examine the proportion of applications submitted by alumni of Russell Group institutions, against the proportion submitted by alumni of institutions with other or no mission groups.
Additionally, due to the exclusion of five HEIs from this section, data prior to 2010/11 has been excluded, due to insufficient base sizes in each of the groups for those years.
5.3.1. Proportion of applications submitted by alumni to PGR courses by mission group
As shown in Table 5.3 below, in each of the two years a higher proportion of applications received for PGR courses at Russell Group institutions were submitted by alumni, with an average of 15%, compared with applications received at non-Russell Group institutions, where the average was 10%. This difference could perhaps be attributed to the greater research focus of Russell Group universities, meaning that students of Russell Group HEIs wishing to undertake a postgraduate research qualification might be more likely to submit an application to their current or previous HEI than students of non-Russell Group institutions.
The levels in each of the years are very consistent for both groups, with the proportion of applications submitted by alumni dropping by 1% for each in 2011/12.
Table 5.3: Percentage of PGR applications submitted alumni by mission group
Application Year
Base: Participating
HEIs
Base: Applications
Percentage of alumni applying to Russell Group HEIs
Percentage of alumni applying to HEIs with other / no
mission group 2010/11 36,979 15% 11%
2011/12 12
40,530 14% 10%
5.3.2. Proportion of applications submitted by alumni to PGT courses by mission group
As shown in Table 5.4 overleaf, in direct contrast to the trend for PGR applications, a higher proportion of applications for PGT courses at non-Russell Group HEIs were submitted by alumni (an average of 8%) compared with applications to Russell Group HEIs (an average of 4%).
In line with the PGR figures, the proportions of applications submitted by alumni in each year were very consistent, with a drop of just 1% in 2011/12 for both Russell Group HEIs and HEIs belonging to any other, or no, mission group.
89

Understanding Postgraduate Demand
Table 5.4: Percentage of PGT applications submitted alumni by mission group
Application Year
Base: Participating
HEIs
Base: Applications
Percentage of alumni applying to Russell Group HEIs
Percentage of alumni applying to HEIs with other / no
mission group 2010/11 179,429 4% 8%
2011/12 15
181,459 3% 7%
5.4. Ratios of applications to enrolments by alumni status (PGR)
5.4.1. Ratios of PGR applications to enrolments by alumni status
Table 5.5 indicates that candidates that applied to study PGR programmes at their current (or former) institution were considerably more likely to have enrolled, than applicants with no previous connection to their intended HEI.
Table 5.5: Ratio of applications to places taken up by alumni status (PGR)
Application Year
Base: Participating
HEIs
Base: Applications
Ratio of PGR applications to
enrolments by alumni
Ratio of PGR applications to
enrolments by new applicants
2008/09 20,754 3.21 8.04
2009/10 6
23,652 2.86 7.91
2010/11 36,979 2.96 8.35
2011/12 12
40,529 3.10 8.62
As an average ratio across the four year period, one in three applications submitted by alumni resulted in enrolment (3.03:1). In comparison, approximately one in eight applications submitted by new applicants resulted in registration on a PGR course (8.23:1).
Across the period, the ratio of applications submitted by alumni to enrolment has remained consistent, ranging between 2.9:1 and 3.2:1 across the four years.
The ratio of applications to places taken up for students without previous experience of studying at the institution was also fairly consistent over time, ranging from 7.9 applications received to every registration (in 2009/10) to 8.6:1 (in 2011/12).
5.4.2. Ratio of PGT applications to enrolments by alumni status
For PGT programmes, alumni were also significantly more likely enrol than new applicants, although the distinction is less marked than at PGR level as in shown in Table 5.6.
90

Understanding Postgraduate Demand
Table 5.6: Ratio of applications to places taken up by existing student status (PGT)
Application Year
Base: Participating
HEIs
Base: Applications
Ratio of PGT applications to
enrolments by alumni
Ratio of PGT applications to
enrolments by new applicants
2008/09 98,861 1.85 6.05
2009/10 9
113,565 1.73 6.50
2010/11 178,567 1.74 6.55
2011/12 15
180,221 1.78 4.77
As an average ratio across the four year period, slightly fewer than one in two PGT applications (1.8:1) submitted by alumni resulted in enrolment. In comparison, one in six (5.97:1) applications submitted by new applicants resulted in registration on a PGT course.
As with PGR applications, across the period, the ratio of PGT applications to places taken up among alumni was relatively consistent, ranging from 1.73:1 – 1.85:1 across the four years.
For students without prior experience of studying at the institution, the ratio of applications to enrolments was also relatively consistent. The lowest ratio of PGT applications to enrolments in this group was seen in the most recent application year (2011/12) when 4.77 applications were received to every registration. The highest proportion of PGT applications to enrolments among ‘new’ students was seen in 2010/11 (6.55:1).
5.5. Trends in proportion of applications submitted by alumni by domicile
5.5.1. Trends in proportion of PGR applications submitted by alumni by domicile
Table 5.7 overleaf shows the proportion of PGR applications submitted by alumni by domicile.
As the table shows, the proportion of PGR applications submitted by alumni of the HEI was considerably higher among UK-domiciled students than among those from overseas. Across the four year period, 28% of PGR applications from UK-domiciled students were submitted by alumni, in comparison with 17% of other EU candidates and 10% of non-EU applications.
Reflecting the overall decline in the proportion of PGR applications made by alumni from 2010/11 onwards, a lower proportion of submissions from alumni is evidenced across all three domicile groups (although the decline in non-EU applications began one year earlier in 2009/10). Yet, the most notable decrease is evident amongst UK-domiciled applicants; in 2009/10 one-third of applications were submitted alumni (32%), which then dropped to one-quarter in 2010/11 (26%) and just over one-fifth in 2011/12 (23%).
91

Understanding Postgraduate Demand
Amongst other EU and non-EU students, the proportion of applications submitted by alumni remained more consistent.
Table 5.7: Percentage of applications submitted by alumni by domicile (PGR)
Application
Year Base:
Participating HEIs
Base: Applications
UK Domiciled
Other EU Non-EU
2008/09 20,657 32% 18% 12%
2009/10 6
23,560 32% 19% 10%
2010/11 36,568 26% 16% 10%
2011/12 12
40,121 23% 16% 10%
5.5.2. Trends in proportion of PGT applications submitted by alumni by domicile
Table 5.8 below shows the same analysis for PGT applications.
Table 5.8: Percentage of applications submitted by alumni by domicile (PGT)
Application
Year Base:
Participating HEIs
Base: Applications
UK Domiciled
Other EU Non-EU
2008/09 98,189 17% 4% 3%
2009/10 9
113,336 17% 4% 3%
2010/11 178,053 18% 4% 2%
2011/12 15
179,916 15% 3% 2%
Although the proportion of PGT applications made by alumni was much lower than for PGR applications, a significantly higher proportion of applications from UK-domiciled students were submitted by alumni, compared with applications submitted by students from overseas. Across the time period, 17% of applications submitted by UK-domiciled candidates to PGT courses were made by alumni. By comparison, 4% of applications submitted by other EU students were from alumni and 3% of those from non-EU students.
In contrast to the pattern seem among PGR applications, the proportion of applications submitted by alumni across the three domiciles only dropped in 2011/12 for UK-domiciled and other EU applications, and in 2010/11 for non-EU applications. Once again, the biggest drop was among UK-domiciled applications (a fall of three percentage points compared to one percentage point each for other EU and non-EU applications); however, the decrease was less marked than that of PGR applications.
92

Understanding Postgraduate Demand
5.6. Trends in proportion of applications submitted by alumni by detailed qualification type
5.6.1. Trends in proportion of PGR applications submitted by alumni by detailed qualification type
Table 5.9 below shows the variations in the proportion of PGR applications made by alumni by detailed qualification type.
Table 5.9: Percentage of applications submitted by alumni by course type (PGR)
Application Year
Base: Participating
HEIs
Base: Applications
PhDs
Professional doctorates
Research Masters
2008/09 20,754 16% 9% 16%
2009/10 6
23,652 15% 10% 18%
2010/11 36,977 14% 12% 18%
2011/12 12
40,529 13% 8% 16%
Across the four year application period as a whole, applications for Research Masters were the most likely to have been made by existing students. Across these four application years, just under one-fifth (17%) of applications to Research Masters were submitted by alumni. In contrast, 15% of applications to PhDs degrees and 10% of applications to Professional Doctorates from alumni.
The proportion of applications for Research Masters from alumni remained relatively consistent across the period, peaking in 2009/10 and 2010/11 when 18% of applications were made by alumni.
Generally speaking, the ratio of applications submitted by existing students to other course types changed more across the period. The proportion of applications submitted for PhD study from alumni decreased by one percentage point each year, falling from 16% in 2008/09 to 13% in 2011/12.
The proportion of applications submitted Professional Doctorate courses that were from alumni fluctuated the most, increasing from 9% in 2008/09 to 12% in 2010/11, before falling back down to 8% in 2011/12.
5.6.2. Trends in proportion of PGT applications submitted by alumni by detailed course breakdown
Table 5.10 overleaf shows the proportion of PGT applications made by alumni by detailed course type.
93

Understanding Postgraduate Demand
Table 5.10: Percentage of applications submitted by alumni by course type (PGT)
Application
Year Base:
Participating HEIs
Base: Applications
Masters Degrees
MBAs Postgraduate Diplomas & Certificates
2008/09 99,516 6% 2% 16%
2009/10 9
114,557 5% 2% 18%
2010/11 179,429 5% 2% 11%
2011/12 15
181,459 4% 2% 9%
Overall, as an average across the period, the highest proportion of applications from alumni was seen for postgraduate diplomas and certificates (14% of all applications received). Across the period, applications from alumni accounted for 5% of applications to Masters degrees and 2% of applications to MBAs.
There was a slight decline in the proportion of Masters degree applications submitted by alumni over the four years, falling from 6% in 2008/09 to 4% in 2011/12.
The proportion of MBA applications submitted by alumni remained extremely stable over the four years. By comparison, the proportion of applications submitted by alumni for postgraduate diplomas and certificates showed considerable fluctuation, with a high point of 18% in 2009/10 before halving to 9% in 2011/12.
5.7. Trends in proportion of applications submitted by alumni by detailed subject breakdown
5.7.1. Trends in proportion of PGR applications submitted by alumni by detailed subject breakdown
Across the four year period as a whole the highest proportion of PGR applications from alumni was seen for Humanities courses, where alumni accounted for one quarter (24%) of PGR applications. Proportionately, the number of alumni applying to study Physics was also comparably high, with alumni constituting one fifth (20%) of applications submitted across the period, closely followed by Languages and Creative arts / design at 19% each. On average, the lowest proportions of applications made by alumni were seen for Other physical sciences (9% of applications) and Business / administrative studies (10%).
Table 5.11 overleaf shows the proportion of PGR applications for each subject area that were from alumni in each application year. This analysis indicates that the general decline in the proportion of applications submitted by alumni from 2008/09 onwards can be evidenced in most subject areas. The biggest declines came in Mathematical sciences, where the proportion fell from 25% in 2008/09 to 14% in 2011/12, followed by Creative arts / design, which dropped from 24% to 15%, and Subjects allied to medicine, which fell from 17% to 9% over the same period.
However, proportions of applications from existing students to Other physical sciences and Business/administrative studies remained at a consistent level over the last three
94

Understanding Postgraduate Demand
application years. Furthermore, a few subjects saw a slight increase in the proportion of applications submitted by alumni in 2011/12: Computer science / librarianship / information science, Law and Education.
Table 5.11: Percentage of applications submitted by alumni by subject area (PGR)
2008/09 2009/10 2010/11 2011/12
Base: Number of participating HEIs 6 12
Base: Number of applications 20,754 23,652 36,979 40,530
Medicine and Dentistry 12% 18% 15% 14%
Subjects allied to medicine 17% 16% 11% 9%
Biological sciences 16% 15% 14% 12%
Veterinary sciences / agriculture / related subjects
13% 18% 16% 12%
Chemistry 17% 15% 17% 14%
Physics 21% 23% 20% 17%
Other physical sciences 10% 9% 9% 9%
Mathematical sciences 25% 15% 14% 14%
Computer science / librarianship / information science
13% 10% 8% 12%
Engineering / technology / building / architecture
11% 12% 11% 9%
Social / political / economic studies 18% 18% 17% 16%
Law 13% 16% 12% 13%
Business / administrative studies 11% 9% 10% 10%
Languages 22% 21% 18% 17%
Humanities 25% 25% 24% 23%
Creative arts / design 24% 18% 19% 15%
Education 13% 14% 11% 12%
Unknown and combined subjects 11% 12% 11% 11%
95

Understanding Postgraduate Demand
5.7.2. Trends in proportion of PGT applications submitted by alumni by detailed subject breakdown
In terms of PGT applications, across this four year period, the highest proportions of applications that were from alumni were seen for applications to study Education (13% of applications received) and Humanities (11%).
Table 5.12 overleaf shows the proportion of applications submitted by alumni split by subject area in each of the four application years.
Reflecting the situation at an overall level, PGT applications by subject show a greater degree of consistency in the proportion of applications from alumni over time than was the case for PGR applications.
Some subjects show a clear decline in the proportion of applications submitted by alumni over the four years. Subjects allied to medicine, Creative arts / design and Education all decreased by five percentage points between 2008/09 and 2011/12, while Chemistry dropped by 4%, Medicine and dentistry and Biological sciences by 3% each.
The greatest fluctuation was seen in the proportion of applications for Veterinary sciences / agriculture submitted by alumni, which jumped from 5% in 2008/09 to 15% in 2009/10, before falling back to a mid-point of 10% in the two years following. This amount of variation in proportion is probably due to the relatively low numbers of applications to this subject overall.
96

Understanding Postgraduate Demand
Table 5.12: Percentage of applications submitted by alumni by subject area (PGT)
2008/09 2009/10 2010/11 2011/12
Base: Number of participating HEIs 9 15
Base: Number of applications 99,516 114,557 179,429 181,459
Medicine and Dentistry 8% 8% 6% 6%
Subjects allied to medicine 10% 12% 9% 7%
Biological sciences 9% 10% 8% 7%
Veterinary sciences / agriculture / related subjects
5% 15% 10% 10%
Chemistry 9% 9% 5% 5%
Physics21 8% 6%
Other physical sciences 5% 4% 5% 3%
Mathematical sciences 6% 5% 7% 5%
Computer science / librarianship / information science
4% 3% 2% 3%
Engineering / technology / building / architecture
4% 3% 3% 2%
Social / political / economic studies 4% 4% 4% 3%
Law 6% 6% 5% 4%
Business / administrative studies 5% 4% 3% 3%
Languages 8% 8% 7% 6%
Humanities 11% 11% 12% 11%
Creative arts / design 10% 9% 9% 5%
Education 15% 14% 14% 10%
Unknown and combined subjects 16% 25% 7% 6%
21 2008/09 and 2009/10 figures for Physics have been suppressed due to low base sizes in these years
97

Understanding Postgraduate Demand
Chapter 6: Trends in applications by Demographics This chapter provides information on the volume of applications to both PGR and PGT programmes broken down by age, gender, ethnicity and disability status.
6.1. Caveats and limitations of the data
All of the demographic information (and in particular the date of birth, ethnicity and disability status fields) must be treated with a certain amount of caution, due to the fact that this information is generally not checked by institutions until the point at which an applicant enrols; therefore, for applications that did not lead to an enrolment, the information stored in the applications database reflects whatever was entered by the applicant, without having been checked for accuracy.
For the age category, any dates of birth which indicated an unusually high or low age at the point of application (younger than 16 or older than 100) have been removed from the database. As some institutions only provided applicants’ year of birth, some of the ages in the database are approximate only.
Ethnicity data has been analysed for UK-domiciled applications only. Furthermore, it must be taken into account that a relatively large proportion of the data for this field is either unknown or refused (8% of unweighted UK-domiciled records are refused or unknown, with a further 8% being blank in the original databases); institutions indicated that while they will confirm ethnicity data at the point of enrolment, many applicants choose not to state this in the initial application.
When looking at disability status, it must be remembered that this is self-declared and does not necessarily represent the actual proportion of applications submitted by applicants with a disability. The way disability status is asked about also varies significantly between institutions, with some asking a simple yes / no question, and others requesting more detail at the application stage. As with ethnicity, there is a relatively large amount of refused / unknown data at this field (18% of unweighted records are refused or unknown, with a further 4% blank in the original databases).
HEIs were originally requested to provide Home applicants’ postcode information in order to facilitate analysis by Socio-Economic category. However, too few HEIs were able to provide this information which is typically collated at registration stage and often not held on the same application database. Other HEIs had concerns about data protection issues and were unwilling to provide postcode information. Unfortunately, this entailed that the volume of records available did not warrant a large enough base size on which to conduct robust analysis.
98

Understanding Postgraduate Demand
6.2. Profile of Applications to Postgraduate Study by Age at Point of Application
6.2.1. Applications to PGR Programmes by Age
Figure 6.1 below set outs the age profile of applications to PGR programmes during each of the seven academic years from 2005/06 to 2011/12 inclusive.
Figure 6.1: Proportion of Applications to PGR programmes by Age
4% 3% 3% 7% 7% 7% 7%
15% 15% 15%
20% 21% 20% 19%
20% 19% 20%
20% 19% 18% 18%
17% 17% 15%
15% 14%14% 14%
17% 17% 17%
14% 14%14% 15%
21% 22% 23%19% 17% 20% 21%
5% 5% 6% 4% 5% 5% 6%
1% 1% 1% 1% 1% 2% 2%
0%
10%
20%
30%
40%
50%
60%
70%
80%
90%
100%
2005-2006 2006-2007 2007-2008 2008-2009 2009-2010 2010-2011 2011-2012
21 and under 22-23 24-25 26-27 28-30 31-40 41-50 51+B
ase: All applications to PGR programmes with date of birth supplied (183,129) (05/06: 5,240), (06/07: 6,551), (07/08: 7,593), (08/09: 25,541), (09/10: 30,275), (10/11: 51,345), (11/12: 56,584) HEIs: (05/06 – 07/08: 6), (08/09 – 09/10: 10), (10/11 – 11/12: 17)
In general terms, the age profile of PGR applications has remained relatively constant over time; there have been some fluctuations over the seven year period but by and large the split between applications from older and younger individuals has remained similar.
Throughout the period covered, between one-fifth (18%) and 28% of applications were submitted by candidates aged 23 or younger. These were likely to be candidates applying to PGR either during or soon after completing their undergraduate degree. In the 2008/09 academic year there was an increase in the proportion of PGR applications submitted by those aged 23 and under, a rise of nine percentage points on the previous year (from 18% to 27%). The proportion of applications submitted by this age group was then broadly consistent in the following three years.
99

Understanding Postgraduate Demand
6.2.2. Applications to PGT Programmes by Age
Figure 6.2 below shows the age profile of applications to PGT programmes during each of the seven academic years from 2005/06 to 2011/12 inclusive.
Figure 6.2: Proportion of applications to PGT programmes by age
14% 15% 15% 17% 18% 18% 19%
26% 27% 26%30% 32% 36% 36%
18% 18% 18%18%
17%16% 16%12% 12% 12%
11%10% 9% 9%11% 11% 11%
10% 9% 8% 8%14% 14% 13% 11% 10% 9% 9%4% 3% 4% 3% 3% 2% 3%1% 1% 1% 1% 1% 1% 1%
0%
10%
20%
30%
40%
50%
60%
70%
80%
90%
100%
2005-2006 2006-2007 2007-2008 2008-2009 2009-2010 2010-2011 2011-2012
21 and under 22-23 24-25 26-27 28-30 31-40 41-50 51+B
ase: All applications to PGT programmes with date of birth supplied (932,285) (05/06: 43,671), (06/07: 50,639), (07/08: 59,540), (08/09: 126,028), (09/10: 149,783), (10/11: 249,998), (11/12: 252,626) HEIs: (05/06 – 07/08: 7), (08/09 – 09/10: 13), (10/11 – 11/12: 20)
As might be expected, compared to PGR applications, a much higher proportion of applications to PGT programmes were submitted by candidates aged 23 and under (an average of 47% throughout the period, with a high of 55% in 2011/12); the majority of these would have been progressing to postgraduate study either directly from or soon after their undergraduate study.
As Figure 6.2 shows, the age profile of applications for PGT study has been getting steadily younger over the period. The proportion of applications submitted by the 23 and under age group increased by 15 percentage points between 2005/06 and 2011/12, driven principally by a rise in applications from the 22-23 age group, which rose by ten percentage points over the seven years compared to five percentage points among those aged 21 and younger. This rise could reflect growing pressure on new graduates to distinguish themselves in an increasingly competitive job market and / or reacting to the lack of job opportunities by remaining in education.
100

Understanding Postgraduate Demand
The proportion of applications submitted by all those aged between 24 and 40 has correspondingly decreased throughout the period, with an overall drop of 15 percentage points between 2005/06 and 2011/12. Within this group, the biggest decrease in applications came from the 31-40 age group (a decrease of 6% overall).
In 2011/12 applications from candidates applying either immediately or soon after the completion of their undergraduate studies (aged 23 and under) made up more than half of all applications to taught postgraduate study (55%). The majority of these were aged between 22 and 23 at the point of application (36%). Applications submitted by those aged 51 and over made up the smallest proportion of applications (just 1%) as did those from individuals aged 41-50 (3%). The remainder of applications were divided fairly evenly among the age groups 26-27, 28-30 and 31-40 (making up 9%, 8% and 9% of all applications respectively).
6.2.3. Ratios of Applications to PGR to Places Taken Up by Age
Figure 6.3 overleaf shows enrolments as a percentage of PGR applications submitted by each age group.
In recent years, applications made by the youngest and oldest age groups have been more likely to result in enrolment than those made by individuals in the middle age brackets.
Applications submitted by candidates in the top two age groups (41-50 and 51 plus) were notably more likely to lead to enrolment in most years; particularly the 50 plus age group, who were most likely to convert an application to an enrolment, with 51% doing so in 2011/12. In 2009/10 more than half (55%) of applications submitted by the 51+ age group resulted in an enrolment, compared with 33% the year before - the most marked increase in enrolments among all age groups. However, even though the proportion of enrolments are high among the this age group, it must be remembered that they make up a relatively low proportion of the overall number of applications (between 1% and 2% each year).
Overall applications submitted by those aged 24-40 were less likely to lead to enrolment; in 2011/12, 15% of applications from 24-25 year olds, 12% of applications from 26-27 and 31-40 year olds, and 11% of applications from 28-30 year olds led to enrolment.
101

Understanding Postgraduate Demand
Figure 6.3: Percentage of PGR Applications Leading to Enrolment
0%
10%
20%
30%
40%
50%
60%
70%
80%
2005-2006 2006-2007 2007-2008 2008-2009 2009-2010 2010-2011 2011-2012
21 and under 22-23 24-25 26-27 28-30 31-40 41-50 51+B
ase: All applications to PGR programmes with date of birth and enrolment status supplied (168,390) (05/06: 5,240), (06/07: 6,551), (07/08: 7,593), (08/09: 25,541), (09/10: 30,275), (10/11: 44,553), (11/12: 48,637) HEIs: (05/06 – 07/08: 6), (08/09 – 09/10: 10), (10/11 – 11/12: 16)
6.2.4. Ratios of Applications to PGT to Places Taken Up by Age
Figure 6.4 overleaf shows the same analysis of the proportion of applications resulting in enrolment by age.
As with PGR, applications submitted by candidates aged 41+ were consistently more likely to lead to enrolments. Across all years, applications submitted by those aged 51 and over were roughly three times as likely to lead to enrolment than applications from candidates aged 23 and under. On average 62% of applications from those aged 51 and over resulted in enrolment.
Although in the early part of the period, a similar pattern was seen to that for PGR applications with applications from the youngest applicants more likely to convert into places taken up than those in the middle age bands, this pattern was less marked in recent years. With the exception of the 21 and under group, in 2011/12 the proportion of applications resulting in enrolments generally increased with the age of applicants.
102
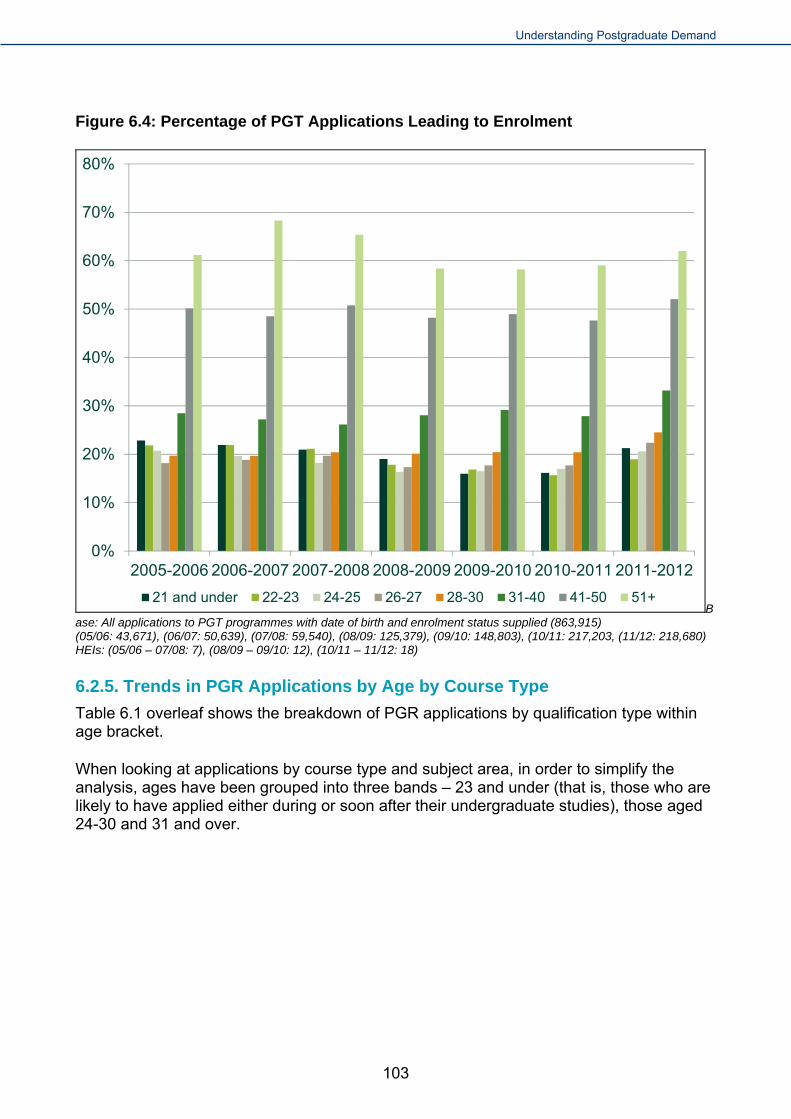
Understanding Postgraduate Demand
Figure 6.4: Percentage of PGT Applications Leading to Enrolment
0%
10%
20%
30%
40%
50%
60%
70%
80%
2005-2006 2006-2007 2007-2008 2008-2009 2009-2010 2010-2011 2011-2012
21 and under 22-23 24-25 26-27 28-30 31-40 41-50 51+B
ase: All applications to PGT programmes with date of birth and enrolment status supplied (863,915) (05/06: 43,671), (06/07: 50,639), (07/08: 59,540), (08/09: 125,379), (09/10: 148,803), (10/11: 217,203, (11/12: 218,680) HEIs: (05/06 – 07/08: 7), (08/09 – 09/10: 12), (10/11 – 11/12: 18)
6.2.5. Trends in PGR Applications by Age by Course Type
Table 6.1 overleaf shows the breakdown of PGR applications by qualification type within age bracket.
When looking at applications by course type and subject area, in order to simplify the analysis, ages have been grouped into three bands – 23 and under (that is, those who are likely to have applied either during or soon after their undergraduate studies), those aged 24-30 and 31 and over.
103

Understanding Postgraduate Demand
Table 6.1: Proportion of PGR Applications by Age by Course Type
Year
2005
/06
2006
/07
2007
/08
2008
/09
2009
/10
2010
/11
2011
/12
Base: HEIs 6 11 17
Base: Applications 5,240 6,551 7,593 25,541 30,275 51,345 56,584
71% 77% 79% 86% 86% 87% PhDs 87%
Professional doctorates
1% 1% 1% 1% 1% 1% 1% Age 23 and under
Research Masters
28% 21% 20% 13% 13% 12% 12%
PhDs 78% 82% 85% 86% 86% 87% 85%
Professional doctorates
1% 1% 1% 2% 2% 2% 2% Age 24-30
Research Masters
21% 17% 15% 12% 12% 11% 13%
PhDs 89% 90% 93% 90% 88% 89% 88%
Professional doctorates
2% 3% 3% 4% 7% 6% 7% Age 31+
Research Masters
9% 7% 4% 6% 5% 5% 6%
Generally over the seven year time period, the shift in the profile of PGR applications away from Research Masters and towards PhDs is evident in all three age bands.
The proportion of PGR applications that were for PhDs increased over the seven years among all age groups. Generally, those aged 31 and over were more likely to apply for a PhD (both the case for PhDs as well as Professional doctorates); however, growth was strongest in applications from those aged 23 and under. The proportion of applications for PhD submitted by this age group increased by 16 percentage points (from 71% of applications in 2005/06, to 87% in 2011/12); in comparison, the proportion of applications for PhDs from those aged 31 and over increased by a smaller four percentage points (from 89% of applications in 2005/06 to 88% in 2011/12).
104

Understanding Postgraduate Demand
6.2.6. Trends in PGT Applications by Age by Course Type
Table 6.2 overleaf shows the profile of PGT applications by qualification types for each of the three age groups.
The likelihood to submit an application for a Masters degree decreased with age – Masters degree applications accounted for an average of 97% of applications submitted by those aged 23 and under, an average of 91% of applications submitted by those aged 24-30, and an average of 77% of applications submitted by those aged 31+.
While the proportion of applications submitted for postgraduate diplomas and certificates remained fairly consistent across the seven year period for those aged 23 and under (between 2% and 3% of applications each year) and for those aged 24-30 (between 4% and 5% of applications each year), there was an increase in the proportion of applications to postgraduate diplomas and certificates submitted by those aged 31 and over. Throughout the period, this age group were more likely to submit applications for postgraduate diplomas and certificates, with 12% doing so in 2006/07. There was then a year on year increase, until the figure reached 18% in 2011/12.
It is likely that this increased level of applications for postgraduate diplomas and certificates is linked to the increasing demand for and offers of postgraduate-level CPD courses, funded by employers for their employees; this correlates with the greater proportion of applications submitted by those aged 31 and over, as such courses are designed for professionals who have already reached a certain level in their career.
Applications to MBAs were also more likely to be submitted by more mature candidates – they accounted for an average of 8% of applications submitted by those aged 31 and over, an average of 5% of applications submitted by those aged 24-30, and an average of 1% of applications submitted by those aged 23 and under. Again, undertaking an MBA is strongly linked to career development, which would explain why those who are further on in their career were more likely to submit an application. In 2011/12, just 1% of candidates aged 23 and under applied for this type of qualification, compared to 4% of those aged 24-30 and 8% of those aged 31 and over.
105
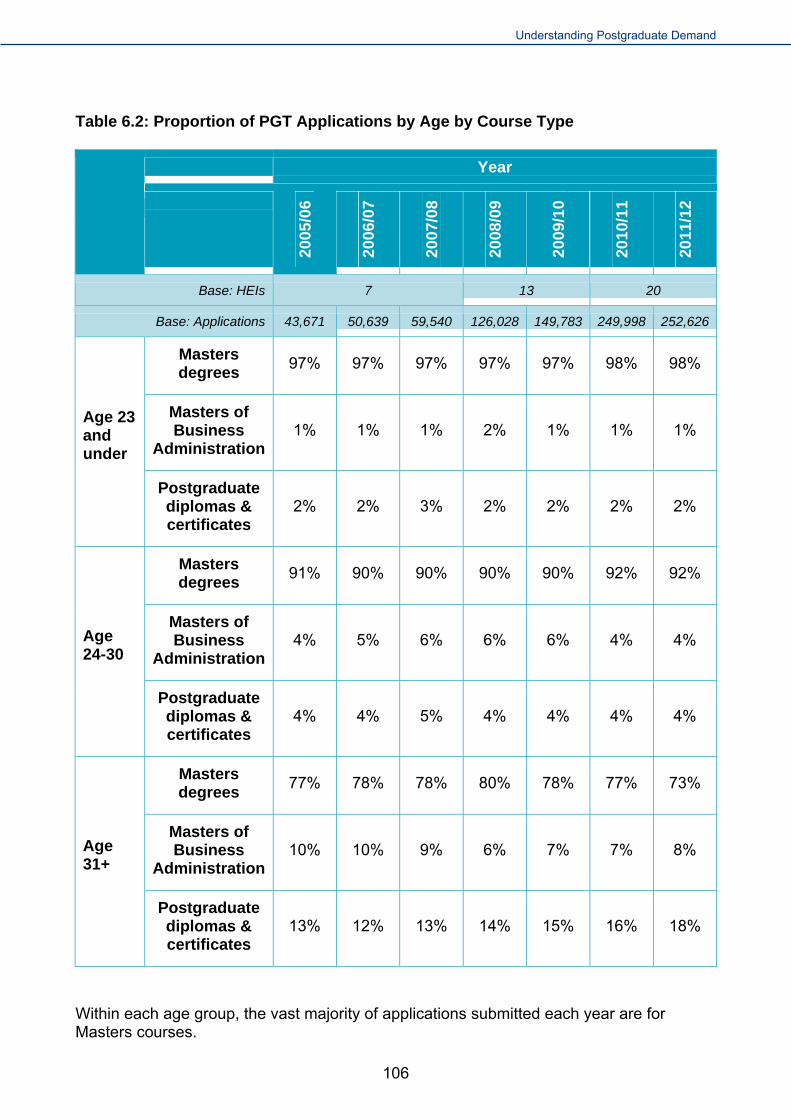
Understanding Postgraduate Demand
Table 6.2: Proportion of PGT Applications by Age by Course Type
Year
2005
/06
2006
/07
2007
/08
2008
/09
2009
/10
2010
/11
2011
/12
Base: HEIs 7 13 20
Base: Applications 43,671 50,639 59,540 126,028 149,783 249,998 252,626
Masters degrees
97% 97% 97% 97% 97% 98% 98%
Masters of Business
Administration 1% 1% 1% 2% 1% 1% 1%
Age 23 and under
Postgraduate diplomas & certificates
2% 2% 3% 2% 2% 2% 2%
Masters degrees
91% 90% 90% 90% 90% 92% 92%
Masters of Business
Administration 4% 5% 6% 6% 6% 4% 4% Age
24-30
Postgraduate diplomas & certificates
4% 4% 5% 4% 4% 4% 4%
Masters degrees
77% 78% 78% 80% 78% 77% 73%
Masters of Business
Administration 10% 10% 9% 6% 7% 7% 8% Age
31+
Postgraduate diplomas & certificates
13% 12% 13% 14% 15% 16% 18%
Within each age group, the vast majority of applications submitted each year are for Masters courses.
106

Understanding Postgraduate Demand
6.2.7. Trends in PGR Applications by Age By Subject
Table 6.3 shows proportions of PGR applications from each of the three age groups split by subject area.
Table 6.3: Proportion of PGR Applications by Age by Subject Area
Year
2005
/06
2006
/07
2007
/08
2008
/09
2009
/10
2010
/11
2011
/12
Base: HEIs: 6 11 17
Base: Applications: 5,240 6,551 7,593 25,541 30,275 51,345 56,584
Medicine and dentistry 1% 1% 2% 3% 4% 3% 3%
Subjects allied to Medicine <1% <1% <1% 4% 5% 5% 5%
Biological sciences 5% 10% 14% 7% 7% 11% 11%
Veterinary Sciences / agriculture / related subjects
<1% <1% - <1% <1% <1% <1%
Chemistry 3% 3% 3% 3% 2% 4% 4%
Physics 3% 3% 2% 3% 2% 3% 3%
Other physical sciences 2% 3% 5% 2% 2% 4% 4%
Mathematical sciences 7% 6% 5% 5% 4% 4% 4%
Computer science / librarianship / info science
4% 4% 2% 2% 3% 3% 3%
Engineering / technology / building / architecture
8% 10% 11% 9% 9% 10% 11%
Social / political / economic studies
48% 42% 36% 25% 25% 21% 21%
Law 5% 3% 4% 1% 2% 2% 2%
Business / administrative studies
9% 9% 9% 12% 12% 9% 8%
Languages 1% 1% 2% 5% 5% 4% 5%
Humanities 5% 3% 4% 6% 6% 5% 6%
Ag
e 23
an
d u
nd
er
Creative arts / design 1% 1% 1% 1% 1% 1% 1%
107

Understanding Postgraduate Demand
Year
2005
/06
2006
/07
2007
/08
2008
/09
2009
/10
2010
/11
2011
/12
Education - <1% <1% 1% 1% 1% 1%
Unknown and combined subjects
<1% - - 10% 10% 8% 7%
Medicine and dentistry 1% 1% 1% 3% 4% 4% 4%
Subjects allied to Medicine <1% <1% <1% 2% 3% 4% 5%
Biological sciences 3% 6% 7% 5% 5% 8% 7%
Veterinary Sciences / agriculture / related subjects
<1% <1% <1% <1% 1% <1% <1%
Chemistry 1% 2% 1% 1% 2% 2% 2%
Physics 1% 1% 1% 1% 1% 1% 1%
Other physical sciences 2% 3% 3% 2% 2% 3% 3%
Mathematical sciences 2% 3% 3% 3% 2% 3% 2%
Computer science / librarianship / info science
4% 4% 5% 4% 4% 4% 4%
Engineering / technology / building / architecture
10% 11% 11% 12% 12% 12% 13%
Social / political / economic studies
55% 47% 45% 35% 34% 29% 28%
Law 5% 5% 5% 5% 4% 4% 4%
Business / administrative studies
8% 10% 10% 10% 9% 10% 10%
Languages 2% 2% 2% 4% 4% 4% 3%
Humanities 5% 3% 4% 4% 5% 5% 5%
Creative arts / design 1% 1% 1% 1% 1% 1% 1%
Education 1% 1% 1% 2% 2% 2% 2%
Ag
e 24
-30
Unknown and combined subjects
- <1% - 6% 5% 3% 3%
108

Understanding Postgraduate Demand
Year
2005
/06
2006
/07
2007
/08
2008
/09
2009
/10
2010
/11
2011
/12
Medicine and dentistry 1% 2% 2% 4% 5% 4% 5%
Subjects allied to Medicine 1% <1% 1% 2% 3% 5% 6%
Biological sciences 4% 4% 4% 4% 4% 7% 6%
Veterinary Sciences / agriculture / related subjects
1% <1% <1% 1% 1% 1% <1%
Chemistry <1% 1% 1% 1% 1% 1% 2%
Physics 1% 1% 1% 1% 1% 1% 1%
Other physical sciences 3% 4% 5% 3% 3% 4% 3%
Mathematical sciences 3% 3% 3% 2% 2% 2% 3%
Computer science / librarianship / info science
5% 6% 5% 5% 4% 5% 4%
Engineering / technology / building / architecture
14% 15% 14% 15% 14% 13% 15%
Social / political / economic studies
36% 29% 31% 25% 23% 21% 20%
Law 5% 6% 6% 7% 5% 4% 5%
Business / administrative studies
14% 16% 14% 13% 14% 14% 13%
Languages 2% 4% 3% 3% 4% 4% 4%
Humanities 4% 4% 5% 5% 6% 6% 6%
Creative arts / design 2% 2% 1% 2% 2% 2% 2%
Education 3% 5% 5% 4% 5% 6% 6%
Ag
e 31
+
Unknown and combined subjects
1% <1% <1% 3% 3% 2% 2%
This analysis shows that the decline in the proportion of PGR applications for social / political / economic studies reported earlier in this report is evident within all 3 age groups. However, the decline is particularly marked among the younger age groups; the proportion
109

Understanding Postgraduate Demand
of applications submitted by those aged 24-30 and those aged 23 and under have dropped by 27 percentage points each, while the proportion of applications submitted by candidates aged 31 and over for this subject area has dropped by 16 percentage points.
Similarly, although evident among all age groups, the growth in the proportion of PGR applications for study in the biological sciences is accounted for particularly by the younger age groups. Applications for research courses in biological sciences accounted for 11% of applications from applicants aged 23 and under in 2011/12; compared with 7% of applications submitted by candidates aged 24-30 and 6% of applications submitted by candidates aged 31 and over. Among the 23 and under age group, this proportion has increased from only 5% in 2005/06.
Older candidates were more likely to apply for courses in business and administrative studies; an average of 14% of applications submitted by those aged 31 and over were for business and administrative studies, compared with an average of 10% of applications submitted by those aged 24-30 and those aged 23 and under.
6.2.8. Trends in PGT Applications by Age by Subject
Table 6.4 overleaf shows profile of PGT applications by subject area for each of the three age groups.
For those aged 23 and under, taught courses in business and administrative studies consistently attracted the greatest proportion of PGT applications in each year, and increased from 32% of all applications submitted by that group in 2005/06 to 42% in 2011/12. Business and administrative studies also accounted for the greatest proportions of applications submitted by those aged 24 and over. However, the proportion of applications from those aged 31 and over for business and administrative studies has declined over time from 29% in 2005/06 to 22% in 2011/12.
Social, political and economic studies received the second highest proportion of applications in each age group per year. However, the relative decline in popularity of these subjects is again evident among PGR applications from each age group. The overall drop in applications was most notable in the 23 and under age group, with 17% of applications being for this subject in 2011/12, a drop of 13 per cent from the proportion 2005/06 (compared with a drop of 8% in the 24-30 age group and a 3% drop in the 31+ age group to 17% and 15% in 2011/12 respectively).
Throughout the period, candidates in the 24-30 age group were more likely to submit applications for engineering, technology, building and architecture courses; in 2011/12, 14% of applications submitted by those aged 24-30 were for this subject area, compared to 11% of those aged 31 and over, and 10% of those aged 23 and under.
Applications submitted by those aged 31 and over were much more likely to be for education, compared to the other age groups; an average of 8% of applications from those aged 31 and over were for education courses (compared to 3% of applications from those aged 24-30 and just 2% of those aged 23 and under).
110

Understanding Postgraduate Demand
Table 6.4: Proportion of PGT Applications by Age by Subject Area
Year
2005
/06
2006
/07
2007
/08
2008
/09
2009
/10
2010
/11
2011
/12
Base: HEIs: 7 13 20
Base: Applications: 43,671 50,639 59,540 126,028 149,783 249,998 252,626
Medicine and dentistry <1% <1% <1% 2% 2% 1% 1%
Subjects allied to Medicine
1% 1% 1% 3% 3% 2% 2%
Biological sciences 3% 3% 3% 2% 2% 2% 2%
Veterinary Sciences / agriculture / related subjects
1% 1% <1% <1% <1% <1% <1%
Chemistry <1% <1% 1% <1% <1% <1% <1%
Physics - <1% <1% <1% <1% <1% <1%
Other physical sciences
2% 2% 2% 2% 2% 1% 1%
Mathematical sciences 4% 3% 4% 3% 3% 3% 3%
Computer science / librarianship / info science
6% 6% 5% 7% 7% 6% 5%
Engineering / technology / building / architecture
8% 8% 8% 12% 11% 10% 10%
Social / political / economic studies
30% 28% 24% 16% 14% 18% 17%
Law 6% 6% 5% 7% 6% 5% 4%
Business / administrative studies
32% 34% 38% 35% 38% 39% 42%
Languages 2% 2% 2% 3% 4% 4% 3%
Ag
e 23
an
d u
nd
er
Humanities 3% 4% 4% 3% 2% 2% 2%
111

Understanding Postgraduate Demand
Year
2005
/06
2006
/07
2007
/08
2008
/09
2009
/10
2010
/11
2011
/12
Creative arts / design 1% 1% 2% 1% 1% 2% 2%
Education 1% 1% 2% 2% 2% 2% 2%
Unknown and combined subjects
<1% <1% <1% 1% 2% 3% 3%
Medicine and dentistry <1% <1% <1% 4% 4% 3% 3%
Subjects allied to Medicine
2% 2% 3% 5% 5% 5% 5%
Biological sciences 3% 3% 3% 2% 2% 3% 2%
Veterinary Sciences / agriculture / related subjects
1% 1% 1% 1% 1% 1% 1%
Chemistry 1% 1% 1% 1% 1% 1% <1%
Physics <1% <1% <1% <1% <1% <1% <1%
Other physical sciences
4% 4% 4% 3% 3% 3% 3%
Mathematical sciences 1% 2% 2% 2% 2% 2% 2%
Computer science / librarianship / info science
6% 5% 5% 6% 6% 6% 5%
Engineering / technology / building / architecture
12% 13% 13% 13% 13% 14% 14%
Social / political / economic studies
25% 24% 20% 15% 15% 17% 17%
Law 7% 7% 7% 9% 8% 7% 7%
Business / administrative studies
30% 31% 33% 29% 30% 28% 29%
Languages 2% 2% 2% 3% 3% 3% 3%
Ag
e 24
-30
Humanities 2% 2% 2% 2% 2% 2% 2%
112

Understanding Postgraduate Demand
Year
2005
/06
2006
/07
2007
/08
2008
/09
2009
/10
2010
/11
2011
/12
Creative arts / design 1% 1% 1% 1% 1% 2% 2%
Education 2% 2% 3% 3% 3% 4% 3%
Unknown and combined subjects
<1% - <1% 1% 2% 2% 2%
Medicine and dentistry <1% <1% 1% 8% 8% 4% 5%
Subjects allied to Medicine
7% 6% 7% 11% 13% 12% 14%
Biological sciences 2% 3% 4% 3% 3% 3% 3%
Veterinary Sciences / agriculture / related subjects
2% 2% 1% 1% 1% 1% 1%
Chemistry <1% <1% <1% <1% <1% <1% <1%
Physics <1% <1% <1% <1% <1% <1% <1%
Other physical sciences
4% 4% 4% 3% 3% 3% 2%
Mathematical sciences 1% 1% 1% 1% 2% 1% 1%
Computer science / librarianship / info science
4% 4% 3% 4% 3% 4% 4%
Engineering / technology / building / architecture
11% 14% 14% 12% 11% 11% 11%
Social / political / economic studies
18% 17% 15% 12% 12% 17% 15%
Law 6% 5% 5% 9% 8% 5% 5%
Business / administrative studies
29% 30% 29% 19% 20% 20% 22%
Languages 2% 3% 2% 3% 3% 3% 3%
Ag
e 31
+
Humanities 4% 4% 3% 3% 3% 3% 2%
113

Understanding Postgraduate Demand
Year
2005
/06
2006
/07
2007
/08
2008
/09
2009
/10
2010
/11
2011
/12
Creative arts / design 2% 2% 2% 2% 2% 3% 2%
Education 7% 7% 8% 8% 8% 9% 8%
Unknown and combined subjects
<1% <1% - 1% 2% 1% 1%
Subjects allied to medicine experienced a large rise in the proportion of applications from the 31+ age group (from 7% in 2005/06 to 14% in 2011/12); there was also a slight rise in applications from the 24-30 age group (from 2% in 2005/06 to 5% in 2011/12). The driving force for these increases is likely to have been the increasing popularity of postgraduate level CPD courses delivered by HEIs for the NHS, something that several institutions mentioned as having an impact on their student numbers.
114

Understanding Postgraduate Demand
6.3. Profile of Applications to Postgraduate Study by Gender
6.3.1. Applications to PGR Programmes by Gender
Figure 6.5 below set outs the gender profile applications to PGR programmes during each of the seven academic years from 2005/06 to 2011/12 inclusive.
Figure 6.5: Proportion of Applications to PGR by Gender
63% 63% 63% 60% 59% 59% 60%
37% 37% 37% 40% 41% 41% 40%
0%
10%
20%
30%
40%
50%
60%
70%
80%
90%
100%
2005-2006 2006-2007 2007-2008 2008-2009 2009-2010 2010-2011 2011-2012
Male Female
Base: All applications to PGR programmes with gender supplied (183,681) (05/06: 5,282), (06/07: 6,563), (07/08: 7,639), (08/09: 25,658), (09/10: 30,368), (10/11: 51,464), (11/12: 56,724) HEIs: (05/06 – 07/08: 6), (08/09 – 09/10: 10), (10/11 – 11/12: 17)
Throughout the period, applications for postgraduate research programmes were more likely to be submitted by men than by women; however, the proportion of applications submitted by women has increased slightly over the seven years, rising from 37% of applications in 2005/06 to around 40% of applications from 2008/09 onwards.
115

Understanding Postgraduate Demand
6.3.2. Applications to PGT Programmes by Gender
Figure 6.6 overleaf set outs the proportion of applications to PGT programmes during each of the seven academic years from 2005/06 to 2011/12 inclusive, split by gender.
Figure 6.6: Proportion of Applications to PGT by Gender
54% 54% 54% 52% 49% 47% 46%
46% 46% 46% 48% 51% 53% 54%
0%
10%
20%
30%
40%
50%
60%
70%
80%
90%
100%
2005-20062006-20072007-20082008-20092009-20102010-20112011-2012
Male FemaleB
ase: All applications to PGT programmes with gender supplied (933,389) (05/06: 43,742), (06/07: 50,801), (07/08: 59,788), (08/09: 126,362), (09/10: 149,896), (10/11: 250,115), (11/12: 252,685) HEIs: (05/06 – 07/08: 7), (08/09 – 09/10: 13), (10/11 – 11/12: 20)
At the beginning of the period, more than half of all applications were submitted by men, (54% of applications in 2005/06); this level remained steady until 2007/08, after which the trend began to reverse, with applications submitted by women increasing in proportion until 2011/12, when they made up 54% of applications.
In contrast to applications to postgraduate research programmes, where those submitted by men predominated throughout, the proportion of applications for taught postgraduate courses from men and women in 2012 is closer to reflecting HESA figures for the undergraduate population at that time; according to HESA, in 2011/12 57 per cent of undergraduate students were female22.
22 http://www.hesa.ac.uk/content/view/1897/239/
116
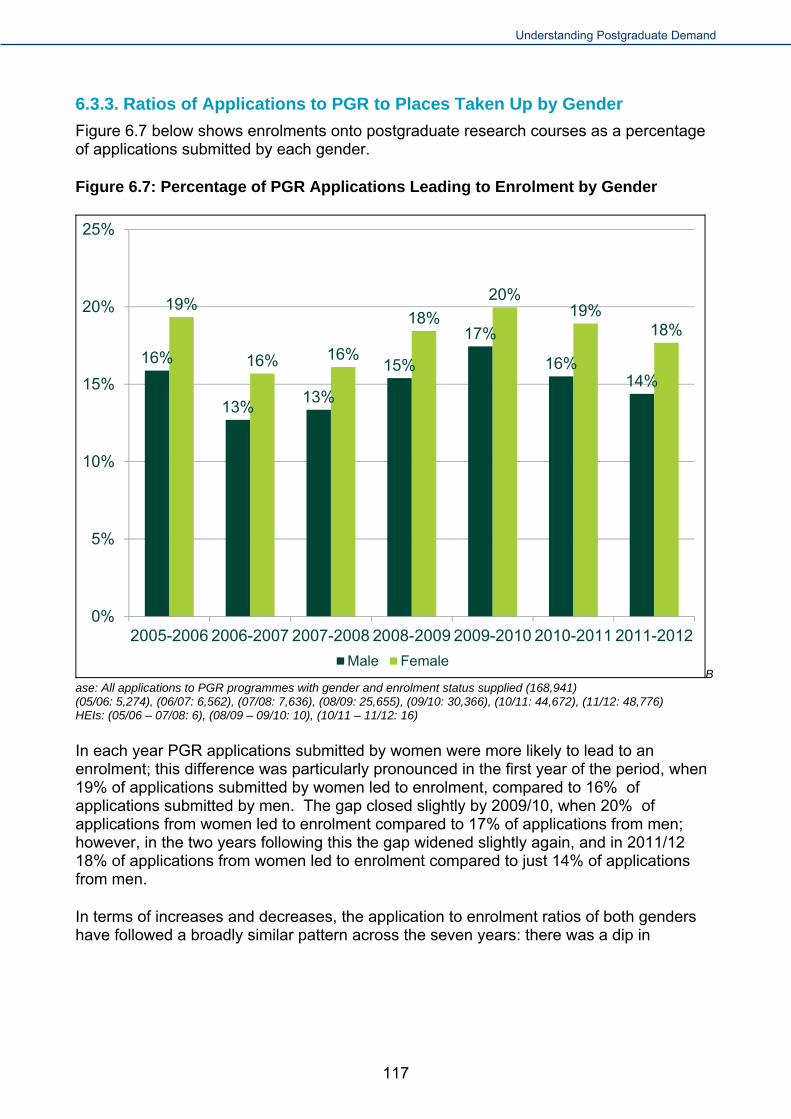
Understanding Postgraduate Demand
6.3.3. Ratios of Applications to PGR to Places Taken Up by Gender
Figure 6.7 below shows enrolments onto postgraduate research courses as a percentage of applications submitted by each gender.
Figure 6.7: Percentage of PGR Applications Leading to Enrolment by Gender
16%
13%13%
15%
17%
16%14%
19%
16% 16%
18%
20%19%
18%
0%
5%
10%
15%
20%
25%
2005-2006 2006-2007 2007-2008 2008-2009 2009-2010 2010-2011 2011-2012
Male FemaleB
ase: All applications to PGR programmes with gender and enrolment status supplied (168,941) (05/06: 5,274), (06/07: 6,562), (07/08: 7,636), (08/09: 25,655), (09/10: 30,366), (10/11: 44,672), (11/12: 48,776) HEIs: (05/06 – 07/08: 6), (08/09 – 09/10: 10), (10/11 – 11/12: 16)
In each year PGR applications submitted by women were more likely to lead to an enrolment; this difference was particularly pronounced in the first year of the period, when 19% of applications submitted by women led to enrolment, compared to 16% of applications submitted by men. The gap closed slightly by 2009/10, when 20% of applications from women led to enrolment compared to 17% of applications from men; however, in the two years following this the gap widened slightly again, and in 2011/12 18% of applications from women led to enrolment compared to just 14% of applications from men.
In terms of increases and decreases, the application to enrolment ratios of both genders have followed a broadly similar pattern across the seven years: there was a dip in
117

Understanding Postgraduate Demand
conversion rates between 2005/06 and 2006/07, before the proportion began to rise again from 2007/08 onwards until 2009/10; there was a drop again in 2010/1123.
6.3.4. Ratios of Applications to PGT to Places Taken Up by Gender
Figure 6.8 below shows enrolments onto taught postgraduate courses as a percentage of applications submitted by each gender.
Figure 6.8: Percentage of PGT Applications Leading to Enrolment by Gender
21% 21%20%
18% 18% 18%
22%
27%25% 25%
23%
20%19%
23%
0%
5%
10%
15%
20%
25%
30%
2005-2006 2006-2007 2007-2008 2008-2009 2009-2010 2010-2011 2011-2012
Male FemaleB
ase: All applications to PGT programmes with gender and enrolment status supplied (865,006) (05/06: 43,742), (06/07: 50,801), (07/08: 59,788), (08/09: 125,707), (09/10: 148,905), (10/11: 217,317), (11/12: 218,746) HEIs: (05/06 – 07/08: 7), (08/09 – 09/10: 12), (10/11 – 11/12: 18)
As with PGR applications, in each application year, applications from women were more likely to convert to enrolments than applications from men.
Across the first three years of the period, the proportion of applications submitted by men that led to enrolment remained broadly steady, with 21% of applications leading to enrolment in 2005/06 and 2006/07, before dropping slightly to 20% in 2007/08. The level then dropped further to 18%, remaining at that level until a big increase to 22% in 2011/12.
23 Although enrolment figures for applications submitted within 2011/12 must be treated with some caution, as any applications submitted for study beginning after the academic year 2012/13 would not have been included in these figures.
118

Understanding Postgraduate Demand
Applications submitted by women were consistently more likely to lead to enrolment than men; however, as the proportion of applications from women leading to enrolment fell over the first six years, from 27% to 19%, while the proportion of male enrolment remained steadier, the gap between the genders decreased.
The proportion of applications leading to enrolment submitted by both men and women both increased in 2011/12, with 22% of applications submitted by men and 23% of applications submitted by women leading to enrolment.
6.3.5. Trends in PGR Applications by Gender by Course Type
Table 6.5 below shows the proportions of applications submitted by men and women for the different postgraduate research qualifications.
Table 6.5: Proportion of PGR Applications by Gender by Qualification Type
Year
2005
/06
2006
/07
2007
/08
2008
/09
2009
/10
2010
/11
2011
/12
Base: HEIs 6 11 17
Base: Applications 5,274 6,562 7,636 25,655 30,366 51,464 56,724
PhDs 77% 82% 84% 87% 85% 88% 87%
Professional doctorates
1% 2% 1% 2% 3% 2% 3% Male
Research Masters
21% 17% 14% 11% 12% 9% 10%
PhDs 83% 86% 89% 87% 87% 87% 85%
Professional doctorates
2% 2% 2% 2% 3% 4% 4% Female
Research Masters
15% 12% 10% 10% 10% 10% 10%
Throughout the period, the majority of applications submitted by both men and women were for PhDs; there was a particular increase in the proportion of applications submitted by men for this qualification type, rising from 77% of applications submitted by men in 2005/06 to 87% in 2011/12. There was also a slight rise in the proportion of applications submitted by women for PhDs, from 83% in 2005/06 to 85% in 2011/12.
119
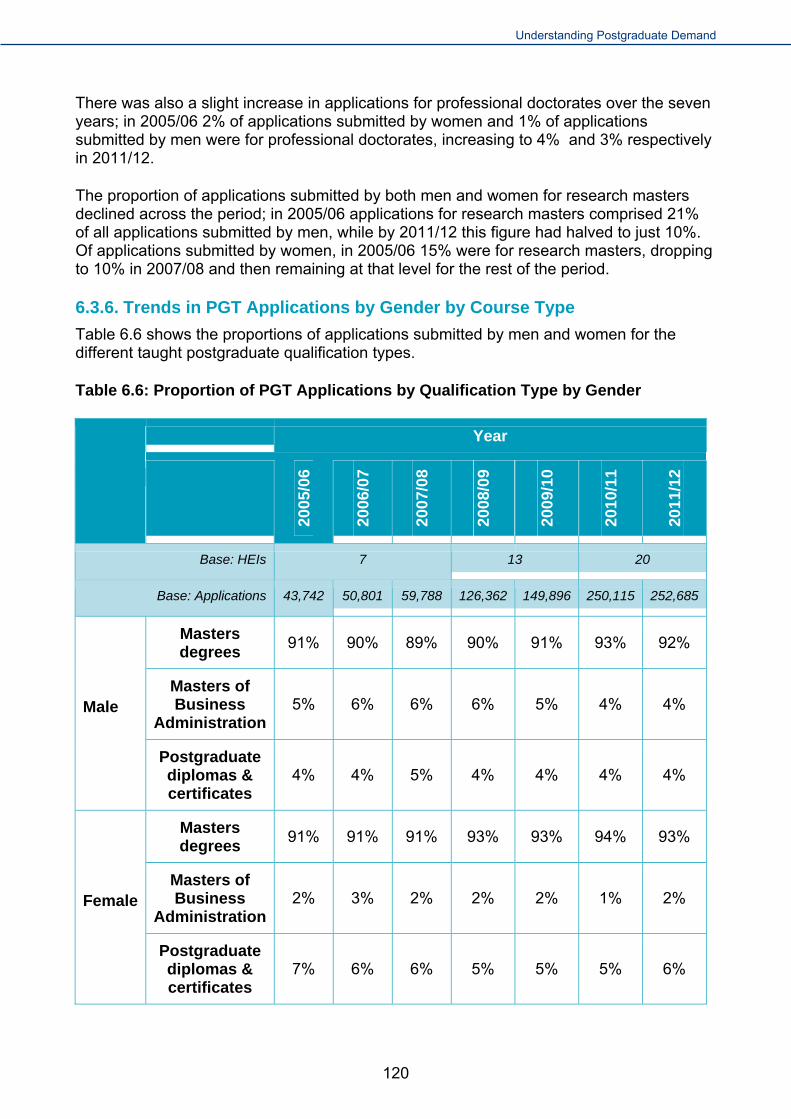
Understanding Postgraduate Demand
There was also a slight increase in applications for professional doctorates over the seven years; in 2005/06 2% of applications submitted by women and 1% of applications submitted by men were for professional doctorates, increasing to 4% and 3% respectively in 2011/12.
The proportion of applications submitted by both men and women for research masters declined across the period; in 2005/06 applications for research masters comprised 21% of all applications submitted by men, while by 2011/12 this figure had halved to just 10%. Of applications submitted by women, in 2005/06 15% were for research masters, dropping to 10% in 2007/08 and then remaining at that level for the rest of the period.
6.3.6. Trends in PGT Applications by Gender by Course Type
Table 6.6 shows the proportions of applications submitted by men and women for the different taught postgraduate qualification types.
Table 6.6: Proportion of PGT Applications by Qualification Type by Gender
Year
2005
/06
2006
/07
2007
/08
2008
/09
2009
/10
2010
/11
2011
/12
Base: HEIs 7 13 20
Base: Applications 43,742 50,801 59,788 126,362 149,896 250,115 252,685
Masters degrees
91% 90% 89% 90% 91% 93% 92%
Masters of Business
Administration 5% 6% 6% 6% 5% 4% 4% Male
Postgraduate diplomas & certificates
4% 4% 5% 4% 4% 4% 4%
Masters degrees
91% 91% 91% 93% 93% 94% 93%
Masters of Business
Administration 2% 3% 2% 2% 2% 1% 2% Female
Postgraduate diplomas & certificates
7% 6% 6% 5% 5% 5% 6%
120

Understanding Postgraduate Demand
The proportion of applications for each PGT qualification type is very similar for both genders. For both men and women, the vast majority of PGT applications were for Masters degrees; these accounted for 91% of applications submitted by men and women in 2005/06, rising slightly to 92% and 93% respectively in 2011/12.
Applications submitted by men were more likely to be for MBAs than applications submitted by women in each of the seven years, with an average of 5% compared to 1%; however, the proportion of applications submitted by men for MBAs declined slightly from high points of 6% between 2006/07 and 2008/09 to 4% in 2010/11 and 2011/12.
Applications submitted by women were slightly more likely to be for postgraduate diplomas and certificates than applications submitted by men; levels remained broadly consistent across the seven years, and in 2011/12 6% of applications submitted by women and 4% of applications submitted by men were for postgraduate diplomas and certificates.
6.3.7. Trends in PGR Applications by Gender By Subject
Table 6.7 below shows the proportions of applications submitted by men and women for different postgraduate research subject areas.
Table 6.7: Proportion of PGR Applications by Subject Area by Gender
Year
2005
/06
2006
/07
2007
/08
2008
/09
2009
/10
2010
/11
2011
/12
Base: HEIs: 6 11 17
Base: Applications: 5,274 6,562 7,636 25,655 30,366 51,464 56,724
Medicine and dentistry 1% 1% 1% 3% 3% 3% 3%
Subjects allied to Medicine <1% <1% <1% 2% 3% 4% 5%
Biological sciences 3% 5% 6% 4% 5% 8% 7%
Veterinary Sciences / agriculture / related subjects
<1% <1% <1% 1% 1% <1% <1%
Chemistry 1% 2% 2% 2% 2% 3% 3%
Physics 2% 2% 1% 2% 2% 2% 2%
Mal
e
Other physical sciences 2% 3% 4% 3% 3% 4% 4%
121

Understanding Postgraduate Demand
Year
2005
/06
2006
/07
2007
/08
2008
/09
2009
/10
2010
/11
2011
/12
Mathematical sciences 4% 3% 4% 4% 3% 4% 4%
Computer science / librarianship / info science
4% 5% 5% 4% 4% 5% 4%
Engineering / technology / building / architecture
14% 16% 16% 16% 16% 17% 18%
Social / political / economic studies
45% 38% 36% 27% 26% 22% 21%
Law 4% 5% 5% 4% 4% 3% 4%
Business / administrative studies
11% 12% 12% 13% 12% 11% 11%
Languages 1% 2% 2% 3% 3% 3% 3%
Humanities 5% 4% 4% 5% 6% 5% 5%
Creative arts / design 1% 1% 1% 1% 1% 1% 1%
Education 1% 2% 2% 2% 2% 2% 2%
Unknown and combined subjects
<1% <1% <1% 6% 5% 4% 3%
Medicine and dentistry 1% 2% 2% 4% 5% 5% 5%
Subjects allied to Medicine 1% <1% <1% 4% 5% 6% 7%
Biological sciences 5% 8% 10% 7% 7% 12% 11%
Veterinary Sciences / agriculture / related subjects
<1% <1% <1% <1% <1% <1% <1%
Chemistry 2% 2% 2% 2% 1% 2% 2%
Fem
ale
Physics 1% 1% 1% 1% 1% 1% 1%
122
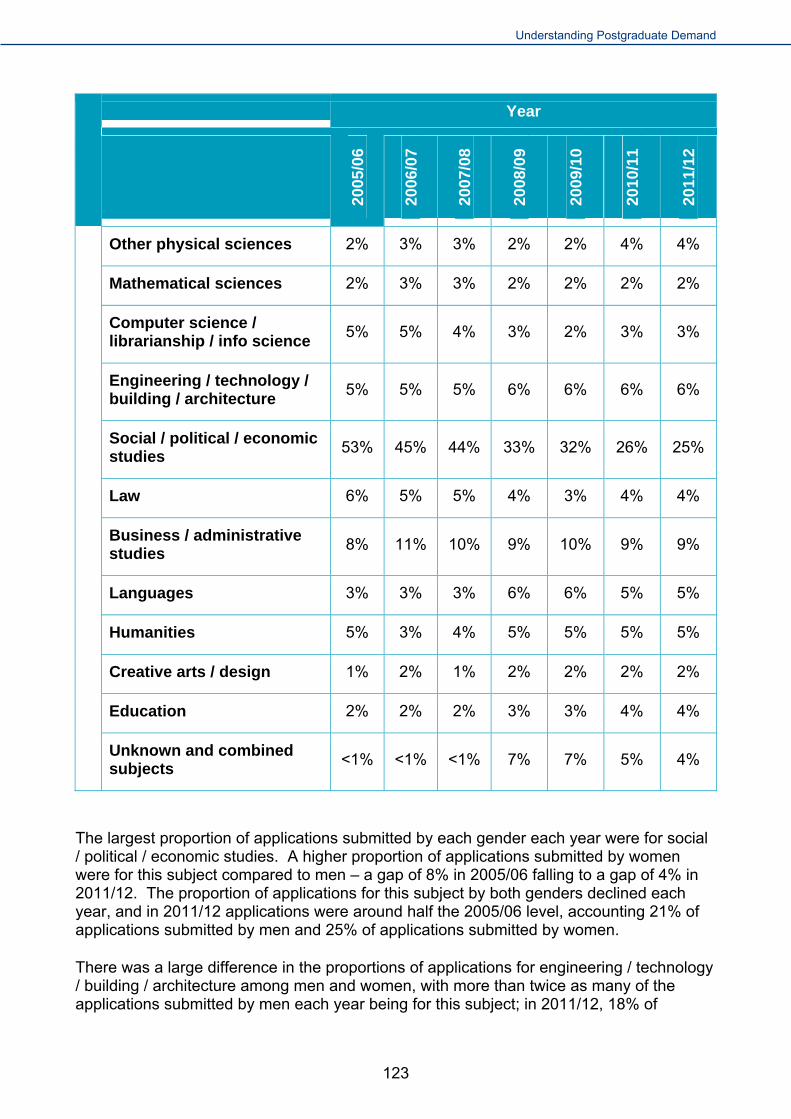
Understanding Postgraduate Demand
Year
2005
/06
2006
/07
2007
/08
2008
/09
2009
/10
2010
/11
2011
/12
Other physical sciences 2% 3% 3% 2% 2% 4% 4%
Mathematical sciences 2% 3% 3% 2% 2% 2% 2%
Computer science / librarianship / info science
5% 5% 4% 3% 2% 3% 3%
Engineering / technology / building / architecture
5% 5% 5% 6% 6% 6% 6%
Social / political / economic studies
53% 45% 44% 33% 32% 26% 25%
Law 6% 5% 5% 4% 3% 4% 4%
Business / administrative studies
8% 11% 10% 9% 10% 9% 9%
Languages 3% 3% 3% 6% 6% 5% 5%
Humanities 5% 3% 4% 5% 5% 5% 5%
Creative arts / design 1% 2% 1% 2% 2% 2% 2%
Education 2% 2% 2% 3% 3% 4% 4%
Unknown and combined subjects
<1% <1% <1% 7% 7% 5% 4%
The largest proportion of applications submitted by each gender each year were for social / political / economic studies. A higher proportion of applications submitted by women were for this subject compared to men – a gap of 8% in 2005/06 falling to a gap of 4% in 2011/12. The proportion of applications for this subject by both genders declined each year, and in 2011/12 applications were around half the 2005/06 level, accounting 21% of applications submitted by men and 25% of applications submitted by women.
There was a large difference in the proportions of applications for engineering / technology / building / architecture among men and women, with more than twice as many of the applications submitted by men each year being for this subject; in 2011/12, 18% of
123

Understanding Postgraduate Demand
applications from men were for engineering / technology / building / architecture compared to 6% of applications from women.
Applications for business and administrative studies contributed the third highest amount of all applications submitted by men, accounting for 12% of applications on average, and 11% in 2011/12. A lower proportion of applications submitted by women were for this subject, with an average of 9% of applications submitted across the seven years, and the same level in 2011/12.
Of the applications submitted by women, a higher proportion were for biological sciences compared to applications submitted by men. However, the proportion of applications submitted by both genders for biological sciences increased across the period, rising from 3% of applications submitted by men and 5% of applications submitted by women in 2005/06 to 7% of applications submitted by men and 11% of applications submitted by women in 2011/12.
In each of the seven years, compared to men, a higher proportion of applications submitted by women were for subjects allied to medicine, although again the proportion of applications submitted by both genders for this subject area increased over time. Subjects allied to medicine accounted for less than 1% of applications from men in 2005/06, rising to 5% in 2011/12, while it accounted for 1% of applications from women in 2005/06, rising to 7% in 2011/12.
Within the period there was an increase in the number of applications submitted by women for languages courses, rising from 3% of applications in 2005/06 to 5% in 2011/12 (with high points of 6% in 2008/09 and 2009/10).
There was a similar pattern in applications for medicine and dentistry, with 1% of applications submitted by both men and women in 2005/06 being for this subject, rising to 3% of applications submitted by men and 5% of applications submitted by women in 2011/12.
In the first few years of the period the proportions of applications submitted by men and women for education courses were broadly in line with each other at around 2%; however, the proportion of applications submitted by women for this subject increased in 2008/09, after which a consistently higher proportion of applications submitted by women were for education. In 2011/12, education accounted for 4% of applications submitted by women, compared to 2% of applications submitted by men.
6.3.8. Trends in PGT Applications by Gender By Subject
Table 6.8 overleaf shows the proportions of applications submitted by men and women for different taught postgraduate subject areas.
124

Understanding Postgraduate Demand
Table 6.8: Proportion of PGT Applications by Subject Area by Gender
Year
2005
/06
2006
/07
2007
/08
2008
/09
2009
/10
2010
/11
2011
/12
Base: HEIs: 7 13 20
Base: Applications: 43,742 50,801 59,788 126,362 149,896 250,115 252,685
Medicine and dentistry <1% <1% <1% 3% 3% 2% 2%
Subjects allied to Medicine
2% 2% 2% 4% 3% 3% 3%
Biological sciences 2% 2% 2% 2% 2% 2% 2%
Veterinary Sciences / agriculture / related subjects
1% 1% 1% 1% 1% 1% 1%
Chemistry 1% 1% 1% 1% <1% <1% <1%
Physics <1% <1% <1% <1% <1% <1% <1%
Other physical sciences
4% 4% 4% 3% 3% 3% 3%
Mathematical sciences 2% 2% 3% 2% 3% 3% 3%
Computer science / librarianship / info science
6% 5% 4% 6% 6% 6% 6%
Engineering / technology / building / architecture
16% 17% 17% 19% 19% 20% 20%
Social / political / economic studies
21% 20% 17% 13% 13% 15% 14%
Law 6% 5% 5% 7% 7% 5% 5%
Mal
e
Business / 32% 33% 35% 31% 33% 31% 33%
125

Understanding Postgraduate Demand
Year
2005
/06
2006
/07
2007
/08
2008
/09
2009
/10
2010
/11
2011
/12
administrative studies
Languages 1% 1% 1% 2% 2% 2% 2%
Humanities 3% 3% 3% 3% 2% 2% 2%
Creative arts / design 1% 1% 1% 1% 1% 1% 1%
Education 2% 2% 3% 2% 2% 2% 2%
Unknown and combined subjects
<1% - <1% 1% 1% 2% 2%
Medicine and dentistry <1% <1% <1% 5% 5% 2% 2%
Subjects allied to Medicine
3% 2% 3% 7% 7% 5% 5%
Biological sciences 4% 4% 4% 3% 2% 3% 3%
Veterinary Sciences / agriculture / related subjects
1% <1% <1% 1% <1% <1% <1%
Chemistry <1% <1% <1% <1% <1% <1% <1%
Physics - <1% <1% <1% <1% <1% <1%
Other physical sciences
2% 2% 3% 2% 2% 2% 2%
Mathematical sciences 2% 2% 2% 2% 2% 2% 2%
Computer science / librarianship / info science
5% 5% 5% 6% 6% 5% 5%
Fem
ale Engineering /
technology / building / architecture
4% 4% 4% 5% 5% 5% 6%
126

Understanding Postgraduate Demand
Year
2005
/06
2006
/07
2007
/08
2008
/09
2009
/10
2010
/11
2011
/12
Social / political / economic studies
30% 29% 25% 17% 15% 19% 18%
Law 7% 7% 7% 9% 8% 5% 5%
Business / administrative studies
30% 31% 33% 31% 34% 36% 38%
Languages 3% 3% 3% 5% 5% 5% 4%
Humanities 3% 3% 3% 2% 2% 2% 2%
Creative arts / design 2% 2% 2% 2% 2% 2% 2%
Education 4% 4% 4% 4% 4% 5% 4%
Unknown and combined subjects
<1% <1% - 1% 2% 2% 2%
Applications for business and administrative studies made up the largest proportion of applications submitted by men in each year of the period, and the largest proportion of applications submitted by women every year apart from 2005/06 (when it was equal to the proportion of applications for social / political / economic studies). The proportions of applications submitted by men and women for this subject were broadly similar throughout the period, at around three in ten applications, although by the end of the period the number of applications submitted by women for business and administrative studies were approaching four in ten. In 2011/12, 33% of applications submitted by men and 38% of applications submitted by women were for business and administrative studies.
Applications for engineering / technology / building / architecture made up a far smaller proportion of applications submitted by women; in 2011/12 just 6% of applications submitted by women were for this subject, around three times lower than the 20% of applications submitted by men.
Throughout the period, applications submitted by women were more likely to be for social / political / economic studies than applications submitted by men, accounting for 30% of applications submitted by women in 2005/06 compared to 21% of applications submitted by men. However, the proportion decreased over time, with a particularly big drop in 2008/09 for both genders (falling to 17% of applications submitted by women and 13% of applications submitted by men). Although the proportion of applications submitted for this
127

Understanding Postgraduate Demand
subject increased again slightly after that dip, in 2011/12 the level stood at 18% of applications submitted by women and 14% of applications submitted by men.
6.4. Profile of UK-domiciled Applications to Postgraduate Study by Ethnicity
This section looks at the trends in application by ethnicity. It looks at an overall breakdown of PGR and PGT applications and at conversion ratios for different ethnic groups. The base sizes of applications for individual ethnic groups were not large enough to support some of the more detailed analysis by course type and subject area within ethnicity that has been shown in the sections on age and gender.
6.4.1. UK- domiciled Applications to PGR Programmes by Ethnicity
Figure 6.9 set outs the profile of PGR applications submitted by UK-domiciled candidates to PGR programmes by ethnicity.
Figure 6.9: Proportion of UK-domiciled Applications to PGR by Ethnicity
69%75%
68% 73% 74% 72% 70%
2%1%
2%4% 4%
3% 3%9%
7%8%
8% 6%7% 7%
6% 4% 7%4% 4% 7% 8%
1% 3% 3%2% 1% 2% 2%
11% 9% 10% 7% 8% 8% 8%
0%
10%
20%
30%
40%
50%
60%
70%
80%
90%
100%
2005-2006 2006-2007 2007-2008 2008-2009 2009-2010 2010-2011 2011-2012
White Mixed Asian Black Chinese Other Not known / information refusedB
ase: All UK-domiciled applications to PGR programmes with ethnicity supplied (39,407) (05/06: 967), (06/07: 1,219), (07/08: 1,449), (08/09: 4,615), (09/10: 6,135), (10/11: 12,492), (11/12: 12,530) HEIs: (05/06 – 07/08: 6), (08/09 – 09/10: 10), (10/11 – 11/12: 17)
The proportion of PGR applications submitted by white candidates has fluctuated slightly between 68% and 75% across the period. In 2011/12 70% of applications to postgraduate research courses were submitted by white applicants. This is lower than the proportion
128
Understanding Postgraduate Demand
with an ethnic group of white in the general population of England and Wales (86%)24 and slightly lower than the proportion of white undergraduate students in 2011/12 (80%)25.
Applications submitted by Asian applicants made up the second largest group within UK-domiciled applications each year up until 2011/12, when, at 7%, the proportion of applications submitted by Asian candidates for postgraduate research was 1% lower than the proportion of applications submitted by Black candidates. This proportion is very close to the proportion of people with an Asian ethnic background in the general population (6.8%), as well as the proportion of undergraduate students with an Asian ethnic background in 2011/12 (7.8%).
The proportion of applications submitted by black candidates varied somewhat in the early years of the period, dropping from 6% in 2005/06 to 4% in 2006/07, before rising to 7% in 2007/08. After falling back to 4% in 2008/09 and 2009/10, the proportion of applications from black candidates began to increase again in 2010/11, reaching 8% in 2011/12. This proportion is greater than that of the general population, where 3.3% report coming from a black ethnic background; it is also slightly higher than the proportion of black undergraduates, which stood at 6% in 2011/12.
There were fairly high levels of applications each year where the candidate either did not record or refused to disclose their ethnicity; this was highest in 2005/06 when the proportion was 11%, and lowest in 2008/09, when the proportion was 7%. In 2011/12 ethnicity information was refused or unknown for 8% of applications. The fluctuations in these figures is likely to have been caused by changes in how this information is collected by the individual HEIs’ application forms and systems throughout the period.
24 2011 Census, Key Statistics for Local Authorities in England and Wales, ONS [accessed 31/10/2013 at: http://www.ons.gov.uk/ons/rel/census/2011-census/key-statistics-for-local-authorities-in-england-and-wales/index.html
25 UK domiciled HE students by level of study, gender, mode of study, first year identifier and ethnicity 2011/12, HESA data table [accessed 31/10/2013 at: http://www.hesa.ac.uk/content/view/1897/239/
129

Understanding Postgraduate Demand
6.4.2. UK-domiciled Applications to PGT Programmes by Ethnicity
Figure 6.10 shows the ethnicity profile of applications submitted by UK-domiciled candidates to PGT programmes.
Figure 6.10: Proportion of UK-domiciled Applications to PGT by Ethnicity
73% 72% 71%66% 65% 64% 63%
2% 2% 3%3% 3% 3% 3%
8% 9% 8%11% 11% 9% 9%
6% 6% 7% 8% 8%9% 11%
8% 8% 9% 8% 9% 11% 9%
0%
10%
20%
30%
40%
50%
60%
70%
80%
90%
100%
2005-2006 2006-2007 2007-2008 2008-2009 2009-2010 2010-2011 2011-2012
White Mixed Asian Black Chinese Other Not known / information refusedB
ase: All UK-domiciled applications to PGT programmes with ethnicity supplied (128,895) (05/06: 6,240), (06/07: 6,897), (07/08: 7,854), (08/09: 19,772), (09/10: 21,244), (10/11: 34,687), (11/12: 32,201) HEIs: (05/06 – 07/08: 7), (08/09 – 09/10: 13), (10/11 – 11/12: 20)
Although the majority of applications each year were submitted by white candidates, this proportion has fallen fairly steadily across the seven years, from nearly three-quarters (73%) of applications in 2005/06 to just over three-fifths (63%) in 2011/12. This proportion is considerably lower than the 86% of white people in the general population of England and Wales, and 80% in the 2011/12 undergraduate population.
However, in terms of absolute numbers, applications submitted by white candidates increased year on year throughout the period; the decline in proportion was due to the fact that the numbers of applications submitted by applicants from other ethnic backgrounds increased at a greater rate: while applications submitted by white candidates increased by 66% between 2005/06 and 2011/12, this compared to an average 168% increase in applications from candidates from other ethnic groups; among these, applications from black candidates experienced the largest growth in numbers across the period, with a 248% increase.
130

Understanding Postgraduate Demand
The proportion of applications submitted by Black candidates also increased year on year; in 2011/12, applications from Black candidates made up 11% of the total, up from just 6% in 2005/06. This proportion is notably higher than that within the general population (3.3%) and the undergraduate population in 2011/12 (6%).
The proportion of applications from Asian applicants increased from 8% in 2007/08 to a high of 11% in both 2008/09 and 2009/10; however, the following year this the proportion dropped slightly to 9%, and remained at this level in 2011/12. This proportion is slightly higher than the proportion of people with an Asian ethnic background in the general population (6.8%) and in the 2011/12 undergraduate population (7.8%).
Applications from applicants with a mixed, Chinese or other ethnic background made up a minority of the total number of applications, and the proportions of each remained fairly steady across the period; in 2011/12, 3% of applications were submitted by applicants with a mixed ethnic background, 2% were submitted by those with a Chinese background, and a further 2% were submitted by those with an other ethnic background. This compares to general population figures of 2.2% with a mixed ethnic background, 0.7% with a Chinese ethnic background, and 1% with an other ethnic background, and to 2011/12 undergraduate figures of 3.9% with a mixed or other ethnic background and 0.8% with a Chinese ethnic background.
As with PGR applications, there was a fairly high proportion of applications each year for which ethnicity information was either refused or unknown, although this proportion has remained relatively consistent over time.
6.4.3. Ratios of Applications to PGR to Places Taken Up by Ethnicity
Figure 6.11 overleaf shows enrolments onto PGR courses as a percentage of applications submitted by UK-domiciled applicants from different ethnic backgrounds. Due to the low base sizes of some of the smaller ethnic groups, these figures must be taken with some caution.
131

Understanding Postgraduate Demand
Figure 6.11: Percentage of UK-domiciled PGR Applications Leading to Enrolment split by ethnicity
0%
10%
20%
30%
40%
50%
60%
70%
80%
2005-2006 2006-2007 2007-2008 2008-2009 2009-2010 2010-2011 2011-2012
White Mixed Asian Black Chinese Other Not known / information refusedB
ase: All UK-domiciled applications to PGR programmes with ethnicity and enrolment status supplied (34,885) (05/06: 967), (06/07: 1,219), (07/08: 1,449), (08/09: 4,615), (09/10: 6,135), (10/11: 10,318), (11/12: 10,182) HEIs: (05/06 – 07/08: 6), (08/09 – 09/10: 10), (10/11 – 11/12: 16)
Over time, the distinction between PGR application to enrolment ratios by ethnic group has become less marked but even in 2011/12 there were still differences.
Throughout the period, between two-fifths and one half of all applications submitted by white candidates led to enrolment, the exact proportion varying between 41% and 49%. The highest levels came in 2005/06 (48%), 2008/09 (44%) and 2009/10 (49%). In 2011/12 41% of applications submitted by White candidates led to enrolment.
The proportion of applications submitted by Asian candidates leading to enrolment remained fairly steady across the seven years. There was a slight drop from 28% in 2005/06 to 24% in 2006/07; however, after this the proportion began to increase gradually, getting back up to 28% by 2011/12.
The proportion of applications from Black candidates that led to enrolment increased throughout the period, rising from 19% in 2005/06 to 29% in 2011/12.
132

Understanding Postgraduate Demand
6.4.4. Ratios of Applications to PGT to Places Taken Up by Ethnicity
Figure 6.12 below shows enrolments onto PGT courses as a percentage of applications submitted by UK-domiciled applicants from different ethnic backgrounds.
Figure 6.12: Percentage of UK-domiciled PGT Applications Leading to Enrolment split by ethnicity
0%
10%
20%
30%
40%
50%
60%
70%
80%
2005-2006 2006-2007 2007-2008 2008-2009 2009-2010 2010-2011 2011-2012
White Mixed Asian Black Chinese Other Not known / information refusedB
ase: All UK-domiciled applications to PGT programmes with ethnicity and enrolment status supplied (119,305) (05/06: 6,240), (06/07: 6,897), (07/08: 7,854), (08/09: 19,761), (09/10: 21,227), (10/11: 29,650), (11/12: 27,676) HEIs: (05/06 – 07/08: 7), (08/09 – 09/10: 12), (10/11 – 11/12: 18)
As with PGR applications, the difference between application to enrolment ratios by ethnic group appears to have closed over time.
However, in each year covered, applications submitted by White candidates were more likely to lead to an enrolment; this proportion decreased from 63% in 2007/08 to 55% in 2008/09 and 2009/10, before increasing again to 57% in 2010/11 and then 64% in 2011/12, the highest proportion of the period.
Applications submitted by applicants from Mixed, Asian and Black backgrounds were also much more likely to lead to an enrolment in 2011/12 compared with previous years; between 2005/05 and 2010/11, an average of 43% of applications from applicants with a Mixed ethnic background, 38% of applications submitted by Black candidates, and 36% of applications from Asian candidates led to enrolment. However, in 2011/12 the proportion for each of these groups was 56%.
133
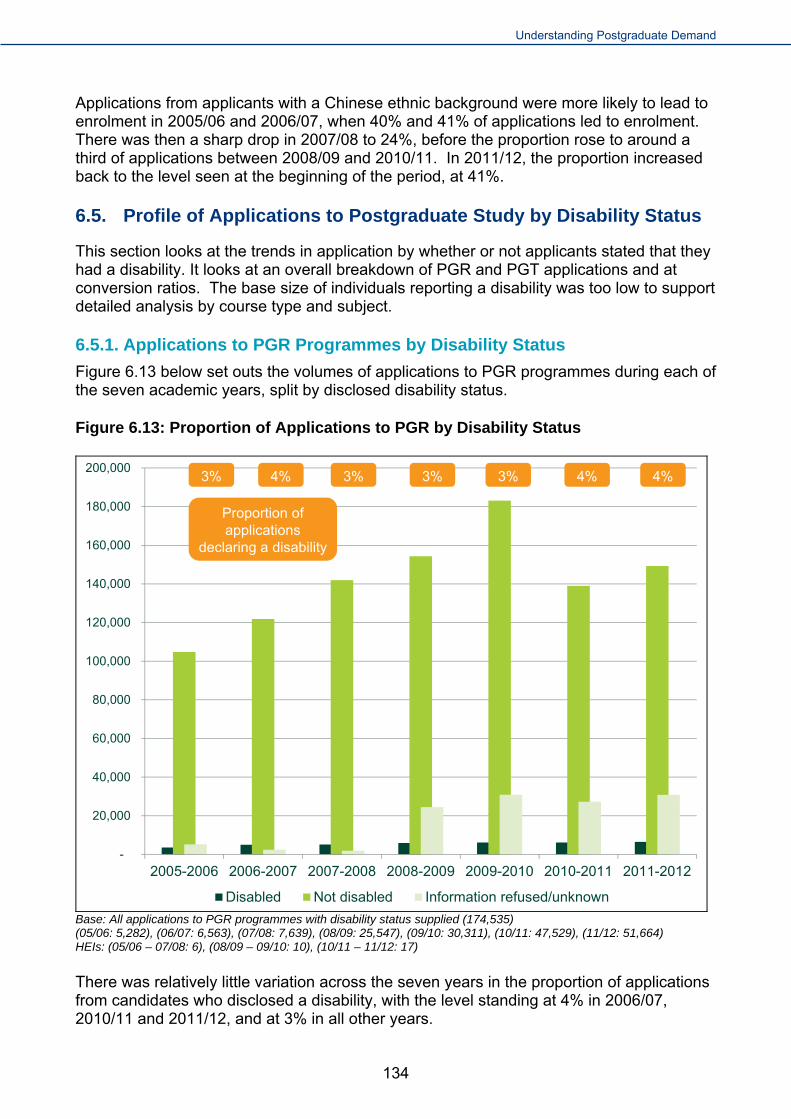
Understanding Postgraduate Demand
Applications from applicants with a Chinese ethnic background were more likely to lead to enrolment in 2005/06 and 2006/07, when 40% and 41% of applications led to enrolment. There was then a sharp drop in 2007/08 to 24%, before the proportion rose to around a third of applications between 2008/09 and 2010/11. In 2011/12, the proportion increased back to the level seen at the beginning of the period, at 41%.
6.5. Profile of Applications to Postgraduate Study by Disability Status
This section looks at the trends in application by whether or not applicants stated that they had a disability. It looks at an overall breakdown of PGR and PGT applications and at conversion ratios. The base size of individuals reporting a disability was too low to support detailed analysis by course type and subject.
6.5.1. Applications to PGR Programmes by Disability Status
Figure 6.13 below set outs the volumes of applications to PGR programmes during each of the seven academic years, split by disclosed disability status.
Figure 6.13: Proportion of Applications to PGR by Disability Status
-
20,000
40,000
60,000
80,000
100,000
120,000
140,000
160,000
180,000
200,000
2005-2006 2006-2007 2007-2008 2008-2009 2009-2010 2010-2011 2011-2012
Disabled Not disabled Information refused/unknown
Proportion of applications
declaring a disability
3% 4%4%3%3%3%4%
Base: All applications to PGR programmes with disability status supplied (174,535) (05/06: 5,282), (06/07: 6,563), (07/08: 7,639), (08/09: 25,547), (09/10: 30,311), (10/11: 47,529), (11/12: 51,664) HEIs: (05/06 – 07/08: 6), (08/09 – 09/10: 10), (10/11 – 11/12: 17)
There was relatively little variation across the seven years in the proportion of applications from candidates who disclosed a disability, with the level standing at 4% in 2006/07, 2010/11 and 2011/12, and at 3% in all other years.
134

Understanding Postgraduate Demand
6.5.2. Applications to PGT Programmes by Disability Status
Similarly, figure 6.14 below set outs the volumes of applications to PGT programmes during each of the seven academic years, split by disclosed disability status.
Figure 6.14: Proportion of Applications to PGT by Disability Status
0
100000
200000
300000
400000
500000
600000
700000
800000
900000
1000000
2005-2006 2006-2007 2007-2008 2008-2009 2009-2010 2010-2011 2011-2012
Disabled Not disabled Information refused/unknown
Proportion of applications
declaring a disability
3% 2%2%2%2%3%3%
Base: All applications to PGT programmes with disability status supplied (895,113) (05/06: 43,754), (06/07: 50,823), (07/08: 59,792), (08/09: 126,391), (09/10: 149,883), (10/11: 231,601), (11/12: 232,869) HEIs: (05/06 – 07/08: 7), (08/09 – 09/10: 13), (10/11 – 11/12: 20)
As with applications to PGR, the proportion of applications to PGT programmes from candidates who disclosed a disability remained fairly steady across the period, although at a slightly lower level: 3% of all applications disclosed a disability in the first three years of the period, and 2% each year thereafter.
135

Understanding Postgraduate Demand
6.5.3. Ratios of Applications to PGR to Places Taken Up by Disability Status
Figure 6.15 shows enrolments onto postgraduate research courses as a percentage of applications submitted by those who declared they either did or did not have any disabilities.
Figure 6.15: Percentage of PGR Applications Leading to Enrolment split by disability status
23%
31%
28% 27%
38%
30%
26%
17%
13% 14%
18%20% 19%
18%
0%
5%
10%
15%
20%
25%
30%
35%
40%
2005-2006 2006-2007 2007-2008 2008-2009 2009-2010 2010-2011 2011-2012
Disabled Not disabledB
ase: All applications to PGR programmes marked ‘disabled’ or ‘not disabled’ with enrolment status supplied (129,441) (05/06: 5,037), (06/07: 6,390), (07/08: 7,486), (08/09: 21,162), (09/10: 24,768), (10/11: 31,262), (11/12: 33,336) HEIs: (05/06 – 07/08: 6), (08/09 – 09/10: 10), (10/11 – 11/12: 16)
Although making up a far smaller proportion of overall applications, applications submitted by candidates who disclosed that they had a disability were notably more likely to lead to enrolment than applications submitted by candidates who declared that they did not have any disabilities. At least a quarter of PGR applications submitted by candidates declaring a disability each year led to enrolment, with a particularly high level of enrolment in 2009/10 at 38%. Applications in the 2005/06 academic years had the lowest proportions of enrolment for candidates who declared a disability, at 23%; in 2011/12, the proportion was lower than the previous two years at 26%.
136

Understanding Postgraduate Demand
6.5.4. Ratios of Applications to PGT to Places Taken Up by Disability Status
Figure 6.16 shows enrolments onto taught postgraduate courses as a percentage of applications submitted by those who declared they either did or did not have any disabilities.
Figure 6.16: Percentage of PGT Applications Leading to Enrolment split by disability status
42%
38% 37%39%
40% 40%
45%
24% 23% 23%25%
24% 23%
29%
0%
5%
10%
15%
20%
25%
30%
35%
40%
45%
50%
2005-2006 2006-2007 2007-2008 2008-2009 2009-2010 2010-2011 2011-2012
Disabled Not disabledB
ase: All applications to PGT programmes marked ‘disabled’ or ‘not disabled’ with enrolment status supplied (660,457) (05/06: 40,658), (06/07: 48,093), (07/08: 57,341), (08/09: 96,488), (09/10: 115,897), (10/11: 151,330), (11/12: 150,650) HEIs: (05/06 – 07/08: 7), (08/09 – 09/10: 12), (10/11 – 11/12: 18)
As was the case with applications for PGR, applications for PGT submitted by candidates who disclosed a disability were more likely to lead to enrolment than applications submitted by candidates who disclosed that they did not have any disabilities. This proportion was highest at either end of the period, with 42% of applications submitted by those declaring a disability leading to enrolment in 2005/06 and 45% in 2011/12.
137

Understanding Postgraduate Demand
Chapter 7: Proportion of applications resulting in an offer This chapter provides information on the proportion of applications that resulted in an offer for both PGR and PGT programmes firstly at an overall level, then by qualification type, HEI, subject area and domicile. This information complements data on the proportion of applications that resulted in places taken up which has been presented throughout the report.
7.1. Caveats and limitations of the data
Just two of the participating HEIs were unable to provide information about whether or not applications resulted in the offer of a place (for 2011/12 only). Data from these HEIs has therefore been excluded from the analysis in this section.
In two HEIs some records were flagged as having an offer “pending” where a decision was yet to be made; this applied to only minority of records (less than 1% of total). For the purposes of analysis in this chapter, these records have also been excluded.
7.2. Proportion of applications that result in an offer
7.2.1. Proportion of PGR applications that result in an offer
The ratio of PGR applications received to offers made has remained broadly consistent over the course of the past seven academic years. Since 2005/06, the ratio of applications to offers has varied between 2.71 and 3.40 applications to every place offered (Figure 7.1)
In general terms, when the volume of applications increased so too did the volume of offers made so that this applications to offers ratio remained broadly similar.
138

Understanding Postgraduate Demand
Figure 7.1: Ratio of applications to offers made (PGR)
-
50,000
100,000
150,000
200,000
250,000
2005/06 2006/07 2007/08 2008/09 2009/10 2010/11 2011/12
Total number of applications Total number of offers made
3.03 2.902.752.713.053.273.40
Ratio of applications to offers made
Base: All applications to PGR programmes with offer status supplied (169,334) (05/06: 5,282), (06/07: 6,563), (07/08: 7,639), (08/09: 25,658), (09/10: 30,368), (10/11: 44,688), (11/12: 49,136) HEIs: (05/06 – 07/08: 6), (08/09 – 09/10: 10), (10/11 – 11/12: 16)
These trends shown in figure 7.1 generally reflect the applications-to-take-up ratios discussed earlier (section 2.2.1); as the number of offers made increased, so too did the number of applicants accepting a place to study.
In 2009/10 where the ratio of applications to enrolment was at its lowest (at 5.41 applications per place taken up), the ratio of applications to offers made was also at its lowest (2.71 applications to each place offered).
However, there is an exception; in 2008/9 when there was a relatively high ratio of applications to offers made (3.05 applications to every offer), a fairly low proportion of offers were accepted (6.01 applications to each place taken up).
The ratio of PGR applications to offers made varied considerably between the different HEIs who shared their data. Looking at the most recent application year alone, the ratios varied from 1:1 (so every PGR application resulted in an offer) to 8:1.
In comparison with 2010/11, at most HEIs it was more competitive to secure a place in the most recent academic year. Since 2010/11 for two third of participating HEIs (66%) the number of PGR applications received to every place offered has increased. A fifth of
139

Understanding Postgraduate Demand
participating HEIs (20%) saw the ratio of applications to offers remain consistent and only a minority (14%) saw this ratio decrease over the course of the past two years.
7.2.2. Proportion of PGT applications that result in an offer
The ratio of PGT applications received to offers made has also remained consistent over the course of the past seven academic years; even more so than for PGR applications. Again there is a strong correlation between the volume of applications made in an application year and the volume of offers made.
As Figure 7.2 demonstrates, since 2005/06, the ratio of applications to offers has varied between 1.67 and 1.89 applications to every place offered. Between 2005/06 and 2009/10, the ratio of applications to offers made increased slightly year on year, before decreasing in 2010/11 and 2011/12.
Figure 7.2: Ratio of applications to offers made (PGT)
0
200000
400000
600000
800000
1000000
1200000
1400000
2005/06 2006/07 2007/08 2008/09 2009/10 2010/11 2011/12
Total number of applications Total number of offers made
1.74 1.671.691.89/
1.871.831.79
Ratio of applications to offers made
Base: All applications to PGT programmes with offer status supplied (866,145) (05/06: 43,754), (06/07: 50,823), (07/08: 59,793), (08/09: 125,757), (09/10: 148,938), (10/11: 217,375), (11/12: 219,705) Participating HEIs: (05/06 – 07/08: 7), (08/09 – 09/10: 12), (10/11 – 11/12: 18)
2011/12 saw the lowest ratio of applications to places offered (a ratio of 1.64 applications received for every place offered). Although the number of applications received increased only slightly in comparison with 2010/11 (1%), the total number of offers made increased at a slightly greater rate (2%).
140

Understanding Postgraduate Demand
There does not seem to be a particularly strong link between trends in offers made for PGR and PGT study. From 2009/10 the ratio of PGR offers increased, but in contrast, the number of proportionate offers made to PGT courses decline from this point. As such, the lowest ratio of PGT applications to offers made was evidenced in 2011/12,, this was a relatively competitive yearfor applicants wishing to study PGR programmes.
As discussed in section 2.2.2, up until 2010/11 the ratio of applications to enrolments increased year on year. In line with this, Figure 2 above shows that up until 2009/10 this ratio of applications to offers made also increased.
However, in 2010/11 when the ratio of applications to enrolments was at its highest (5.34 applications to every registered place), proportionately the ratio of applications to offers made was comparatively low (1.69).
Again the ratios of PGT applications to offers made varied between the participating HEIs, though to a much lesser extent than at PGR level. In 2011/12 the application to offer ratio varied from 1.01:1 to 3.82:1 applications to every place offered.
7.3. Application to offer ratio by detailed qualification type
7.3.1. Application to offer ratio by detailed qualification type (PGR)
Table 7.3 below shows the ratio of applications to offers according to specific qualification type within PGR programmes.
Table 7.1: Ratio of applications to offers by qualification type (PGR)
Qualification type
Base: HEIs
Base: Application
s PhDs
Professional doctorates
Research Masters
2005/06 5,282 2.80 1.68 5.03
2006/07 6,563 3.25 1.60 5.53
2007/08
6
7,639 3.26 1.54 3.89
2008/09 3.04 25,658 2.45 3.30
2009/10
11
30,368 2.71 1.29 3.86
2010/11 44,688 2.83 1.38 2.79
2011/12
16
49,136 3.00 1.51 2.91
141

Understanding Postgraduate Demand
Over the period covered, the highest ratio of applications to offers was for Research Masters; on average 3.73 applications were received for each offer made. A particularly competitive year was in 2006/7 with more than 5 applications (5.53) submitted to every offer made. This is reflective of the ratio of applications to places taken up discussed in section 2.4.1 where the highest ratios of applications to enrolment were seen for Research Masters courses with this ratio also peaking in 2006/7.
On average across the period, 2.95 applications to PhDs were submitted for each offer made. The highest ratio of applications to offers was in 2007/08 (3.26 applications were submitted per offer) and the lowest in 2009/10 (2.71 applications per offer).
On average 1.53 applications made to Professional Doctorate qualifications resulted in an offer. . However, the proportion of applications to offers was notably high in 2008/09 where more than two applications were submitted per offer made (2.45). As shown in Table 2.2 in section 2.4, for Professional Doctorates, the ratio of applications to places taken up for was also particularly high in that year. In 2011/12, the number of applications to Professional Doctorates were submitted per offer made was in line with the average across the period (1.51).
7.3.2. Application to offer ratio by detailed qualification type (PGT)
Table 7.2 shows the ratio of applications to offers according to specific qualification type within PGT programmes.
Table 7.2: Ratio of applications to offers by qualification type (PGT)
Qualification type
Base: HEIs
Base: Application
s
Masters Degrees
MBAs Postgraduate diplomas and
certificates
2005/06 43,754 1.81 1.38 1.15
2006/07 50,823 1.86 1.47 1.14
2007/08
6
59,793 1.91 1.53 1.17
2008/09 125,757 1.91 2.07 1.26
2009/10
12
148,938 1.92 2.25 1.32
2010/11 217,375 1.72 1.63 1.28
2011/12
18
219,705 1.70 1.53 1.30
142

Understanding Postgraduate Demand
In comparison with PGR programmes, the ratio of applications to offers for PGT study was generally more consistent within qualification type. On average, across the period, the ratio of applications to offers was 1.8:1 for Masters degrees, 1.7:1 to MBAs and 1.2:1 for postgraduate certificates and diplomas. The ratio of applications to Masters degrees fluctuated between 1.7:1 and 1:9, and between 1.1:1 and 1.3:1 for Postgraduate diplomas and certificates. A slightly higher degree of fluctuation occurred for MBAs; at its least competitive 1.4 applications were received to every offer, and 2.3:1 at its most competitive.
Table 7.2 indicates a general increase in the proportionate number of applications received per offer up until 2009/10. However in 2010/11 and 2011/12, a slight decline in the proportion of applications receive is evident across all three qualification types.
7.4. Application to offer ratio by Subject
7.4.1. Application to offer ratio by Subject (PGR)
Taken as an average across the seven year period, the most competitive subject area with the highest proportion of applications received per offer was Business/Administrative studies. Since 2005/06, on average, 5.11 applications were received for every offer made. Submissions to Social / Political / Economic studies were almost as competitive, with an average ratio of 4.68 applications to every place. However, in the most recent year (2011/12), the most competitive subject area was Law; 5.89 applications were received for every offer made.
Relative to the proportion of applications received, the highest numbers of offers were made to candidates applying to study Creative arts / design; overall 1.54 applications were received to every offer made.
Table 7.3 below shows the number of PGR applications for each offer made by subject over time.
Table 7.3: Ratio of applications to offers received by Subject Area (PGR)
Ratio of applications to offers
05/06 06/07 07/08 08/09 09/10 10/11 11/12
Base: HEIs 6 11 16
Base: Applications 5,282 6,563 7,639 25,658 30,368 44,688 49,136
Medicine and Dentistry
1.15 1.83 1.72 3.08 1.56 1.62 1.69
Subjects allied to Medicine
1.58 2.93 2.18 2.48 2.52 1.73 1.90
Biological Sciences 1.67 2.86 3.10 2.52 2.29 3.05 3.16
143

Understanding Postgraduate Demand
Ratio of applications to offers
05/06 06/07 07/08 08/09 09/10 10/11 11/12
Veterinary Sciences / agriculture / related subjects
1.85 1.60 4.00 1.81 1.28 1.25 1.27
Chemistry 1.79 2.84 2.55 2.23 2.16 2.49 2.71
Physics 1.87 2.46 2.41 3.05 2.79 3.39 3.37
Other physical sciences
1.33 2.60 2.41 2.39 2.54 3.03 3.59
Mathematical sciences
3.45 2.86 2.85 3.17 3.02 3.42 3.34
Computer science / librarianship
4.48 4.61 5.85 3.68 3.44 2.87 2.93
Engineering / technology / building / architecture
1.64 1.75 1.96 2.23 2.05 1.99 2.08
Social / political / economic studies
4.92 5.43 4.59 4.18 4.28 4.48 4.91
Law 4.30 3.48 4.41 4.21 4.24 4.30 5.89
Business / administrative studies
4.28 6.03 6.10 5.79 4.71 4.19 4.66
Languages 1.80 2.02 2.00 2.03 1.77 1.94 2.08
Humanities 1.85 2.17 1.76 2.07 1.76 1.82 2.09
Creative arts / design 1.15 1.65 1.66 1.68 1.49 1.52 1.61
Education 2.33 2.41 2.12 2.12 1.91 1.91 2.10
Unknown and combined subjects
1.14 1.33 # 2.54 2.44 2.75 2.76
Across the seven years, the ratio of applications to offers made was very consistent in some subject areas; for instance, Languages, Humanities and Creative / Arts design.
144

Understanding Postgraduate Demand
However some subjects appear to have become increasingly competitive over time notably Physics, Other Physical Science and Law.
7.4.2. Application to offer ratio by Subject (PGT)
Taken as an average across the 7 year period, the PGT subject area with the highest proportion of applications received per offer made was Mathematical Sciences. Since 2005/06, overall 3.17 applications were received for every offer made, and a significantly high proportion of applications were made in 2007/08 (5.06 submissions per offer).
The lowest application to offer ratios were seen for Chemistry and Education; over the whole 7 year period, 1.37 applications for Chemistry and 1.28 applications for Education were received per offer for each of these subjects.
Furthermore, as with PGR applications, a proportionately small number of applications did not result in an offer of a place for Veterinary Sciences / Agriculture / Related Subjects. Across the seven year period, overall 1.46 applications were received per offer and this ratio was as low as 1.12 in the most recent academic year (2011/12).
Table 7.4 indicates that with the exception of Mathematical Sciences, year on year, the ratio of PGT applications to offers fluctuates far less than submissions to PGR courses.
Table 7.4: Ratio of applications to offers by Subject Area (PGT)
Ratio of applications to offers
05/06 06/07 07/08 08/09 09/10 10/11 11/12
Base: HEIs 6 12 18
Base: Applications 43,754 50,823 59,793 125,757 148,938 217,375 219,705
Medicine and Dentistry
1.97 2.97 3.67 2.13 2.29 1.73 1.60
Subjects allied to Medicine
1.44 1.38 1.40 1.90 1.85 1.64 1.68
Biological Sciences 1.57 1.52 1.47 1.68 1.71 1.70 1.68
Veterinary Sciences / agriculture / related subjects
1.57 1.70 1.48 1.60 1.55 1.19 1.12
Chemistry 1.33 1.28 1.27 1.39 1.51 1.43 1.37
Physics 3.04 1.00 1.12 1.53 1.31 1.71 2.00
Other physical sciences
1.33 1.35 1.35 1.55 1.50 1.44 1.53
145

Understanding Postgraduate Demand
Ratio of applications to offers
05/06 06/07 07/08 08/09 09/10 10/11 11/12
Mathematical sciences
2.79 3.07 5.06 3.16 2.60 2.72 2.80
Computer science / librarianship
1.90 1.88 2.05 1.72 1.81 1.64 1.64
Engineering / technology / building / architecture
1.43 1.50 1.52 1.59 1.54 1.38 1.33
Social / political / economic studies
2.51 2.57 2.56 2.40 2.47 2.15 2.11
Law 1.67 1.82 1.96 1.65 1.79 1.61 1.68
Business / administrative studies
1.65 1.72 1.81 2.06 2.09 1.81 1.76
Languages 1.51 1.40 1.50 1.48 1.69 1.40 1.40
Humanities 1.47 1.57 1.67 1.64 1.66 1.55 1.56
Creative arts / design 1.23 1.21 1.38 1.51 1.54 1.62 1.69
Education 1.21 1.25 1.24 1.40 1.29 1.26 1.29
Unknown and combined subjects
1.08 1.00 - 1.40 1.43 1.29 1.22
7.5. Application to offer ratio by Domicile
7.5.1. Application to offer ratio by Domicile (PGR)
Over half (53%) of PGR applications made by UK domiciled applicants between 2005/06 and 2011/12 resulted in an offer of a place to study. Approximately a third (32%) of applications submitted by other EU applicants were successful and slightly less than a third (28%) of applications submitted by non-EU candidates were successful.
Figure 7.3 overleaf shows the proportion of applications resulting in an offer by domicile for each of the application years.
146

Understanding Postgraduate Demand
Figure 7.3: Percentage of applications resulting in an offer by Domicile (PGR)
0%
10%
20%
30%
40%
50%
60%
70%
80%
2005-2006 2006-2007 2007-2008 2008-2009 2009-2010 2010-2011 2011-2012
UK domiciled Other EU Non-EU
Base: All applications to PGR programmes with offer status and domicile supplied (168,023) (05/06: 5,269), (06/07: 6,543), (07/08: 7,592), (08/09: 25,507), (09/10: 30,243), (10/11: 44,223), (11/12: 48,646) Participating HEIs: (05/06 – 07/08: 6), (08/09 – 09/10: 10), (10/11 – 11/12: 16)
The proportion of successful applications did not fluctuate greatly from year to year for either other EU or non-EU candidates. For applications from non-EU Candidates, the proportion of applications resulting in an offer ranged between 25% and 31%. For applications from other EU candidates, the proportion ranged between 28% and 35%. However success rates varied more for UK candidates; in 2009/10 59% of PGR applications were successful in comparison with 49% in 2011/12.
7.5.2. Application to offer ratio by Domicile (PGT)
Approximately seven in ten (71%) of applications from UK domiciled applicants to PGT study made between 2005/06 and 2011/12 resulted in an offer of a place to study. Overall, over half of applications submitted by non-EU (54%) and other EU applicants (52%) were successful.
Figure 7.4 below shows the variation in the proportion of PGT applications resulting in an offer being made by domicile.
147

Understanding Postgraduate Demand
Figure 7.4: Percentage of applications resulting in an offer by Domicile (PGT)
0%
10%
20%
30%
40%
50%
60%
70%
80%
2005-2006 2006-2007 2007-2008 2008-2009 2009-2010 2010-2011 2011-2012
UK domiciled Other EU Non-EU
Base: All applications to PGT programmes with offer status and domicile supplied (856,798) (05/06: 42,991), (06/07: 49,977), (07/08: 58,694), (08/09: 124,264), (09/10: 147,431), (10/11: 215,498), (11/12: 217,943) Participating HEIs: (05/06 – 07/08: 7), (08/09 – 09/10: 12), (10/11 – 11/12: 18)
As Figure 7.4 indicates, there was a marked decline in the proportion of applications submitted by UK domiciled candidates that led to an offer in 2008/09, with 67% resulting in an offer compared with 75% in the previous year. In the latter part of the period, the proportion of applications resulting in an offer increased again to 73% in 2010/11 and 72% in 2011/12, although it did not quite reach the level seen at the beginning of the period (78% in 2005/6).
In 2011/12 proportionate number of offers submitted by EU and Non-EU candidates peaked; in both cases just less than six in ten (58%) applications resulted in an offer of a place to study.
148

Understanding Postgraduate Demand
Chapter 8: Postgraduate Demand in the Future This chapter provides some qualitative information collected during the site visits to HEIs. While these site visits focussed primarily on checking the application data that had been provided and discussing the trends that it appeared to show, time was also spent exploring HEIs’ views on how the demand for postgraduate study might change in the future. In addition, HEIs were encouraged to discuss the amount of work involved in participating in the study and any steps that could be taken to minimise this if the exercise were to be repeated in the future. Also included are recommendations from the researchers about collating postgraduate data in the future.
8.1. Postgraduate demand in the future
While demand for postgraduate study has increased in recent years, the HEIs who shared their application data for this project all expressed concern about the future of postgraduate study in the UK. Although many felt that the impact of 2006 increases in undergraduate fees on the demand for postgraduate study had been quite slight (at least at an overall level), there was a general consensus that the effect of £9,000 fees introduced in Autumn 2012 will be much more heavily felt26.
HEIs were concerned that graduates will be acquiring higher levels of debt as a result of fee increases at undergraduate level and that this will result in a lack of willingness to take on the expense of postgraduate study.
“This prospect of having that loan and then finding £4000, £5000 for fees plus living expenses for Postgraduate is probably going to be unreachable for a fair proportion of our Undergraduate students who might think about progressing.”
Furthermore, some HEIs participating in the study also expressed scepticism that the present fee cap will remain at £9,000 and were concerned that tuition fees may be increased even further in the future (with a corresponding knock-on impact on demand for postgraduate study).
HEIs felt that the impact of undergraduate fee increases is likely to have a particularly significant impact in the context of the current economic climate and the purported reduction in available fiscal support offered by the Research Councils discussed in Chapter 1. Some HEIs felt that the reduction of funding available (in conjunction with a
26 Any impact will be felt from the academic year 2015/16 onwards (as the earliest point at which the vast majority of undergraduates entering study in 2012/13 academic year could have proceeded to a postgraduate course).
149

Understanding Postgraduate Demand
lack of a standardised loan system -akin to that available at undergraduate level - available for postgraduates) would have as big an impact on postgraduate demand as the increased level of undergraduate fees. One of the participating HEIs currently undertakes follow-up surveys with candidates who are offered a place to study but do not accept the offer. They have found that over 50% of such applicants turned down their place because they could not secure the relevant finances.
There is some indication that Russell Group universities feel that they are better positioned to weather the impact of the higher undergraduate fee regime than other HEIs, at least in terms of sustaining absolute numbers of applications received. HEIs in the Russell Group feel that their more established links to industry partners and greater access to bursaries and sponsorships will help them to sustain demand for postgraduate study (particularly for Research courses and more specifically STEM [Science, Technology, Engineering, Mathematics] subjects).
Widening participation
Most HEIs raised concerns about the impact that increased undergraduate fees might have on the widening participation agenda in postgraduate study. A number of HEIs were anxious that the 2012/13 fee regime may threaten the number of applications submitted by candidates of lower socio-economic groups and that postgraduate study may become increasingly elitist.
However, as mentioned earlier in this report, very few HEIs collected data that would make it possible to monitor the socio-economic status of postgraduate applicants and this will make it difficult to assess whether this fear comes to pass. HEIs also mentioned being unsure about what sort of information would be appropriate to collect with the use of information on parental background or schooling feeling less appropriate in the context of postgraduate applicants than for undergraduate applicants.
Demographics
Some of the HEIs participating in the study suggested that the average age of postgraduate applicants is likely to increase in the future. They felt that the cumulative expense of proceeding straight from undergraduate to postgraduate study is more likely to deter younger graduates, and as a result a higher proportion of applications are likely to be received from professional candidates already mid-career in future years. Some HEIs suggested that gaps between completing an undergraduate course and embarking on postgraduate study of around 5-6 years (or even longer) might become more normal.
Yet in contrast, some HEIs argued that the age profile of applicants is likely to remain relatively static at least while economic recovery remains weak. They suggested for every young person deterred from postgraduate study by increasing debt, another is likely to opt to remain in higher education due to the lack of available career opportunities (enabling them to improve career prospects and/or delay entering the job market).
Subject choice
Among HEIs there was a widespread belief that postgraduate study in Arts and Humanities subjects will be particularly susceptible to the impact of increased undergraduate fees. Generally they felt that postgraduate study in these subject areas (and particularly for Taught Masters courses) was more likely to be driven by personal
150

Understanding Postgraduate Demand
interest, rather than a focus on enhancing career development. Additionally, in comparison with STEM subjects, significantly fewer bursaries and sponsorships were available to support undertaking qualifications in the Arts and Humanities (and fewer employer-funded opportunities were felt to be available). HEIs felt that greater financial pressure on potential students would make them more likely to feel unable to justify the return on investment of an Arts or Humanities course.
The courses that HEIs felt are least likely to be affected in the future are vocational courses with a strong link to particular employers or sectors. Government subsidised / paid courses such as those offered in conjunction with the NHS have seen strong growth in recent years and some HEIs were optimistic that the interest in this type of course will continue to grow. Several HEIs mentioned that they are pro-actively endeavouring to further develop their links with industry and private providers to ensure this growth.
Most HEIs also made the point that if applications from UK students are reduced as a result of the new undergraduate fee regime, then it is likely that their distribution of students by subject will be more heavily influenced by the subject preferences of international students. They mentioned that their international students tend to be particularly concentrated in subjects such as Business and Management Skills as well as the STEM subjects and these subjects may account for a greater proportion of their offer in future for this reason as well.
Qualification type
There was less consensus on the impact that the changing fee regime and other developments might have on the types of qualifications that postgraduate students choose to study for. Generally HEIs seemed to suspect that any changes in application trends will be more apparent by subject than by qualification type.
However, some HEIs indicated that they are anticipating a decline in applications to Masters courses, as compared to PhDs for example, it can be harder to prove the direct impact on career prospects. A representative from one HEI commented;
“There has been a recent shift in fundamental philosophy from, ‘education is there for education’s sake’ and for becoming a more developed individual to, ’education is there to get you a job.’ In that case, there’s a far more deliberate weighing up of options, and you have to question whether Masters courses can survive in that.”
On the other hand, some felt that Masters qualifications might start to look good value for money, when judged against the increased cost of studying at Undergraduate level.
MBAs are amongst those qualifications most likely to be sponsored by an employer and so HEIs felt that demand for these qualifications was least likely to be impacted by changes to the undergraduate fee regime. In many HEIs a high proportion of MBAs were undertaken by international students and hence for this reason as well HEIs felt that they would not be affected by changes in undergraduate fees specifically.
151

Understanding Postgraduate Demand
Part-time / Full Time
There was a divergence of opinion among HEIs as to how demand for part-time and full time courses might change in the future. A slight majority of HEIs participating in the study suggested that the proportion of part-time applications would increase in the wake of the 2012/13 fee changes. These HEIs felt that the fee increases would result to a higher proportion of applications from older candidates who are more likely to be looking to fit study around their career and family lives. Some HEIs also anticipated an increased demand for online courses or distance learning packages as they result in lower living costs for students.
On the other hand, a slightly smaller proportion of HEIs argued that the balance could shift more towards full-time study. Some of those anticipating that the future might see a greater proportion of international students felt this would be the case (since these students are more likely to study full-time). Others felt that a greater shift towards full-time study might be the case if an increasing proportion of applicants are on vocational courses sponsored by an employer. These HEIs felt that businesses generally prefer employees to complete a qualification within a quick turnaround (and hence prefer full-time over part-time study).
Candidate quality
HEIs expressed different views about how the new undergraduate fee regime will affect the quality of postgraduate applicants.
Generally, HEIs agreed that if volumes of applications fell in the way that they anticipated then it was likely that the ‘conversion rate’ (i.e. the proportion of applications that result in a place being taken up) would increase in order to try to maintain student numbers. However there were varying views on the impact that this might have on the quality of postgraduate students.
Russell Group universities were particularly inclined to state that the quality of students would not change because they already received applications from far more high quality candidates than they are able to offer places to. They stressed that their standards and entry criteria would always be upheld; even if application numbers fell.
Some other HEIs felt that it might be possible for conversion rates to increase in the future without this meaning a fall in the quality of students if the issues of higher undergraduate fees and reduced funding meant that it was less committed or lower quality applications that were impacted most. They felt that if decisions to embark on postgraduate study became more carefully considered then it would be more likely to be applicants with genuine interest or talent in a subject that applied to continue their studies.
Others felt that they would be likely to have to accept lower quality applicants in order to maintain viable student numbers. There were already indications that HEIs have been testing measures to adjust entry requirements to increase applications/student numbers, arguably at the expense of quality. For a short period, one HEI had made the entry requirements for one of its postgraduate courses less stringent for existing undergraduate students, although this idea was revoked when it was clear that student aptitude was being comprised.
152

Understanding Postgraduate Demand
International students
Most HEIs suggested that, in the absence of other policy changes, the increase in undergraduate fees would lead to a greater proportion of postgraduate applications coming from overseas students. However, they felt that this picture was likely to be complicated by other changes that will impact international students at the same time.
HEIs tended to feel that the UK dependency on international applicants was precarious. They felt that the UK education system still benefitted from an impressive international reputation but felt that changing visa restrictions were already starting to have a considerable deterrent effect on levels of applications from overseas candidates. Most notably, HEIs cited the introduction of the points based visa system alongside the abolition of the post-study work visa (April 2012) as working to dissuade potential international candidates. They cited examples of negative coverage of these changes in the international media (particularly in India). Some HEIs mentioned that they had noticed these changes shifting the balance of their applications between countries (noting that Chinese students were less likely to be looking to work in the UK after study then those from countries such as India or Bangladesh for example meaning that applications from China had held up better).
In the wake of these changes, HEIs predicted that the UK will face increasing competition from abroad. They felt that places such as Holland, the US, Germany and Australia facilitated cheaper study options, more flexible visas and might generally be perceived as offering more appealing packages; particularly those offering the opportunity to work after graduating.
Some HEIs also mentioned that variations in currency exchange rates can have quite big increases in the costs of postgraduate study and hence in levels of applications.
All-in-all the number of factors impacting on international applications made it very difficult for HEIs to predict how the balance between domestic and international applications might change in the future. However all were in agreement that there was potential for both domestic and international applications to drop (albeit in response to different policy changes) and that this could have a very serious impact on the postgraduate sector.
HEI response
Some HEIs had already started to implement strategies to address their concerns about future demand, or were planning to introduce them.
Some had introduced committees or appointed individuals to assess how best to respond to the changing landscape and market postgraduate courses most effectively.
Several HEIs had expanded, or were looking to expand, their provision of part-time and flexible learning options. Some HEIs had simply extended part-time study options to a more extensive range of courses or subjects area; others had established ways to facilitate distance learning such as the introduction of “online delivery colleges”.
Alongside this, many HEIs had looked at measures to actively encourage existing undergraduate students to proceed directly to postgraduate study at the organisation. To boost retention, some HEIs offered or were considering discounts or “loyalty bursaries” to existing students considering extending their studies.
153

Understanding Postgraduate Demand
HEIs had also developed a number of other strategies to try to assist postgraduate students with funding their courses. These included:
Active promotion and marketing of available funding opportunities such as scholarships or bursaries
The introduction of “lump-sum” payments based on the existing US model. This enables students who prefer to do so to pay for the entire cost of the course in a single payment.
Developing new industry partnerships who may offer sponsorship to some students, as well as employment opportunities in a bid to compensate for the reduction in Research Councils funding.
Implementing systems whereby select bursary allocations are pooled together and divided in a manner that enables greater equity of opportunity to a higher number of applicants.
Enabling applicants to study towards (and pay for) selective modules, rather than a full qualification
Developing reciprocal arrangements with International HEIs enabling students to study for a year of their PhD in the UK and receive a qualification from two universities (at a decreased cost of studying for four years overseas).
Reflecting the big role that funding can have in decisions about whether or not to take up an offer of a place for postgraduate study, one HEI was in the process of exploring options to ascertain whether funding decisions can be brought forward in the application process to give them greater certainty in the volume of places likely to be taken up.
More generally, most HEIs had implemented or were looking to implement strategies to more actively market their postgraduate opportunities. Marketing campaigns mentioned included adverts on websites, billboards, newspapers and television are being specifically developed to try and appeal to a greater number of UK undergraduates.
HEIs were focussing on developing strategies to emphasise the positive return on investment in postgraduate study. Many HEIs have introduced marketing and recruitment campaigns to stress the benefits of attaining a postgraduate qualification; usually by highlighting postgraduates’ increased employability and publicising postgraduate alumni “destinations”. In a similar vein, other HEIs have attempted to increase the perceived value of their courses by incorporating personal development modules and opportunities to undertake internships into their programmes.
There was some debate about how the cost of postgraduate study should be presented in marketing material. Some HEIs have deliberately promoted the comparatively low cost of studying for (some) postgraduate qualifications, in comparison with undergraduate courses. On the other hand, some organisations were more cautious in adopting this approach, suggesting that this tack may indicate postgraduate study is of lower quality/value.
154

Understanding Postgraduate Demand
“With £9000 undergraduate fees, people are going to ask, ‘Why is a PGT £2,900?’ You have to say one of them is not right. There’s no way you can argue consistently for both of them.”
Repeating the data collation exercise
Positively, in the absence of any centralised source of information about postgraduate applications, HEIs that participated in the data collation exercise shared a view that investigation to understand demand for postgraduate study was welcomed. As such, despite the challenges faced in producing their data sets, nearly all HEIs stated that, at least in principle, they would be willing to participate in future exercises to further explore change in postgraduate demand.
There is also suggestion that five HEIs who were not asked to share their data (on the basis that they only held very recent application records or very incomplete data) would have been willing to provide their data if their involvement had been requested. These HEIs had expressed interest in the project from the offset, participated in the site visit to discuss their application database and stated that they were, at least in principle, happy to share their data. Should future exercises benefit from their input, it is likely that these HEIs would be willing to accommodate similar requests.
Yet, it is worth noting that out of the 24 HEIs that were initially asked to provide their data for this study, four declined to participate.
In two instances this was due to a lack of available resource which could be dedicated to the exercise and the cumbersome nature of their application system.
One HEI was unwilling to participate because of concerns about data protection issues and releasing commercially sensitive information.
The final HEI did not provide a specific reason for their refusal.
Moreover, as discussed in Chapter 1 Scottish HEIs exhibited a lower level of interest in the research than English HEIs and a decision was made to exclude them from the data collection stage of the project. Aforementioned, Scottish HEIs appeared to be less engaged in the project than English institutions; on completion of the initial online exercise, only one Scottish university out of nine was keen to participate at the initial site visit stage. This would seem to indicate that a greater level of promotion or persuasion would be required to secure enough interest from Scottish HEIs for their data to be included in a future exercise.
HEI feedback on data collation exercise It is clear that experiences were varied among those HEIs that submitted their application databases for the project. In the main, the amount of time and resource required to provide the data was determined by the sophistication of the application database in use. Some institutions were able to automatically extract data and comply with the specification with relative ease. Conversely, other HEIs stated that complying with the request took days of work; one institution estimated that the cost of the exercise had been £1,500 to the institution. In some cases, several systems (for example archives or registration information) had to be interrogated in order to produce the single data set. A minority had
155
Understanding Postgraduate Demand
to combine information obtained from paper applications with those submitted via online methods. Some HEIs had run similar analyses for their own internal purposes, others had relatively little experience of reviewing their own applications data.
Some HEIs could provide the required information in a matter of days where for example one member of staff was able to extract the required data from an automated system. Conversely one institution, dependent on a relatively basic application system, had to recruit a temporary member of staff to input data manually; information was uploaded in batches as and when they were completed over the course of several weeks. Moreover, the resource required to undertake the exercise was often difficult for HEIs to predict at the start of the project which caused some issues for internal resource planning.
Contractor feedback Generally the quality and completeness of data provided by the participating HEIs was good, although it was a relatively time-consuming process to collate, clean and compile the data to produce a single standardised data set.
After initial data was received, a rigorous checking process was conducted on a HEI by HEI basis. This was necessary to ensure that the specification had been interpreted correctly and enabled the contractor to highlight any omissions or apparent errors in the data.
The most common issues to arise were:
HEIs providing data pertaining to applicants’ year of intended study, rather than providing all applications submitted within a given academic year
Use of institution-based coding mechanisms (and sometimes different coding frames for different years of study) for some data (typically relating to Previous HEI field)
Typically these issues were resolved through telephone and email correspondence, and in some more complex cases, via face to face contact at the follow up site visits. If possible, where errors were identified, the HEI then uploaded amended or supplementary data. Alternatively, sometimes an explanation of internal coding systems was all that was required.
In addition to issues around the content of the databases, imposing a timetable on the study was difficult. With no obligation to participate, it was often difficult for HEIs to prioritise extraction of application data. In some cases, HEIs had to be repeatedly contacted and deadlines were extended several times which caused delays to the extensive checking stage and subsequently to the overall project timetable.
In the case of some HEIs quite a long period of time elapsed from delivery of the initial file to delivery of a corrected file. The length of time taken appeared to depend largely on the sophistication of the individual HEIs’ system, the extent of the queries and any resourcing issues faced by the institution. Some HEIs were able to respond within a few days of receiving the queries; other took up to four weeks to deliver amended data. In part, this was determined by the onsite presence of a single point of contact and, during the summer
156

Understanding Postgraduate Demand
period, it was more difficult to resolve queries due to the high prevalence of contacts on annual leave.
Recommendations on analysing postgraduate demand in the future
Analysis of application data would obviously be much easier and of much greater robustness if there were a centralised system for postgraduate applications akin to the UCAS system for undergraduate study. Assuming that a portal of this nature is unlikely to be established in the near future, then it will only be possible to conduct analysis of applications data by obtaining information direct from HEIs.
On this basis, it might be worth further exploring a couple of options in advance of any future data collection exercise. These include:
Working with some of the large providers of student records management databases. A number of HEIs use ‘off the shelf’ packages and there are two or three market leaders. These systems tend to use standardised data fields even if the user interface is customised to the requirements of an individual HEI. It seems possible that some of these providers would be able to write a programme that the HEIs using their systems could run to extract data relatively quickly. This option was explored in the feasibility stage to this project with one provider however they felt that they would need to consult with the institutions using their system before being willing to consider this and the timeframes for the project did not really allow for this. It might be worth revisiting this again in advance of any future exercise (from the perspective of both the provider’s capacity to develop this programme and user institutions’ willingness to run it).
Discussing with the HEIs that only hold one or two years’ worth of applications data whether they would be willing to retain more records or perhaps to transfer their data to BIS prior to its destruction. Otherwise, if this exercise is repeated after an interval of more than two years, some of the HEIs that took part in this exercise will have a gap in their time series data.
If the exercise were to be repeated in a similar format again, then it we would recommend the following:
HEIs are again only asked to provide anonymised data. While this limits some of the analysis potential of the data collected, levels of participation in the exercise would have been considerably lower if they had been asked to share attributed data.
HEIs should be provided with as much advance warning as possible – maybe even up to 6 months, to enable institutions to prepare and plan necessary resource requirements;
Deadlines for delivery of data factor in some HEIs not being able to meet the deadline due to unexpected resourcing difficulties and will also need to allow a lot of time for resolution of queries about initial datasets;
157

Understanding Postgraduate Demand
The site visits and supporting detailed data reports are retained as part of the project (these were very useful for identifying errors/omissions in the data provided and the data report provided analysis that some institutions felt would be valuable for their own purposes which may have helped to secure their buy-in to any future exercise).
A degree of flexibility in the data specification is necessary. In some cases, in order to secure access to the data it was necessary for some data to be taken in a non-standardised way and to be edited/coded by the research contractor. There was a consensus among HEIs that requirements should not be too prescriptive given that they are under no obligation to participate.
Again ensuring that standardised documentation on data security, data protection and the potential uses of the data is agreed in advance. Most HEIs requested to see at least some of this documentation. Some HEIs felt that they would find it more reassuring to receive this type of documentation directly from BIS rather than from a research contractor.
158

Understanding Postgraduate Demand
Appendix I: Volumetric tables The figures presented below are weighted data for all tables and charts in the report that present data proportionally. The absolute number below should be treated as indicative only. Unweighted bases are provided for reference.
Chapter 2
Applications by qualification type
PGR Base:
Participating HEIs
Base PhDs Professional doctorates
Research masters
2005-2006 5,282 90,334 1,544 21,738
2006-2007 6,563 107,758 2,040 19,478
2007-2008
6
7,639 128,154 2,255 18,606
2008-2009 25,658 161,237 4,017 20,040
2009-2010 10
30,368 190,290 6,326 23,866
2010-2011 51,478 158,073 5,115 17,146
2011-2012 17
56,741 170,060 6,842 19,965
PGT Base:
Participating HEIs
Base Masters degrees MBA PG Diplomas
& Certificates
2005-2006 43,754 447,962 19,236 25,361
2006-2007 50,823 511,353 25,390 27,351
2007-2008
7
59,793 605,055 28,604 36,319
2008-2009 126,412 926,708 39,400 47,549
2009-2010 13
149,930 1,122,834 40,963 55,995
2010-2011 250,173 1,199,324 31,685 56,839
2011-2012 20
252,754 1,206,167 33,173 63,272
Applications by mode of study
PGR 2005 -2006
2006 -2007
2007 -2008
2008 -2009
2009 -2010
2010 -2011
2011 -2012
Base: Participating
HEIs 6 10 17
Base 5,282 6,563 7,639 25,658 30,368 51,478 56,637
Full-time 108,207 123,946 141,404 178,165 208,788 170,546 186,536
Part-time 5,249 5,180 7,481 6,955 11,340 8,931 9,522
Other 160 150 130 173 354 861 605
159

Understanding Postgraduate Demand
PGT 2005-2006
2006-2007
2007-2008
2008-2009
2009-2010
2010-2011
2011-2012
Base: Participating
HEIs 7 13 20
Base 43,754 50,823 59,792 126,412 149,930 250,164 252,754
Full-time 437,899 503,341 595,517 920,210 1,109,295 1,188,270 1,199,173
Part-time 50,250 55,493 69,393 81,891 98,590 87,720 89,280
Other 4,409 4,960 5,057 11,555 11,907 11,796 14,159
Mode of study according to specific qualification type (Full Time / Part Time / Other)
PhDs Professional doctorates Research masters
PGR
Base HEIs
Base FT PT Other FT PT Other FT PT Other
2005-2006
5,282 85,588 4,596 150 965 569 10 21,654 84 0
2006-2007
6,563 10,3432 4,186 140 1,150 890 0 19,364 104 10
2007-2008
6
7,639 121,538 6,486 130 1,460 795 0 18,406 200 0
2008-2009 25,658 155,483 5,587 167 2,927 1,082 7 19,754 285 0
2009-2010
10 30,368 182,157 7,833 300 3,156 3,157 13 23,475 351 40
2010-2011 54,478 151,223 6,397 452 2,750 2,074 292 16,573 454 118
2011-2012
17 56,636 163,475 6,428 158 3,816 2,475 340 19,243 615 108
Masters degrees MBAs PG dips & certs
PGT
Base HEIs
Base FT PT Other FT PT Other FT PT Other
2005-2006
43,754 415,540 29,299 7,951 14,408 3,736 1,093 7,951 17,216 193
2006-2007
50,823 473,600 34,253 9,935 19,806 4,346 1,238 9,935 16,894 222
2007-2008
7
59,792 557,695 43,666 14,768 23,054 4,341 1,209 14,768 21,386 164
2008-2009
126,412 860,857 58,637 23,097 36,256 2,684 460 23,097 20,570 3,882
2009-2010
13 149,930
1,046,975
67,890 25,892 36,428 4,289 247 25,892 26,411 3,692
2010-2011
250,164 1,134,2
24 56,065 26,158 27,889 3,640 157 26,158 28,016 2,664
2011-2012
20 252,754
1,143,474
52,221 29,264 26,435 6,660 78 29,264 30,399 3,609
160

Understanding Postgraduate Demand
Chapter 3
Applications by subject area
PGR 2005 - 2006
2006 - 2007
2007 - 2008
2008 - 2009
2009 - 2010
2010 - 2011
2011 - 2012
Base: Participating HEIs 6 10 17
Base 5,282 6,563 7,639 25,658 30,368 51,480 56,743
Medicine and dentistry 995 1,515 2,035 6,198 9,005 6,918 7,723
Subjects allied to Medicine 402 349 509 5,082 8,107 8,247 11,175
Biological sciences 4,188 7,878 11,268 10,300 12,436 16,748 17,051
Veterinary Sciences / agriculture / related subjects
370 160 160 955 1,167 655 620
Chemistry 1,624 2,345 2,395 2,977 3,709 4,513 4,871
Physics 1,512 1,760 1,335 2,752 2,974 2,509 3,006
Other physical sciences 2,265 4,434 5,557 4,511 5,482 7,391 8,187
Mathematical sciences 3,883 4,129 5,123 6,148 5,755 5,738 5,632
Computer science / librarianship / info science
4,905 5,993 6,602 6,507 7,821 7,434 7,793
Engineering / technology / building / architecture
11,823 15,495 17,627 21,516 26,224 22,374 25,972
Social / political / economic studies
54,871 52,813 58,139 55,176 63,295 42,118 44,735
Law 5,608 6,327 7,357 7,712 7,711 6,085 7,253
Business / administrative studies
11,032 15,111 16,503 20,999 24,082 18,992 19,895
Languages 1,947 2,857 3,511 7,484 9,398 7,020 7,628
Humanities 5,497 4,333 6,070 9,088 12,483 9,264 10,106
Creative arts / design 1,029 1,412 1,622 2,240 3,060 2,451 2,885
Education 1,409 2,237 3,160 4,201 4,887 4,602 5,346
Unknown and combined subjects
256 128 42 11,447 12,886 7,288 7,002
161
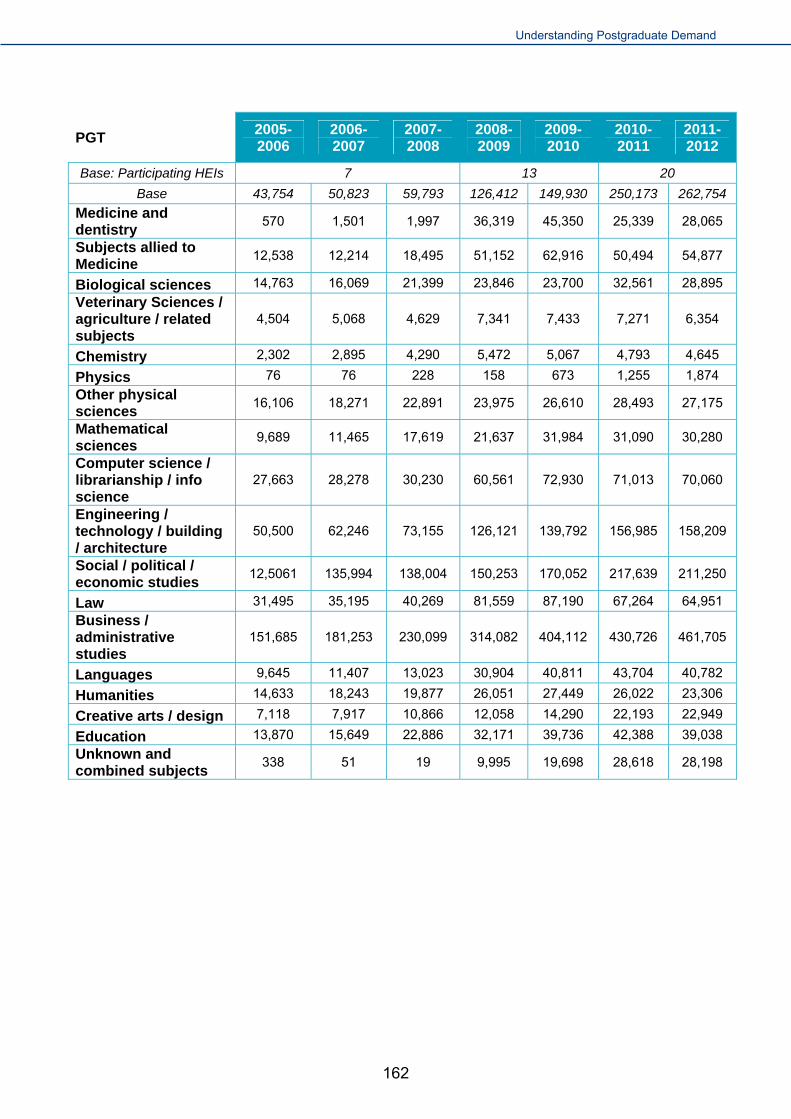
Understanding Postgraduate Demand
PGT 2005-2006
2006-2007
2007-2008
2008-2009
2009-2010
2010-2011
2011-2012
Base: Participating HEIs 7 13 20
Base 43,754 50,823 59,793 126,412 149,930 250,173 262,754
Medicine and dentistry
570 1,501 1,997 36,319 45,350 25,339 28,065
Subjects allied to Medicine
12,538 12,214 18,495 51,152 62,916 50,494 54,877
Biological sciences 14,763 16,069 21,399 23,846 23,700 32,561 28,895
Veterinary Sciences / agriculture / related subjects
4,504 5,068 4,629 7,341 7,433 7,271 6,354
Chemistry 2,302 2,895 4,290 5,472 5,067 4,793 4,645
Physics 76 76 228 158 673 1,255 1,874
Other physical sciences
16,106 18,271 22,891 23,975 26,610 28,493 27,175
Mathematical sciences
9,689 11,465 17,619 21,637 31,984 31,090 30,280
Computer science / librarianship / info science
27,663 28,278 30,230 60,561 72,930 71,013 70,060
Engineering / technology / building / architecture
50,500 62,246 73,155 126,121 139,792 156,985 158,209
Social / political / economic studies
12,5061 135,994 138,004 150,253 170,052 217,639 211,250
Law 31,495 35,195 40,269 81,559 87,190 67,264 64,951
Business / administrative studies
151,685 181,253 230,099 314,082 404,112 430,726 461,705
Languages 9,645 11,407 13,023 30,904 40,811 43,704 40,782
Humanities 14,633 18,243 19,877 26,051 27,449 26,022 23,306
Creative arts / design 7,118 7,917 10,866 12,058 14,290 22,193 22,949
Education 13,870 15,649 22,886 32,171 39,736 42,388 39,038
Unknown and combined subjects
338 51 19 9,995 19,698 28,618 28,198
162
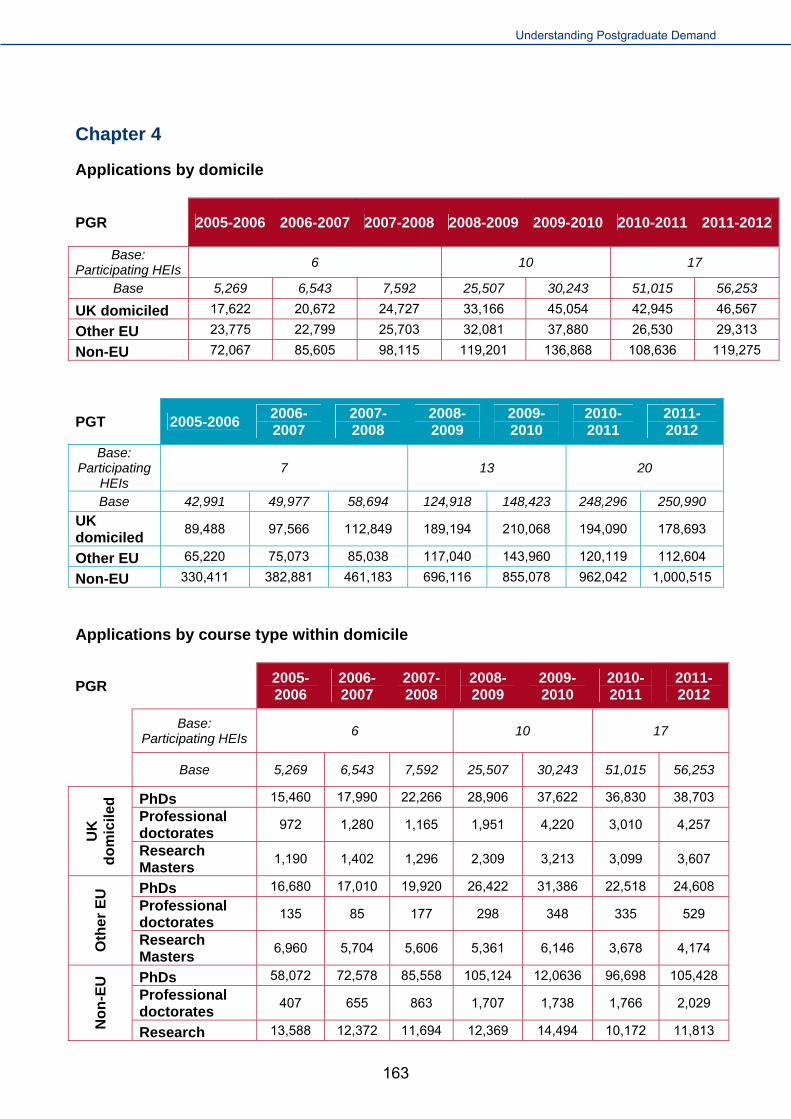
Understanding Postgraduate Demand
Chapter 4
Applications by domicile
PGR 2005-2006 2006-2007 2007-2008 2008-2009 2009-2010 2010-2011 2011-2012
Base: Participating HEIs
6 10 17
Base 5,269 6,543 7,592 25,507 30,243 51,015 56,253
UK domiciled 17,622 20,672 24,727 33,166 45,054 42,945 46,567
Other EU 23,775 22,799 25,703 32,081 37,880 26,530 29,313
Non-EU 72,067 85,605 98,115 119,201 136,868 108,636 119,275
PGT 2005-2006 2006-2007
2007-2008
2008-2009
2009-2010
2010-2011
2011-2012
Base: Participating
HEIs 7 13 20
Base 42,991 49,977 58,694 124,918 148,423 248,296 250,990
UK domiciled
89,488 97,566 112,849 189,194 210,068 194,090 178,693
Other EU 65,220 75,073 85,038 117,040 143,960 120,119 112,604
Non-EU 330,411 382,881 461,183 696,116 855,078 962,042 1,000,515
Applications by course type within domicile
PGR 2005-2006
2006-2007
2007-2008
2008-2009
2009-2010
2010-2011
2011-2012
Base:
Participating HEIs 6 10 17
Base 5,269 6,543 7,592 25,507 30,243 51,015 56,253
PhDs 15,460 17,990 22,266 28,906 37,622 36,830 38,703
Professional doctorates
972 1,280 1,165 1,951 4,220 3,010 4,257
UK
d
om
icil
ed
Research Masters
1,190 1,402 1,296 2,309 3,213 3,099 3,607
PhDs 16,680 17,010 19,920 26,422 31,386 22,518 24,608
Professional doctorates
135 85 177 298 348 335 529
Oth
er E
U
Research Masters
6,960 5,704 5,606 5,361 6,146 3,678 4,174
PhDs 58,072 72,578 85,558 105,124 12,0636 96,698 105,428
Professional doctorates
407 655 863 1,707 1,738 1,766 2,029
No
n-E
U
Research 13,588 12,372 11,694 12,369 14,494 10,172 11,813
163

Understanding Postgraduate Demand
Masters
PGT 2005-2006
2006-2007
2007-2008
2008-2009
2009-2010
2010-2011
2011-2012
Base:
Participating HEIs
7 13 20
Base 42,991 49,977 58,694 124,918 148,423 248,296 250,990
Masters degrees
65,081 73,248 83,331 160,502 174,393 153,695 132,472
MBAs 5,249 5,897 5,787 3,637 4,570 3,767 4,217 UK
d
om
icil
ed
PG Diplomas & Certificates
19,158 18,422 23,730 25,055 31,104 36,628 42,004
Masters degrees
63,674 73,219 82,865 111,710 137,595 114,444 106,293
MBAs 474 717 924 856 1,600 1,121 1,665
Oth
er E
U
PG Diplomas & Certificates
1,072 1,137 1,249 4,473 4,765 4,554 4,647
Masters degrees
31,2471 357,390 428,949 644,391 802,169 920,992 958,724
MBAs 13,252 18,379 21,337 34,554 33,914 26,418 26,392
No
n-E
U
PG Diplomas & Certificates
4,688 7,111 10,897 17,171 18,995 14,632 15,399
164

Understanding Postgraduate Demand
Applications by subject area within domicile
PGR 2005-2006
2006-2007
2007-2008
2008-2009
2009-2010
2010-2011
2011-2012
Base: Participating HEIs 6 10 17
Base 5,269 6,543 7,592 25,507 30,243 51,015 56,253
Medicine and dentistry 415 380 705 2,007 3,624 2,590 2,891
Subjects allied to Medicine
242 55 122 1,706 2,955 3,038 4,006
Biological sciences 1,513 3,135 4,004 3,076 4,346 6,523 7,464
Veterinary Sciences / agriculture / related subjects
30 20 20 107 160 105 108
Chemistry 827 755 705 930 983 1,522 1,768
Physics 835 760 625 1,075 1,065 1,064 1,310
Other physical sciences
655 1,237 1,607 1,356 1,663 3,599 3,442
Mathematical sciences 719 629 757 1,012 1,118 1,023 980
Computer science / librarianship / info science
475 602 639 750 1,035 1,367 1,085
Engineering / technology / building / architecture
2,226 2,603 3,099 3,587 4,605 4,197 3,838
Social / political / economic studies
5,314 5,220 6,028 6,215 7,634 5,525 6,063
Law 653 895 1,047 1,240 1,139 954 1,102
Business / administrative studies
1,011 1,417 1,512 1,477 1,792 1,697 1,854
Languages 607 747 1,117 2,446 3,320 2,287 2,775
Humanities 1,367 1,218 1,703 2,798 4,579 3,732 3,681
Creative arts / design 409 655 672 1,017 1,636 1,203 1,478
Education 164 312 365 574 1,110 1,155 1,552
UK
do
mic
iled
Unknown and combined subjects
160 32 0 1,793 2,291 1,369 1,176
Medicine and dentistry 40 80 80 492 838 606 712
Subjects allied to Medicine
30 0 32 475 836 800 1,185
Biological sciences 563 1,120 1,542 1,257 1,753 1,973 2,630
Veterinary Sciences / agriculture / related subjects
40 0 10 67 102 32 51
Chemistry 195 170 140 320 472 614 627
Physics 165 210 170 435 463 332 405
Oth
er E
U
Other physical sciences
210 335 570 480 568 875 1,316
165

Understanding Postgraduate Demand
PGR 2005-2006
2006-2007
2007-2008
2008-2009
2009-2010
2010-2011
2011-2012
Mathematical sciences 822 820 935 1,228 1,347 1,066 1,064
Computer science / librarianship / info science
854 920 760 890 974 957 1,266
Engineering / technology / building / architecture
1,474 1,310 1,659 1,958 2,530 1,831 2,254
Social / political / economic studies
14,418 13,036 14,283 14,233 15,877 9,831 10,324
Law 1,176 1,176 1,255 1,671 1,498 874 1,043
Business / administrative studies
2,009 2,214 2,469 3,420 3,909 2,613 2,129
Languages 295 285 357 965 1,285 933 946
Humanities 1,252 803 1,116 1,741 2,475 1,578 1,675
Creative arts / design 150 240 190 292 390 281 256
Education 50 80 135 413 362 329 318
Unknown and combined subjects
32 0 0 1,744 2,200 1,009 1,116
Medicine and dentistry 540 1,055 1,250 3,699 4,543 3,702 4,094
Subjects allied to Medicine
130 294 355 2,891 4,311 4,316 5,758
Biological sciences 2,112 3,623 5,702 5,937 6,319 6,760 6,719
Veterinary Sciences / agriculture / related subjects
300 140 130 777 905 516 462
Chemistry 602 1,420 1,550 1,722 2,249 2,350 2,351
Physics 512 790 540 1,217 1,420 1,111 1,280
Other physical sciences
1,400 2,862 3,380 2,640 3,242 2,793 3,231
Mathematical sciences 2,342 2,680 3,431 3,893 3,284 3,642 3,542
Computer science / librarianship / info science
3,576 4,471 5,203 4,867 5,782 5,073 5,399
Engineering / technology / building / architecture
8,033 11,382 12,479 15,659 18,876 16,083 19,411
Social / political / economic studies
35,107 34,557 37,828 34,638 39,695 2,6735 28,307
Law 3,779 4,256 5,055 4,787 5,070 4,253 5,093
Business / administrative studies
7,982 11,480 12,462 16,039 18,263 14,641 15,759
Languages 1,045 1,825 2,037 3,998 4,743 3,784 3,887
Humanities 2,878 2,312 3,251 4,513 5,394 3,934 4,726
Creative arts / design 470 517 760 920 1,033 962 1,149
Education 1,195 1,845 2,660 3,194 3,405 3,109 3,408
No
n-E
U
Unknown and combined subjects
64 96 42 7,810 8,335 4,875 4,703
166

Understanding Postgraduate Demand
PGT 2005-2006
2006-2007
2007-2008
2008-2009
2009-2010
2010-2011
2011-2012
Base: Participating
HEIs 7 13 20
Base 42,991 49,977 58,694 124,918 148,243 248,296 250,990
Medicine and dentistry 78 186 213 14780 21068 9828 11818
Subjects allied to Medicine 5,286 4,126 6,830 23,330 29,563 23,038 28,675
Biological sciences 3,425 3,949 5,484 7,105 7,353 10,417 9,886
Veterinary Sciences / agriculture / related subjects
695 727 711 1443 1316 1582 1281
Chemistry 196 386 355 579 361 469 520
Physics 0 0 25 78 157 374 314
Other physical sciences
4,216 4,506 5,201 6,228 6,375 6,532 4,952
Mathematical sciences
851 1,044 1,209 3,411 4,981 3,156 2,848
Computer science / librarianship / info science
2,853 3,225 3,518 8,682 8,990 6,949 5,450
Engineering / technology / building / architecture
7,266 8,847 9,754 14,392 12,789 12,922 10,300
Social / political / economic studies
18,352 18,842 19,215 31,220 30,725 36,526 30,678
Law 6,804 6,320 6,961 12,738 14,837 12,475 8,860
Business / administrative studies
21,234 25,698 30,201 26,578 27,842 25,529 25,297
Languages 3,188 4,044 3,872 8,619 9,200 7,617 6,487
Humanities 5,573 6,352 6,158 11,441 11,071 9,827 8,462
Creative arts / design
3,571 3,382 4,846 5,175 5,545 7,389 6,567
Education 5,693 5,882 8,294 12,434 15,254 17,043 13,907
UK
do
mic
iled
167
Unknown and combined subjects
208 51 0 962 2,641 2,418 2,392
Medicine and dentistry
77 116 261 3,553 4,598 2,396 2,364
Subjects allied to Medicine
550 283 673 4,230 6,698 4,256 4,161
Biological sciences
2,189 1,671 1,799 2,144 2,411 3,396 2,811
Oth
er E
U
Veterinary Sciences /
658 805 561 823 956 667 591

Understanding Postgraduate Demand
PGT 2005-2006
2006-2007
2007-2008
2008-2009
2009-2010
2010-2011
2011-2012
agriculture / related subjects Chemistry 200 140 175 211 369 322 255
Physics 0 0 25 0 175 221 301
Other physical sciences
1,553 1,649 1,882 1,782 2,087 2,422 2,130
Mathematical sciences
1,470 1,905 2,795 2,754 4,973 4,173 4,069
Computer science / librarianship / info science
3,534 3,372 3,319 6,142 7,608 6,580 5,389
Engineering / technology / building / architecture
6,300 6,533 7,527 10,610 12,589 13,250 13,422
Social / political / economic studies
23,002 26,636 25,698 26,438 31,285 26,935 25,803
Law 4,991 5,943 6,586 17,524 18,812 11,143 11,625
Business / administrative studies
15,018 18,781 25,213 28,176 36,094 29,309 27,413
Languages 1,462 1,960 1,892 4,471 5,275 3,938 2,925
Humanities 2,233 2,731 3,627 3,395 3,950 3,771 3,239
Creative arts / design
581 822 1,137 1,471 1,430 2,161 1,891
Education 1,374 1,726 1,867 2,444 3,134 2,875 2,249
Unknown and combined subjects
26 0 0 867 1,516 2,304 1,968
Medicine and dentistry
348 1,190 1,484 16,451 18,870 13,014 13,615
Subjects allied to Medicine
6,205 7,179 10,222 22,786 25,616 22,217 20,301
Biological sciences
8,675 10,130 13,602 13,869 13,389 18,201 15,601
Veterinary Sciences / agriculture / related subjects
2,948 3,441 3,212 5,023 4,906 4,688 4,357
Chemistry 1,887 2,321 3,693 4,653 4,297 3,924 3,846
Physics 76 76 177 80 341 634 1,259
Other physical sciences
9,825 11,459 14,754 15,384 17,380 18,587 19,259
Mathematical sciences
7,369 8,487 13,480 15,346 21,759 23,614 23,160
No
n-E
U
Computer science / librarianship / info science
21,073 21,469 23,219 45,617 56,257 57,041 58,763
168

Understanding Postgraduate Demand
PGT 2005-2006
2006-2007
2007-2008
2008-2009
2009-2010
2010-2011
2011-2012
Engineering / technology / building / architecture
34,893 44,662 53,535 99,876 112,919 128,266 132,919
Social / political / economic studies
83,204 89,966 92,230 91,908 107,575 153,154 153,926
Law 19,555 22,712 26,310 49,409 52,289 43,015 44,044
Business / administrative studies
113,818 134,499 171,696 257,354 337,711 373,772 406,371
Languages 4,821 5,229 6,999 17,522 26,062 31,848 31,031
Humanities 6,576 9,074 9918 11,105 12,264 12,135 11,473
Creative arts / design
2,869 3,645 4555 5,240 7,149 12,341 14,210
Education 6,164 7,346 12028 16,331 20,752 21,781 22,541
Unknown and combined subjects
104 0 19 8,156 15,541 23,811 23,839
169

Understanding Postgraduate Demand
Chapter 5
Applications by alumni status
PGR Base: Participating HEIs
Base Alumni New applicants
2008-2009 20,754 25,329 131,273
2009-2010 6
23,652 28,240 153,209
2010-2011 36,979 20,263 119,892
2011-2012 12
405,30 20,605 131,361
PGT Base: Participating HEIs
Base Alumni New applicants
2008-2009 99,516 48,042 755,848
2009-2010 9
114,557 53,087 884,451
2010-2011 179,429 45,651 900,546
2011-2012 15
181,459 40,047 917,262
170

Understanding Postgraduate Demand
Chapter 6
Applications by age
PGR Base HEIs
Base
21 and under 22-23 24-25 26-27 28-30 31-40 41-50 51+
2005-2006 5,240 4,620 17,046 22,698 19,359 18,692 23,358 5,786 1,397
2006-2007 6,551 4,122 19,650 25,079 21,799 21,574 28,390 6,773 1,749
2007-2008
6
7,593 4,308 21,853 29,180 22,687 25,510 34,562 8,385 1,933
2008-2009 25,541 12,749 37,458 36,621 27,519 26,151 34,410 7,769 1,991
2009-2010 10
30,275 15,817 46,106 42,892 31,500 31,487 38,361 10,823 3,005
2010-2011 51,345 12,235 35,983 32,314 25,330 25,138 36,599 9,647 2,783
2011-2012 17
56,584 12,776 37,193 34,871 26,725 29,073 41,286 10,888 3,688
PGT
Base HEIs
Base 21 and
under 22-23 24-25 26-27 28-30 31-40 41-50 51+
2005-2006 43,671 66,843 129,601 87,533 59,690 55,937 70,272 17,342 4,319
2006-2007 50,639 81,612 151,520 101,068 66,066 60,516 77,648 18,861 4,423
2007-2008
7
59,540 102,891 176,273 120,359 78,121 71,661 89,128 23,679 5,168
2008-2009 126,028 173,577 302,571 181,358 112,244 98,327 106,778 27,706 8,056
2009-2010 13
149,783 222,518 393,814 212,484 121,346 108,174 117,710 32,918 9,372
2010-2011 249,998 236,258 462,706 211,919 116,954 101,562 116,139 31,829 9,450
2011-2012 20
252,626 247,342 470,110 204,453 112,060 101,810 122,595 33,589 9,846 Applications by course type within age
PGR 2005-2006 2006-2007 2007-2008 2008-2009 2009-201
Base: Participating HEIs 6 10
Base 5,240 6,551 7,593 25,541 30,275
PhDs 15,348 18,407 20,682 43,350 53,159
Professional doctorates 240 295 285 438 428 Age 23 and under
Research Masters 6,078 5,070 5,194 6,418 8,336
PhDs 47,222 56,033 65,393 77,759 91,247
Professional doctorates 579 537 560 1,362 1,730 Age 24 - 30
Research Masters 12,948 11,882 11,424 11,170 12,902
PhDs 27,124 33,188 41,572 39,937 45,766
Professional doctorates 705 1,198 1,320 1,781 3,817 Age 31+
Research Masters 2,712 2,526 1,988 2,452 2,606
171

Understanding Postgraduate Demand
PGT 2005-2006
2006-2007
2007-2008
2008-2009
2009-2010
2010-2011
2011-2012
Base: Participating HEIs
7 13 20
Base 43,671 50,639 59,540 126,028 149,783 249,998 252,626
Masters 190,137 225,348 269,744 454,159 59,1383 631,254 646,919
MBAs 1,547 2,473 2,012 7,092 5,722 3,488 3,434 Age 23
and under
PG diplomas & certificates
4,759 5,311 7,408 9,044 10,105 11,813 10,261
Masters 185,807 205,997 241,937 350,032 395,825 360,358 346,932
MBAs 8,621 12,308 15,280 23,263 24,245 16,849 15,839 Age 24 - 30 PG diplomas
& certificates 8,732 9,345 12,924 16,722 19,184 16,002 15,869
Masters 71,165 78,617 91,623 113,256 124,238 111,150 110,667
MBAs 8,943 9,981 10,632 8,636 10,807 10,231 12,467 Age 31+ PG diplomas
& certificates 11,826 12,335 15,719 20,193 24,409 22,609 27,711
Applications by subject area within age
PGR 2005-2006
2006-2007
2007-2008
2008-2009
2009-2010
2010-2011
2011-2012
Base: Participating HEIs 6 10 17
Base 5,240 6,551 7,593 25,54
1 30,27
5 51,34
5 56,58
4
Medicine and dentistry 220 275 510 1,732 2,402 1,347 1,523
Subjects allied to Medicine
10 64 20 1,901 2,893 2,150 2,512
Biological sciences 1,028 2,485 3,544 3,745 4,568 5,027 4,886
Veterinary Sciences / agriculture / related subjects
10 10 0 122 103 71 94
Chemistry 630 740 835 1,342 1,332 1,593 1,791
Physics 620 730 545 1,367 1,445 1,317 1,578
Other physical sciences 345 755 1,200 1,132 1,495 1,727 2,012
Mathematical sciences 1,431 1,320 1,318 2,426 2,317 1,958 1,844
Computer science / librarianship / info science
833 911 498 1,228 1,814 1,477 1,390
Engineering / technology / building / architecture
1,680 2,357 2,935 4,370 5,510 4,526 4,946
Social / political / economic studies
10,322 9,982 9,521 12,51
7 15,37
3 9,174 9,421
Law 1,023 689 1,004 681 1,043 708 814
Business / administrative studies
1,994 2,206 2,420 5,900 7,294 4,083 3,800
Languages 180 290 450 2,759 3,238 1,941 2,122
Ag
e 23
an
d u
nd
er
Humanities 1,146 713 1,126 2,874 3,605 2,411 2,590
172

Understanding Postgraduate Demand
PGR 2005-2006
2006-2007
2007-2008
2008-2009
2009-2010
2010-2011
2011-2012
Creative arts / design 130 180 180 612 855 596 593
Education 0 65 55 520 665 487 523
Unknown and combined subjects
64 0 0 4,980 5,970 3,736 3,412
Medicine and dentistry 345 655 725 2,719 4,087 2,902 2,939
Subjects allied to Medicine
137 125 105 2,112 3,430 2,925 4,183
Biological sciences 1,919 3,982 5,779 4,418 5,346 6,185 6,069
Veterinary Sciences / agriculture / related subjects
170 40 60 343 595 292 249
Chemistry 822 1,185 1,030 1,185 1,795 1,742 1,621
Physics 490 710 445 1,117 1,240 883 1,007
Other physical sciences 1,015 2,215 2,280 1,957 2,470 2,377 2,607
Mathematical sciences 1,427 1,808 2,651 2,746 2,615 2,144 1,930
Computer science / librarianship / info science
2,507 3,019 3,621 3,253 3,769 2,859 3,423
Engineering / technology / building / architecture
5,889 7,655 8,304 10,48
4 13,14
4 9,276
10,533
Social / political / economic studies
33,200 32,238 34,650 31,40
7 35,99
6 21,79
6 23,07
5
Law 2,918 3,485 3,754 4,093 4,083 3053 3,583
Business / administrative studies
4,868 7,037 7,910 9,194 9,510 7,251 8,095
Languages 1,060 1,205 1,692 3,307 4,024 2,648 2,760
Humanities 3,185 1,989 2,871 4,027 5,586 3,783 4,193
Creative arts / design 420 545 805 963 1,192 804 1,007
Education 377 495 695 1,749 1,714 1,168 1,533
Ag
e 24
to
30
Unknown and combined subjects
0 64 0 5,215 5,284 2,577 2,588
Medicine and dentistry 430 585 770 1,742 2,515 1,812 2,269
Subjects allied to Medicine
240 160 384 1,069 1,768 1,918 2,926
Biological sciences 1,171 1396 1,870 1,741 2,166 2,864 2,712
Veterinary Sciences / agriculture / related subjects
170 110 100 490 463 293 240
Chemistry 142 420 500 445 582 620 815
Physics 377 320 330 263 288 308 420
Other physical sciences 875 1,449 2,077 1,422 1,507 1,414 1,399
Mathematical sciences 995 1,001 1,124 970 823 978 1,196
Computer science / librarianship / info science
1,535 2,053 2,468 2,025 2,234 2,186 2,110
Engineering / technology / building / architecture
4,134 5,438 6,183 6,599 7,565 5,374 6,908
Social / political / economic studies
11,146 10,583 13,921 11,21
7 11,90
1 9,456
10,115
Ag
e 31
+
Law 1,652 2,153 2,584 2,939 25,86 1,929 2,314
173

Understanding Postgraduate Demand
PGR 2005-2006
2006-2007
2007-2008
2008-2009
2009-2010
2010-2011
2011-2012
Business / administrative studies
4,128 5,838 6,068 5,849 7,253 5,970 6,215
Languages 677 1,362 1,354 1,403 2,125 1,772 1,981
Humanities 1,166 1,616 2,073 2,181 3,293 2,691 2,967
Creative arts / design 479 687 637 664 989 964 1,151
Education 1,032 1,677 2,395 1,922 2,503 2,559 2,887
Unknown and combined subjects
192 64 42 1,227 1,627 963 940
174

Understanding Postgraduate Demand
PGT 2005-2006
2006-2007
2007-2008
2008-2009
2009-2010
2010-2011
2011-2012
Base: Participating HEIs 7 13 20
Base 43,671 50,639 59,540 126,028 149,783 249,998 252,626
Medicine and dentistry
19 45 10 9,253 14,259 5,372 5,590
Subjects allied to Medicine
1,685 1,676 2,363 16,372 20,689 12,302 12,684
Biological sciences 6,335 6,951 8,577 10,369 10,447 14,081 12,382
Veterinary Sciences / agriculture / related subjects
991 1,216 921 2,155 2,246 2,217 1,884
Chemistry 860 1,158 1,606 2,339 2,219 1,857 2,174
Physics 0 25 76 61 340 787 1,051
Other physical sciences
4,109 5,366 6,915 8,820 10,377 9,677 9,463
Mathematical sciences
6,914 7,291 11,440 13,233 21,249 18,795 18,477
Computer science / librarianship / info science
11,939 12,994 13,892 31635 41,954 35,994 35,828
Engineering / technology / building / architecture
15,872 18,618 21,969 56506 64,033 65,275 64,861
Social / political / economic studies
58,576 65,300 64,663 75436 86,543 115,816 114,082
Law 11,709 14,554 16,346 33721 37,809 30,452 28,577
Business / administrative studies
62,732 79,147 106,003 163776 230,036 253,689 276,921
Languages 3,709 3,865 4,881 15169 22,532 24,244 21,956
Humanities 6,540 8,808 10,223 13398 14,151 13,369 12,269
Creative arts / design 2,250 3,022 4,526 5229 6,859 11,299 12,191
Education 2,152 3,072 4,746 8050 11,179 13,394 13,555
Ag
e 23
an
d u
nd
er
Unknown and combined subjects
52 26 10 4773 10,287 17,934 16,669
Medicine and dentistry
377 983 1,311 15795 18,270 9,939 10,290
Subjects allied to Medicine
4,436 4,868 7,279 18657 21,578 18,631 19,104
Biological sciences 6,137 6,237 8,142 9282 8,565 10,378 9,085
Veterinary Sciences / agriculture / related subjects
1,976 2,100 2,074 3346 3,562 3,445 2,992
Chemistry 1,079 1,357 2,112 2620 2,431 2,180 1,522
Physics 25 25 127 48 272 385 643
Other physical sciences
8,333 9,035 11,662 11121 12,081 11,328 10,930
Ag
e 24
to
30
Mathematical sciences
2,272 3,443 5,212 6755 8,189 6,692 6,189
175

Understanding Postgraduate Demand
PGT 2005-2006
2006-2007
2007-2008
2008-2009
2009-2010
2010-2011
2011-2012
Computer science / librarianship / info science
12,094 11,433 12,546 23279 25,551 22,090 19,626
Engineering / technology / building / architecture
24,198 29,149 34,480 51618 58,158 56,471 54,864
Social / political / economic studies
49,803 53,733 55,070 57320 64,459 65,473 62,769
Law 14,300 15,171 17,836 35678 36,998 26,516 25,776
Business / administrative studies
61,600 71,059 87,876 112954 129,583 110,663 110,604
Languages 3,998 4,828 5,527 11328 137,80 12,352 11,114
Humanities 4,535 5,544 5,930 8411 8,881 7,772 6,672
Creative arts / design 2,998 3,196 3,939 4665 4,738 6,392 6,704
Education 4,867 5,490 9,009 12755 15,175 14,895 12,458
Unknown and combined subjects
130 0 10 4385 6,980 7,607 7,297
Medicine and dentistry
174 464 676 11,271 12,785 5,843 7,513
Subjects allied to Medicine
6,373 5,651 8,823 15,965 2,0552 16,679 20,736
Biological sciences 2,252 2,871 4,671 4,123 4,631 4,962 5,081
Veterinary Sciences / agriculture / related subjects
1,518 1,717 1,614 1,811 1,616 1,446 1,197
Chemistry 363 381 572 513 407 390 519
Physics 51 25 25 49 61 77 173
Other physical sciences
3,626 3,767 4,256 3,988 4,153 3,911 3,325
Mathematical sciences
503 722 967 1,577 2,473 1,682 1,514
Computer science / librarianship / info science
3,551 3,758 3,774 5,525 5,369 5,305 5,499
Engineering / technology / building / architecture
10,173 14,130 16,253 17,295 17,429 16,491 17,197
Social / political / economic studies
16,653 16,844 18,146 17,334 18,989 23,897 22,630
Law 5,396 5,431 6,077 12,113 12,286 7,849 8,005
Business / administrative studies
26,982 29,980 34,392 27,650 31,388 29,224 32,766
Languages 1,928 2,658 2,607 4,353 4,461 3,953 3,931
Humanities 3,558 3,882 3,725 4,230 4,404 3,799 3,418
Creative arts / design 1,844 1,679 2,351 2,152 2,693 3,631 3,382
Education 6,831 6,946 9,045 11,334 13,334 12,888 11,740
Ag
e 31
+
Unknown and combined subjects
156 25 0 803 2,422 1,963 2,220
176

Understanding Postgraduate Demand
177

Understanding Postgraduate Demand
Applications by gender
PGR Base: Participating HEIs
Base Male Female
2005-2006 5,274 71,389 42,090
2006-2007 6,562 81,938 47,306
2007-2008
6
7,636 93,274 55,696
2008-2009 25,665 110,814 74,425
2009-2010 10
30,366 129,138 91,315
2010-2011 51,464 106,968 73,313
2011-2012 17
56,724 117,161 79,610
PGT Base: Participating HEIs
Base Male Female
2005-2006 43,742 265,587 226,856
2006-2007 50,801 306,100 257,481
2007-2008
7
59,788 362,758 307,172
2008-2009 126,362 528,225 485,148
2009-2010 13
149,896 602,595 616,998
2010-2011 250,115 604,027 683,490
2011-2012 20
252,685 598,755 703,446
178

Understanding Postgraduate Demand
Applications by qualification type within gender
PGR 2005-2006
2006-2007
2007-2008
2008-2009
2009-2010
2010-2011
2011-2012
Base: Participating HEIs
6 10 17
Base 5,274 6,562 7,636 25,665 30,366 51,464 56,724
PhDs 55,298 67,064 78,785 96,146 110,398 94,293 102,161
Professional doctorates
789 1,266 1,373 2,332 3,561 2,535 3,320
Mal
e
Research Masters
15,302 13,608 13,116 12,337 15,180 10,138 11,676
PhDs 34,931 40,662 49,324 65,038 79,863 63,719 67,812
Professional doctorates
755 774 882 1,685 2,765 2,581 3,522
Fem
ale
Research Masters
6,404 5,870 5,490 7,703 8,686 7,008 8,274
PGT 2005-2006
2006-2007
2007-2008
2008-2009
2009-2010
2010-2011
2011-2012
Base: Participating
HEIs 7 13 20
Base 43,742 50,801 59,788 126,362 149,896 250,115 252,685
Masters 242,127 276,175 324,554 476058 547107 559409 552217
MBAs 14,127 18,548 21,681 29793 30380 21818 22214
Mal
e
PG diplomas & certificates
9,334 11,378 16,522 22374 25107 22800 24323
Masters 205,719 234,985 280,472 450389 575528 639609 653555
MBAs 5,110 6,822 6,923 9596 10583 9867 10950
Fem
ale
PG diplomas & certificates
16,027 15,673 19,777 25164 30887 34013 38941
179

Understanding Postgraduate Demand
Applications by subject area within gender
PGR 2005-2006
2006-2007
2007-2008
2008-2009
2009-2010
2010-2011
2011-2012
Base: Participating HEIs 6 10 17
Base 5,274 6,562 7,636 25,665 30,366 51,464 56,724
Medicine and dentistry 520 715 1,055 3,124 4,444 3,449 3,861
Subjects allied to Medicine 122 145 259 2,333 3,739 3,846 5,306
Biological sciences 2,194 4,221 5,851 4,966 5,820 8,157 8,079
Veterinary Sciences / agriculture / related subjects
270 140 140 6,52 730 409 319
Chemistry 974 1,635 1,525 1,850 2,420 2,973 3,217
Physics 1,147 1,350 940 2,109 2,297 1,986 2,319
Other physical sciences 1,445 2,827 3,640 3,005 3,391 4,671 5,135
Mathematical sciences 3,010 2,710 3,416 4,421 3,896 4,269 4,124
Computer science / librarianship / info science
2,993 3,777 4,253 4,440 5,550 5,186 5,128
Engineering / technology / building / architecture
9,908 12,925 14,655 17,239 20,608 17,812 20,798
Social / political / economic studies
32,299 31,357 33,533 30,384 34,091 23,235 25,189
Law 2,937 3,849 4,592 4,426 4,621 3,508 4,167
Business / administrative studies
7,868 10,049 11,160 13,941 15,272 12,100 12,766
Languages 840 1,320 1,675 3,067 4,016 3,136 3,257
Humanities 3,536 2,987 3,728 5,616 7,828 5,481 6,428
Creative arts / design 492 552 870 1,056 1,525 1,180 1,337
Education 770 1,315 1,950 1,685 1,943 1,767 2,047
Mal
e
Unknown and combined subjects
64 64 32 6,503 6,947 3,806 3,688
Medicine and dentistry 475 800 980 3,074 4,561 3,462 3,860
Subjects allied to Medicine 265 204 250 2,750 4,368 4,401 5,841
Biological sciences 1,994 3,657 5,387 5,334 6,616 8,591 8,962
Veterinary Sciences / agriculture / related subjects
100 20 20 303 432 246 301
Chemistry 650 710 870 1,127 1,288 1,540 1,654
Physics 365 410 395 643 677 521 683
Other physical sciences 820 1,607 1,917 1,506 2,092 2,716 3,042
Mathematical sciences 843 1,419 1,707 1,727 1,859 1,447 1,508
Computer science / librarianship / info science
1,912 2,216 2,349 2,067 2,271 2,243 2,642
Engineering / technology / building / architecture
1,915 2,570 2,972 4,272 5,616 4,562 5,172
Social / political / economic studies
22,495 21,424 24,606 24,767 29,180 18,871 19,523
Law 2,656 2,478 2,765 3,263 3,090 2,577 3,086
Fem
ale
Business / administrative studies
3,164 5,062 5,328 7,058 8,810 6,892 7,129
180

Understanding Postgraduate Demand
PGR 2005-2006
2006-2007
2007-2008
2008-2009
2009-2010
2010-2011
2011-2012
Languages 1,107 1,537 1,836 4,417 5,383 3,885 4,371
Humanities 1,961 1,346 2,342 3,472 4,656 3,783 3,678
Creative arts / design 537 860 752 1,184 1,535 1,271 1,548
Education 639 922 1,210 2,516 2,943 2,831 3,299
Unknown and combined subjects
192 64 10 4,944 5,939 3,478 3,313
181

Understanding Postgraduate Demand
PGT 2005-2006
2006-2007
2007-2008
2008-2009
2009-2010
2010-2011
2011-2012
Base: Participating HEIs 7 13 20
Base 43,742 50,801 59,788 126,362 149,896 250,115 252,685
Medicine and dentistry 290 706 983 13,693 15,872 10,738 12,199
Subjects allied to Medicine
5,878 5,937 8,447 19,190 20,916 17,279 18,047
Biological sciences 6,248 6,884 8,720 9,984 9,095 12,953 10,780
Veterinary Sciences / agriculture / related subjects
3,271 3,860 3,473 4,897 4,775 4,213 3,743
Chemistry 1,600 2,140 3,036 3,206 2,771 2,795 2,741
Physics 76 51 127 127 526 940 1,340
Other physical sciences
10,977 12,166 14,342 14,194 15,321 16,407 15,766
Mathematical sciences 5,222 7,278 10,579 13,038 20,481 18,886 18,073
Computer science / librarianship / info science
16,144 15,128 15,371 32,279 38,171 38,672 35,715
Engineering / technology / building / architecture
42,210 51,860 60,834 101,786 111,961 119,571 118,017
Social / political / economic studies
56,414 60,679 60,726 68,121 75,767 89,693 86,452
Law 15,504 16,658 19,843 39,436 40,103 29,746 29,055
Business / administrative studies
84,081 101,524 128,457 165,068 196,455 187,818 196,652
Languages 2,633 3,283 3,590 8,292 9,492 10,730 9,708
Humanities 7,563 9,464 10,769 14,205 14,524 13,481 12,021
Creative arts / design 2,380 2,716 3,362 3,969 4,833 6,907 6,783
Education 4,966 5,768 10,081 12,198 13,414 10,781 10,097
Mal
e
Unknown and combined subjects
130 0 19 4,542 8,118 12,418 11,568
Medicine and dentistry 280 786 1,014 22,627 29,479 14,598 15,866
Subjects allied to Medicine
6,660 6,278 10,048 31,951 41,988 33,207 36,827
Biological sciences 8,506 9,175 12,669 13,862 14,605 19,599 18,115
Veterinary Sciences / agriculture / related subjects
1,233 1,208 1,155 2,444 2,659 3,058 2,611
Chemistry 703 756 1,254 2,266 2,296 1,990 1,903
Physics 0 25 101 31 147 316 534
Other physical sciences
5,110 6,067 8,549 9,758 11,278 12,086 11,409
Mathematical sciences 4,468 4,187 7,030 8,588 11,491 12,200 12,194
Fem
ale
Computer science / librarianship / info science
11,509 13,141 14,859 28,271 34,742 32,335 34,345
182
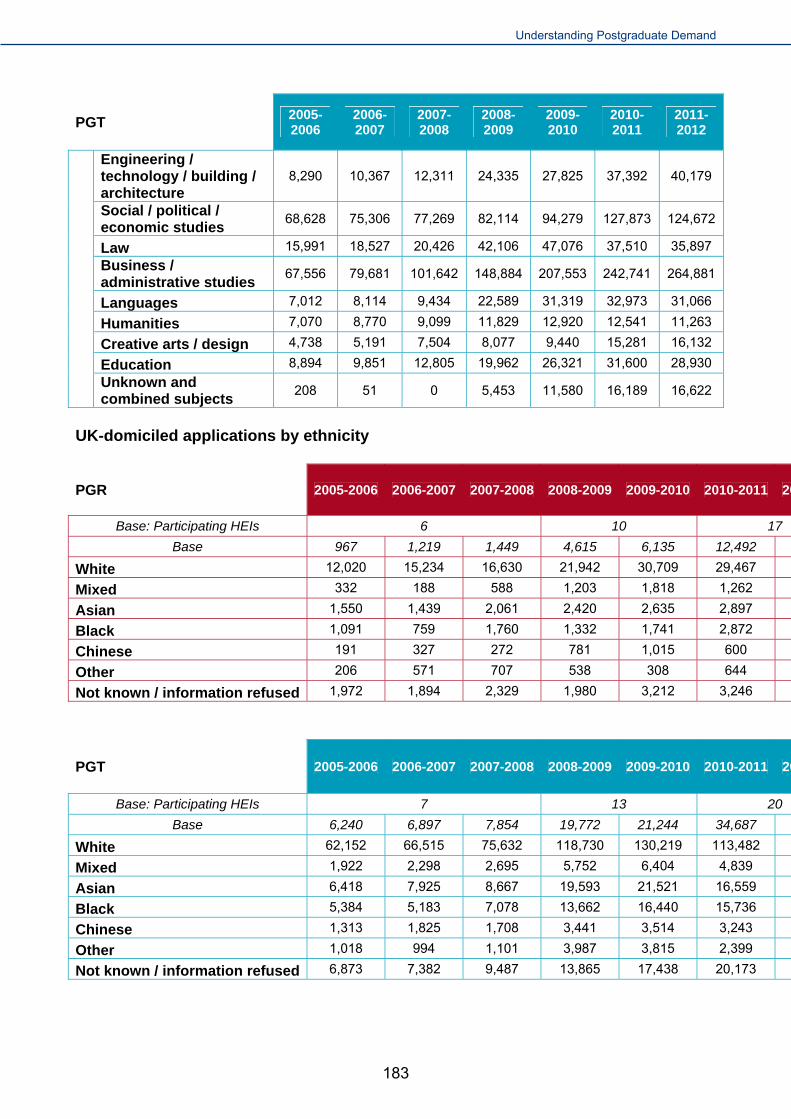
Understanding Postgraduate Demand
PGT 2005-2006
2006-2007
2007-2008
2008-2009
2009-2010
2010-2011
2011-2012
Engineering / technology / building / architecture
8,290 10,367 12,311 24,335 27,825 37,392 40,179
Social / political / economic studies
68,628 75,306 77,269 82,114 94,279 127,873 124,672
Law 15,991 18,527 20,426 42,106 47,076 37,510 35,897
Business / administrative studies
67,556 79,681 101,642 148,884 207,553 242,741 264,881
Languages 7,012 8,114 9,434 22,589 31,319 32,973 31,066
Humanities 7,070 8,770 9,099 11,829 12,920 12,541 11,263
Creative arts / design 4,738 5,191 7,504 8,077 9,440 15,281 16,132
Education 8,894 9,851 12,805 19,962 26,321 31,600 28,930
Unknown and combined subjects
208 51 0 5,453 11,580 16,189 16,622
UK-domiciled applications by ethnicity
PGR 2005-2006 2006-2007 2007-2008 2008-2009 2009-2010 2010-2011 20
Base: Participating HEIs 6 10 17
Base 967 1,219 1,449 4,615 6,135 12,492
White 12,020 15,234 16,630 21,942 30,709 29,467
Mixed 332 188 588 1,203 1,818 1,262
Asian 1,550 1,439 2,061 2,420 2,635 2,897
Black 1,091 759 1,760 1,332 1,741 2,872
Chinese 191 327 272 781 1,015 600
Other 206 571 707 538 308 644
Not known / information refused 1,972 1,894 2,329 1,980 3,212 3,246
PGT 2005-2006 2006-2007 2007-2008 2008-2009 2009-2010 2010-2011 20
Base: Participating HEIs 7 13 20
Base 6,240 6,897 7,854 19,772 21,244 34,687
White 62,152 66,515 75,632 118,730 130,219 113,482
Mixed 1,922 2,298 2,695 5,752 6,404 4,839
Asian 6,418 7,925 8,667 19,593 21,521 16,559
Black 5,384 5,183 7,078 13,662 16,440 15,736
Chinese 1,313 1,825 1,708 3,441 3,514 3,243
Other 1,018 994 1,101 3,987 3,815 2,399
Not known / information refused 6,873 7,382 9,487 13,865 17,438 20,173
183

Understanding Postgraduate Demand
Applications by disability status
PGR Base: HEIs
Base Disabled Not disabled Information refused/unknown
2005-2006 5,282 3,640 104,739 5,237
2006-2007 6,563 5,015 121,830 2,431
2007-2008
6
7,639 5,155 141,942 1,918
2008-2009 25,547 5,966 154,293 24,479
2009-2010 10
30,311 6,232 183,055 30,910
2010-2011 47,529 6,211 138,971 27,237
2011-2012 17
51,644 6,574 149,289 30,849
PGT Base Base: HEIs Disabled Not disabled Information refused/unknown
2005-2006 43,754 13,484 448,949 30,126
2006-2007 50,823 14,769 521,434 27,591
2007-2008
7
59,792 17,275 627,264 25,428
2008-2009 126,391 22,289 733,075 258,026
2009-2010 13
149,883 24,399 905,113 289,685
2010-2011 231,601 25,540 933,828 272,573
2011-2012 20
232,869 24,942 937,589 280,317
184

Understanding Postgraduate Demand
185
Appendix II: Postgraduate typology
The table below sets the specific types of study and examples of corresponding qualifications within both PGR and PGT programmes as defined for the purposes of the this study.
PGR
Doctoral Degrees PhD DPhil MPhil*
Professional doctorates EngD DNursSci VetMD DBA DClinPsy
Research Masters
PGT
Masters Degrees MA MSc
Masters of Business Administration
Postgraduate Diplomas and Certificates
PGCert PGDip
After close consultation with BIS, MPhils were categorised under Doctoral Degrees, although it is acknowledged that there is some institutional variation in terms of the positioning of this qualification being closer to a Masters Degree or a PhD.

Appendix III Table of student numbers The figures presented below are taken from the Students in Higher Education Institutions tables compiled by the Higher Education Statistics Agency (HESA). They provide information on the actual numbers of students registered to postgraduate study at English Higher Education Institutions in each of the academic years covered by this study. Please note that figures have not been included for academic years post 2007-2008, due to the fact that this data is not freely available online. Figures are rounded to the nearest five students.
PGR PGT Other Postgraduate Total
N % change N % change N % change N % change
2005-2006 23,015 - 118,370 - 85,180 - 226,565 -
2006-2007 24,610 7% 124,005 5% 82,750 -3% 231,365 2%
2007-2008 23,545 -4% 129,680 5% 77,285 -7% 230,510 -<1%
186

187
Appendix IV Research instruments Data specification sent to participating HEIs
Data Specification
Data sharing specification: Demand for Postgraduate Study
1.1 Thank you for your valuable contribution to this research study into the student demand for postgraduate study so far. We are pleased to confirm that the next stage of the research is going ahead which entails the collation of application data from a selected number of HEIs in England. The purpose of this exercise is to enable us to analyse a robust sample of the postgraduate application data to identify patterns and trends over time.
What type of data is in scope?
Line by line data
1.2 We would like to obtain copies of your application databases for applications received in the following academic years [DELETE AS APPROPRIATE]:
2005-06 (for study from September 2006 onwards)
2006-07 (for study from September 2007 onwards)
2007-08 (for study from September 2008 onwards)
2008-09 (for study from September 2009 onwards)
2009-10 (for study from September 2010 onwards)
2010-11 (for study from September 2011 onwards)
2011-12 (for study from September 2012 onwards)
1.3 For the years specified above, we require anonymised line-by-line records (i.e. one row per application as opposed to aggregate or summary data). PLEASE NOTE we are not looking for just records of students who went on to study at your institution; in order to understand levels of demand we wish to collate all application data, regardless of whether or not the individual went on to enrol on a course.
1.4 Please exclude all applications for:
Integrated Masters Programmes
PGCE courses
If this is not easily achievable, please flag these records accordingly.

Understanding Postgraduate Demand
1.5 Information on the specific data fields and field format we require is set out in ‘Data Fields’ sections below (see sections 1.14 and 1.15).
Aggregated data
1.6 In addition to the row by row application data, we would be grateful if you could provide us with any aggregated data held by the institution dating from 2003 (where possible). This may be in the form of summary tables or a qualitative précis.
1.7 Any aggregated data submitted will be used alongside the line by line data. These aggregate data will supplement the detailed data and should not be provided in place of the individual line by line records we have requested.
What will the data be used for?
1.8 The data you provide will be used in quantitative analysis of application data from a number of English HEIs. The data will be combined with that of other institutions so that it can be used in the future as a benchmark against which the impact of wider HE policy change (particularly the increase in undergraduate tuition fees) might be measured.
1.9 In addition, IFF will conduct analysis by key demographic groups to understand how the demand for postgraduate study among these groups has changed over the last decade.
1.10 Please be assured that any findings will not be reported on in such a way that will allow individual institutions to be identified.
How will the data be handled?
1.11 Every effort will be taken to assist HEIs with the extraction and transfer of data. If you require any technical support or advice, please contact Anna Ponomarenko at [email protected] or Jessica Huntley Hewitt at [email protected], or telephone IFF on 0207 250 3035.
1.12 Data should be transferred using IFF’s secure File Transfer Protocol (FTP) site. This site is hosted in-house on IFF’s encrypted server. Data transfer can only occur when using an approved registered account and data must be encrypted to AES-256 compliance and password protected. Further instruction on how to register on the FTP site and upload data is provided in the ‘Transferring Data’ section (1.16 onwards).
1.13 If you require a data transfer agreement then please inform either Anna or Jessica who will arrange for the document to be drawn up.
Data fields
1.14 For each year of application data requested, please provide the following information specified in the tables on the next pages. Where possible, please provide information in the suggested format given in the tables. However, we also value any free text information that can be coded by IFF to produce the types of information that we require.
1.15 We have produced this list of fields based on information provided by HEIs during the site visits at the end of last year. We understand these to be the data fields most commonly held on application databases. If there are particular fields that you don’t have then please let us know and we can discuss alternatives.

Understanding Postgraduate Demand
Security: CONTROLLED 189
Postgraduate application data fields required by IFF Research
Data Field Notes / Format
1 Date application submitted DD/MM/YYYY
2 Gender Male / Female
3 Date of Birth DD/MM/YYYY
4
Mode of Study applied to Preferably in the following format:
1.) Full-time
2.) Part-time,
3.) Other (including distance learning, sandwich courses etc)
5
Disability Status 1.) Yes
2.) No
3.) Refused / Unknown

Understanding Postgraduate Demand
Data Field Notes / Format
6 Ethnicity We are particularly interested in obtaining this information for British Nationals.
Where possible, please use the following categories;
1.) White - British
2.) White – Irish
3.) White – Scottish
4.) Irish Traveller
5.) White - other
6.) Mixed – White and Black Caribbean
7.) Mixed – White and Black African
8.) Mixed – White and Asian
9.) Mixed – Any other Mixed
10.) Asian or Asian British – Indian
11.) Asian or Asian British – Pakistani
12.) Asian or Asian British – Bangladeshi
13.) Asian or Asian British – Any other Asian
14.) Black or Black British – Caribbean
15.) Black or Black British – African
16.) Black or Black British – Any other Black
17.) Chinese
18.) Any other ethnic group
19.) Not known / Information refused

Understanding Postgraduate Demand
Security: CONTROLLED 191
Data Field Notes / Format
7 Funding status Please indicate where possible whether applicants fall within the following areas:
1.) UK Domiciled
2.) Other EU
3.) Non-EU
If this is not possible, please provide any relevant field(s) which can be used to derive this information for funding purposes (e.g. country of residence)
8 Course Title Please provide the course or programme title that the applicant was applying for.

Understanding Postgraduate Demand
Data Field Notes / Format
9 Subject Area Where possible, please refer to HEFCE subject categories as outlined below. For information on how JACS maps onto this categorisation please refer to Appendix 1
(1) Medicine and dentistry
(2) Subjects allied to Medicine
(3) Biological sciences
(4) Veterinary Sciences / agriculture / related subjects
(5) Chemistry
(6) Physics
(7) Other physical sciences
(8) Mathematical sciences
(9) Computer science / librarianship / info science
(10) Engineering / technology / building / architecture
(11) Social / political / economic studies
(12) Law
(13) Business / administrative studies
(14) Languages
(15) H iti

Understanding Postgraduate Demand
Security: CONTROLLED 193
Data Field Notes / Format
10 Qualification Type If possible please code the qualification applied for using the categories below.
1.) Doctoral degrees (PhD and DPhil)
2.) Professional doctorates (e.g. EngD, DNursSci, VetMD, EdD, DBA, DClinPsy)
3.) Higher doctorates and honorary doctorates (e.g. Doctor of Sciences (DSc/ScD) and Doctor of Letters (DLitt/LittD)
4.) Masters degrees (taught e.g. MA, MSc)
5.) Research masters (MRes, MPhil)
6.) Masters of Business Administration (MBA)
7.) Postgraduate diplomas and certificates
If this isn’t possible, for example, because you use alternative classifications, please provide whatever data you are able to.
11 Previous HEI Where possible, please provide 4 digit Institutional code. Please see Appendix 1
Alternatively, please provide any free text fields
12 Date of Previous Qualification Achieved
Please provide in the following format:
DD/MM/YYYY

Understanding Postgraduate Demand
Data Field Notes / Format
13 Existing student Where possible, please indicate whether or not applicant was an existing undergraduate student.
1.) Yes
2.) No
This could potentially be done by appending an existing student number where applicable
14 Was an offer made? Please indicate on the records whether or not an offer was made to the applicant
1.) Yes
2.) No
15 Did the applicant enrol on the course? Please indicate on the records whether the applicant ultimately registered on the course
1.) Yes
2.) No
16 Postcode Please provide the postcode of applicants’ permanent address at the time of making the application.
We are really only interested in this information for British Nationals.

Understanding Postgraduate Demand
195
Appendix 1: Subject classifications
JACS SUBJECT AREA
JACS 1.7 code (refers to first two
characters only)
JACS 2 code (refers to first two
characters only) for 2007/08 onwards
Subject area
1 Medicine and Dentistry
2 Subjects allied to Medicine
3 Biological sciences
4 or 5 Veterinary sciences, Agriculture and related Subjects
6 F1 F1 Chemistry
6 F3 F3 Physical Sciences
6 else
Else Other physical sciences
7 Mathematical Sciences
8 or E Computer science, Librarianship & Info Science
9 or A Engineering, Technology, Building & Architecture
B Social political and economic studies
C Law
D Business and administrative studies
F Languages
G Humanities
H Creative arts and design
I Education
J Unknown and combined subjects

Understanding Postgraduate Demand
For more information please see:
http://www.hesa.ac.uk/content/view/102/136/1/4/ (JACS 1.7) and
http://www.hesa.ac.uk/content/view/102/136/1/6/ (JACS 2.0)
Appendix 2: 4 Digit Institutional Codes
Valid Entries
0001 The Open University
0002 Cranfield University
0003 Royal College of Art
0007 Bishop Grosseteste University College Lincoln
0009 Buckinghamshire New University
0010 Central School of Speech and Drama
0011 University of Chester
0012 Canterbury Christ Church University
0013 York St John University
0014 University College Plymouth St Mark and St John
0016 Edge Hill University
0017 University College Falmouth
0018 Harper Adams University College
0021 The University of Winchester
0023 Liverpool Hope University
0024 University of the Arts, London
0026 University of Bedfordshire
0027 The University of Northampton
0028 Newman University College
0030 Ravensbourne

Understanding Postgraduate Demand
Secu
0031 Roehampton University
0032 Rose Bruford College
0033 Royal Academy of Music
0034 Royal College of Music
0035 Royal Northern College of Music
0037 Southampton Solent University
0038 University of Cumbria
0039 St Mary's University College, Twickenham
0040 Leeds Trinity University College
0041 Trinity Laban Conservatoire of Music and Dance
0046 The University of Worcester
0047 Anglia Ruskin University
0048 Bath Spa University
0049 The University of Bolton
0050 Bournemouth University
0051 The University of Brighton
0052 Birmingham City University
0053 The University of Central Lancashire
0054 University of Gloucestershire
0056 Coventry University
0057 University of Derby
0058 The University of East London
0059 The University of Greenwich
r

Understanding Postgraduate Demand
0060 University of Hertfordshire
0061 The University of Huddersfield
0062 The University of Lincoln
0063 Kingston University
0064 Leeds Metropolitan University
0065 Liverpool John Moores University
0066 The Manchester Metropolitan University
0067 Middlesex University
0068 De Montfort University
0069 The University of Northumbria at Newcastle
0071 The Nottingham Trent University
0072 Oxford Brookes University
0073 The University of Plymouth
0074 The University of Portsmouth
0075 Sheffield Hallam University
0076 London South Bank University
0077 Staffordshire University
0078 The University of Sunderland
0079 The University of Teesside
0080 Thames Valley University
0081 University of the West of England, Bristol
0082 The University of Chichester
0083 The University of Westminster
0085 The University of Wolverhampton
Understanding Postgraduate Demand
Secu
0086 The University of Wales, Newport
0087 Glyndŵr University
0089 University of Wales Institute, Cardiff
0090 University of Glamorgan
0091 Swansea Metropolitan University
0092 Trinity University College
0095 University of Abertay Dundee
0096 Edinburgh College of Art
0097 Glasgow School of Art
0100 Queen Margaret University, Edinburgh
0101 The Royal Scottish Academy of Music and Drama
0104 The Robert Gordon University
0105 The University of the West of Scotland
0106 Glasgow Caledonian University
0107 Edinburgh Napier University
0108 Aston University
0109 The University of Bath
0110 The University of Birmingham
0111 The University of Bradford
0112 The University of Bristol
0113 Brunel University
0114 The University of Cambridge
0115 The City University
r

Understanding Postgraduate Demand
0116 University of Durham
0117 The University of East Anglia
0118 The University of Essex
0119 The University of Exeter
0120 The University of Hull
0121 The University of Keele
0122 The University of Kent
0123 The University of Lancaster
0124 The University of Leeds
0125 The University of Leicester
0126 The University of Liverpool
0127 Birkbeck College
0131 Goldsmiths College
0132 Imperial College of Science, Technology and Medicine
0133 Institute of Education
0134 King's College London
0135 London Business School
0137 London School of Economics and Political Science
0138 London School of Hygiene and Tropical Medicine
0139 Queen Mary and Westfield College
0141 Royal Holloway and Bedford New College
0143 The Royal Veterinary College
0145 St George's Hospital Medical School
0146 The School of Oriental and African Studies

Understanding Postgraduate Demand
Secu
0147 The School of Pharmacy
0149 University College London
0151 University of London (Institutes and activities)
0152 Loughborough University
0154 The University of Newcastle-upon-Tyne
0155 The University of Nottingham
0156 The University of Oxford
0157 The University of Reading
0158 The University of Salford
0159 The University of Sheffield
0160 The University of Southampton
0161 The University of Surrey
0162 The University of Sussex
0163 The University of Warwick
0164 The University of York
0167 The University of Edinburgh
0168 The University of Glasgow
0169 The University of Strathclyde
0170 The University of Aberdeen
0171 Heriot-Watt University
0172 The University of Dundee
0173 The University of St Andrews
0174 The University of Stirling
r

Understanding Postgraduate Demand
0175 Scottish Agricultural College
0176 The University of Wales, Lampeter
0177 Aberystwyth University
0178 Bangor University
0179 Cardiff University
0180 Swansea University
0184 The Queen's University of Belfast
0185 University of Ulster
0186 The University of Wales (central functions)
0188 The Institute of Cancer Research
0189 Writtle College
0190 Norwich University College of the Arts
0193 Stranmillis University College
0194 St Mary's University College
0195 Royal Agricultural College
0196 UHI Millennium Institute
0197 The Arts University College at Bournemouth
0199 Conservatoire for Dance and Drama
0200 University College Birmingham
0201 Courtauld Institute of Art
0202 London Metropolitan University
0203 The University of Buckingham
0204 The University of Manchester
0205 Heythrop College

Understanding Postgraduate Demand
Secu
0206 University for the Creative Arts
0207 Leeds College of Music
0208 Guildhall School of Music and Drama
0209 The Liverpool Institute for Performing Arts
0210 University Campus Suffolk
r

Understanding Postgraduate Demand
Qualitative discussion guide used at HEI site visits
Private & Confidential J5120 Date 5/12/13
BIS – Understanding Demand for Postgraduate Study Wave 2 Site-Visits Depth Interview Topic Guide (Version 1)
1. INTRODUCTION (5 mins)
Stress confidentiality issues
o Introduce self o Introduce IFF Research – independent research company o Explain Subject:
o IFF Research has been commissioned by Department for Business, Innovation and Skills (BIS) to explore changes in demand for postgraduate study over the last decade. The research study started last year in 2012 and we are now coming to the end of the fieldwork period.
o You recently submitted an extensive dataset to IFF Research detailing demographic information relating to applications to study at postgraduate level at this HEI.
o Based on the dataset provided, IFF Research have produced a brief report summarising the overall trends and patterns in applications to study at postgraduate level by key demographics.
o We’d now like to discuss this summary with you to ensure that the patterns we have identified tie in with your experiences and to acquire further contextual information that might help to explain some of the changes seen in the profile of postgraduate applicants to your institution.
o Recording, confidentiality – MRS Code of Conduct and Data Protection o Length: Approx. One and a half hours

Understanding Postgraduate Demand
Secu
2. Discussion of summary report: (45 minutes)
The purpose of this section is to talk through the summary report of application data compiled by IFF Research for each of the HEIs participating in the Stage 2 site visits. The main aims of the discussion are to ensure that the reported trends are as the HEI expects; provide an opportunity for the respondent to offer further contextual information to explain the trends noted and where respondents disagree with the patterns observed, explain where and how this disparity arises.
Outline amount of information supplied o Academic years covered by application data provided o Limitations of data – whether any field(s) for which no / little data was provided
Discuss overall levels of application numbers in period covered
Discuss patterns in applications by key demographics;
o Application rates by gender o Application rates by age o Application rates by mode of study o Application rates by disability status o Application rates by ethnicity o Application rates by funding status o Application rates by subject area o Application rates by qualification type o Application rates by previous HEI o Application rates by date of previous qualification achieved o Applications from existing students o Outcome of applications made
Interviewer to refer to individual HEI summary report and invite respondent’s opinion on patterns and trends documented in report. If respondent disagrees with patterns and trends observed, interviewer to note down areas where respondent disagrees, how and why.
After outlining main trends and patterns for each section, interviewer to refer to relevant di i b i h ti f t f t d b ifi t
r

Understanding Postgraduate Demand
3. Activities that have been undertaken to increase demand (15 mins)
The purpose of this section is to acquire any further information about how postgraduate study has been marketed to potential applicants and the extent to which these marketing activities have impacted on, or skewed, the profile of those applying to study at the university.
Can you tell me a bit more about any activities, that we haven’t already discussed, that the HEI has undertaken to increase the number of candidates applying to study at postgraduate level?
PROBE:
o What activities has the HEI undertaken? What else? o Are they any types of applicants in terms of demographic profile that the HEI has
sought to attract? IF YES: What types of applicant? Who else? Why these types of applicants specifically? What methods have been used to attract these specific candidates?
o Are there any qualification types that the HEI has promoted in particular over the period the data covers? Which qualifications? Why these types of qualifications?
o Are there any subject areas that the HEI has promoted in particular over the period the data covers? Which subjects? Why these subjects?
IF ANY ACTIVITY UNDERTAKEN:
What has been the effect of these activities? PROBE:
o Which of these activities has had most impact? And which the least? Why do you think this is?
o Are there specific types of candidates who are harder or easier to attract to study at postgraduate level at the university? IF YES: Which type of candidate is harder to recruit? And which the easiest? Why is this? Has this always been the case, or has this changed with time?
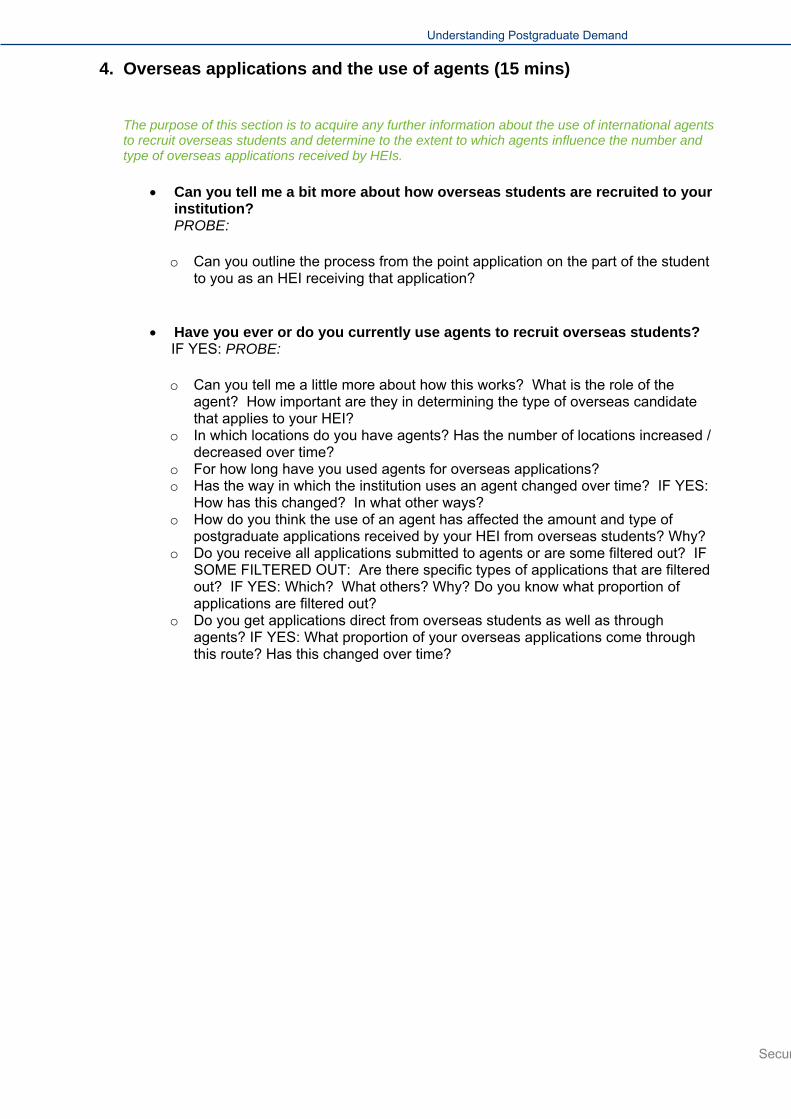
Understanding Postgraduate Demand
Secu
4. Overseas applications and the use of agents (15 mins)
The purpose of this section is to acquire any further information about the use of international agents to recruit overseas students and determine to the extent to which agents influence the number and type of overseas applications received by HEIs.
Can you tell me a bit more about how overseas students are recruited to your institution? PROBE:
o Can you outline the process from the point application on the part of the student to you as an HEI receiving that application?
Have you ever or do you currently use agents to recruit overseas students? IF YES: PROBE:
o Can you tell me a little more about how this works? What is the role of the agent? How important are they in determining the type of overseas candidate that applies to your HEI?
o In which locations do you have agents? Has the number of locations increased / decreased over time?
o For how long have you used agents for overseas applications? o Has the way in which the institution uses an agent changed over time? IF YES:
How has this changed? In what other ways? o How do you think the use of an agent has affected the amount and type of
postgraduate applications received by your HEI from overseas students? Why? o Do you receive all applications submitted to agents or are some filtered out? IF
SOME FILTERED OUT: Are there specific types of applications that are filtered out? IF YES: Which? What others? Why? Do you know what proportion of applications are filtered out?
o Do you get applications direct from overseas students as well as through agents? IF YES: What proportion of your overseas applications come through this route? Has this changed over time?
r

Understanding Postgraduate Demand
5. Perceived impact of fees over time (10 mins)
The purpose of this section is to better understand the perceived impact of the increase in tuition fees for those enrolling in the 06/07 academic year; to provide some context as to how this change in the fee regime impacted specifically on postgraduate applications at the HEI and to encourage the respondent to consider the issues of increased tuition fees specifically in relation to the demand for postgraduate study.
How do you think the increase in tuition fees for those enrolling in the 2006/07 academic year subsequently impacted on applications to study at postgraduate level at this HEI? PROBE:
o What was the most significant change in terms of the profile of postgraduate applicants as a result of the fee increase for the 2006/07 academic year?
o In what other ways did this increase impact on the demand for postgraduate study?
o How long did it take for the increase in fees at undergraduate level in 2006/07 to filter up to applications for postgraduate study?
o Is the university still feeling the effect of this fee increase? In what ways?
How important do you consider the increase in tuition fees in 06/07 to be on the number and profile of applications to postgraduate study relative to specific marketing activities undertaken by the HEI? PROBE:
o What would you say has had the biggest impact on postgraduate applications to the university, fees or marketing activities? Why do you say this?

Understanding Postgraduate Demand
Secu
6. Anticipated future trends (15 mins)
The purpose of this section is to encourage respondents to consider specifically the anticipated effect of the most recent increase in tuitions fees introduced for the 2012/13 cohort.
How do you think the increase in tuition fees of up to £9,000 a year will impact on postgraduate applications? PROBE:
o How will the fee increase impact on the number of postgraduate applications? o How will the fee increase impact on the quality of postgraduate applications? o How will the fee increase impact on the demographic profile of postgraduate
applicants? Who will be less likely to apply to study at postgraduate level? Why?
o Will any groups be more likely to apply? Who? Why? o How do you think the fee change will impact on when people come to apply to
postgraduate study? o How do you think the fee change will impact on the types of postgraduate
qualifications candidates apply for? o How do you think the fee change will impact on the subjects candidates apply
to?
How will this most recent change to the fee regime impact on postgraduate applications compared to that seen as a result of the fees introduced for the 2006/07 academic year? PROBE:
o Will the impact of this fee hike be more significant than that seen in relation to the 06/07 increase? Why / Why not? IF YES: In what ways?
o Will the impact of the new fee regime impact more quickly on postgraduate applications than seen previously? Why / why not?
How influential do you consider the most recent fee changes to be in
determining the number and profile of postgraduate applications more generally? Will other factors have more of an effect on postgraduate applications in the coming years? PROBE:
o What other factors might impact on the demand for postgraduate study? o What will be the most influential factor in determining the future postgraduate
landscape?
r

Understanding Postgraduate Demand
7. Repeating the data collection exercise (10 mins)
The purpose of this section is to gauge the amount of work required on the part of the HEIs to be able to participate in this study and whether they would be willing, in principle, to participate in a similar study in the future.
We are extremely grateful for the work you have undertaken to be able to supply us with the information we requested for this study. Could you outline how easy or difficult a process this has been for your institution? PROBE:
o What were the main challenges faced by the HEI in providing the application information?
o Was there any assistance that the research agency or BIS could have provided to facilitate the process further? IF YES: What assistance would have been helpful?
o Would you be willing to speak with our client either over the phone or face-to-face to discuss the workload implications of having participated in this exercise? Please be assured that our client has not had and will not have access to your individual HEI application database at any point throughout the study. The main purpose of the conversation would be to help our client better understand the process involved in supplying the data and to inform the planning of future studies in this area.
8. Wrap-up (5 mins)
The purpose of this section is to allow respondents to reflect on the session, raise any final points that they may wish to contribute and outline the final stages of the research project.
The next stage of the research will involve us combing the application data received from all participating HEIs and compile a report documenting trends and patterns in applications to postgraduate study by key demographics such as age, gender and ethnicity.
The ultimate aim of the data analysis and report is to establish a baseline level of demand for postgraduate study against which future levels can be measured and the impact of rising fees better understood.
We are due to present final findings to BIS in the autumn of this year.
I declare that this survey has been carried out under IFF instructions and within the rules of the MRS Code of Conduct.
Moderator signature: Date:
Finish time: Interview Length Mins

Understanding Postgraduate Demand
Secur

Understanding Postgraduate Demand
© Crown copyright 2013
You may re-use this information (not including logos) free of charge in any format or medium, under the terms of the Open Government Licence. Visit www.nationalarchives.gov.uk/doc/open-government-licence, write to the Information Policy Team, The National Archives, Kew, London TW9 4DU, or email: [email protected].
This publication available from www.gov.uk/bis
Any enquiries regarding this publication should be sent to:
Department for Business, Innovation and Skills 1 Victoria Street London SW1H 0ET Tel: 020 7215 5000 If you require this publication in an alternative format, email [email protected], or call 020 7215 5000. BIS/13/1319