
UK Letter Mail Demand: A Content Based Time Series Analysis Using Overlapping Market Survey...
18
Institut d’Economie Industrielle (IDEI) – Manufacture des Tabacs Aile Jean-Jacques Laffont – 21, allée de Brienne – 31000 TOULOUSE – FRANCE Tél. + 33(0)5 61 12 85 89 – Fax + 33(0)5 61 12 86 37 – www.idei.fr – [email protected] 2010 n° 616 “UK Letter Mail Demand: a Content Based Time Series Analysis using Overlapping Market Survey Statistical Techniques” Catherine CAZALS, Jean-Pierre FLORENS, Leticia VERUETE-McKAY, Frank RODRIGUEZ and Soterios SOTERI
-
Upload
independent -
Category
Documents
-
view
0 -
download
0
Transcript of UK Letter Mail Demand: A Content Based Time Series Analysis Using Overlapping Market Survey...

Institut d’Economie Industrielle (IDEI) – Manufacture des TabacsAile Jean-Jacques Laffont – 21, allée de Brienne – 31000 TOULOUSE – FRANCETél. + 33(0)5 61 12 85 89 – Fax + 33(0)5 61 12 86 37 – www.idei.fr – [email protected]
2010
n° 616
“UK Letter Mail Demand: a Content Based Time Series Analysis using
Overlapping Market Survey Statistical Techniques”
Catherine CAZALS, Jean-Pierre FLORENS, Leticia VERUETE-McKAY,
Frank RODRIGUEZ and Soterios SOTERI

UK letter mail demand: a content based time series analysis using overlapping market survey statistical techniques*
Catherine Cazals1, Jean-Pierre Florens1, Leticia Veruete-McKay2, Frank Rodriguez3 and Soterios Soteri2
University of Toulouse Capitole (Gremaq, TSE and IDEI) 1, Royal Mail Group 2 and Oxera 3
1. INTRODUCTION The postal market in the UK is experiencing a period of prolonged structural change. The key factors driving such change can be viewed to originate from two quite different sources: those related to the regulatory and policy making framework; and advances in technology that influence customer communication channels. This, combined with the deep recession of 2008-09 and slow economic recovery in 2010, has created a high level of uncertainty with respect to both the short and long term demand for letter mail1. Uncertainty is a factor confronted by businesses, consumers and policymakers on a day-to-day basis. Businesses and organisations that have a better understanding of why customers demand their products and what factors underpin that demand are more likely to successfully manage this uncertainty. However, postal operators’ information systems mainly focus on the products they sell, which in the UK primarily relate to speed of delivery and presortation discounts, and tend to contain little information on the types of letter communications customers are purchasing. While letter traffic information based on speed and presortation attributes is essential for many reasons including a range of operational, financial, marketing and regulatory requirements, it is less helpful in providing insights into the reasons for sending letters and for assessing the likelihood that customers will continue to send mail in the future. Previous UK studies have focused on the demand for letters by speed of delivery and presortation levels2. In an environment of continuing and evolving structural change it may be as appropriate also to assess the demand for sending different types of letter communications. Unfortunately, letter traffic data by content type is not readily available in the UK. The absence of letter traffic volumes by content type was overcome by Veruete-McKay et al (2010) (henceforth, VM) by combining Royal Mail total traffic data on addressed inland mail and survey information. That study provided important new insights into the influence of the economic cycle, prices, technology and other factors on the demand for UK letter traffic by content type. In particular, it estimated the price elasticity of addressed direct mail (or advertising) letters to be substantially higher than for other types of letter communications and provided quantitative estimates of the extent to which technology has driven a wedge between the rates of growth of economic activity and letter traffic (referred to by some in the postal industry as the "technology wedge")3.

2
The incomplete and overlapping coverage of the survey data used by VM to derive letter volumes by content type led to the generation of two content traffic data series. In general, the econometric results using these series were broadly similar, but generated some differences. In particular, the magnitude of the estimated price elasticity for direct mail differed markedly when using the two data sets. The two sets of estimated elasticities reported by VM therefore provide a range of values that can be used to inform business and policymaking decisions within the postal industry in the UK. This paper builds on the approach adopted by VM to further our understanding of the demand for letters by content type in the UK and provides two important developments to the literature on the demand for mail. First, the paper shows how maximum likelihood statistical techniques can be used to make more efficient use of information and create a unified framework within which to derive time series content traffic data using incomplete but overlapping survey data. Second, based on this it provides additional insights into the demand for letters in the UK using econometric time series techniques. Section 2 describes the maximum likelihood statistical methodology used to derive a single time series of letter traffic by content type using limited and partial information sets. Section 3 describes the econometrics methodology adopted to estimate the letter traffic content models and reports the results of the econometrics analysis. Section 4 provides a summary and conclusions. 2. DERIVING LETTER TRAFFIC CONTENT TIME SERIES USING INCOMPLETE
SURVEY DATA Letter traffic data by content type for social, commercial (mainly transactional) and direct mail were derived in two stages. In the first stage, information on letter contents was obtained from two Royal Mail surveys by sender and receiver segments. However, as neither of the surveys on their own provided full coverage of addressed inland letter traffic volumes for the whole time series, a maximum likelihood statistical technique was used to derive content share estimates for each of the three content types by using partial and overlapping information from the two surveys. The second stage then used the content share estimates from stage one and Royal Mail total addressed inland letter traffic data to generate time series data for each of the three content types. This section contains information on the two surveys sources, the maximum likelihood estimation methodology adopted to estimate content shares and the resulting letter content time series data. 2.1 Letter Content Survey Data
Information on letter traffic contents was obtained from two Royal Mail surveys, the Mail Characteristics Survey (MCS) and the Consumer Panel Survey (CPS). The MCS contained information on the content of letters delivered by Royal Mail on an end-to-end (E2E) basis (that is, collected, sorted and delivered by Royal Mail) for UK

3
financial years 1980/81 to 2007/08 and the CPS on mail sent and received by households from 1997/98 onwards4. Neither of the two surveys provided a fully comprehensive survey of total letter traffic delivered by Royal Mail. For example, the MCS survey excluded downstream access traffic handled by competitors upstream (that is, mail collected and sorted by competitors prior to handing it back to Royal Mail for delivery) which developed from 2004/05, while the CPS covered all types of Royal Mail delivered volumes except business-to-business traffic. Time series estimates for letter traffic volumes by content type for social, commercial (mainly transactional) and direct mail were derived from 1980/81 to 2001/02 using information contained in the MCS. For the period 2002/03 to 2007/08 information on each content type for up to four sender-receiver segments was obtained from the two surveys to estimate letter traffic by content shares for Royal Mail E2E traffic and access volumes. Table 1 contains a summary of the coverage of the survey information and data on total traffic that were used to inform the maximum likelihood estimates for letter traffic content shares. Note that both surveys contained some information on E2E letter content sender-receiver segments, that is person to person (P2P), person to business (P2B), business to person (B2P) and business to business (B2B), but only the CPS contained information on access traffic.
Table 1. Data used to estimate letter traffic content shares
Mail Characteristics Survey (MCS) 1 Consumer Panel Survey (CPS) 1,4 End-to-end (E2E) mail End-to-end (E2E) mail Sender-to-receiver segments Sender-to-receiver segments Contents P2P P2B B2P B2B P2P P2B B2P 5 B2B Social ✓ ✓ ✓ ✓ ✓ ✓ - -
Direct mail2 - - ✓ ✓ - - ✓ -
Commercial ✓ ✓ ✓ ✓ ✓ ✓ ✓ -
Access mail3 Access mail Contents P2P P2B B2P B2B P2P P2B B2P B2B Social - - - - - - - - Direct mail - - - - - - ✓ -
Commercial - - - - - - ✓ -
Data on total traffic6 Total E2E ✓ Total access ✓
Note: (1) ✓ indicates survey provided information to maximum likelihood letter content share estimates.
- indicates that no survey information was provided to inform maximum likelihood content share estimates. (2) Sample responses from both surveys suggested a very small quantity of direct mail was sent by private individuals. This
was constrained to equal zero. (3) The MCS survey does not cover access mail (4) The CPS did not cover B2B mail (5) Prior to 2006/07 the CPS survey did not adequately distinguish between B2P social and commercial letters. Information
from the MCS suggested that social B2P mail volumes were very small and therefore this segment of CPS traffic was re-allocated to the commercial B2P segment.
(6) Refers to Royal Mail addressed inland letter traffic mail.
The methodology used by VM to derive letter content traffic data was to estimate two traffic series for each of the three content groups. In particular, VM used each of the two surveys in turn as the primary source of information and then used information from the other survey to complete the data set5. This paper follows a similar approach to VM initially, in that it derives letter content traffic time series

4
data by combining survey data and Royal Mail traffic volume data. However, a key development of this paper is that it adopts a maximum likelihood approach to estimate a single set of letter content volume shares using incomplete and overlapping survey data from different sources. 2.2. Deriving Letter Content Share Estimates Using Incomplete and Overlapping Survey Data This section describes the methodology used to estimate letter traffic content shares for the six year period 2002/03 to 2007/08 using the two survey sources outlined in section 2.1 that provide partial and overlapping information on the population of letter traffic6. In the first instance, it describes the methodology using a standard single survey case with three characteristics (letter content types) and generalises this to the case with up to k characteristics (letter content types disaggregated further by sender-receiver segments). It then proceeds to explain how the standard single survey case can be extended to cover the case where information is available from two partial samples. Finally, this section summarises how this methodology was applied to estimate letter traffic content shares for UK addressed inland letter traffic. 2.2.1 The standard case using a single sample In the standard case it is assumed that we obtain a single sample in which we observe letter traffic by content type characteristics. For example, consider three possible content types denoted by A, B and C, for the letter traffic population where the actual proportions of these content types in the letter traffic population are denoted by Aα , Bα , Cα and are the parameters to be estimated. The sum of the three population proportions must sum to one, that is, 1A B Cα α α+ + = . This identity imposes an adding up restriction which means that only two parameters can be independently estimated subject to the restriction holding. For example, re-arranging the adding-up constraint yields the relationship
1 ( )C A Bα α α= − + and therefore once estimates for Aα , and Bα are derived subject to the adding up constraint, Cα is also identified. To estimate the parameters, Aα , Bα , and Cα it is assumed that a sample of n letters is observed and each has one of the three content types A, B, C, such that nA+nB+nC =n and nk are the observed number of letter traffic items of random variables Nk, k=A, B, C. The joint distribution of (NA, NB, NC) is a multinomial distribution, where the probability density function for the multinomial distribution (see Mood et al, 1974) is given by:
,!( , )
! ! !CA B nn n
A B C A B CA B C
np n n nn n n
α α α= (1)
and the log-likelihood function can be expressed as:

5
(1 )A A B B C A Bl n Ln n Ln n Lnα α α α= + + − − (2)
For simplicity, the constant term ! ( ! ! !)A B CLn n Ln n Ln n Ln n− + + is omitted since it does not include any of the parameters to be estimated in the log-likelihood maximization. The terms kα , k=A, B, C, in the log-likelihood function (2) represent the letter traffic contributions to the likelihood, that is the probability that a letter is of content type k. The corresponding maximum likelihood estimates of the proportions are:
ˆ ˆ ˆ CA BA B C
nn nn n n
α α α= = = (3)
where the estimated proportions are simply equal to the number of observed letter traffic items of each content type in the sample divided by the total sample size. In the general case where we deal with a set of k letter traffic content types differentiated by sender-receiver segments denoted by K={1,2,…,k}, where k has an integer value, the log-likelihood function (2) can be expressed as:
i
k
1ii Lnnl α∑=
= (2)’
where ni represents the number of items of traffic in the observed sample with letter traffic content types i, and iα is the unknown actual proportion of letter traffic volume with content types i in the whole population, for i=1, …, k. Obviously, in this
case again, the adding up restriction holds (that is, 1i
k
1i=∑
=α ) and one parameter is
linearly dependent on the others and the maximum likelihood estimates for the proportions with content types i are:
k,...,1i,nni
i ==∧
α (3)’
2.2.2 The case of two partial and overlapping samples Assume that we have two different samples corresponding to two survey data sets. The first survey, with size n, is limited only to the two categories A and B. So we have information about the number of items of traffic in the sample with letter traffic content types A, denoted nA, and the number of items of traffic in the sample with content type B, denoted nB, with A Bn n n+ = . The second survey, with size m, is limited to the categories B and C. So we have information about the number of items of traffic in the sample with content type B, denoted mB, and the number of items in the sample with content type C, denoted mC, with B Cm m m+ = . That is, we have a case where each survey partially covers the letter traffic population by content type (A, B and C) and the survey information overlap one another (that is, both contain information on content type B). The objective is to estimate the actual proportions of the three letter traffic content types in the whole population from the information contained in the two incomplete
6
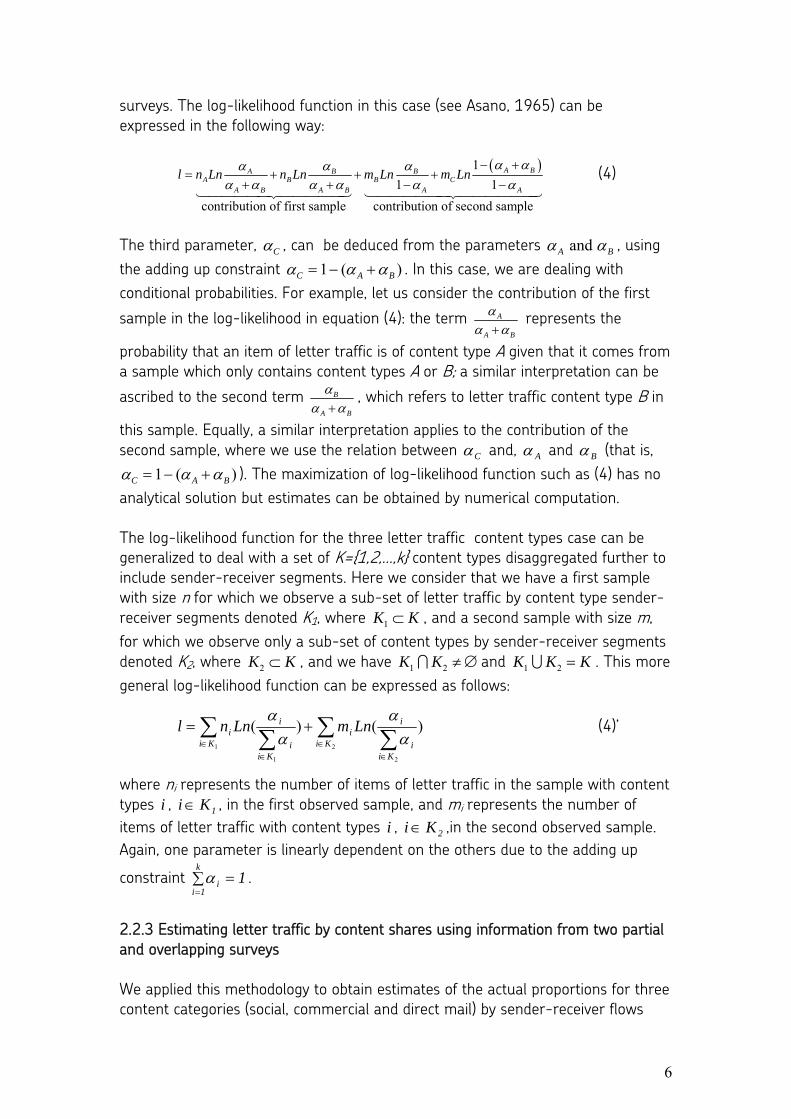
surveys. The log-likelihood function in this case (see Asano, 1965) can be expressed in the following way:
( )11 1
contribution of first sample contribution of second sample
A BA B BA B B C
A B A B A A
l n Ln n Ln m Ln m Lnα αα α α
α α α α α α− +
= + + ++ + − −
1444442444443 144444424444443
(4)
The third parameter, Cα , can be deduced from the parameters and A Bα α , using the adding up constraint 1 ( )C A Bα α α= − + . In this case, we are dealing with conditional probabilities. For example, let us consider the contribution of the first
sample in the log-likelihood in equation (4): the term A
A B
αα α+
represents the
probability that an item of letter traffic is of content type A given that it comes from a sample which only contains content types A or B; a similar interpretation can be
ascribed to the second term B
A B
αα α+
, which refers to letter traffic content type B in
this sample. Equally, a similar interpretation applies to the contribution of the second sample, where we use the relation between Cα and, Aα and Bα (that is,
1 ( )C A Bα α α= − + ). The maximization of log-likelihood function such as (4) has no analytical solution but estimates can be obtained by numerical computation. The log-likelihood function for the three letter traffic content types case can be generalized to deal with a set of K={1,2,…,k} content types disaggregated further to include sender-receiver segments. Here we consider that we have a first sample with size n for which we observe a sub-set of letter traffic by content type sender-receiver segments denoted K1, where 1K K⊂ , and a second sample with size m, for which we observe only a sub-set of content types by sender-receiver segments denoted K2, where 2K K⊂ , and we have 1 2K K ≠ ∅I and 1 2K K K=U . This more general log-likelihood function can be expressed as follows:
)()(
2
2
1
1 ∑∑∑∑∈
∈∈
∈
+=
Kii
i
Kii
Kii
i
Kii LnmLnnl
αα
αα
(4)’
where ni represents the number of items of letter traffic in the sample with content types i , 1Ki∈ , in the first observed sample, and mi represents the number of items of letter traffic with content types i , 2Ki∈ ,in the second observed sample. Again, one parameter is linearly dependent on the others due to the adding up
constraint 1k
1ii =∑
=α .
2.2.3 Estimating letter traffic by content shares using information from two partial and overlapping surveys We applied this methodology to obtain estimates of the actual proportions for three content categories (social, commercial and direct mail) by sender-receiver flows

7
(person to person (P2P), person to business (P2B), business to person (B2P) and business to business (B2B)) and the proportion of access mail for total addressed inland letter traffic volumes delivered by Royal Mail. The direct mail sender-receiver letter traffic flows in the survey originating from persons were very small in number and their respective proportions in the maximum likelihood estimation were assumed to be equal to zero. Therefore, in total the two surveys provided partial information on up to 12 mail categories that covered the population of total addressed inland letter traffic excluding B2B access mail. More precisely and by reference to Table 1, the MCS data set provided information on 10 sender-receiver mail categories but no information on access mail7, while the CPS provided information on 8 mail categories (2 access traffic segments and 6 E2E traffic sender-receiver segments)8. In addition, since information on the actual proportion of total access volumes was observed this was directly incorporated into the maximum likelihood estimation function to inform the estimated content shares for access mail. The maximum likelihood methodology was applied to information on the sender-receiver segments from the two surveys for each of the six years 2002/2003 to 2007/2008 to estimate proportions of mail for 12 mail categories. These are reported in Table 1 and are given by each sender-receiver category where there was information from at least one of the surveys. With no overlapping information on access mail volumes from B2B from the two surveys, it was necessary to use data on access mail volumes from B2P. It was assumed that the ratio of direct mail access mail volumes by B2P and commercial mail business access volumes by B2P was the same as the corresponding ratio for B2B. This allowed the shares of access of direct mail and commercial mail volumes send by B2B to be derived. 2.3 Addressed Inland Letter Traffic Trends by Content Type Once traffic share estimates for the period 2002/03 to 2007/08 were obtained using the maximum likelihood estimation techniques described above, a continuous time series was derived by linking them to those estimated for the period 1980/81 to 2001/02 using MCS information9. Estimates of letter volumes by content type
( iV^
) were then derived from Royal Mail total addressed inland letter traffic volume index data (V) using expression (5)
VsV iii
∧∧
= α (5)
where ∧
iα denotes the estimated share of total addressed inland letter traffic being of i content type; i refers to social, commercial and direct mail; and si denotes a scalar to generate index numbers equal to 100 in 2005/06. Note that by definition
∑ ==
=
∧∧3i
1iii VVα and ∑ =
=
=
∧3i
1ii 1α .
Figure 1 contains a plot of the annual rates of growth for the estimated addressed inland letter traffic data by content type generated by expression (5) and also the

8
corresponding series reported in VM. Two points to note about the different estimates for each content type contained in figure 1 from 2002/03 onwards are: firstly, the estimates informed by the maximum likelihood methodology that used overlapping information from both surveys seem to be less volatile than those derived by VM; and secondly, the maximum likelihood estimates are not equal to the average of the two series derived by VM. In fact, as we assumed that information from the two surveys was equally reliable, the maximum likelihood content share estimates for each year broadly reflect the relative size of the number of items of letter traffic covered by each survey.
Figure 1: Estimated Letter Volume Growth Rates by Content Type
Social mail
-16
-12
-8
-4
0
4
8
12
16
81/8
2
83/8
4
85/8
6
87/8
8
89/9
0
91/9
2
93/9
4
95/9
6
97/9
8
99/0
0
01/0
2
03/0
4
05/0
6
07/0
8
% on financial year per working days
Direct mail
-16
-12
-8
-4
0
4
8
12
16
81/8
2
83/8
4
85/8
6
87/8
8
89/9
0
91/9
2
93/9
4
95/9
6
97/9
8
99/0
0
01/0
2
03/0
4
05/0
6
07/0
8
% on financial year per working days
Commercial (mainly transactional) mail
-16
-12
-8
-4
0
4
8
12
16
81/8
2
83/8
4
85/8
6
87/8
8
89/9
0
91/9
2
93/9
4
95/9
6
97/9
8
99/0
0
01/0
2
03/0
4
05/0
6
07/0
8
% on financial year per working
Total mail
-16
-12
-8
-4
0
4
8
12
16
81/8
2
83/8
4
85/8
6
87/8
8
89/9
0
91/9
2
93/9
4
95/9
6
97/9
8
99/0
0
01/0
2
03/0
4
05/0
6
07/0
8
% on financial year per working days
VM estimated content growth rate using data method 1 - - - - VM estimated content growth rate using data method 2 Maximum likelihood estimated growth rates using overlapping market survey data
Note: Data refers to year-on-year growth in UK Financial years (FY). For example, UK FY 2007/08 refers to the data period April 2007 to March 2008. The two time series data sets derived by VM are denoted in the paper as those derived using “Method 1” and “Method 2”. Method 1 was based primarily on information available from the MCS and then used the CPS to complete the data set where data were not available from the MCS (for example, on access). In contrast, Method 2 primarily focused on information available from the CPS and then used information available from the MCS to complete the data set where not available from the CPS (for example, business-to-business segments).
In terms of directional trends, figure 1 shows the annual rate of growth of total UK letter traffic per working day to have been negative between 2005/06 and 2007/08. The three estimated traffic series for commercial (mainly transactional) mail began to decline a year later than total traffic, while social letter communications were estimated to have started two, or possibly three years earlier. Note also that direct mail volumes are estimated to have declined in at least

9
three out of the four years between 2004/05 to 2007/08, despite the UK economy recording robust rates of growth over this period. The three quite different estimated rates of growth for direct mail in 2006/07 reported in figure 1 suggest there is some uncertainty associated with data for individual years for letter traffic by content type. However, greater confidence can be attributed to the broad directional movements in the estimates. Bearing this in mind, and concentrating on the annual growth rates of the times series using the maximum likelihood estimates reported in figure 1 which are less volatile than those contained in VM, a number of interesting trends emerge. First, it is estimated that social letter communications increased, on average, by around 2% per annum over the two decades covering 1981/82 to 2000/01, but that between 2001/02 and 2007/08 social mail declined, on average, by almost 4% per annum. Second, direct mail letter communications have historically exhibited high rates of growth and fluctuated with economic activity. Third, commercial (mainly transactional) letter traffic volumes have, similar to direct mail, historically exhibited positive rates of growth and fluctuated in line with economic conditions. However, the demand for commercial letter communications has fluctuated less than that for direct mail. 3. AN ECONOMETRIC ANALYSIS OF UK LETTER TRAFFIC DEMAND BY CONTENT
TYPE 3.1 Estimation Methodology An econometric analysis of the demand for addressed UK inland letter traffic by content type was undertaken using a similar estimation methodology to Veruete-McKay et al (2010) (denoted as VM in the remainder of this section). In summary, the modelling comprised three relationships: one for social mail letter traffic; a second for commercial (mainly transactional) letters; and a third for direct mail letter communications10. The demand relationships were estimated using UK financial year data and single equation static ordinary least squares (OLS) time series models of the following form11:
itit'iit
'iit xDq η++= ΠA (6)
where lower case letters for Qit and Xit denote logarithms of variables in time period t. The variable Qi denotes the volume of traffic per household per working day for content type i. The variable Xit denotes a vector of explanatory variables corresponding to each traffic stream i. The vector of explanatory variables Xit included economic activity, real letter tariff price indices12 for content type i, the quality of letter service delivery, and the proportion of internet advertising expenditure relative to total advertising expenditure13. Also, initially included in Xt was the real price of traditional non-mail advertising media substitutes and a number of variables linked to technology trends, such as the proportion of households with access to the internet and broadband and real telecommunication prices. Dit is a vector of deterministic variables which includes a constant, dummy

10
variables and a number of time trends. Πi is a vector of long-run coefficients; Ai is a vector of estimated coefficients; and itη is a random disturbance term. 3.2 Estimated Models of Letter Traffic by Content Type The estimated equations for addressed inland letter traffic by content types, after eliminating insignificant variables, are reported in table 2. The estimated parameters have reasonably high t-statistics and the reported diagnostic tests suggest that the model is statistically sound14. The estimated elasticities for the three content types are broadly similar to those estimated by VM. However, there are also a number of differences, particularly with respect to the estimated impact of prices and internet advertising on direct mail and the estimated time trend impacts across all three content types. The estimated long run elasticities and time trends for total addressed inland letter traffic volumes were calculated by weighting the long-run parameters for each of the three content types by their respective share of total traffic. The estimated elasticities for economic activity, quality of service and price of telecommunication reported in table 2 are very similar to those contained in VM. In particular, commercial (mainly transactional) letter traffic is estimated to have a near unit elasticity with respect to economic activity, while direct mail is estimated to be highly pro-cyclical and posses an elasticity of about two. In contrast, social letter traffic is estimated to be independent of economic activity. Furthermore, the estimated elasticities for total letter demand with respect to quality of service and the price of telecommunication are almost identical to those estimated by VM (0.3 and 0.1 respectively). Note in the case of the estimated commercial price and telecommunication price elasticities that the hypothesis that they are equal in magnitude and opposite in sign was tested and could not be statistically rejected. The adoption of this hypothesis in the model leads to considerably higher t-statistics than those estimated for each of the variables individually (as a comparison of the estimated parameters in the restricted and unrestricted columns for commercial traffic show). An important point to note with respect to the estimated price elasticities for letter traffic by content type is that, again as in VM, they differ substantially by communication type. In particular, the econometric models indicated that commercial (mainly transactional) letter communications has the lowest price elasticity (of around -0.1 to -0.2) and social letter mail has a higher price elasticity of demand than transactional mail but it is still quite inelastic (around -0.5). The direct mail estimated price elasticity reported in table 2 of a little under unity (-0.9) lies towards the middle of the range of the two estimates contained in VM (that is, -0.7 and -1.4)15. This finding is as expected, since the maximum likelihood methodology used to derive the content traffic data combined information from the two survey sources used by VM. The high estimated price elasticity of direct mail

11
relative to other types of letter communications is consistent with the findings of Thress (2006) and Santos and Lagao (2001).
In order to examine the extent to which the results reported in table 2 depend on the importance placed on the two surveys used to derive time series for letter traffic by content type, two sensitivity tests were undertaken. Although both surveys are considered to be of a high standard, and purely to test the possible impact if one survey were to be considered superior to the other, in the first sensitivity, it was assumed that the information provided by the CPS was incorporated as if it was twice as reliable as that provided by the MCS and the second sensitivity assumed the opposite16. The estimated direct mail price elasticities resulting from these two sensitivities were -0.9 and -1.1 respectively. This suggests that, with both survey sets considered to be a high standard, a reasonable estimate of the price elasticity for total direct mail over the estimation period is around -1.
Table 2: Addressed Inland Letter Content Traffic Per Household Model: Estimated Long Run Elasticities and Time Trends1
Social Commercial mail4 Direct mail Total Traffic5
Unrestricted Restricted Unrestricted Restricted Economic activity2 ns 0.98 (7.7) 1.02 (25.7) 1.98 (4.9) 1.10 1.14 Own price tariff index3 -0.52 (-4.3) -0.17 (-1.2) -0.12 (-3.9) -0.92 (-2.2) -0.35 -0.31
Quality of service 0.44 (5.4) 0.34 (5.5) 0.33 (6.4) ns 0.28 0.27
Price of telecommunications index3
na 0.11 (2.1) 0.12 (-3.9) ns 0.08 0.09
Proportion of internet advertising expenditure
na na na -2.33 (-6.8) -0.47 -0.47
Pre 2003 ns
Pre 2002 ns
Pre 2002 ns
Pre 1997 2.0% (2.3)
Pre 1997 0.4%
Pre 1997 0.4%
Time trend estimates
Post 2003 -4.1% (-9.3)
Post 2002 -2.6% (-8.6)
Post 2002 -2.6% (-9.0)
Post 1997 -3.8% (-4.2)
Post 2003 -3.0%
Post 2003 -3.0%
Net impact of “unexplained” time trends per annum at end of estimation period
-4.1% -2.6% -2.6% -1.8% -2.6% -2.6%
Rsq adjusted 0.880 0.995 0.995 0.995 Reg. SE 0.028 0.014 0.014 0.022 DW 1.76 1.53 1.49 2.29 Diagnostic tests (p-values) Serial Correlation6 0.57 0.38 0.35 0.44 Heteroscedasticity7 0.39 0.28 0.25 0.82 Normality8 0.41 0.91 0.88 0.07 Reset9 0.11 0.98 0.79 0.96 Chow test10 0.26 0.11 0.10 0.10
Note: (1) T-statistics reported in brackets. (2) Refers to Gross Domestic Product (GDP). (3) Deflated by the all items retail prices index. (4) The hypothesis that the own-price elasticity and the telecommunication price elasticities were equal and opposite in sign in the commercial equation was tested and could not be rejected. The commercial estimates imposing this hypothesis are reported in the “restricted” column of results and the freely estimated parameters not imposing this hypothesis is reported in the “unrestricted” column. (5) The total traffic estimated long run elasticities and parameters were calculated by weighting the estimated coefficients of each traffic content stream by their respective volume share in 2007/08. (6) This is a test for 1st order autocorrelation. (7) Refers to White’s test for heteroscedasticity. (8) Refers to the Jarque-Bera test for normality in the residuals. (9) Refers to Ramsey’s RESET test of functional form misspecification. (10) Refers to Chow’s predictive failure test from 2005/06 onwards. Note that for the direct mail equation used to undertake the Chow test the dummy variable associated with 2006/07 was not considered in the regression.

12
The estimated time trend impacts reported in table 2 suggest that there was a decline in the trend rate of social and commercial traffic from around 2003/04 and 2002/03 respectively and that this slowdown was of the scale of about 4% and 2½% per annum respectively17. The timing coincides with the sharp increase in the number of firms and individuals with broadband connections in the UK. It is likely that this combined with advances in internet enabled technology has resulted in continuing substitution of social and commercial letter traffic. The impact of esubstitution on direct mail resulting from the emergence of the internet and, in particular, “paid-for-search” advertising can be estimated using the coefficient of the proportion of internet advertising expenditure reported in table 2. For example, multiplying the average change in the proportion of internet advertising expenditure over the period 2005/06 to 2007/08 (4 percentage points per annum) by the long-run coefficient reported in table 2 suggests that internet related esubstitution could have reduced direct mail traffic volumes by an average of around 9% per annum during this period18. However, independent of the influence of internet advertising, it is likely that the high rates of direct mail growth experienced in the UK in the 1980s and 1990s would have eventually slowed down in order to stabilise its share of advertising spend within overall marketing budgets. The decline in the post 1997 direct mail time trend term effects reported in table 2 is consistent with this hypothesis. 3.3 Using the Letter Traffic by Content Model to Assess Prospects for Mail Trends The estimated parameters reported in table 2 can be used as a starting point to assess the prospects for traffic growth in the UK in the near future if esubstitution effects are projected to be broadly in line with those in the recent past. As a first step in such an exercise it is necessary to make assumptions regarding the future values for all of the explanatory variables in the model including those for esubstitution. As an illustrative example, assume GDP growth in the UK were to be equal to 2% per annum; household growth were to be 1% per annum; the share of internet advertising expenditure were to continue to increase by 4 percentage points per annum; real telecommunication prices were to decline by around 5% per annum; real letter prices and QoS were to be unchanged; and time trend terms were to continue in line with the estimates in table 2. These assumptions together with the estimated parameters reported in table 2 would imply that social letter communications would decline by around 3% per annum; commercial (mainly transactional) letter traffic communications would be broadly flat; and direct mail traffic would decline by around 6% per annum. In total, this would suggest that if the impact of esubstitution as well as the other coefficients in the model were to remain broadly stable at around 2007/08 levels, then letter traffic in the UK would decline by around 2% per annum in the near to medium term for the assumptions in this illustrative example. However, the increase in the share of internet advertising expenditure will decrease at some point in the future. If this initially were to increase by, say, between only 1% and 2% per annum, while the assumptions for all the other factors remained as above, then

13
direct mail demand would be expected to recover from a heavily negative growth rate. In this illustrative example, this would reduce the rate of decline in the demand for letter traffic overall in the UK, and possibly even stabilise it. Unfortunately, the impact of esubstitution in the medium to long term future on the demand for letter traffic is uncertain and clearly may change from the effects experienced over the recent past. As discussed by Nikali (2008), esubstitution is not a single process but reflects the effects of many technologies each with its own s-shaped diffusion curve. As some technologies mature others, perhaps as yet unknown, may impact on letter traffic in the future such that "the curve for substitution is reminiscent of a large corrugated s-curve" (Nikali, 2008, p91). For example, pressures to reduce business costs and concerns with the environment are exerting downward pressure on the demand for transactional letters (which is the largest category of letter mail in the UK and many other countries) and perhaps also on the extent to which direct mail will recover as the increase in internet advertising expenditure slows down. If, the decline in transactional letter mail over the future were to take place at a faster rate than in the past, then the esubstitution impacts contained in the model reported in table 2 would underestimate the extent to which transactional mail letter communication will be substituted by electronic and digital forms of communication. It is important that projections of mail volumes attempt to reflect these uncertainties regarding the quantitative impact of esubstitution in future years through risk and sensitivity analysis as well as adjustments to projections for factors that, as yet, have not entered time series of past trends. It is likely that the factors affecting future demand for mail may be better understood through using a model of letter demand that is based on letter content types than models that focus on the demand for mail differentiated by speed of delivery or presortation levels. Therefore, while there may be some uncertainty associated with individual year estimates for letter traffic volumes by content type, model based projections that are augmented with off-model additional net trend adjustments (ANTAs) based on an analysis of demand by content type may provide a more informed framework for forecasting mail volume trends into the future. This approach is consistent with that developed in Feve et al (2010) where it is recommended that information priors (such as ANTAs) should be used to augment econometric models when forecasting the demand for letter mail in a changing and evolving market environment.

14
4. SUMMARY AND CONCLUSIONS Structural changes in the communications market are having different impacts on different types of letter communications. However, many postal operators’ information systems, including those in the UK, tend to focus on the types of products sold, which mainly reflect speed of delivery and presortation discounts, and not the type of communication purchased by customers. In order to better understand the factors influencing the total demand for letters and improve forecasting in an evolving market environment, it is important to understand the key drivers underpinning the demand for different types of letter communications. However, there is a lack of good quality data on letter traffic by content type in most countries. This paper attempts to bridge the information gap in the UK by developing the framework set out in Veruete-McKay et al (2010) (denoted as VM) and combining actual total traffic data with survey information to derive estimates for letter traffic volumes by content type. Estimates for three letter content types (social, commercial (mainly transactional) and direct mail) were derived using two sources of incomplete but overlapping survey data. In order to extend the analysis in VM, this paper has used maximum likelihood estimation techniques to combine information from different survey sources to obtain a single data set for UK delivered traffic segmented into the three content types. This data set was then used to estimate econometric time series models of the demand for letter traffic by content type. The results were consistent with those in VM and the econometric estimates in this paper can be viewed as a set of best central estimates that lie within a range of potential estimates. The elasticities contained in section 3 of the paper provide insights into the relative importance of the key drivers for different types of letter communications in the UK. In particular, it is estimated that the elasticity of demand for commercial (mainly transactional) letter traffic with respect to economic activity is , approximately, unity and that direct mail is twice as sensitive to the economic cycle as commercial letter traffic. In contrast social letter traffic was found to be invariant to the economic cycle. Direct mail was estimated to be the most price sensitive segment of letter traffic, with an estimated price elasticity of around -1. Both commercial and social mail price elasticities were found to be considerably less sensitive to price changes. Esubstitution impacts were estimated to affect all three content types. For example, over the three years between 2005/06 to 2007/08 the econometric models estimate that esubstitution was reducing the demand for: direct mail by at least 9% per annum19; social letter mail by around 4% per annum; and commercial (mainly transactional) letter traffic by around 2½% per annum. The econometric results reported in this paper can be viewed as a starting point in considering future prospects for letter traffic volumes in the UK. While the impact of economic factors (including prices) appears to be comparatively stable, the significant impacts of esubstitution on mail volumes remain uncertain. In such an environment, it is important that projections of mail volumes attempt to reflect these uncertainties through risk and sensitivity analysis as well as adjustments to

15
projections for factors that are, as yet, not reflected in time series of past trends. Over time, as new outcome data on the evolving mail market environment becomes available off-model sensitivity analysis of this kind can be updated and risks re-assessed. Such an approach is set out formally in Feve et al (2010) and the model set out in the current paper in terms of traffic by content type can be viewed as being fully consistent with that wider framework. NOTES * The analysis contained in this paper reflects the views of the authors and not necessarily those of Royal Mail Group. 1 Except where otherwise stated, the analysis in this paper refers solely to addressed inland mail volumes and does not consider developments in unaddressed or international mail volumes. 2 See Nankervis et al (2002) and Soteri et al (2009). 3 See Hooper et al (2008 p 43-44). 4 See appendix for further details on the two surveys. Note that the UK financial year runs from April to March of the following year. 5 Veruete-McKay et al (2010) used information from the MCS and CPS to derive two alternative estimates for content traffic data for social, commercial (mainly transactional) and direct mail traffic. They refer to the two different traffic estimates as those obtained using Method 1 and Method 2. Method 1 was based primarily on information available from the MCS and then used the CPS to complete the data set where data were not available from the MCS (for example, on access). In contrast, Method 2 primarily focused on information available from the CPS and then used information available from the MCS to complete the data set where data were not available from the CPS (for example, business-to-business segments). 6 Royal Mail data on addressed inland letter traffic covers both Royal Mail traffic that is delivered end-to-end and access traffic that is handled by competitors who give this mail back to Royal Mail to deliver. There is a small amount of addressed inland letter traffic that is not included in the surveys but it is deemed to be too small to materially affect our results. 7 The 10 sender-receiver segments that the MCS provides information on (as shown in Table 1) are: 4 for social mail (P2P, P2B, B2P, B2B); 2 for direct mail (B2P, B2B); 4 for commercial mail (P2P, P2B, B2C, B2B). 8 The 8 categories of mail that the CPS provides information on (as shown in Table 1) are: 2 for social mail sent by persons (P2P, P2B); 1 for direct mail ((B2P); 3 for commercial mail (P2P, P2B, B2P); and 2 for access mail (direct mail B2P and commercial B2P). 9 In particular, changes in MCS content shares were linked to the 2002/03 maximum likelihood estimated content shares to derive time series data going back to 1980/81. 10 The model was estimated using EVIEWS5. 11 More general specifications including lags and leads were tested using dynamic OLS estimation methods suggested by Saikkonen (1991) and popularised by Stock and Watson (1993). However, specifications including no leads and no lags were preferred on the basis of statistical criteria. 12 Where real prices in the paper refer to nominal prices deflated by the all items retail prices index. 13 The data on internet advertising expenditure are consistent with the data sources and definitions contained in WARC(2008). 14 All the diagnostic tests are passed at the 5% level of significance. However, it should be noted that the Heteroskedasticity and Ramsey Reset tests are strictly not valid when I(1) variables (such as economic activity) are included in regression models of this type (see Gerrard and Godfrey, 1998). In addition to the Chow forecast test for parameter stability, CUSUMQ and CUSUMQ Squared tests were also undertaken and they did not indicate any clear evidence of parameter instability. 15 The estimated direct mail price elasticity in Veruete-McKay et al (2010) using Method 1 (which primarily used information from the MCS) was -1.4 and that using Method 2 (which primarily used information from the CPS) was -0.7. 16 The sensitivities for estimating content traffic data followed the same methodology as that outlined in section 2 except that the sample sizes used to combine the two surveys were amended to reflect the desired weights. 17 A number of time trends were tested around this time period. The adoption of the 2002/03 and 2003/04 time trends were informed by the Akaike information criterion (AIC) and the Schwarz criterion (SC). 18 This estimate is consistent with results reported in Soteri et al (2009). 19 The esubstitution impact of 9% per annum is based only on the impact of the share of internet advertising variable. If the time trend variable in the direct mail equation is also considered to be a proxy for esubstitution this would add a further negative impact of around 2% per annum. However, if the direct mail time trend impact to some extent reflects factors relating to the slow down in direct mail growth from 1997 onwards due to market saturation factors, it can be argued that this should not be fully considered to be an esubstitution impact.

16
REFERENCES Asano, C. (1965), ‘On estimating multinomial probabilities by pooling incomplete samples’,
Annals of the Institute of Statistical Mathematics, 17, 1-13 Cazals, C., J.P. Florens, F. Rodriguez and S. Soteri (2008), ‘Forecast uncertainty in dynamic
models: an application to the demand for mail’, in M.A. Crew and P.R. Kleindorfer (eds), Competition and Regulation in the Postal and Delivery Sector, Edward Elgar publishers, 63-73.
Fève, F., J.P. Florens, F. Rodriguez and S. Soteri (2010), “Forecasting mail volumes in an evolving market environment”, in M.A. Crew and P.R. Kleindorfer (eds), Heightening Competition in the Postal and Delivery Sector, Edward Elgar.
Gerrard, W.J., and L.G. Godfrey (1998), ‘Diagnostic checks for single-equation error-correction and autoregressive distributed lag models’, The Manchester School, Vol. 66, No.2, pp222-237.
Hooper, R., D. Hutton and I.R. Smith (2008), Modernise or decline: policies to maintain the universal postal service in the United Kingdom.
Mood, A.M., F.A. Graybill and D.C.Boes (1974), Introduction to the Theory of Statistics, McGraw-Hill, New York.
Nankervis, J., S. Richard, S. Soteri and F. Rodriguez (2002), ‘Disaggregated letter traffic demand in the UK’, in M.A. Crew and P.R. Kleindorfer (eds), Postal and Delivery Services, Boston, MA: Kluwer Academic Publishers, pp. 203-18.
Nikali, H (2008), ‘Substitution of letter mail for different sender-receiver segments’, in M.A. Crew and P.R. Kleindorfer (eds), Competition and Regulation in the Postal and Delivery Sector, Edward Elgar publishers, pp. 89-106.
Saikkonen, P. (1991), ‘Asymptotically Efficient Estimation of Cointegration Regressions’ Econometric Theory: 7:1-21.
Santos, R.G., and S.C. Lagao (2001), ‘The demand for direct mail in Portugal’, in M.A. Crew and P.R. Kleindorfer (eds), Future Directions in Postal Reform, MA: Kluwer Academic publishers, pp213-232.
Soteri, S., F. Fève, J.P. Florens and F. Rodriguez (2009). ‘Internet advertising and direct mail: trends and analysis for the UK’, in M.A. Crew and P.R. Kleindorfer (eds), Progress in the Competitive Agenda in the Postal and Delivery Sector, Edward Elgar publishers, pp. 209-222.
Stock, J.H, and M.W. Watson (1993), ‘A Simple Estimator of Cointegrating Vectors in Higher Order Integrated Systems’. Econometrica: 61: 783-820.
Thress, T.E. (2006), ‘Direct Testimony of Thomas E. Thress on behalf of the United States Postal Service’, Postal Rate and Fee Changes Docket No. R2006-1.
Veruete-McKay, L., S. Soteri, J. Nankervis and F. Rodriguez (2010), ‘Letter traffic demand in the UK: an analysis by product and envelope content type’. Presented at the Institut d’Economie Industrielle (IDEI) Sixth Conference on “Regulation, competition and universal service in the postal sector”, Toulouse, March 25-26 2010.
WARC (2008), The Advertising Forecast, volume 32, number 34, January 2008. Published in association with the Advertising Association, Nielsen Media Research, World Advertising Research Center.

17
APPENDIX: ROYAL MAIL SURVEY DATA
Information on the contents of Royal Mail letter traffic is available from two different surveys: the Mail Characteristics Survey (MCS) and the Consumer Panel Survey (CPS).
The MCS is a random unclustered survey of around 0.7 million consumers and businesses. This survey attaches a questionnaire card to randomly selected envelopes and has a response rate of around one in six. Data collection takes place at all mail centres (MC) and distribution centres (DC). This means that end to end (E2E) mail traffic is covered in the MCS, with the exception of products such as Response Mail, Special Delivery and Cleanmail Advance (3% of total E2E mail in 2007/08). However, the MCS excludes information on downstream access volumes. Traffic data by type of contents is available from 1980/81 from the MCS. Also this survey records up to five different detailed content types for a specific envelope and allocated a prioritisation routine to identify the “primary” content. This eliminates double counting of contents within the envelope. The CPS is a weekly survey diary and covers a panel of around 1,000 households with a national representation. This survey is weighted by socioeconomic group, household size and age. The weights are updated every two years. The CPS has the important feature that provides some information on downstream access traffic. However, it does not capture information on business-to-business traffic.
Since neither of the two surveys is fully comprehensive of total letter traffic, information from both was used to derive letter content time series data for addressed inland mail volumes. Traffic data by content types (and disaggregated by flows of senders and receivers) from the MCS and CPS on a financial year basis from 2002/03 to 2007/08 were used to estimate shares of content types of total inland addressed traffic. Due to the longer time span of data available from the MCS its content category definitions were adopted to derive content shares for total UK letter traffic.