Exploratory study of the relationship between tropical forest regeneration stages and SIR-C L and C...
11
ELSEVIER Exploratory Study of the Relationship Tropical Forest Regeneration Stages and SIR-C L and C Data between Corina da C. F. Yanasse,* Sidnei J. s. Sant'Anna, ° Alejandro C. Frery,~ Camilo Daleles Renn6,* Jogo Vianei Soares, and Adrian John Luckman~ In this article, the relationship between secondary forest regrowth stage and SIR-C SAR data is assessed, for an area located near to the Tapaj6s National Forest, south of Pard State, in the Amazon region. These regeneration stages are mapped by making use of a consecutive annual sequence of Landsat TM (Thematic Mapper) images'. Us- ing this map as. a mask over the radar images, the tonal means (expressed in dB) and coefficient of variation (CV) for several second-growth succession stages classes are calculated. It is shown that the discrimination between regeneration stages is difficult when individual "small ar- eas are used, but this discrimination might be possible when L-band means over a "largo area are computed. In particular, the L-HV band seems to carry more informa- tion. The n~aximum difference of means among classes oc- curred in this band and it is of about 5 dB. The CV ap- peared to be less well suited than the mean value for ,regeneration stage discrimination, although some dis- crimination anwng early stages of regeneration may be possible using this measure at L-band. ©Elsevier Sci- ence Inc. 1997. *Instituto Nacional de Pesquisas Espaciais, DPI and DSR, S~io Jos6 dos Campos, Brazil Universidade Federal de Pernambuco, Departamento de In- formitica, Recife, Brazil i British National Space Centre, Remote Sensing Applications Development Unit, Huntingdon, United Kingdom Address correspondence to Corina da Costa Freitas Yanasse, Inst. Nacional de Pesquisas Espaciais, DPI and DSR, Avenida dos Astro- nautas, 1758, 12227-010 Silo ]os6 dos Campos, Brazil. Received 9 February 1996; revised 13 May 1996. REMOTE SENS. ENVIRON. 59:180-190 (1997) ©Elsevier ScienceInc., 1997 655 Avenue of the Americas, New York, NY 10010 INTRODUCTION Many studies have used remote sensing to discriminate between mature forest and nonforest areas to determine the extent of deforestation in tropical regions (Tardin et al., 1980; Alves et al., 1992). More attention is now being payed to the remote sensing of secondary forest re- growth because it may have an important part to play in the region's carbon balance (Luekman et al., 1996). With its all weather capability, microwave sensors guarantee image availability for a region that presents in- tense cloud cover most of the time, as is the ease of most of the Amazon Basin. Another strong motivation for us- ing radar data in the study of second-growth succession is the sensitivity of radar baekscatter to vegetation struc- ture, which is related to standing biomass (Luckman et al., 1996; Le Toan et al., 1992; Beaudoin et al., 1992). The objective of this article is to analyze the nature of the relationship between the second-growth succes- sion stages and SIR-C SAR data (Space Shuttle hnaging Radar, L- and C- bands), over the Tapajds region, in the Amazon Basin. The SIB-C SAR data available in this re- gion were bands L and C, HH and HV polarizations. The analysis is accomplished by mapping the regenera- tion stages using a 10 consecutive annual sequence of Landsat TM data (Sant'Anna et al., 1995), and relating these stages with some measures of radar baekscatter. Among the measures that could be derived from SAR images (e.g., Luckman et al., 1995), two very simple ones are used in this paper: the tonal mean and the coef- ficient of variation (CV). One reason for using both of these measurements is that in Yanasse et al. (1993) it was observed that the tonal mean for SAREX (South Ameri- can Radar EXperiment) data was not sufficient to sepa- 0034-4257/97/$17.00 PII S0034-4257(96)00149-6
Transcript of Exploratory study of the relationship between tropical forest regeneration stages and SIR-C L and C...
ELSEVIER
Exploratory Study of the Relationship Tropical Forest Regeneration Stages and SIR-C L and C Data
between
Corina da C. F. Yanasse,* Sidnei J. s. Sant'Anna, ° Alejandro C. Frery,~ Camilo Daleles Renn6,* Jogo Vianei Soares, and Adrian John Luckman~
I n this article, the relationship between secondary forest regrowth stage and SIR-C SAR data is assessed, for an area located near to the Tapaj6s National Forest, south of Pard State, in the Amazon region. These regeneration stages are mapped by making use of a consecutive annual sequence of Landsat TM (Thematic Mapper) images'. Us- ing this map as. a mask over the radar images, the tonal means (expressed in dB) and coefficient of variation (CV) for several second-growth succession stages classes are calculated. It is shown that the discrimination between regeneration stages is difficult when individual "small ar- eas are used, but this discrimination might be possible when L-band means over a "largo area are computed. In particular, the L-HV band seems to carry more informa- tion. The n~aximum difference of means among classes oc- curred in this band and it is of about 5 dB. The CV ap- peared to be less well suited than the mean value for ,regeneration stage discrimination, although some dis- crimination anwng early stages of regeneration may be possible using this measure at L-band. ©Elsevier Sci- ence Inc. 1997.
*Instituto Nacional de Pesquisas Espaciais, DPI and DSR, S~io Jos6 dos Campos, Brazil
Universidade Federal de Pernambuco, Departamento de In- formitica, Recife, Brazil
i British National Space Centre, Remote Sensing Applications Development Unit, Huntingdon, United Kingdom
Address correspondence to Corina da Costa Freitas Yanasse, Inst. Nacional de Pesquisas Espaciais, DPI and DSR, Avenida dos Astro- nautas, 1758, 12227-010 Silo ]os6 dos Campos, Brazil.
Received 9 February 1996; revised 13 May 1996.
REMOTE SENS. ENVIRON. 59:180-190 (1997) ©Elsevier Science Inc., 1997 655 Avenue of the Americas, New York, NY 10010
I N T R O D U C T I O N
Many studies have used remote sensing to discriminate between mature forest and nonforest areas to determine the extent of deforestation in tropical regions (Tardin et al., 1980; Alves et al., 1992). More attention is now being payed to the remote sensing of secondary forest re- growth because it may have an important part to play in the region's carbon balance (Luekman et al., 1996).
With its all weather capability, microwave sensors guarantee image availability for a region that presents in- tense cloud cover most of the time, as is the ease of most of the Amazon Basin. Another strong motivation for us- ing radar data in the study of second-growth succession is the sensitivity of radar baekscatter to vegetation struc- ture, which is related to standing biomass (Luckman et al., 1996; Le Toan et al., 1992; Beaudoin et al., 1992).
The objective of this article is to analyze the nature of the relationship between the second-growth succes- sion stages and SIR-C SAR data (Space Shuttle hnaging Radar, L- and C- bands), over the Tapajds region, in the Amazon Basin. The SIB-C SAR data available in this re- gion were bands L and C, HH and HV polarizations. The analysis is accomplished by mapping the regenera- tion stages using a 10 consecutive annual sequence of Landsat TM data (Sant'Anna et al., 1995), and relating these stages with some measures of radar baekscatter.
Among the measures that could be derived from SAR images (e.g., Luckman et al., 1995), two very simple ones are used in this paper: the tonal mean and the coef- ficient of variation (CV). One reason for using both of these measurements is that in Yanasse et al. (1993) it was observed that the tonal mean for SAREX (South Ameri- can Radar EXperiment) data was not sufficient to sepa-
0034-4257/97/$17.00 PII S0034-4257(96)00149-6
Tropical Forest Regeneration Stages and SIR-C Data 1631
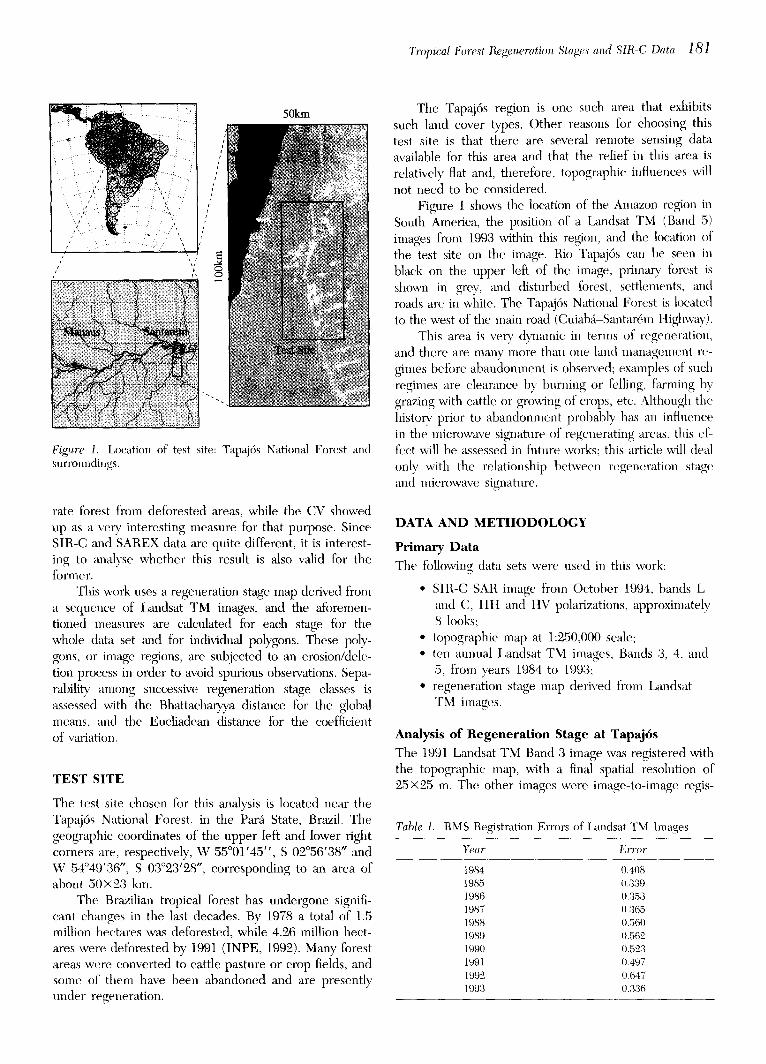
Figure i. Location of test site: Tapaj6s National Forest and surroundings.
rate forest from deforested areas, while the CV showed up as a very interesting measure for that purpose. Since SIB-C and SAREX data are quite different, it is interest- ing to analyse whether this result is also valid for the former.
This work uses a regeneration stage map derived from a sequence of Landsat TM images, mad the aforemen- tioned measures are c~culated for each stage ibr the whole data set and for individual polygons. These poly- gons, or image regions, are subjected to an erosion/dele- tion process in order to avoid spurious observations. Sepa- rability among successiwe regeneration stage classes is assessed with the Bhattacharyya distance for the global means, and the Eudiadean distance for the coefficient of variation.
TEST SITE
The test site chosen for this analysis is located near the Tapaj6s National Forest, in the Pardi State, Brazil. The geographic coordinates of the upper left and lower right corners are, respectively, W 55°01'45 ' ' , S 02°56'38" and W 54°49'36 ", S 03°23'28 ", corresponding to an area of about 50×23 kin.
The Brazilian tropical forest has undergone signifi- cant changes in the last decades. By 1978 a total of 1,5 million hectares was deforested, while 4.26 million hect- ares were defbrested by 1991 (INPE, 1992). Many forest areas were converted to cattle pasture or crop fields, and some of thein have been abandoned and are presently under regeneration.
The Tapaj6s region is one such area tlhat exhibits such land cover types. Other reasons for choosing this test site is that there are several remote sensing data available for this area and that the relief in this area is relatively flat and, therefore, topographic influences will not need to be considered.
Figure 1 shows the location of the Amazon region in South America, the position of a Landsat TM (Band 5) images from 1993 within this region, and the location of the test site on the image. Rio Tapaj6s can he seen in black on the upper left of the image, primary tbrest is shown in grey, and disturbed forest, settlements, and roads are in white. The Tapaj6s National Forest is located to the west of the main road (Cuiab~i-Santarrm ttighway).
This area is very dynamic in terms of regeneration, and there are many more than one land management re- gimes before abandonment is observed; examples of such regimes are clearance by burning or ()lling, farming by grazing with cattle or growing of crops, etc. Although the histou prior to abandonment probably has an influence in the microwave signature of regenerating areas, this ef- fect will be assessed in future works; this article will deal only with the relationship t)etween regeneration stage and microwave signature.
DATA AND METHODOLOGY
Primary Data The {bllowing data sets were used in this work:
• SIR-C SAR image from October 1994, bands L and C, HH and HV polarizations, approximately 8 looks;
• topographic map at 1:250,000 scale; • ten annual Landsat TM images, Bands :3, 4, and
5, from years 1984 to 1993; • regeneration stage map derived from Landsat
TM images.
Analysis of Regeneration Stage at Tapaj6s The 1991 Landsat TM Band 3 image was registered with the topographic map, with a final spatial resolution of 25×25 m. The other images were image-to-image regis-
Table 1. BMS Registration Errors of Landsat TM hnages
Yea r E Fro F
1984 0.408 1985 0.339 1986 0.353 1987 o.365 1988 o.560
1989 o.562 1991) 0.523
1991 0.497 199"2 (/,647
1993 0.336
182 Yanasse et al.
tered, having the 1991 Landsat TM Band 3 image as the reference and the same spatial resolution. The data were resampled using the nearest-neighbor technique. Table 1 presents the RMS registration errors of these Landsat TM images, showing that from this point of view the im- ages are reliably registered. The possible influence of the registration errors on the forthcoming analysis will be re- duced in an erosion procedure as described later.
Each Landsat TM images was segmented and then classified into several classes of land cover. The segmen- tation procedure was a region growing technique, which consists of the aggregation of pixels with similar proper- ties in sets called segments, defined by their borders. The segments classification identifies and labels segments with similar properties using a clustering algorithm called ISOSEG (Erthal et al., 19911, which is a region classifier. This procedure was applied to the l0 segmented images already obtained, generating 10 thematic images. Four geoelasses were associated with land use and vegetation types: i) primary forest; ii) secondary vegetatkm; iii) pas- ture, crops and bare soil; iv) river; and a nuisance type, v) shadows and clouds.
The 1992 image classification was evaluated by com- paring samples from the classified image with samples from a visual interpretation, using 133 samples of differ- ent classes. The percentage of agreement was 87%, and the Kappa coefficient of agreement was 76.26 with a variance of 0.0028.
These thematic images were superposed in a GIS system, and, using logical (Boolean) operations, a regen- eration stage classes map was generated.
The classes in this map were defined as areas with recent activities, areas with ditIbrent stages of secondary vegetation (varying from 1 to 9 years of regeneration), old secondary forest (more than 9 years of regeneration), and primary tbrest. For details about the generation of the regeneration stage map see Sant'Anna et al. (19951. Some classes in the map were grouped in order to re- duce misclassifieation errors. The classes used were: re- cent activities, (0, 2] years old, (2, 4] years old, (4, 6] years old, (6, 8] years old,~>9 years old, primary forest, without information. These classes correspond, respec- tively, to areas with bare soil and pasture, regeneration
up to 2 years old, regeneration between 2 and 4 years, regeneration between 4 and 6 years, regeneration be- tween 6 and 8 years, regeneration with at least 9 years, primary fi)rest, and areas tbr which there was no inibr- marion clue to cloud cover or shadows in the Ixmdsat TM images.
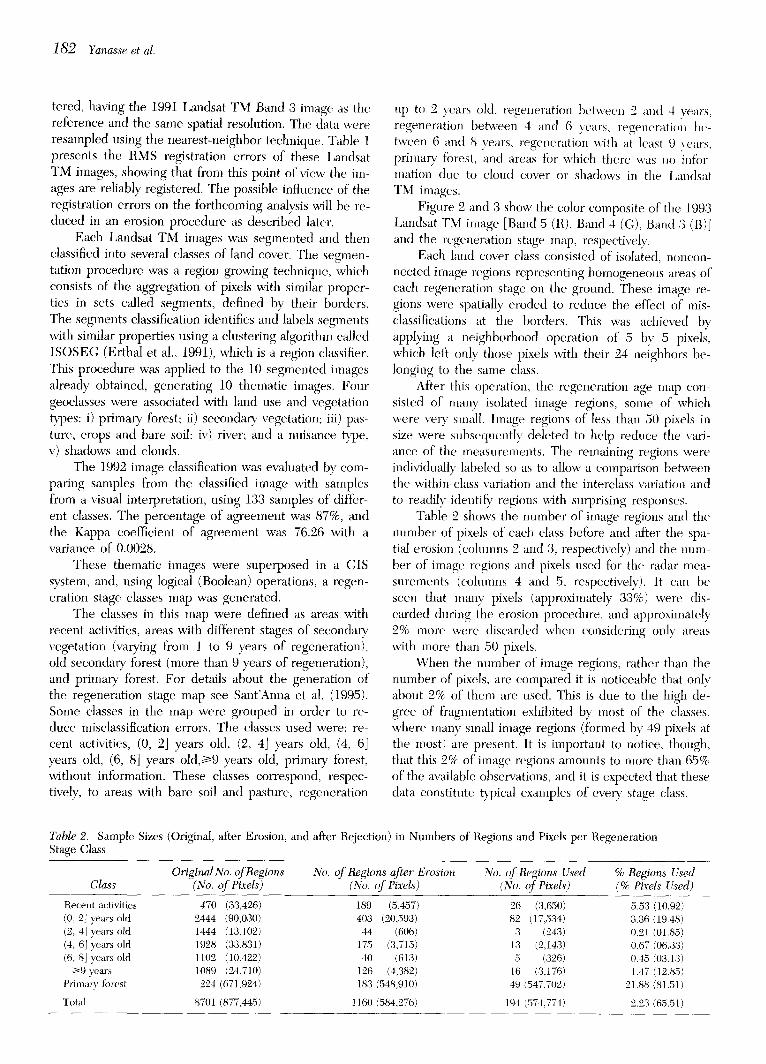
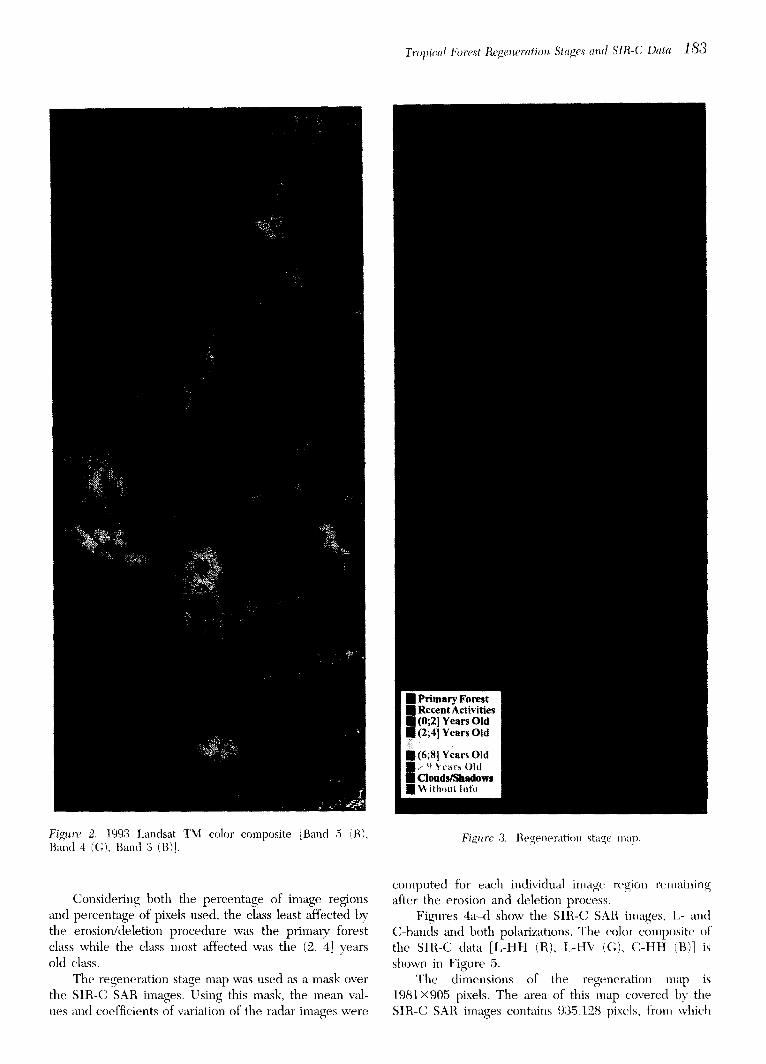
Figure 2 and 3 show the color coinposite of the 1993 Landsat TM image [Band 5 (R), Band 4 (G), Band 3 (B)] and the regeneration stage map, respectively.
Each land cover class consisted of isolated, noneon- neeted image regions representing homogeneous areas of each regeneration stage on the ground. These image re- gions were spatially eroded to reduce the effect of mis- classifications at the borders. This was achieved by appl~ng a neighborhood operation of 5 by 5 pixels, which left only those pixels with their 24 neighbors be- longing to the same class.
After this operation, the regeneration age map con- sisted of many isolated image regions, some of which were veo~ small, hnage regions of less than 50 pixels in size were subsequently deleted to help reduce the vari- ance of the measurements. The remaining regions were indi~idually labeled so as to allow a comparison between the within-class variation and the interclass variation and to readily identify regions with surprising responses.
Table 2 shows the number of image regions and the number of pixels of each class be}bre and after the spa- tial erosion (cohnnns 2 and 3, respectively) and the num- ber of image regions and pixels used ibr the radar mea- surements (eohnnns 4 and 5, respectively). It car) be seen that many pixels (approximately 33%) were dis- carded during the erosion procedure, and approximately 2% more were discarded when consklering only areas with more than 50 pixels.
When the number of image regions, rather than the number of pixels, are compared it is noticeable that only about 2% of them are used. This is due to the high de- gree of fragmentation exhibited by most of the classes, where many small image regions (~brmed by 49 pixels at the most) are present. It is important to notice, though, that this 2% of image regions amounts to more than 65% of the available observations, and it is expected that these data constitute b~)ical examples of every stage class.
Table 2. Sample Sizes (Original, after Erosion, and after Rejection) in Numbers of Regions and Pixels per Regeneration Stage Class
Original No. of Regions No. of Regions after Erosion No. of Regions Used % Regions Used Class (No. of Pixels) (No. of Pixels) (No. of Pixels) (% Pixels Us'ed)
Recent activities 470 (33,426) 189 (0, 2] years old 2444 (9(/,0301 4(13 (2, 4] years old 1444 (13,1021 44 (4, 6] years old 1928 (33,8311 175 (6, 8] years old 1102 (10,422) 4(1
/>9 years 1089 (24,7101 126 Primary forest 224 (671,924) 183
Total 87(tl (877,445) 1160
(5,457) 26 (3,650) 5.53 (1(/.92) (20,593) 82 (17,534) 3.36 (19.481
(606) 3 (243) 0.21 (01.851 (3,7151 13 (2,1431 0.67 (06.:33)
(61:3) 5 (326) 0.45 (03.13) (4,382) 16 (:3,176) 1.47 (12.85)
(548,910) 49 (547,702) 21.88 (81.511
(584,276) 194 (574,774) 2.23 (65.51)
Tropical Forest Regenerati(m Sta,~e.s aml SIR-C Data 183
Figure 2. 1993 Landsat TM color composite [Band 5 ,',B), Band 4 ((;), Band 3 (B)].
Fiy, ure 3. Regeneration stage map,
Considering both the percentage of image regions and percentage of pixels used, the class least affected by the erosion/deletion procedure was the primau forest class while the class most affected was the (2, 4] years old class.
The regeneration stage map was used as a mask over the SIR-C SAt/ images. Using this mask, the mean val- ues and coefficients of w~riation of the radar images were
computed for each individual image region remainiug after the erosion and deletion process.
Figures 4a-d show the SIII-C SAIl images, L- and C-bands and both polarizations. The color composite of the SIII-C data [L-HH (H), L-HV ((;), C-HH (g)] is shown in Figure 5.
The dimensions of the regeneration map is 1981×905 pixels. The area of this map covered by the SIII-C SAt/ images contains 935,128 pixels, from which
] 8 4 Yanasse et al.
(a) (b) (c) (d)
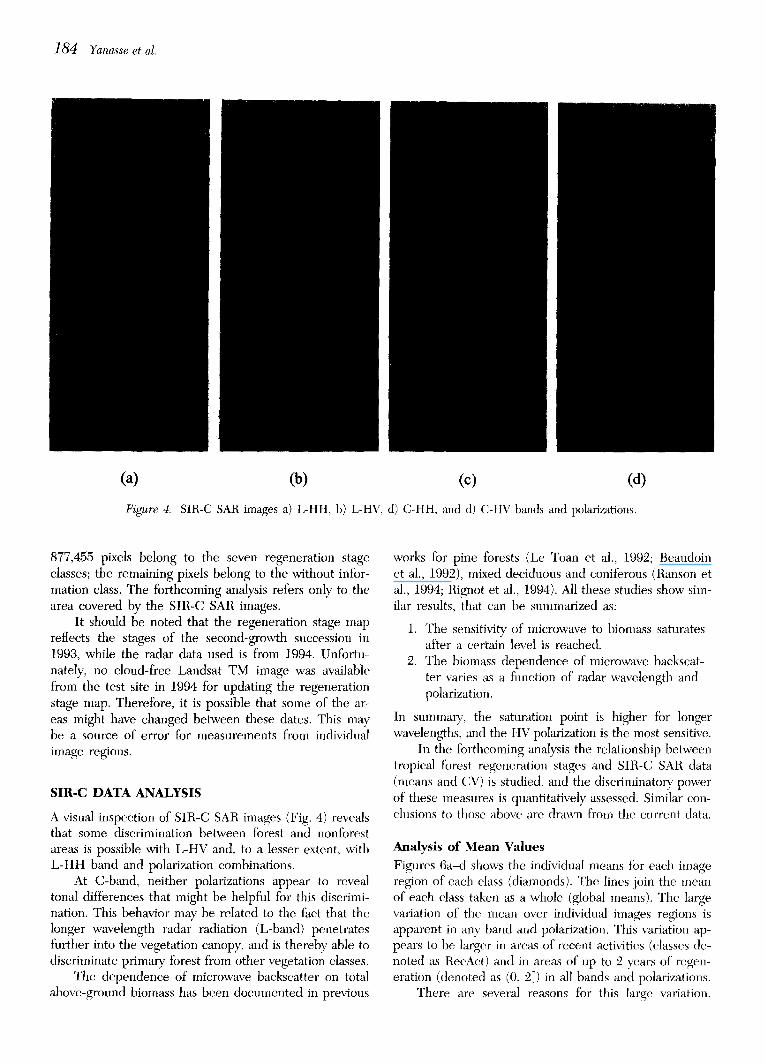
Figure 4. SIR-C SAR images a) L-HH, b) L-HV, d) C-HH, and d) C-HV bands and polarizations.
877,455 pixels belong to the seven regeneration stage classes; the remaining pixels belong to the without infor- mation class. The forthcoming analysis refers only to the area covered by the SIR-C SAR images.
It should be noted that the regeneration stage map reflects the stages of the second-growth succession in 1993, while the radar data used is from 1994. Unfortu- nately, no cloud-free Landsat TM image was available from the test site in 1994 for updating the regeneration stage map. Therefore, it is possible that some of the ar- eas might have changed between these dates. This may be a source of error for measurements from individual image regions.
SIR-C DATA ANALYSIS
A visual inspection of SIR-C SAR images (Fig. 4) reveals that some discrimination between tbrest and nonforest areas is possible with L-HV and, to a lesser extent, witb L-HH band and polarization combinations.
At C-band, neither polarizations appear to reveal tonal differences that might be helpful for this discrimi- nation. This behavior may be related to the t~act that the longer wavelength radar radiation (L-band) penetrates further into the vegetation canopy, and is thereby able to discriminate primary forest from other vegetation classes.
The dependence of microwave backscatter on total above-ground biomass has been documented in previous
works for pine forests (Le Toan et al., 1992; Beaudoin et al., 1992), mixed deciduous and coniferous (Banson et al., 1994; Bignot et al., 1994). All these studies show sim- ilar results, that can be summarized as:
1. The sensitivity of microwave to biomass saturates after a certain level is reached.
"2. The biomass dependence of microwave backscat- ter varies as a fimction of radar wavelength and polarization.
In summary, the saturation point is higher for longer wavelengths, and the HV polarization is the most sensitive.
In the forthcoming analysis the relationship between tropical ~brest regeneration stages and SIB-C SAIl data (means and CV) is studied, and the discriminatory power of these measures is quantitatively assessed. Similar con- clusions to those above are drawn from the current data.
Analysis of Mean Values Figures 6a-d shows the individual means for each image region of each class (diamonds). The lines join the mean of each class taken as a whole (global means). The large variation of the mean over individual images regions is apparent in any band and polarization. This variation ap- pears to be larger in areas of recent activities (classes de- noted as RecAct) and in areas of up to 2 years of regen- eration (denoted as (0, 2]) in all bands and polarizations.
There are several reasons for this large variation.
Tropical Forest Regeneration Stages and SIR-C Data 18~
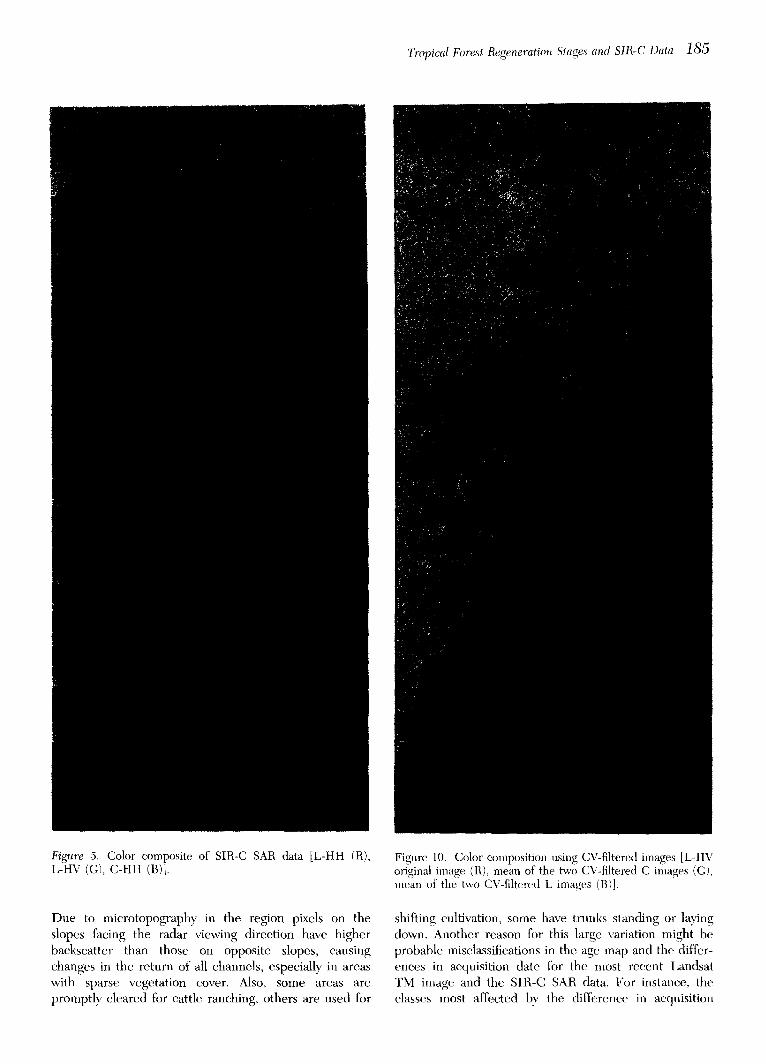
Figure 5. Color composite of SIR-C SAR data [L-HH (R), L-HV (G), C-HH (B)].
Figure 10. Color composition using CV-filtered images [L-HV original image (R), mean of the two CV-filtered C images (G), mean of the two CV-filtered L images (B)].
Due to microtopography in the region pixels on the slopes facing the radar viewing direction have higher baekseatter than those on opposite slopes, causing changes in the return of all channels, especially in areas with sparse vegetation cover. Also, some areas are promptly cleared for cattle ranching, others are used for
shifting cultivation, some have trunks standing or laying down. Another reason for this large variation might be probable miselassifications in the age map and the differ- ences in acquisition date for the most recent Landsat TM image and the SIR-C SAR data. For instance, the classes most affected by the difference in acquisition
186 Yanasse et al.
o)
._c
A
c g
(o) - -B t , r .. , . . . . . . . , . . . . . . . . . r . . . . . . . . ~.
- - 1 0
- -12
- -14 ~ 0
- -16 O . , . . . . . . . . . i . . . . . . . . . ,~ . . . . . . . . J . . . . . . . . .
RecAct ( 0 , 2 ] ( 2 , 4 ] ( 4 , 6 ] ( 6 , 8 ] > - 9 P r i m F o r R e g e n e r e t i o n S toges in 1995
(c)
2 I ~ ° o 2 c - 4 0 0 c
~ , - 1 0
~-8 +~ +~ -~I
+ ++++ : + + i + + + g ~ -12
~--~
RecAct (0,2] (2,4] (4,6] (6,8] >=9 Primror R e g e n e r o t i o n S tages [n 1 9 9 3
~- - 1 2 g c - 1 4
- 1 6
- 2 0 03 c e ° - 2 2
( b )
O 7°
ReCAct (0,2] (2.4] (4,6] (<8] >=9 Prlmgor Regenerotion Stages in 1993
(d)
q °
5> 0
RecAct (0,2] (2,4] (4,6] (6,8] >=9 er~mFor Regene ra t i on S tages in 1993
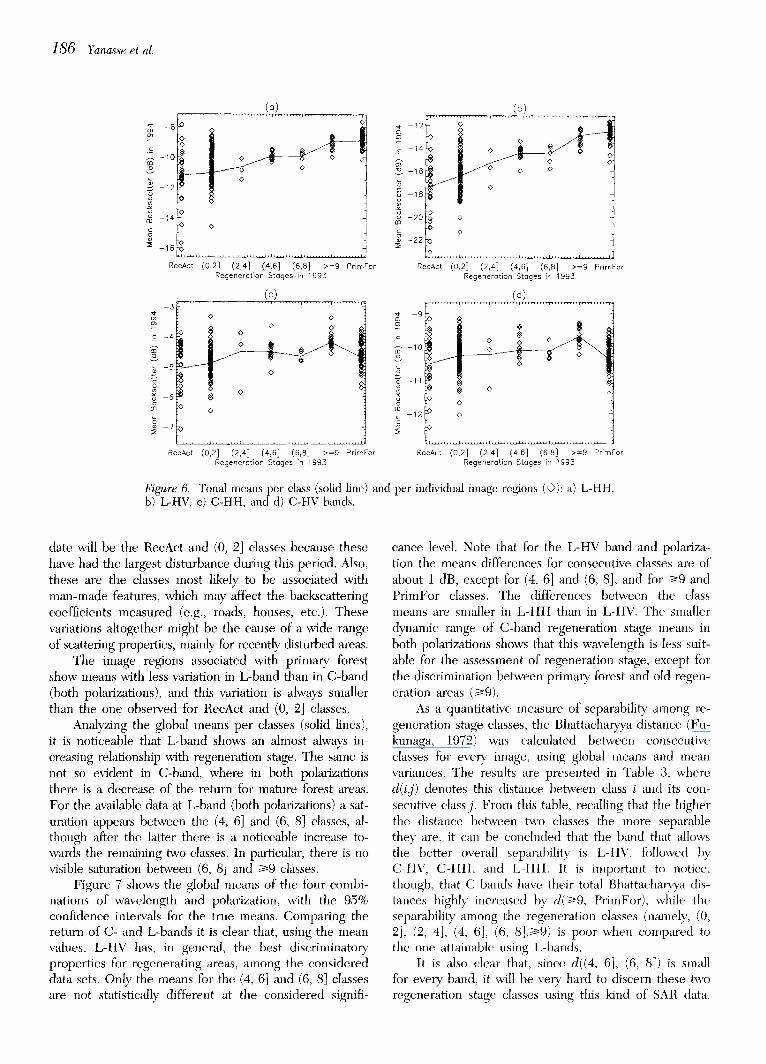
Figure 6. Tonal means per class (solid line) and per individual image regions (O): a) L-HH, b) L-HV, c) C-HH, and d) C-HV bands.
date will be the RecAct and (0, 2] classes because these have had the largest disturbance during this period. Also, these are the classes most likely to be associated with man-made features, which may affect the baekseattering coefficients measured (e.g., roads, houses, etc.). These variations "altogether might be the cause of a wide range of scattering properties, mainly for recently disturbed areas.
The image regions associated with primary forest show means with less variation in L-band than in C-band (both polarizations), and this variation is always smaller than the one observed for ReeAet and (0, 2] classes.
Analyzing the global means per classes (solid lines), it is noticeable that L-band shows an 'almost always in- creasing relationship with regeneration stage. The same is not so evident in C-band, where in both polarizations there is a decrease of the return for mature forest areas. For the available data at L-band (both polarizations) a sat- uration appears between the (4, 6] and (6, 8] classes, al- though after the latter there is a noticeable increase to- wards the remaining two classes. In particular, there is no visible saturation between (6, 8] and >9 classes.
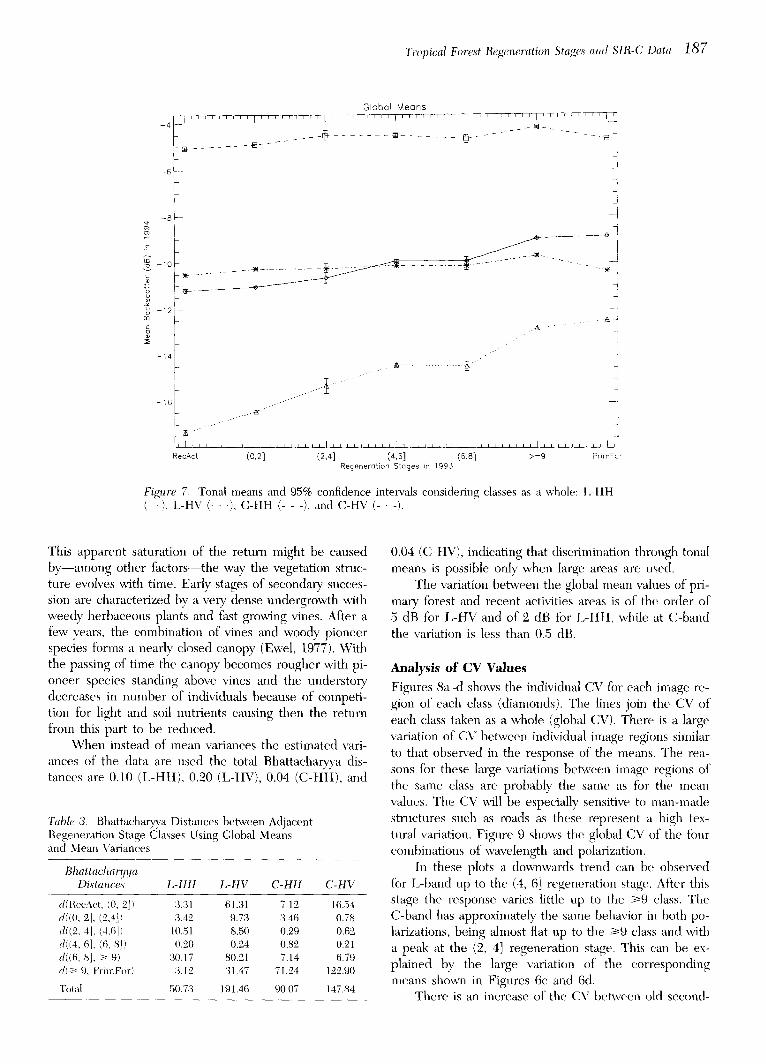
Figure 7 shows the global means of the four combi- nations of wavelength and polarization, with the 95% eonfidenee intervals tbr the true means. Comparing the return of C- and L-bands it is clear that, using the mean values, L-HV has, in general, the best discriminatory properties for regenerating areas, among the considered data sets. Only the means for the (4, 6] and (6, 8] classes are not statistically different at the considered signifi-
eanee level. Note that for the L-HV band and polariza- tion the means differences ibr consecutive classes are of about 1 dB, except for (4, 6] and (6, 8], and for >9 and PrimFor classes. The differences between the class means are smaller in L-HH than in L-HV. The smaller dynamic range of C-band regeneration stage means in both polarizations shows that this wavelength is less suit- able for the assessment of regeneration stage, except tbr the discrimination between primary forest and old regen- eration areas (>9).
As a quantitative measure of separability among re- generation stage classes, the Bhattaeharyya distance (Fu- kunaga, 1972) was calculated between consecutive classes for every image, using global means and mean variances. The results are presented in Table 3, where d(i,j) denotes this distance between class i and its con- secutive classj. From this table, recalling that tile higher the distance between two classes the more separable they are, it can be concluded that the band that allows the better overall separability" is L-HV, tbllowed by C-HV, C-HH, and L-HH. It is important to notice, though, that C bands have their total Bhattacharyya dis- tances highly increased by d(>9, PrimFor), while the separabili~ among the regeneration classes (namely, (0, 2], (2, 4], (4, 6], (6, 8],>9) is poor when compared to the one attainable using L-bands.
It is also clear that, since d((4, 6], (6, 8]) is small for every band, it will be very hard to discern these two regeneration stage classes using this kind of SAR data.
Tropical Forest Regeneration Sta~es' and SIR-C Data 1~7
ob
g
g co
Global Means _ 4 ~ - l - q - . . . . . ~ r ~ T , , , i r , ~ , ~ , , , r T , , , , ~ , , I , ~ , ' ' ~ - ~ ~ [ ~
N- . . . . . . . i
J
-121 N. " " ]
- 1 4 . . . . . i l ~ . . . . . . . . ~
, i , i , ~ , , , I t L ~ _ ~ ~ : , I ~ , , ~ , L ~ _ ~ 3 _ RecAct ( 0 , 2 ] ( 2 , 4 ] ( 4 , 6 ] ( 6 , 8 ] > = 9 P r i m F o r
R e g e n e r a t i o n S t a g e s in 1 9 9 3
Figure 7. Tonal means and 95% confidence intervals considering classes as a whole: L-HIt (--), L-HV (. . . ) , C-HH (- - -), and C-HV (- • -).
This apparent saturation of the return might be caused by--among other fiactors--the way the vegetation struc- ture evolves with time. Early stages of secondary succes- sion are characterized by a very dense undergrowth with weedy herbaceous plants and l:ast growing vines. After a few years, the combination of vines and woody pioneer species tbrms a nearly closed canopy (Ewel, 19771. With the passing of time the canopy becomes rougher with pi- oneer species standing above vines and the understory decreases in number of individuals because of competi- tion for light and soil nutrients causing then the return from this part to be reduced.
When instead of mean variances the estimated vari- ances of the data are used the total Bhattaeharyya dis- tances are 0.10 (L-HH), 0.20 (L-HV), 0.04 (C-HH), and
Table 3. Bhattacharyya Distances between Adjacent Regeneration Stage Classes Using Global Means and Mean Variances
Bhattachanjya Distances L-HH L-HV C-HH C-HV
d(tteeAct, (0, 2]) 3,31 61.31 7,12 16.54 d((11, 21, (2,4]) 3.42 9.73 3.46 1/.78 d((2, 4], (4,6]) 10.51 8.50 0.29 0.62 d((4, 6], (6, 8]) 1/.20 0.24 0.82 0.21 d((6, 8], > 9) 30.17 80.21 7.14 6.79 d (~ > 9, PrmaFor) 3.12 31,47 71.24 122.90
Total 5/173 191.46 90.07 147.84
0.04 (C-HV), indicating that discrimination through tonal means is possible only when large areas are used.
The variation between the global mean values of pri- mary ibrest and recent activities areas is of the order of 5 dB for L-HV and of 2 dB for L-HH, while at C-band the variation is less than 0.5 dB.
Analysis of CV Values
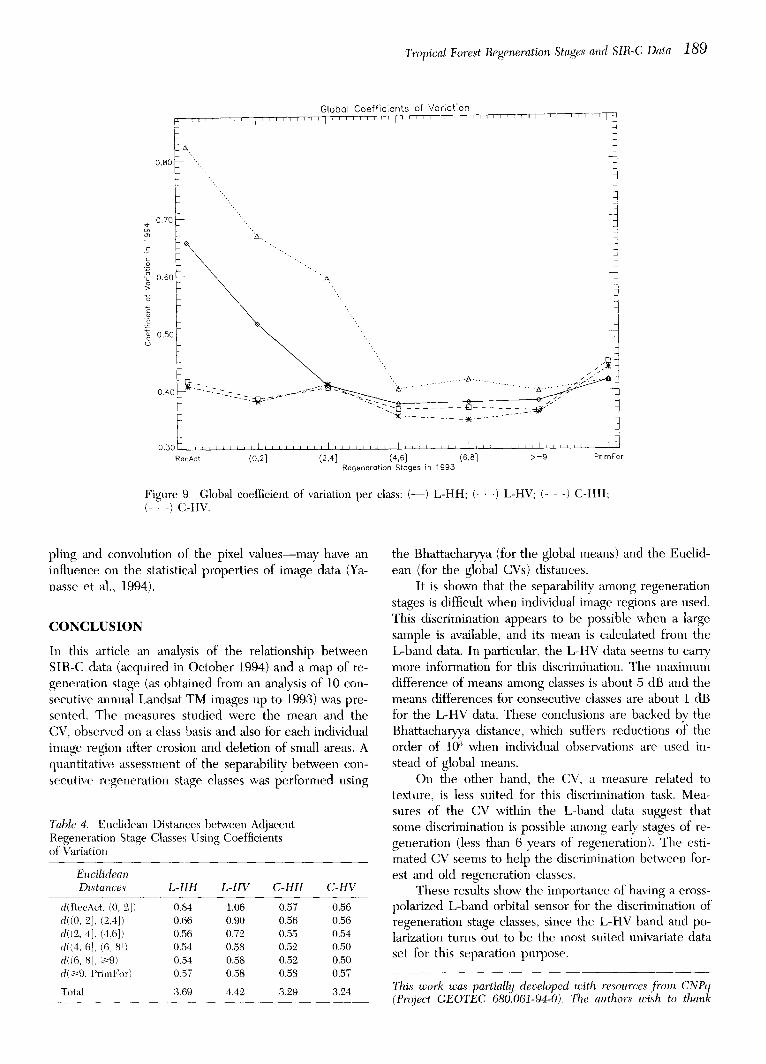
Figures 8a-d shows the individual CV for each image re- gion of each class (diamonds). The lines join the CV of each class taken as a whole (global CV). There is a large variation of CV between individual image regions similar to that observed in the response of the means. The rea- sons ~br these large variations between image regions of the same class are probably the same as fbr the mean values. The CV will be especially, sensitive to man-made structures such as roads as these represent a high tex- tural variation. Figure 9 shows the global CV of the fbur combinations of wavelength and polarization.
In these plots a downwaMs trend can be observed fbr L-band up to the (4, 6] regeneration stage. M~er this stage the response varies little up to the >9 class. The C-band has approximately the same behavior in both po- larizations, being almost fiat up to the >9 class and with a peak at the (2, 4] regeneration stage. This can be ex- plained by the large variation of the corresponding means shown in Figures 6c and 6d.
There is an increase of the CV between old second-
1 8 8 Yanasse et al.
(o) ~ . . . . . . . . . ~ . . . . . . . . . i . . . . . . . . . i ......... i I~ . . . . . . . . r ........
O.70 ~ !
O. 60
o o i 0.40
0.30 ~ ......... , . . . . . . . . . , . . . . . . . . . . . . . . . . . . . . . . . . . . . . . ~ .........
RecAct (0,2] (2,4] (4,6] (6,8] >=9 PrimFor Regeneration Stages in 1993
(o)
m 0 . 5 0
._=
= 0.45 o
o
0.40 ~d
0.35 u
'~ 0.30 o
RecAct (0,2] (2,4] (4,6] (6,8] >=9 PfimFor
Regenerotion Stages in 1993
c
~5
"S
G
t)
(b) 0 . 8 0 ~ ' " ', ......... , ......... , .........
0~0~. 8 \ <, o
! \ o o
0.40 @
f~ . . . . . ~ . . . . . . . . . . . . . . . 8 . . . . . . . ~ . . . . . . . . ~ . . ~ _ ~
RecAct (0,2] (2,4] (4,6] (6,8] >=9 PrimFor Regeneration Steges in 1993
(d)
0.50
0.45
0.40
0.35
0 . 3 0 0
0.25
RecAct (0,2] (2,4] (4,6] (6,8] >=9 PrimFor Regenerotion Stages in 1993
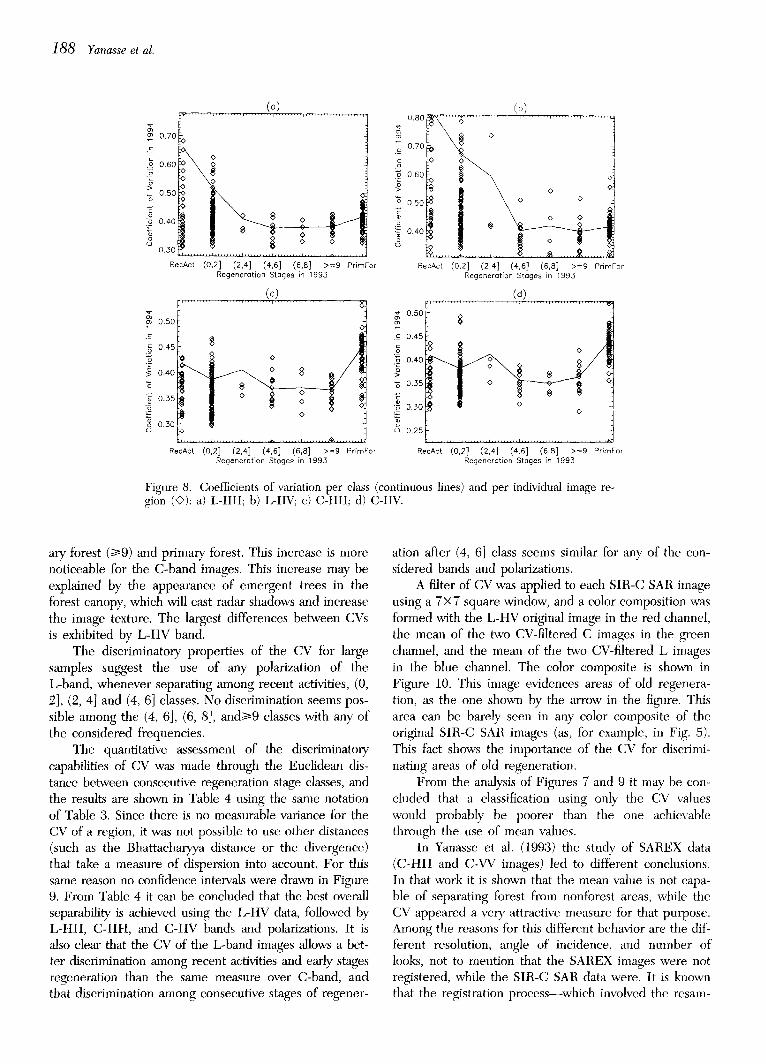
Figure 8. Coefficients of variation per class (continuous lines) and per individual image re- gion (©): a) L-HH; b) L-HV; c) C-HH; d) C-HV.
ary forest (1>9) and primary fbrest. This increase is more noticeable for the C-band images. This increase may be explained by the appearance of emergent trees in the forest canopy, which will cast radar shadows and increase the image texture. The largest differences between CVs is exhibited by L-HV band.
The discriminatory properties of the CV for large samples suggest the use of any polarization of the L-band, whenever separating among recent activities, (0, 2], (2, 4] and (4, 6] classes. No discrimination seems pos- sible among the (4, 6], (6, 8], ands>9 classes with any of the considered frequencies.
The quantitative assessment of the discriminatory capabilities of CV was made through the Euclidean dis- tance between consecutive regeneration stage classes, and the results are shown in Table 4 using the same notation of Table 3. Since there is no measurable variance for the CV of a region, it was not possible to use other distances (such as the Bhattacharyya distance or the divergence) that take a measure of dispersion into account. For this same reason no confidence intervals were drawn in Figure 9. From Table 4 it can be concluded that the best overall separability is achieved using the L-HV data, followed by L-HH, C-HH, and C-HV bands and polarizations. It is also clear that the CV of the L-band images allows a bet- ter discrimination among recent activities and early stages regeneration than the same measure over C-band, and that discrimination among consecutive stages of regener-
ation after (4, 6] class seems similar for any of the con- sidered bands and polarizations.
A filter of CV was applied to each SIR-C SAR image using a 7×7 square window, and a color composition was formed with the L-HV original image in the red channel, the mean of the two CV-filtered C images in the green channel, and the mean of the two CV-filtered L images in the blue channel. The color composite is shown in Figure 10. This image evidences areas of old regenera- tion, as the one shown by the arrow in the figure. This area can be barely seen in any color composite of the original SIR-C SAR images (as, for example, in Fig. 5). This fact shows the importance of the CV for discrimi- nating areas of old regeneration.
From the analysis of Figures 7 and 9 it may be con- cluded that a classification using only the CV values would probably be poorer than the one achievable through the use of mean values.
In Yanasse et al. (1993) the study of SAREX data (C-HH and C-VV images) led to different conclusions. In that work it is shown that the mean value is not capa- ble of separating forest from nonforest areas, while the CV appeared a very attractive measure for that purpose. Among the reasons for this different behavior are the dif- ferent resolution, angle of incidence, and number of looks, not to mention that the SAREX images were not registered, while the SIR-C SAR data were. It is known that the registration process which involved the resam-
Tropical Forest Regeneration Stages and SIR-C Data 189
0 . 8 0
0 . 7 0
0 . 6 0
0 , 5 0
0 . 4 0
Global Coefficients of Voriation i ~ i i i I I I I I [ I I I I I I I I I I I I I
A.
q
?X.
.,....
0 . 3 0
R e c A c t
i I i l t l i l l l l [ l l l l l I I [ t l l l l l l i l l l l l t l i l l L l t i t l i i l t l i l l l l - I l l l i L ~ ( 0 , 2 1 ( 2 , 4 ] ( 4 , 6 ] ( 6 , a I > = 9 P r i m g o r
R e c j e n e r a t l o n S t a g e s in 1 9 9 5
Figure 9. Global coefficient of variation per class: (--) L-HH; (- . .) L-HV; (- - -) C-HH; (- - -) C-HV.
piing and convolution of the pixel values--may have an influence on the statistical properties of image data (Ya- nasse et al., 1994).
C O N C L U S I O N
In this article an analysis of the relationship between SIR-C data (acquired in October 1994) and a map of re- generation stage (as obtained from an analysis of 10 con- secutive annual Landsat TM images up to 1993) was pre- sented. The measures studied were the mean and the CV, observed on a class basis and also for each individual image region after erosion and deletion of small areas. A quantitative assessment of the separability between con- secntive regeneration stage classes was performed using
Table 4. Euclktean Distances between Adjacent Regeneration Stage Classes Using Coefficients of Variation
Eucilidean Distances L-ttH L-HV C-HH C-HV
d(RecAct, (0, 2]) 0.84 1.06 0.57 0.56 d((0, 2], (2,4]) 0.66 0.90 0.56 0.56 d((2, 4], (4,6]) 0.56 0.72 0.5.5 0.54 d((4, 6], (6, 8]) 0.54 0.58 0.52 0.50 d((6, s], ~9) 0.54 0.58 0.52 0.50 d(>~9, PrimFor) 0.57 0.58 0.58 0.57
Total 3.69 4.42 3.29 3.24
the Bhattacharyya (for the global means) and the Euclid- ean (for the global CVs) distances.
It is shown that the separability among regeneration stages is difficult when individual image regions are used. This discrimination appears to be possible when a large sample is available, and its mean is calculated from the L-band data. In particular, the L-HV data seems to carry more information for this discrimination. The maximum difference of means among classes is about 5 dB and the means differences for consecutive classes are about 1 dB for the L-HV data. These conclusions are backed by the Bhattacharyya distance, which suffers reductions of the order of 103 when individual observations are used in- stead of global means.
On the other hand, the CV, a measure related to texture, is less suited for this discrimination task. Mea- sures of the CV within the L-band data suggest that some discrimination is possible among early stages of re- generation (less than 6 years of regeneration). The esti- mated CV seems to help the discrimination between for- est and old regeneration classes.
These results show the importance of having a cross- polarized L-band orbital sensor for the discrimination of regeneration stage classes, since the L-HV band and po- larization turns out to be the most suited univariate data set for this separation purpose.
This work was partially developed with res(mrces front CNPq (Project GEOTEC 680.061-94-0). The authors wish to thank
1 9 0 Yanasse et al.
the @ t e e s that helped improve the readabilit!l of this work, and Dr. L. V. Durra (INPE-DPI).
REFERENCES
Alves, D. S., Meira Filho, L. G., d'Alge, J. C. L., Mello, E. K., Moreira, J. C., and de Medeiros, J. S. (1992), The Amaz6nia information system, in ISPRS Congress, 17, Washington, DC, 2-14 August, Archives, Washington, DC, ISPBS Vol. 18, Comission VI, pp. 259-266.
Beaudoin, A., le Toan, T., Hsu, C. C.; Han, H. C., Kong, J. A., and Shin, R. T. (1992), Simulation of forest backseat- ter as a function of forest and ground parameters, in IGARSS'92 Proceedings, Houston, TX, 26--'29 May', Vol. 2, pp. 121"2-1214.
Erthal, G. J., Fonseea, L. M. G., Bins, L. S., Velasco, F. R. D., and Monteiro, A. M. V. (1991), Um sistema de segmentaq~io e classifieagfio de imagens de sat61ite, in Sim- pdsio Brasileiro de Computafdo Grdfica e Processal~uento de hnagens, 4, S~io Paulo, Brazil, July, Anais, Silo Paulo, EPUSP, 1991, Vol. 1, pp. 237-240.
Ewel, J. (1977), Differences between wet and dry succeeional tropical ecosystems. Geo-Eco- Trop 1:103-117.
Fukunaga, K. (1972), Introduction to Statistical Pattern Becog- nition, Academic, New York.
INPE (1992), Deforestation in Brazilian Amaz6nia, Separata, Instituto Naeional de Pesquisas Espaeiais, Silo Jos~ dos Campos, Brazil, 4 pp.
Le Toan, T., Beaudoin, A., Riom, J., and Guyon D. (1992), Re- lating/brest biomass to SAIl data. IEEE Trans. Geosci. Re- mote Sen.s'. 30:403-411.
Luckman, A., Baker, J., Kuplich, T. M., Yanasse, C. C. F., and Frery, A. C. (1996), A study of the relationship between ra-
dar backscatter and regenerating tropical (inest I)i<m*ass for spaceborn SAB instruments, Idemote Sens. En~Sro~., in press.
Luckman, A. J., Fre~):, A. C., Yanasse, C. C. F., and (;room, (;. B. (1995), Texture in Airborne SAIl imagery of tropical tbrest and its relationship to fi)rest regeneration stage. Int. J. Belm)te Sens., in press.
Ranson, J. K., and Sun, G. (1994), Northern ibrest classification using temporal multifrequeney and multipolariinetric SAt/ images. Bemote Sens. Enciron. 47:142-153.
Bignot, E., Wag, J. B., Willians, C., and Viereck L. (1994), Ila- dar estimates of above-gromld biomass fbrests of interior Alaska. IEEE 7~rans. Geosc. flemote Sen.s'. 32:117-1124.
Sant'Anna, S. J. S., Yanasse, C. C. F., Hernandez Filho, P. (1995), Seconda~ fbrest age mapping in Amaz6nia using multi-temporal LANDSAT/TM imagery, in 1995 Intem~a- tional Geos'cience and Bemote Sensing S!tmposium, Quanti- tative Remote Sensing fi~r Science and Applications, Flore- nce, Italy, 10-14 July, IEEE, New York, Vol. l, pp. 323-,325.
Tardin, A. T., Lee, D. C. L., Santos, Il. J. Il., et al. (1980), Subprojeto Desmatamento: Conv~nio IBDF/CNPq - INPE, Technical Report INPE-1649-IlPE/103, S~io Jos6 dos Campos, Brazil.
Yanasse, C. C. F., Frery, A. C., and Sant'Anna, S. J. s. (1994), Stochastic distributions and the inultiplieative mode/: rela- tions, properties, estimators and their use tbr SAIl image analysis, Technical Ileport, INPE, Silo Jos~ dos Cainpos, Brazil.
Yanasse, C. C. F., Frery, A. (2., Saut'Anna, S. J. S., Hernandez, P. F., and Dutra, L. V. (1993), Statistic'a[ analysis of SAIIEX data over Tapajds--Brazil, in SAREX-92 South American Radar E.vperi~luent, Paris, 6-8 Dec., 1993, W~)rkshop Pro- ceedings, ESA WPP-76, ESA, Paris, March 1994, pp. 25-40.