Exploration of intramolecular 13 C isotope distribution in long chain n-alkanes (C 11–C 31) using...
6
Exploration of intramolecular 13 C isotope distribution in long chain n-alkanes (C 11 –C 31 ) using isotopic 13 C NMR Alexis Gilbert a,⇑ , Keita Yamada a , Naohiro Yoshida a,b a Department of Environmental Chemistry and Engineering, Tokyo Institute of Technology, 4259 Nagatsuta-cho, Midori-ku, Yokohama, Kanagawa 226-8503, Japan b Earth-Life Science Institute, Tokyo Institute of Technology, Meguro, Tokyo 152-8551, Japan article info Article history: Received 16 October 2012 Received in revised form 5 July 2013 Accepted 8 July 2013 Available online 16 July 2013 abstract n-Alkanes are ubiquitous and useful biomarkers in the biogeochemistry field. Their carbon isotope com- position in sedimentary organic matter is therefore of particular importance for inferring their origin. The commonly used technique for d 13 C determination, isotope ratio mass spectrometry (IRMS), gives access to the isotope composition of n-alkanes at the molecular level, but does not provide information on their intramolecular isotope distribution. Here, we evaluate the potential of isotopic 13 C nuclear magnetic resonance (NMR) spectrometry for the determination of the intramolecular isotope composition of long chain n-alkanes (C 11 –C 31 ). The relative isotope composition of the three terminal carbon positions can be determined with a precision of 1.2‰ or better. The results from commercially available samples show that (i) the intramolecular 13 C isotope distribution is opposite between odd and even numbered n- alkanes in the C 16 –C 31 range and (ii) those in the C 11 –C 15 range show a 13 C depletion of ca. 12‰ in the methyl position and no difference between odd and even numbered compounds. The results are consis- tent with a biological origin of heavy n-alkanes whereas lighter ones are proposed to originate from abiogenic degradation such as thermal cracking. Overall, although only partial intramolecular 13 C patterns are obtained, the approach appears as promising tool in petroleum exploration and in the bio- geochemistry field. Ó 2013 Elsevier Ltd. All rights reserved. 1. Introduction n-Alkanes are ubiquitous compounds biosynthesized by several organisms such as terrestrial and aquatic plants, algae and insects. The stable carbon isotopic composition (noted as d 13 C and ex- pressed in ‰ relative to the international standard Vienna Peedee Belemnite, V-PDB) of n-alkanes biosynthesized by such organisms is therefore a useful indicator for inferring the origin of n-alkanes in sedimentary organic matter (OM; Hayes, 1993; Chikaraishi and Naraoka, 2003; Chikaraishi et al., 2012). The isotopic composition of n-alkanes is commonly determined using gas chromatography coupled with isotope ratio mass spec- trometry via a combustion module (GC-C-IRMS; Hayes et al., 1990). The technique has the advantage of allowing determination of the d 13 C values of various compounds present in the same ma- trix with a precision as low as 0.2‰ and with a sample amount of the order of nmol. The main limitation is that it provides d 13 C values at the molecular level, i.e. the average isotopic composition of each carbon position of the analyte. Indeed, since chemical and biological reactions break or form specific C–C bonds, the isotope fractionation (variation in d 13 C values) expected in natural compounds must occur at specific carbon atom positions. As stated by Monson and Hayes (1982), ‘‘isotopic differences between whole molecules [...] must be the attenuated and superficial manifesta- tions of isotopic differences within molecules’’. In other words, determining the d 13 C for each carbon position of a compound, namely the intramolecular isotope distribution, might lead to re- fined information about the chemical, physical and/or biological history of the compound. Little is known about the intramolecular isotopic distribution in natural compounds. The pioneering work of De Niro and Epstein (1977) and later Monson and Hayes (1982), allowed a comprehen- sive view of the metabolic steps that could lead to a heterogeneous 13 C isotopic distribution in fatty acids (FAs). Given that n-alkanes are formed from the FAs of living organisms (Cheesbrough and Kolattukudy, 1984; Zhou et al., 2010), the 13 C intramolecular het- erogeneity in FAs is likely to be preserved to a certain extent in n-alkanes and could thus be a valuable indicator of the sources and fate of organic compounds in sedimentary OM. Yet, to our knowledge, the intramolecular isotope distribution in n-alkanes has never been determined. The most conventional way to obtain intramolecular isotope distribution at natural abundance levels consists in the degradation of the analyte into fragments, the d 13 C values of which are determined separately using IRMS. Nevertheless, the high stability of n-alkanes, that makes them valuable biomarkers in 0146-6380/$ - see front matter Ó 2013 Elsevier Ltd. All rights reserved. http://dx.doi.org/10.1016/j.orggeochem.2013.07.004 ⇑ Corresponding author. Tel.: +81 45 924 5555; fax: +81 45 924 5143. E-mail address: [email protected] (A. Gilbert). Organic Geochemistry 62 (2013) 56–61 Contents lists available at SciVerse ScienceDirect Organic Geochemistry journal homepage: www.elsevier.com/locate/orggeochem
Transcript of Exploration of intramolecular 13 C isotope distribution in long chain n-alkanes (C 11–C 31) using...
Organic Geochemistry 62 (2013) 56–61
Contents lists available at SciVerse ScienceDirect
Organic Geochemistry
journal homepage: www.elsevier .com/locate /orggeochem
Exploration of intramolecular 13C isotope distribution in long chainn-alkanes (C11–C31) using isotopic 13C NMR
0146-6380/$ - see front matter � 2013 Elsevier Ltd. All rights reserved.http://dx.doi.org/10.1016/j.orggeochem.2013.07.004
⇑ Corresponding author. Tel.: +81 45 924 5555; fax: +81 45 924 5143.E-mail address: [email protected] (A. Gilbert).
Alexis Gilbert a,⇑, Keita Yamada a, Naohiro Yoshida a,b
a Department of Environmental Chemistry and Engineering, Tokyo Institute of Technology, 4259 Nagatsuta-cho, Midori-ku, Yokohama, Kanagawa 226-8503, Japanb Earth-Life Science Institute, Tokyo Institute of Technology, Meguro, Tokyo 152-8551, Japan
a r t i c l e i n f o a b s t r a c t
Article history:Received 16 October 2012Received in revised form 5 July 2013Accepted 8 July 2013Available online 16 July 2013
n-Alkanes are ubiquitous and useful biomarkers in the biogeochemistry field. Their carbon isotope com-position in sedimentary organic matter is therefore of particular importance for inferring their origin. Thecommonly used technique for d13C determination, isotope ratio mass spectrometry (IRMS), gives accessto the isotope composition of n-alkanes at the molecular level, but does not provide information on theirintramolecular isotope distribution. Here, we evaluate the potential of isotopic 13C nuclear magneticresonance (NMR) spectrometry for the determination of the intramolecular isotope composition of longchain n-alkanes (C11–C31). The relative isotope composition of the three terminal carbon positions can bedetermined with a precision of 1.2‰ or better. The results from commercially available samples showthat (i) the intramolecular 13C isotope distribution is opposite between odd and even numbered n-alkanes in the C16–C31 range and (ii) those in the C11–C15 range show a 13C depletion of ca. 12‰ in themethyl position and no difference between odd and even numbered compounds. The results are consis-tent with a biological origin of heavy n-alkanes whereas lighter ones are proposed to originate fromabiogenic degradation such as thermal cracking. Overall, although only partial intramolecular 13Cpatterns are obtained, the approach appears as promising tool in petroleum exploration and in the bio-geochemistry field.
� 2013 Elsevier Ltd. All rights reserved.
1. Introduction
n-Alkanes are ubiquitous compounds biosynthesized by severalorganisms such as terrestrial and aquatic plants, algae and insects.The stable carbon isotopic composition (noted as d13C and ex-pressed in ‰ relative to the international standard Vienna PeedeeBelemnite, V-PDB) of n-alkanes biosynthesized by such organismsis therefore a useful indicator for inferring the origin of n-alkanesin sedimentary organic matter (OM; Hayes, 1993; Chikaraishiand Naraoka, 2003; Chikaraishi et al., 2012).
The isotopic composition of n-alkanes is commonly determinedusing gas chromatography coupled with isotope ratio mass spec-trometry via a combustion module (GC-C-IRMS; Hayes et al.,1990). The technique has the advantage of allowing determinationof the d13C values of various compounds present in the same ma-trix with a precision as low as 0.2‰ and with a sample amountof the order of nmol. The main limitation is that it provides d13Cvalues at the molecular level, i.e. the average isotopic compositionof each carbon position of the analyte. Indeed, since chemical andbiological reactions break or form specific C–C bonds, the isotopefractionation (variation in d13C values) expected in natural
compounds must occur at specific carbon atom positions. As statedby Monson and Hayes (1982), ‘‘isotopic differences between wholemolecules [. . .] must be the attenuated and superficial manifesta-tions of isotopic differences within molecules’’. In other words,determining the d13C for each carbon position of a compound,namely the intramolecular isotope distribution, might lead to re-fined information about the chemical, physical and/or biologicalhistory of the compound.
Little is known about the intramolecular isotopic distribution innatural compounds. The pioneering work of De Niro and Epstein(1977) and later Monson and Hayes (1982), allowed a comprehen-sive view of the metabolic steps that could lead to a heterogeneous13C isotopic distribution in fatty acids (FAs). Given that n-alkanesare formed from the FAs of living organisms (Cheesbrough andKolattukudy, 1984; Zhou et al., 2010), the 13C intramolecular het-erogeneity in FAs is likely to be preserved to a certain extent inn-alkanes and could thus be a valuable indicator of the sourcesand fate of organic compounds in sedimentary OM. Yet, to ourknowledge, the intramolecular isotope distribution in n-alkaneshas never been determined.
The most conventional way to obtain intramolecular isotopedistribution at natural abundance levels consists in thedegradation of the analyte into fragments, the d13C values of whichare determined separately using IRMS. Nevertheless, the highstability of n-alkanes, that makes them valuable biomarkers in

A. Gilbert et al. / Organic Geochemistry 62 (2013) 56–61 57
biogeochemistry, makes them difficult to degrade into specificfragments without any isotope fractionation. For instance, Corsoand Brenna (1999) determined the isotopic composition ofpyrolytic fragments from light n-alkanes (C5–C10) using an on-linepyrolysis system coupled with GC-C (combustion)-IRMS. Despitethe high potential of the approach for fingerprinting purposes,the original 13C pattern of n-alkanes cannot be reconstructed reli-ably due to potential isotope fractionation and occurrence of sec-ondary reactions during pyrolysis.
Recently, isotopic 13C nuclear magnetic resonance (NMR) spec-trometry has made possible the separation and quantification ofeach 13C isotopomer in an analyte without prior degradation. Thetechnique has been used to access the intramolecular isotopiccomposition of compounds such as EtOH (Caytan et al., 2007a; Gil-bert et al., 2011), vanillin (Tenailleau et al., 2004), glucose (Gilbertet al., 2009) and paracetamol (Silvestre et al., 2009). Once theparameters are set to obtain quantitative conditions, the precisioncan reach 1‰ or less on the d13C scale (Caytan et al., 2007a). SinceNMR is non-destructive, the intramolecular 13C isotope distribu-tion in n-alkanes can potentially be determined without any cor-rection needed to account for isotope fractionation.
Here we have examined the feasibility of determining the intra-molecular isotope distribution of long chain n-alkanes (C11–C31)using isotopic 13C NMR. Preliminary results from commerciallyavailable samples are presented and discussed to illustrate the po-tential of the approach in biogeochemistry.
Fig. 1. n-Alkane structure and notation used. Only the three terminal carbon atompositions (CH3, CH2a, CH2b) were considered.
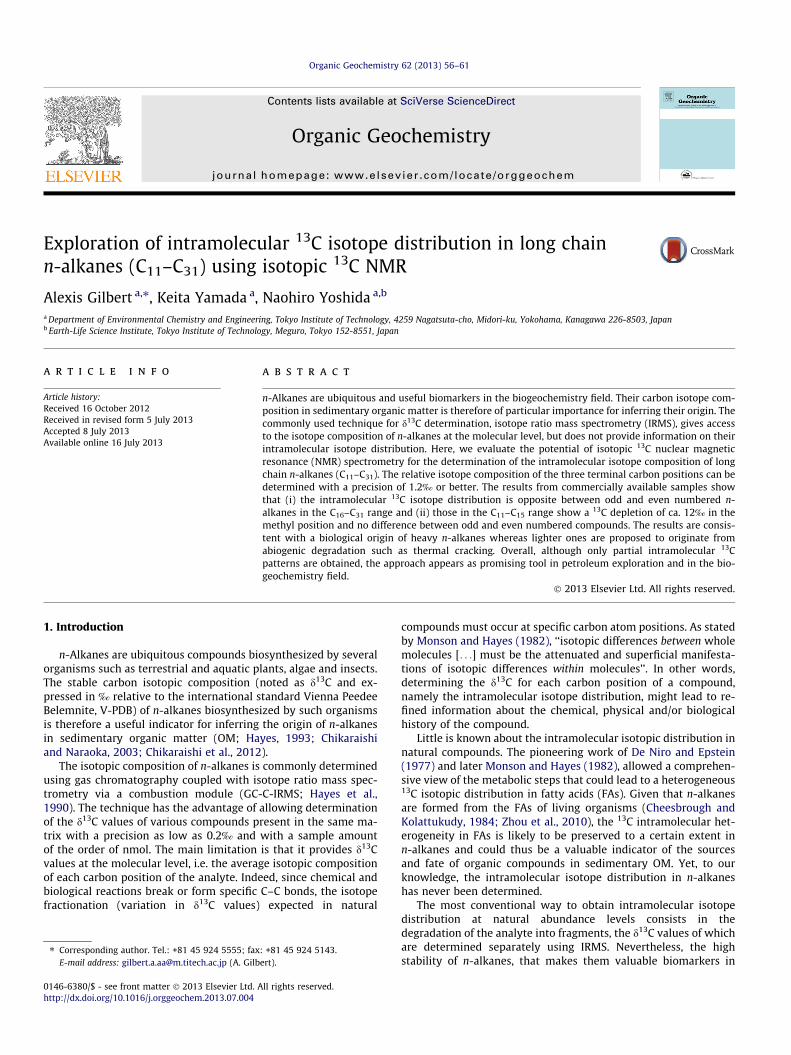
Fig. 2. 13C NMR spectrum (1H decoupled) of tetracosane (n-C24H50). Only theisotopomers with a 13C on the three terminal atom positions (CH3, CH2a, CH2b) couldbe quantified.
2. Material and methods
2.1. Chemicals
n-Alkanes (C11–C31) (purity > 99.5%) were from Tokyo ChemicalIndustry Co. (TCI, Tokyo, Japan). Deuterated chloroform (CDCl3)and toluene (Tol-d8) were from Wako Pure Chemical Industries,Ltd. (Osaka, Japan). The relaxation agent, tris(2,4-pentadiona-to)chromium-III [Cr(Acac)3] (97%) was from Kanto Chemical Co.,Inc. (Tokyo, Japan).
2.2. Sample preparation
(i) For n-alkanes in the C11–C27 range: to 100–600 mg of thecompound were added 300–800 ll CDCl3 and 100 ll of0.1 M Cr(Acac)3 in CDCl3. The solution was homogenizedbefore being filtered in a 5 mm outer diameter (o.d.) tube.
(ii) For n-alkanes in the C28–C31 range: to 100–125 mg of thecompound were added 500–700 ll Tol-d8 and 100lL of0.1 M Cr(Acac)3 in Tol-d8. The solution was gently heatedand homogenized until complete dissolution of the com-pound before being filtered in a 5 mm o.d. tube.
2.3. NMR measurements
Quantitative 13C NMR spectra were recorded using a Bruker 400Avance III spectrometer fitted with a 5 mm i.d. 13C/1H probe care-fully tuned at the recording frequency of 100.64 MHz. The temper-ature was set at 303 ± 0.1 K for the C11–C27 n-alkanes and to313 ± 0.1 K for the C28–C31 n-alkanes. The sequence used was thatdescribed by Tenailleau and Akoka (2007). Briefly, a 90� pulse wasapplied on the 13C channel followed by an acquisition period of 1 s.The number of repetitions of this sequence (number of scans, NS)was adapted for each compound in order to get a signal/noise ratioof 700. For each compound, the longitudinal relaxation times T1
(13C) were measured using an inversion-recovery sequence. Therecovery delay, i.e. the delay between each 90� pulse, was set to10 � T1max (13C), where T1max (13C) is the largest T1 (13C) of the com-
pound to be measured. 1H decoupling was applied only during theacquisition period in order to avoid a Nuclear Overhauser effectinducing any change in the area of the carbon signals. The decou-pling sequence used a cosine adiabatic pulse with appropriatephase cycles, as described by Tenailleau and Akoka (2007).
2.4. Spectra treatment
The free induction decay (FID) was multiplied by an exponentialfunction with a line broadening factor of 1.6 Hz followed by Fouriertransform. The curve fitting of the spectrum was carried out in ac-cord with a Lorentzian mathematical model using Perch Software(Perch NMR Software: University of Kuopio, Finland). One mea-surement is the mean of the results obtained from 3 to 5 spectra.
2.5. Expression of results
Since the signals corresponding to the central CH2 atoms over-lap in the 28–30 ppm region (Figs. 1 and 2), only the isotopomersbearing a 13C atom in one of the three terminal positions (CH3,CH2a and CH2b) could be quantified. For each of these three carbonatom positions, the relative 13C abundance was determined usingthe molar fraction fi (where i is the C atom position considered)as follows: fi = Si/Stot, where Si is the area of the peak correspondingto the 13C isotopomer in the position i and Stot the total areaof the peaks corresponding to the three 13C isotopomers(Stot = SCH3 + SCH2a + SCH2b). Each Si was corrected to compensatefor the slight loss of intensity caused by satellites (interactionsdue to the presence of 13C–13C isotopologues) by multiplying by(1 + n � 0.011), where n is the number of carbons directly attachedto the C atom position i (n = 1 for the CH3 position and n = 2 for theCH2a and CH2b positions) and 1.1% (= 0.011) is the average natural13C abundance [see Tenailleau et al. (2004) and Silvestre et al.(2009) for a detailed explanation]. Eventually, if Fi denotes the sta-tistical mole fraction (homogeneous 13C distribution, i.e. Fi = 1/3 foreach carbon position in the case of n-alkanes) at any C atom posi-tion i, then the site-specific relative deviation from a 13C homoge-neous distribution is di (‰)= (fi/Fi – 1) � 1000.

58 A. Gilbert et al. / Organic Geochemistry 62 (2013) 56–61
It is worth noting that the patterns thus obtained are an averageof the isotopic patterns at each end of the carbon chain.
2.6. Bulk d13C determination of n-alkanes
The bulk d13C values of all n-alkanes were determined usingcavity ring down spectroscopy (CRDS, G1121-I analyzer, PicaroInc., Santa Clara , CA, USA) after their combustion to CO2.
3. Results
The purpose was to evaluate the potential of isotopic 13C NMRfor determination of the intramolecular isotope distribution in n-alkanes (C11+). Since n-alkanes up to C31 can be found in petroleumand plant wax, we focus here on the analysis of all the compoundsin the C11–C31 range. As can be seen from Fig. 2, only three isotop-omers can be reliably quantified, the other signals overlapping inthe 28–30 ppm region of the 13C NMR spectrum. The precisionrequired (ca. 1‰) prevents the use of an internal reference forthe absolute determination of d13C values, so that only relative13C abundance for each of the three positions, di, can be deter-mined. Only the di value for these three carbon atom positionswas considered.
3.1. Experimental time
The precision of an isotopic 13C NMR analysis is mainly gov-erned by the SNR (Caytan et al., 2007a). Accordingly, the concen-tration of each analyte was made as high as possible bydissolving the maximum amount of the compound in the mini-mum of deuterated solvent. The NS was then adjusted to reach aSNR of at least 700 (required for 1‰ precision; see Caytan et al.,2007a). The duration of each scan is governed by the recovery de-lay, RD, which has to be adjusted from the maximum relaxationtime T1 (13C) of the compound. In order to reduce RD, a relaxationagent was used for all the measurements. It allows the reduction ofthe longitudinal relaxation times T1 (13C) and thus the experimen-tal time, without affecting the accuracy of the measurement(Caytan et al., 2007b).
Consequently, the experimental time is governed by (i) the con-centration of the analyte (i.e. the NS necessary to reach a S/N valueof 700) and (ii) the RD. The relaxation times for n-alkanes in theC11–C31 range were of the same order of magnitude (within 3 s).Accordingly, the RD did not affect the experimental time between
0.0
0.2
0.4
0.6
0.8
1.0
1.2
11 12 13 14 15 16 17 18 19 2
SD (‰
)
Carbon c
Fig. 3. Standard deviation from the mean di (expressed in ‰; n P 3) for each of the threlength. Black triangles, CH3: white circles, CH2a; black stars, CH2b.
two compounds to a great extent. Hence, the main factor affectingthe experimental time was the concentration of the analyte. Sincethe solubility of n-alkanes decreases with increasing chain length,the higher the molecular weight of the analyte, the longer theexperimental time. The latter thus increases gradually from n-C11
(ca. 1 h) to n-C27 (ca. 90 h). Tol-d8 was used instead of CDCl3 forC28+ compounds in order to allow working at higher temperature,and thus to increase the concentration of the analyte. In these con-ditions, compounds up to C31 can be analyzed within a reasonabletime (i.e. < 90 h for one measurement). The results obtained usingboth Tol-d8 and CDCl3 were identical for C17 and C22 (data notshown), suggesting that both solvents could be used for our pur-pose. Nevertheless, because of its lower price, CDCl3 was preferredwhen possible. Thus, the C11–C27 compounds were analyzed usingCDCl3 and the C28–C31 compounds using Tol-d8.
3.2. Repeatability of measurements
The standard deviation of repeated experiments (n > 3) wasdetermined for each compound. As shown in Fig. 3, the standarddeviation from the mean di for each of the three C atom positionsdid not exceed 1.2‰ for all the compounds; this is in good accordwith data for vanillin using the same S/N ratio (Caytan et al.,2007a). Furthermore, it is worth noting that the carbon chainlength, and thus the experimental time, had no influence on theprecision.
3.3. Application to commercially available samples
The results typically obtained for n-C21 and n-C22 are depictedin Fig. 4. Clearly, the intramolecular isotope distribution is nothomogeneous, with differences between each C atom position ofup to 10‰. To compare the data from one compound to another,the relative di values cannot be used. For instance, the di value ofCH2b for C21 and C22 (ca. 0‰) cannot be seen as equal, since theabsolute d13C value is not known. Nevertheless, the variation with-in a compound (i.e. the isotopic pattern) can be used for a compar-ison. Therefore, the results are expressed subsequently as:
D1 ¼ dCH3 � dCH2a
D2 ¼ dCH2a � dCH2b
For instance, the D1 and D2 values for C22 (Fig. 3) are 10.2 ‰ and�5.6 ‰, respectively.
0 21 22 23 24 25 26 27 28 29 31hain length
e terminal carbon atom positions obtained for n-alkanes as a function of the chain

-8.0
-4.0
0.0
4.0
8.0d i (
‰)
CH3 CH2a CH2b
Fig. 4. Partial isotopic pattern, expressed as di (‰), of the three terminal carbonpositions of n-C21 (black line) and n-C22 (gray line) from TCI. The dotted linerepresents a homogeneous 13C distribution (di = 0).
G2
G1
G1a
G1b
Δ2 (‰
)
-10.0
-5.0
0.0
5.0
10.0
15.0
20.0-20.0 -15.0 -10.0 -5.0 0.0 5.0 10.0 15.0 20.0
G2
G1
G1a
G1b
Δ1 (‰)
Fig. 6. Representation of D2 values as a function of D1 values for n-alkanesanalyzed. Three groups could be distinguished according to their D1 and D2 values:G1a (OCN n-alkanes in the C16–C31 range, excluding n-C17), G1b (ECN n-alkanes in theC16–C31 range) and G2 (OCN n-alkanes + ECN-n-alkanes in the C11–C15 range,including n-C17).
A. Gilbert et al. / Organic Geochemistry 62 (2013) 56–61 59
The results for all n-alkanes from TCI in the range C11–C29 andC31 are reported in Fig. 5. Two features arise from these results:
(i) For all the compounds in the C16–C31 range (except n-C17),the intramolecular pattern was alternate between odd car-bon numbered and even carbon numbered n-alkanes(denoted subsequently as OCN n-alkanes and ECN n-alkanes,respectively): for OCN n-alkanes, the CH3 position was 13Cdepleted vs. the CH2a position (D1 negative) whereas theCH2a position was 13C enriched vs. CH2b (D2 positive). Theopposite tendency was observed for ECN n-alkanes.
(ii) All the lighter n-alkanes (n-C11 to n-C15 including n-C17) hada similar pattern which was not dependent on the number ofcarbons in the compound: CH3 was 13C-depleted vs. CH2a
(D1 negative) whereas CH2a and CH2b had similar isotopecomposition (D2 ca. 0‰).
4. Discussion
The n-alkanes were from commercial sources. Unfortunately,obtaining clear information about their origin (petroleum distil-lates, biological extracts) from the supplier turned out to be diffi-cult. Hence, rather than deciphering their origin, the followingdiscussion aims at showing the potential information obtainedusing relative isotopomer concentration and how the approachmight be used in future studies.
Two groups could be distinguished, denoted as G1 (‘‘heavy’’group: C16–C31 range, excluding C17) and G2 (‘‘light’’ group: C11–C15 range, including C17). The G1 group could be subdivided into
-20.0
-10.0
0.0
10.0
20.0
11 12 13 14 15 16 17 18 19 2
1 SD
Δ (‰
)
Carbon
Fig. 5. Representation of D1 (‰) (black line) and D2 (‰) (gray line) from the isoto
two sub-groups: G1a (OCN n-alkanes) and G1b (ECN n-alkanes).The arbitrary distinction between the groups was straightforwardwhen the D2 values were plotted as a function of the D1 valuesfor each compound, as shown in Fig. 6. The mean d13C, D1 andD2 values and the standard deviation associated with each groupare listed in Table 1 (see Supplementary material for a detailedlist).
4.1. Preliminary considerations
As stated in Section 3, the patterns obtained for n-alkanes arethe average of that at each end of the carbon chain. If the patternat each end of the chain is perfectly opposite (e.g. one end has anisotopic pattern x–y–x and the other y–x–y, where x and y are13C abundances), the method employed here will lead to ahomogeneous pattern (D1 = D2 = 0). Any deviation from this pat-tern thus requires (i) a symmetrical arrangement in which bothends of the alkane have the same pattern x–y–x or (ii) markedinequality between patterns of each end so that one dominatesthe averaged signal.
4.2. Intramolecular 13C isotope distribution in n-alkanes from G1 group
The 13C isotopic pattern of odd numbered, long chain n-alkanes(G1a group) can be attributed to an alternation in d13C values be-tween odd and even carbon atom positions in FAs, as observed
0 21 22 23 24 25 26 27 28 29 31chain length
pic 13C NMR measurement of n-alkanes as a function of carbon chain length.

Fig. 7. Simplified scheme for formation of odd numbered and even numbered n-alkanes; m and k depict the 13C isotope composition of methyl and carboxyl positions,respectively, of acetyl-CoA, the precursor of FAs; c, b and a represent the 13C isotope composition of carbon atom positions in propionate (from the methyl position inwards).The term ‘‘decarboxylation’’ is used to express the loss of the terminal carboxyl carbon atom, either by direct decarboxylation or by reduction followed by decarbonylation.ECN, even carbon numbered; OCN, odd carbon numbered; FA, fatty acid.
Table 1Average d13C, D1 and D2 values for each of the 3 groups of n-alkanes (numbers inbrackets indicate standard deviation from the mean).
d13C (‰) D1 (‰) D2 (‰)
G1aa (n=7) -30.2 (1.1) -3.9 (1.8) 11.0 (5.2)
G1bb (n=7) -31.1 (2.0) 10.4 (2.4) -3.1 (1.9)
G2c (n=6) -28.3 (1.7) -12.5 (0.7) -0.5 (1.9)
a OCN n-alkanes in the C16-C31 range, excluding C17.b ECN n-alkanes in the C16-C31 range.c OCN n-alkanes + ECN n-alkanes in the C11-C15 range, including C17.
60 A. Gilbert et al. / Organic Geochemistry 62 (2013) 56–61
by Monson and Hayes (1980, 1982). Assuming an alternate patternin even carbon numbered fatty acids (ECN FAs) inherited from the13C isotopic composition of carbonyl (k) and methyl (m) positionsof acetyl-CoA, both ends of the n-alkanes would have the same iso-tope pattern, m–k–m, which corresponds to case i above (Fig. 7).This alternation was indeed observed for n-alkanes in the G1a
group, with the CH3 and CH2b positions 13C depleted vs. the CH2a
position. It is worth noting that the expected pattern in the precur-sor FAs would show a 13C depletion in odd positions (derived fromthe methyl position of acetyl-CoA) and a 13C enrichment in theeven ones (from the carboxyl position of acetyl-CoA). This findingis in good agreement with the data obtained by Monson and Hayes(1982) from FAs biosynthesized by Saccharomyces cerevisiae.
Remarkably, the D1 and D2 values for even long chain n-alkanes(G1b group) were 10.4‰ and �3.1‰, respectively (see Table 1),which is significantly different from zero. This would not be com-patible with a-oxidation or b-scission where the isotope patternshould be null (D1 = D2 = 0), with one end having an m–k–m pat-tern and the other one k–m–k (Fig. 7). It could be consistent witha biological origin of these compounds deriving from OCN FAs,the precursor of which is propionate (Zhou et al., 2010). In sucha case, both ends of n-alkanes would have different patterns (i.e.c–b–a and m–k–m; see Fig. 7), leading to a non-null result (caseii above). Obviously the veracity of this conjecture cannot be as-sessed without knowing the clear origin of the compounds.
4.3. Intramolecular 13C isotope distribution in n-alkanes from G2 group
Comparing the intramolecular 13C patterns for compounds fromthe G2 group with those from the G1 group, two features arise: (i)
the 13C pattern was different from both G1a and G1b groups and (ii)there was little or no alternation of D1 and D2 values between oddand even numbered compounds. Indeed, the 13C pattern in G2 n-al-kanes was highly reproducible, with a standard deviation from themean below 2‰ for both D1 and D2 values (Table 1). Moreover, thed13C values of n-alkanes from the G2 group were different fromthose of n-alkanes from the G1 group (Table 1; p < 0.05), suggestingthey arose from a different process and/or source.
Generally, light n-alkanes arise from the thermal cracking ofheavier ones. Thermal cracking of OM (heavy n-alkanes) can occurin situ, at temperatures above 100 �C and within geological time-scales, or in industry, in order to obtain valuable commercial com-ponents (e.g. gasoline). In both cases, that might affect theintramolecular isotopic signature of the newly formed n-alkanes(light n-alkanes).
During thermal cracking, each precursor n-alkane will produce acomparable amount of OCN n-alkane and ECN n-alkane. Hence, theintramolecular isotopic pattern of newly formed n-alkanes can beconsidered to a first approximation as homogeneous, the heteroge-neity inherited from both OCN n-alkanes and ECN n-alkanes beingcancelled out. This is indeed the case for the CH2a and CH2b posi-tions, which had similar 13C isotope composition (D2 ca. 0‰, Ta-ble 1). Although this is obviously not the case for the methylposition, which was 13C depleted by ca. 12.5‰ compared with thetwo other carbon atom positions (D1 = �12.5‰, Table S1). Sincethe methyl position arises from the broken C–C bond of theirprecursor (a heavier n-alkane), we suggest that the depletionoriginates from an isotope effect associated with its formation. Tanget al. (2000) calculated an isotope effect (13k/12k) of 0.981 for thecentral C–C bond breaking of n-hexane at 500 K. Accordingly, the13C isotope composition in the methyl position of the productformed (propane in that case) should be 13C-depleted comparedwith the parent hydrocarbon (n-hexane) to an extent dependingon the rate of its formation. Assuming a single reaction where a sin-gle C–C bond is broken, the isotopic fractionation observed with ourmethod would be diluted by a factor 2 due to the symmetry of n-al-kanes: one methyl position is involved in the reaction whereas theother remains unaffected. Eventually, the two methyl positionscannot be distinguished from each other, and the final isotopiccomposition of the methyl position would be the average of theunaltered and altered positions. Therefore, the real isotope fraction-ation induced on the methyl position of newly formed n-alkanes

A. Gilbert et al. / Organic Geochemistry 62 (2013) 56–61 61
must be around 25‰, which is of the same order as that calculatedby Tang et al. (2000).
Thus, it seems likely that the intramolecular isotope distributionin n-alkanes from the G2 group is a consequence of the degradationof heavier n-alkanes. Yet, no indication can be obtained as towhether or not the thermal cracking giving rise to the light n-al-kanes analyzed here occurred in situ or during industrial processing.
Interestingly, the 13C depletion in the methyl position of n-al-kanes might influence the isotopic signature of the natural gasformed therefrom. Mathematical models attempting to understandthe isotopic composition of natural gas generally assume a homoge-neous isotope distribution in the source components (e.g. Chunget al., 1988). Although intramolecular isotope heterogeneity hasbeen thought to be partly responsible for the isotopic signature ofnatural gas, and especially the 13C depletion of CH4 from thermo-genic natural gas (Waples and Tornheim, 1978; Galimov, 2006),to our knowledge, this feature has never been demonstrated. Here,we show that the methyl position of n-alkanes can be 13C depletedby up to 13‰ compared with the other carbon atom positions. As aconsequence, the d13C value of methane formed therefrom via ther-mal cracking would be 13C depleted compared with that arisingfrom n-alkanes with a homogeneous intramolecular distribution.
5. Conclusions
Isotopic 13C NMR allows determination of the relative 13C iso-topomer ratios of the three terminal carbon atom positions of n-al-kanes (C11–C31) with 1.2‰ precision. Using commercially availablestandards, we show that this approach can potentially give insightsinto the biochemical processes responsible for the formation anddegradation of n-alkanes. Obviously, the conjectures made herewill have to be tested using samples of known origin (e.g. plants,petroleum). Nevertheless, it appears that the approach allows anew type of information to be obtained, which may be of impor-tance in biogeochemistry and in petroleum exploration.
Given the amount of sample necessary to run NMR measure-ments (> 100 mg), the technique could be used for the determina-tion of the relative isotopomer concentration in matrices wherethe n-alkane concentration is relatively high (e.g. crude oil). It isworth noting, however, that isotopic 13C NMR could be used tocorrect the d13C values of the fragments obtained by the on-linepyrolysis approach developed by Corso and Brenna (1999). Theintramolecular isotope distribution in the parent n-alkanes couldthen be reconstructed from the pyrolytic fragments, which wouldconsiderably decrease the required amount of sample. The ap-proach could then be used with a wider range of applications(e.g. biodegradation studies, lipid metabolism, biogeochemistryof sediments).
Acknowledgements
A. G. thanks the Ministry of Environment (MOE) for financialsupport (Global Environment Research Fund A-0904). The workwas partly supported by the Grant-in-Aid for Scientific Research(S) (23224013), MEXT, Japan. The authors are particularlythankful to V. Silvestre, S. Akoka and G. Remaud for help inestablishing the isotopic 13C NMR measurements. The authorsgreatly acknowledge J.M. Hayes and an anonymous reviewer forconstructive comments.
Appendix A. Supplementary material
Supplementary data associated with this article can be found, inthe online version, at http://dx.doi.org/10.1016/j.orggeochem.2013.07.004.
Associate Editor—I.D. Bull
References
Caytan, E., Botosoa, E.P., Silvestre, V., Robins, R.J., Akoka, S., Remaud, G.S., 2007a.Accurate quantitative 13C NMR spectroscopy: repeatability over time of site-specific 13C isotope ratio determination. Analytical Chemistry 79, 8266–8269.
Caytan, E., Remaud, G.S., Tenailleau, E., Akoka, S., 2007b. Precise and accuratequantitative 13C NMR with reduced experimental time. Talanta 71, 1016–1021.
Cheesbrough, T.M., Kolattukudy, P.E., 1984. Alkane biosynthesis by decarbonylationof aldehydes catalyzed by a particulate preparation from Pisum sativum.Proceedings of the National Academy of Sciences USA 81, 6613–6617.
Chikaraishi, Y., Naraoka, H., 2003. Compound-specific d13C analyses of n-alkanesextracted from terrestrial and aquatic plants. Phytochemistry 63, 361–371.
Chikaraishi, Y., Kaneko, M., Ohkouchi, N., 2012. Stable hydrogen and carbon isotopiccompositions of long-chain (C21–C33) n-alkanes and n-alkenes in insects.Geochimica et Cosmochimica Acta 95, 53–62.
Chung, H.M., Gormly, J.R., Squires, R.M., 1988. Origin of gaseous hydrocarbons insubsurface environments: theoretical considerations of carbon isotopedistribution. Chemical Geology 71, 97–104.
Corso, T.N., Brenna, J.T., 1999. On-line pyrolysis of hydrocarbons coupled to high-precision carbon isotope ratio analysis. Analytica Chimica Acta 397, 217–224.
De Niro, M.J., Epstein, S., 1977. Mechanism of carbon isotope fractionationassociated with lipid synthesis. Science 197, 261–263.
Galimov, E.M., 2006. Isotope organic geochemistry. Organic Geochemistry 37,1200–1262.
Gilbert, A., Silvestre, V., Robins, R.J., Remaud, G.S., 2009. Accurate quantitativeisotopic 13C NMR spectroscopy for the determination of the intramoleculardistribution of 13C in glucose at natural abundance. Analytical Chemistry 81,8978–8985.
Gilbert, A., Silvestre, V., Segebarth, N., Tcherkez, G., Guillou, C., Robins, R.J., Akoka, S.,Remaud, G.S., 2011. The intramolecular 13C-distribution in ethanol reveals theinfluence of the CO2-fixation pathway and environmental conditions on thesite-specific 13C variation in glucose. Plant, Cell & Environment 34, 1104–1112.
Hayes, J.M., Freeman, K.H., Popp, B.N., Hoham, C.H., 1990. Compound-specificisotopic analyses: a novel tool for reconstruction of ancient biogeochemicalprocesses. Organic Geochemistry 16, 1115–1128.
Hayes, J.M., 1993. Factors controlling 13C contents of sedimentary organiccompounds: principles and evidence. Marine Geology 113, 111–125.
Monson, K., Hayes, J., 1980. Biosynthetic control of the natural abundance of carbon13 at specific positions within fatty acids in Escherichia coli. Evidence regardingthe coupling of fatty acid and phospholipid synthesis. Journal of BiologicalChemistry 255, 11435–11441.
Monson, K., Hayes, J., 1982. Biosynthetic control of the natural abundance of carbon13 at specific positions within fatty acids in Saccharomyces cerevisiae. Isotopicfractionation in lipid synthesis as evidence for peroxisomal regulation. Journalof Biological Chemistry 257, 5568–5575.
Silvestre, V., Mboula, V.M., Jouitteau, C., Akoka, S., Robins, R.J., Remaud, G.S., 2009.Isotopic 13C NMR spectrometry to assess counterfeiting of activepharmaceutical ingredients: site-specific 13C content of aspirin andparacetamol. Journal of Pharmaceutical and Biomedical Analysis 50, 336–341.
Tang, Y., Perry, J.K., Jenden, P.D., Schoell, M., 2000. Mathematical modeling of stablecarbon isotope ratios in natural gases. Geochimica et Cosmochimica Acta 64,2673–2687.
Tenailleau, E., Lancelin, P., Robins, R.J., Akoka, S., 2004. NMR approach to thequantification of nonstatistical 13C distribution in natural products: vanillin.Analytical Chemistry 76, 3818–3825.
Tenailleau, E., Akoka, S., 2007. Adiabatic 1H decoupling scheme for very accurateintensity measurements in 13C NMR. Journal of Magnetic Resonance 185, 50–58.
Waples, D.W., Tornheim, L., 1978. Mathematical models for petroleum-formingprocesses: carbon isotope fractionation. Geochimica et Cosmochimica Acta 42,467–472.
Zhou, Y., Grice, K., Stuart-Williams, H., Farquhar, G.D., Hocart, C.H., Lu, H., Liu, W.,2010. Biosynthetic origin of the saw-toothed profile in d13C and d2H of n-alkanes and systematic isotopic differences between n-, iso- and anteiso-alkanesin leaf waxes of land plants. Phytochemistry 71, 388–403.