ExPLAINTM-WAX: CAUSAL ANALYSIS OF GENE BATTERIES AND IDENTIFICATION OF KEY NODES IN SIGNAL...
16
Appl. Comput. Math., V.9, Special Issue, 2010, pp.34-49 ExPLAIN TM - WAX: CAUSAL ANALYSIS OF GENE BATTERIES AND IDENTIFICATION OF KEY NODES IN SIGNAL TRANSDUCTION NETWORKS BECKER S. 1 , HOMEYER N. 1 , KONOVALOVA T. 1 , STEGMAIER P. 1 , LEWICKI-POTAPOV B. 1 , VOSS N. 1 , KEL A. 1, 2 Abstract. Batteries of genes whose expression is changed in unison through different cellular normal and pathological processes are regulated by very specific class of nuclear proteins - tran- scription factors (TFs). Activity of TFs is, in turn, governed by signal transduction pathways in response to intracellular and extracellular signals. In cases of diseases, aberrant activity of a few key regulatory molecules in such pathways can lead to a global shift in expression of gene batteries in the cell resulting in a disease phenotype. Novel computational tools are needed for automatic analysis of large collections of gene battery expression data in the context of signal transduction and gene regulatory pathways and for identification of key nodes in disease networks. We developed an integrated computational system ExPlain TM (www.biobase.de), for causal interpretation of gene expression data and identification of key signaling molecules whose aber- ration may lead to diseases. The ExPlain TM system is based on high quality manually curated databases on gene regulatory mechanisms: TRANSFACr and TRANSPATH§. ExPlain TM integrates several algorithms for identification of transcription factor binding sites (Match TM , F-Match, P-Match) and their function-specific combinations, composite regulatory modules (Composite Module Analyst TM ) with network analysis algorithm, KNA (Key Node Analyst), which is a highly optimized network search engine that analyzes signal transduction networks controlling the activities of the corresponding TFs and seeks for key node molecules responsible for the observed concerted gene expression changes. The key node molecules resemble prospec- tive therapeutic targets or disease biomarkers. In this paper we describe a novel high-throughput workflow automatization system, WAX (Workflow Automat for ExPlain TM ). We applied WAX to the full collection of genes encoding components of the most important canonical cellular pathways. In 50% of the analyzed pathways ExPlain TM proposed a positive regulatory loops that regulate the activity of these pathways. Key nodes of such feedback circuits can be regarded as “Achilles Heels” of the cells, whose dysfunction frequently causes diseases. Keywords: Microarray Data Analysis, Promoter Analysis, Transcription Factors, Composite Elements, Signal Transduction, Drug Targets. AMS Subject Classification: 62-07, 68T10, 92-08. 1. Introduction Combating complex diseases such as cancer and diabetes is a major challenge in modern medicine, and has become a socially and economically important issue. Understanding the dis- ease mechanisms is the key to rationalize drug development. It becomes clear now that the life of all cells of our body is governed by complex molecular mechanisms of receiving and processing 1 BIOBASE GmbH, Halchtersche Str. 33, D-38304 Wolfenbttel, Germany 2 A.P. Ershov’s Institute of Informatics Systems, 6, Lavrentiev ave., 630090 Novosibirsk, Russia Manuscript received 7 April, 2009. 34
Transcript of ExPLAINTM-WAX: CAUSAL ANALYSIS OF GENE BATTERIES AND IDENTIFICATION OF KEY NODES IN SIGNAL...
Appl. Comput. Math., V.9, Special Issue, 2010, pp.34-49
ExPLAINTM - WAX: CAUSAL ANALYSIS OF GENE BATTERIES ANDIDENTIFICATION OF KEY NODES IN SIGNAL TRANSDUCTION
NETWORKS
BECKER S.1, HOMEYER N.1, KONOVALOVA T.1, STEGMAIER P.1,
LEWICKI-POTAPOV B.1, VOSS N.1, KEL A.1,2
Abstract. Batteries of genes whose expression is changed in unison through different cellular
normal and pathological processes are regulated by very specific class of nuclear proteins - tran-
scription factors (TFs). Activity of TFs is, in turn, governed by signal transduction pathways
in response to intracellular and extracellular signals. In cases of diseases, aberrant activity of a
few key regulatory molecules in such pathways can lead to a global shift in expression of gene
batteries in the cell resulting in a disease phenotype. Novel computational tools are needed
for automatic analysis of large collections of gene battery expression data in the context of
signal transduction and gene regulatory pathways and for identification of key nodes in disease
networks.
We developed an integrated computational system ExPlainTM (www.biobase.de), for causal
interpretation of gene expression data and identification of key signaling molecules whose aber-
ration may lead to diseases. The ExPlainTM system is based on high quality manually curated
databases on gene regulatory mechanisms: TRANSFACr and TRANSPATH§. ExPlainTM
integrates several algorithms for identification of transcription factor binding sites (MatchTM ,
F-Match, P-Match) and their function-specific combinations, composite regulatory modules
(Composite Module AnalystTM ) with network analysis algorithm, KNA (Key Node Analyst),
which is a highly optimized network search engine that analyzes signal transduction networks
controlling the activities of the corresponding TFs and seeks for key node molecules responsible
for the observed concerted gene expression changes. The key node molecules resemble prospec-
tive therapeutic targets or disease biomarkers. In this paper we describe a novel high-throughput
workflow automatization system, WAX (Workflow Automat for ExPlainTM ). We applied WAX
to the full collection of genes encoding components of the most important canonical cellular
pathways. In 50% of the analyzed pathways ExPlainTM proposed a positive regulatory loops
that regulate the activity of these pathways. Key nodes of such feedback circuits can be regarded
as “Achilles Heels” of the cells, whose dysfunction frequently causes diseases.
Keywords: Microarray Data Analysis, Promoter Analysis, Transcription Factors, Composite
Elements, Signal Transduction, Drug Targets.
AMS Subject Classification: 62-07, 68T10, 92-08.
1. Introduction
Combating complex diseases such as cancer and diabetes is a major challenge in modernmedicine, and has become a socially and economically important issue. Understanding the dis-ease mechanisms is the key to rationalize drug development. It becomes clear now that the lifeof all cells of our body is governed by complex molecular mechanisms of receiving and processing
1 BIOBASE GmbH, Halchtersche Str. 33, D-38304 Wolfenbttel, Germany2 A.P. Ershov’s Institute of Informatics Systems, 6, Lavrentiev ave., 630090 Novosibirsk, Russia
Manuscript received 7 April, 2009.
34
KEL A. ET AL: ExPLAINTM - WAX: CAUSAL ANALYSIS ... 35
of signals coming from outside of the cell membrane as well as intracellular signals. Signals triggerthe cell fate by controlling such intracellular programs as cell cycle, differentiation, metabolismor even apoptosis (the programmed cell death). Impairment of the signaling mechanisms ofcells are often the primary cause of complex diseases. Different intracellular signal transductionpathways often converge at key molecules that master the regulation of many cellular processes.Revealing of such crossroads of signaling networks can help to understand the causal mechanismsof diseases and provides a rational way of selecting most perspective drug targets and diseasebiomarkers.
Recently developed various high-throughput methods for measuring the global expressionof genes and proteins provide a huge amount of data that correspond to various normal andpathological states of the living systems. Extensive application of these technologies in manydifferent fields of biology and medicine generates enormous amount of mass data. However, theavailable capacities to interpret these data and to filter candidate targets for drug developmentis very limited. In many cases, interpretation of the data is done by manual inspection ofbulky lists of gene names by experts. More advanced computer-aided interpretation of thesedata make use of Gene Ontology, and map the product of the genes found to be affected undercertain conditions to various functional groups (e.g. GoMiner tool [11]. This approach generallyallows only to draw conclusions about the effects of the observed gene induction phenomena,but does not provide any direct clue on their causes.
However, it becomes clear now that reliable identification of potential drug targets and diseasebiomarkers requires a clear explanation of the causes of the observed gene expression changes inthe pathological situations. Earlier, we have developed a novel computational tool, ExPlainTM
[4] for causal interpretation of gene expression data. First of all, promoters of differentiallyexpressed genes are analyzed and specific combinations of transcription factors (CompositeModules) regulating these genes are hypothesized. Next, analysis of the signal transductionnetwork upstream of these transcription factors allows us to reveal key signaling molecules thatcan master the observed gene expression profile. The method utilizes data from three databases(TRANSFACr, TRANSPATHr and HumanPSD, http://www.biobase-international.com/ ).The ExPlainTM tool was recently validated in a number of successful applications to the anal-ysis of various gene expression data [3, 8, 12]. In spite of these promising results, its wideapplication to mass data is limited by manual execution of the algorithms. There is a clear needfor an automatic system which would be able to execute large amount of data analysis sessionsin a parallel fashion. Such a system should be able to perform fairly complex scenarios of severalconsecutive steps of analysis and to maintain a simple level control of the validity of the resultsobtained at each step of the analysis in order to execute decisions about the further steps of theanalysis in the scenario. Such a system should be generic enough to store and execute variousscenarios of the analysis of the data.
In this paper we describe a new tool, WAX (Workflow Automat for ExPlainTM ) for a scenario-based workflow execution of causal analysis of gene expression data. It performs an automaticiterative execution of the so called “upstream analysis workflow”, which includes several analysisfunctions of the ExPlainTM system: 1) loading multiple gene expression data as lists of differen-tially expressed genes; 2) retrieving promoters of these genes from the TRANSProTM database;3) identification of statistically overrepresented sites for transcription factors (TF) in these pro-moters using F-MatchTM [5] based on the TRANSFACr database; 4) identification of compositeregulatory modules (cis-regulatory modules) using Composite Module Analyst (CMA) [1] andprediction of TFs responsible for observed differential gene expression; 5) pathway analysis of
36 APPL. COMPUT. MATH., V.9, SPECIAL ISSUE, 2010
predicted TFs based on TRANSPATHr database and identification of signal transduction keynodes potentially responsible for triggering the activity of these TFs in a concerted manner.
Here we applied ExPlainTM and WAX to analyze signal transduction pathways whose aberra-tions often cause various complex diseases. We demonstrate that “upstream analysis approach”of gene expression data allows to reveal the correct pathways, whereas the traditional “down-stream analysis approach” is not able to find the correct pathway. Then, we applied WAX foran automatic analysis of the full collection of genes encoding components of most importantcellular canonical pathways. In 50% of the pathways analyzed the positive regulatory loopswere proposed to regulate the activity of these pathways. Key nodes of such feedback circuitsare the “Achilles Heels” of the cells, whose dysfunction often causes diseases.
2. Data and methods
2.1. Databases used in the study. Current, most up-to-date knowledge on full signal trans-duction and gene regulatory networks in mammalian organisms is stored in two databases:TRANSFACr and TRANSPATHr.
In TRANSPATHr, signaling pathways and networks are stored as a bipartite directed graphs[6]. It contains molecules and reactions as separate nodes, which are subject to complex hier-archies. TRANSPATHr records information about all functionally active variants of polypep-tide molecules including individual splice variants, various post-translational modifications (likephosphorylated forms), as well as protein complexes and complexes of polypeptides with smallmolecules. The database also stores generalized information about families of molecules, likefamilies of receptors, cytokines, chemokines and others. Groups of subsequent reactions arejoined to so-called “chains” and “pathways” which represent functionally connected parts ofthe full signal transduction network. Reactions between molecules are of two types – mech-anistic and semantic. Semantic reactions represent the signal flow in the signal transductionpathways, whereas the mechanistic reactions show details of the molecular interactions at eachpathway step. Presently, TRANSPATHr has 114,210 molecule and 161,813 reaction entriesand describes more than 1500 pathways and chains.
TRANSFACr [7] is a database on eukaryotic transcription factors (TFs) and their bind-ing sites, which regulate gene expression. One of the most important parts of TRANSFACris a comprehensive library of TF DNA-binding profiles (positional weight matrices, PWMs).TRANSFACr and its structure became standard in the field of gene regulation and is usedin many studies for analysis of gene regulation and identification of potential binding sites fortranscription factors in order to predict gene regulatory mechanisms. Presently, TRANSFACrhas 12,183 TF entries (includes miRNAs), 24,745 TF sites and 858 PWMs.
2.2. Tools. We use the MatchTM [2] method implemented in ExPlainTM to search for potentialTF inding sites (TFBS) in nucleotide sequences using position weight matrices (PWMs) fromTRANSFACr . Statistically significant overrepresentation of TFBSs in a promoter set of dif-ferentially expressed genes is revealed with the tool F-MatchTM [5]. F-MatchTM is optimizingcut-offs of PWMs in order to identify the highest site frequency ratio between foreground andbackground sets of promoters. Statistical significance of the site over-representation is estimatedby binomial and Fisher’s tests.
A composite module (CM) is a particular combination of PWMs for different TFs, which isassociated with a specific functional type of gene regulatory regions. CM analysis is performedusing the CMA (Composite Module Analyst) method, which is implemented in ExPlainTM and

KEL A. ET AL: ExPLAINTM - WAX: CAUSAL ANALYSIS ... 37
based on a genetic algorithm [1] Each CM is characterized by a specific scoring function thatcan be calculated for any gene promoter X:
FCM (X) = f(W,T, c1, ..., cK , d1, ..., dR, o1, ..., oE) (1)
here, W and T parameters describe the extent of the sequence window and its position relativeto the transcription start site (TSS); ciare the score cut-offs of K position weight matrices thatare included into the CM; di and oi are the parameters defining mutual distances and mutualorientations of the sites constituting the CM. The function f can be linear, non-linear or Booleandepending on the mathematical model that is used to describe the CM.
In order to identify key regulators of signal transduction networks of the cell whose malfunctioncan alter of the expression of large gene sets in the diseased cell we have developed a key-nodesearch algorithm, Key Node Analyst (KNA), which is integrated in ExPlainTM and allows data-driven search for key upstream regulators in the signal transduction network composed of theknown experimentally verified reactions annotated in TRANSPATHr .
KNA starts its upstream search from an input of a list of so called “end-node” molecules,which are considered as end nodes receiving the signal in a cascade of signal transduction. Alist of TFs, which have been proposed in the previous step of the analysis (e.g. TFs linked tothe PWMs of the best discriminating CM), is used as input for KNA. The program searches forso-called “key nodes” (or key molecules) in the signal transduction network upstream from theend-node molecules in such a way that a signal from these key molecules can reach the maximalnumber of end-node molecules through a minimal number of steps (and by reaching a minimalnumber of other molecules). By this way the program can find molecules providing coordinatedsignal transduction and, in the case of transcription factors, it can suggest a “master-regulator”of differentially expressed genes.
While searching for key nodes starting from TFs found in a set of up-regulated genes, an userof KNA gets the possibility to add this set of up-regulated genes as a “secondary gene set”. So,the KN algorithm will try to follow passes that are going through the products of the genes ofthe “secondary gene set”. Through this option, we consider possible autoregulation loops of thegenes under analysis. Thus, the KNA algorithm will find such key nodes whose downstreamnetworks exhibit a maximal number of autoregulation loops.
2.3. WAX (Workflow automat for ExPlainTM).The new tool, WAX (Workflow Automat for ExPlainTM ) for scenario-based workflow execu-
tion of a causal analysis of gene expression data performs an automatic iterative execution ofthe “upstream analysis workflow” described above. WAX is written in Java and in Perl. Usercreates a configuration file, where all tools for the workflow are defined and the order of the dataflow is specified. WAX includes a set of converters that transforms output of one tool into agene set, which in turn is used as the input of another tool (see Fig. 1). It also includes simpledecision operations which evaluate the output parameters and decide if the achieved scores areabove specified critical values to proceed further to the next tool. All the parameters of all toolsand the number of iterations are defined at the initial step. After that, the process is launchedand iteratively executed. The output report contains a summary of all executions and final listof potential key nodes and pathways with corresponding scores.

38 APPL. COMPUT. MATH., V.9, SPECIAL ISSUE, 2010
Figure 1. A workflow diagram of a typical scenario of WAX tool. User can specify an order of execution of
various tools. The outputs of all tools are transformed into gene sets (here, shown as a stacks of three green lines),
which are then used by other tools as their input.
3. Main results
3.1. Analysis of TNF-alpha pathway. In order to understand the major principles of func-tioning of complex eukaryotic signal transduction pathways we analyzed gene expression datagenerated from a cell culture after specific stimulation of a particular pathway. In a previouslypublished experimental work [9], Viemann with coauthors have studied TNF-alpha pathways- one of the most important signal transduction pathway activated during inflammatory pro-cesses. Tumor necrosis factor alpha (TNF-alpha) is also known as one of the most importantpromoters of inflammation. It is known, that inflammatory processes are critically determinedby the response of the vascular endothelium to extracellular injury. Therefore, Viemann withcoauthors have treated macrovascular human umbilical vein endothelial cells (HUVEC) withTNF-alpha and performed Affymetrix-based microarray experiments to measure the gene ex-pression changed after TNF-alpha stimulation.
We have downloaded the original gene expression data from GEO (accession number:GSE2639)and performed a standard statistical analysis using t-test. We uploaded into ExPlainTM soft-ware the full list of genes whose expression was measured by 8 Affymetrix arrays in untreatedcells (4 arrays) and TNF-alpha treated cells (4 arrays). By applying standard t-test we identified184 significantly up-regulated and 137 down-regulated genes (p-value < 0.01).
In the following analysis we asked a fairly straightforward question: would it be possibleto reveal the true original signal – the TNF-alpha signaling molecule, in this case, – from themicroarray array without including prior knowledge about this true signal? This would mimicthe real situation, where the researcher studying a biological phenomenon like inflammation ora complex disease and trying to identify the TRUE molecular cause of the disease.

KEL A. ET AL: ExPLAINTM - WAX: CAUSAL ANALYSIS ... 39
3.1.1. Mapping on canonical pathways. We performed mapping of differentially expressedgenes (up and down- regulated) on canonical pathways in TRANSPATHr database using re-spective functionality of ExPlainTM system (“downstream analysis”). Results of the mappingare shown in the Table 1.
Table 1. Mapping of the differentially expressed genes (products of genes) on canonical signal tranduction
pathways and chains. “#Hits in groups” – number of gene products from the full list of differentially expressed
genes mapped on the respective canonical pathways. “Group size” – number of proteins in the respective pathway.
P-value – the p-value calculated based on Fisher’s test.
Pathway name Molecule name (gene prod-uct)
#Hitsingroup
Groupsize
p-value
EDAR —> NF-kappaB Bcl-3, IkappaB-alpha, IkappaB-beta, IkappaB-epsilon
4 10 7.61601E-05
IL-8 —> ERK2 G-alpha-i-1, GROalpha, IL-8,MEK1
4 19 0.00118005
RANKL —> p38 Bcl-3, IkappaB-alpha,IkappaB-beta, IkappaB-epsilon
4 22 0.00210125
EDAR pathway Bcl-3, CYLD, IkappaB-alpha,IkappaB-beta, IkappaB-epsilon
5 37 0.00227234
MEK —> ABP-280 ERK3, MEK1, RSK3 3 12 0.00308263Apo2L —> Caspase-10 Apo2L, DR5 2 4 0.00383441Apo2L —Caspase-8—>
Caspase-3Apo2L, DR5 2 5 0.00628431
Apo2L —> Caspase-7 Apo2L, DR5 2 5 0.00628431Apo2L —Caspase-10—>
Caspase-3Apo2L, DR5 2 5 0.00628431
IFN pathway IFNGR, IFNGR2, STAT5A,Tyk2
4 30 0.00674461
IFNalpha, IFNbeta,IFNgamma —> Rap1
IFNGR, IFNGR2, Tyk2 3 17 0.00868874
IL-4 —> STAT6 IL-4Ralpha, STAT6 2 6 0.00926986IL-4 - STAT6 pathway IL-4Ralpha, STAT6 2 6 0.00926986. . .11 chains andpathways. . .TNF-alpha —> p50:RelA-p65
IkappaB-alpha, p62 2 18 0.0775233
. . .52 chains andpathways. . .TNF-alpha pathway IkappaB-alpha, p62 2 51 0.383762. . .

40 APPL. COMPUT. MATH., V.9, SPECIAL ISSUE, 2010
As one can see from the results of the mapping, this approach is not able to identify the truesignal (TNF-alpha). The cut-off of significant p-value (p<0.01) was far below the full “TNF-alpha pathway” (p-value = 0.3837 – non significant) or the chain “TNF-alpha —> p50:RelA-p65” (p-value =0.0775233 – non significant). The mapping reveals the following significantpathways: EDAR pathway and IFN pathway as well as several chains leading to activation oftranscription factors NF-kB and STAT6 and to the activation of p38 and Caspases. It is clear,that after treatment of the cells by TNF-alpha, as a consequence, a number of pathways wereactivated triggering various intracellular processes, which have been revealed by such mappingapproach. But the cause/reason of all such changes – TNF-alpha has not been revealed by thismethod.
These results clearly demonstrate that simple direct mapping on the canonical pathways, theapproach most commonly applied by publicly available and commercial software, often does notreveal the true causality signal. More sophisticated techniques of causal pathway analysis areneeded.
In this work, we describe the “upstream analysis workflow” algorithm which helps to identifythe true causality signals in normal and pathological cellular processes.
3.1.2. Promoter analysis fi. The first and the most important reason of the failure of thedirect mapping to reveal the true causes of intracellular changes is very little knowledge of allpossible gene regulatory events in the cells. The biggest gap of knowledge is lack of informationabout regulatory binding sites of numerous transcription factors (TFs) in promoters, enhancersand silencers of their target genes.
Unfortunately, the available experimental information about verified transcription factor bind-ing sites (TFBS) or other data about TF-target gene relations is still very limited. Assuming anumber of ˜30,000 genes in the human genome with 50-100 TFBS per gene (e.g. Rat PEPCKgene has got 77 documented TF binding sites), number of sites can be up to 3,000,000 TFBSin the human genome. The TRANSFAC database – the most comprehensive TFBS database inthe world, documents up to now about 2400 human TFBS, or less than 0.1% of what we couldexpect; another, very conservative estimate resulted in a maximum of 1% known TFBS of theamount to be expected [10]. Thus, in order to overcome the incompleteness of the data andbuild the signal transduction paths from receptors to genes, we fully depend on reliable methodsfor predicting TFBS.
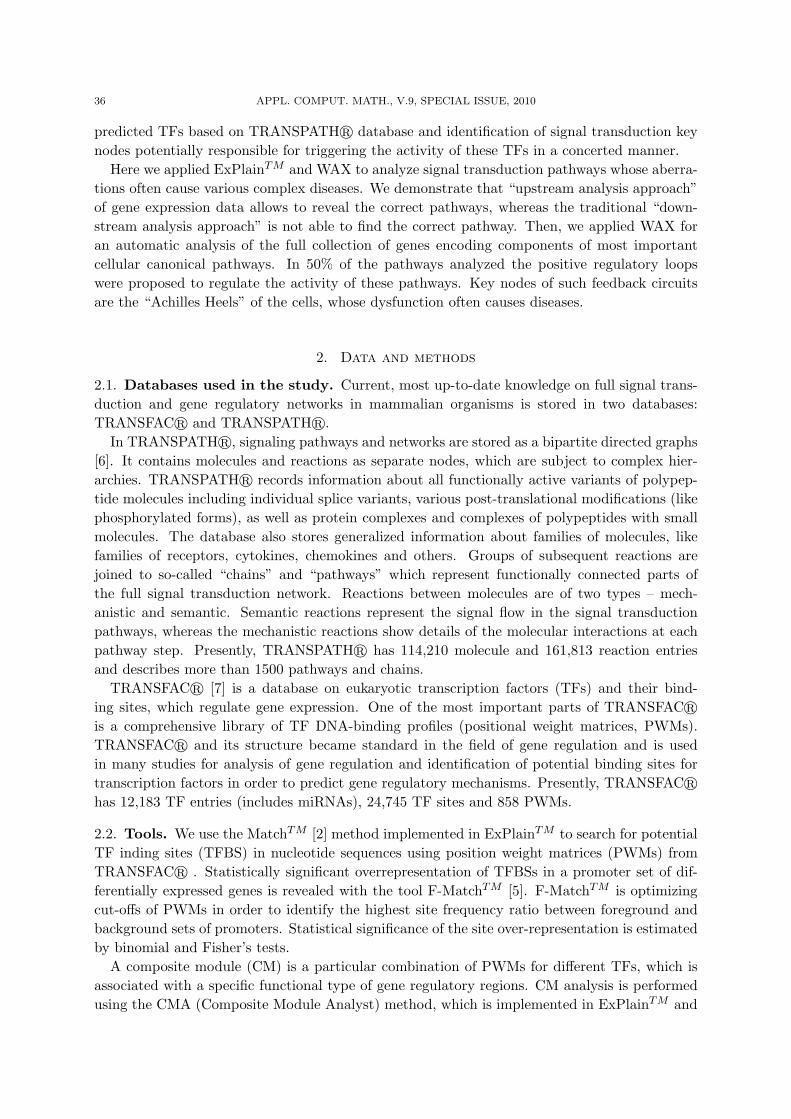
The first step of the upstream analysis workflow is analysis of promoters of differentiallyexpressed genes and identification of TFBSs and therefore transcription factors potentially re-sponsible for differentially regulated genes. TFBSs are identified by two methods: F-MatchTM
and CMA. Principles of these two methods are described in the Method section.We applied the promoter analysis methods to the set of up-regulated genes (184 genes). F-
MatchTM analysis was performed with the background set of 1255 genes whose expression didnot change significantly upon TNF-alpha treatment (FC = 1.0 +/- 0.01). Results of F-MatchTM
analysis are shown in the Fig.2.
KEL A. ET AL: ExPLAINTM - WAX: CAUSAL ANALYSIS ... 41

42 APPL. COMPUT. MATH., V.9, SPECIAL ISSUE, 2010
Figure 2. A) Results of F-Match promoter analysis of up-regulated genes (UP) after TNF-alpha treatment
compared to the promoters of non-changed genes (NC).”Yes” – frequency of the respective sites in the promoters
of UP genes (sites per promoter of [–1000 +100] length); “No” – frequency of the respective sites in the background
set NC; “Yes/No” – frequency ratio; Pvalue – p-value calculated using binomial distribution; “Matched promoters
Pvalue” - p-value calculated based on Fisher’s test. B) Distribution of frequency of TFBS found in the promoters
of up-regulated genes.
First of all, the most significant overrepresentation in promoters of up-regulated genes uponTNF-alpha treatment is demonstrated by sites of TFs belonging to the NF-kappaB family. Thisis not a surprise, since it is a well known fact that NF-kappaB factors are the most importantfactors in providing inflammatory response of the TNF-alpha stimulation. However, these arenot the only transcription factors which are involved in this biological process. We can seethat binding sites for factors of IRF, ETS and STAT families also show a highly significantoverpresentation in the up-regulated promoters. In Fig.2B, one can clearly see that most of theidentified sites are located in close proximity of the TSS (up to –500).
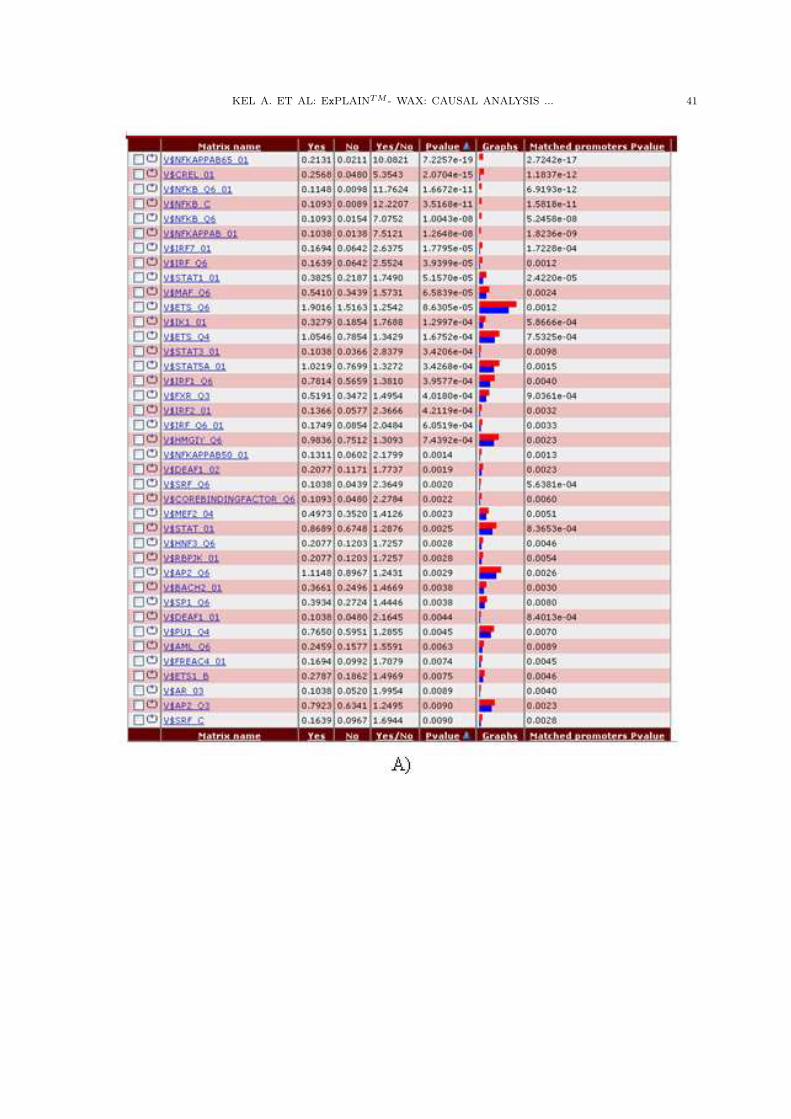
In order to understand the complex pattern of site composition in the proximal parts ofup-regulated promoters we applied the CMA program. Results of CMA analysis are shown inFig.3.
A)Matrix1 Cut-off1 Distance Matrix2 Cut-off2V$AP1 Q2 0.939500 [7..85] V$CREB Q4 0.877500V$EBOX Q6 01 0.976500 [32..80] V$SMAD Q6 01 0.933500V$ELF1 Q6 0.892500 [3..94] V$IRF1 01 0.865500V$CETS168 Q6 0.889000 [30..94] V$SP3 Q3 0.828500V$CREL 01 0.980500 [10..79] V$NERF Q2 0.736500V$CETS168 Q6 0.826000 [50..80] V$STAT5A 02 0.734500V$NFKAPPAB 01 0.925500 [8..70] V$TAXCREB 02 0.628000V$ELF1 Q6 0.919500 [3..94] V$IRF Q6 01 0.956500
T-test p-value: 2.5852e-28FP: 8.11%FN: 29.27%
KEL A. ET AL: ExPLAINTM - WAX: CAUSAL ANALYSIS ... 43
Figure 3. Results of CMA promoter analysis of up-regulated genes (UP) after TNF-alpha treatment compared
to the promoters of non-changed genes (NC). The length of promoters analysed was taken [–500 +100]. A)
The promoter composite model (CM1) consisting of 8 pairs of position weight matrices (PWMs). Matrix1 and
Matrix2 are identifiers of PWMs in TRANSFACr database; Cut-off1 and Cut-off2 are respective cut-offs of the
PWMs calculated by CMA; “Distance” is the minimal and maximal distance between sites of the two matrices in
promoter sequences calculated by CMA. B) Two distributions of the “composite score” of the composite model
CM1 consisting of 8 PWM pairs, in promoters of up-regulated genes (red bars) and non-changed genes (blue bars)
(FP –false positives; FN –false negatives; with the Score cut-off =0.35) . C) Example of complex structure of the
proximal promoter region of the TNFAIP3 gene which is highly induced upon TNF-alpha treatment.
CMA analysis allowed us to identify the set of most important TF pairs involved in the up-regulation of the majority of the genes in the HUVEC cells upon TNF-alpha stimulation. Asone can see in Fig. 3, two distributions (UP and NC) are clearly separated (highly significantt-test p-value), which confirms that identified combination of TFs is specifically characterizesthe causality of the up-regulated gene battery. The CMA method is also allowed us to proposethe complex composite structure of the promoters of up-regulated genes. Overlapping pairssuch as NF-kappaB – CREB and EBOX-SMAD, which we can find, e.g., in the promoter of

44 APPL. COMPUT. MATH., V.9, SPECIAL ISSUE, 2010
the TNFAIP3 gene, demonstrate an extremely complex pattern of interactions of transcriptionfactors during realization of the intracellular program in response to TNF-alpha stimulation.
Now, knowing the set of the most important transcription factors involved in the realizationof the gene regulatory programs in response to the external stimulus, we can try to follow thesignaling paths upstream of these transcription factors in order to identify the true causalitysignal, which can trigger the activity of the considered set of transcription factors. Therefore,the next step of the upstream analysis workflow is “key-node analysis”.
3.1.3. Key-node analysis. The key-node analysis was performed with the help of the respec-tive function in the ExPlainTM system. We joined all transcription factors found by F-MatchTM
and CMA analysis together in order to use full information obtained during the previous steps.We obtained 58 PWMs linked to 140 different transcription factors. Due to the prolonged stim-ulation period (many hours), we assumed that these TFs were not only directly triggered byTNF-alpha signaling itself, but also by secondary effects, when the initial TNF-alpha signaltriggered the activity of subsequent (“secondary”) pathways, which, in turn, activated some ofthe TFs in the list. Sorting out the primary and secondary pathways is the major challenge ofthe key-node analysis.
In the absence of time series data, which would help to separate the primary and secondarypathways, the only hope to identify the true primary pathway is due to its dominance (diseasepathways very often become the most active pathway in the target cells, as the TNF path-way should be upon prolonged TNF-alpha treatment) and due to auto-regulatory loops in thecells that exist to maintain the most dominant pathway. The role of auto-regulatory loops isillustrated in Fig. 4.
Figure 4.A scheme of activation of auto-regulation loops during maintaining of a signal transduction pathway.
A) Signal transduction pathways is inactive. TFs (yellow trapezoid) is not active. Gene battery is repressed. B)
Signal transduction pathway is activated by a ligand (red triangle). TFs are active (red trapezium) switching
on the gene battery. Genes encode components of the same pathway – positive feedback loops (green arrows

KEL A. ET AL: ExPLAINTM - WAX: CAUSAL ANALYSIS ... 45
pointing to the increased sizes of the respective products) Such feedback loops may provide maintenance of the
stable pathway activity.
Taking into account the possible auto-regulation loops we run the key-node analysis algorithmusing as the input the full set of TFs combined with all their targets among up-regulated genesrevealed by the microarray experiment after stimulation of the HUVEC cells by TNF-alpha.The target genes for the considered set of TFs were identified from the results of F-MatchTM
(promoters containing at least 15 TFBS for all TFs considered) and results of CMA analysis(promoters exceeding the composite score higher then 0.54). As a results, the input set ofkey-node analysis contained 246 proteins, among them, 115 TFs, 20 ligands- cytokines andchemokines, 14 membrane-transducing components, 6 protein kinases, 6 adaptor proteins, andother components of signal transduction network of the cells.
The key node analysis has been performed with the default basic parameters (distance thresh-old=4, connectivity penalty = 8). We applied the option: “Follow curated chains” with “Per-sistence reward” =1.0, in order to identify all possible known long-ranging connections betweenextracellular ligands and TFs. The result of the key-node search is shown in Fig.5.

46 APPL. COMPUT. MATH., V.9, SPECIAL ISSUE, 2010
Figure 5. Results of the key-node analysis of the combined set of proteins: TFs revealed by promoter analysis of
up-regulated genes upon TNF-alpha stimulation and products of the up-regulated genes which are targets of these
TFs. A) Screenshot of ExPlainTM system with the results of the key-node analysis. TNF-alpha was found as the
first ranking causality key node. So, the upstream analysis reveals the TRUE signal in the TNF-alpha stimulated
HUVEC cells. “#hits in the network”(n) – the number of end-node molecules, that can be reached from the
key-node; “#Non-relevant reachable nodes”(m) – the number of all other nodes in the full signal transduction
graph, that can be reached from the key node; “Score” – the key-node score which is computed from the values n
and m and taking all parameters of the search into account. The higher the score, the higher the reliability of the
key node. B) Representation of the key-node (red coloured triangle at the top) and the sub-network connecting
the key node and the end-node molecules (blue coloured figures). The blue figures represent transcription factors
identified at the previous step of the analysis (trapeziums) and other molecules up-regulated in response to TNF-
alpha treatment (marked by red bars, that indicate the level of upregulation). Molecules represented by inverse
triangles are ligands.
So, as one can see from the results of the key-node analysis, the upstream analysis approachwas able to identify the true signal, TNF-alpha, as the fist ranked causality key node. Twomajor paths of the signals have been hypothesized: through TRADD-TRAF2-p38 leading tothe activation of the NF-kappaB and IRF transcription factors and through JNK1 leading toactivation of many important transcription factors, such as c-Jun, Smad3, Elk1 and others. Itis interesting to see that activation of Stat factors might be a result of the cross-talk betweenthese two signaling paths in the system. It is important to emphasize that the majority of thetranscription factors acting in the system does not exhibit a significant change of expression.Only few, like IkappaB, JunB and Stat6 and Smad3 show the expression change, whereas, changeof the activity of other factors is identified by the change of regulation of their target genes. Most

KEL A. ET AL: ExPLAINTM - WAX: CAUSAL ANALYSIS ... 47
probably, those factors experience a significant change in their phosphorylation level, which istriggered by upstream signaling cascades.
3.2. Automatic analysis of pathways with WAX. In order to understand the role of theauto-regulatory loops in functioning of signal transduction pathways we performed a study ofa big collection of known canonical signal transduction pathways and applied the upstreamanalysis workflow in an automatic fashion using the WAX (Workflow Automat for ExPlain)tool. We applied WAX to the set of 23 biggest canonical pathways from TRANSPATHrdatabase. These pathways were generated by manual curation of scientific literature. Knownexperimentally proven signal transduction reactions were put together into sequences/chains ofreactions which, based on the experimental evidences, are known to work together providingsignaling regulation of particular cellular processes. A list of the pathways analyzed is given inTable 2.
Table 2. Results of analysis of canonical signal transduction pathways from the TRANSPATHrdatabase using the WAX tool. Upstream analysis workflow was applied to all genes of threespecies (human, mouse and rat) encoding components of a pathway. “n” – is the number of keynodes identified; “N” = 48857 – the full number of proteins in all TRANSPATH pathways; “M”– number of proteins belonging to the respective pathway; “m” – number of key nodes (out of“n”) belonging to the pathway.
Pathway n m M p=n/N r=m/M r/p p-valueRANKL pathway 41 3 36 0.00083918 0.08333333 99.30 2.8592E-08TLR4 77 2 14 0.00157603 0.14285714 90.64 1.4065E-06TNF-alpha pathway 52 2 26 0.00106433 0.07692308 72.27 3.0777E-06P38 pathway 80 2 23 0.00163743 0.08695652 53.11 7.5865E-06Fas pathway 64 2 37 0.00130995 0.05405405 41.26 1.6892E-05B-cell antigen receptorpathway
90 2 33 0.00184211 0.06060606 32.90 3.2721E-05
Htt pathway 27 1 33 0.00055263 0.03030303 54.83 0.00015942Neurotensin pathway 58 1 21 0.00118714 0.04761905 40.11 0.00029154IL-1 pathway 46 1 32 0.00094152 0.03125 33.19 0.00043149Wnt pathway 56 1 29 0.0011462 0.03448276 30.08 0.00052251Caspase network 122 1 20 0.00249708 0.05 20.02 0.00114979PDGF 79 1 31 0.00161696 0.03225806 19.95 0.00117841Tuberin pathway 50 0 20 0.00102339 0 0.00 0.02027012HIF-1 alpha pathway 46 0 27 0.00094152 0 0.00 0.0251124Apo2L pathway 45 0 28 0.00092106 0 0.00 0.02547142Parkinassociated path-ways
57 0 27 0.00116667 0 0.00 0.03102695
TLR3 pathway 64 0 27 0.00130995 0 0.00 0.03477275JNK pathway 120 0 15 0.00245615 0 0.00 0.03621548IFN pathway 52 0 36 0.00106433 0 0.00 0.03761077G1phase 61 0 31 0.00124854 0 0.00 0.0379886E2F network 140 0 15 0.00286551 0 0.00 0.04213103PRL pathway 88 0 24 0.00180117 0 0.00 0.0423445Plk1 cell-cycle regula-tion
58 0 40 0.00118714 0 0.00 0.04640262
48 APPL. COMPUT. MATH., V.9, SPECIAL ISSUE, 2010
We applied the WAX system to run the upstream analysis workflow to the genes encodingcomponents of each pathway putting together genes of human, mouse and rat. The questionwhich we asked was: when applying the upstream workflow onto the genes of a pathway, howoften will the identified key nodes belong to the same pathway? Such cases would indicatethe presence of feedback mechanisms in functioning of the pathway under study. In Table 2we present the results of the WAX analysis. The second column (“n”) of the table shows thenumber of significant key nodes identified by WAX. The third column (“m”) of the table showhow many of these key nodes belong to the same pathway. The p-value calculated based onbinomial distribution indicates the random chance probability of observing so many (and more)key nodes belonging to the same pathway. As a result, we have observed that for 12 pathwaysout of 23, the key nodes found belonging to the same pathway which may indicate that thesepathways are functioning using feedback mechanisms of regulation.
In conclusion we would like to point out that the automatic analysis workflow tool, WAX,allows high-throughput analysis of many sets of data in a fairly objective manner compared toa manual explorative type of analysis in ExPlainTM , which is important for the initial steps ofdata analysis. WAX helped us to do the systematic analysis of a big collection of gene groupswhich are belonging to various canonical signal transduction pathways.
In 50% of the pathways analyzed, positive regulatory loops were proposed, that regulateactivity of these pathways. Key nodes of such feedback circuits are the “Achilles Heels” of thecells, whose dysfunction often causes diseases.
4. Acknowledgements
Parts of the work were funded by EU grants “TRANSISTOR” (MRTN-CT-2004-512285),“EuroDia” (LSHM-CT-2006-518153), VALAPODYN (LSHG-CT-2006-037277) and Net2Drug(LSHB-CT-2007-037590) and the ETB grant GlobCell and BMBF project TCellTalk.
References
[1] Kel, A., Konovalova, T., Waleev, T., Cheremushkin, E., Kel-Margoulis, O., Wingender E. Composite Module
Analyst: a fitness-based tool for identification of transcription factor binding site combinations, Bioinfor-
matics, V.22, 2006b, pp.1190-1197.
[2] Kel, A. E., Goßling, E., Reuter, I., Cheremushkin, E., Kel-Margoulis, O. V. and Wingender, E. MATCHTM :
a tool for searching transcription factor binding sites in DNA sequences, Nucleic Acids Res. V.31, 2003,
pp.3576-3579.
[3] Kel, A. E., Niehof, M., Matys, V., Zemlin, R. and Borlak, J. Genome wide prediction of HNF4alpha
functional binding sites by the use of local and global sequence context, Genome Biol., V.9, 2008b, R36.
[4] Kel, A., Voss, N., Valeev, T., Stegmaier, P., Kel-Margoulis, O., Wingender, E. ExPlain: finding upstream
drug targets in disease gene regulatory networks, SAR QSAR Environ Res., V.19, 2008a, pp.481-494.
[5] Kel, A., Voss, N., Jauregui, R., Kel-Margoulis, O. and Wingender, E. Beyond microarrays: Finding key
transcription factors controlling signal transduction pathways, BMC Bioinformatics, 7(Suppl. 2), S13, 2006a.
[6] Krull, M., Pistor, S., Voss, N., Kel, A., Reuter, I., Kronenberg, D., Michael, H., Schwarzer, K., Potapov,
A., Choi, C., Kel-Margoulis, O. and Wingender, E. TRANSPATHr : an Information resource for storing
and visualizing signaling pathways and their pathological aberrations, Nucleic Acids Res., V.34, D546-D551,
2006.
[7] Matys, V., Kel-Margoulis, O. V., Fricke, E., Liebich, I., Land, S., Barre-Dirrie, A., Reuter, I., Chekmenev, D.,
Krull, M., Hornischer, K., Voss, N., Stegmaier, P., Lewicki-Potapov, B., Saxel, H., Kel, A. E. and Wingender,
E. TRANSFACr and its module TRANSCompelr : transcriptional gene regulation in eukaryotes, Nucleic
Acids Res., V.34, D108-D110, 2006.
KEL A. ET AL: ExPLAINTM - WAX: CAUSAL ANALYSIS ... 49
[8] Paragh, G., Schling, P., Ugocsai, P., Kel, A.E., Liebisch, G., Heimerl, S., Moehle, C., Schiemann, Y.,
Wegmann, M., Farwick, M., Wikonkl, N.M., Mandl, J., Langmann, T., Schmitz, G. Novel sphingolipid
derivatives promote keratinocyte differentiation, Exp. Dermatol., V.12, 2008, pp.1004-1016.
[9] Viemann. D, Goebeler, M., Schmid, S., Klimmek, K., Sorg, C., Ludwig, S., Roth, J. Transcriptional profiling
of IKK2/NF-kappa B- and p38 MAP kinase-dependent gene expression in TNF-alpha-stimulated primary
human endothelial cells, Blood., V.103, 2004, pp.3365-3373.
[10] Wingender, E., Crass, T., Hogan, J.D, Kel, A. E., Kel-Margoulis, O.V. and Potapov, A.P. Integrative
content-driven concepts for bioinformatics ”beyond the cell”, J. Biosci., V.32, 2007, pp.169-180.
[11] Zeeberg, B.R., Feng, W., Wang, G., Wang, M.D., Fojo, A.T., Sunshine, M., Narasimhan, S., Kane, D.W.,
Reinhold, W.C., Lababidi, S., Bussey, K.J., Riss, J., Barrett, J.C., Weinstein, J.N. GoMiner: a resource for
biological interpretation of genomic and proteomic data, Genome Biol., V.4, R28, 2003.
[12] Zubarev, R. A., Nielsen, M. L., Fung, E. M., Savitski, M. M., Kel-Margoulis, O., Wingender, E. and Kel, A.
Identification of dominant signaling pathways from proteomics expression data , J. Proteom., V.71, 2008,
pp.89-96.
Alexander Kel - holds the position of Senior
Vice President Research and Development. He
joined BIOBASE in 2000. Dr. Kel is heading
the RD department of the company and respon-
sible for scientific coordination of bioinformatics
research and development projects. Before join-
ing the Biobase GmbH, Dr. Kel was a Group
Leader and Principal Investigator at the Institute
of Cytology and Genetics, Novosibirsk, Russia.
His group has developed one of the first databases
on gene regulation and the first program for pro-
moter recognition. He has received both Master of
Science and Ph.D. degrees in Computational Biol-
ogy, totalling almost 20 years of scientific research
in this field.
Since that time, Dr. Kel was involved in research in practically all fields of bioinformatics, from molecular evo-
lution, and structural biology to database development, application of machine learning techniques and sequence
analysis. In the recent years his interests shifted considerably towards system biology including structural analysis
of signal transduction and gene regulatory pathways and dynamic modelling of regulatory circuits of such complex
cellular processes as cell cycle, differentiation and appoptosis. He has contributed to over 150 publications in the
peer-reviewed national and international journals and to several books on computational biology and bioinfor-
matics. Alexander Kel was invited to several international conferences for oral presentations and tutorials. He
has taught genetics, evolution theory and bioinformatics in the Novosibirsk State University since 1988 and at
the Gulbenkian Training Programme in Bioinformatics, Oeires, Portugal since 2003. The scientific career of Dr.
Alexander Kel includes research stays in USA (e. g. 1993: Supercomputer Center, Tallahassee; 1997: University
of Pennsylvania, Philadelphia, 1999: Cold Spring Harbor, NY, Visiting scientist), Italy (1991,1992: ITBA, Milan,
Visiting professor), and Germany (1994, 1995, 1996, 1997-1998: GBF; 1997: Max Plank Institute of Molecular
Biology, Berlin, visiting scientist and Post. Doc.).