Expert Review Comments on the IPCC WGIII AR5 First Order ...
78
Expert Review Comments on the IPCC WGIII AR5 First Order Draft – Chapter 5 Comment No Chapter From Page From Line To Page To Line Comment Response 4123 5 Please review chapter 4 section 4.3. If you feel that this section contains redundant and/or inconsistent duplications of chapter 5 discussions, please advice chapter 4 authors on how to revise their section. Noted 4126 5 It would be useful to prioritize more and carve out key insights. Some sections seem almost encyclopedic, some sections are skin, not all pieces of information seem relevant. Accepted: We are now working on prioritizing and streamlining the texts as well as making them more homogenious among sections and subsections when necessary. 4134 5 Please review chapter 1 section 1.3. If you feel that this section contains redundant and/or inconsistent duplications of chapter 5 discussions, please advice chapter 1 authors on how to revise their section. Noted 4135 5 It would be helpful for the reader if you could prioritize your findings. Your chapter contains a wealth of information but it is not always clear how important certain trends and drivers are in relation to others. The Executive Summary (which should be much much shorter) should focus on these most important trends and drivers and provide empirical information on their effects. Accepted: We recognize the issue raised here and we are working to improve clarity about the relationships and interlinks among factors and drivers that affect emissions. 4136 5 Please review chapter 4 sections 4.3 and 4.4.. If you feel that these sections contain redundant and/or inconsistent duplications of chapter 5 discussions, please advice chapter 4 authors on how to revise their section. Noted 4143 5 Under all circumstances, please please respect the page limit (55 pages) for the Second Order Draft of your chapter. Noted 4151 5 It would be useful to highlight the relation of your chapter to the AR4. What has happened since? How were trends and drivers treated in the AR4 and how do you expand on this assessment? Accepted: We are trying to refer to AR4 everytime such a reference is needed to assess the evolution of trends and drivers. 8427 5 The assessment of resources is very uncertain, so 4 significant figures are too much. I believe that 2 are enough. Accepted in principle. After discussions with Chapter 7 authors, table has been removed from Chapter 5 as it is already in Chapter 7. 8429 5 The assessment of these emissions is very uncertain, so 6 or 7 significant figures are too much. I believe that 2 are enough. Accepted. Revised. 5736 5 This figure is very relevant and quoted very often in the past. It would be good to see an updated version. Figure shown elsewhere 3526 5 This figure is not clear. In Y-axis, what does it mean 'Emissions relative to 1895'? The caption of the figure is not clear; what is 'open burning'? What is 'normalized to 1985 values'. Please improve the figure. Improve also consistency between section 5.2.1 and 5.2.2: the analysis covered the period 1970-2008 for section 5.2.1 whereas it covered the period 1970-2010 in section 5.2.2 (see figure 5.2.6). Point 1: Figure and caption clarified. Unfortunately, conssitent data is not available in the literature for the same periods for GHGs and pollutant emissions. 13767 5 This figure uses a different nomenclature than the text. It cannot be understood without referring to the original reference. Please adopt the language of Raupach or change the figure! Figure eliminated Page 1 of 78
-
Upload
khangminh22 -
Category
Documents
-
view
2 -
download
0
Transcript of Expert Review Comments on the IPCC WGIII AR5 First Order ...

Expert Review Comments on the IPCC WGIII AR5 First Order Draft – Chapter 5
Comment No
Chapter From Page
From Line
To Page
To Line Comment Response
4123 5 Please review chapter 4 section 4.3. If you feel that this section contains redundant and/or inconsistent duplications of chapter 5 discussions, please advice chapter 4 authors on how to revise their section.
Noted
4126 5 It would be useful to prioritize more and carve out key insights. Some sections seem almost encyclopedic, some sections are skin, not all pieces of information seem relevant.
Accepted: We are now working on prioritizing and streamlining the texts as well as making them more homogenious among sections and subsections when necessary.
4134 5 Please review chapter 1 section 1.3. If you feel that this section contains redundant and/or inconsistent duplications of chapter 5 discussions, please advice chapter 1 authors on how to revise their section.
Noted
4135 5 It would be helpful for the reader if you could prioritize your findings. Your chapter contains a wealth of information but it is not always clear how important certain trends and drivers are in relation to others. The Executive Summary (which should be much much shorter) should focus on these most important trends and drivers and provide empirical information on their effects.
Accepted: We recognize the issue raised here and we are working to improve clarity about the relationships and interlinks among factors and drivers that affect emissions.
4136 5 Please review chapter 4 sections 4.3 and 4.4.. If you feel that these sections contain redundant and/or inconsistent duplications of chapter 5 discussions, please advice chapter 4 authors on how to revise their section.
Noted
4143 5 Under all circumstances, please please respect the page limit (55 pages) for the Second Order Draft of your chapter.
Noted
4151 5 It would be useful to highlight the relation of your chapter to the AR4. What has happened since? How were trends and drivers treated in the AR4 and how do you expand on this assessment?
Accepted: We are trying to refer to AR4 everytime such a reference is needed to assess the evolution of trends and drivers.
8427 5 The assessment of resources is very uncertain, so 4 significant figures are too much. I believe that 2 are enough. Accepted in principle. After discussions with Chapter 7 authors, table has been removed from Chapter 5 as it is already in Chapter 7.
8429 5 The assessment of these emissions is very uncertain, so 6 or 7 significant figures are too much. I believe that 2 are enough.
Accepted. Revised.
5736 5 This figure is very relevant and quoted very often in the past. It would be good to see an updated version. Figure shown elsewhere
3526 5 This figure is not clear. In Y-axis, what does it mean 'Emissions relative to 1895'? The caption of the figure is not clear; what is 'open burning'? What is 'normalized to 1985 values'. Please improve the figure. Improve also consistency between section 5.2.1 and 5.2.2: the analysis covered the period 1970-2008 for section 5.2.1 whereas it covered the period 1970-2010 in section 5.2.2 (see figure 5.2.6).
Point 1: Figure and caption clarified. Unfortunately, conssitent data is not available in the literature for the same periods for GHGs and pollutant emissions.
13767 5 This figure uses a different nomenclature than the text. It cannot be understood without referring to the original reference. Please adopt the language of Raupach or change the figure!
Figure eliminated
Page 1 of 78

Expert Review Comments on the IPCC WGIII AR5 First Order Draft – Chapter 5
Comment No
Chapter From Page
From Line
To Page
To Line Comment Response
12539 5 The data for conventional oil appears to be incorrect, with reserves at 4 900 - 7 610 and reserves at a lesser range of 4 170 - 6 150 EJ.
Rejected. The ranges are from GEA (2012), which is the most recent, peer-reviewed assessment of reserves and resources. However, we will make sure with the GEA authors that there is not by any chance an unnoticed mistake.
16206 5 legend has lots of jargon/abbreviations that are not defined: F=Pgef=Pgh; these are not the exact same as in the intro to this chapter or the big introductory chapter. Harmonize.
Figure has been elimated
16207 5 1895 on Y axis should be 1985 Typo been corrected17473 5 I think this table is still to be completed (?) so I have not included full comments but here are a couple: 1) Will
sources supporting each entry be given? 2) what is FE? 3) could be better described as carbon rater than system efficiency? 4) is the entry for CHP is the wrong row?
noted. Table deleted. However, the points are taken.
17466 5 source needed Editorial: The data is from standard sources provide by the IPCC TSU and will be fully referenced in the final version when the final data sources are agreed on.
17467 5 source needed Editorial: The data is from standard sources provide by the IPCC TSU and will be fully referenced in the final version when the final data sources are agreed on.
17468 5 source needed Editorial: The data is from standard sources provide by the IPCC TSU and will be fully referenced in the final version when the final data sources are agreed on.
17469 5 source needed Editorial. The sources for the data are being included, but reference for common data sources used in multiple charts may be updated as part of the final revision.
17470 5 source needed Editorial: The data is from standard sources provide by the IPCC TSU and will be fully referenced in the final version when the final data sources are agreed on.
17471 5 source needed Editorial: The data is from standard sources provide by the IPCC TSU and will be fully referenced in the final version when the final data sources are agreed on.
Page 2 of 78

Expert Review Comments on the IPCC WGIII AR5 First Order Draft – Chapter 5
Comment No
Chapter From Page
From Line
To Page
To Line Comment Response
17472 5 source needed Editorial: The data is from standard sources provide by the IPCC TSU and will be fully referenced in the final version when the final data sources are agreed on.
17806 5 In particular - the chapter of Haines et al - and the numbers mentioned in the execuitive summary or in other summaries would be important. Similar arguments have been brought up again in Lancet 2012 by Haines and Dora. There are also a plentitude of examples in the housing sector (e.g. refer to WHO Euro the burden of disease of housing ) and the transport sector - refer to UNECE/WHO transport co-benefits and green jobs.
noted and text redrafted
10792 5 Figure is very confusing, therefore meaningless. Either replace it with text or redesign. Avoid pastel collors. Rejected. Figure 5.6.4 has been reviewed positively in other comments (e.g. see Comment xxxx). However, pastel colors will be avoided in the next draft.
18141 5 a) There is no text relating to this figure.b) Figure 5.2.2 depicts the information for 2000 for 5 sectors (Energy, Industrial Processes, Land use change, Agriculture and Waste) which are the commonly used sectors. Figure 5.2.3 shows time series from 1970-2008 for different sectors (AFOLU, Energy, Transport, Industry and Buildings). For ease of comparison, it would be best to use the sector classifications as per Figure 5.2.2 which is also the more common classification. Additionally, as mentioned previously, the sector Buildings needs definition and the waste sector does not appear to be depicted in Fig 5.2.3 while energy seems to be broken into energy, transport and possibly buildings? Furthermore, it is mentioned in section 5.7.2, pg 50 (lines 14-15) that most GHG emissions from buildings come from electricity use - how is this different from the emissions from the energy sector (which would also include electricity)? Likewise, in section 5.7.3, industry emissions include energy use emissios apart from production process emissions. Again what is the distinction between energy use industry emissions and energy emissions? c) Source of data required for this figure.
Figure eliminated
18142 5 a) REF, LAM and MAF can be more precisely defined rather than stating where they primarily refer to.b) Source of data required.
See reference
18143 5 What does Gpi stand for? Figure has been elimated18144 5 Y axis title should be changed to Emissions relative to 1985 (rather than 1895). Agreed.18147 5 Data source missing. Accepted. Data source provided.18151 5 Figure is missing some of the legends and the years in the x-axis are unclear. replotted15989 5 where does the literature (claimed to be around 40 sources) come from? Is that table taken from some source?
Remains unclear, please specifyConsidered. The table removed.
15986 5 The AR5 will be published in 2014, that's 14 years ... graph needs an update if it's supposed to be published; also, check whether this graph was not already published in AR4
Datat being updated
15987 5 if it's possible by IPCC statutes authors might want to update this figures by Raupach (which should be easily manageable) with most recent data (latest IEA publications cover 2009, that's four additional years!)
Figure being removed
Page 3 of 78

Expert Review Comments on the IPCC WGIII AR5 First Order Draft – Chapter 5
Comment No
Chapter From Page
From Line
To Page
To Line Comment Response
16002 5 in my opionion illumination might be a little "biased" example, as it is particular energy wasting; on the other hand, it's only a small fraction of total PE; the latter should be mentioned in the text
Accepted and the share of less than 7 percent worldwide will be included in the text. However, there are other similarly “biased” examples that are comparatively wasteful, e.g. gasoline and diesel compared to electric vehicles or thermal
5922 5 Biased and untrue for CHP: In countries with cold climate, building extensive, large-scale CHP systems in cities has replaced traditional house-size or block-size heating systems, using coal, oil or wood. Thus CHP has resulted in dramatically improved air quality ! Today, large CHP plants in Europe mostly have very efficient flue gas cleaning systems, required by EU LCP directive and national legislation. A hypothetical shifting to e.g. smaller-size biomass-based systems as a climate change mitigation measure would significantly damage air quality in these cities.
rejected. The overall mood is positive with CHP and a caveat is put on incease in local emissions. This does not mean that smaller biofuel boilers are better for local air quality.
5918 5 Are D1, D2,D3 countries defined somewhere in the report ? Figure eliminated8937 5 The figure might be correct, but seems strange to me. What is the source of these data? There must (for many
countries) be beter data available. Why is only refrigeration and air conditioning singled out? And it's share seems very small (maybe due to the lumping of residential and "other" sectors?
source added in replotted figure
10388 5 it is not clear what the word '2' at the end of the caption means Editorial. The table has been removed10389 5 it is not clear what the word '2A' at the end of the caption means Editorial. The table has been removed10381 5 the caption of this figure is missing Editorial: Caption has been added10382 5 This figure needs to redraw since it miss some information. Still it contains some unnecessary information as
emissions from refrigeration and air conditioning while the caption of this figure is emission from transportFigure REDrawn
15982 5 I do not totally understand the split between global and regional trends that have been announced before ... are regional trends supposed to be discussed here, in this case I'm missing a couple of studies wrt CO2 and e.g. China
Regional trends are discussed here but in more detail in Chapter 6 (for future)
15994 5 could be shortened Noted14457 5 This chapter will need quite a bot of redrafting. It is confusing and does not represent a clear scientific storyline.
The chapter does not follow a sound scientific reasoning.
It took me much more time to comment on than I expected. This also limited my ability to review other chapters. I feel that, if indeed this chapter is considerably improved, this will also lead to adaptations in the chapters following it.
My comments below will hopefully underpin this general comment.
Noted
4127 5 It would be useful for the reader to understand how your chapter relates to chapter 6. Taken into account - connection to Ch6 made in Section 5.11
3510 5 Please avoid to personalize the text by using terms such as "we assess", "we present", "our chapter", "the section tells us". This comment is applicable to the whole chapter.
Editorial. Proceeded as suggested
3511 5 This chapter is about "Drivers, Trends and Mitigation of GHG emissions and removals". In the current version of the introduction, there is no history to read. The text in the introduction should address questions like: why do we need to know drivers, trends of emissions/removals, what are the causes of changes in emissions/ trends, why mitigation? etc. and build and history in a logical order around these concepts. I don't think the first sentence in the introduction is necessary. Please justify the use of 40 years (1970 - 2010) for the analyses.
Taken into account - Section 5.1 rewritten.
Page 4 of 78

Expert Review Comments on the IPCC WGIII AR5 First Order Draft – Chapter 5
Comment No
Chapter From Page
From Line
To Page
To Line Comment Response
3512 5 For inventory compilers, the equation in the introduction section is never used to estimate CO2 emissions; the eq. would be applicable only to energy sector and not to AFOLU (for exemple) which generates also CO2 emissions. The statement by the authors that "One cannot conclude from the equation that population growth as such increases emissions, nor does income growth necessarily lead to higher emission levels", weakens the approach (i.e. the equation). Please include a robust approach, otherwise delete the equation. The introduction can be better drafted without using this "Kaya identity". I would suggest that when building the history in the introduction section, that the authors add the sectors covered and the drivers assessed. I agree to describe the structure of the chapter at the end of this section, but this should be brief.
Taken into account - Section 5.1 (and Fig 5.1) now better explains the conceptual set up of the chapter, while Section 5.3 explains the use of the decomposition.
14458 5 I have some conceptual difficulty with the way the story line in this chapter is constructed.
I can understand that for the applications in scenarios and projections the Kaya "identity" (see also my comment on lines 13 -16 on this page) might be helpful: if changes over historic times in the per capita gross production, the per gross production energy use and the CO2 emission per energy use are better understood, this understanding could be used in projecting emissions for future years in alternative scenarios with various possible measures, using the Kaya approach.
Following this the Kaya approach is used for the application of the results of this chapter. It does not necessarily need to be the framework of the analyses herein. I would expect that the chapter would try to derive the dependence of the three different parameters (see my comment on lines 13 - 15 below) on historic variables that could be projected towards future years or as a minimum a proxy for that. This chapter then would need to search for correlations (whether or not these are reflecting causality) with other parameters and variable that would explain the relations between respectively population and gross world production, between gross world production and energy requirement and between energy requirement and CO2 emissions.
As it is now, the search for such relations and explanations and its application in the Kaya approach is too much mixed up and interlinked. Itis rather confusing!
I do acknowledge that the Kaya "identity" has been used before by IPCC. Nevertheless, I feel that this use is quite confusing for many scientific disciplines outside the climate science community and might contribute to some of the scepticisms towards the IPCC assessments. To increase the impact and profile of the IPCC assessments it could therefore be a good idea to apply a bit more rigorous formalism from the mathematical point of view, avoiding "identities", since in mathematics (and in physics) these identities do not mean anything, simply because they are identities. When the formalism is given in a slightly different way, applying "parameters" that might be time dependent, the identity disappears and the mathematics becomes understandable for people from other disciplines. At the same time the distinction between identifying (cor)relations from historic information and applying them in projections will help to make the assessment more clear and transparent. (see also my comment on page 19, line 23)
Taken into account - the chapter is revised and the overview presented in the introduction makes clearer what the contributions are of each section to understanding the emission trends.
15996 5 Even though it can be somehow interpreted from the graph i suggest to also include EI explicitly Rejected. Comment not understood4125 5 Please discuss your definition of 'co-benefit' with chapter 3 authors who are responsible for framing this important
concept for the WGIII report.Accepted: A definition of co-benefits was discussed and agreed for all chapters in WGIII. We will use this definition in Chapter 5.
Page 5 of 78
Expert Review Comments on the IPCC WGIII AR5 First Order Draft – Chapter 5
Comment No
Chapter From Page
From Line
To Page
To Line Comment Response
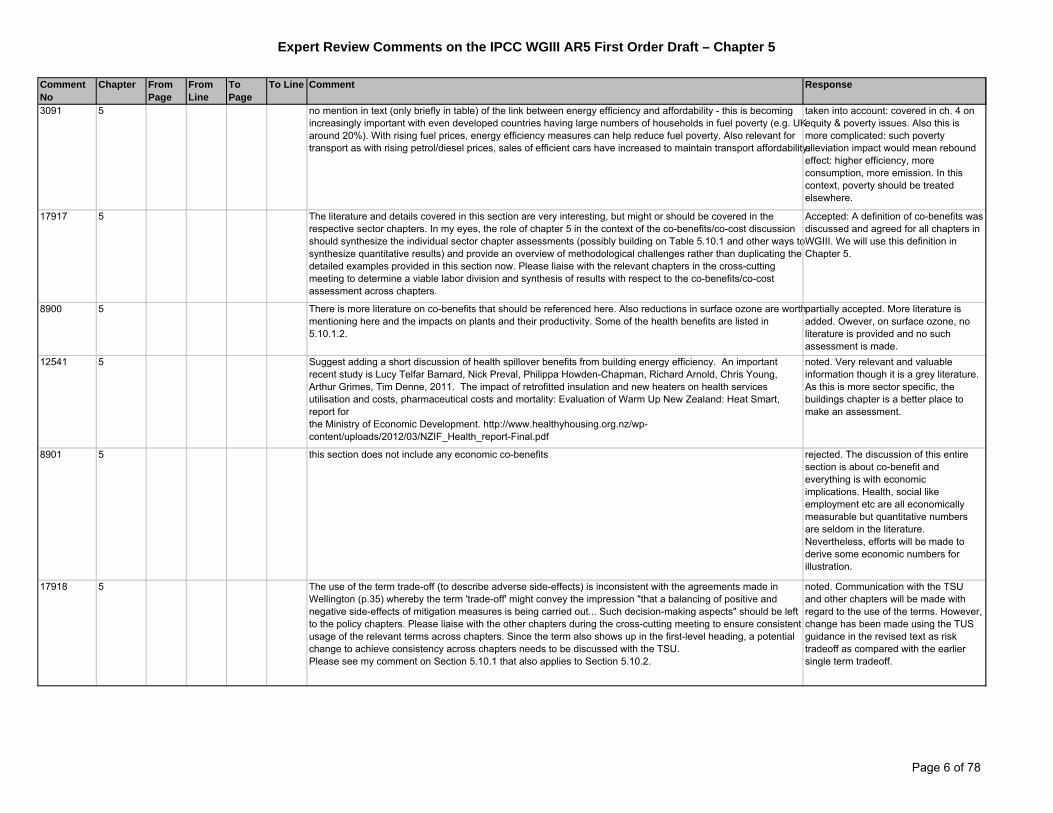
3091 5 no mention in text (only briefly in table) of the link between energy efficiency and affordability - this is becoming increasingly important with even developed countries having large numbers of households in fuel poverty (e.g. UK around 20%). With rising fuel prices, energy efficiency measures can help reduce fuel poverty. Also relevant for transport as with rising petrol/diesel prices, sales of efficient cars have increased to maintain transport affordability.
taken into account: covered in ch. 4 on equity & poverty issues. Also this is more complicated: such poverty alleviation impact would mean rebound effect: higher efficiency, more consumption, more emission. In this context, poverty should be treated elsewhere.
17917 5 The literature and details covered in this section are very interesting, but might or should be covered in the respective sector chapters. In my eyes, the role of chapter 5 in the context of the co-benefits/co-cost discussion should synthesize the individual sector chapter assessments (possibly building on Table 5.10.1 and other ways to synthesize quantitative results) and provide an overview of methodological challenges rather than duplicating the detailed examples provided in this section now. Please liaise with the relevant chapters in the cross-cutting meeting to determine a viable labor division and synthesis of results with respect to the co-benefits/co-cost assessment across chapters.
Accepted: A definition of co-benefits was discussed and agreed for all chapters in WGIII. We will use this definition in Chapter 5.
8900 5 There is more literature on co-benefits that should be referenced here. Also reductions in surface ozone are worth mentioning here and the impacts on plants and their productivity. Some of the health benefits are listed in 5.10.1.2.
partially accepted. More literature is added. Owever, on surface ozone, no literature is provided and no such assessment is made.
12541 5 Suggest adding a short discussion of health spillover benefits from building energy efficiency. An important recent study is Lucy Telfar Barnard, Nick Preval, Philippa Howden-Chapman, Richard Arnold, Chris Young, Arthur Grimes, Tim Denne, 2011. The impact of retrofitted insulation and new heaters on health services utilisation and costs, pharmaceutical costs and mortality: Evaluation of Warm Up New Zealand: Heat Smart, report forthe Ministry of Economic Development. http://www.healthyhousing.org.nz/wp-content/uploads/2012/03/NZIF_Health_report-Final.pdf
noted. Very relevant and valuable information though it is a grey literature. As this is more sector specific, the buildings chapter is a better place to make an assessment.
8901 5 this section does not include any economic co-benefits rejected. The discussion of this entire section is about co-benefit and everything is with economic implications. Health, social like employment etc are all economically measurable but quantitative numbers are seldom in the literature. Nevertheless, efforts will be made to derive some economic numbers for illustration.
17918 5 The use of the term trade-off (to describe adverse side-effects) is inconsistent with the agreements made in Wellington (p.35) whereby the term 'trade-off' might convey the impression "that a balancing of positive and negative side-effects of mitigation measures is being carried out... Such decision-making aspects" should be left to the policy chapters. Please liaise with the other chapters during the cross-cutting meeting to ensure consistent usage of the relevant terms across chapters. Since the term also shows up in the first-level heading, a potential change to achieve consistency across chapters needs to be discussed with the TSU.Please see my comment on Section 5.10.1 that also applies to Section 5.10.2.
noted. Communication with the TSU and other chapters will be made with regard to the use of the terms. However, change has been made using the TUS guidance in the revised text as risk tradeoff as compared with the earlier single term tradeoff.
Page 6 of 78

Expert Review Comments on the IPCC WGIII AR5 First Order Draft – Chapter 5
Comment No
Chapter From Page
From Line
To Page
To Line Comment Response
3627 5 Delete the summary to save space. Taken into account - we substantially shortened the ES, introduction and final section.
3514 5 Greenhouse gases' and 'GHG' are used interchangeably. Please write 'greenhouse gases (GHG)' for the first time and 'GHG' in subsequent text.
Okay
16250 5 The title of this section suggests a discussion of stocks and flows of GHG emissions…, however, the section only covers flows.
Title will be revised accordingly
3523 5 You state at the beginning of this section 'We begin by focusing on the trends in GHG emissions from 1970 through 2008'; but nowhere in the section, nothing is said on the situation after 2008? Please add a text describing the situation after 2008 to improve the completeness of the section. If this has not been assessed, explain why and make reference to section on drivers and explain how the situation is likely to be after 2008. In this section 5.2.1, clarify what is non-CO2 GHG and make reference to section 5.2.2 for the other non-CO2 gases. Please improve the cohesion between sections by making reference between them.
The data base has been extended through 2010.
14470 5 I believe this section can be considerably condensed, if it were built on the understanding that the time series of emissions (aggregated using GWP) is based on a set of data giving emissions per GHG, per source category, per region and per year. Figures 5.2.1, 5.2.3 and5.2.4 are different aggregations of this same data set (by GHG, by source and by region respectively). Between each couple of these three and for any year in the time series a graph like 5.2.2 could be produced. However, such figures do not add too much understanding, although they look very nice.
The current text uses 3.5 pages to show the same information in different forms. This could be condensed.
Figure 5.2.5 is a bit strange here. Does it correspond with a multivariate analysis of the data presented in figures 5.2.1 - 5.2.4, using the Kaya equation as the model under analysis? If not, on what data is this figure 5.2.5 based? Are these consistent with the data presented in the other graphs?The figure does not seem to be used here, so as far as I am concerned it could be deleted. If it is to remain, please consider whether or not it fits in this section and add more explanation on what it means and where it is coming from.
The section has been condensed and two figures have been removed (5.3 and 5.5). However, the writing team agrees that the remaining figures are useful as is.
14477 5 Is this section needed here? For the purpose of this report it could be sufficient to integrate the analyses of these indirect greenhouse gases together with the direct ones in section 5.2.1 into one section, using the (be it uncertain) effective GWP as derived from the latest versions of the WG I report.
We willl refer to AR% new radiative forcing digram to integrate
18348 5 The discussion of drivers needs to be coordinated with Chapter 4 (section 4.2) to sharpen chapter-specific focus. Accepted. 4.2 has been reviewed and no clear overlap found. Further conversation will be done.
16208 5 Again, PPP, GWP100 not defined yet. Accepted. Removed.13752 5 In this section, I miss the role of knowledge as a driver of emissions. It could be important in both ways, either as
a driver for more emissions of countries with high-income and high know ledge standards and as a source for reduction strategies e.g. through innovation or efficiency strategies.
Rejected. Not all drivers can be discussed within the limited space.
15999 5 I disagree with the main message and first sentence here: the causality that is implied here is wrong; see e.g. Jakob and Marschinski, in press Nature Climate Change
Rejected. As it was clearly stated, no causality is implied.
Page 7 of 78

Expert Review Comments on the IPCC WGIII AR5 First Order Draft – Chapter 5
Comment No
Chapter From Page
From Line
To Page
To Line Comment Response
13771 5 I can see that what is attempted here is worthwhile. However, the present text is rather preliminary and incomplete. No specific results are offered. Please either supplement specific findings or delete this.
Considered. The methodology part has been completely rewritten focusing only on Kaya decomposition.
12536 5 I strongly support the addition of a full consideration of the consumption-based approach within emissions analysis. As the summary shows there have been considerable advances in research since AR4.
Accepted. The text revised accordingly.
14512 5 Only placeholders here? Noted. Section has been revised.13772 5 This section can be reduced in volume. It does not offer very significant conclusions. Accepted. Section reduced in volume;
conclusions are based on the reviewed literature.
14513 5 I wonder whether the authors understand the mathematics of what they are doing. I'll provide a few examples below to show that they don't!
I feel that this section should be reritten. It does not link at all to the framework of the Kaya approach and copnfuses everything with everything. I do not see any need to show GHG emissions in graphs showing population etc.
What I would expect is
1) graphs (global, regional, sectoral, fuel) of Gross Production versus population size to show what happens with (G/P) in the Kaya approach
2) graphs (global, regional, sectoral, fuel) of gross production versus energy use (E/G) in the Kaya approach
3) graphs (global, regional, sectoral, fuel) of energy uses versus emissions (CO2/E) in the Kaya approach.
These curves would be investigated as to the influence on them from a broad range of other parameters that might change over time and of course, if possible, underlying explanatory variables and parameters.
I will not provide further detailed comments on this section, since i believe it needs a major revision in the light of my earlier comments.
Accepted: Population as factor and the related demographic drivers are better explained.
18363 5 The treatment of trade and embedded emissions is a very sensitive issue and a clear vision of its coverage should be developed in cooperation with Chapters 4, 13 and 14.
Noted. Coordination has started.
13775 5 There is an overlap with Ch. 7. Think about how to avoid this by coordinating it. Also, harmonize analysis. Accepted. The overlap must be avoided. I will try to make suggestions next week week after contacting Edgar Herwig.
12538 5 This section could benefit from discussion of the relationship between energy price stability/volatility on the structure of energy demand and related policy aspects, viz. the provision of consumer energy subsidies.
Accepted: Added a mention of the effects of the oil price shocks in 1973, 1979, and 2008
Page 8 of 78

Expert Review Comments on the IPCC WGIII AR5 First Order Draft – Chapter 5
Comment No
Chapter From Page
From Line
To Page
To Line Comment Response
14518 5 This section should be rewritten by somebody understanding the first and second laws of thermodynamics.
What we would need to be looking for here is a relation between Gross Production and preferably physical energy use, if possible by fuel type to be able to decompose the trends in global emissions into a part that is related to energy use.
The example of the light bulb is a bit overexposing the issue here. Ene4rgy for lighting is only a small fraction of total energy use. And, yes, an incandescent light bulb produces more heat than light. Since light bulbs are in many cases used in winter evenings, this heat is not necessarily a loss, since it will decrease (slightly) heat demand from other energy carriers. LEDs, fluorescent or other high efficiency light sources obviously produce less heat relative to light. The effect on the total energy balance of a building is more complicated. In the case of street lights etc it is more simple.
Thermal power plants is another issue here: the second law of thermodynamics states that it is impossible to run a thermal power plant without a cooling system. The maximum efficiency of the power plant is determined by the highest (combustion in the boiler) and the lowest temperatures (in the condenser). One could therefor also say that the energy dissipated in the cooling water or cooling tower is basically used to convert high entropy heat into low entropy electric energy. One could try to find a useful application of the even lower entropy (because of lower temperature) "waste" heat, but it can not be avoided. By bringing this into a graph like figure 5.6.2 the reader might think that indeed the major red flow could be avoided. It cannot.
Also figure 5.6.3 is a bit confusing in energy terms. What does the red and yellow arrows mean? It seems to show that energy never gets lost, but is fully converted into low entropy heat at the end. That is true. Translating this into energy efficiencies however might brake down, not only on the basis of the above entropy reasoning for power plants. Also because for instance because the kinetic energy in transport is basically a loss, since it is fully compensated by the heat energy in the brakes of the vehicle. The energy use in a vehicle is only used to overcome air resistance (road, air, water transport) and rolling resistance (road, trains, etc) or water resistance (navigation). For light my comment above applies.
Noted. Indeed, this has been the intention of the writing team that includes expertize on thermodynamics and will be improved in the next draft. 2. The example of the light bulb will be kept, but better explained including the caveats
3039 5 Completely agree that energy intensity is a poor measure of energy efficiency. In addition to the considerations mentioned, energy intensity depends on factor price movements (capital, labor, energy, materials), factor substitution elasticities, and factor technology gains. Intensity trends hide a multiplicity of important influencing variables, and depart too far from the concrete engineering efficiency gains that actually underlie intensity trends. Instead defining energy efficiency gains as energy-augmenting technical change [see Stern and Kander 2012 referenced in a comment below; also Saunders 1992 referenced below] gets us much closer to the"bottom-up" language of the engineer and is more consistent with microeconomic theory, at least for the productive side of the energy economy. [for detail on obtaining engineering assessments of energy-augmenting technical change see also H. D. Saunders. "Specifying technology for analyzing rebound" in: Energy efficiency and Sustainable Consumption: Dealing with the rebound effect. Ed. H. Herring and S.Sorrell. Palgrave Macmillan, 2009. link available at: http://works.bepress.com/harry_saunders/12/]
Accepted, further examples of energy intensity factors will be mentioned. Suggestion of including text and references on energy-augmenting technical change is rejected as the text is too long as is. Perhaps, this could be included in sec
4124 5 Please state at the beginning of this section how the sectoral break down you are using relates to the sectoral break down of chapters 7 to 11. A conceptual visualization might be helpful.
Taken into account: Peter Z addressed this issue
Page 9 of 78

Expert Review Comments on the IPCC WGIII AR5 First Order Draft – Chapter 5
Comment No
Chapter From Page
From Line
To Page
To Line Comment Response
8428 5 There is a clear overlapping between this paragraph and the paragraph in the specific Chapters of every sector. As an example Figure 5.7.1 is equivalent to Figure 8.1.2.a.I suggest to leave all the sector specific issue in the detailed chapters and discuss here the broad picture, but not the possibilities to reduce emissions.In this way we can avoid some inconsistencies; as an example in 5.7.1 line 14-27 are proposed some options to reduce emissions, but the importance of behavioural and structural changes are less evident than in the executive summary of Chapter 8 (pag 5, line 14-20).
Noted
8816 5 The analysis of behavioural change is very shallow, lacking good social science practice of tracing a whole range of causal factors to try to identify the most significant and those that can be effectively addressed. Literature suggested in my previous comment presents a range of factors that should be added to the analysis.
Accepted (added section on factors affecting behaviour change)
3040 5 The end-use/production distinction is handled better here. But again, globally, only one-third of energy is consumed by households and for personal transportation, while two-thirds is consumed in the productive part of the economy ("embedded" energy), which provides goods and services [ref: ExxonMobil, The outlook for energy: a view to 2030, (2009) available at http://www.exxonmobil.com/Corporate/energy_o_view.aspx. ]. In the U.S., productive energy use is about 60% and end-use 40%.
Noted
3042 5 Technological change is defined here too narrowly. Technology gains affect other factors of production besides energy (i.e., capital, labor, and materials). Non-energy technology gains have an enormous impact on energy use (increasing it) and also on energy intensity [Saunders H.D. (1992). The Khazzoom-Brookes Postulate and Neoclassical Growth. The Energy 17 Journal 13. (DOI: 10.5547/ISSN0195-6574-EJ-Vol13-No4-7). Available at: 18 http://www.iaee.org/en/publications/ejarticle.aspx?id=1091. (cited in WGIII AR5 FOD report)].
Reject. Although we don't disagree with the comment, the points made in the comment are already addressed in the FOD text.
3625 5 Delete or massively reduce as explained in Chapter 3.12. Accepted, will be coordinated with chapter 3
6380 5 This section relies primarily on 10-30 year old literature, despite numerous recent studies (in the last 3 years alone.) Indeed there are only 2 references newer than 12 years old. See several papers by Sorrell et al. (2008, 2009, 2011); David Greene (2007); Winebrake et al. 2012 (good review of recent rebound literature); York 2012 in Nature Climate Change. Rebound effects from production are mentioned, but no examples are given. Several recent economic studies of biofuels discuss rebound effects in global fuel markets resulting from biofuel expansion (Chen and Khanna, 2012, Drabik and De Gorter 2011; Rajagopal et al. 2011; Thompson et al. 2011). An important factor that should be addressed is the difference between rebound in production and consumption: reducing consumption starts produces 0 emissions plus some (10-30%, typically) rebound effect, whereas for production (i.e., fuel switching) net GHG accounting starts with a generally uncertain quantity of GHG emissions (esp. for biofuels), to which a rebound must be added. In the latter case, the potential for backfire is much greater because of the non-zero and uncertain emissions from the alternative fuel/energy system.
Accepted. The rebound effect section has been updated considerably yo take account of developments in the past 5 years. Notably this the section now includes evidence from a substantial review by Sorrell that includes many of the references you mention. Additionally, the figure of 10-30% is also included in relation to direct rebound effects.
2339 5 It seems that, the ordering of paragraph in the Executive Summary and other sections should be re ordered again. For instance, in the Executive Summary, the factors in the Kaya identity can be summarized.
Accepted: We are rewriting the ES of Chapter 5 following this suggestion, among others.
8902 5 0 This chapter represents well the past trends and drivers of GHGs, but the mitigation aspect of the chapter is not properly covered - especially in terms of mitigating future GHG emissions
Rejected - We can not say much about the future in Ch5, but we can say something more about mitigation in the past.
Page 10 of 78

Expert Review Comments on the IPCC WGIII AR5 First Order Draft – Chapter 5
Comment No
Chapter From Page
From Line
To Page
To Line Comment Response
10747 5 0 My impression is that GWP for a 100 year time horizon is used without any indication that the GWP has been subject to critisism and assessment. It could be noted that there are other time horizons than 100 years and that several implicit choices have been made in the application of GWP100 (see WGI Chapter 8 and WGIII chapter 3). It could also be noted that the contributions calulated would look different if a different time horizon was used or if a different metric was used; see figure 8.31 in WGI.
Agreed. The reader will be referred to chapter 3 which deals with this issue in detail. To discuss the issue in detail again would be redundant.
16941 5 0 This is a very data-rich chapter, with rigorous analysis. It might be useful for the authors to step back and try to think about the important “so what” messages. Curiously, amidst all the data, I think the chapter misses out a fundamentally important diagram (and associated set of issues), namely the data captured in a very aggregated form in the FOD Chapter 14 Figure 14-12 on trends in per-capita emissions vs per-capita GDP. I think this format captures several important points, but they are somewhat obscured by the nature and level of aggregation in Chapter 14. The issues are clearer looking at sub-regional breakdowns. One example of both data at this level and interpretation of possible implications is in Grubb, Hourcade and Neuhoff, Planetary Economics: the three domains of sustainable development, Chapter 1 (Figure 1.7). I have sent this chapter to the Secretariat. �
This is not the section to deal with this issue
9312 5 0 The chapter is very well organized, well-written, reader-friendly and takes into account holistic view of drivers, trends and mitigation strategies of greenhouse gas emissions.
Noted
18616 5 0 Technological change and individual behaviour become key aspects for future efforts on climate change mitigation.
Noted
18617 5 0 “From an economic theory point of view, however, international trade contributes to a more effcient allocation of resources, which may help mitigate GHG emissions.”
Rejected: comment not understood
18618 5 0 Not handled (from what I can see) –relation between investments and consumption. Noted. The aim of the section on consumption was to consider the trends in the growth of consumption and its relationship with GHG emissions. With 400 words available it the trend and underlying drivers that have been given the most attention, as this is the focus on this chapter.
18619 5 0 Most of the mitigation alternatives (efficiency, RES, CCS and nuclear) build on upfront investments; high CAPEX, substantially lower OPEX. Power systems perhaps a shift from 50/50 to 90/10 in the long run. Savings need to be up (and direct consumption down). Short and long term effects?
Rejected: Outside the scope of Chapter 5
18620 5 0 Parts of the material very theoretical and probably unreadable to a wider audience – share results, not formulas! Accepted. The part removed.
18623 5 0 Also in this chapter the most substantial conclusions are found in the FAQs. To be extended?(As such depressing, the emissions will continue to grow….)
Noted. Partly effectuated
9025 5 0 Methdologically, this chapter relies on two approaches which are biased against discussions of historical responsibility and equitable access to development: (1) Reliance on the Kaya identity as a way of decomposing the sources of current emissions, which does not reflect differences in development levels, population, economic structure between developing and developed countries; and (2) Use of standardized comparison of emission flows, which emphasizes recent growth in emissions of developing countries and obscures the role that the stock of the long-lasting emission that had been originated from the developed countries
Taken into account - we try to present our data in various units that provide multiple perspectives, e.g. CO2e/cap as well as total CO2e/yr emissions.
Page 11 of 78

Expert Review Comments on the IPCC WGIII AR5 First Order Draft – Chapter 5
Comment No
Chapter From Page
From Line
To Page
To Line Comment Response
9026 5 0 In its data analysis, the Chapter consistently uses 1970 as a starting point, which obscures the role of historical emissions.
Taken into account - we include historic emissions before 1970 in the SOD
9027 5 0 The country-by-country comparisons treatment obscures the nature of emissions in production and consumption. Developed country per capita consumption levels are not only much higher than those of developing countries, developed countryper capita production emissions are also much less. However, developed country consumption is dependent on developing country production of goods produced in higher emission production processes. International trade has carbon embedded in it and emissions are unduly associated with developing country economic activity.
Accepted: We are preparing a figure to better show the issue raised.
9028 5 0 The Chapter should at a minimum recognizeand state the agreed principles under the Convention. Under the principles of the Convention, developing countries have a right to pursue their development and developed countries have the responsibility to provide the technology and finance to decouple this development from emission increases.
Rejected - Chapter 5 does not assess rights, but trends and drivers. The comment is better suited for the framing chapter.
16247 5 0 This chapter points out well the interdependence of different drivers within different sectors, however, it does not mention the linkages of the sectors themselves through material flows. The sectors are treated as if they were independent from each other. In reality, changes in the building and transport infrastructures are key drivers for industry production, and waste flows are the result of past production activities. A logical consequence of these physical linkages between the different sectors is that mitigation efforts should aim at transforming entire socio-metabolic systems...
Rejected - Chapter 5 does not assess future mitigation options, but past trends and drivers.
13214 5 0 This chapter is very factual and highly policy relevant. Its pages number allocation should be increased accordingly.
Noted
12946 5 0 For a chapter on mitigation there is strong focus on the engineering/practical needs for technology to achieve the mitigation measures, but not very much at all on the economic conditions needed to make those technological solutions commerically realistic. In particular further discussion of the importance of carbon pricing seems to be lacking.
Accepted - we pay more attention to pricing in the SOD
18523 5 0 As agreed in Wellington, Chapter 5 should include some mention of tourism, deliniating the different components, and how those components are addressed across the different AR5 chapters. This has not been included in the FOD.
Accepted: We are working with TSU and CLAs in Chapter 10 on how to deal with the tourist sector.
11285 5 0 The entire chapter deals with comparisons, calculations, and various quantification models. It would be interesting (and probably necessary) to reflect also the changes attributable to, or at least within the scope of, the range of existing international covenants, agreements, standards, etc not least of which would be commitments by member states made in Rio at the Rio +20 conference in June 2012.
Taken into account - the issue is touched upon at various occasions in the SOD, but there is not much evidence in the literature, however.
8601 5 0 There is not enough information on Fisheries and Aquaculture as to consider the acronym AFOLUFA instead of AFOLU. Evenmore, in the FOD WGIII AR5-IPCC the Fisheries and Aquaculture activities are barely discussed.
Accepted
Page 12 of 78

Expert Review Comments on the IPCC WGIII AR5 First Order Draft – Chapter 5
Comment No
Chapter From Page
From Line
To Page
To Line Comment Response
3144 5 0 This chapter is the logical place for all the core discussion of drivers. I suggest that chapter 1 have the figure on Kaya (which already exists—see figure 1.6) and this chapter unpack the drivers in a lot more detail. TSU needs to help steer how other chapters address drivers as this discussion also exists in chapter 4, 6 and 7 among others.
Depending on what is done with the regional chapter (#14, I think) a lot of the regional discussion might be trimmed back from this chapter.
it would help if the executive summary were more empirical. Which of the drivers is most important?
It is possible that some of the more detailed discussion of allocation among industrial sectors (which sets up the later chapters that look sector by sector) belongs here as well. TSU has a note in chapter 10 saying that this kind of introduction is neded. maybe it belongs a bit in chapter 1 and mostly in chapter 5?
Noted
10377 5 0 the section 5.6 about the sectoral emission sames irralevent to this chapter, given the excess pages, it may be appropriate to abridge it or move it the according chapters through 7-10.
Taken into account - the section is entirely rewritten.
10379 5 0 In discussing the driver of carbon content and the energy substitution, the nuclear security and hence the supersede pertential of nuclear energy should be reconsidered.
Accepted. This point is included in the response to Comment 15978/222.
11527 5 0 In my view to much attention is paid to the Kaya formula, while it would we worthwhile to spend more attention to the causal relationships that explain the level of emissions.
Taken into account: Section 5.3 is being rewritten.
11528 5 0 It is striking that hardly any reference is made to the impact of energy prices as a driver for trends in emissions. I would expect explicit reference in the executive summary, in paragraph 5.6 and other places. When one analyses long term trends in energy use it is clear that prices hikes have triggered energy consumption to decrease or to grow more slowly. A clear example is the effect of the escalation of oil prices during the last7 to 8 years.
Taken into account - we have included a discussion of major oil price shocks in section 5.6.1.
11415 5 0 The chapter looks at historical trends and drivers of stocks and flows of greenhouse gases only from the period 1970 to 2008. Nowhere in the chapter, however, is there any explanation for why only this particular period is selected. In doing so, the chapter presents an incomplete picture of the long-run historical responsibility for GHG emissions. It essentially disregards the fact that the fact that the bulk of historical emissions since the Industrial Revolution (e.g. 1850) or even at least since the start of the 20th century (1900) to the present came from developed countries. In doing so, no adjustment in terms of the attribution of future responsibility therefore needs to be made to reflect the disregagrded historical responsibility. What the chapter tends to highlight as "historical trends", therefore, is that in the 40-year timeframe used, an increasingly larger share of emissions have come from non-OECD countries, thereby creating an implicit conclusion that an increasingly larger share of the mitigation burden will also need to be borne by non-OECD countries. This approach essentially absolves OECD countries of their long-run historical responsibility for anthropogenic emissions and ignores an important element of what should be considered as scientific fact when it comes to correctly attributing long-run responsibilities for historical emissions. It biases the attribution of historical trends in favor of OECD countries and against developing countries but focusing only on the period when most OECD countries had finished their industrialization process (and hence had more or less stabilized their emissions levels) while developing countries by and large were still embarking on the initial stages of their industrialization and development process (and hence would be increasing their emissions).
Taken into account - we have revised Section 5.2 to also include emissions before 1970. We are careful not to suggest that developing countries must take more action vis-a-vis developed countries.
Page 13 of 78
Expert Review Comments on the IPCC WGIII AR5 First Order Draft – Chapter 5
Comment No
Chapter From Page
From Line
To Page
To Line Comment Response
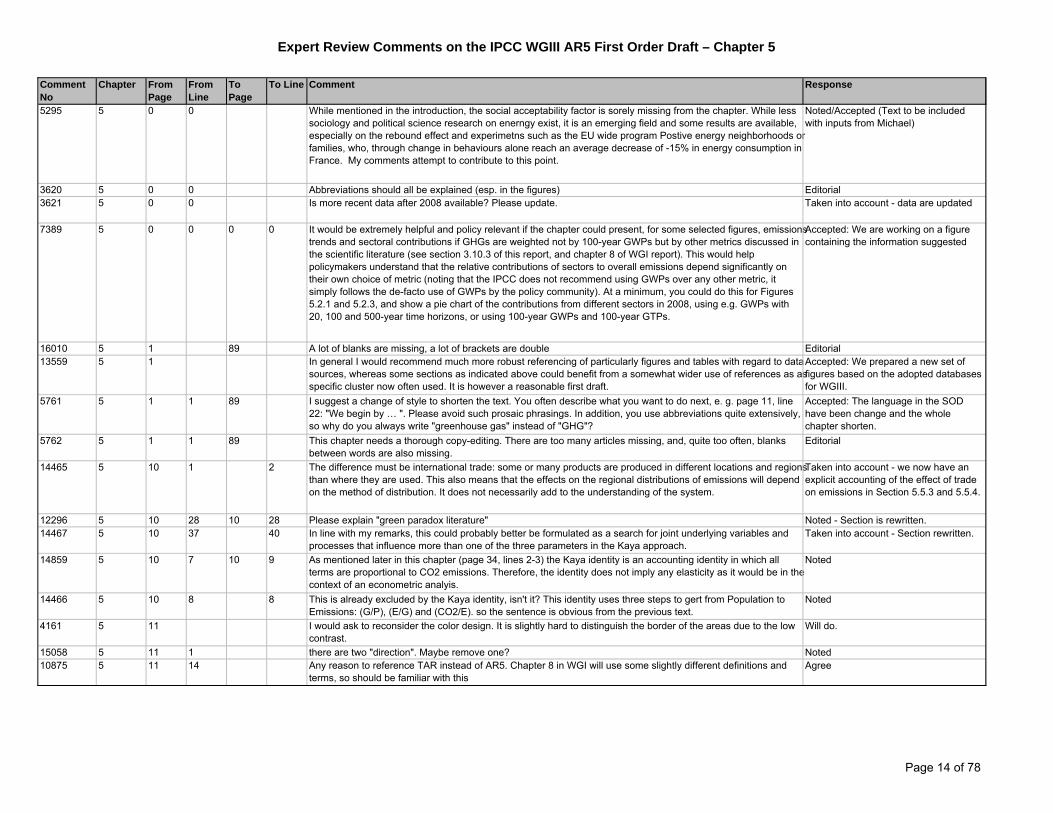
5295 5 0 0 While mentioned in the introduction, the social acceptability factor is sorely missing from the chapter. While less sociology and political science research on enerngy exist, it is an emerging field and some results are available, especially on the rebound effect and experimetns such as the EU wide program Postive energy neighborhoods or families, who, through change in behaviours alone reach an average decrease of -15% in energy consumption in France. My comments attempt to contribute to this point.
Noted/Accepted (Text to be included with inputs from Michael)
3620 5 0 0 Abbreviations should all be explained (esp. in the figures) Editorial3621 5 0 0 Is more recent data after 2008 available? Please update. Taken into account - data are updated
7389 5 0 0 0 0 It would be extremely helpful and policy relevant if the chapter could present, for some selected figures, emissions trends and sectoral contributions if GHGs are weighted not by 100-year GWPs but by other metrics discussed in the scientific literature (see section 3.10.3 of this report, and chapter 8 of WGI report). This would help policymakers understand that the relative contributions of sectors to overall emissions depend significantly on their own choice of metric (noting that the IPCC does not recommend using GWPs over any other metric, it simply follows the de-facto use of GWPs by the policy community). At a minimum, you could do this for Figures 5.2.1 and 5.2.3, and show a pie chart of the contributions from different sectors in 2008, using e.g. GWPs with 20, 100 and 500-year time horizons, or using 100-year GWPs and 100-year GTPs.
Accepted: We are working on a figure containing the information suggested
16010 5 1 89 A lot of blanks are missing, a lot of brackets are double Editorial13559 5 1 In general I would recommend much more robust referencing of particularly figures and tables with regard to data
sources, whereas some sections as indicated above could benefit from a somewhat wider use of references as as specific cluster now often used. It is however a reasonable first draft.
Accepted: We prepared a new set of figures based on the adopted databases for WGIII.
5761 5 1 1 89 I suggest a change of style to shorten the text. You often describe what you want to do next, e. g. page 11, line 22: "We begin by … ". Please avoid such prosaic phrasings. In addition, you use abbreviations quite extensively, so why do you always write "greenhouse gas" instead of "GHG"?
Accepted: The language in the SOD have been change and the whole chapter shorten.
5762 5 1 1 89 This chapter needs a thorough copy-editing. There are too many articles missing, and, quite too often, blanks between words are also missing.
Editorial
14465 5 10 1 2 The difference must be international trade: some or many products are produced in different locations and regions than where they are used. This also means that the effects on the regional distributions of emissions will depend on the method of distribution. It does not necessarily add to the understanding of the system.
Taken into account - we now have an explicit accounting of the effect of trade on emissions in Section 5.5.3 and 5.5.4.
12296 5 10 28 10 28 Please explain "green paradox literature" Noted - Section is rewritten.14467 5 10 37 40 In line with my remarks, this could probably better be formulated as a search for joint underlying variables and
processes that influence more than one of the three parameters in the Kaya approach.Taken into account - Section rewritten.
14859 5 10 7 10 9 As mentioned later in this chapter (page 34, lines 2-3) the Kaya identity is an accounting identity in which all terms are proportional to CO2 emissions. Therefore, the identity does not imply any elasticity as it would be in the context of an econometric analyis.
Noted
14466 5 10 8 8 This is already excluded by the Kaya identity, isn't it? This identity uses three steps to gert from Population to Emissions: (G/P), (E/G) and (CO2/E). so the sentence is obvious from the previous text.
Noted
4161 5 11 I would ask to reconsider the color design. It is slightly hard to distinguish the border of the areas due to the low contrast.
Will do.
15058 5 11 1 there are two "direction". Maybe remove one? Noted10875 5 11 14 Any reason to reference TAR instead of AR5. Chapter 8 in WGI will use some slightly different definitions and
terms, so should be familiar with thisAgree
Page 14 of 78

Expert Review Comments on the IPCC WGIII AR5 First Order Draft – Chapter 5
Comment No
Chapter From Page
From Line
To Page
To Line Comment Response
14469 5 11 14 18 The understanding of this from a mechanistic point of view is a bit different:
Radiative forcing is a property of the atmosphere, that can be changed due to changes in concentrations of greenhouse gases in the atmosphere. These changes in concentrations are at least partly due to emissions caused by human activities. So in my view, emissions can be anthropogenic. Not the GHG concentrations, nor the radiative forcing. Moreover, CO2 absorbs infrared radiation, which is manily "outgoing" rather than "incoming".
So a more precise way of saying this would be something along the following lines:The term "radiative forcing" is used to denote a change in the radiative balance of the atmosphere. A positive forcing leads to a more energetic, and hence warmer, atmosphere, whereas a lower forcing leads to less energetic, hence cooller, atmosphere. Radiative forcing is influenced by changes of concentrations of greenhouse gases, aerosols and troposheric ozone, partly due to anthropogenic emisisons.
The reference to AR4 would probaly better fit immediately after this modified sentence.
Text edited to remove language on incoming and outoing radiation and clarify meaning. Otherwise, the current text is consistent with the more detailed discussion in AR5 WG I, and the reader is now refered there for a more nuanced discussion of
15983 5 11 15 probably also possible to quote WG I AR5 here Done10876 5 11 17 Don’t forget that land use change, via albedo and energy balances, also effects climate. Not just emissions. Yes
14468 5 11 2 5 This is clearly one of the examples where the different parameters in the Kaya approach are mutually dependent. Noted
15984 5 11 20 contact WG I people whether there is an equivalent in AR5 Done14471 5 11 22 29 "aggregated" would be a more precise term than "converted". Text edited to clarify.14860 5 11 22 11 23 You need to be more specific on the GWP values used. On which Assessment Report are they based? Will try to be so.
12856 5 11 25 It would be good for this figure to portray the uncertainty bounds (ranges of the estimates) for each gas. The text on page 12 describes these uncertainty bounds, but the figure would more effectively show the ranges of the estimates.
Extremely difficuly to do in Figure.
3513 5 11 12 11 13 Change the title to "Global trends in flows of greenhouse gases and short-lived species" Rejected: Titles of section were adopted by the IPCC Plenary.
6898 5 11 12 Please ensure consistency with corresponding WGI Chapters and use latest data available. Agree6899 5 11 18 11 20 Update reference to WGI AR5, e.g., Chapter 8. Done4370 5 11 11 same fig as 1.4 Will discuss with Chapter 1 writing team
6900 5 11 22 11 22 Not trends, but emissions of GHGs. Please correct. Corrected.8944 5 12 1 C02 emission increased 80% but atmospheric concentrations did not. This is about 18% Not clear about purpose of this
comment. Increase in concentrations is not mentioned in this paragraph.
10877 5 12 1 12 4 I presume you have used a GWP with 100 year time horizon. Should state this, and also mention that this is one choice of many (see Ch8 WGI)
Yes
10878 5 12 10 12 13 Check chapter 6 in WGI as this might be updated now. Also see Andres, R.J., Boden, T.A., Bréon, F.M., Ciais, P., Davis, S., Erickson, D., Gregg, J.S., Jacobson, A., Marland, G., Miller, J., Oda, T., Olivier, J.G.J., Raupach, M.R., Rayner, P., Treanton, K., 2012. A synthesis of carbon dioxide emissions from fossil-fuel combustion. Biogeosciences 9, 1845-1871.
Done
15985 5 12 10 14 I understand (hope) that this is supposed to be a comparison/update to the AR4 rather than just a quote ... if so, the statement is not totally clear
Yes, Done.
Page 15 of 78

Expert Review Comments on the IPCC WGIII AR5 First Order Draft – Chapter 5
Comment No
Chapter From Page
From Line
To Page
To Line Comment Response
10879 5 12 14 12 24 For the CH4 and N2O budgets, you shuld read and review WGI text which have specific sections on this. Done
14472 5 12 14 16 Tinus Pulles and André van Amstel (2010), An overview of non-CO2 greenhouse gases, Journal oif Integrative Environmental Sciences, vol 7 sup1 pp. 3-19 doi: 10.1080/1943815X.2010.505241 provide a recent overview of antropogenic emissions in relation to changing atmospheric conentrations.
Do not have access to Journal
11841 5 12 14 Here you could mention that methane is the second most important anthropogenic GHG, to be consistent with the paragraph before (co2 is most important) and after (n20 is third abundant…).
This is a good idea, but for interests of space, we did not do this. A new figure, however, does show the relative importance of the major GHGs.
7319 5 12 20 12 22 These lines state that "The third most abundant source of anthropogenic emissions comes from nitrous oxide (N2O) which is emitted during agricultural and industrial activities, as well as during combustion of fossil fuels and solid waste." For the last part of this sentence only ("combustion of fossil fuel and solid waste"), I would suggest that the authors perhaps meant NO2/NOx, rather than N2O.
Text edited to clarify.
14473 5 12 20 20 … source ... should read ... greenhouse gas related to … Done17430 5 12 23 12 23 Why is it a given that uncertainty for CH4 and N2O will be larger? Because fossil CO2 emissions are
primarly dependent on the carbon content of fuel, which is relatively well known. CH4 and N2O emissions are highly process dependent and are, therefore, much more uncertain. (Text also clarified to make clear th
14474 5 12 25 27 Please be careful:F-gases are long lived. CO2 is long-lived. CH4 and N2O can be considered as short lived. The distinction here should therefore be made on a different parameter than "life time".
Agreed. Text edited.
10749 5 12 3 12 3 It should also be mentioned which time horizon that is used. yes10880 5 12 31 I have never heard them called "high GWP gases" before. Where does this come? I suggest use more standard
terms. See WGI.This is a term commonly used in economic and energy modeling. Because of this we use, and define, this term here.
9316 5 12 34 GHG may be changed to 'GHGs' and the following word 'emission' is suggested to be deleted. Done6459 5 12 36 12 37 “By far” should be deleted, because other sources & activities, such as transportation, show not-so-small
emissions.Text edited to clarify
6519 5 12 37 Delete "by far", as the other sources and activities are considerably large and important. Text edited to clarify14863 5 12 37 12 37 Add "production and" after Energy. If GHG emissions analysis is to be based on a consumption based approach,
then this should be explicitly mentioned.Text edited to clarify
14475 5 12 38 39 This is fine to mention here. However care must be taken that this does not lead to double counting. The indirect emissions do not add to those in figures 5.2.1 and 5.2.2 and 5.2.3 and 5.2.4!
Care has been taken not to double count emissions.
9315 5 12 4 The word 'since' seems to be superfluous and suggested to be deleted. Done.12297 5 12 5 12 24 Please be consistent when referring to the anthropogenic part of the various GHG emissions. Not quite sure what the comment refers
to, but the chapter has been edited for general consistancy.
Page 16 of 78

Expert Review Comments on the IPCC WGIII AR5 First Order Draft – Chapter 5
Comment No
Chapter From Page
From Line
To Page
To Line Comment Response
14862 5 12 7 12 8 If it is necessary to explain the "combustion of fossil fuels" then you have to add additional (to the power plants and transportation already mentioned) sources (e.g. boilers/furnaces in industry, boilers and other stationary equipment in residential/commercial sectors). I suggest deleting this sentence.
Agreed text deleted
17429 5 12 8 12 8 Combustion of fossil fuels takes place in buildings as well as power plants and transport deleted12298 5 12 9 12 9 This sentence should be balanced including both removal by sinks and emissions related to LULUCF. sentence deleted3516 5 12 10 13 I would suggest to reformulate the paragraph as followed: 'In the 1990s, CO2 emissions originating from fossil
fuel were estimated at 6.4 +/-0.4 Gt per year and that associated with land use changes ranged from 0.5 to 2.7 Gt per year with an average estimated at 1.6 Gt per year (IPCC 2007; Smith et al. 2011)'.
edited alomg these lines
3524 5 12 17 Replace 'human-related activities with 'human activities' Yes3517 5 12 20 24 Please add a reference in the paragraph. Reference added3518 5 12 26 But, nothing is said before on the Kyoto Protocol. Text edited to clarify.7709 5 12 28 Fluorinated gases are sometimes used as….' should be replaced by 'Hydrofluorocarbons are mostly used as…..'
because HFCs have been developed as alternatives to ozone depleting substances.yes
3515 5 12 5 By using the term 'most important', do you mean 'CO2 is the most abundant anthropogenic GHG emissions'? Text edited to claiify
6901 5 12 5 12 5 Please add the reference to WGI AR5 Ch8 for summary figure on present-day radiative forcing estimates for Anthropogenic and Natural Climate Forcings.
Done
8420 5 13 figure 5.2.3 is not quoted in the text Figure eliminated8419 5 13 13 These data are too old (year 2000). I suggest to insert in the Chapter 5 the Box now in Chapter 10 – pag. 8-10,
and use only the Sankey diagram now in Figure 10.2.Data being updadte
15059 5 13 Is other fuel combustion a sector? it looks confusing how the sectors are distinguished. is coal mining a end user? Figure moved to Chapter 1
15555 5 13 This is a nice summarizing Figure regarding the sources of gaseous emissions, but it would become much clearer, when the Key Sectors in Section 5.7 (i.e. 7.7.1 to 5.7.5), namely Transport, Buildings, Industry, Agriculture+Forestry+…, Waste) would be referred to
Figure moved to Chapter 1
7459 5 13 Harvest management contributes 2.5% to GHG emissions. Some harvest management can lead to carbon sequestration. This is discussed in Chapter 11. Therefore, I think the ‘negative’, practices should be spelled out.
Needs to be dealt with by Chapter 1 where figure is now located.
10881 5 13 Are these values consistent with WGI? Why use the metric values from SAR and not AR5 (at least AR4). I suggest to refer to the relevant section of WGI Ch8 for updated metric values. Note, AR4 GWPs will be used in climate policy from 2020 onwards and SAR ones are very old.
Because for the UNFCCC and other policy purposes, SAR GWPs are always used. So thoe are also used here for consistency. Because we are discussing general trends, this choice does not alter the message of the chapter.
14861 5 13 See comment No. 2 See response above16018 5 13 very old data Data being updated6902 5 13 GWPs have been updated since then in a number of IPCC reports, Ozone Assessment, WGI AR4, etc. This is true, however SAR GWP values
are still used for policy purposes, so these are used here as well.
12857 5 13 1 This is a very good figure and should even be in the Summary for Policymakers and Technical Summary, but it currently is not legibile. It would be good to somehow enlarge the text labels, although the thin arrows will require work to keep the labeling clear and accurate.
Figure has been eliminated
Page 17 of 78

Expert Review Comments on the IPCC WGIII AR5 First Order Draft – Chapter 5
Comment No
Chapter From Page
From Line
To Page
To Line Comment Response
8346 5 13 1 How about replacing world greenhouse gas emissions in 2000 with emission in 2005? Reference is as follows. Herzog T. (2009). World Greenhouse Gas Emission in 2005. World Resources Institute. http://pdf.wri.org/working_papers/world_greenhouse_gas_emissions_2005.pdf
Figure Moved to another Chapter
13548 5 13 1 Add reference to figure Okay9062 5 13 2 Figure 5.2.2. All data is for 2000. Be great if the data is more recent ( 2010 onwards) Data being updated15928 5 13 7 13 9 the last varifiable data set is from 2008 (?) I am sure several peer-reviewed publications carry more recent data
(2009-2010-2011) / Using 2008 for a report that will be published in 2013 allows for a tremedous lag and may not provide the best available scientific viewpoints on stocks or trends for GHGs.
Changes are planned including data through 2010
5349 5 13 13 Cant this figure be updated? This figure would be far more impactful if wasn't showing 14 year old data Figure deleted
3519 5 13 Figure 5.2.2 shows data that is 12 year old. Is there any updated version that shows recent situation? Please add a text to explain whether the situation has changed or not since 2000. Replace 'absorptions' with removals'
Figure deleted
3520 5 13 Please add the source of the figure. Okay4371 5 13 13 some figures in this flow chart are contradictory with numbers appearing in the text in different instances Please be more specific. 2 charts have
been removed (5.3 and 5.5)4372 5 13 13 same fig as 1.4, excep mentionned time span is different Figure eliminated8421 5 14 Usually REF means Economies in Transition; the term “Central Europe” is unclear. MAF is Middle East and
Africa, not only Africa.Yes
4162 5 14 Definition of the regions should be more clearly documented or the literature should be refered. Yes10435 5 14 This figure has potential to generate controversy Yes?14864 5 14 See comment No. 2 Yes7646 5 14 Explain or write out country/region akronyms. Yes12303 5 14 13 The regions need to be described. For instance is REF not explained in this chapter. Yes9317 5 14 4 Please add '(2007)' after Raupach et al. Figure eliminated16205 5 14 4 7 Rapupach's abbreviations are not the same as the ones used in the text; harmonize figure and text Figure eliminaterd3521 5 14 Include the share of North America in the figure. However, such information can be
extracted fom primary source.3522 5 14 3 4 Include data on 'growth rates' and clarify 'recently' (what is time period?) See original reference15060 5 15 It would be nice if more up-to-date data and result was included. Data being updated8945 5 15 Not clear. Factors not clearly explained in caption. Accepted. The text has been revised.
4163 5 15 Definition of the regions should be more clearly documented or the literature should be refered. Figure eliminated14476 5 15 I have no idea what this figure legend means. Must be explained. Figure eliminated5765 5 15 It is not clear what this figure relates to at this place as you do not work with what is shown here. A
decomposition of the Kaya Identity, but what is the message associated with this, or is this figure only given for "decorative" purposes? Please delete or at least amend text and explain abbreviations. For example, what does "Pgef" mean? Gpi (PPP) is unclear, FSU too. Please keep in mind that this text is to be read not only by specialists familiar with your lingo!
Figure deleted
14865 5 15 I suggest deleting Figure 5.2.5 (at least from this part of Chapter 5) as it is based on indicator analysis that appears later in this chapter
Agree
7647 5 15 What is F = Pgef = Pgh? If explained in the text pls include ref to place in text. Figure eliminated12304 5 15 2 The figure caption needs to be extended with explanations of F, P etc. What is the relation between e.g. D1 and
UAS, EU and Japan? Are the latter included in D1? Is it all the countries included?Figure eliminated
Page 18 of 78

Expert Review Comments on the IPCC WGIII AR5 First Order Draft – Chapter 5
Comment No
Chapter From Page
From Line
To Page
To Line Comment Response
14478 5 15 20 20 The data reported by Annex I Parties on "indirect greenhouse gases" to UNFCCC have never been reviewed and might be quite incomplete and incomparable between these countries. I feel it a bit dangerous to cite these data and not use the data on direct greenhouse gases from the same source. These have been reviewed and the quality of those direct GHG emission data is quite high.
Peer revieweed literature along with other data soruces are cited to support the statements in the text. Given that the UNFCCC submitted emissions are also, in general, the emissions used for policy purposes by goverments, these are also releva
2219 5 15 6 16 24 SOD should also review a key report which I could not find in the references so far: "Project Catalyst: Abatement opportunities for non-CO2 climate forcers, May 2011". It has BAU estimates by non-CO2 climate forcer (CH4, N2O, f-gasses, and notably Black Carbon. Also it has a detailed set of MACurves for each of the non-CO2 forcers, which would be relevant to include in AR5. Project Catalyst/ClimateWorks may be willing to share underlying details of the analysis and results.
Report needs to be peer reviwed. Appears to be a briefing paper not primary research
15557 5 15 7 16 24 Generally Section 5.2.2: The important differences between aerosols and GHGs should be made clearer. They are considered more or synonymously, but aerosol increases may cause cooling effects and the net effects seems to be small or even negative. The cited Figure SPM 2 (IPCC, 2007, p. 4), cited on page 11, line 20 Fig. clearly shows this finding.
Good points, intro text edited to make this point.
12299 5 15 8 15 9 Please be consistent, climate forcing or radiative forcing Richard R (could not find, may be in other parts of text)
15558 5 15 8 15 9 Trends in aerosol consist not only of trends on secondary organic aerosols (SOCs) but also of changes in direct aerosol emissions (mineral dust, sea salt, pollen, vegetation fire, combustion processes, volcanic eruptions). Thus almost all GHG emissions also correspond to changes in aerosol emissions. This is also reflected by Fig. 5.2.6 regarding BC and OC. Both climate changes (wind climate, resulting vegetation changes) and direct land surface changes cause feedbacks on aerosols, which is particularly important since aerosols may either cool OR heat the lower atmosphere.
Text edited to note the influece of climate and land-use changes.
4373 5 15 15 legend does not explin acronyms and symbols Figure eliminated6520 5 15 Explain the abbreviations in figure's legend. Figure eliminated10882 5 15 Should be reference to WGI which covers this topic in detail We are not aware that WG I discusses
reactive gas and particulate emissions in detail. We reference here, however, the latest literature on this topic.
3525 5 15 7 20 Include in brackets the chemical formulae of gases, for e.g. carbon monoxide (CO). Done6903 5 15 8 15 11 Add reference to WGI AR5 Chapter 2, 6, 8 for the most up-to-date IPCC assessement of changes in atmospheric
composition.This section focuses on anthropogenic emissions of reactive gases not concentrations. As discussed by WG I, the relationship between anthropogenic emissions and ozone and particulate concentration is complex -- too mcuh so to repeat in this cha
8422 5 16 I suggest to normalize data to the year 1990 (not 1985 – in the graph there is 1895…) Noted: Figure has been re-drawn4029 5 16 the y-axis should read "1985" Noted: Figure corrected8946 5 16 Not clear. Caption requires explanation of all the peaks, etc. Noted: caption text edited to note that
short-term variability is due to open-burning
Page 19 of 78

Expert Review Comments on the IPCC WGIII AR5 First Order Draft – Chapter 5
Comment No
Chapter From Page
From Line
To Page
To Line Comment Response
7460 5 16 CO should be CO2? Rejected: Figure is correct and refers to CO emissions.
10883 5 16 Perhaps there is a good reason, but why are there spikes in the CO and NMVOC emissions Noted: caption text edited to note that short-term variability is due to open-burning
9318 5 16 12 It is suggested to add another factor 'and emission reduction regulations' after emission reduction technologies. Rejected. Not all factors can be dealt with.
12301 5 16 25 20 7 Readability of section 5.3 is good due to the use of subtitles. Please consider the use of subtitles in other sections. Editorial. This is part of the ongoing discussion between the editors.
12300 5 16 25 26 2 Most of section 5.3 could be placed in an Annex. You then get rid of close to 10 pages out of the 15 that you need to cut.
Considered. The part removed.
15559 5 16 4 16 18 An important finding should be mentioned, that regards unexpected climate side-effects of modern power-plants, which try to reduce coarse aerosols emissions (for health issues), but emit more ultrafine particles, which have a significant effect o clouds. Literature: "The climate penalty for clean fossil fuel combustion" W. Junkermann, B. Vogel, and M. A. Sutton, Atmos. Chem. Phys. Discuss., 11, 24567–24589, 2011; www.atmos-chem-phys-discuss.net/11/24567/2011/; doi:10.5194/acpd-11-24567-2011
Rejected. The issue is too specific and detailed to be dealt with in this general section.
6521 5 16 Explain the abbreviations in figure's legend. Will do3527 5 16 19 24 As tropospheric O3 results from photochemical reactions of precursurs, it may be useful to include this in the
section or to make reference to the chapter of the AR5 where this is addressed.Text edited to note this and to refer to Myhre et al. (AR5).
14479 5 16 As indicated above, I have some difficulty in the story line of the chapter.
Since the chapter aims at identifying the (in my words) parameters of the Kaya approach, I would expect sections on the relation between population (growth) and gross production values, between gross production values and energy requirements etc.
The Kaya approach is telling the reader that these drivers are changes in these parameters. What this section then could look for is how all kind of "drivers" identified in the literature fit into the Kaya approach. Which ones do influence the per capita Gross Production, which ones the energy requirement per gross production and which ones the emissions per energy use.
As it is now, this section confuses and does not add value to the understanding of the changes in the parameters of the Kaya approach.
Accepted: The whole Chapter 5 is being rewritten in order to improve clarity in the relationship among factors of the decomposition and underlying drivers.
Page 20 of 78

Expert Review Comments on the IPCC WGIII AR5 First Order Draft – Chapter 5
Comment No
Chapter From Page
From Line
To Page
To Line Comment Response
11200 5 17 18 There is an argument for including a new additional category here with the subtitle: "Governance and political ecology" (or just 'governance') and inserting a paragraph with references linked to the work of scientists like Agrawal showing how community forest governance and secure rights are positively correlated with intact and healthy ecosystems and low(er) emission levels when compared to other governance types and land uses. The need for much greater regulation of land acquisition could also be made in this additional sub-section under the same heading.
See refs: Persha L, Agrawal A, and Chhatre A (2011) Social and Ecological Synergy: Local Rulemaking, Forest Livelihoods, and Biodiversity Conservation Science 25 March 2011: Vol. 331 no. 6024 pp. 1606-1608
and Nepstad D, Schwartzman S, Bamberger B, Santilli M, Ray D, et al. (2006) Inhibition of Amazon deforestation and fire by parks and indigenous lands. Conserv Biol 20: 6573.
and Hayes, T M and Murtinho, F (2008) "Are indigenous forest reserves sustainable? An analysis of present and future land-use trends in Bosawas, Nicaragua" International Journal of Sustainable Development & World Ecology, Volume 15, Issue 6, 2008: 497-51
Noted. Unfortunately we don't have the space available to include all literature deemed relevant
10750 5 17 1 17 1 Re: "….emission in GWP100 has increased...". again, rewording is needed. The emissions are weighted by GWP-100.
Noted: Chapter substantially revised, text phrase no longer exists.
9466 5 17 13 19 This conflicts with page 4, lines 2-4. Are drivers strictly causes or are they associative? It would be helpful to pick a stable definition and ensure that the literature reviewed meets the standard.
Considered. It is clearly stated that they are not about cause-effect relationship.
12858 5 17 23 17 35 Here, the text should clearly identify consumption per capita as important as total consumption. Considered. Per capita consumption is deal with in the text in following sections and the link is clearly made.
15988 5 17 23 18 9 I am not sure whether the literature cited here is not misinterpreted or even worse there might be a conceptual error in the literature. There is no causality between increasing imports of GHG and consumption - I'd argue that a fair share of that is due to a higher carbon intensity of exporting countries (see e.g. Jakob and Marschinski, forthcoming in Nature Climate Change for a discussion)
Considered. The text asserts no causality.
14481 5 17 26 27 This is an accounting system indeed. It has nothing to do with understanding changes in GHG emissions over time. On the contrary: the accounting systems use information on emissions and allocates these following a specific set of accounting rules:- aggregates geographically (as in UNFCCC and the Kyoto Protocol- following a series of consecutive production steps- following a specific materialetc.
In the Kaya approach I would say that "consumption" is one of the drivers of (gross) production (no economically functioning unit will produce significant numbers of products without a consumer needing it!).
Considered. No contradiction is identified.
5766 5 17 3 17 6 Please reverse order. Scientifically sound methodology would be to identify drivers as such first, and then weigh them to identify "major" drivers.
Rejected. The section is limited to talk about 3-4 preidentified factors.
9319 5 17 32 Please see if the word 'of' can be replaced with 'by'. Accepted. The part removed.
Page 21 of 78

Expert Review Comments on the IPCC WGIII AR5 First Order Draft – Chapter 5
Comment No
Chapter From Page
From Line
To Page
To Line Comment Response
14482 5 17 36 18 9 Apart from the emissions from the transport equipment itself (trucks, ships, airplanes, etc), international trade only influences the location of the emisisions. In the Kaya approach it will be mainly influencing the regional distribution of emissions
Considered. No contradiction is identified.
10884 5 17 39 I note the use of "driver or enabling factor", which may be sufficient, but studies currently just quantify the emission flows and not the drivers or enabling factors. As reviewers often say to me "if there is trade, there will be emissions embodied in trade" and it does not mean much more than displacing emissions. If the displaced emissions causes the global emissions to be higher than otherwise, then there is more relevance to trade.
Accepted. The chapter has now ensured a more consistent use of the terms "factors" and "drivers". You are correct that we are many explaining what has happened and not implying cause. An extra paragraph has also been added to start the discussion on causality.
14480 5 17 5 5 I have understood that his framework is the Kaya approach. Considered. No specific action is required.
9465 5 17 7 12 However, in the land change science literature there has been little consensus on how to distinguish proximate vs. ultimate factors and whether drivers are causal.
Considered. The text discusses the difficulty of distinguishig them.
6522 5 17 20 22 Make the description consistent with Table 1 (which should be Table 5.3.1.), as the text here deals very little with correlations between drivers, while Table 5.3.1 does not evaluate individual drivers at all.
Considered. Removed.
18154 5 17 37 20 7 Some references to studies from Statistics Norway may be added to the literature review: 1) Bruvoll, A., T. Fæhn and B. Strøm (2003): Quantifying central hypotheses on environmental Kuznets curves for a rich economy: A computable general equilibrium study, The Scottish Journal of Political Economy 50(2), 149-173. This study decomposes emission changes to study driving forces, including leakage effects and policy effects. See also 2) Fæhn, T. and A. Bruvoll (2009): Richer and cleaner – at others’ expense?, Resource and Energy Economics 31(2), 103-122.
Considered. The part removed.
7324 5 18 1 18 2 MRIO studies can estimate consumption-based CO2 emissions but you can't lead this sentence. Accepted. Understood as a comment.
7325 5 18 1 18 2 Other studies such as Cole and Elliot (2003) and Mangi et al. (2009) found international trade could have a both beneficial and detrimental effect on the environment varies and it depends on the pollutant and the country. http://dx.doi.org/10.1016/S0095-0696(03)00021-4 http://dx.doi.org/10.1016/j.jeem.2009.04.008
Considered. The issue should better be discussed in 5.5.
10885 5 18 1 Maybe worth drawing on the "carbon leakage" literature and alternative definitions. See Peters, G.P., 2010. Managing Carbon Leakage. Carbon Management 1, 35-37.; Peters, G.P., Hertwich, E.G., 2008. CO2 Embodied in International Trade with Implications for Global Climate Policy. Environmental Science and Technology 42, 1401-1407.
Considered. The issue should better be discussed in 5.5.
12859 5 18 10 18 15 Here, the text should clearly identify per capita intensity as important as total population. Considered. Everything is important. Per capita intensity is discussed in 5.4.
14483 5 18 10 15 Main variable in the Kaya approach. Should be mentioned first! Accepted. I hope that the new text is more accessible.
Page 22 of 78

Expert Review Comments on the IPCC WGIII AR5 First Order Draft – Chapter 5
Comment No
Chapter From Page
From Line
To Page
To Line Comment Response
16251 5 18 16 18 20 It is unclear what the authors mean with "urbanization": Is it the actual growth of cities due to migration (this always leads to an increase in emissions compared to when the city is stable), or is it include the use-phase of cities (emissions once the infrastructure stock have been built)? Emission data are usually only available for direct emissions from cities or rural areas. Drawing conclusions from such comparison regarding the impact of urbanization can be problematic, because it neglects the build-up of urban infrastructures, which is extremely emission-intensive, and even more confusing, because these emissions from the physical expansion of cities often occur in rural areas (steel and cement factories are often not located within urban areas).
Considered. See 5.4.
14484 5 18 16 20 Probably influences both the per capita gross production and the consumption Considered. That was the intention.7648 5 18 16 18 20 There should be a reference to indirect emissions from cities (not just territorial emissions).
There is a recent review which summarises the current discussion: Baynes T & Wiedmann T, "General Approaches for Assessing Urban Environmental Sustainability", Current Opinion in Environmental Sustainability, forthcoming.
Rejected. The section is by design limited to regional and global assessment.
4165 5 18 20 18 20 Reference is needed here although it is commonly recognized that the "compact city" shows higher effeiciency in energy use. However, in the gigantic city, heat-island and water and waste management issues become barrier to achieve the high efficiency.
Rejected. The section is by design limited to regional and global assessment.
8947 5 18 21 25 Human behavior is most fundamental but this analysis is short and vague. Some narrative examples of behavioral change would help.
Rejected. We have a behaviour section separately handling it.
12038 5 18 26 18 46 It is very important to stress the connection between economic growth and GHG emissions. Don't overemphasize mitigation potential of economic growth. See Jackson 2009 ("Prosperity without growth")
Accepted. I hope that the new text is more clearly describe it.
13768 5 18 27 18 43 I don't understand why the EKC literature is discussed here. It was not introducted for GHGs and does not apply to them. Is there any study that provides credible support for an EKC for CO2? Consumption is discussed above, and increase consumption leads to increased emissions. You can drop this section and replace it by the simple statement that there is no support for a reduction of CO2 emissions with growth at any level of wealth.
Accepted. Removed.
14485 5 18 27 27 Please be aware that these are time derivatives: they represent changes and hence are of another order than the "drivers" mentioned earlier in this section
Considered. But not sure what it was meant.
4164 5 18 3 18 4 This contribution holds only if both import and export countires want to reduce GHG emissions. It seems to me, this is a part of the side-effects of economic growth.
Considered. No particular action is required.
10887 5 18 30 18 43 This section misses a lot of the relevant literature. EKC's are generally found (acknowledging the issues you raise) for local pollutants. I am not sure if anyone has found an EKC with a realistic turning point for energy or co2. Even so, disregarded whether GDP drives the EKC shape, if we reach ambitions of 80% reductions by 2050, all countries will follow an EKC. Thus, GDP may not cause an EKC, but we need to have an EKC! Also, there are several studies which show that if trade is include, then the EKC may not exisit. Suri, V., Chapman, D., 1998. Economic growth, trade and energy: Implications for the environmental Kuznets curve. Ecological Economics 25, 195--208: Rothman, D.S., 1998. Environmental Kuznets Curves - real progress or passing the buck? A case for consumption-based approaches. Ecological Economics 25, 177-194.; Aldy, J.E., 2005. An Environmental Kuznets Curve Analysis of U.S. State-Level Carbon Dioxide Emissions. Journal of Environment and Development 14, 48--72.; Peters, G.P., Hertwich, E.G., 2008. CO2 Embodied in International Trade with Implications for Global Climate Policy. Environmental Science and Technology 42, 1401-1407.
Considered. The EKC literature is taken out per other comments.
10886 5 18 36 Do you have a reference for this statement? Considered. The EKC literature is taken out per other comments.
12860 5 19 1 19 11 Here, the text should clearly identify energy use per capita and energy intensity per unit of PPP-adjusted GNP as important as total energy use.
Accepted. The text revised to include them.
Page 23 of 78

Expert Review Comments on the IPCC WGIII AR5 First Order Draft – Chapter 5
Comment No
Chapter From Page
From Line
To Page
To Line Comment Response
14486 5 19 1 11 In the Kaya approach this isG x (E/G)and hence again something quite different than the earlier "drivers.
Considered. See the revised description.
14487 5 19 12 12 This could be a new section at a higher level in the outline. Rejected. The section structure has been mandated.
14488 5 19 13 22 Is there any reason to prefer the one over the other?
To me it seems that these two (IPAT and Kaya) only use different "proxies" to try to correlate the emissions in time with changing major societal and economic variables. The application than in this chapter would be to extrapolate ("project") the future emissions, using projected values of these proxies.
Would there be any theoretical preference for the one or for the other? I don't see a reason for that, so it might be similar and the choice for Kaya in this chapter might be "accidental". The introduction states that the one is a refinement of the other. I would expect that energy intensity of the production process would be one of the proxies in IPAT, needed to understand the changes in the "efficiency of technology (T) used to generate 8 income" (page 9).
Given the international trade, the difference could also be on how production in one country/region of products, used in another is taken into account. At the global level this would not make any difference, unless a significant number of products would be produced that is never used. This would be rather surprising.
Accepted: The text is being revised and a new approach of the decomposition is being introduced.
5767 5 19 13 19 31 Please consider placing all three decomposition approaches in one box and refering to this box from the text. This here is the third or forth time the Kaya Identity is explained and this is, frankly, two or three times too often.
Considered. The space limitation does not make it possible.
14489 5 19 23 23 This is the first time the "input-output framework" is mentioned in this chapter. I understand that this basically macro-economic approach is underlying the thinking of the authors of this chapter. My understanding so-far was a more technical one, where I was expecting the chapter to find (correlational, not necessarily causal) explanations for changes in greenhouse gas emissions in the past with a view of extrapolating those into a future where possible measures can or could be taken.
Rejected. The space is limited to explain it but references are provided in the text.
14490 5 19 25 28 This in many other scientific disciplines could be seen as a multivariate analysis. Considered. Could be. No particular need of change.
13769 5 19 31 Please see also Yamakawa, A., Peters, G.P. (2011) Structural decomposition analysis of greenhouse gas emissions in Norway 1990-2002. Economic Systems Research 23, 303-318. I wonder whether you could provide a brief summary of the findings. My understanding is that structural effects are difficult to identify, not because the structure is not changing but because the effect of structural change is not uniform. In additon, there may be problems with the data and the technique is very sensitive to small error in the data.
Considered. SDA part has been reduced due to the mandate to discuss Kaya identity in more detail. No room to expand on SDA, unfortunately.
13770 5 19 32 20 7 This section does not offer any insight. Of course there is an interaction. I think it would, in this connection, also be necessary to introduce the STRIPAT approach: Dietz, T., Rosa, E.A. (1994) Rethinking the environmental impacts of population, affluence and technology. Human Ecology Review 1, 277-300. Please note that this approach does not present an index decompostion but rather a multivariate regression analysis as it is common in social sciences. In many ways, it provides a more valid insight into how variables are connected. Elasticities as derive by Hertwich&Peters (2009) conform rather to this approach.
Considered. The mandate of the section is now to discuss the Kaya identity in more detail.
Page 24 of 78

Expert Review Comments on the IPCC WGIII AR5 First Order Draft – Chapter 5
Comment No
Chapter From Page
From Line
To Page
To Line Comment Response
14491 5 19 37 41 In multivariate analyses it is not unusual that explaining variables correlate. There is a range of statistical methods that can deal with such correlations.
The link to "causality" here is a bit confusing. There is or there is not a causality. The problem is whether or not the analyses can correctly find and identify such causality.
In my view this, and many similar sentences in this draft, confuse the (quantitative) analysis and the interpretation thereof too much.
Considered. Much of the sentences are removed. Again, this section cannot perform correlation or multivariate analysis. It is simply out of the scope of the section.
5768 5 19 39 19 41 Ethics and responsibility are terms that imply justification or weighing of emissions. From a natural sciences point of view: an emission is an emission is an emission. The circular network thus has a starting point (the anthroposphere - atmosphere - boundary). Please do not intermingle "ethics" with "valuation" or "norm".
Considered. The part revised.
8948 5 19 41 Lip service to ethics and responsibility. Again reader needs more examples perhaps of virtuous behavior. Rejected. This section does not deal with ethics and responsibility. The two are different accounting approaches.
14492 5 19 42 45 This paragraph is conceptually problematic for two reasons, partly due to the mathematical Kaya identity, being an identity:
1) I understand that with "driver" the authors refer to the decomposition of the trends in CO2 emissions as expressed in the "Kaya identity". So "energy consumption" in this paragraph would be Energy Consumption per Gross Production (E/G). It is quite unclear what exactly is meant in this confusing paragraph.
2) In the "Kaya identity", but also the IPAT approach, the population size is explicitly "decomposed" and therefore should not be included in the explanatory decomposition of the Energy Consumption driver.
Considered. The part revised.
16019 5 19 5 thats not true. CO4 and N2O-emissions are much more often releated to land use and deforestation. Considered. No disagreement. The text only says that they are ALSO associated with energy systems.
4374 5 19 39 19 41 I cannot make sens of that statement Considered. Revised and hope that it better addresses the issue.
14493 5 20 1 2 A similar remark could be made here. Population should not be separated her, since it is already separated out in the top level decomposition. The "GHG emisison intentsity of each fuel type" is also separated out separately in the Kaya identity and should not show up here.
Furthermore, I assume that "transport" is mainly of interest as it adds to the energy requirement per gross production in the Kaya approach. Indeed parameters/variables that influence energy use in transport are modal shifts and fuel efficiency of the equipment. Another very important parameter here will be transport distance. Maybe that is meant by "transport requirement" here. But then: not per capita but per Gross Product.
Considered. The part removed.
Page 25 of 78
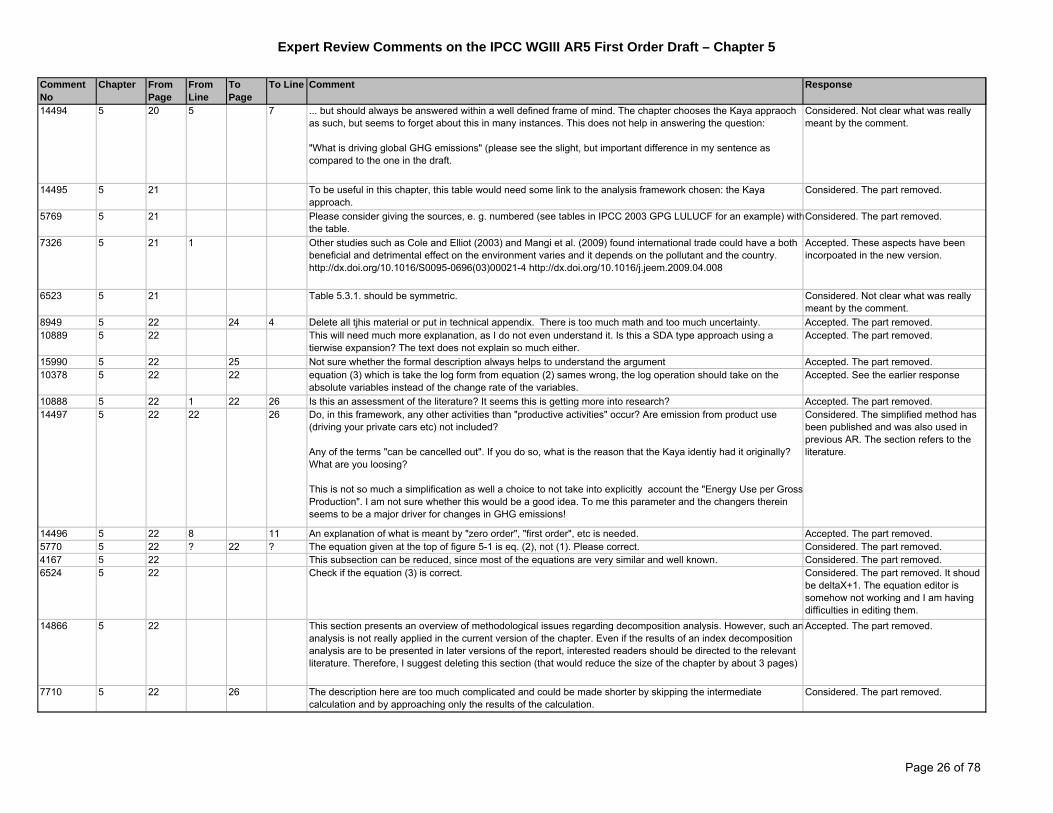
Expert Review Comments on the IPCC WGIII AR5 First Order Draft – Chapter 5
Comment No
Chapter From Page
From Line
To Page
To Line Comment Response
14494 5 20 5 7 ... but should always be answered within a well defined frame of mind. The chapter chooses the Kaya appraoch as such, but seems to forget about this in many instances. This does not help in answering the question:
"What is driving global GHG emissions" (please see the slight, but important difference in my sentence as compared to the one in the draft.
Considered. Not clear what was really meant by the comment.
14495 5 21 To be useful in this chapter, this table would need some link to the analysis framework chosen: the Kaya approach.
Considered. The part removed.
5769 5 21 Please consider giving the sources, e. g. numbered (see tables in IPCC 2003 GPG LULUCF for an example) with the table.
Considered. The part removed.
7326 5 21 1 Other studies such as Cole and Elliot (2003) and Mangi et al. (2009) found international trade could have a both beneficial and detrimental effect on the environment varies and it depends on the pollutant and the country. http://dx.doi.org/10.1016/S0095-0696(03)00021-4 http://dx.doi.org/10.1016/j.jeem.2009.04.008
Accepted. These aspects have been incorpoated in the new version.
6523 5 21 Table 5.3.1. should be symmetric. Considered. Not clear what was really meant by the comment.
8949 5 22 24 4 Delete all tjhis material or put in technical appendix. There is too much math and too much uncertainty. Accepted. The part removed.10889 5 22 This will need much more explanation, as I do not even understand it. Is this a SDA type approach using a
tierwise expansion? The text does not explain so much either.Accepted. The part removed.
15990 5 22 25 Not sure whether the formal description always helps to understand the argument Accepted. The part removed.10378 5 22 22 equation (3) which is take the log form from equation (2) sames wrong, the log operation should take on the
absolute variables instead of the change rate of the variables.Accepted. See the earlier response
10888 5 22 1 22 26 Is this an assessment of the literature? It seems this is getting more into research? Accepted. The part removed.14497 5 22 22 26 Do, in this framework, any other activities than "productive activities" occur? Are emission from product use
(driving your private cars etc) not included?
Any of the terms "can be cancelled out". If you do so, what is the reason that the Kaya identiy had it originally? What are you loosing?
This is not so much a simplification as well a choice to not take into explicitly account the "Energy Use per Gross Production". I am not sure whether this would be a good idea. To me this parameter and the changers therein seems to be a major driver for changes in GHG emissions!
Considered. The simplified method has been published and was also used in previous AR. The section refers to the literature.
14496 5 22 8 11 An explanation of what is meant by "zero order", "first order", etc is needed. Accepted. The part removed.5770 5 22 ? 22 ? The equation given at the top of figure 5-1 is eq. (2), not (1). Please correct. Considered. The part removed.4167 5 22 This subsection can be reduced, since most of the equations are very similar and well known. Considered. The part removed.6524 5 22 Check if the equation (3) is correct. Considered. The part removed. It shoud
be deltaX+1. The equation editor is somehow not working and I am having difficulties in editing them.
14866 5 22 This section presents an overview of methodological issues regarding decomposition analysis. However, such an analysis is not really applied in the current version of the chapter. Even if the results of an index decomposition analysis are to be presented in later versions of the report, interested readers should be directed to the relevant literature. Therefore, I suggest deleting this section (that would reduce the size of the chapter by about 3 pages)
Accepted. The part removed.
7710 5 22 26 The description here are too much complicated and could be made shorter by skipping the intermediate calculation and by approaching only the results of the calculation.
Considered. The part removed.
Page 26 of 78

Expert Review Comments on the IPCC WGIII AR5 First Order Draft – Chapter 5
Comment No
Chapter From Page
From Line
To Page
To Line Comment Response
14498 5 24 1 6 From the mathematical point of view, this is rather unusual.
I could understand that at the highest level of detail, the mathematical formalism would take into account different values for the intensities g and h for different regions, different sectors and different fuels (your "third order"). The system then could be aggregated to decrease the demand for input data by either summing up over all fuels (your "second order") and subsequently over all sectors (your "first order"). The final step would be to aggregate over all regions, leading to your "zero order".
When you present it like this it is obvious that the correlations that could be found will be more coarse and probably have lower explanatory power, when going to the "lower order" approaches. this then simply is because less data are fed into the approach. So, in principle a higher "order" provides more insight, but has a higher data requirement.
In GHG Emisison Inventories these are not called "orders" but "tiers". it could be helpful to do the same in this chapter.
Considered. The part removed.
14500 5 24 15 18 A similar remark here:
The sentence seems to confuse "energy use"and "fossil energy use". The problem here is rather the difficulty in getting reliable data on biomass fuel use as compared to fossil fuel use and has nothing to do with the mathematical formalism.
In other words: On "energy" the approach would work. Since data on non-fossil energy use are difficult to find. Therefore their influence on the "Gross World Product" would be difficult to find too.
Accepted. Fossile energy use is used.
14501 5 24 17 17 Only here I understand that in the Kaya identity Gross Production is understood by what economists measure as "GDP". If that is the case than the reasoning should be that GDP is not a perfect measure for what is believed to drive GHG emissions. This would be a similar remark as "the correlations are not perfect" or "we do not understand it all". This would be hardly a problem for the analyses, as long as there is a reasonable level of covariance.
Rejected. Not sure what exactly was suggested.
14502 5 24 21 21 In my view this is mainly because economic input-output modelling does not see this transport. In a correlational study it might be very well possible to correlate passenger transport to wealth and/or private income as a first order approach.
Considered. No particular action is required.
14503 5 24 23 23 "GDP is becoming a worse measure", rather than "the decomposition does no longer work". Considered. No particular action is required.
4168 5 24 28 24 28 It should be noted that the equation (3) cannot be directly applied to the formulations in Figure 5.3.1 and equation (4), since equation (3) is not additive.
Considered. The part completely removed.
8950 5 24 30 IPAT does not get the same emphasis as Kaya -- should it? Accepted. The text revised.10891 5 24 30 24 33 "Here we propose", would be much better for an aritlce to be submitted and reviewed so that you can assess the
literature instead of starting new research.Accepted. The part removed.
14504 5 24 33 33 Does this mean "... do explain the same reality, but use different variables in the decomposition"? Or does it mean something else?
Considered. The part is rewritten.
4166 5 24 7 24 28 It seems to me that the two issues listed here too much emphasize the factor (E/G) or (F/G) as the causal driving source of the emission. Kaya identity is no more than a decomposition experssion of the definition equation without the causality hypothesis but is sill convenient to understand the changes in the economy or energy demand and supply strucutre by looking the changes of these factors.
Accepted. The part revised.
Page 27 of 78

Expert Review Comments on the IPCC WGIII AR5 First Order Draft – Chapter 5
Comment No
Chapter From Page
From Line
To Page
To Line Comment Response
10890 5 24 7 24 14 I do not see that Kaya only applies to energy? http://www.pnas.org/content/early/2012/04/10/1117054109.abstract And I think a look at the broader Kaya literature (IPAT also) will find lots of non-energy examples.
Considered. The literature mentioned uses the idea of decomposition. The original proposition of Kaya identity indeed deals only with energy related CO2 and that's how most understand it.
14499 5 24 7 9 This is not necessarily true. It would be if the aim was an understanding of causality, which the authors do not seek. There might be quite strong correlations to a country's (or the globe's) energy use and, fopr instance, the sizes of life stock kept in farms.
Considered. The part removed.
4375 5 24 30 24 30 I=PAT: explain those symbols, may be use more consistent symbols throughout, fig. 5.3.1 looks more consistent in that regard
Accepted.
14505 5 25 1 1 Is this indeed, "only" a difference in allocation? What is the index "i" in the summation standing for in the formula on the bottom line of page 24?
The part removed.
14507 5 25 16 17 Since "products" seem to play the role that "sectors" are playing in the production based approach, I would expect that the parameters/data her would need to be collected and used at the different products in the most detailed approach (a "third order" would also see that fuels might be different for different products).
The part removed.
14508 5 25 17 18 Not "better represent" but "make better visible". I hope the authors are aware that the two approaches should never be added, nor even in part, since both of them are supposed to include all emissions. But all activities should always be included to estimate "global emissions"!
The difference is that some human activities can more easily be separated out in the one and others in the other.
The part removed.
14867 5 25 23 25 25 I think that a justification of the method applied is necessary The part removed.15061 5 25 24 typo The part removed.14509 5 25 24 24 Why logarithmic ? Is this because the underlying variables cannot be negative? Or are lognormal distributions
assumed? The part removed.
14510 5 25 26 33 Please explain. Why would "population" not be further specified in for instance age groups? Urban/ non-urban? Income groups? Such further detail couldadd to the explanatory power of the approach.
So why do you need equations 8 and 9 and what is the essential difference?
The part removed.
8951 5 25 3 30 Omit or put in a technical appendix. The part removed.5771 5 25 3 25 7 Please check. If "F(c)" on the left side of the equals sign is "emissions / expenditure" and "Y := expenditure", then
"F(c) / Y" would be "(emissions / Y ) / Y". The part removed.
14511 5 25 34 34 "Added"? These probably are not always additive, especially when ther might be correlations between these different separations!
The part removed.
14506 5 25 7 7 Why "life cycle"? What is happening with half products?How would this work for instance with emissions from energy transformation (refineries, gas works etc) if the refinery produces different products from the same crude using a fraction of the crude as fuel? To what product would the fuel use be attributed?
The part removed.
6526 5 25 26 29 Check if the equation (8) and (9) are correct. The part removed.6525 5 25 9 Check if the equation (4) is correct. The part removed.15062 5 26 So far it is not clear where the life-cycle emissions come from. The part removed.15991 5 26 4 6 With respect to the illustrative example shown: As the AR5 is supposed to be an assessment, I recommend to
think again how to present your points hereThe part removed.
8347 5 26 7 How about deleting Figure 5.3.1 because of duplication with 5.3.2 and shortening the volume? The part removed.
Page 28 of 78

Expert Review Comments on the IPCC WGIII AR5 First Order Draft – Chapter 5
Comment No
Chapter From Page
From Line
To Page
To Line Comment Response
8952 5 27 1 Does report have anything to say about reducing poplulation growth rate? Rejected because this is beyond scope. This is a chapter about factors (and drivers) of GHG emissions, one being population; not about factors and drivers of population growth.
4030 5 27 13 "per capita emissions between the highest (USA)" I wrong stetment. The highest per capita emission is in Qatar, eg see http://data.worldbank.org/indicator/EN.ATM.CO2E.PC
Rejected - Qatar is not a region in Raupach et al. reported here.
18145 5 27 16 RCP needs to be defined. Accepted, revised; it is now defined.14514 5 27 2 4 This sentence confuses not only the reader, but apparently also the authors of the chapter.
In the Kaya approach there is only one term describing the population (P). Affluence is used in the IPAT (page 9), not in Kaya. In the Kaya approach an explicit choice is to try to model per capita production separately as the first "decomposition" step. This can only be done, while keeping the population size as independent variable by defining a per capita gross production. This term is then not related anymore to (the size of) the population.
Taken into account - Sentence rephrased based on the newly agreed terminology and Kaya explanation.
18146 5 27 20 27 22 While it is true to say that per capita emissions have doubled in Asia, for the sake of balance, it should also be stated that despite this, a) emissions per capita in Asia is still the lowest of all 5 regions and b) the OECD 90 and REF regions are still more than double and almost triple (OECD 90) the levels of Asia.
Rejected - This is explained later and clear from Figure 5.4.2.
14515 5 27 4 5 No it does not. On page 9 it was implicitly and explicitly assumed that the terms in the Kaya approach (in my language parameters; the g, e and f in equation 1 on page 22) are time dependent and can change. With such changes the proportionality disappears!
Taken into account - Sentence rephrased based on the newly agreed terminology and Kaya explanation.
14868 5 27 4 27 7 See comment No. 1 Rejected - Not clear what is comment No. 1.
14516 5 27 6 6 "… are at work behind ...": no... these are changing the average over time! Accepted, text revised to changing averages.
7711 5 27 1 32 28 This chapter might be lengthy and tedious and coule be much more compact and simple to reduce pages. Taken into account. Reduced length, but assessment of key literure is needed to fulfill the mandate.
4377 5 27 27 Fig somewhat redundant with fig 5.2.5 Accepted - Figures revised and included as per instructions of CLAs.
4376 5 27 16 27 24 Missing definitions for acronyms (MAF, REF...) Accepted - Provided.10436 5 28 4 28 26 This has to be rewritten eliminating the elasticity comparisons because for a technical, non economist audience,
understanding this section would be problematicRejected. Elasticities are clearly explained and presenting them is important.
14517 5 28 6 7 on page 27, lines 4 to 6 the contrary is stated! Rejected because both pieces of text say: population size is proportional but the underlying dynamics are diverse.
4378 5 28 24 28 24 definition of “transmission channels” ? Taken into account - Revised according to the new chapter terminology.
4169 5 29 13 29 19 The income inequity between the rural and the urban area should be touched upon besides the policy issues. Rejected - Income inequality discussed two paragraphs below.
Page 29 of 78

Expert Review Comments on the IPCC WGIII AR5 First Order Draft – Chapter 5
Comment No
Chapter From Page
From Line
To Page
To Line Comment Response
15992 5 29 20 31 Might want to think about infrastructure stocks here Taken into account but: Literature checked/rechecked but infrastructure stocks are mostly implicit. - so no change
9087 5 29 26 29 28 What is the definition of words "local or regional nuclear power" ? (small module reactor or something ?) Accepted, text revised and Specified only: nuclear power.
17431 5 29 32 30 1 Did not understand paragraph Accepted - text Rephrased to make it more understandable.
10892 5 29 32 There should be a strong link to the chapter on urbanisation, and also, on system boundaries, this is a good paper Lenzen, M., Peters, G.M., 2010. How City Dwellers Affect Their Resource Hinterland: A Spatial Impact Study of Australian Households. Journal of Industrial Ecology 14, 73-90.
Rejected. Content of proposed publication not directly related to subject.
15993 5 29 32 33 Not clear to me Accepted - text revised -Provided explanation.
12302 5 29 6 29 9 This sentence is hard to understand. And to us the decline mentioned in the last part is only true for the REF Region.
Accepted - REF was dropped in the assembly process. Included now.
6527 5 29 9 REF seems missing at the end of the sentence. Accepted - REF was dropped in the assembly process. Included now.
18254 5 30 So, 1) a definition is needed to grasp the interrelationship between Science, Technology, Innovation and Diffusion and then using the concepts properly in the whole text. 2) An explicit description of an interdependent variables processes; that is to say, policies are not based only based on a linear model (from science to technology) ,but there are interrelated. 3) Another aspect which is becoming more important is that innovation is not only technological but also non-technological (organization, marketing, services).
Accepted, references will be added. 1) See chapter 3; 2) see chapter 3 and 5.1; 3) see chapter 3
5919 5 30 1 4 This could be added: Monni, S. and Syri, S. 2011. Weekly greenhouse gas emissions of municipalities: methods and comparisons. Energy Policy 39, 4755-4765. This article shows that in largest Finnish cities, per-capita GHG emissions were considerably below national average, mainly due to lower transportation emissions and efficient CHP heating.
Rejected. Content of proposed publication not directly related to subject.
4170 5 30 20 30 27 The authors should also touch upon the cases in African countries, since China and India have already grown up. See Karen Rajaona Daka and Jerome Ballet, "Children's education and home electrification: A case study in northwestern Madagascar", Energy Policy 39 (2011) 2866-2874
Rejected - Considered but the paper says nothing about emissions.
13551 5 30 3 "Initial findings suggest that the level and structure of trade in 2004 reduced global emissions by 6%.". Not referenced or founded. Who calculated and used GTAP7 for this? Usin the DTA as a reference is very dangerous since the structure of the economy may differ significantly as from what is imported. Dangerous section - do what an AR is supposed to do, review sound scientific work and do not additoinal analyses yourself as author.
Accepted - this section has been deleted and replaced with a more comrpehensive discussion of causality.
17432 5 30 5 30 6 I'd suggest explaining the system boundary problem Accepted - it is Explained.4379 5 30 28 30 50 is there any reason to detail the Chinese case more than any other ? Rejected because China has the Largest
population and major changes in demongraphic drivers, such as urbanization. Ample literature relative to other regions/countries. Paragraph was deleted anyway.
Page 30 of 78

Expert Review Comments on the IPCC WGIII AR5 First Order Draft – Chapter 5
Comment No
Chapter From Page
From Line
To Page
To Line Comment Response
3259 5 30 31 1. At the beginning of the chapter, the authors could state that behaviour as driver of GHG emission is very defendant to the various aspects of conceptual framework (function, scale, roots and context)2. Therefore the Kaya identity can perform well at global scale but will be more challenging to apply it at individual scale because of a different influence of various set of drivers and contextual underpinnings.3. In paragraph 2-3: it might be good to address the issue of GHG offsetting through social corporate responsibilities. This is indeed a new trend in behaviour consisting of investing in carbon projects rather than reducing emission internally (e.g. Air transport companies, big firms etc.). Hence the companies maintain their own production attitude but concur to green activities. The chapter authors can take stock from carbon trust funds and emerging VCS for communities PES as part of the picture. 4. The paragraph 4 is a rather philosophical section where it is opportune (maybe) to mention the fuzziness of behaviour when it ties to qualitative aspects such as awareness, concerns, willing (good will). Assessing those variables are difficult and monitoring them through time at individual level very puzzling as individual behaviour change over time and depending to the social and economic context. This raises indirectly the issue of identity. Every person is a moving identity depending to the context (adjustment in behaviour influenced by many contextual factors including culture) the use of the conceptual framework can help. 5. The paragraph 5 could mention the opportunistic character of behaviour at organisational and personal level. Some changes or adoption of behaviour are related back to awareness or perception (also to incentives or penalties). An example is the handling of waste in developing countries vs. low income countries.6. In Paragraph 6 it is proven that some changes of behaviour are imposed by a co-evolution of knowledge, information sharing, economy, demography, governance, policy, etc. An increase population density requires necessary changes in habitats, consumption, transportation, communication etc. This might be a place to address the regional differences of behaviour based on co-variation of many drivers.
Noted
15995 5 31 21 36 could be interesting to also combine the argument with demographic trends in developed countries a little clearer Rejected because the topic is Included in the studies assessed here. No change.
9320 5 31 31 31 33 How the same population can be ageing and without ageing? Accepted, text revised - Explained.17433 5 31 34 31 36 Sentence is not clear to me / appears to contradict itself Accepted, text revised - Checked and
corrected.9321 5 31 35 Please replace 'what' with 'which'. Accepted - Text redrafted.9088 5 31 5 31 7 How is the impact of Fukushima nuclear disaster on CO2 mitigation by nuclear energy over the world ? Rejected - Beyond the scope of this
chapter.4171 5 31 8 "Aged society" should be discussed together with the "low fertility society". Rejected. Low fertility is a crucial
determinant of aging. Yet population dynamics is beyond the scope of this chapter; mandate is to discuss impacts of age disrtribution.
6528 5 31 33 36 Check if "cohorts born before 1960" instead of "cohorts born after 1960" is correct, as the first half of the sentence seems contradicting with the second half of the sentence.
Accepted - Checked and corrected.
17434 5 32 25 32 27 Not clear if "lifestyle and popoulation density" belong to the start or end of the sentence (presumably the former?). House type is a nominal variable so not clear how it has a directional effect on energy use (also house type is mentioned here in the concluding paragraph but is not discussed earlier in the sub-section...)
Accepted - Sentence fixed.
Page 31 of 78

Expert Review Comments on the IPCC WGIII AR5 First Order Draft – Chapter 5
Comment No
Chapter From Page
From Line
To Page
To Line Comment Response
10893 5 32 30 32 38 This paragraph needs some references, particularly considering you call it "controversial" Editorial: This is the headline paragraph that summarizes the content of the section.
9322 5 32 36 The phrase 'actual such catch up growth in developing countries may be more capital and resource --' is not clear; it neede to be rephrased.
Accepted: Agree that this was badly phrased and it has been rewritten.
3092 5 32 7 32 10 is this really an unexplored area? In the UK, this has been looked at e.g. in the evaluation of energy efficiency policy measures. See e.g. [http://www.decc.gov.uk/assets/decc/11/funding-support/3339-evaluation-of-the-delivery-and-uptake-of-the-carbo.pdf]. This directly contradicts the finding of the Greek study - e.g. page 29 in the priority group of the over 70s, it was easy to get people to opt for energy efficiency measures, whereas younger age groups (often living in rented, short-term accomodation) were less interested. Hence, the statement (based on just one Greek study) that 'the elasticity of demand is lower in an ageing society than in a young society' is totally unsupported and probably wrong.
Considered but related Paragraph was deleted.
16942 5 32 See my opening remark about per-capita GDP versus per-capita emissions. This section would seem the natural place to include a more disaggregated version of the Figure 14-12, and that would start to give a “story” to accompany the mass of data already here. Whether or not the interpretation in our book (Chapter 1) is right, or the somewhat more negative view in the FOD Chapter 14 (see my comments to Ch.14), is for the authors to judge. Since production vs consumption is also included in this section, this might be the place to try and also produce an alternate version of the diagram, in terms of consumption. This would help to illuminate to what extent the apparent reductions in Annex I are actually due to trade effects and how closely tied this is to time & wealth. Such development would need to be dovetailed with Chapter 14 and maybe Chapter 4 on similar issues. �
Taken into accoutn: Figure 5.5.2 will be revised to have GDP per capita on the X axis in line with this comment. Section 5.5.3. Deals with the consumption based accounting. The book referred to is still unpublished so we can't comment on that.
14874 5 32 Productivity is mentioned in various parts of this section mainly as a potential way to increase incomes with little emissions impact. It would be useful to provide the readers with the definition of productivity used in the context of this chapter including parameters affecting productivity (following the example of energy intensity later on chapter 5). Productivity changes, at least in the shorter term, could be related to innovations, products of high quality and value, prices of production factors including human resources, etc.
Accepted: We have added a description of what we mean by producitivty and technological change.
15133 5 32 34 32 34 Productivity is lower in developing countries than in the developed world Editorial: The statement is repeated intentionally as the first paragraph of each section serves as a kind of headline and summary.
14875 5 33 In the figure legend you should specify whether emissions from biomass are excluded. Noted: The data include all sources of greenhouse gases including from agriculture and land-use change. In general the report includes all sources unless otherwise stated. We will discuss whether to note this on the figure captions or at a central point in the chapter or report
Page 32 of 78

Expert Review Comments on the IPCC WGIII AR5 First Order Draft – Chapter 5
Comment No
Chapter From Page
From Line
To Page
To Line Comment Response
13549 5 33 1 Add references for data sources, fully unclear on what based Editorial: This comment appears to refer to Figure 5.5.1 - the data is from standard sources provide by the IPCC TSU and will be fully referenced in the final version when the final data sources are agreed on.
15997 5 33 2 Abbreviations are not straight-forward to me - explain Accepted: we have expanded the abbreviation
5772 5 34 Please explain whether you show general features or emissions etc. related to energy only, as indicated in the text (p. 33, lines 4 - 7).
Taken into account: Text was confusing and has been revised for clarity.
8953 5 34 1 3 Accounting model vs. need for a dynamic model. Will IPCC address this? Noted: We are covering it to the degree that literature provides information on causal effects. Kaya is simply a way of organizing the material overall in the report.
5297 5 34 1 ADD: In democratic countries, the development of RE is based on several factors:- Natural conditions (for wind and sun exposure…)- Costs and benefits of RE- Technological maturity- Political incentives - Social acceptability (see section 7.9.4.)
Rejected: This comment does not appear relevant at this point in the text and for us to add it somewhere it would need to be referenced to a reliable source.
4172 5 34 1 36 2 This subsection seems to me too general. At least the key "technological changes" which contributed to the economic growth after 1970 and their effects should be mentioned. More concrete description is preferable.
Rejected: This would take us into less relevant material. Economists think of technological change as contributing to increases in productivity. It's the implication of this which we are interested in. However, we have added a description of what we measure with technological change
13550 5 34 1 Add references for data sources, fully unclear on what based Editorial: This comment appears to refer to Figure 5.5.2 - the data is from standard sources provide by the IPCC TSU and will be fully referenced in the final version when the final data sources are agreed on.
15218 5 35 Productivity is lower in many developing countries than developed countries (Parente and Prescott, 2000) Noted: We do not understand this comment as it is simply a quote of what is written in the FOD text at this point,.
13553 5 35 1 40 Similar concerns as on 5.6 but to a lesser extent on 5.5, i.e. a bit too much focused on Peters and Caldeire where there is much broader work out there, new databases (EORA, WIOD, EXIOBASE) that may be useful too.
Noted: This comment doesn't seem relevant to p35 as that page doesn't mention Peters or consumption based emissions at all.
Page 33 of 78

Expert Review Comments on the IPCC WGIII AR5 First Order Draft – Chapter 5
Comment No
Chapter From Page
From Line
To Page
To Line Comment Response
15929 5 35 13 35 15 India is not a middle income country (check World Bank http://data.worldbank.org/about/country-classifications/country-and-lending-groups). South Africa and Brazil are a better match - If china must be talked about.
Rejected: India is a lower-middle income country according to the source cited by the commenter, whereas China is an upper-middle income country.
15998 5 35 26 40 Authors might also want to consider the work from Christian Gross (Energy Economics, 2011 and some (as far as I know submitted) working papers) on the question of causality
Noted: Christian Gross is collaborating on these papers with David Stern who is the LA who wrote this section. The working papers you refer to are still in progress and haven't been submitted to a journal though we have given presentations at conferences
12537 5 35 44 An additional useful reference is Kevin P. Gallagher, 2009, "Economic Globalization and the Environment," Annual Review of Environment and Resources, Vol. 34: 279-304, DOI: 10.1146/annurev.environ.33.021407.092325
Accepted: Reference added
15134 5 35 8 35 9 Productivity is lower in developing countries than developed countries Noted: We do not understand this comment as it is simply a quote of what is written in the FOD text at this point,.
8954 5 36 1 10 Here some country or sector-level analysis -- case studies -- would be helpful, eg. former Soviet Union, India, Africa, which could communicate better than charts and generalities.
Rejected: This paragraph is simply a summary of what is in this section. Space is limited and some discussion of specific economies is included below.
10380 5 36 10 this paragraph seems not finished without an end punctuation. Editorial: Text revised5773 5 36 28 37 38 I suggest to use studies as references, not as topics. If you change the direction from where you write this part of
the text will be shorter. "XY wrote …; AB found ..." just needs too much space compared to "[the outcome is … or … (AB 1999, XY 2000)".
Editorial: Revised the text in line with this comment.
17435 5 36 32 36 32 Meaning not clear to me Accepted: We have revised the wording of the discussion of this paper.
4173 5 36 Some empirical numbers are needed to show the long term structural changes in production. Accepted: Added some global figures from the World Bank.
5350 5 36 9 36 10 Please (robustly) substantiate the point with references to the peer reviewed literature that the switch from centrally planned economies to market economies facilitiaties greeenhose gas emissisons reductions. That is a very important point and it deserves at the least a few references to high quality literature and perhaps a few sentences explaining what is going on / what are the major drivers of this observed phenomenon.
Accepted: Added reference to Stern (2012, Energy Economics).
Page 34 of 78

Expert Review Comments on the IPCC WGIII AR5 First Order Draft – Chapter 5
Comment No
Chapter From Page
From Line
To Page
To Line Comment Response
18621 5 37 “All the studies show that reductions in emissions resulting from improvements in emissions intensity and changes in the structure of production and consumption have been offset by significant increases in emissions resulting from the volume of consumption resulting in an overall increase in emissions.”
In reality a generalisation of a discussion of the rebound effects from different improvements (including policy driven actions)?
Interesting material on the volume growth in world trade (Doubling every 7 years between 1971 and 2010) measured in value. Physical tonnage is up from 5.4 to 10 billion tonnes between 1970 and 2005.
Demand for products by Annex B countries is repsonsible for 20% of the growth in CO2 emissions in non-Annex B countries.
Initial findings suggest that level and structure of trade in 2004 reduced global emissions by 6%.
Noted
10894 5 37 23 A more recent reference Minx, J.C., Baiocchi, G., Peters, G.P., Weber, C.L., Guan, D., Hubacek, K., 2011. A “Carbonizing Dragon”: China’s Fast Growing CO2 Emissions Revisited. Environ Sci Technol 45, 9144-9153.
Reference added
15063 5 37 28 remove JC Rejected - I'm unsure what teh comment is referring to.
18148 5 37 7 "GNE" to be defined. Taken into account - phrase is not longer used after editing new text
7327 5 37 8 37 12 Peters et al. (2011) on Nature Climate Change updated these numbers up to 2010. doi:10.1038/nclimate1332 Reference added
14869 5 37 A comment regarding production technologies/practices (e.g. availability of efficient technologies in the countries of origin) is necessary, as it is the combination of of consumption and production that affect emissions levels (e.g. in the example regarding Annex B countries)
Noted
10896 5 38 I think a great contribution to the "assessment" here would be to do a model comparison, see at least Peters, G.P., Davis, S.J., Andrew, R., 2012. A synthesis of carbon in international trade. Biogeosciences 9, 3247-3276.
Noted - page numbers makes it difficult to undertake such an assessment. However, data from different models has now been used in attempt to show consistency across results.
18149 5 38 Y axis is labelled MTCO2, however the figures show population, affluence and emissions intensity as well which are measured with different units. Label to be changed to show that figures are indexed to 1990. The title of the figures also may need to be changed to drivers of production/consumption emissions of the different regions.
Figure has now been deleted
5774 5 38 Please adjust agenda of top-left panel: the order is not the same as in the other three panels. Figure has now been deleted5775 5 38 2 40 7 Please shorten this sub-chapter and re-order the text. It appears to be a little chaotic and jumps between topics. Noted - more coherent structure has
been introduced13774 5 38 Nice to see this analysis. However, maybe it would be possible to have consumption and production based
emissions in the same figure; population and GDP will remain the same.Accepted - new figure included
4174 5 38 Structural changes in consumption are more significant. Transition from food, manufacturing products such as automobile and electric appliances to service industry (software, medical education, etc.) should be touched upon here.
Noted - section on causaility is extended
Page 35 of 78

Expert Review Comments on the IPCC WGIII AR5 First Order Draft – Chapter 5
Comment No
Chapter From Page
From Line
To Page
To Line Comment Response
9065 5 38 1 40 7 5.5.4 Embedded carbon in trade can be deleted due to limitations on nos of pages Rejected - sections decided by IPCC beforehand and cannot be changed
16000 5 39 1 6 It's not (ony) the demand for products but also the higher CI in exporting countries that has driven GHG emissions to a large part
Accepted - causality of emission transfers has been extended.
17436 5 39 12 39 12 I think the words "the growth in" should be deleted? Noted14870 5 39 18 39 23 Add carbon to weak and strong leakage in order to be more precise. Accepted- new text box added to explain
difference10895 5 39 22 39 23 I think it would be good to refer to the "carbon leakage" section in WGIII and include non-IOA references on this
pointAccepted- new text box added to explain difference
13773 5 39 34 39 39 Please note that the paper by Hertwich&Peters 2009 which you already cite elsewhere quantifies total GHG emissions embodied in trade (Kyoto gases including CH2, CH4, N2O and F-gases). The emissions fall in the range identified here.
Accepted- new references added
7330 5 39 40 40 7 Which reference discuss about these findings? You mentioned GTAP 7 but don't cite any peer reviewed papers. I think Peters don't discuss about such results.
Noted - new figure is introduced and fully referenced
17438 5 39 40 40 7 Not my area of expertise; however I suspect this finding will attract some scepticism / may not apply in more recent years (e.g. given Chinese exports). Not sure I wholly agree with the conclusion that "countries will trade with those able to produce products more [energy] efficiently.." as many other factors (labour costs etc) will affect trade (unless these factors are accounted for in the methodology?)
Noted - the causes of international trade emissions transfer is now discussed more comprehenisively
4175 5 39 40 39 41 Why no reference on GTAP results is attached here? Noted - new figure is introduced and fully referenced
9126 5 39 44 If "the ratio of emissions embedded in exports to the emissions embedded in imports" is larger than one, it means that region is net exporter of the trade embedded CO2. In this context, It is difficult to understand why "larger than one ratio implying "their consumption base emission accounts would be lower if they were domestically self-sufficient".
Accpeted- this section as been re-worded
5776 5 39 46 39 48 The sentence is not clear. What does "this ratio" mean here? Sentence deleted4176 5 39 47 39 48 "(imports + exports )/2 " sounds too ad-hoc. Is there any literature to give rationale? Sentence deleted6529 5 39 44 48 Give a reference paper or numerical calculations for Scandinavian regions and for China, as the description here
is not clear enough.References added
4758 5 4 4 I assume that "CO2" should be read as "CO2eq" Accepted: The ES is being revised.12283 5 4 1 5 4 Please apply the same sturcture for all sectors decribed, e.g. percent of global emissions, increase in absolute
terms, etc.Accepted: Sectoral sections are being reestructure following the same structure.
12285 5 4 1 8 42 Please consider to use subtitles to increase readability in the executive summary Accepted: The ES of Chapter 5 is being revised and subtitles will be considered.
2216 5 4 1 5 4 This text comes across as incomplete. It should start in line 12 with stating a trend of total global GHGs and then a systematic (100%) breakdown of all emitting sectors. Hence, it should start with power (electricity generation) or energy generation more broadly (incl. extraction/transport), then the ones whcih are listed. The omission of energy is not explained, and thus energy should be included.
Accepted: The text is being revised.
2217 5 4 1 5 4 The listing of mitigation options is inconsistent. A) Either you talk about "technology options" like in the transport sentences (biofuels, fuel efficiency, etc.) OR you talk about policies like in buildings OR both (techs AND policies) in all sector descriptions consistently.
Accepted: The text is being revised, although mitigation options are not part of our chapter. Mitigation options are mentioned as examples and the list do not pretend to exhaustive. Please, refer to Chapter 6 through 13 for detailed mitigatio
Page 36 of 78
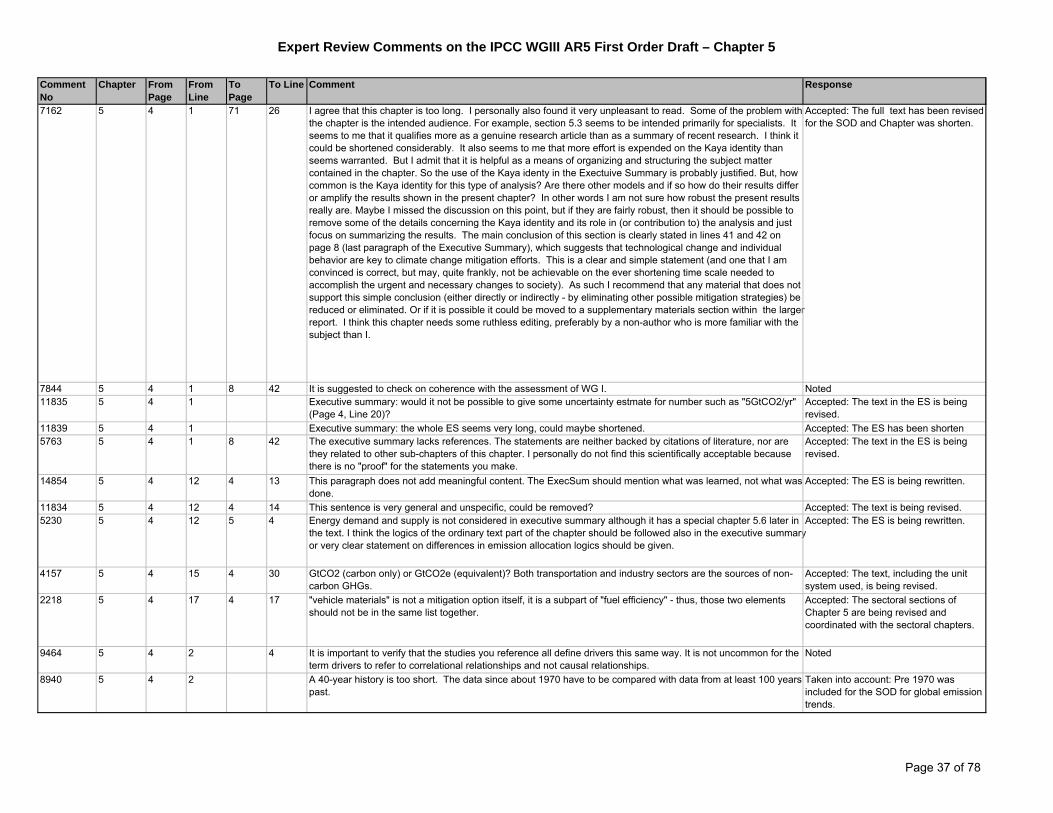
Expert Review Comments on the IPCC WGIII AR5 First Order Draft – Chapter 5
Comment No
Chapter From Page
From Line
To Page
To Line Comment Response
7162 5 4 1 71 26 I agree that this chapter is too long. I personally also found it very unpleasant to read. Some of the problem with the chapter is the intended audience. For example, section 5.3 seems to be intended primarily for specialists. It seems to me that it qualifies more as a genuine research article than as a summary of recent research. I think it could be shortened considerably. It also seems to me that more effort is expended on the Kaya identity than seems warranted. But I admit that it is helpful as a means of organizing and structuring the subject matter contained in the chapter. So the use of the Kaya identy in the Exectuive Summary is probably justified. But, how common is the Kaya identity for this type of analysis? Are there other models and if so how do their results differ or amplify the results shown in the present chapter? In other words I am not sure how robust the present results really are. Maybe I missed the discussion on this point, but if they are fairly robust, then it should be possible to remove some of the details concerning the Kaya identity and its role in (or contribution to) the analysis and just focus on summarizing the results. The main conclusion of this section is clearly stated in lines 41 and 42 on page 8 (last paragraph of the Executive Summary), which suggests that technological change and individual behavior are key to climate change mitigation efforts. This is a clear and simple statement (and one that I am convinced is correct, but may, quite frankly, not be achievable on the ever shortening time scale needed to accomplish the urgent and necessary changes to society). As such I recommend that any material that does not support this simple conclusion (either directly or indirectly - by eliminating other possible mitigation strategies) be reduced or eliminated. Or if it is possible it could be moved to a supplementary materials section within the larger report. I think this chapter needs some ruthless editing, preferably by a non-author who is more familiar with the subject than I.
Accepted: The full text has been revised for the SOD and Chapter was shorten.
7844 5 4 1 8 42 It is suggested to check on coherence with the assessment of WG I. Noted11835 5 4 1 Executive summary: would it not be possible to give some uncertainty estmate for number such as "5GtCO2/yr"
(Page 4, Line 20)?Accepted: The text in the ES is being revised.
11839 5 4 1 Executive summary: the whole ES seems very long, could maybe shortened. Accepted: The ES has been shorten5763 5 4 1 8 42 The executive summary lacks references. The statements are neither backed by citations of literature, nor are
they related to other sub-chapters of this chapter. I personally do not find this scientifically acceptable because there is no "proof" for the statements you make.
Accepted: The text in the ES is being revised.
14854 5 4 12 4 13 This paragraph does not add meaningful content. The ExecSum should mention what was learned, not what was done.
Accepted: The ES is being rewritten.
11834 5 4 12 4 14 This sentence is very general and unspecific, could be removed? Accepted: The text is being revised.5230 5 4 12 5 4 Energy demand and supply is not considered in executive summary although it has a special chapter 5.6 later in
the text. I think the logics of the ordinary text part of the chapter should be followed also in the executive summary or very clear statement on differences in emission allocation logics should be given.
Accepted: The ES is being rewritten.
4157 5 4 15 4 30 GtCO2 (carbon only) or GtCO2e (equivalent)? Both transportation and industry sectors are the sources of non-carbon GHGs.
Accepted: The text, including the unit system used, is being revised.
2218 5 4 17 4 17 "vehicle materials" is not a mitigation option itself, it is a subpart of "fuel efficiency" - thus, those two elements should not be in the same list together.
Accepted: The sectoral sections of Chapter 5 are being revised and coordinated with the sectoral chapters.
9464 5 4 2 4 It is important to verify that the studies you reference all define drivers this same way. It is not uncommon for the term drivers to refer to correlational relationships and not causal relationships.
Noted
8940 5 4 2 A 40-year history is too short. The data since about 1970 have to be compared with data from at least 100 years past.
Taken into account: Pre 1970 was included for the SOD for global emission trends.
Page 37 of 78

Expert Review Comments on the IPCC WGIII AR5 First Order Draft – Chapter 5
Comment No
Chapter From Page
From Line
To Page
To Line Comment Response
2249 5 4 2 5 4 Still this curious obsession with emissions. The greenhouse theory, for which no evidence has been found, is dependent on greenhouse gas CONCENTRATIONS, and since there is no scientifically established relationship between emissions and concentrations what possible relevance can there be in this constant concern for emissions?
Rejected: Please, refer to WGI for detail explanation.
4759 5 4 20 4 25 Could you also provide the share (%) of industry as the other sectors? Accepted: The sectoral sections of Chapter 5 are being revised and coordinated with the sectoral chapters.
9422 5 4 20 4 25 ・Addition is needed for the description of the use of nuclear energy and for voluntary actions.・It would be appropriate to add, to the list of potential mitigation measures, the use of nuclear energy that has an effect similar to or greater than that of measures which use renewable energy as described in FOD.・The draft stipulates that the technological options for GHG mitigation can be coupled with policies. However, voluntary actions should be treated equally to policies and added, since there are cases of voluntary actions of the industry achieving significant effects as reported in Japan. ・Refer to the following documents.
Okazaki et al. [1] showed that the Japanese steel industry responded to the Kyoto target by launching a voluntary action plan in 1996 a year prior to the adoption of the Kyoto Protocol with challenging quantitative target: 10% reduction of energy consumption in 2010 compared to 1990. Since then, the steel industry has made stead progress toward achieving these goals. As a result, the energy consumption in 2008 was 11.5% less in comparison to the 1990 level (equivalent to 12.1% reduction in CO2 emissions). [1]Teruo Okazaki, Mitsutsune Yamaguchi (2011)Accelerating the transfer and diffusion of energy saving technologies steel sector experience—Lessons learned Original Research ArticleEnergy Policy, Volume 39, Issue 3, March 2011, Pages 1296-1304http://www.sciencedirect.com/science/article/pii/S0301421510008827
[1]page 1296 right column line15-23
Rejected: Chapter 5 does not deal with mitigation options. Please refer to the Sectoral chapters in WGIII for detail information about mitigation options.
9779 5 4 21 4 21 suggest to delete "realized from 2002 attributed to industry growth in China" Accepted: The sectoral sections of Chapter 5 are being revised and coordinated with the sectoral chapters.
11734 5 4 22 4 25 Nuclear power should be put into example of potential mitigation measures. Rejected: Chapter 5 does not deal with mitigation options. Please refer to the Sectoral chapters in WGIII for detail information about mitigation options.
16011 5 4 23 renewable energy, local energy, feedstpcl change Accepted: The sectoral sections of Chapter 5 are being revised and coordinated with the sectoral chapters.
4760 5 4 24 4 24 What is behind "energy pricing"? 0.0
Page 38 of 78

Expert Review Comments on the IPCC WGIII AR5 First Order Draft – Chapter 5
Comment No
Chapter From Page
From Line
To Page
To Line Comment Response
4761 5 4 26 4 30 The statement assumed that "public measures" could trigger the phenomenom. Have you got evidence of this statement?
Accepted: The sectoral sections of Chapter 5 are being revised and coordinated with the sectoral chapters.
14384 5 4 26 Buildings 4GtCO2 sounds considerably lower than chapter Chapter 9’s “30 percent” of energy-related emissions. Here (and there) may need to sort out direct versus indirect and attribution to “energy sector” or “building” for heating and cooling.
Accepted: The sectoral sections of Chapter 5 are being revised and coordinated with the sectoral chapters.
14855 5 4 30 Can you characterize the confidence In this statement? Accepted: The sectoral sections of Chapter 5 are being revised and coordinated with the sectoral chapters.
14385 5 4 31 11.5% for agriculture and 11.3% for forestry and land use looks very different from figure 11.1, where agriculture is much smaller relative to deforestation. May depend in part on whether “fires” are included in agriculture; would seem doubtful.
Taken into account: The Nos. will be varified with that in Ch 11
12850 5 4 31 4 40 Due to uncertainties in quantification of greenhouse gas emissions and removals, use appropriate precision by reporting results with only two significant figures. For example, say "25%" rather than "25.3%." Otherwise, the results imply a precision of measurement that current estimation methods cannot reach.
Noted, all the Nos. have been rounded to significant figures.
12851 5 4 31 4 40 Due to uncertainties in quantification of greenhouse gas emissions and removals, use appropriate precision by reporting results with only two significant figures. For example, say "25%" rather than "25.3%." Otherwise, the results imply a precision of measurement that current estimation methods cannot reach.
Noted, all the Nos. have been rounded to significant figures.
13762 5 4 31 4 37 The emissions from FOLU are quite uncertain. The level of precision suggested by the numbers here is not justified.
Noted, all the Nos. have been rounded to significant figures.
14856 5 4 31 4 37 Can you characterize the confidence In this statement? Taken into account: The first sentence is based on the emission data provided by IPCC. The second sentence has been deleted in the SOD
7457 5 4 31 4 32 “Agriculture contributed 11.5% to total global emissions in 2008, whereas forestry and other land uses (FOLU) contributed 11.3%“. I contend that the ‘forestry’ contribution is mainly caused be cutting down trees for pastoral and arable land use purposes. Most wood for productive use is harvested, causing little if any reduction in the growing stock. Therefore, this statement about ‘forestry’ should be amended.
Taken into account: The sentence has been modified
11836 5 4 31 4 37 Would be good to also get the emissions not only as percentage but also as absolute numbers (GtCO2/yr) as in the sections before
Accepted
16012 5 4 31 4 40 Why only relative numbers? Accepted8417 5 4 32 4 33 I suggest to add data on the emission trend in the forestry sector. Accepted12287 5 4 34 5 5 Please use same accuracy when referring to increase in global poplulation (doubled or 82,7%) Noted. The figure has been rounded uo
to 83%8941 5 4 34 Does the word breeding imply any support for Genetic Modification of crops? This may be contentious. Taken into account: The sentence is
deleted
Page 39 of 78

Expert Review Comments on the IPCC WGIII AR5 First Order Draft – Chapter 5
Comment No
Chapter From Page
From Line
To Page
To Line Comment Response
17414 5 4 34 "An increase in food production can be reached through breeding of stress tolerant cultivars/breeds of crops, livestock, fish and forest trees that will increase food, feed and fuel production without enhancing GHG emission." This seems like a highly optimistic statement and is notably provided without a citation. Recommendation dropping this blanket statement and replacing with a much more sophisticated discussion of the interactions among agricultural production, adaptation strategies (of which breeding is just one of many) and mitigation potentials. Same comment for Ch 5, p-53.
Taken into account: The sentence is deleted
10790 5 4 35 4 37 This is counterintuitive and should be substanciated; actually, agriculture will expand into poorer and less productive lands, therefore increasing emissions
Taken into account: The sentence is deleted
12852 5 4 37 4 37 Because of the importance of global forest emissions, it would be good to mention here that tropical deforestation causes most greenhosue gas emissions in the forest sector, with additional periodic pulses from wildfire in temperate and boreal forests.
Taken into account: The sentence has been modified
7318 5 4 38 4 40 Executive summary for Chap 5 states the following: "Waste GHG emissions represented in 2008 the 2.9 % of global GHG emissions, compared with 2.6 % in 1970 year (medium agreement, robust evidence). Waste related GHG emissions increased by 193.5 % in the same period (medium agreement, robust evidence)." It would be helpful to state the actual numbers rather than just the %'s.
Accepted: The section on waste and the ES are being revised.
12286 5 4 38 4 40 Please clarify if " waste GHG emissions" and "waste related GHG emissions" is the same. Accepted: The section on waste and the ES are being revised.
13218 5 4 40 4 40 193.5% should be replaced by 90 % : see comment on page 53 line 21 Accepted14857 5 4 41 Is there an objective definition of 'significant contributor?' Given how small waste GHG total is (2.9%) the level
required to make something a 'significant contributor' must be small indeed. Many other things must also be significant contibutors that are not called out.
Accepted: We are removing all adjectives from the text and replacing them by actual numbers, percentages, etc.
14858 5 4 42 5 4 Useful information here would be the effectiveness of these methods, not just a listing. Noted8418 5 4 43 4 44 "Municipal solid waste is a significant contributor to greenhouse gas emissions". The contribution is 3%, I would
change significant with “not negligible” Accepted: We are removing all adjectives from the text and replacing them by actual numbers, percentages, etc.
12284 5 4 5 4 5 Please include definition of short-lived species Figure eliminated2250 5 4 5 4 8 There is no doubt whatsoever that the most important greenhouse gas is water vapour. The question is, is its
changes anthropogenic?. Human acivities undoubtedly have a major influence on the presence of water vapour in the atmosphere, so you must admit it.
Rejected - water vapor is the most important greenhouse gas but its concentration is mainly driven by the concentration of the non-condensing greenhouse gases - CO2, CH4 etc. While changes in land use etc. might have an effect on humidity and hence the greenhouse effect we don't know of any literature on human effects on water vapor in the atmosphere apart from through the above path.
11837 5 4 6 This abreviation (PPP) is mentionned several times but only introduced later. I think this is also the case for other abreviations. Would be more appropriate to introduce acronyms at the first time of use.
Editorial
4156 5 4 9 4 11 Increased percentage seems misleading. Fraction in GWP or carbon equivalent values should be refered, since these are already used in the past IPCC reports.
Accepted: The text is being revised.
4519 5 4 5 pages is too long for an executive summary. Suggest shortening and focusing only on key insights. Taken into account - shortened
Page 40 of 78
Expert Review Comments on the IPCC WGIII AR5 First Order Draft – Chapter 5
Comment No
Chapter From Page
From Line
To Page
To Line Comment Response
6897 5 4 5 4 8 This statement in the Executive Summary seems misplaced here. This Chapter does not (and it should not!) provide an assessment of the relative importance of individual GHGs in terms of concentrations and/or radiative forcing. This is assessed in the WGI AR5 contribution, Ch2 and 8. Please make sure to refer to the WGI AR5 in the underlying text supporting the statement "CO2 continues to be the most important ....".
Rejected: We are informed by WGI to include this statement.
10791 5 4 the executive summary needs rewriting in style of an assay, with logical conclusions and not a mere sequence of sentences, with only a weak link among them.
Editorial
4027 5 4 4 Use of terminology: "CO2 emissions" and "GHG emissions" seem not to be consistently used. Sometimes it seems to be CO2eq not CO2 e.g. lines 20-25, 31-40 on p.4. Suggest double checking.
Taken into account - consistency improved
2338 5 4 Some points in the Executive Summary can be summarized. For instance, the analysis based on the data about the sector based emission (Industry GHG emission, Waste GHG emissions and Agriculture GHG emission- page 4) are more detailed in the Executive Summary.
Taken into account - ES shortened
12282 5 4 1 Please shorten the Executive Summary by focusing on the most important key findings. The summary shouldbe no more than two pages.
Taken into account - shortened
4369 5 4 20 5 20 I am puzzled by the use of the word “moderately” to characterize an increase of 60% !!! Taken into account: we are removing most adjectives and repalcing them with concrete figures (i.e. numbers, percentages, etc.)
17437 5 40 1 40 1 What "country differences" are being referred to? Noted. This section has been reworked so that this sentence no longer forms part of the text.
13552 5 40 1 46 1 On various places in the document I have the feeling authors are a bit biased to papers they know or have written. Section 5.6 is a bit too much dependent on work of Grubler, where without denying his quality, there must be more of such work out.
Noted: This seems ineviatble though. It's the role of reviewers to make us aware of additional papers that we should cover.
4177 5 40 12 40 12 Is "energy consumption" a "final energy consumption" ? Taken into account: Added "primary" to first line of section
18150 5 40 13 40 16 a) The manner in which the percentages were derived from Fig 5.6.1 requires explanation.b) It should be noted that despite the high percentage increases in energy consumption/capita in non-REF/OECD 90 region over the last 40 years, total consumption is still many times lower (about 400%? in OECD 90 case) thatn in the REF/OECD-90 regions. The high percentage increases were likely necessary to meet basic needs and in some instances further growth may be necessary to assure that these needs are met.
Noted/Accepted: The percentages are simply the increase from 1970 to 2010. Added a statement that per capita energy use in developing countries is still only a quarter of that in developed countries
16001 5 40 14 Please be more explicit: which countries do you consider to be transition economies; transition economies = EIT?Taken into account: We have changed this to "Reforming Economies" These are the former USSR and formerly centrally planned eastern European countries
16020 5 40 15 same %-numbers for "Latin America" and "Middle East and Africa"??????? Accepted: Data revised5777 5 40 20 40 25 First, this information here is redundant. Second: What does this imply? Why is the outcome of the analysis
influenced by the choice of how "income" is measured and compared? Accepted: Deleted these references to market exhange rates
3622 5 40 28 40 28 Please add for the source of Granger causality and co-integration "(Granger (1969, 1986, 1988))". Please cite as: Granger, C.W.J. (1969). Investigating causal relations by econometrics models and cross spectral models. Econometrica 37, 424-438. Granger, C.W.J. (1986). Developments in the study of co-integrated economic variables. Oxford Bulletin of Economics and Statistics 77, 213-228. Granger, C.W.J. (1988). Some recent developments in a concept of causality. Journal of Econometrics 39, 199-211.
Accepted - added some references to Granger's papers
Page 41 of 78

Expert Review Comments on the IPCC WGIII AR5 First Order Draft – Chapter 5
Comment No
Chapter From Page
From Line
To Page
To Line Comment Response
10897 5 40 3 40 7 References for this? Noted. Reference has now been included.
10898 5 40 This reference may be relevant at several stages in this paper, relating to fossil fuel trade and further linking to consumption of goods and services Davis, S.J., Peters, G.P., Caldeira, K., 2011. The supply chain of CO2 emissions. Proceedings of the National Academy of Sciences 108, 18554-18559.
Noted: This paper might be relevant to the energy supply section below
4380 5 40 13 40 13 Again the term “fairly moderate” reflects more subjectivity than objectivity, what is considered an acceptable increase in GHG emission per capita ?
Rejected: It's moderate relative to growth in energy use in developing regions. And this is energy use not emissions.
18622 5 41 Discussion on energy efficiency (page 41) is a little bit shaky, there are process limitations (as well as economic limitations) to take into consideration.
(Also important to sort out if discussing economy, energy or carbon efficiency)
Just using the most efficient technology would lead to improvements even for coal but builds on pricing resources including externalities.
Partly also depending on how things are calculated (statistical methods). Conventional nuclear fission extremely inefficient from a pure energy content perspective but is that interesting? Interesting to compare gas and coal as such?
Accepted. There are many considerations and limitations. It is still correct as indicated in the comment that using most efficient technology would improve energy system for all conversion chains. Text revised accordingly. However, the st
16022 5 41 10 41 11 to much sources Editorial. We think these references can be useful to the reader.
3038 5 41 21 29 See above comment specific to lighting. Even though "abundant opportunities for improving energy efficiency exist at every link in the energy chain," for lighting specifically history shows such efficiency gains do not lead to lowered energy use [Tsao, J.Y., Saunders, H.D., Creighton, J.R., Coltrin, M.E., Simmons, J.A., 2010. "Solid state lighting: an energy-economics perspective." Journal of Physics D: Applied Physics 43 (35), 354001; also Saunders, H.D. and Tsao, J.Y. "Rebound effects for lighting," Energy Policy, 49(2012): 477-478]
Accepted. Rebound effect will be mentioned here but also the point that energy use would have increased more rapidly without efficiency improvement. Thus, the net effect is still one of saving; except for the rebound effect portion. Howev
9358 5 41 24 41 29 "Shifting to more efficient fuels (e.g., natural gas)" should be deleted from the sentence because you cannot argue it without considering energy security and economical aspect. According to a report issued by the Ministry of Economy, Trade and Industry of Japan, not only the efficient utilization of natural gas and nuclear but also coal is important for energy security and economical aspect. Please refer http://www.enecho.meti.go.jp/topics/hakusho/2010energyhtml/1-1-3.html
Rejected. Security issue and economics are important for all fuel choices, but natural gas can be both economic and can increase security as has been the case in the US with the shale gas. It is yet to be seen whether environmental compat
11735 5 41 27 Fuel itself doesn't have the efficiency and almost all combined cycle power plants are using natural gas. So it's not nesesarry the sentence [more efficient fuel (eg., natural gas) and].
Accepted. It is correct that fuels themselves do not have “efficiency” but their conversion to other energy forms has and as such natural gas is most efficiently converted to electricity and other energy forms. As the comment suggests, co
Page 42 of 78

Expert Review Comments on the IPCC WGIII AR5 First Order Draft – Chapter 5
Comment No
Chapter From Page
From Line
To Page
To Line Comment Response
3623 5 41 5 41 5 Please add "Econometric analysis of the Granger causality of China's economic development and primary energy demand reveals that only since the introduction of economic reforms in China in 1978, economic development has a significant expalantory power for energy consumption and related CO2-emissions (Oberheitmann and Frondel, 2006)." Please cite as: Oberheitmann, A. and Frondel, M. (2006). The Dark Side of China’s Increasing Economic Prosperity: Will Energy Consumption and Global Emissions Rise Drastically? Bleischwitz, R. and Budzinski, O. (eds.): Environmental Economics – Institutions, Competition, Rationality. Berlin: VWF, 207-224.
Rejected: This is too specialised a finding from a literature with literally hundreds of papers to include in this short section.
16021 5 41 shorter because some parts are redundant Accepted: Section has been drastically shortened in response to this and other reviewer comments.
14871 5 42 13 42 15 What is the basis of the comparison? Is it heating furnace vs. heat pump without considering production of electricity?
Rejected. The basis of comparison is the difference between the first and second-law efficiencies.
15064 5 42 18 citation format is incorrect. Accepted and corrected.12097 5 42 19 42 21 "The theoretical potential for efficiency improvements is thus very large, and
current energy systems are nowhere close to the most efficient levels suggested by the Second Law21 of Thermodynamics." This claim is unreferenced - please add this text and reference from IEA. "For instance, as the International Energy Agency (IEA) reported in 2006, The energy intensity of most industrial processes is at least 50% higher than the theoretical minimum determined by the laws of thermodynamics. Many processes have very low energy efficiency and average energy use is much higher than the best available technology would permit." Reference - International Energy Agency (2006) Energy Technology Perspectives 2006: Scenarios and Strategies to 2050, IEA, Paris
Accepted. Both the IEA and GEA reports will be cited. The later refers directly to the exergy potentials.
9359 5 43 Good figure. It would be more useful for readers to explain in more depth how the developed contries such as Japan have managed to improve its energy intensity /GDP per capita.
Noted with appreciation. It is difficult to add new explanatory text due to sever page limitations.
Page 43 of 78

Expert Review Comments on the IPCC WGIII AR5 First Order Draft – Chapter 5
Comment No
Chapter From Page
From Line
To Page
To Line Comment Response
14519 5 43 1 15 This is a example that makes my underlying problems with the analyses in this chapter quite clear.
There seems to be a confusion between the concepts that are assumed to influence any of the parameters, intensities or other variables and the way these are measured. I'll try to explain using figure 5.6.4.
The figure presents historic recordings of Energy Use per Gross Production as a function of Gross Production per capita. These indeed are two important parameters in the Kaya approach. Apparently data are available in two different measures of Gross Production (PPP and MER). What I would expect is that the authors would choose one of the two or even a combination, that would best reflect what is expected to be the underlying concept, rather than presenting both. I have no idea how exactly this figure now could be interpreted and why it is here.
What probably could be done is concluding that the relation between (E/G) and (G/P) could be approximated by a straight line (total production only?) on a double logarithmic plot with all of them more or less the same slope. It would then be very interesting to find explanatory variables or proxies for the different intercepts of the straight lines. This would help quantifying the parameters in the Kaya approach application in scenarios.
I would expect that any relation would be with the total energy use and not with "commercial" only. Use of energy in production processes (in TJ) will be largely independent of the original source of the energy fossil or something else! The processes need a certain amount of energy but in many cases the process equipment can be relatively easily chosen to take into account the different origins of the energy.
Rejected. It has been an explicit decision of the writing team to use both measures of GDP, namely MER and PPP. The use of one or the other makes a big difference. IPCC has been vehemently criticized in the past for not making this clear.
15930 5 43 11 43 12 This is a poor, or at least a very incomplete explanation of the differences in accounting methods. Please expand or delete.
Accepted and reworded.
5778 5 43 9 43 14 It is not clear what is meant here. The description of the "direct" method does not make sense. Accepted and reworded.16003 5 44 25 Might be intersting to mention that EI in China (at least when measured in PPP) has increased after having
reached global level in the early 2000s, see e.g. Steckel et al. 2011Partially accepted. EI in China did experience an increase between 2002 and 2004, but EI has continued to decline since then (Enerdata, 2012). Furthermore, Steckel et al., 2011 state that “the pattern of energy intensity development does not change considerably compared to using PPP”
5779 5 44 37 44 48 Suggest to delete paragraph, redundant. Accepted and deleted.4351 5 44 37 44 40 introduction of risk of substantial souorces of CO2 from forests is reasonable but enphasys of the risk may
confuse the readers of this chapter who want to understand mitigation potential of forest ecosystem.Accepted and reworded.
Page 44 of 78

Expert Review Comments on the IPCC WGIII AR5 First Order Draft – Chapter 5
Comment No
Chapter From Page
From Line
To Page
To Line Comment Response
8425 5 45 Please explain better what is included in both numerator and denominator of every data.“All PE carriers and CO2 emissions” means that CO2 from biomass combustion is included in the numerator and GJ of biomass primary energy is included in the denominator.“Without biomass CO2 (but incl. biomass PE)” means that CO2 from biomass combustion is not included in the numerator but GJ of biomass primary energy is included in the denominator.For the sake of clarity, I suggest to add the line of carbon intensity of only fossil fuels (CO2 from biomass combustion is not included in the numerator and GJ of biomass primary energy not included in the denominator).It must be also underlined that the assessment of the amount of biomass primary energy use is very uncertain, far more than fossil fuels PE.
Accepted. A new line added. This will be done next week.
4178 5 45 26 It is not clearly mentioned how "energy intensity" and "energy efficiency" differently work as a driving force. It seems to me that the latter is a driving force while the former is an outcome of structure changes.
Rejected. The section is about carbon intensities. However, the statement is not supported by appropriate references to be included in section 5.6.2.
14520 5 45 32 40 I propose to build this text on the information and explanations in the 2006 IPCC Guidelines, Energy Volume's introductory chapter. This presents tables with default values of energy per mass/volume of all relevant fuels (NCVs, if needed you can also find an explanation of the difference with GCVs) and of carbon contents, leading to default emission factors.
I would expect IPCC to use their own publications if possible.
Accepted. The IPCC publications now cited, both the WGII SAR as well as 2006 Guidelines. This will be added next week.
13033 5 45 34 45 This sentence indicates that oil is now the dominant fossil fuel, replacing coal. However, coal is still by far the dominant fossil fuel in terms of total electricity production. See p. 24: http://www.iea.org/textbase/nppdf/free/2010/key_stats_2010.pdf
Rejected. This is factually correct – oil is still the major energy source worldwide. However, it is also true that coal is the major source of electricity even though electricity’s share in global final energy is less than a quarter.
8423 5 45 37 5 43 I would generalize, using “renewables” instead of hydropower. Accepted and reworded.9360 5 45 38 45 43 It should be deleted because the shift mentioned here seems to be caused by the aspect of the energy security
rather than the increase of energy conversion. In the UK nuclear power station was introduced with a view to improve energy security as a main motivation.(Adam Corner et al,2011)
Rejected. The sentence provides a phenomenological statement and does not provide causality as suggested by the comment. There are many reasons for the shift and it is by no means clear that energy security was the main driver.
8424 5 45 44 46 2 I found this paragraph (and the following Figure 5.6.5) very difficult to follow. Usually, CO2 emissions from biomass (biogenic Carbon) are not counted in emission inventories, so if CO2 from biomass is accounted must be clearly stated.It is hard to believe that “biomass, like fossil fuels, has also contributed significantly to increases in atmospheric concentrations of CO2”, because CO2 levels in the atmosphere in the last 10.000 years, before 1750, have had very small variations (see figure SPM1 in AR4-WG1).
Rejected. Biomass resulting from deforestation associated with expansion of global land-use (mostly for agriculture) has been the major source of carbon emissions until fuel wood has been substituted by coal; see the estimates of the Glob
Page 45 of 78
Expert Review Comments on the IPCC WGIII AR5 First Order Draft – Chapter 5
Comment No
Chapter From Page
From Line
To Page
To Line Comment Response
7461 5 45 48 46 2 “Historically, emissions related to land-use changes (deforestation) have far exceeded carbon releases from energy-related biomass burning, which suggests that in the past, biomass, like fossil fuels, has also contributed significantly to increases in atmospheric concentrations of CO2 (Grübler et al., 2012)”. If wood etc. is not burnt for energy, then it will rot and release CO2 and CH4 etc. Therefore, energy related biomass burning should be discounted. It is land clearing for agriculture that is the main cause of CO2 release from woody biomass etc. However, some will have been used in construction etc., this is a long-tem store of C.
Rejected. Biomass burning related to energy uses (e.g. cooking or ore smelting) would result in CO2 emissions if associated with deforestation or not based on sustainable agricultural practices where the CO2 uptake through re-growth compe
17439 5 45 5 45 5 Fuel mix may not determine energy use but I would argue that by definition it determines CO2 emissions. Perhaps historically the correlation has been fairly weak, however in future it would be expected to be stronger e.g. With a greater share of renewables.
Accepted. “Fuel mix” deleted.
5351 5 45 44 46 7 Given the caveat at the bottom of page 45 about it not being approproiate to assume biomass in the past was carbon neutral, please consider taking out that line in Figure 5.6.5. This might be a case where it would be better to note use the same exact graphic that was in the paper that is being referenced if it causes difficulties communicating the points in Chapter 5.
Rejected. Instead an new line has been added in response to Comment 8425/595. This will be done next week.
9297 5 45 27 47 30 In order to facilitate sustainable development, the cement industry in Japan has developed co-processing technologies for energy mix. The reference shows a case study to utilize municipality wastes as alternative fuels and materials. (MORIMOTO, NGUYEN, CHIHARA, HONDA and YAMAMOTO; Journal of Life Cycle Assessment, Japan, Vol.2 No.4 October 2006 "Proposals for Classification and an Environmental Impact Evaluation Method for Eco-Services: Case study of Municipal Waste Treatment in Cement Production") and (Makoto HOKI and Hideto MASHITA, Journal of the Japan Institute of Energy, Vol. 87, 749 -752, (2008), "Trend of Biomass Use in the Southeast Asian Countries")
Rejected even though an important point. The reason is that it is too specific and given the server page limitation there is no obvious way of including the reference by adding just a word or two.
14872 5 46 The figure could be quite misleading, implying that a carbonization occur since 1850. It would be useful if you could add another line excluding not only CO2 emissions but also PE from biomass
Accepted and changed, also see Comment 8425/595.
9089 5 46 16 46 17 Decarbonization by nuclear seems to be quite difficult due to Fukushima for the future. At least not easy than before. Authors are recommended to prudently correct the sentence.
Accepted and reworded.
5780 5 46 19 46 25 Delete footnote - it is just "the Kaya Identity explanation" repeated again. Accepted and deleted.11736 5 46 8 46 21 Pacala et al. showed 15 options to reduce the emissions in which 5 are the near-zero emission technologies. And
also 0.3% of 2.0% can not be ignored. These indicates that existing low carbon technologies are expected to play a major role in the long-term stabilization of carbon emissions. Last Phrase should be amended to [This means higher carbon emissions compared to historical experience, so it gets more and more important to accelerate the decarbonaization by using low carbon technologies.]1.Pacala et al.:[Stabilization Wedges: Solving the Climate Problem for the Next 50 Years with Current Technologies], send attachment by another e-mail.
Accepted, last sentence reworded.
16004 5 46 8 11 plus: carbonization has mainly been driven by coal (e.g. Steckel et al. for a decomposition of carbon intensity in a Kaya framework)
Accepted and reworded.
8426 5 47 11 47 11 “presently stand at $80” It is better to show the average price in 2010 and 2011, because what is “present” is not clear for an IPCC report
Accepted and rewritten to reflect the suggestion.
2574 5 47 15 47 17 Mention to the infrastructure lock-in by the use of shale gas, World Energy Outlook 2011 Accepted, but lock-in refers to many infrastructures not only to shale gas ones.
5781 5 47 30 47 30 Footnote from "conventional Uranium" is missing. Accepted. Footnote added.
Page 46 of 78
Expert Review Comments on the IPCC WGIII AR5 First Order Draft – Chapter 5
Comment No
Chapter From Page
From Line
To Page
To Line Comment Response
16005 5 47 5 6 What does that tell us about GHG emissions? If oil is getting scarce i.e. more expensive, that would probably make coal to liquid more attractive; this should be discussed in this respect
Rejected. The page limitation is severe and adding new arguments is not possible especially as the suggested one refers to the future possibilities and not to historical or current situation.
5352 5 47 10 47 14 This sounds a lot like "peak oil." Please be careful here. There are many potential reasons for the observed trends. Suggesting that there is no more oil that can be had "working at maximum capacity" seems to be a real strech. Humanity has a very poor track record of prediciting peak oil but an amazingly strong track record of innovation that moves previous uneconomic or technically impossible to produce oil into oil that is flowing into global markets.
Accepted. The intention was not to rephrase the “peak oil’ arguments. Text has been revised.
5353 5 47 15 47 17 Cant cite the truly pesimistic Howarth et al 2011 article for a basic fact like shale gas production is growing. It would be far better to cite something that speaks directly to the narrow point being made here which is shale gas production is growing. Consider replacing the Howarth citation here with IEA, Golden Rules for a Golden Age of Gas, 2012, International Energy Agency: Paris. p. 150. EIA, World Shale Gas Resources: An Initial Assessment of 14 Regions Outside the United States 2011, Energy Information Administration, US Department of Energy: Washington, DC. DOE, Modern Shale Gas Development in the United States: Primer, 2009, Office of Fossil Energy, US Department of Energy: Washington, DC. p. 116.
Accepted and additional references added.
5354 5 47 18 47 30 Please make sure that the numbers presented here are consistent with the data in Chapter 7 that speaks to the same issues.
Accepted. The overlap must be avoided. See also response to Comment 13775/79. I will try to make suggestions next week after contacting Edgar Herwig.
8955 5 48 Figure is labeled poorly. redrwan4179 5 48 Is it possible to touch upon the difference in "freight transportation" and "passenger transportation" growth? shares given limited by page numbers
7462 5 48 . Not all the colors are identified. redrawn5782 5 48 Please redraw figure. Years are not given correctly and legend is missing in parts. rdrawn5231 5 48 The legend of Figure is partly lost in the copy. redrwan figures2220 5 48 1 48 1 Where is the power / energy sector? Strange to not include it in the overview chapter under energy chapter17440 5 48 15 48 16 Sentence is not clear to me text redrafted10437 5 48 20 48 31 Not necessary redrafted3624 5 48 20 48 31 What is the relative contribution of transportation by sea and by air? given in new text17441 5 48 26 48 27 Sentence is not clear to me - cars are Light Duty Vehicles too. corrected16006 5 48 28 Try to avoid citing the AR4 as a resource … if you do, you should explain what's new in AR5 looking back in history it may have some
relevance15007 5 48 8 48 10 Updated data of WEO2011 are available. noted used IPCC data4382 5 48 48 I cannot read axis labels, legend appears incomplete figures redrawn4381 5 48 7 48 9 Numbers are contradictory with fig 5.2.2 figures redrawn
Page 47 of 78

Expert Review Comments on the IPCC WGIII AR5 First Order Draft – Chapter 5
Comment No
Chapter From Page
From Line
To Page
To Line Comment Response
8556 5 49 PHRASEOLOGY TOO OBSCURE AND DEFINITIVE"Land use changes including planning and public transport also shape GHG growth from transport sector but these drivers are effective over large time scales(ITF, 2010)."RECOMMEND CLEARER STATEMENT... SUCH AS "Land use changes including planning and public transport may also shape GHG growth from transport sector but these drivers require large time scales to be effective (ITF, 2010)."ALSO SEE COMMENT 14
noted will adjust
8557 5 49 REPORT DOES NOT MAKE SUCH A FINDING."Land use changes including planning and public transport also shape GHG growth from transport sector but these drivers are effective over large time scales(ITF, 2010)."COMMENT: Reference should be deleted
noted will adjust as necessary
4180 5 49 "Heating" and "electricity consumption" should also be explicitly shown. I don't see the reason why only air-conditioning is separately shown.
redrafted
15010 5 49 19 49 21 Only carbon tax? How about other policies? noted15011 5 49 22 49 24 EV and biofuels do not necessarily reduce the GHG emissions. Only if selection is appropriate. noted but dealt with in Sector Chapter 8
15012 5 49 24 49 27 In terms of the previous sentence, this part must be more concrete. redrafted2223 5 49 28 50 39 Suggest to add the technological mitigations (wall insulation, multilayered windows, LEDs, solar heating, heat
pumps, etc.)Mitiagtation in Chapter 8
2179 5 49 28 50 39 There should at least a sentence or two about the important role Chine's building/construction industry has on the overall projectory of the global GHG emissions from the building/construction sector
noted
15008 5 49 3 49 4 Reference is gray literature, and not appropriate here. Grey literature allowed2221 5 49 32 49 32 Why is the unit CO2 and not CO2e, in refrigeration there should be a lot of f-gases noted and corrected13554 5 49 32 Again an unreferenced figure or not clear where data come from. now referenced source of data3086 5 49 33 emissions from buildings are not just from houses and offices but include all sorts of other buildings e.g. retail,
warehouses, data centres, public sector buildings (schools etc)data sources used has residential, commercial/institutional
15009 5 49 9 49 9 "Local" environment is better to clarify the kind of concerns. redrafted text6530 5 49 24 26 Modify the description, taking into consideration that life-cycle GHG emissions of at least HEVs and PHEVs can
be smaller than that of conventional gasoline vehicles regardless of the actual generation mix, as shown on IPCC/SRREN(2011) Figure 8.16.
under Transport Chapter
16899 5 5 Please make clear that wealth is not equal to emissions. Emissions are driven by the technology embedded in the existing capital stock. Future emissions will be driven by decisions we make regarding what technologies to deploy as we grow economies and replace our old capital stock.
Noted: The chapter is organized based on the IPAT decomposition so that the level of emissions depends on both the size of the GDP and the level and type of technology deployed. Income levels will likely affect those technologies adopted and this is discussed in the chapter but there is still plenty of opportunity to adopt more or less environmentally friendly technologies. We think that this is discussed well in the chapter.
16013 5 5 1 aerobic landfilling, seperate collection of waste fractions, pre-… Accepted
Page 48 of 78

Expert Review Comments on the IPCC WGIII AR5 First Order Draft – Chapter 5
Comment No
Chapter From Page
From Line
To Page
To Line Comment Response
12289 5 5 15 5 17 Is this true also if we want to define the MAIN driver(s)? You might consider to move this entire paragraph to the body of the text and delete it from the summary.
Accepted: The ES is being revised.
15054 5 5 17 should be a dot not comma Editorial4762 5 5 23 5 23 The "Kaya identity" is interesting however several criterias are inter-dependent (interactions between those
drivers). It is difficult to conclude …Accepted: The Section 5.3 where Kaya identity is introduced as well as the ES are being revised.
12853 5 5 23 5 23 It would be good to provide proper credit here and say "…the Kaya identity, a refinement of the IPAT identity,…" Accepted: The Section 5.3 where Kaya identity is introduced as well as the ES are being revised.
4763 5 5 33 5 33 What is behind "indirect effects"? Taken into account: Fixed based on the new chapter terminology.
7641 5 5 33 5 33 It is not clear what is meant by "indirect effects of population on emissions". Taken into account: Fixed based on the new chapter terminology.
9313 5 5 34 Please see if the phrase 'The emissions increase --' is actually 'The emission increase ---'. Editorial - text has changed9314 5 5 39 Please see if the word 'in' needs to be added at the end of the line. Editorial - text has changed15055 5 5 40 what other factors, could you give examples Accepted, text revised; fast economic
growth and reliance on fossil fuels - added.
16248 5 5 42 5 43 The meaning of the sentence is unclear. What is meant with the "initial stage", what with "further urbanization"? Does it refer to e.g., the first million people in a city versus the third or fourth million (progression in size)? Or is it the build-up of stocks versus the use of stocks (stock development)? Or does the statement refer to the fact that developing countries often have higher emissions in urban areas than in rural areas (on a per capita level), whilethe opposite is often the case in industrialized countries (progression in income disparity rural-urban)?
Accepted; all these items play a role. Revised and better explained.
15056 5 5 43 what is the emission? Total emissions or emission per capita? urbanization doesn't necessarily lead to a decrease of emission. It is really depending on the city initial set-up and the definition of urban area if you compare the U.S. and the Europe.
Accepted - It is per capita; revised based on revisions in Section 5.4.
16249 5 5 43 6 2 Meaning of sentence is unclear: Do the authors mean that it is unclear whether a declining household size might have a positive or negative impact on emissions, or that the extent of the negative effect is difficult to determine?
Accepted. The sentence has beeen rephrased.
2251 5 5 5 5 7 Gross misrepresentation of facts. Current population increase is almost exclusively in Africa and parts of india. Most of the rest of the world has a declining population, or is soon facing it. The GDP of the entire Western world is in the doldrums and many countries are hardly moving at all. All this is admitted in Chapter 14. What are you goiung to do about it?.
FT: This is CLA text, but facts remain facts.
16014 5 5 5 population has doubled since 1970 (in other part is named rise of 82%, page 4 line 33/34) Ferenc T and CLAs - FT: This is not my text.
12288 5 5 6 5 6 Please define PPP Accepted: We are revising the text.16203 5 5 6 define PPP; define GWP100 Accepted: We are revising the text.10748 5 5 7 5 7 The wording "...global GHG emission in GWP100 has increased.." should be changed. The emissions are
weighted by GWP-100.Accepted: We are revising the text.
7845 5 5 7 Emissions in GWP 100 is not a very common and scientific langauge. It is suggested to refer to CO2e. Accepted: We are revising the text.4520 5 5 8 5 30 This executive summary names as a driver “consumption” as well as “economic growth” in line 8 and “output” in
line24. Why are different terms used; I do not understand the reason? Suggest that the same terms be used or that the difference be explained and motivated. Shortening and avoiding discussing overlapping drivers several times would help the summary. The discussion of consumption-based accounting come up later; suggest that consumption be discussed at that point.
Accepted: The ES is being revised.
17442 5 50 1 50 1 "1990s" not "1900s" redrafted
Page 49 of 78

Expert Review Comments on the IPCC WGIII AR5 First Order Draft – Chapter 5
Comment No
Chapter From Page
From Line
To Page
To Line Comment Response
5783 5 50 12 50 15 Please add a reference sustaining the attribution "The cause of the greenhouse gas emissions in buildings is largely attributed to electricity use." If you include cooking (for example), you include a substantial amount of households using gas or "biofuels". The same holds true for heating purposes.
redrafted
9981 5 50 12 50 15 The cause of GHG emission in buildings is attributed to not only electricity use but also fossil fuel use such as natural gas. In addition, this part should explain that "heat pump technology" has potential to reduce GHG emission from electricity use in buildings, as described in (IEA, 2011, page16). This literature is listed in the No51 line of this table.
redrafted
3089 5 50 14 is it largely electricity use? Certainly in countries with a high heating demand (e.g. central and northern Europe) it's actually fossil fuels for heating. Worth making the distinction here, may be supported with a few examples.
redrafted
17443 5 50 14 50 15 Reference needed for statement about electricity use noted-redrafted4181 5 50 14 50 14 Air-conditioning is partly given by gas-based equipment. redrafted11286 5 50 16 50 22 We suggest including also "Building design" (buildings that are not properly designed according to the local
climate and use wrong building materials, tend to consume more energy than environmentally friendly architecture). Majority of existing modern buildings were designed and built when energy was cheap, as a result, they rely heavily on electricity for lighting, cooling and heating.
redrafted
11529 5 50 16 50 27 The number of causes and drivers for emissions from houses are far from complete. I miss reference to factors such as changes in climate (in many places of the world some warming has occured resulting in lower heat demand and in some places to higher cooling demand), behaviour (e.g. driven by energy prices), family size and heating systems.
redrafted
3087 5 50 2 is this supposed to read 1970s and 1980s (instead of 1900s)? Need to explain why economic decline in the EIT affected buildings emissions - is it about falling service sector emissions? Energy prices increased in the EIT and that may have had an impact on residential sector emissions. Plus there's been quite a lot of retrofitting of buildings and district heating systems which were notoriously inefficient.
noted will be considered
11737 5 50 28 50 31 IEA shows that heat pomp is one of key technology in building sector. Adding [such as introducing heat pump technology] after [an opportunity to deploy GHG mitigation options] would be better.1.IEA:[Technology road map], http://www.iea.org/papers/2011/buildings_roadmap.pdf
now in Chapter 9
17444 5 50 28 50 35 References needed Accepted (References added)3088 5 50 3 Chapter 9 says buildings account for 32% of global final energy and 23% of global primary energy use. Where
does the 40% come from and does it refer to primary or final energy use? Which figures are correct?There needs to be consistency between chapters!
noted-to be reconciled
2222 5 50 3 50 7 The three sentences are very very hard to understand. The 40% in sentence 1 are clear (though the chart on the previous page shows only direct emissions (no electricity)), then the breakdown in sentence 2 does neither add up to 40% not to 100%. Finally, in sentence 3, 110% of what are they growing to?
noted will be adjusted
14873 5 50 3 50 5 In chapter 9 it is mentioned "In 2009 buildings accounted for 32% of total global final energy use (IEA, 2012)". Here, the share of buildings is "more than 40% of global energy used". I suggest using the most recent reference (that is IEA 2012)
noted-to be reconciled
3090 5 50 35 50 36 Need to have a date and clarify potential here, i.e. 30% is cost-effective potential by 2030 (see chapter 9). Technical potential is much higher. For which year is the IPCC (2007) potential?
only considering historical trends
11842 5 50 35 50 35 This statement needs a reference. noted/redrafted5784 5 50 35 50 36 These two sentences are redundant, please delete one. noted/redrafted16024 5 50 35 50 36 redundant. And the potential is much higher. redrafted10384 5 50 35 50 36 the number is inconsistent (29% and 30%) redrafted
Page 50 of 78
Expert Review Comments on the IPCC WGIII AR5 First Order Draft – Chapter 5
Comment No
Chapter From Page
From Line
To Page
To Line Comment Response
17445 5 50 43 51 1 suggest re-naming "manufacturing industries and constrauction" as "Other manufcaturing industries and construction" (i.e. other than chemicals etc, given that on p.51 lines 7-16 chemicals (and others) are then described as being part of manufacturing). The reason that this category is the largest contributor is presumably just because it is more aggregated?
correct/indicated in new draft
2224 5 50 45 50 45 Check if not rather CO2e, given a lot of non-CO2 in industry taken care of in new draft4985 5 50 5 50 6 Sentence: of this 21 % …….10 % from Industrial buildings. The sum of this is only 48 %, what is the source of
remaining 52 %? redrafted
13515 5 50 5 50 6 Sentence: of this 21 % …….10 % from Industrial buildings. The sum of this is only 48 %, what is the source of remaining 52 %?
redrafted
3085 5 50 8 50 11 Why has the US been singled out here? Other countries have interesting emission statistics for buildings too. Would be more interesting to have e.g. some OECD or EU figures vs developing country figures here. The fact that US building emissions exceeds the combined emissions of Japan, France and the UK doesn't necessarily tell the reader much - the population of those three countries is about 60 mill lower than those of the US and there's a lot of difference in all sectors. Emissions per m2 would be more interesting.
redrafted
16023 5 50 8 In the US buildings account for …. redrafted10383 5 50 8 "GHg" should be "GHG" noted and corrected4383 5 50 3 50 5 Contradictory with fig 5.2.2 which indicates 15.3% of emissions attributed to buildings redrafted12098 5 50 38 50 39 "energy efficiency in homes has become more prevalent in the past several years, largely in the OECD countries.
An example would be goodNoted will be considered
12099 5 50 38 50 39 Coverage here regarding energy efficiency in residential buildings here does not address issues for energy efficiency in residential homes for the global poor, yet it is here that the largest energy efficiency potential exists. Please see Mills, E. (2005) ‘The specter of fuel-based lighting’, Science, vol 308, pp1263–1264 and Weiszakcer et al (2009) Factor Five:Transforming the Global Economy through 80% Improvements in Resource Productivity. Earthscan London - pp 92-96 available at http://www.naturaledgeproject.net/Factor5-Chapter2-ResidentialBuildingsSub-Chapter.pdf.pdf
noted-source to be reviewed
6531 5 50 1 "1980s" instead of "1900s"? redrafted7463 5 51 Lime production is a reversible reaction and does not lead to and increase in CO2. CaCO3 (heat) = CaO + CO2.
When used in the soil in absorbs CO2 and increases the pH. Ca(OH)2 + CO2 = CaCO3 + H2O. Similarly with lime in cement, some CO2 is reabsorbed when it sets.
noted- basing on IPCC 2006 industrial processes sources.
17447 5 51 17 51 18 should this sentence go before lines 15-16? (I think it would make more sense that way) noted17446 5 51 2 51 2 does the 16% growth refer to the period 1970 - 2002? removed17448 5 51 21 51 24 More accurately "The drivers for growth of GHG in industry....." ? Discussion is rather brief - could more space be
devoted to it?noted but allocated space limits also
11738 5 51 25 51 29 Nuclear power should be put into example of GHG mitigation options. now in sectior chapter9361 5 51 25 51 30 It should also add nuclear power as one of the potential mitigation measures.
Besides the voluntary action should be added as one of the policies because it is effective in the Japanese industry. Okazaki et al (2011) showed the effecitve example of the Japanese steel industry.
noted-mitigation options in Sector chapters
10385 5 51 25 52 6 There exist many spelling mistake as 'feedstocj', 'anf' and so on noted will spell check
Page 51 of 78

Expert Review Comments on the IPCC WGIII AR5 First Order Draft – Chapter 5
Comment No
Chapter From Page
From Line
To Page
To Line Comment Response
9423 5 51 25 51 30 ・Addition is needed for the description of the use of nuclear energy and for voluntary actions.・It would be appropriate to add, to the list of mitigation options, the use of nuclear energy that has an effect similar to or greater than that of measures which use renewable energy as described in FOD.・The draft stipulates that the technological options for GHG mitigation must be coupled with policies. However, voluntary actions should be treated equally to policies and added, since there are voluntary actions of the industry achieving significant effects as reported in Japan.・Refer to the following documents.
Okazaki et al. [1] showed that the Japanese steel industry responded to the Kyoto target by launching a voluntary action plan in 1996 a year prior to the adoption of the Kyoto Protocol with challenging quantitative target: 10% reduction of energy consumption in 2010 compared to 1990. Since then, the steel industry has made stead progress toward achieving these goals. As a result, the energy consumption in 2008 was 11.5% less in comparison to the 1990 level (equivalent to 12.1% reduction in CO2 emissions). [1]Teruo Okazaki, Mitsutsune Yamaguchi (2011)Accelerating the transfer and diffusion of energy saving technologies steel sector experience—Lessons learned Original Research ArticleEnergy Policy, Volume 39, Issue 3, March 2011, Pages 1296-1304http://www.sciencedirect.com/science/article/pii/S0301421510008827
[1]page 1296 right column line15-23
noted- will see what is applicabnle and what goes to sector chapters
9323 5 51 3 Please add 'in' after 'realized'. noted-whole text redrafted11994 5 51 31 51 33 Looking at the number of registered projects is giving the wrong pictures as these 0.6% actually represent more
than 50% of the actually issued CERs!!! In other words, the CDM has already had an enormous impact and there is still a huge potential to use the CDM to reduce emissions in the industry sector. Please look at the large amount of research performed under the High Level CDM Policy Panel on their dedicated webpage at cdmpolicydialogue.org.
noted and will be reviwed.
13694 5 51 31 51 33 Replace "CDM has … another 0.6%" by "CDM has been highly successful as an instrument to reduce emissions from industry, as large-scale options in Brazil, China, India and South Korea to reduce the industrial gases HFC-23 and N2O were mobilized rapidly (see Michaelowa and Buen (2012) for an account of this process). By August 2012, two thirds of the one billion isued CDM credits came from these project types (UNEP Riso Centre 2012). CDM has also mobilized waste heat recovery in heavy industry; the over hundred projects of this type have generated more than 50 million credits to date (ibid.)". References: Reference: Michaelowa, A.; Buen, J. (2012): The CDM gold rush, in: Michaelowa, A. (ed): Carbon markets or climate finance?, Routledge, Abingdon, p. 1-38; UNEP Riso Centre (2012): CDM pipeline, download at www.cdmpipeline.org. (Data should be updated at the time of finalization of AR5.)
not included in new version
10978 5 51 25 51 29 A one of the examples of mitigation measures, it is suitable to add the use of nuclear energy. belongs to Chapter 7
Page 52 of 78

Expert Review Comments on the IPCC WGIII AR5 First Order Draft – Chapter 5
Comment No
Chapter From Page
From Line
To Page
To Line Comment Response
12101 5 51 25 51 30 Paragraph starting with "There is a wide range of GHG mitigation options in the industry sector........" misses out3 key GHG mitigation strategies for industry sectors and manufacturing sectors such as 1) waste heat loss minimisation and waste heat recovery Reference for this - US DOE (2008) Waste Heat Recovery: Technology and Opportunities in U.S. Industry. US DOE at http://www1.eere.energy.gov/manufacturing/intensiveprocesses/pdfs/waste_heat_recovery.pdf + US DOE (2004) Waste Heat Reduction and Recovery for Improving Furnace Efficiency Productivity and Emissions Performance. A Best Practices Process Heating Technical Brief. US DOE. http://www1.eere.energy.gov/manufacturing/tech_deployment/pdfs/35876.pdf - 2) Combined Heat and Power - Co/Tri Generation - Ref Oland, C. (2004) Guide to Combined Heat and Power. Prepared for the U.S. Department of Energy. Industrial Technologies Program. Prepared by Oak Ridge National Laboratory. At http://www1.eere.energy.gov/manufacturing/tech_deployment/pdfs/guide_chp_boiler.pdf 3) improving the operational energy efficiency of manufactured products, appliances, IT vehicles, industrial and commercial cooking equipment. Whilst energy efficiency of product manufacturing processes is important, it is important to note that that life cycle analysis shows that for most “energy using” manufactured products (vehicles, computers, electric motors, appliances, engines, toner cartridges and buildings) over 70% of the total life cycle energy use occurs over the 5-30 plus years of operation
For example - Product, % of lifecycle energy usage from operation , reference.Cars, SUVs, pickups, buses - 65-74% (Chester, M.V. and Horvath, A. (2009) Environmental assessment of passenger transportation should include infrastructure and supply chains. Environmental Research Letters, vol. 4, no. 2, pp. 1-8) US Family Sedan 85% (Sullivan, J. L., et al., 1998, Life cycle inventory of a generic U.S. family sedan – Overview of results USCAR AMP Project, proceedings of Total Life Cycle Conference Land, Sea and Air Mobility, SAE International P-339, pp.114) Passenger transportation (private and public): 63-70% 63-70% (Chester, M.V., Horvath, A. and Madanat, S. (2010) Comparison of life-cycle energy and emissions footprints of passenger transportation in metropolitan regions. Atmospheric Environment, vol. 44, no. 8, pp. 1071-1079.))Aircraft 69-79% (Chester, M.V., Horvath, A. and Madanat, S. (2010) Comparison of life-cycle energy and emissions footprints of passenger transportation in metropolitan regions. Atmospheric Environment, vol. 44, no. 8, pp. 1071-1079.))Residential Buildings 80-90% (Ramesh, T., Prakash, R. and Shukla, K.K. (2010) Life cycle energy analysis of buildings: an overview. Energy and Buildings, vol. 42, no. 10, pp. 1592-1600)
Lighting – All Forms 98% Office Buildings 86% ICT network and mobile phones (e.g., 2G and 3G, not office network): 84% 79 -84% �
mitigation options in sector chapters now
6532 5 51 31 32 Modify the description, as CERs issuance up to 2012 for the industry projects including Cement, EE Industry, HFCs, N2O, PFCs and SF6 are expected to dominate 65% of the total issuance, according to UNEP RISO Center.
noted and excluded
12863 5 52 18 52 18 Add "Forests cover approximately 30% of global land area (FAO 2010)." Food and Agriculture Organization (FAO). 2010. Global forest resources assessment 2010. FAO, Rome, Italy.
Accepted
4986 5 52 19 52 20 Sentence: Forest fires-post burn decay was the largest contributor ……….(23.5%). The sum of % ges is almost 100 (99.8 %). Does that mean, contribution of FOLU to GHG emission consist almost only from these three items?
Taken into account: New data have been presented
Page 53 of 78

Expert Review Comments on the IPCC WGIII AR5 First Order Draft – Chapter 5
Comment No
Chapter From Page
From Line
To Page
To Line Comment Response
13516 5 52 19 52 20 Sentence: Forest fires-post burn decay was the largest contributor ……….(23.5%). The sum of % ges is almost 100 (99.8 %). Does that mean, contribution of FOLU to GHG emission consist almost only from these three items?
Taken into account: New data have been presented
12861 5 52 2 52 3 Say instead "Agricultural lands, including croplands and rangelands, occupy 40–50% of the ice-free land surface of the Earth and are expanding (Bartholomé and Belward 2005, Ellis et al. 2010)." Bartholomé, E. and A.S. Belward. 2005. GLC2000: A new approach to global land cover mapping from Earth observation data. International Journal of Remote Sensing 26: 1959-1977. Ellis, E.C., K.K. Goldewijk, S. Siebert, D. Lightman, and N. Ramankutty. 2010. Anthropogenic transformation of the biomes, 1700 to 2000. Global Ecology and Biogeography 19: 589-606.
Accepted
17415 5 52 37 Recommend a citation for this statement: "Consumption of livestock and aquaculture products is increasing because of increased income and production."
Taken into account: The sentence has bene deleted
7464 5 52 39 52 42 “The world population is expected to increase to 9.3 billion in 2050 causing greater demand for food but per capita land availability will be reduced to 0.152 ha (UNFCCC, 2012). This will necessitate intensification of agriculture and influence GHG emission”. Tempering population increase must be given prominence!
Noted
12864 5 52 43 52 43 For industrial agriculture as the main cause of tropical deforestation, cite Gibbs et al. 2010. Gibbs, H.K., A.S. Ruesch, F. Achard, M.K. Clayton, P. Holmgren, N. Ramankutty, and J.A. Foley. 2010. Tropical forests were the primary sources of new agricultural land in the 1980s and 1990s. Proceedings of the National Academy of Sciences of the USA 107: 16 732-16 737.
OK
7465 5 52 43 52 47 “Large-scale agro-industrial expansion is the dominant driver of deforestation. Across the tropics the total net increase in agricultural area was more than 100 million ha between 1980 and 2000, and more than 55% of new agricultural land came from intact forests, 28% from disturbed forests and 8% from shrub land (Gibbs et al., 2010). Land-use change for production of biofuel and livestock expansion is another driver of agriculture influencing GHG emission” The population in developing countries increase by about 75% between 1980 and 2000. In my opinion, this is the dominant driver of deforestation. I examined the rate of deforestation in every sub-Saharan African country between 1980 and 1990, and compared it to the increased demand for arable land based on the productivity for grain crops and population increase. This accounted for over 90% of deforestation. It is written up as Chapter 11 in Climate Change and Africa (2005). Ed. Pak Sum Low, Cambridge University Press, England U.K.
Noted
12862 5 52 7 52 27 Due to uncertainties in quantification of greenhouse gas emissions and removals, use appropriate precision by reporting results with only two significant figures. For example, say "30%" rather than "29.9%." Otherwise, the results imply a precision of measurement that current estimation methods cannot reach.
Accepted
10969 5 52 7 52 17 This comment about the agricultural contribution should specifically note that it is based on the 100-year GWP as the way of comparing GHGs, and that there are an increasing number of papers suggesting alternative metrics as more appropriate for use in the context of a stabilisation scenario.
Noted
5786 5 52 9 52 18 Please rework this paragraph. Not all water bottles end up in the ocean and it does not become clear why garbage is collected and what is done with it that warrants comparison with biomass. In addition, biomass can be garbage, too, depending on the definition of garbage / waste.
Noted. Not clear what was intended, but the section has been rewritten.
3528 5 52 In principle, 'Fisheries and Aquaculture' is included in 'Agriculture' sector and the title of the section 5.7.4 should simply be 'Agriculture, Forestry, and Other Land Uses (AFOLU)' to be consistent with chapter 11. Otherwise, please justify why 'Fisheries and Aquaculture' is treated separately.
Accepted
Page 54 of 78

Expert Review Comments on the IPCC WGIII AR5 First Order Draft – Chapter 5
Comment No
Chapter From Page
From Line
To Page
To Line Comment Response
3529 5 52 The analyses of emissions trends between 1970-2008 need to be improve by including the interannual variability of emissions for the sector (AFOLU) and the categories (for e.g. enteric fermentation, rice cultivation, forest fires) during the period. It may be useful to include a graph showing the trend and thus the interannual variability. This will help to better see what happened during that period.
Accepted
4182 5 52 The contribution of fertilizer and other chemicals in agriculture sector to the GHG emission should also be touched upon.
Accepted
8600 5 52 2 52 2 Other reference than UNFCCC (2012) (ie. the original study) should be citing the statement that "Agricultural lands occupy about 40–50% of the Earth’s land surface and are expanding"
Taken into account: The reference of FAOSTAT 2012 has been included and the sentence is also modified.
5355 5 52 43 52 46 Is there an IPCC definition of "large-scale agro-industrial"? That sounds like jargon here in Chapter 5. It might make sense in the paper that is cited here but the authors of Chapter 5 should rephrase this so readers don’t have to hunt down this Gibbs et al 2010 paper to learn what is and what is not within the bounds of this term.
Taken into account: The text has been modified
5785 5 52 1 53 8 This section is rather weak. You do not include any information on fisheries (besides two sentences on aquaculture), statements are not backed by references (e. g., lines 43, 47) and with all the numbers given in the first three paragraphs - did you consider putting them in a table?
Taken into account: The text has been deleted
10386 5 53 1 53 2 the unit for economic potential is hard to read Accepted, will be clarified17449 5 53 17 53 18 This sentence appears rather randomly Accepted, the sentence will be revised
10387 5 53 19 53 21 the numbers are misspelt where the dot '.' punctuation appears to be ',' Accepted, the numbers will be revised
13217 5 53 21 53 21 What is meant by "with an increment of 193, 5 %(" ? The relative increase from 734 to 1400 is 90% consistent with a relative share of a total emissions iicreasing by 80% evolving from 2.6 to 2.9 %
Accepted, the numbers will be revised
5787 5 53 25 I suggest to put this in a figure as the content would become much easier to understand. Accepted, will be analyzed the form more convenient
17416 5 53 6 "Because of scarcity of land andavailability of new technologies many of the underperforming or waste lands will be rehabilitatedcontributing towards enhanced food production and influencing GHG emission." This also seems highly optimistic and lacks a citation. Strongly recommend reframing this as a recommendation rather than a prediction for the future.
Accepted. The text has been revised.
18540 5 53 Much of the text and data in this section may be more aptly placed in the excursus section on Waste in Chapter 10. Please liaise with Ch 10 CLAs on this point.
Accepted, the liaison with Chapter 10 was realized in Vigo
12102 5 53 10 54 26 This entire waste summary offers no estimate of the potential GHG mitigation potential of the strategies summarised. This paper provides such an estimate. Bahor, B (2009) Integrated waste management as a climate change stabilization wedge. Waste Management & Research http://www.seas.columbia.edu/earth/wtert/sofos/wmr_nov09_p839.pdf This peer reviewed paper has calculated that integrated waste management offers an entire Socolow/pascala Wedge of GHG mitigation.
Accepted, the reference will be revised
5356 5 53 13 53 16 What is the citation and more importantly what is the significance for Chapter 5 of the following passage? "For example, 89 billion plastic water bottles are sold every 13 year throughout the world, and as garbage these bottles and other residues go to the ocean forming 14 the denominated ¨garbage island ¨ as the constituted by 6 millions tones of plastic between 15 California and Japan, or form accumulations in the coasts, rivers, lakes, and others."
Accepted, will be delated
4384 5 53 15 53 15 I am not an expert in that area, but 6 millions tons seems way under current estimates seen or heard in the news recently, a source should be cited
Accepted, will be delated
Page 55 of 78

Expert Review Comments on the IPCC WGIII AR5 First Order Draft – Chapter 5
Comment No
Chapter From Page
From Line
To Page
To Line Comment Response
5357 5 53 19 53 21 The authors of this section of Chapter 5 might want to look at Kuo et al 2011 for an example of how high MSW collection rates can be and the contribution of WTE facilities ....Kuo, J.-H., et al., Emission of carbon dioxide in municipal solid waste incineration in Taiwan: A comparison with thermal power plants. International Journal of Greenhouse Gas Control, 2011. 5(6): p. 1443-1453. DOI:10.1016/j.ijggc.2011.03.001
Accepted, the reference will be revised
3530 5 54 I would suggest that you merge Figures 5.7.4 and 5.7.5 and include emissions from Waste incineration. Please clarify whether the emissions are expressed as CO2-equivalent.
Accepted, maybe the figure change
5788 5 54 11 Footnote "1A" is not related to the text, can be deleted. Accepted, wii be deleted7320 5 54 7 54 10 These lines cite numbers from the TS for the AR4.WGIIIand thus have not been updated for the AR5. Moreover,
it would be better to reference the specific studies Monni et al. (2007) and EPA (2007) cited in Chap. 10.AR4.WGIII which were the basis for these numbers.
Accepted, we will revise the reference and try to improve the data
17450 5 54 7 54 10 would this be better represented in a chart? Accepted, we think about the best manner
17451 5 55 12 55 16 does not appear to follow from earlier part of the paragraph Accepted, we will move in the text or deleted
15291 5 55 21 55 22 It is stated that waste incineration is a method for mitigation. This is true for degradable waste but not for plastics where incineration with energy recovery is causing more emissions than landfilling, at least in a time perspective of a century (Eriksson, O. and Finnveden, G. (2009): Plastic waste as a fuel – CO2-neutral or not? Energy and Environmental Science, 2, 907-914).
Accepted, we will revise the reference and try to improve the text
15292 5 55 24 55 25 The statement could be modified to "Recycling is in general an effective means…". A reference could be added, e.g. Tyskeng, S. and Finnveden, G. (2010): Comparing energy use and environmental impacts of recycling and incineration. Journal of Environmental Engineering, 136, 744-748 or some of the references in this metasynthesis.
Accepted, the reference will be revised and the statement modified
4183 5 55 24 55 24 Recycling does not always result energy saving. Usually, especially in waste plastic recycling, recycling needs more energy than once-through production but contributes to conservation of land-fill space and resources.
Accepted, will be written more clear and exact utilizing other references
10899 5 55 28 Energy intensity as behavioural change? I guess aspects could be, but not all aspects. Energy intensity as framed in the Kaya or IPAT is often Energy/$. Energy intensity may have a strong technology aspect to it. I am not sure why you want to call this behavioural change, but perhaps explain in more detail.
Accepted (new additional text and figure on drivers and factors has been brought in to link behaviour to the Kaya identity)
13555 5 55 28 The section on behavioral change is a bit an open door. No real analysis of successful policies, quantified assesssment of what is possible in terms of reductions of impacts, etc. Should be expanded if the section aims to provide avenues for consumptoin oriented emission reductions.
Accepted (text has been revised majorly; additional examples proposed to be added by Michael)
18707 5 55 39ff Cite at least one or two of the "various studies" mentioned here Noted5789 5 55 41 Footnotes 2 and 2A are misplaced. Please move to where they belong. Noted. Removed5358 5 55 1 55 26 There is a significant literature that speaks to the benefit of combusting MSW in terms of CO2e that really ought
to be referenced here. There are many issues surrounding waste to energy facilities but whether they reduce GHG compaired to landfills isn't one of them. This body of knowledge should be cited here in this Section of Chapter 5. Luckow et al 2010 summarizes some of this literature... Luckow, P., et al., Large-scale utilization of biomass energy and carbon dioxide capture and storage in the transport and electricity sectors under stringent CO2 concentration limit scenarios. International Journal of Greenhouse Gas Control, 2010. 4(5): p. 865-877. doi: DOI: 10.1016/j.ijggc.2010.06.002 Cleary, J., Life cycle assessments of municipal solid waste management systems: A comparative analysis of selected peer-reviewed literature. Environmental International, 2009. 35(8). Consonni, S., M. Giugliano, and M. Grosso, Alternative strategies for energy recovery from municipal solid waste Part B: Emission and cost estimates. Waste Management, 2005. 25: p. 137-148.
Accepted, we will revise references , and introduce the theme of MSW combustion - waste for energy production
Page 56 of 78

Expert Review Comments on the IPCC WGIII AR5 First Order Draft – Chapter 5
Comment No
Chapter From Page
From Line
To Page
To Line Comment Response
18153 5 55 24 55 26 The statement "Recycling is an effective means to reduce energy use, CO2, NH4, N2O emissions and waste at the source at the same time" is inaccurate and wrong. Emission taxes, emission permits or direct emission regulations represent efficient measures to reduce emissions. Recycling is generally a costly instrument to reduce emissions, and the effects is highly unclear. Further, waste as such does not represent a clear problem in the GHG context. The important focus is on the methane and CO2 emissions from waste, and how these are handled. Such emissions can be reduced and even eliminated, even if the waste amounts increase.
Accepted, will be written more clear and exact utilizing other references
18152 5 55 9 55 12 Sentence needs rewording. Accepted, will be written more clear or deleted
8956 5 56 1 5 Hard to grasp without some detailed case studies of consumption patterns. Accepted (text revised)5790 5 56 10 56 10 Is this a "lack of real or imaginary opportunities" or does the theory indicate an imaginary lack of opportunities
(what may only be conceived, not real, while imaginary opportunities are not existent in reality).Accepted (this text has been deleted)
18709 5 56 14 Would be useful to get an example of the institutional and physical structures that influence or constrain behavior.Noted (to include an example where possible from peer reviewed literature)
10901 5 56 15 56 17 What is the citation for "several studies". Also, the data is in emissions while the sectio is about energy intensity. It is no surprise that countries have large co2 per capita differences given different energy systems and resources, but you need data on energy consumptino per capita.
Accepted (text modified to reflect variation in energy consumption per capita; Citation added accordingly)
18710 5 56 16f There are regional differences of the same magnitude within countries as well, e.g., NY and CA have much lower CO2 emissions than other US states, for reasons similar to those given in lines 17 and 18.
Accepted (original text deleted and modified)
17417 5 56 20 56 28 This chapter begins talking about energy choices, but then invokes an example of eating choices. Recommend caution in conflating all GHG-emitting activities under the category of energy.
Accepted (text modified to link emissions to dietary choices)
18711 5 56 22 what are "inherent behaviors"? Noted (Inherent behaviour refers to behaviours that are historically/culturally rooted within an individual)
10900 5 56 23 56 28 Some references would be good. And this is in terms of "emissions" and vegetarian vs meat is not so much about energy intensity (in the fossil sense). This example does not really fit in this section, at least without rewording considerably to make it an energy efficiency issue.
Accepted (Reference added and text reworded)
18712 5 56 23 57 6 All the results mentioned in this passage should beprovided with references to the studies from which the results come. I have at least 6 instances where i would have liked to see the paper that substantiated a claim made, from vegetarianism and CO2 emissions to rebound effects.
Accepted (References added)
5303 5 56 32 ADD; In 2012, the French government announced a new law imposing progressive tariff on energy (gas, electricity) beyond a basic necessity threshold (under which the cost is decreased by between 3% and 10% from present tariff). The problem is finding clear and quantifiable criteria for the threshold. Three levels are to be taken into account according to the number of occupants and the region. But there is concern as poor people tend to live in energy inefficient housing and thus, could pay a high tariff just to remain in the basic comfort zone.
Rejected (does not fit in with the context in this section and not strongly supported by literature)
17452 5 56 32 40 References needed Accepted (Reference added)17453 5 56 48 49 References needed Accepted (References added)18713 5 56 48 57 6 It may be better to move this important distinction to the beginning of the section, and to perhaps organize the
section around the distinction. Accepted (text revised)
18708 5 56 9f Can the label "ipsative theory" be explained or defined? And what are imaginary opportunities and why do they matter? Should it be "imagined"?
Accepted (text deleted)
17454 5 57 1 6 References needed assmbled will be added to Zotera.
Page 57 of 78

Expert Review Comments on the IPCC WGIII AR5 First Order Draft – Chapter 5
Comment No
Chapter From Page
From Line
To Page
To Line Comment Response
10903 5 57 15 "annihilated" is perhaps not the best word to use here. Referneces also. Will there be another section in WGIII discussing technological change? Point to that.
Accepted, word will be changed to "reduced".
3041 5 57 26 28 I believe the AEEI concept was originally due to Manne & Richels [Manne, A.S., Richels, R.G., 1992. Buying greenhouse insurance—the economic costs of Co2 emission limits. MIT Press, Cambridge.]
Accepted, add original ref
10902 5 57 5 Some references for the "rebound effect" would be good. Is there a section in WGIII which covers this in detail? Link to that.
Accepted (text of both the behaviour section and technological change section link to rebound effect)
10905 5 57 What is "technocal change"? Perhaps needs a definition. How is technology change seperated from efficiency improvements (which were earlier classes as behavioural). It can be argued that the definition is somewhat arbitrary depending on the sector detail Weber, C.L., 2009. Measuring structural change and energy use: Decomposition of the US economy from 1997 to 2002. Energy Policy 37, 1561-1570.
Accepted, will be added to the Glossary. Chapter introduction will include a figure clarifying term.
3296 5 57 7 61 19 This is a strong, informative section and should be retained as is. Thank you.16025 5 58 16 58 17 to much sources Rejected, we felt these sources were
needed12039 5 58 24 58 47 The importance of subsidies and state-led programs in R&D for technological change as well as investment
should be mentioned, e.g. Energy Transition Policies in Germany towards renewable energy sources.Accepted, will search for references
8957 5 58 37 40 Where have exceptional R&D efforts been undertaken, how have they succeeded, and how can they be expanded?
Accepted, if literature can be found. See also 12039 and 5360.
3264 5 58 45 59 30 The de la Tour 2011 paper is cited heavily, and yet it is only one paper on the Chinese PV industry (and one that many experts in this field believe took a rather superficial look at technology transfer in the industry). Suggest citing a much broader body of evidence on the Chinese PV industry, or would be even better to use other industries and other countries in this section to build a broader case.
Accepted, other references will be looked up and text will be changed accordingly
10904 5 58 Earlier sections of this chapter also discuss historic patterns of energy change, but draw on different literature. Structural and Index decomposition analysis is relevant here. The CLA (Sangwon Suh) should be able to point to the literature, or see earlier sections in the chapter
Accepted, Suh will be asked
5360 5 58 24 58 47 For what it is worth, Dooley identified a number of these historical drivers that are discussed here in 1998. Dooley, J., Unintended consequences: energy R&D in a deregulated energy market. Energy Policy, 1998. 26(7): p. 547-555.
Accepted, although reference is relatively old so we will need to see whether to include it.
5359 5 58 30 58 40 The work of Alpanda, S. and A. Peralta-Alva 2010 is a useful example of how a step level change in an economy's energy efficiency has happened and might be worht citing here. Alpanda, S. and A. Peralta-Alva, Oil crisis, energy-saving technological change and the stock market crash of 1973-74. Review of Economic Dynamics, 2010. 13(4): p. 824-842. DOI: 10.1016/j.red.2010.04.003
Accepted, thank you for the reference
13556 5 59 I would have expected a discussion of rebounds in the consumption section Noted - however they were allocated seperate sections
5791 5 59 1 59 30 Please rework this section. It is not paramount WHO found something, but what has been found and what is still not understood or included. As it is a statement like in lines 10 to 17 leaves the reader with the question "And what does this imply?" as you offer no insights beyond a mere description. Please give some more thought to what are the core findings regarding system aspects and concentrate thereon.
Rejected. Unclear what the comment refers to. WHO is not quoted on this page.
3265 5 59 10 59 17 The discussion of Technological Innovation Systems repeats what is already discussed at more length in Chapter 4. Suggest deleting from this chapter.
Noted
4184 5 59 26 59 30 The acquisition procedure of skills and know-hows in industry should be documented based on broader literature. For instance, it is well understood in Japan that the retired engineer and managers were broadly hired by Chinese companies and taught them.
Rejected. Impossible to provide such detail and no peer-reviewed references suggested.
Page 58 of 78

Expert Review Comments on the IPCC WGIII AR5 First Order Draft – Chapter 5
Comment No
Chapter From Page
From Line
To Page
To Line Comment Response
17455 5 59 29 30 Meaning not clear to me Agreed, sentence has been removed as part of re-write.
2225 5 59 31 60 12 This is a super interesting and very tricky topic, very limited literature. 1) Check out the work from Steve Sorrell at UKERC (http://www.ukerc.ac.uk/support/tiki-index.php?page=0710ReboundEffects), 2) it would be really helpful to get NUMBERS on this from the equilibrium models, isn't there anything? e.g. if one would reduce fuel efficiency by 30% in all new cars, would they actually drive more?
Noted - now been included
15065 5 59 43 this is a problem on citation. Noted3043 5 59 43 45 The backfire condition is slightly subtler than stated here: for a CES function, the elasticity of substitution between
energy and other inputs need only be greater than one minus the energy value share [H.D. Saunders, "Fuel conserving (and using) production functions," Energy Economics 30 (2008) 2184 2235]
Saunders work now included
3044 5 59 45 49 Actually, a response to Howarth showed his result depended on an extreme assumption of Leontief (fixed factors) production. A number of researchers (e.g., Sorrell) seem to treat this rebuttal as definitive. [H.D. Saunders, "Does predicted rebound depend on distinguishing between energy and energy services?" Energy Policy 28(6-7) (2000b) 497 500.]
Saunders work now included
9255 5 59 10 59 15 Does the TIS approach take into account recent developments in social media as informers and influencers? 2008 is 5 years old; we should be looking 5+ years ahead.
TIS is not incompatible with social media, and this chapter looks at historical trends. However, TIS will be treated in Ch3.
10906 5 59 This is drawing on quite old literature. What has happened since AR4? What does the latest literature say? Accepted- considerable number of new references have been added
6517 5 6 1 2 Modify the description after "while", as it contradicts with the descriptions of P.31 line 27-28, P.32 line 11-12, and P.32 line 27.
Accepted. The sentence has beeen rephrased.
16015 5 6 1 6 2 Why is this efect not clear? Decline of household size cause more squere meter living space, more waste, more furniture and electric domestic products more energy use, more cars etc.)
Rejected - Because that's what the literature says - see Section 5.4.
16900 5 6 14 16 Seems to contradict lines 3 through 8 on page 7? Rejected: There is no contradiction. Page 7 says that changes in energy intensity are affected by structural change, p6 says that they are less important than efficiency improvements inside sectors.
16016 5 6 14 6 16 sometimes is it more and sometimers less important that depends of the special situation Accepted: The ES is being revised.7642 5 6 14 6 14 What is meant by "sector shifts". Increase in output in one sector at the cost of another sector? It might be worth
mentioning that the effect of such shifts are deemed to be less important because the amount of embodied (life-cycle) emissions are not strongly affected (if this is what the argument is trying to say).
Accepted: The ES is being revised.
Page 59 of 78

Expert Review Comments on the IPCC WGIII AR5 First Order Draft – Chapter 5
Comment No
Chapter From Page
From Line
To Page
To Line Comment Response
8815 5 6 17 8 41 There appears at least a tension between page 6 '17 Economic growth, in turn, is related to the level of consumption of goods and services; once the level of consumption is isolated as an individual driver of emissions, it is by far the most significant driver in both developed and developing countries (high agreement, robust evidence). This is the conclusion of numerous studies that have undertaken a structural decomposition analysis to identify the role of different drivers.' and page 8 '41 In view of this assessment, technological change and individual behaviour becomes key aspects for future efforts on climate change mitigation.' Given the acknowledgement of the rebound effect on page 7 this tension appears profoundly ideological, as if the authors of this chapter cannot question consumerism which is the institutionalised driver of unsustainable consumption and CO2 production by individuals and organisations. Simplifying here for brevity the causal chain of this consumerist driver of emissions goes via two routes to most likely one source. (1) Conventional economics is based on the utilitarian ethical assumption that more consumption is good - effectively turning greed from a classical vice (cf. Aristotle, etc.) into a virtue 'greed is good' - this is recognised JM Keynes among others. This is then closely linked to politician in 'liberal' 'representative' 'democracy' effectively buying votes by forever promising better material standards of living to all, as the politician have bought into the utilitarian ethical assumptions embodied in economic practice (2) As Kevin Anderson (2009, Climate change in a myopic world, Tyndall Briefing Note No. 36 – May 2009, http://www.tyndall.ac.uk/sites/default/files/bn36.pdf) writes 'Do we continue to pay lip service to the issue of climate change, and hope future generations will understand our preference for barely-veiled hedonism over stewardship?' In similar but much stronger terms Wenz argues that consumerism harm everybody, societies the Earth System specially that it implicated in suffering of the global poor including increases in some causes of malnutrition, health effects of pollution, greater inequity, unjust displacement from traditional neighbourhoods resulting in poorer living and working conditions, family break up and child prostitution. Indeed, he then compares selfishness and indifference in rich consumers with German citizens in Nazi Germany (Sandler R and Cafaro P (Eds.) (2005, 199-207) Environmental virtue ethics, Lanham, Md.: Rowman and Littlefield). I shall not dwell on if there is truth in what Wenz argues what this makes ideologues who promote consumerism. Perhaps the most important analysis of the causes of consumerism as the cause of environmental stress is Tim Jackson's 2002 'Consumer Culture as a Failure in Theodicy' (in Consumption, Christianity and Creation - Proceedings from an Academic Seminar held on 5th July 2002, Sheffield: Centre for Sustainable Consumption) most notably the lack of understanding of philosophical ideas of virtue by authors in Jackson including Malthus and Nietzsche. See MacIntyre A (1990, Three Rival Versions of Moral Enquiry. London: Duckworth) for a philosophical discussion of the problems Nietzschean ethics. So it can be argued that ultimately the causal chain of wanton climate change emissions can be traced back to the hedonism justified by poor theology by Rev. Malthus.
Noted
12290 5 6 17 6 21 Should this important finding on the role of consumption be included in the SPM? Accepted: The SPM is being written.16017 5 6 17 6 21 redundant Accepted: The ES is being written.12291 5 6 22 6 25 Please state confidence or agreement in statement on effect of trade. Also, should this statement be included in
the SPM?Taken into account: Implying cause to trade related emissions is not easy and this uncertainity has now been reflected in the re-write. Additional references, including Jakob and Marschinski (1012) have been included in an attempt to show the difficultly of signing causality.
Page 60 of 78

Expert Review Comments on the IPCC WGIII AR5 First Order Draft – Chapter 5
Comment No
Chapter From Page
From Line
To Page
To Line Comment Response
12533 5 6 24 While gross trade volume has certainly grown as the global economy has grown, the pattern in the relative proportion of traded goods and services to global GDP over the last 150 years is more mixed. This raises interesting questions concerning whether terms of trade are a real driver or instead a consequence of deeper structural shifts in global economic systems, relative costs of primary inputs, and patterns of population growth and demographic transition. This may have important implications for policy structure to affect production and consumption patterns aggregated to a global scale.
Accepted - in an atempt to recognise the complexity of international emissions transfers, additional text has been added to recognise the causes and not just describe the current situation. The text does still not provide a comprehensive assessment of how each driver affects emissions though as we would conclude that the literature does not, at this stage, provide a comprenhesive answer.
16901 5 6 26 32 Good! Manufacturing is linked to emissions with the existing energy system/technologies. Manufacturing needs energy, which creates emissions. Trade lets manufacturing move from developed to developing countries, providing benefits to both countries.
Noted
13763 5 6 28 6 30 I would dispute the evidence classification. Is there any evidence that points in the other direction? Some industrialized countries, such as Canada, Australia, and until a decade ago, Norway, have predominantly high emissions intensity exports, i.e. natural resources. For these countries, consumption-based emissions are hence lower than territorial ones. However, this does not contradict the statement presented here. It just needs to be made clar that not all developed countries have low emissions intensities.
Taken into account - covered with the addition in figure in section 5.5.3
7643 5 6 31 6 32 I think this has been said previously. Noted - Section is rewritten.12534 5 6 33 It is asserted that trade is not a driver of global emissions per se, but an argument to the contrary can be made,
because trade may privilege luxury, “high value” or high-embedded carbon production and consumption over subsistence. This may be a useful avenue for research.
Accepted - in an attempt to recognise the complexity of international emissions transfers, additional text has been added to recognise the causes and not just describe the current situation. The text does still not provide a comprehensive assessment of how each driver affects emissions though as we would conclude that the literature does not, at this stage, provide a comprenhesive answer.
7458 5 6 39 6 42 “Long-term statistical records show improvements in energy intensities of economic outputs (measured by GDP) by more than a factor of five since 1800 when traditional biomass fuels are included in the measure of energy inputs, corresponding to an average decline of total energy intensity of about 1% per year”. For 210 years at 1% increase per year will give an 8 fold increase not 5!
Accepted. The mistake must have occurred during the shortening of FOD text. I will provide the correction next week with relevant references.
2252 5 6 9 6 9 "The OECD showed considerable growth levels" which have now ceased. Rejected: First, the chapter refers to economic growth over the 1970-2010 period. While GDP did fall in most countries in the 2008-9 recession, the economy is now growing in most developed countries and especially in the US.
Page 61 of 78

Expert Review Comments on the IPCC WGIII AR5 First Order Draft – Chapter 5
Comment No
Chapter From Page
From Line
To Page
To Line Comment Response
13557 5 60 I miss in the section on lock in of infrastructure a reference to a very insightful Science 2010 paper of Davis and Caldeira, who caclulated how much CO2 emission still will be emitted by infrastructure available in 2010 during its normal still remaining economic lifetime
thanks, ref added.
5923 5 60 23 32 I find it slightly strange that coal-CCS for developing countries is mentioned in a negative sense. In reality, for instance Germany is at the moment building 19 GW of new fossil capacity, largely due to the decision to abandon nuclear power. This is new fossil capacity without any CCS, a good example of lock-in to the worst options with regard to climate change. Shouldn't this be mentioned as well ?
accepted. Changes made
12618 5 60 29 60 32 Bioenergy and CCS is a very valid technology but may be constrained by the availability of sustainable biomass. This must be taken into account when estimating the infultration of bio CCS into any overshoot scenario.
accepted, changes made
12661 5 60 29 60 32 Bioenergy and CCS is a very valid technology but may be constrained by the availability of sustainable biomass. This must be taken into account when estimating the infultration of bio CCS into any overshoot scenario.
accepted, changes made
17456 5 60 31 32 worth mentioning possible constraints on large scale BECCS (availability of resources/land etc; fact that emissions may actually increase if appropriate land use controls are not in place)
accepted, changes made
5792 5 60 31 60 31 What does "BECCS" stand for? accept, give full17457 5 60 39 60 43 is this relevant to infrastructure? accetped, changes3045 5 60 4 12 This section is somewhat out of date. Numerous researchers have now made rebound estimates that are well
above this. A good source of a richer and more recent bibliography is [ref: H.D. Saunders, "Historical evidence for rebound in 30 US sectors, and a toolkit for rebound analysts," (2011, under review) available at http://works.bepress.com/harry_saunders/9/] This particular paper shows direct rebound magnitudes of 50% and more for certain sectors. Frondel et al. report rebound magnitudes of around 60% for private transport in Germany [Frondel, M., Ritter, N., Vance, C., "Heterogeneity in the rebound effect: Further evidence for Germany." 2012 Energy Economics 34(2): 461-467.]. Recently, Stern and Kander have reported results for 150 years worth of data for Sweden that give rise to economy-wide energy efficiency rebound in excess of 75% over that period. [Stern, D.I. and A. Kander (2012). “The role of energy in the industrial revolution and modern economic growth.” The Energy Journal 33(3):125-152] For analysis showing how the Stern and Kander results deliver this rebound magnitude, see [H.D. Saunders, "Rebound implications of the Stern and Kander article" (under review) (2012) Available at: http://works.bepress.com/harry_saunders/33 ]
Accepted. The text and references has been revised.
12540 5 60 43 Drop or reword the phrase, “especially for BRIC after the centre of gravity of global economy moved to Asia.” There is no objective meaning to “centre of gravity of global economy,” and neither Brazil nor a substantial portion of Russia are in Asia. If the phrase remains, it should refer to the relative development of the trade-oriented coastal economy of Asia from Karachi to Seoul.
accepted, changes made
17458 5 60 47 60 48 comment of Germany and Japan appears rather randomly and does not relate to infrastructure. (It might fit better at the end of the first paragraph on p.61?)
accepted. Deleted
16026 5 60 7 60 8 to much sources Rejected, we felt these sources were needed
10910 5 60 A relevant reference here is http://www.sciencemag.org/content/329/5997/1330.full.pdf accepted, literature reviewed and added
17916 5 60 14 60 17 Please link the use of the term 'infrastucture' to the definition in the Glossary. accepted. Links made to the glossary
Page 62 of 78
Expert Review Comments on the IPCC WGIII AR5 First Order Draft – Chapter 5
Comment No
Chapter From Page
From Line
To Page
To Line Comment Response
5361 5 60 23 60 25 This reviewer does not follow the stated causality of post WWII and low energy prices and today's GHG emissions. What's the specific technical point being made here and is it an important one. If yes, I would elaborate the point and cite additional peer reviewed literature that is focused specifically on the point being made here rather than pointing the reader to a massive IPCC report that was writen in 2007 and that somewhere contains something that relates to this issue.
noted. Additional literature is being searched to further substantiate and specify this point. Text will be changed in the following revisions.
4385 5 60 29 60 31 more undefined acronyms accepted. Full terms are given.17805 5 61 62 Health co-benefits: I found it disappointing and reductionist the way on how the health co-benefits have been dealt
with - there is a whole series in the Lancet of 2009 - with six chapters dealing with the cobenefits for human health of mitiagtion
noted, will assess
17459 5 61 1 61 5 is this relevant to infrastructure? Also the comment on highway vehicles is not clear to me. accepted, rewrite9424 5 61 15 61 19 ・Addition is needed for the description of voluntary actions.
・The draft claims that absence of policy intervention leads, through the lock-in effect, to loss of consumption and of welfare. However, voluntary actions should be treated equally to policy intervention and added, since there are cases of voluntary actions of the industry achieving significant effects as reported in Japan.・Refer to the following documents.
As examples of successful voluntary actions, Wakabayashi has analyzed the case of decreasing the standby power of devices in Japan and the case of PFC emission reduction in the global semiconductor industry [1] [2]. The program for decreasing the standby power of devices in Japan set the goal of lowering the standby power of every major device to 1W or less by the end of fiscal 2003, the most ambitious goal in the world, and strong commitment of the industrial association achieved this goal for all devices. The semiconductor industry successfully reduced PFC emission through voluntary actions as the participating corporations shouldered burdens greater than those dictated as the norm by business standards, in order to mitigate global warming.The evaluation report for fiscal 2011 of the third party committee on the Japan Business Federation’s voluntary action plan on the environment, released on April 23, 2012, reported that CO2 emission from the industry and from the energy conversion sector (34 categories of business) in fiscal 2010 was 443.47 million tons, which was a 5.3% increase over fiscal 2009 and 12.3% decrease from fiscal 1990, the basis year, and evaluates this result highly as the result of persistent efforts of the industry to achieve the goal in accordance with its voluntary action program [3]. Okazaki et al. [4] showed that the Japanese steel industry responded to the Kyoto target by launching a voluntary action plan in 1996 a year prior to the adoption of the Kyoto Protocol with challenging quantitative target: 10% reduction of energy consumption in 2010 compared to 1990. Since then, the steel industry has made stead progress toward achieving these goals. As a result, the energy consumption in 2008 was 11.5% less in comparison to the 1990 level (equivalent to 12.1% reduction in CO2 emissions).[1] Masayo Wakabayashi“Success case study of voluntary actions in Japan, 1: Action to decrease standby power of devices,” Socio-Economic Research Center, Central Research Institute of Electric Power Industry, Discussion Paper (SERC Discussion Paper):SERC11035 http://www.climatepolicy.jp/thesis/pdf/11035dp.pdf[2] Masayo Wakabayashi“Success case study of voluntary actions in Japan, 2: Semiconductor industry’s actions to reduce PFC emission to mitigate global warming,” Socio-Economic Research Center, Central Research Institute of Electric Power Industry, Discussion Paper (SERC Discussion Paper):SERC11041http://criepi.denken.or.jp/jp/serc/discussion/download/11041dp.pdf[3] Evaluation report for fiscal 2011 of the third party committee on the voluntary action plan on the environment http://www.keidanren.or.jp/policy/2012/029.pdf[4]Teruo Okazaki Mitsutsune Yamaguch (2011)
rejected, as voluntary actions are not linked to locked in effect assessments.
Page 63 of 78

Expert Review Comments on the IPCC WGIII AR5 First Order Draft – Chapter 5
Comment No
Chapter From Page
From Line
To Page
To Line Comment Response
17460 5 61 17 61 18 Meaning not clear to me accepted, changes made8958 5 61 27 Along with co-benefits there may be unintended consequences or side effects, such as reducing sulfur emissions
making GH warming stronger.noted, but this is addressed alswhere.
8985 5 61 27 62 23 This section is missing several of the key recent references on the air pollution and health co-benefits of GHG mitigation. These include: van Vuuren DP, Cofala J, Eerens HE, Oostenrijk R, Heyes C, Klimont Z, Elzen MGJd, Amann M (2006) Exploring the ancillary benefits of the Kyoto Protocol for air pollution in Europe. Energy Policy 34:444-460, and the review article: Bell ML, Davis DL, Cifuentes LA, Krupnick AJ, Morgenstern RD, Thurston GD (2008) Ancillary human health benefits of improved air quality resulting from climate change mitigation. Environmental Health 7
accepted, added.
8986 5 61 27 62 23 In addition, the health co-benefits of reducing short-lived climate forcing agents was addressed by: Shindell D, Kuylenstierna JCI, Vignati E, van Dingenen R, Amann M, Klimont Z, Anenberg SC, Muller N, Janssens-Maenhout G, Raes F, Schwartz J, Faluvegi G, Pozzoli L, Kupiainen K, Hoglund-Isaksson L, Emberson L, Streets D, Ramanathan V, Hicks K, Oanh NTK, Milly G, Williams M, Demkine V, Fowler D (2012) Simultaneously Mitigating Near-Term Climate Change and Improving Human Health and Food Security. Science 335 (6065):183-189
accepted, changes made
8987 5 61 27 62 23 Our own work has shown that methane emissions abatement also has ozone air quality and health co-benefits, as methane is an ozone precursor. See West, J. J., A. M. Fiore, L. W. Horowitz, and D. L. Mauzerall (2006) Global health benefits of mitigating ozone pollution with methane emission controls, Proceedings of the National Academy of Sciences, 103(11): 3988-3993, doi: 10.1073/pnas.0600201103, and West, J. J., A. M. Fiore, and L. W. Horowitz (2012) Managing ozone air quality by reducing methane emissions: abatement costs and mortality benefits in scenarios to 2030, Climatic Change, 114: 441-461, doi: 10.1007/s10584-012-0426-4.
accepted, changes made
8988 5 61 27 62 23 We plan to submit a paper this fall that estimates global co-benefits for air quality and human health of GHG mitigation, building upon the RCP scenarios. Since we use the RCP scenarios, we expect that this will be a good way of relating this chapter to the work of WGI and WGII. I will send the paper to the authors of the chapter when it is submitted.
noted, thanks. Waiting….
11739 5 61 37 61 42 Nox and Sox can be removed with high efficiency as Taylar et al. and Yeah et al. show in their respective paper.It isn't appropriate to link reducing the greenhouse gasemissions with improving air quarity.These sentence should be deleted all.1.Taylar et al.:[Regulations as the Mother of Innovation], http://gspp.berkeley.edu/academics/faculty/docs/mtaylor/Taylor%20et%20al%20-%20Reg%20as%20Mother%20of%20Innov%20-%20LaPo%2005.pdf2.Yeah et al.:[Technology Innovations and Experience Curves for NOx Control Technologies], http://gsppi.berkeley.edu/faculty/mtaylor/taylor_expcurvenox.pdf
rejected. As developing countries can be in a different situation, it is factually correct.even in developed countries, lower carbon based energy consumption will lead to lower cost of conventioanl pollution control
10643 5 61 37 61 42 Nox and Sox can be removed with high efficiency as Taylar et al. and Yeah et al. show in their respective paper.It is not always the case ambient air qualityt can be also improved by climate change reponses.1.Taylar et al.:[Regulations as the Mother of Innovation], http://gspp.berkeley.edu/academics/faculty/docs/mtaylor/Taylor%20et%20al%20-%20Reg%20as%20Mother%20of%20Innov%20-%20LaPo%2005.pdf2.Yeah et al.:[Technology Innovations and Experience Curves for NOx Control Technologies], http://gsppi.berkeley.edu/faculty/mtaylor/taylor_expcurvenox.pdf
rejected. As developing countries can be in a different situation, it is factually correct.even in developed countries, lower carbon based energy consumption will lead to lower cost of conventioanl pollution control
Page 64 of 78
Expert Review Comments on the IPCC WGIII AR5 First Order Draft – Chapter 5
Comment No
Chapter From Page
From Line
To Page
To Line Comment Response
9362 5 61 37 61 42 It should be deleted because air quality is adequately protected in the developed countries including Japan by implementing up-to-date Sox/Nox/Dust removal system to the coal fired power plant.
rejected. As developing countries can be in a different situation, it is factually correct.even in developed countries, lower carbon based energy consumption will lead to lower cost of conventioanl pollution control
17461 5 61 40 61 40 caveat: lower energy will lead to lower air emissions IF energy source is carbon (combustion) based noted, with thanks. Change16943 5 61 This is not an area I have much expertise but I have had cause to review some of the literature recently. I was
struck by the apparent scale of local air pollution impacts and apparent “co-beneifts”, despite the big reductions in eg. sulphur referred to (eg. p.62 lines 14-23). I’d suggest that this section should look more closely at the environment / health co-benefits including the efforts to put quantitative values on these, to which we refer in Chapter 1 of Grubb, Hourcade and Neuhoff (section 1.4); see most notably the US data we cite from NY-NAS and AER. The IPCC chapter cites the OECD study Bollen (2009) and it might be worth including their core diagram on relationship between CO2 abatement costs and LEP co-benefits (also discussed in Chapter 6 of Grubb, Hourcade and Neuhoff). In that chapter we also note that the biggest co-benefits may be due to reducing the level of energy subsidies. �
noted, incorporated
9063 5 61 20 67 42 5.10. Co-benefits and trade-offs of mitigation actions can be deleted due to limitations on the nos of pages, and it is also covered in chapter 6
noted, will communicate
11843 5 61 27 A little introduction of how these cobenfits were identified and selected would be good. I assume that there are more co-beneifts possible, which are mayb not documented yet or may not be included for other reasons.
accept
12100 5 61 27 62 47 The current text is a good start but would be much more effective if it included all the other numerous important co-benefits of climate change mitigation including, to name a few a) many energy efficiency measures also deliver water efficiency savings (Ref - Retamal, M.L., Abeysuriya, K.R., Turner, A.J. & White, S. 2009, 'Water energy nexus literature review', Institute for Sustainable Futures, UTS, Sydney, Australia.at http://www.isf.uts.edu.au/publications/retamaletal2009wenlitreview.pdf) b) biodiversity co-benefits from investing in reafforestation and habitat restoration for carbon biosequestration (Ref - Dickson, B., Dunning, E., Killen, S., Miles, L. & Pettorelli, N. Carbon Markets and Forest Conservation: A Review of the Environmental Benefits of REDD Mechanisms. United Nations Environmental Programme — World Conservation Monitoring Centre, 2009; available at http://www.unep-wcmc.org/medialibrary/2010/10/05/d26fb1d3/Environmental%20Benefits%20from%20REDD.pdf.) c) increasing soil carbon improves soil productivitiy (Ref - d) integrated waste management and higher levels of recycling - save energy, reduce GHGs and reduce waste to landfill. (Ref - Bahor, B (2009) Integrated waste management as a climate change stabilization wedge. Waste Management & Research http://www.seas.columbia.edu/earth/wtert/sofos/wmr_nov09_p839.pdf) e) Recycling organic waste streams from cities and using them to restore nutrients to the soil and soil productivity in peri-urban areas. f) Many mitigation strategies also help with adaptation - eg: energy/water efficiency nexus opportunities reduce both energy and water demand, insultating buildings, improving soil productivity, investing in natural capital to name a few. More co-benefits and more refs can be sent if interested.
accepted, changes made
Page 65 of 78

Expert Review Comments on the IPCC WGIII AR5 First Order Draft – Chapter 5
Comment No
Chapter From Page
From Line
To Page
To Line Comment Response
5920 5 61 62 Only health-benefits have been mentioned. Also benefits to other air pollution problems (acidification, eutrophication, ground-level ozone) could be mentioned. Suitable references are e.g. Syri S., Karvosenoja N., Lehtilä A., Laurila T., Lindfors V. & Tuovinen J.-P. 2002. Modeling the impacts of the Finnish Climate Strategy on air pollution. Atmospheric Environment 36: 3059-3069. , Syri S., Amann M., Capros P., Mantzos L., Cofala J. & Klimont Z. 2001. Low-CO2 energy pathways and regional air pollution in Europe. Energy Policy 29: 871-884.
rejected, not mitigation policy
10907 5 61 There is a larger literature to draw upon. Maybe some is covered in WGI, but otherwise the work of Shindell et al should point to the relevant recent literature http://www.sciencemag.org/content/335/6065/183.abstract. But, it is worth noting that there is a large literature on climate and health co-benefits that does not seem to be captured here.
noted, will consider and coordinate with sectoral chapters
4031 5 61 After the second paragraph, suggest adding the following text: "Implementation of selected measures to mitigate black carbon and tropospheric ozone could help avoid 0.6–4.4 and 0.04–0.52 million annual premature deaths globally in 2030, while more than 80% of the health benefits are estimated to occur in Asia (Anenberg et al. 2012)." The full reference: Anenberg, S.C., J. Schwartz, D. Shindell, M. Amann, G. Faluvegi, Z. Klimont, G. Janssens-Maenhout, L. Pozzoli, R. Van Dingenen, E. Vignati, L. Emberson, N.Z. Muller, J. Jason West, M. Williams, V. Demkine, K. Hicks, J.C.I. Kuylenstierna, F. Raes, and V. Ramanathan. Global Air Quality and Health Co-Benefits of Mitigating Near-Term Climate Change through Methane and Black Carbon Emission Controls. Environ Health Perspect 120:831–839 (2012). http://dx.doi.org/10.1289/ehp.1104301. The authors should also amend Table 5.10.1, accordingly (the Health Impacts section).
accepted, changes made
5362 5 61 16 61 18 Not sure the point(s) being made in this sentence are as policy relveant as the authors of this section of Chapter 5 might think they are. The world we live in today is being compared to an idealized world that has perfect foresight and has the ability to share costs equitably over time. Not sure this comparison helps policymakers all that much.
acceted, changes
11740 5 62 1 62 5 Deleate all. Refer to No.25. accepted, deleted9982 5 62 1 62 3 This part should be deleted totally because SOx/NOx emission can be technically decontaminated by installing
SOx/NOx removal equipments into coal power plants, as shown in (Margaret, 2005, page369-370, Fig9) and (Sonia, 2005, page3 and 6).
<Reference>[1] Margaret R. Taylor, Edward S. Rubin, and David a. Hounshell (2005).Regulations as the Mother of Innovation: The Case of SO2 Control LAW & POLICY, Vol.27 No.2 April 2005[2] Sonia Yeah, Edward S. Rubin、Margaret R. Taylor, and David A Hounshell (2005). Technology Innovations and Experience Curves for NOx Control TechnologiesJournal of Air Waste Management Association 2005 Dec.;55(12):1827-38. Available at: http://gsppi.berkeley.edu/faculty/mtaylor/taylor_expcurvenox.pdf
accepted, deleted
9363 5 62 1 62 3 It should be deleted because the emissions of SO2 are already tightly controlled by implementing SO2 removal system.
accept, delete.
Page 66 of 78

Expert Review Comments on the IPCC WGIII AR5 First Order Draft – Chapter 5
Comment No
Chapter From Page
From Line
To Page
To Line Comment Response
4032 5 62 10 62 13 The last sentence represents a controversial statement. Yes, it's correct to say that introducing modern cook stoves would deliver huge health benefits. However the benefit for radiative forcing is not that much obvious. The improved stoves often reduce emissions of organic carbon more that those of black carbon. Emissions of organic carbon in general lead to cooling thus cancelling out the climate benefit of the black carbon mitigation (see discussion in section 2.4.5 of "Integarted Assessment of Black Carbon and Tropospheric Ozone", UNEP/WMO 2011, available at http://www.unep.org/dewa/Portals/67/pdf/BlackCarbon_report.pdf). Therefore the wording could be as follows: "One study has suggested that in India around two million premature deaths, particularly in women and children, could be averted by introducing 150 million improved efficiency cook stoves over a decade (Wilkinson et al., 2009). However as regards to the sign of the resulting radiative forcing the uncertainty is particularly large for this mitigation option because biomass combustion emits significantly more organic carbon, which produces a cooling effect on the atmosphere, compared to black carbon, which is a warming agent. The improved stoves often reduce emissions of organic carbon more that those of black carbon (UNEP/WMO 2011)."
accepted, changes made
17462 5 62 14 62 43 not clear to me how this relates to health benefits accepted, deleted12619 5 62 3 62 5 30% is the upper range currently. Some estimates are as low as 20-25%. This range should be presented. noted, deleted.
12662 5 62 3 62 5 30% is the upper range currently. Some estimates are as low as 20-25%. This range should be presented. noted, deleted.
17463 5 62 32 62 39 not clear to me how this relates to transport safety/economic co-benefits (most of it seems more relevant to the health co-benefits section)
accepted, changes made
3626 5 62 40 62 46 Employment co-benefits can also be lost, e.g. if they are dependent on government subsidies and subject to strong international competition such as in the solar energy industry. In Germany, competition with Chinese producers led to bankruptcies in this industry after the feed-in tariff was reduced.
rejected, this is not relevant as international trade applies to all the sectors, not just to solar pv
9364 5 62 40 62 46 It should be deleted because what is happening in Finland does not necessarily apply to other countries. Employment creation is realized as a result of the policy tradeoff.(Berndes and Hansson,2007)
accepted, rewrite
5793 5 62 41 62 46 Please rework this paragraph as "labor markets may recover" is somewhat redundant to "employment may recover".
accepted rewite
9298 5 62 24 62 39 The reference shows economic co-benefit for both of the cement plant and local government to treat municipality wastes in the cement kiln as well as reduction of GHG emissions. (Susumu Sano, Akira Kato, Tomoyuki Iino, Nobuo Kasiwazaki, Toshihiko Matsuto and Nobutoshi Tanaka, Journal of the Japan Society of Material Cycles and Waste Management, Vol.16, No.5, p.341, 2005 “Effects of CO2 Emissions from the Utilization of Municipal Solid Waste as Alternative Fuel and Raw Materials in Cement Production”)
accepted, changes made
5363 5 62 1 62 5 This entire paragraph is missing a number of citations to the underlying peer reviewed literature. These points need to be substantiated with references to the peer reviewed literature and not just asserted.
accepted, will add
10908 5 62 I guess this is quite a small sample, I would imagine there are many other economi co-benefits. For example, taking the MAC discussed in Chapter 3 I think shows there are many economic win-wins.
noted, will assess
4386 5 62 24 62 24 improper title, economy is not dealt with in this section rejected. Economic is different from economy
Page 67 of 78
Expert Review Comments on the IPCC WGIII AR5 First Order Draft – Chapter 5
Comment No
Chapter From Page
From Line
To Page
To Line Comment Response
5364 5 62 25 62 31 This entire paragraph about "energy security" is technically very weak. Need to have citations to back up the points being made here. Moreover, what is the science or technical literature that substantiates benefits of energy security as described here? If a nation still imports any oil then it is still susceptable to price shocks and the resulting economic damage. Having a Strategic Petrolium Reserve and a storng military are arguably the best energy security tools that are employed by the United States. Neiher one of those are very GHG friendly. If there are sound technical points to be made about energy security then please make them in a sound technical fashion (i.e., drawing on a broad body of high quality peer reviewed literature). Otherwise, delete this policitical sloganeering about "energy security." The US could in the name of energy security exploit its large unconventional hydrocarbon resources but that would likely result in the opposite of a "co-benefit" (see for example Dooley, J., R. Dahowski, and C. Davidson, The potential for increased atmospheric CO2 emissions and accelerated consumption of deep geologic CO2 storage resources resulting from the large-scale deployment of a CCS-enabled unconventional fossil fuels industry in the U.S. International Journal of Greenhouse Gas Control, 2009. 3(6): p. 720-730.) For a more general discussion about the lack of technical meaning of the concept of energy security and its related concept of energy independence see Council on Foreign Relations, National Security Consequences of U.S. Oil Dependency Report of an Independent Task Force, 2006, Council on Foreign Relations: New York. p. 90.
rejected. It is co-benefit, not for the sake of energy security
4387 5 62 32 62 39 paragraph more relevant with section 5.10.1.1 accetped, changes made4033 5 62 After the second paragraph suggest adding the following text: "Food security: Implementation of selected
measures to mitigate black carbon and tropospheric ozone would increase annual cropyields of wheat, rice, maize, and soy combined by 30 to 135 million tonnes due to ozone reductions in 2030 and beyond (Shindell et al. 2012)." The full reference: Shindell, D., J.C.I. Kuylenstierna, E. Vignati, R. van Dingenen, M. Amann, Z. Klimont, S.C. Anenberg, N. Muller, G. Janssens-Maenhout, F. Raes, J. Schwartz, G. Faluvegi, L. Pozzoli, K. Kupiainen, L. Höglund-Isaksson, L. Emberson, D. Streets, V. Ramanathan, K. Hicks, Kim Oanh N. T., G. Milly, M. Williams, V. Demkine, and D. Fowler. Simultaneously mitigating near-term climate change and improving human health and food security. Science, 13 January 2012: Vol. 335 no. 6065 pp. 183-189 DOI: 10.1126/science.1210026. The authors should also amend Table 5.10.1, accordingly (the Economic section).
accepted, changes made
11741 5 62 Rathzel and Uzzell show the jobs versus climate change dilemma is likely to seriously impact on workers worldwide. It's too early to refer the relationship between climate change action and job employment.This section should be deleted.1.Rathzel and Uzzell:[Trade unions and climate change: The jobs versus environment dilemma.] , send attachment by another e-mail.
rejected, it should be included, positive or negative
4259 5 62 This might be a place to consider the health co-benefits and their effects on the macroeconomy. See for example Keogh-Brown and colleagues submitted for publication - draft paper could be shared if there is interest. Also some policies such as those that promote active travel can avert health service costs Jarrett J, Woodcock J, Griffiths UK, Chalabi Z, Edwards P, Roberts I, Haines A Effect of incresing active travel in urban England and Wales on National Health Service costs. Lancet 2012; 379:2198-205
noted, change
10644 5 62 Rathzel and Uzzell argue the jobs versus climate change dilemma is likely to seriously impact on workers worldwide. At the moment there is no eviden to support the relationship between climate change action and job employment.1.Rathzel and Uzzell:[Trade unions and climate change: The jobs versus environment dilemma.] , send attachment by another e-mail.
rejected, it should be included, positive or negative
17464 5 63 14 63 14 what does the 77% refer to? accepted, changes made
Page 68 of 78

Expert Review Comments on the IPCC WGIII AR5 First Order Draft – Chapter 5
Comment No
Chapter From Page
From Line
To Page
To Line Comment Response
9268 5 63 15 63 20 The IPCC draft report is correct in regard to impacts on water consumption, SOx, NH3 and NOx in regard to post-combustion capture using current generation amine solvents.
A key reason for the increased water consumption is the relatively high heat release when CO2 is absorbed into the current generation of amine solvents, which then requires significant quantities of cooling water to take away the heat in the absorber, and high quantities of steam in the stripper to release the absorbed CO2. The use of high quantities of steam then significantly reduces the amount of power generated in the host power plant.
The new generation of post-combustion capture solvents (such as hindered amines and potassium carbonate) have a much lower heat release when CO2 is absorbed, meaning cooling water requirements are either significantly reduced or can be replaced in part or in full by air cooling. The quantity of steam used in the stripper to release the absorbed CO2 is also reduced, meaning that more power is generated relative to the current generation amine solvents.
accepted, changes made
12620 5 63 17 63 18 Studies have shown that CCS can be done with little to no increase in water consumption. See the study IEA GHG WATER USAGE AND LOSS ANALYSIS OF BITUMINOUS COAL FIRED POWER PLANTS WITH CAPTURE
accepted, changes made
12663 5 63 17 63 18 Studies have shown that CCS can be done with little to no increase in water consumption. See the study IEA GHG WATER USAGE AND LOSS ANALYSIS OF BITUMINOUS COAL FIRED POWER PLANTS WITH CAPTURE
accepted, changes made
4185 5 63 18 63 20 Does this sentence on CHP emission mean NOX or other air pollutant? In terms of GHG, the distance between the cite and consumers does not matter.
accepted, changes made
5921 5 63 18 22 The side-impacts of CHP have been written in a biased and untrue way, which does not represent reality in most countries with a cold climate, which utilise CHP. In these countries, building extensive, large CHP systems in cities has replaced traditional house-size or block-size heating systems, using coal, oil or wood. Thus CHP has resulted in dramatically improved air quality ! Today, large CHP plants in Europe mostly have very efficient flue gas cleaning systems, required by EU LCP directive and national legislation. A hypothetical shifting to e.g. smaller-size biomass-based systems as a climate change mitigation measure would significantly damage air quality in these cities.
accept, changes made
Page 69 of 78

Expert Review Comments on the IPCC WGIII AR5 First Order Draft – Chapter 5
Comment No
Chapter From Page
From Line
To Page
To Line Comment Response
5298 5 63 19 ADD: At least two important social dimensions need to be taken into account.The first is that there is a movement away from individuals being strictly consumer and they are potentially becoming producers of energy: solar on the roofs, small wind power, geothermal. In addition, due to new energy technologies and market liberalisation, consumers can choose form different energy producers/distributors and even from different types of energy (carbon based or RE), or finally, even the time of day at which they may consume more energy. The second relates to the social un/acceptability issue. As regards wind power, it is often rejected by local communities, even after a communication campaign and thus cannot always be implemented even when the other technical and natural conditions exist, mostly for aesthetics and NIMBY reasons. What we do not know yet is the impact of the level of unacceptability on the different energy measures and effective renewable deployment. The same argument applies to solar panels for example, judged to be often too expensive (or the return on investment is considered too long) by families or small firms, as there are issues with adding isolation to existing habitat, while dams are for local environmental impacts. Without state subsidies the development of these forms of energy may well be under optimal in the short term, until costs diminish. With sufficient development, this may even in the middle run, play a role on grid equilibrium especially large scale ones, such as the emerging European. Even when these measures are successfully implemented, one has to take into account the rebound effect. �
partialy accepted: tradeoffs part only. The other part is not related to risk tradeoff issues
9498 5 63 23 63 27 delete this paragraph - There is no explanatory reason why these challenges can be overcome at a cost accept, delete
9425 5 63 23 63 27 ・Deletion or addition is needed as shown below.・The draft claims that the challenges imposed by the deployment of intermittent generation can be overcome at a cost. However, it is inappropriate to use the word ‘cost’ without specifically describing what it represents. Either this sentence should be deleted, or the nature and magnitude of the cost should be specifically described.
accept, delete
9256 5 63 28 63 40 Biofuels combined with CCS have the ability to reduce atmospheric CO2, and this should be mentioned (along with the negative aspects) to give balance.
noted, but this is not the place to address such issue. Therefore, rejected
4186 5 63 29 63 32 This statement is applicable only to the crop-based ethanol cases. Cellose based fuel and sugar cane residual based fuel are not the cases.
accept, changes made
17418 5 63 29 Missing from this discussion is the GHG emissions that are associated with clearing new land for food production This is an important potential perverse outcome of unsophisticated biofuels policies.
reject: meaning implied and clear
5794 5 63 7 63 40 What is a "negative co-benefit"? Sorry, this sounds like an invention to hurt no-one by hiding the truth. I suggest to use "side effect" or "secondary effect" as neutral words instead.
accepted and changes made. glossary and X-cutting
Page 70 of 78

Expert Review Comments on the IPCC WGIII AR5 First Order Draft – Chapter 5
Comment No
Chapter From Page
From Line
To Page
To Line Comment Response
5365 5 63 13 63 17 There is a large body of literature about the life cycle impacts of CCS. There are even a couple of meta analysis of this literature. This is a complex issue and needs to be dealt with more carefully than what is here in the FOD. There is a critical difference between increases in non-GHG emissions on a perkwh basis and the total impact in a basin, a region, a nation or the planet. That difference is whether or not the climate policy is depressing the total amount of coal that is being used. One also needs to consider the impacts associated with not using CCS and / or not addressing cliamte change for many of the LCA impact categories. Lastly the point about CCS using more water is true for post combustion capture systems on (again!) a per kwh basis. However any climate policy stringent enough to cause large scale adoption of CCS systems probably also changes many other aspects of the energy system and therefore it is not clear for a basin or a region if there is more or less water consumed. Also there is no technical rationale for assuming that only post combustion capture systems will be used for the rest of time. Many advanced CCS power systems have very different water use patterns than a post combustion capture unit does.IEAGHG, Water Usage and Loss Analysis of Bituminous Coal Fired Power Plants with CO2 Capture, 2011, IEAGHG: Stoke Orchard, Cheltenham, UK. p. 816.
accepted, changes made
11742 5 64 Employment effects(local) on the table shoud be deleted. Refer to No.27. noted, table to be deleted9257 5 64 What's an FE (add to caption)? CCS should appear under Carbon Efficiency rather than infrastructure efficiency?
Why will CCS increase water consumption? - pressure relief wells will produce water (though it will in many cases be saline to some degree and need treatment). Under capacity building, oil/gas knowledge and technology can be used for storage of compressed air (banking green energy), and CCS. Under Technological Risks, the danger of spills stems not so much in consumption and trade as from exploiting more difficult reserves. The biggest risks are development of cheaper technology in CCS, renewables and energy efficiencies being too slow.
noted, table to be deleted
10645 5 64 The same as my previous comment. noted, table to be deleted6533 5 64 Make Table 5.10.1. more comprehensive and precise. For example, whereas it puts productivity increase as a co-
benefit of carbon efficiency, productivity almost always decline if carbon efficiency is increased by political intervention. Otherwise, delete the table so as not to create a biased view on the balance of co-benefits and trade-offs.
noted, table to be deleted
7466 5 64 Social. Employment effects. The trade in biomass energy is a large (rural) job creator worldwide. noted, table to be deleted5795 5 64 66 In the text, there is no reference made to this table. "Options": You mean "Electrification of Transport"? What
does "FE" stand for? This abbreviation is not explained. "Impacts on energy access & affordability": consumer spending will only go down if BF, RE etc. are competitive in monetary terms. And CCS has technological risks, too.
noted, table to be deleted
15931 5 64 64 RE (esp wind and solar) will have a definite + co-benefit on water consumption when compared to conventional power generation.
noted, table to be deleted
9269 5 65 See comments made on same issue (reference: Chapter 5, page 63 lines 15 to 20). In the table, row "Water Consumption" and column "System/Infrastructure Efficiency", should note that the extent of water increase will depend on the type of capture process used. Prospective technologies (i.e. hindered amines and potassium carbonate) can substantially reduce this impact.
noted, table to be deleted
7467 5 66 Land use. Bioenergy use. By using more of the annual net primary production, bio-energy use could have a positive effect. Biodiversity. By reclaiming degraded land for bio-energy, it could have a positive effect on biodiversity.
noted, moaterials removed
4034 5 66 24 after "IPCC 2007" add "Shindell et al. 2012, Anenberg et al. 2012" accept, add.
Page 71 of 78

Expert Review Comments on the IPCC WGIII AR5 First Order Draft – Chapter 5
Comment No
Chapter From Page
From Line
To Page
To Line Comment Response
16944 5 66 Its very good to have this section on the complexities of using co-benefits. However, two points not fully recognised here: (i) the idea of “separating” policies to deal with each issue individually makes apparent sense economically but not if either solutions may be integrated, or policy responses involve new investment (as is often the case) in which case integrated investment to deliver multiple benefits is often the most cost-effective response. (ii) it is entirely possible that “higher domain” concerns (like climate change) can help to motivate welfare-improving policies at lower domain levels, which would otherwise not be tackled (subsidy reduction may be a classic case). This theme is developed in the concluding chapter (12) of Grubb, Hourcade and Neuhoff.Grubb, Hourcade and Neuhoff, Planetary Economics and the three domains of sustainable energy development, Taylor and Francis (forthcoming), Chapters 1 (submitted), 6 and 12 (drafts available from authors).
noted, will incorporate
4187 5 67 I would point out two; first this table says that the outcome of mitigation is global, long-term and uncertain while cost and benefits are near and clear. Second, the term "development benefit" is unclear. I don't think this table is needed in this report.
accept, delete
15932 5 67 67 I am not sure - what prompts the authors to classify 'Mitigation Benefits' as 'Uncertain' / the para above the table also just mentions and excerpt from the original paper without any clear explanations.
deleted
5796 5 67 6 67 10 I disagree. Mitigation benefits are not global only. WG II has chapters on local impacts which could be mitigated by emission reduction measures, so instead of "global" you have indirect effects. In some regions, mitigation can have adaptation (or: reduced need for adaptation) as opportunity costs, while in other regions benefits from an CC may dominate. Only here you have ex situ - effects.
accept, change
17465 5 67 7 67 8 Meaning not clear to me accept, clarify17919 5 67 28 67 31 This rather general statements should be replaced by a cross-reference to Chapter 8 and 11 that explicitly deal
with these issues on the basis of a comprehensive literature assessment.accept, materials removed
17920 5 67 36 67 37 If you want to use the example of LPG here, please supply a reference and examples for the "negative co-benefits" (please use other term instead; see my comment on Section 5.10.2) of production and transport of LPG. Preferrably, examples of the distributive implications of aggregate co-benefits/co-costs results should be taken from the sector chapter assessment.
accept, table removed and changes made
5797 5 68 1 70 23 Please shorten this section. You can delete everything used to explain the Kaya-Identity, for example. Just give the results. I also suggest to give within-chapter references. Without any reference this section appears to be of little scientific quality.
Accepted: The section is being revised.
10438 5 68 Rewrite the entire section in terms of negative and positive externalities Accepted: The section is being revised.
9064 5 68 1 71 26 5.11. The system perspective: linking sectors, technologies and consumption patterns can be deleted to limitations on the nos of pages
Rejectes: Section 5.11 ca not be deleted. It is being revised and shorten.
9258 5 69 24 69 26 Key to this are social perceptions and their tipping points, and that's probably related more to extreme climate events (ECVs) than background climate change, as well as the use of social media. ECVs aremore likely during sunspot peaks, so 2025-ish could be significant.
Noted
5300 5 69 43 70 48 Take out, other chapters cover this Rejected: Chapter 5 has to deal with this, although the text is being revised for the SOD.
Page 72 of 78

Expert Review Comments on the IPCC WGIII AR5 First Order Draft – Chapter 5
Comment No
Chapter From Page
From Line
To Page
To Line Comment Response
3046 5 69 5 12 The third term of the Kaya Identity is dependent on so many things--factor prices, factor substitution elasticities, factor technology gains--that it makes a poor tool for projection purposes, even while it allows interesting and useful historical comparisons. The problems in using this measure for projections are at least four: - a minimum degree of further disaggregation is needed, to permit distinctions between industrialized and developing countries, and between productive and end-use energy consumption (which have differing microeconomic optimizations driving them: profit-maximization vs. consumer utility maximization); further disaggregation is required to comprehend sectoral shifts; - real output, Y, is more directly related to energy use than GDP (the real output of an economy is greater than its GDP); real output is a better measure of (energy-using) economic activity; GDP is a value-added measure; - output, or GDP, is not independent of the E/GDP ratio: both terms are driven by common drivers such as multi-factor technology gains; the terms of the identity are not independent and so cannot be independently forecast; - the multiplicity of drivers means intensity is fundamentally difficult to project, and can give counterintuitive results such as that intensity can go down even while total energy use is increased (a backfire situation with declining intensity)
Accepted: The section is being revised.
16903 5 7 8 The story you seem to tell here is one of austerity -- Do we intend to suggest people should stop consuming? No consumption, no production, no job. No paycheck leads to no policy action. Decarbonizing our energy system and being more efficient does not mean austerity. Please emphasis that the least cost and most desirable lever to pull is new techs that need what appears in all modeling to be relatively affordable incentive of a CO2 price.
Rejected: we don't suggest austerity as solution.
12292 5 7 12 7 13 Please consider to include this key finding in the SPM Accepted: The SPM is being written.13764 5 7 12 7 16 This must be incorrect. Where do you find a rising carbon intensity? Not in any of the regions depicted in Fig.
5.2.5! However, as I know the story, the increase in global average carbon intensity is due to the disproportionate rise in the energy consumption of emerging economies,e specially China, which have a much higher carbon intensity to start out with.
Accepted. This is clearly a mistake – not even global energy intensity is increasing (nor that of China).
15978 5 7 12 7 16 however, when looking at the period from 1970 - today, coal has been a major driver of carbonization; while nuclear energy has been a driver of decarbonization ... see steckel et al. (2011)
Accepted. Coal has been indeed the major driver of carbonization, or rather a barrier toward faster decarbonization worldwide. Nuclear and other zero-carbon options such as new renewables have offset some of the carbonization due to incre
15977 5 7 2 7 2 regarding China: which has however shown an increasing EI after 2000; also results hinge critically on whether to look at GDP in MER or GDP
Rejected. This cannot be correct. The rate of energy intensity decline in China has slowed down from historical records of some 4 percent per year during the past decade. We will corroborate the number and update next week.
16902 5 7 20 21 But mass changes in behavior without incentives? A few lines later (bet'n 26 - 28) if people change behaviors in fairly large way, but we are still stuck with the same energy system techs, we are still stuck.
Noted
Page 73 of 78

Expert Review Comments on the IPCC WGIII AR5 First Order Draft – Chapter 5
Comment No
Chapter From Page
From Line
To Page
To Line Comment Response
7846 5 7 20 7 21 This sentence only makes real sense if "future" is inserted before "emissions" at the end of the sentence. Accepted (insert word "future" before "emissions")
7644 5 7 30 7 30 Besides behaviour, there are other social forces that act as barriers. For example, the inertia of institutions. Noted
14387 5 7 35 I disagree that the literature calls for a reduction in consumption, not the mainstream climate economics literature. That is all premised on continued increases in consumption, and indeed rising consumption is implicit in the use of positive discount rates.
Rejected (literature exists to support this view)
4764 5 7 36 7 43 I fullt support this statement regarding the "rebund effect". It is not always the final product that becomes cheaper, but rather the cost of the total quantity that is cheaper (for instance, thaks to energy efficiency measure, you will decrease your energy consumption, the unitary energy price is the same, so your global purchase decreases ... wil may lead to extra-consumption ...)
Noted
12535 5 7 42 A summary of the recent literature suggests the rebound effect is at the lower end of the 10-30% range for the power sector and passenger vehicles, and that the effect has likely been declining over decades. Stephen Nadel, 2012. "The Rebound Effect: Large or Small," American Council for an Energy Efficient Economy, http://aceee.org/files/pdf/white-paper/rebound-large-and-small.pdf
Taken into account - additional references have been added from the comprehensive review to date of rebound effect, namely Sorrell (2009).
14386 5 7 9 Not very helpful except as background to talk about declining coal since 1880; rise of China /coal in last couple of decades. Memo: for major-country decomposition of Kaya equation in last couple of decades, see Cline (2011), pp. 10-11.
Rejected. Historically, coal has declined since the peak of its global energy share in 1920. The share has been increasing during the past decade particularly because of the rise in China and few other countries, but this is still very fa
5348 5 7 20 7 21 Why not say that there is "high confidence" that behavior is an important aspect of anthorprogenic emissions? I can't imagine there being much serious debate about whether behavior is important or not.
Accepted (can be changed in Executive summary)
10909 5 70 I do not know who came up with that FAQ, but that is hard to answer. The first sentence, whilst perhaps true, is a rather significant assumption. History did not tell us much about the 2009 financial crisis. If countries take positive mitigation measures, then history may fast become irrelevant. Future emissions are about choices we make today, and if we make no choices, then history may repeat.
Accepted: Sentence reworded so it poses the question in a way that can be answered from the information in the chapter
13558 5 70 I like the FAQ, a nice way of condensing the key messages of the chapter. Noted8959 5 70 1 Conclusion could start here since the immediate preceding pages are repetitive. Accepted: The section is being revised.
11743 5 70 21 70 22 Existing low carbon technologies are important as mentioned in No.22. This sentence should be amended to [In view of this assessment, technological change and individual behavior with accelerating the decarbonaization by using low carbon technologies becomes key aspects for future efforts on climate change mitigation.].
Accepted: The section is being revised.
4035 5 70 43 70 44 delete "and economies in transition". In fact the population of these countries is decreasing. See the Population Division of the Department of Economic and Social Affairs of the United Nations Secretariat for statistics.
Accepted: The section is being revised.
4987 5 71 15 71 16 Sentence: Agriculture accounts for 11.5% of global GHG 15 emissions. This should not be Agriculture only but should be FOLU ( See same chapter page 52, Line 18 -19)
Accepted: Sentence changed as proposed.
13517 5 71 15 71 16 Sentence: Agriculture accounts for 11.5% of global GHG 15 emissions. This should not be Agriculture only but should be FOLU ( See same chapter page 52, Line 18 -19)
Accepted - duplicate comment
Page 74 of 78

Expert Review Comments on the IPCC WGIII AR5 First Order Draft – Chapter 5
Comment No
Chapter From Page
From Line
To Page
To Line Comment Response
17419 5 71 16 "Technology has some scope to reduce the carbon footprint of food production, and substantial scope to reduce the carbon footprint of food distribution, however, consumer choice will play a large role in taking advantage of these food-related opportunities." This is a large and important topic, with a large and growing literature, that should be developed much more robustly in the document.
Noted
8817 5 71 24 71 24 The use of the term 'wise' is welcome and points to a virtue epistemology which incorporates the predictive elements of 'scienctistic' epistemology but also incorporates more humble elements such as precaution.
Noted
5302 5 71 31 72 8 Take out, other chapters cover this Rejected: Chapter 5 has to deal with this, although the text is being revised for the SOD.
10390 5 71 6 71 7 [section7 5.6.1 and 5.6.2 still not available] should be substituted by the real content Accepted: The sections missing when the FAQ was prepared have since become available and the figures were added
5301 5 71 9 16 Take out, other chapters cover this Rejected: Chapter 5 has to present the overall picture with regard to drivers, trends and mitigation, setting the stage for the more in-depth treatment in followiugn chapters.
6534 5 71 9 10 Replace "not dependent on fossil fuels" with "less dependent on fossil fuels", to be more reasonable. Accepted: sentence revised as proposed
12865 5 75 37 75 40 Delete one of the duplicate references to Ehrlich and Holdren (1971) and change citations in the text to read "1971" (rather than "1971a" or "1971b.")
Editorial
13561 5 78 31 Hertwich and Peters referenced twice Editorial11838 5 8 10 From my reading of other parts of this report and of WG2, I had the feeling that co-benefits are usually perceived
as being positive and if negative are rather termed trade-offs. Here it is unclear what are trade-offs then, if co-benefits can also be negative. Later in the text (section 5.10) this is clarified but to me it seems more intuitive to talk about co-benefits with a positive and about trade-offs with a negative connotation (although of course the authors rightly point out that positive co-benefits for one persone/group maybe negative for another ("winners and loosers")
Accepted: A definition of co-benefits was agreed in Vigo for the whole WGIII and what Chapter 5 should do about it was also defined.
4158 5 8 17 8 19 I agree that "many" cobenefits are short-term, but the promotion of renewable energy sources would contribute to the long-term sustainability. This sentence sounds that long-term co-benefits have only minor effects.
Accepted: A definition of co-benefits was agreed in Vigo for the whole WGIII and what Chapter 5 should do about it was also defined.
4765 5 8 20 8 25 Is it possible to have qualitative values for this statement? % or numbers associated? Accepted: The texts are being revised.
12294 5 8 20 8 23 Please consider to include this key finding in the SPM Accepted: The SPM is being written.16204 5 8 20 decreasing trend in efficiency' is misleading; there is a decrease in the RATIO used to embody efficiency,
however, efficiency itself is improving (see point up above on 1.17.27)Accepted: The texts are being revised.
6518 5 8 20 Replace "the decreasing trend in energy efficiency" either with "the increasing trend in energy efficiency" or "the decreasing trend in energy intensity".
Accepted: The texts are being revised.
5296 5 8 27 8 37 Take out part on other chapters, summarise what 5 does and no mention of what the other chapters do not do Accepted: The texts are being revised and coodinated with other Chapters according to the agreement reached in Vigo..
8942 5 8 31 36 Use of imperatives must and we have to seems overly directive. Accepted: The texts are being revised.
Page 75 of 78

Expert Review Comments on the IPCC WGIII AR5 First Order Draft – Chapter 5
Comment No
Chapter From Page
From Line
To Page
To Line Comment Response
11199 5 8 32 8 42 The summarised conclusion of the assessment does not mention the vital need to combat emissions through governance, land tenure and rule of law measures that are essential for tackling land use changes related to direct and indirect drivers. Improved governance and equitable tenure regimes in line with international obligations are needed to stem unregulated land acquisitions and conversion of habitats by agricultural, forestry, infrastructure and energy sector developments (biofuels, foods, fibres, veg oils, mining, oil and gas, roads, dams, forced displacement, expropriation and fragmentation of communal lands and destruction of community-based sustainable land use systems). In other words, tackling emissions is not just about individual behaviour, technological change, trade and consumption patterns (though these are also key), but also about upholding the rights of indigenous peoples and other customary resource owners and users to own and control their lands and resources and thus stem uncontrolled land use change
Rejected: Chapter 5 does not deal with mitigation options. Please refer to sectoral as well as policy chapters in WGIII for detail assessment of mitigation options.
13213 5 8 35 8 36 This is a major conclusion which should be highlighted. However, to be not policy prescriptive, the second sentence should be rewritten, e.g. in the followind way: " Such a shift implies to reduce energy per output, or to decarbonise energy supply, or both
Accepted: The texts are being revised.
7645 5 8 36 8 36 Probably better to avoid 'we'. 'We' can mean different things and is not well defined. Accepted: The texts are being revised.
12293 5 8 41 8 42 If possible please include what role leadership has in order to mitigate emissions. Rejected: Chapter 5 does not deal with mitigation options. Please refer to sectoral as well as policy chapters in WGIII for detail assessment of mitigation options.
16904 5 8 41 42 But the question then is how do we change behavior and technology? Education campaigns, shaming? Or create an incentive that points producer and consumer behavior in the same direction (consumers prefer techs that have lower emissions and producers move fast to create and produce).
Noted
4159 5 8 42 8 42 becomes -> become Editorial4028 5 8 9 8 10 Suggested wording: "Co-benefits and other trade-offs have also influenced the implementation of mitigation
policies and measures and, therefore, the GHG emissions. Side effects of implementation of mitigation policies can be positive or negative."
Editorial - text has changed
15979 5 8 9 14 it's not immediately obvious to me why co-benefits need to be discussed in a chapter on drivers and trends Accepted: A definition of co-benefits was agreed in Vigo for the whole WGIII and what Chapter 5 should do about it was also defined.
Page 76 of 78

Expert Review Comments on the IPCC WGIII AR5 First Order Draft – Chapter 5
Comment No
Chapter From Page
From Line
To Page
To Line Comment Response
5299 5 86 21 ADD: A recent socioeconomic study undertaken by CEPS indicates that domestic users in different countries demonstrate notable different preferences for the characteristics ascribed to the reliability of electricity supply. For example, respondents in France are willing to pay for the certainty of knowing the seasons during which a power cut would take place and to avoid power cuts occurring in the evening. But French respondents are not willing to pay to reduce the frequency or the duration of power cuts. By contrast, respondents in the UK and Italy are willing to pay to reduce the number of power cuts and their average duration. UK households are willing to pay to avoid a cut during the daytime whilst those in France are willing to pay to avoid a cut in the evening. Respondents in Italy, however, prefer knowing in which season a blackout would occur, whilst the time of day at which it occurs is not important. There are thus national differences that seem to be in part explainable by the national energy structure (France’s energy is based on nuclear and is thus very stable throughout the seasons. Gas supply stability and prices do raise issues in individuals’ perceptions on their willingness to pay and when they prefer a power cuts to occur or how long it would be. But on these points, there are also national differences which are yet to explore. C. Wan-Jung, A. Hunt, A. Markandya, A. Bigano, R. Pierfederici, S. La Branche. Consumer Valuation of Energy Supply Security: an analysis of Survey results in three EU countries, Centre for European Policy Studies Policy Brief. 2010.
Noted
15556 5 9 1 11 11 The whole Introduction seems to adress GHGs only, not other minor substances, in particular aerosols of quite different origin, composition, and substantial contribution to radiative forcing, in particular to cooling via their clouds effects. This causes a bias in the whole Chapter, which (almost, except in 5.2.2) ) neglects the particles in the atmosphere.
Rejected - the introduction cannot be comprehensive.
5764 5 9 1 11 11 This section is too long. If written in a more concise, less prosaic manner it could be shortened down to about one page length.
Taken into account - revised and shortened.
15057 5 9 10 what is the unit of gross world product, Monetary or physical value? Need specify for non-expoert Noted: text is rewritten8943 5 9 13 Overreliance on Kaya Identity which is crude at best. Similar to Drake Equation in astronomy, with no predictive,
dynamic powerNoted. SOD is clearer on use of decomposition.
14459 5 9 13 In mathematical terms this is indeed an identity, not explaining anything. It might confuse mathematician and physicist and other scientists.
A better representation would represent (G/P), (E/G) and (CO2/E) as parameters rather than as quotients. For many scientists it could help if all of these were explicitly shown as dependent on time.
In my view the Kaya identity as presented here seems to be a bit naive and simplistic, probably too close to economic modelling. A birt more mathematical rigidity could help to make the reasoning in the chapter better understandable and better describing causes and effects.
Noted. SOD is clearer on use of decomposition.
4160 5 9 14 10 9 These sentences could be reduced, if we seriously have to squeeze pages. Taken into account - Section rewritten.
14460 5 9 14 16 If the (G/P) etc are represented as parameters, the identity is no longer so obvious, and the equation will better represent the different influences on the emissions.
Actually, this is done in the equations (1) and (2).
Noted. SOD is clearer on use of decomposition.
12295 5 9 2 9 6 It seems like the WGIII is doing the analysis themselves, and not referring to published material, please consider rephrasing.
Taken into account - rephrased to make clear we assess the literature
2253 5 9 2 71 26 Trends in 40 years since1970s are a good way of concealing what is actually happening, before, during and after these years
Taken into account - we explain our time frame
Page 77 of 78

Expert Review Comments on the IPCC WGIII AR5 First Order Draft – Chapter 5
Comment No
Chapter From Page
From Line
To Page
To Line Comment Response
13765 5 9 2 9 29 I think it should be pointed out already here that the identity can be expressed in terms of production (we are really talking about value added in a country) and consumption. The two perspectives are complementary but offer different interpretations.
Taken into account - we explicitly mention production and consumption in the introduction, but don't want to emphasize the distinction here.
15980 5 9 2 the ipcc might want to think about how appropriate it is to work with trends until the late 2000s when it's released in 2014. i'm aware that literature today uses data until 2008 or 2009 but many analyses in the chapter can be easily replicated with newer data (thinking e.g. at the Raupach paper) ... maybe it would be possible to do some analyses that includes latest data in a later process of the AR5, maybe also collaborating with e.g. the IEA in order to get access to the most recent trends
Taken into account - data are updated to 2010.
14461 5 9 24 28 Further on the above comments: this could read that this chapter tries to identify and understand the underlying causes for the time dependence of the variable and parameters of the equation.
Noted. SOD is clearer on use of decomposition.
14462 5 9 30 33 This indeed implies that the chapter is trying to find ex-post explanations of why the emissions of greenhouse gases have changed over time, rather than trying to find the reasons why emissions change as a consequence of general and specific changes in the major variable (population) while at the same time the wealth and energy intensity of the society and the production processes changes as a result of many other variables. And whether or not these changes explain the (observed) changes in emissions.
I feel that this is a consequence of the choice to start from a mathematical identity, rather than from a (causal) relation between changes in the society and economy worldwide and the resulting global emissions.
Noted. SOD is clearer on use of decomposition.
11840 5 9 30 11 11 This (very topical) part of the report could be shortened Taken into account - Section rewritten.
15981 5 9 30 I agree it's a good structure, but it might be a little misleading: for example thinking of energy intensity, it comprises both, energy efficiency improvements and structural changes ... maybe it makes sense to explain this somewhere ..
Noted - lack of space does not allow for extensive explanation of all elements.
14463 5 9 41 42 "Attributed to" is quite similar to "causality", isn't it?
Throughout the chapter there seems to be some confo=licting use of terms like "causality", which is sometimes said not to be looked for and the use of the term "driver". A "driver" drives something and therefore would have some causality implicitly in it. Actually, the analyses seem to look for correlations, be it in a rather confusing way.
Taken into account - we pay more attention to explaining what we mean by 'drivers', and its relation to causality and correlation.
14464 5 9 43 45 What probably is meant here that the chapter merely wants to look at correlations. But, are production and consumption not correlated. If so, the two approaches are not independent, but again correlated!
Noted. Not clear what the referee is after.
12854 5 9 6 9 6 Because this chapter relies so prominently on the Kaya identity, it should provide a citation here to a peer-reviewed reference. The reference list, however, does not give a peer-reviewed reference.
Taken into account - reference provided in Section 5.3
12855 5 9 6 9 6 Becase this is the first methion of the IPAT identity in the main text, cite here the peer-reviewed reference (Ehrlich and Holdren 1971).
Taken into account - reference provided in Section 5.3
13766 5 9 6 9 11 The way I have learned about IPAT - from John Holdren - A was already expressed at GDP, and further decompositons were possible.
Taken into account - Section 5.3 will provide the literature reference.
18140 5 9 2 9 3 Justification required as to why 1970 has been chosen as the start point of this historical analysis. For example, would the start of the industrialisation period (1850s) not be a better choice?
Taken into account - we explain our time frame
Page 78 of 78