Standard Republican French and French Nationalism: "Une et Indivisible"

Number 3 — March 1998
I N F O R M A T I O N B U L L E T I N
Group co-ordinator: Aymeric Desurmont, SPC, B.P. D5, 98848 Noumea Cedex, New Caledonia; Phone: +687 262000;fax: +687 263818; e-mail: [email protected] Ñ Printed with financial assistance from the Government of France
ISSN 1026-2032
F i s h A g g r e g a t i n g D e v i c e
FAD
EditorialÔWhy do tuna gather around FADs? How long do tuna stay nearFADs? Why do some FADs seem to attract more tuna than oth-ers?Õ These are some of the many questions which interestresearchers working for the ECOTAP (Tuna Behaviour Studythrough Acoustics and Longline Fishing) programme in FrenchPolynesia. Pascal Bach and six other scientists participating inthe programme summarise (p. 3) the preliminary resultsobtained during experimental fishing carried out in the vicinityof FADs. Through concurrent use of ultrasonic telemetry to tracktuna and acoustic surveys to observe the surrounding environ-ment, these researchers have demonstrated the important effectwhich the biological environment has on horizontal and verticaltuna movements.
A large-scale study was carried out by Jean-Philippe Detolle andfour other scientists in La Reunion Island in the Indian Ocean forthe purpose of optimising FAD costs and lifespans. In addition tothe technical options proposed following an analysis of all the crit-ical points in the fabrication of mooring lines, the authors addressFADsÕ importance to the continuation and development of arti-sanal fishing activities on the island. The extract selected for thispublication (p. 19) covers the social and economic aspects of FADsthrough a study of their effects on the number of working fisher-men, catches and income. Oddly enough, few studies of this kindexist, although they are, in fact, essential when it comes to con-vincing governments and possible institutional donors of the mer-its of continuing FAD programmes.
Again in the same region, Michel de San, one of the designers ofa type of FAD which uses a surface array of small trawl buoys,summarises experiences with FADs in the Western Indian Oceanon page 24. In that part of the world, the FADs deployed are sim-ple to make and costs are kept down to the bare minimum.Fishing techniques there are very similar to those used in the
Secretariat of the Pacific Community
M A R I N E R E S O U R C E S D I V I S I O N – I N F O R M A T I O N S E C T I O N
Inside this issue
Experimental research andfish aggregating devices(FADs) in French Polynesiaby P. Bach et al. p. 3
The dynamics and effects ofFADs in La Reunion Island by J.-P. Detolle et al. p. 19
FAD – The Western IndianOcean experienceby M. de San et al. p. 24
Recovering FADs lost at a depth of 2000 mby M.Taquet et al. p. 30
Safety system developed for light FADsby M. Palladin p. 35
Readings p. 37
Bibliography . . . p. 40

SPC Fish Aggregating Device Information Bulletin #3 – March 1998
Pacific. Readers from the Pacific area will be sur-prised to learn that FADs may first have been usedin the Mediterranean and not in the Philippines asthey had always thought.
After the Pacific and Indian Oceans, we could notneglect the Atlantic. The news comes from theisland of Martinique, where Marc Taquet, PaulGervain and Alain Lagin (p. 30) present a veryoriginal technique used for recovering lost FADs.This technique made it possible to analyse themooring lines of the FADs recovered and identifythe causes of failure. The results confirmed thatmost problems occur in the upper part of moor-ings, which is where most of the efforts forimprovement should therefore be concentrated.WhatÕs more, the success obtained in Martiniquewith ultra-light, very low-cost FADs (about one-tenth the price of FADs used in the Pacific) shouldraise a lot of interest among those countries in ourregion whose FAD programmes have been put onhold for lack of resources.
Finally, Max Palladin, a consultant for SEPIAInternational, presents a security system for FADsdeveloped in Sao Tome (p. 35). A brilliant ideawhich is simple to implement.
In Alain Fonteneau and Jean-Pierre HallierÕs articleÔLa p�che aux thons sous objets flottantsÕ (ÔFishing fortuna around floating objectsÕ) published in the
November 1992 issue of La Recherche and translat-ed for the second issue of this bulletin, the authorsconclude by noting: ÔThe potential impact of artifi-cial floating objects on tuna resources and the envi-ronment will (É) require careful appraisal, to makesure that the development of this fishing technique(which appears very attractive initially) does nothave negative consequences on the ecological bal-ances of the ocean.Õ
Five years later, it must be noted that develop-ment of this technique by the fishing industry hasbeen much more rapid than assessment of itsimpact, particularly as concerns bigeye tunastocks (see the article from Fishing NewsInternational on p. 37). According to the latestnews, following expressions of concern by scien-tists, the fishing companies themselves havedecided to implement a three-month moratoriumon the use of this technique in some parts of theAtlantic Ocean. Close attention should be paid todevelopments in this area.
Scientific discoveries, new techniques, a socialand economic approach, ideas, inventions, not toforget concerns . . . FADs certainly aggregate lotsof discussion!
Happy reading.
Aymeric Desurmont
2
Workshop in preparationA workshop on FADs and the aggregation of large pelagic fish around floating objects is being planned byour colleagues in the Caribbean (IFREMER-IRPM) for 1999.The main topics addressed would be:
1. FAD technology (e.g. lifespan, cost, new materials).2. Economic, social and cultural aspects of FADs.3. Study of aggregation behaviour.4. FADs and fishery management: impact and limits.
Such a workshop would only be worthwhile if it brought together a large number of scientists, technol-ogists and fishing-sector professionals from many countries and indeed included representatives of man-ufacturers able to put forward new technological options (part 1).
If you are interested in this workshop, please send a message by e-mail or postal mail to:
Marc TaquetDélégation IFREMER des Antilles
Pointe Fort97231 - Le Robert
MARTINIQUE - FRANCEE-mail : [email protected]

SPC Fish Aggregating Device Information Bulletin #3 – March 1998
Introduction
Floating natural or man-made objects are oftenencountered at sea. Fishermen themselves deploysuch devices because they know that small or largepelagic fish are likely to gather around them andthat fishing there is likely to be productive.Artisanal fleets in South-east Asia have been usingthis technique to catch small pelagics for manyyears. Where the larger pelagics are concerned,purse-seine fishing around floating objects hasintensified over the past 20 years in all the worldÕsoceans. Fonteneau (1992), in a review of tuna fish-eries, wrote that the main area in which fishing iscarried out around floating objects is the westerncentral Pacific, where catches associated with suchdevices account for approximately 50 per cent oflandings. In 1995, 42 per cent of the French purse-seine catch and 65 per cent of Spanish purse-seinelandings in the Atlantic Ocean came from fishingaround floating objects. These figures rise to above70 per cent in the Indian Ocean (Stretta et al., 1996).
Fish aggregating devices (FADs) moored near thecoast are an aid to artisanal fleets targeting largepelagics such as tunas in many island states.Historically, the FAD testing area of the 70s was thePacific, with the guidance of the South PacificCommission. As was stressed by Holland (1996) inthis bulletin, FADs are now used world-wide tosupport or develop artisanal or sport tuna fisheries.
French Polynesia began its FAD deployment pro-gramme in 1981. Technological progress on materi-als, giving moorings a longer lifespan, has had animpact on the programme. The latest type of FADused in French Polynesia was recently discussed(Leproux & Desurmont, 1996) in this bulletin.
Scientists have been recording observations ontuna behaviour near FADs for about the past10 years (Cayr� & Chabanne, 1986; Holland et al.,1990a, 1992; Cayr�, 1991; Cayr� & Marsac, 1993;Marsac et al., 1996). Whatever the merits of observ-ing, however, understanding is better. Despite theextensive experimental work already carried out inall the worldÕs oceans and consequent wealth ofavailable information, Holland (1996), concludedthat a great deal remain to be learned on the mech-anisms (including the role of biological factors)affecting the relationship between tunas and FADs.
Why do tunas aggregate around FADs? How longdo tunas remain near FADs? Why do some FADsseem to be more effective in attracting tunas thanothers? These are some of the questions facing sci-entist from EVAAM 4, IFREMER 5 and ORSTOM 6,who are working together in the ECOTAP 7 pro-gramme in Tahiti.
These issues affect the resource at various levels ofperception (individual specimen, school, aggrega-tion) and on various time-scales from one day to
3
Experimental research and fish aggregating devices (FADs) in French Polynesia
by P. Bach 1, L. Dagorn 1, E. Josse 2, F.-X Bard 1, R. Abbes 3, A. Bertrand 2 & C. Misselis 3
1. Centre ORSTOM de Tahiti, BP 529, 98715 Papeete, Tahiti, French Polynesia2. Centre ORSTOM de Brest, BP 70, 29280 Plouzan�, France3. Antenne IFREMER, Centre ORSTOM de Tahiti, BP 529, 98715 Papeete, Tahiti, French Polynesia4. �tablissement pour la valorisation des Activit�s Aquacoles et Maritimes (Institute for the Development of Aquaculture and
Maritime Activities) B.P. 20, 98715 Papeete, Tahiti, French Polynesia.5. Institut Fran�ais de Recherche pour lÕExploitation de la Mer (French Institute of Research for Ocean Development)6. Institut fran�ais de recherche scientifique pour le d�veloppement en coop�ration (French Institute of Scientific Research for
Cooperative Development)7. ECOTAP: �tude du Comportement des Thonid�s par lÕAcoustique et la P�che (Tuna Behaviour Study through Acoustics and Fishing)
SPC Fish Aggregating Device Information Bulletin #3 – March 1998
several months. To find the answers to these ques-tions, science needs to call upon a range of toolsand methods: sonic tagging, active acoustics, cou-pling of sonic tagging and active acoustics,Artificial Life modelling.
Initially, this paper will discuss the two main toolsused by the ECOTAP programme: ultrasonictelemetry and acoustic surveys. These tools wereeither used separately or together depending onthe goals of the activities concerned. The secondpart of the paper will address implementationmethods, with some comments on the initialresults being given in each case. Lastly, someplanned analytical and experimental work willbe discussed.
Tools used as part of the ECOTAP programme
Sonic tagging
The first fish tracking by sonic telemetry was car-ried out in the late 50s (Trefethen, 1956 in Yuen,1970). Much more research has been carried outfor the purpose of describing fish movements intheir natural environment since that time, throughthe rapid development of telemetry, in otherwords, the distant transmission of a signal carry-ing the result of measurement work, which hasbeen made possible by technological progressachieved in electronics and in particular the minia-turisation and improvements in the range andlifespan of transmitters.
Since the work carried out by Yuen (1970) on tunas,many sonic tagging experiments have been per-formed out in all the oceans. Holland (1996) hasproduced a synopsis of the results so far publishedof tuna tagging near FADs (Cayr� & Chabanne,1986; Holland et al., 1990a, 1992; Cayr�, 1991; Cayr�& Marsac, 1993; Marsac et al., 1996).
Under the ECOTAP programme, tuna tracking bysonic telemetry was performed using two differentdevices.
The first, which was used in the first series ofexperiments, comprised a VEMCO V-10 bearing(directional) hydrophone fitted to a paravanetowed by the boat. This hydrophone was connect-ed to a VEMCO VR-60 decoder which convertedthe value of the raw signal transmitted by the taginto the value of the variable measured (depth, inthe case of our experiments). The boat position wasrecorded on a global positioning system (GPS)receiver every five minutes.
Concerning the second, which has been in usesince 1996, signal reception was by the ÒVEMCO V-
41 Bearing HydrophoneÓ system fitted to a towedparavane. In this case, four basic hydrophones,each having its own listening angle, were used.Four zones were defined for the horizontal plane:forward, rear, port and starboard. All the hydro-phones were connected to a VEMCO VR 28 receiv-er by an electromechanical cable. This receiver wasequipped with a control module making it possibleto select which of the four areas was to be listenedto. The receiver was connected to a micro-comput-er through an RS232 link. This micro-computerwas also connected to a GPS through a secondRS232 link.
The ÒTRACKÓ software package used on themicro-computer made it possible to record:
¥ signals transmitted by the tag and decoded bythe receiver every second, and
¥ GPS data every five seconds.
Two methods were used to attach the tag to thefish. The most widely used method for tunas,which has been described in this bulletin byHolland (1996) involves attaching the tag usingtwo nylon straps inserted through the musclebehind the dorsal fin. This method is difficult touse on specimens weighing over 30 kg. In suchcases, it is preferable to tag the fish in the water inthe same way as with billfish (Holland et al., 1990b;Brill et al., 1993). The sonic tag is attached to a flex-ible tag developed as part of a billfish taggingexperiment. A pole with a stainless steel arrowheadis used. The hydroscopic nylon head of the hollowflexible tag is pushed through the fishÕs muscle bymeans of the arrowhead. A ring fitted to the poletwo or three centimetres behind the tip acts as astop, preventing the nylon head from penetratingtoo far. A rubber band secures the tag to the pole toprevent it being misplaced during preparations fortagging (Figure 1).
Active acoustics
There are two different main acoustic surveymethods:
¥ active acoustics where the basic informationcomes from the echoes returned by the targetsfrom a signal generated by the sonic equipment,and
¥ passive acoustics performed by analysing nois-es spontaneously emitted by organisms or theenvironment.
The use of active acoustics to detect fish (acousticsurveys) was first referred to in the scientific liter-ature in 1929 (Kimura, 1929 in Johannesson &
4

SPC Fish Aggregating Device Information Bulletin #3 – March 1998
Mitson, 1993). Not until the 1960s did the firstelectronic integrators appear, making it possibleto process fish echoes (echo-integration).Quantitative fish stock estimates then made rapidprogress (Johannesson & Mitson, ibid.). There arevarious types of sounders which differ in theiroperating principles and the kind of informationthey collect.
Only vertical sounders were used in the ECOTAPprogramme. The Biosonics 102 model, using twofrequencies, 38 kHz and 120 kHz, was used firsteither in normal mode (single beam) to make quan-tity assessments or in dual beam mode to deter-mine the target strengths (TS) of individual sub-jects. The echo-integration data collected with theBiosonics sounder were analysed using the INES-MOVIES software package (Diner, 1990). From1995 onwards, observations were carried out witha SIMRAD EK500 sounder, operating on two fre-quencies, 38 kHz and 120 kHz. This is a compactsounder including an echo-integration module anda TS analysis system. The 120 kHz transducer is asingle beam transducer whereas the 38 kHz is asplit beam transducer.
Results of some experiments
Movements of tunas tagged near FADs
Tuna tagging experiments near FADs in FrenchPolynesia began in November 1985 (Cayr� &Chabanne, 1986) and continued in 1992 as part ofthe EVAAM FAD programme, in 1993 as part of the
ECOTAPP experimental programme (Abbes et al.,1995) and then in 1995 under the ECOTAP pro-gramme. Nine tunas have been tagged near FADssince 1992 (8 yellowfin, Thunnus albacares and1 bigeye, Thunnus obesus), four of which are thesubject of this report. Three involved conventionalultrasonic tagging while the fourth was an associa-tion of acoustic survey and ultrasonic tagging.
Yellowfin tagged on 2 September 1992
A yellowfin tuna 48 cm in fork length was caughtby trolling near a FAD located 20 nautical miles(nm) east-south-east of the Tahiti peninsula (seeFigure 2 on next page). Tagged in the morning(09:11, local time), this fish was tracked for almost28 hours. After being tagged, this fish stayed closeto the FAD for approximately four hours beforeheading south (between 12:30 and 16:30) thensouth-west (from 16:30 to 18:00). At sunset, it waslocated 1.5 nm from the FAD and then veeredwest and subsequently north. It then startedswimming back towards the FAD, which it swampast at a distance of 0.5 nm, before exploring thezone to the north of the device.
From the middle of the night to dawn, this ani-malÕs horizontal movements were not very exten-sive in an area which it would again favour inmid-morning, after a period of rapid movementstowards the FAD. The fish was lost at 11:11 andthen relocated two hours later at the FAD. Duringthe tracking period (28 hours) the fish did notmove more than 2.1 nm away from the FAD.
5
ShaftSonic tag
Washer
Rubber band
Hydroscopicnylon head
Stainless steel tip
Figure 1 Sonic tag attachment device for specimens weighing over 30 kg

SPC Fish Aggregating Device Information Bulletin #3 – March 19986
149¡42' W
17¡23' S
148¡29' W
18¡08' S
Ta hiti
DCP deMehetia
09:11 le 02/09/9211:11 le 03/09/92
Poisson retrouv�le 03/09/92 � 13:00
sous le DCP Jour
Nuit
148¡ 50' W17¡ 53 ' S
148¡ 45 ' W
17¡ 58' S
1 nm
11:11 on 03-09-92
Daytime
Night-time
09:11 on 02-09-92
Fish relocated on 03-09-92 at 13:00
at the FAD
Mehetia FAD
Figure 2
Horizontal movements of the 48 cm fork-length yellowfin tuna tagged on 2 September 1992 and tracked for 28 hours

SPC Fish Aggregating Device Information Bulletin #3 – March 1998
Vertical movements during the diurnal phase weremostly limited (between 180 and 260 m) except twobrief deep dives to 430 m in the morning and 470 min the afternoon (Figure 3). The fish moved upnearer the surface early in the night (50Ð120 m)before commencing a phase of wide depth varia-tions (50Ð250 m). During the morning of the secondday, the fish remained between 150 and 250 m, inan identical manner to the first day.
Yellowfin tagged on 2 March 1993
A yellowfin tuna 51 cm in fork length was caughton a trolling line near FAD no. 165 (Punaauia FAD)located 5.2 nm from TahitiÕs west coast (seeFigure 4 on next page). This specimen was taggedat 18:35 (local time) and tracked for approximately64 hours. It left this FAD just after being tagged andswam parallel to the coast for the first nighttowards FAD no. 179 (Paea FAD) located 6.4 nmfrom the previous one. Little movement was
recorded between 09:30 and 12:30, and the fishremained within a semi-circle 1.5 nm in radiusfrom the FAD. In the middle of the day, its move-ments turned southwards towards a third FAD(FAD no. 170, known as the Papara FAD) located9.2 nm from the second and 15.6 nm from the first.It continued swimming towards this FAD all nightto reach a point approximately 0.8 nm from it atfirst light. During the day and in the early evening,it remained relatively far from the FAD, returningtowards it in the middle of the night (maximumdistance from the FAD = 7.8 nm).
Early in the morning (07:00 local time), it was locat-ed under the FAD and remained there until 09:30when tracking ended. A synopsis of these resultsreveals that the fish swam between the FADs onthe first two nights and came back to the third FADduring the third night, having swum away from itat the end of the second day. The diurnal phaseswere spent in areas close to FADs.
7
Figure 3Vertical movements of the 48 cm fork-length yellowfin tuna tagged on 2 September 1992
Local time
Depth (m)
Frequency (%)
Depth (m) Depth (m) Depth (m)
Frequency (%) Frequency (%)

SPC Fish Aggregating Device Information Bulletin #3 – March 1998
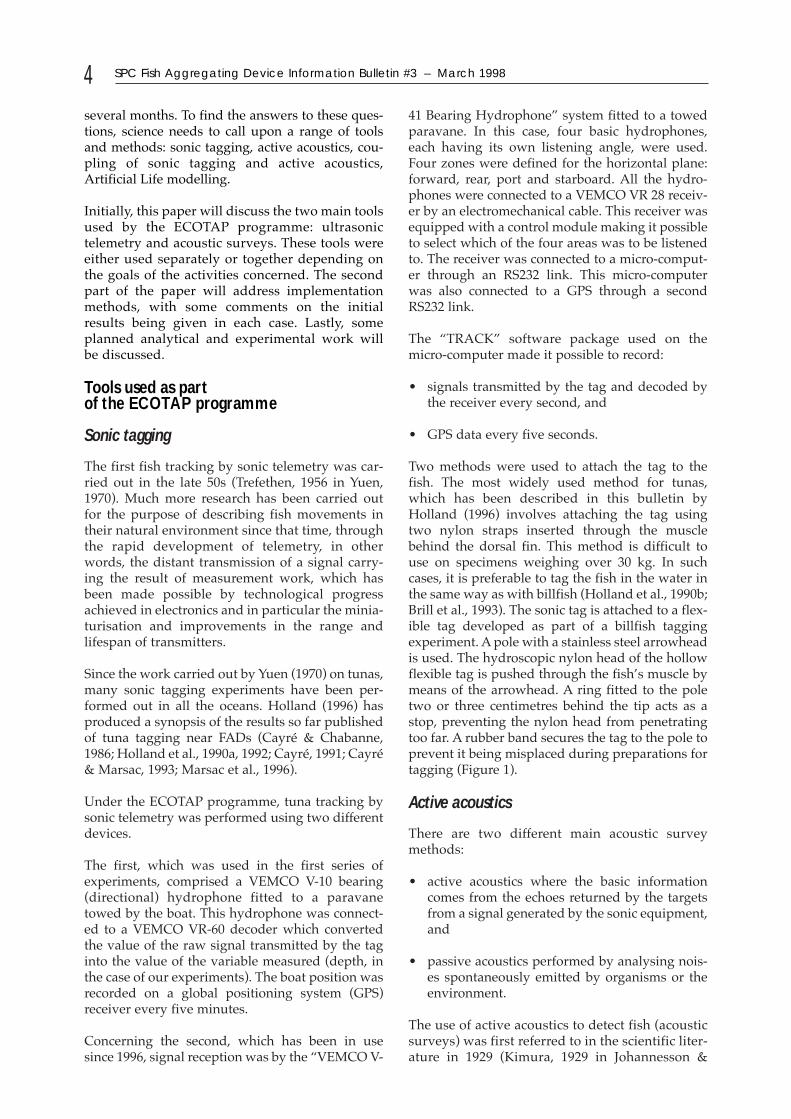
The average speed-frequency distributions perthirty minute period calculated during the nightsand days of tracking show that these speeds fluc-tuated over time (Figure 5). From being relativelystable over the first two nights and the first day oftracking (average speed approximately = 0.9 knotor 1.7 km/h), they increased during the second day(average = 1.4 knots or 2.6 km/h) and the thirdnight (average = 1.6 knots or 3 km/h) to reduce atthe beginning of the third day when the fish wasnear the FAD (average = 0.4 knot or 0.7 km/h).
The vertical movements show that on the first night,the fish occupied the water layer between the sur-face and a depth of 120 m with a dive to 250 m in themiddle of the night (Figure 6). On the other hand,during the next two nights, it mostly remained inthe top 80 m. During the first diurnal phase, the fishshowed a preference for depths of between 100 and140 m while swimming between the surface and210 m during the second. This difference in diurnalvertical movements was in both cases observedwhen the fish was swimming close to a FAD.
8
FAD no. 149
FAD no. 170
FAD no. 179
FAD no. 165
End of trackingon 05-03-93 at 09:53
Night-time
Daytime
02-03-93at 18:35
Figure 4Horizontal movements of the 51 cm fork-length yellowfin tuna tagged on 2 March 1993
at FAD no. 165 (Punaauia) and tracked for 64 hours
SPC Fish Aggregating Device Information Bulletin #3 – March 1998 9
Figure 6Vertical movements of the 51 cm fork-length yellowfin tuna tagged on 2 March 1993
0
1
2
3
4
5
6
7
8
9
0.25
0.75
1.25
1.75
2.25
2.75
3.25
3.75
4.25
4.75
5.50
6.50
Night 1 (N = 23)Night 2 (N = 21)
Night 3 (N = 21)
0
1
2
3
4
5
6
7
8
9
0.25
0.75
1.25
1.75
2.25
2.75
3.25
3.75
4.25
4.75
5.50
6.50
Day 1 (N = 27)Day 2 (N = 24)Day 3 (N = 4)
(0.1
35)
(0.9
45)
(1.7
55)
(2.5
65)
(3.5
10)
Average speed (km/h and (knots))
(0.1
35)
(0.9
45)
(1.7
55)
(2.5
65)
(3.5
10)
Average speed (km/h and (knots))
BA
Figure 5Average speed-frequency distributions per 30-minute period observed at night (A)
and during the day (B) in the course of tracking
Local time
Dep
th (
m)

SPC Fish Aggregating Device Information Bulletin #3 – March 1998
Yellowfin tuna tagged on 2 March 1996
A 90 cm fork-length yellowfin tunawas caught on a vertical longline(drop-stone fishing, Moarii &Leproux, 1996) near FAD no. 204(Papeete FAD) located 14.2 nm offthe northern coast of the island ofTahiti (Figure 7).
During tracking, which lastedalmost 81 hours, the fish always re-mained at a distance of less than1 nm from this FAD. This taggingexperiment shows that the fish didnot leave the FAD for at least81 hours or approximately 4 days.
The vertical movements oscillatebetween the surface and 165 m(this depth interval corresponds toa temperature interval between the28.5¡C and 23¡C values). No signif-icant difference between diurnaland nocturnal movements wasrecorded (Figure 8).
10
Figure 7Horizontal movements of the yellowfin tuna in the vicinity
of the Papeete FAD from 09:13 on 2 March 1996 to 18:00 on 5 March 1996
Various positions of FAD during tracking
Figure 8Vertical movements of the 90 cm fork-length yellowfin tuna during the 81 hours of tracking
Night-time
Daytime
Local time
Dep
th (
m)
SPC Fish Aggregating Device Information Bulletin #3 – March 1998
Coupling of acoustic surveys and ultrasonictagging
The use of active acoustics together with a sonic tag-ging experiment made it possible to observe the bio-logical environment inhabited by the tracked fish. Inthe same way as with the physical environment(temperature, dissolved oxygen) it becomes possibleto consider this biological environment as anexplanatory factor for vertical and horizontal tunamovements (Josse et al., 1997). The tagging experi-ment described below illustrates the wealth of infor-mation that such a dual method can provide.
Yellowfin tuna tagged on 27 October 1995
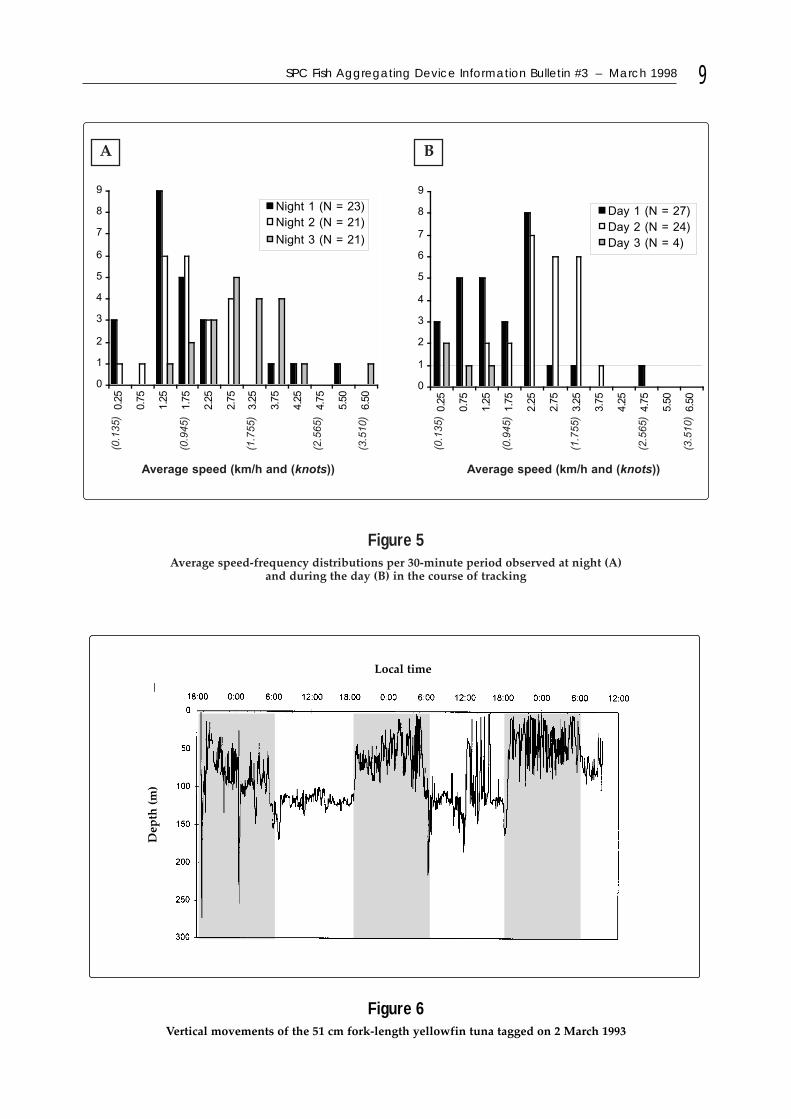
A 60 cm fork-length yellowfin tuna was caught byvertical longlining near FAD no. 177 (Maupiti FAD)moored near the island of Maupiti (16¡27'S and152¡17'W), (Figure 9). This fishÕs horizontal move-ments can be divided into four periods:
(i) association with the FAD just after tagging; (ii) gradual movement away from the FAD until
sunset (the maximum distance from the FADwas 3.3 nm at 17:14);
(iii) gradual return to the FAD until 23:00; and(iv) gradual movement away from the FAD paral-
lel to the coast from 23:00 onwards.
Two periods characterise the vertical movements :
(i) under the mixed layer during the day, and(ii) in the mixed layer for the nocturnal period
observed.
Within an oligotrophic environment, a sound scat-tering layer (SSL) was observed (Figure 9), usingthe SIMRAD EK500 sounder. SSLs were sampledseveral times during pelagic trawling, revealingthat they are formed of tuna prey. The fish crossedthis layer a first time during the day (see Figure 10on next page) and a second time at night (seeFigure 11 on next page). During the second cross-ing, this fish changed its vertical movement: itswam in the mixed layer at night and left to enterthe prey aggregation, probably for feeding purpos-es. The horizontal movements would appear to bemore due to the attraction exerted by this layerthan by an association with the FAD.
Synopsis of the four taggings described in this document
The last tagging experiment coupled with anacoustic survey revealed the need to observe thebiological environment in the same way as the phys-ical and chemical environments in order to betterunderstand the behaviour of tunas near FADs.
11
Figure 9Horizontal movements of the 60 cm fork-length yellowfin tuna caught
and tagged at a FAD moored near the island of Maupiti. Superimposition of the sound scattering layer (SSL) on the horizontal movements

Sound scattering layer (SSL)
SPC Fish Aggregating Device Information Bulletin #3 – March 1998
In addition, these four taggings showed that it isnot possible to define a single kind of association(in term of duration or horizontal and verticalmovements). The first and third tunas remainednear the FAD during tracking whereas the secondand fourth tunas left the FAD close to which theyhad been caught to visit other FADs or follow theoutline of the coast. Similarly, the vertical profilesdid not make it possible to show any particulartrend as to vertical movements near FADs.
Use of acoustic survey methods to studythe daily variability in aggregations
In analysis of tuna-FAD relationships, sonic tag-ging with tracking only yields information on theserelationships at the level of the individual fish.Multiple ultrasonic tagging (up to 20 specimens)with a network of receivers installed on neigh-
bouring FADs makes it possible to analyse thegroupÕs degree of cohesion, the strength of its rela-tionship with a FAD and the exchange mechanismsbetween FADs on a time scale which will be deter-mined by the lifespan of the transmitters (Klimley& Holloway, 1996).
Acoustic surveys around FADs make it possible toconsider the associated aggregation. The purposeof the experiments carried out in Tahiti (seeDepoutot, 1987 and Josse, 1992, for some initialresults) was to study the horizontal and verticalextensions of aggregations and their variations ona one-day time scale. Acoustic surveys, in a starformation around the FAD (Figure 12) were carriedout several times per day in order to do so.
The results presented here concern a series ofacoustic surveys performed with the Biosonics 102
12
Vertical movements of thetagged tuna through the SSL
Local time
Depth (m)
0
0
250
500
13:00 14:00
14:00 14:30 15:00
15:00
100
200
300
400
Depth (m)
Vertical movements of
the tagged tunathrough the SSL
Sound scattering layer (SSL)
Local time
Depth (m)
0
0
250
500
19:00 20:00 23:0021:00
20:30 21:00 21:30
22:00
100
200
300
Depth (m)
Figure 10Vertical movements of the yellowfin tuna in thedaytime between 13:30 and 15:00 (local time) andrelationship with the sound scattering layer (SSL)
Figure 11Vertical movements of the yellowfin tuna in the
night-time between 20:15 and 21:30 (local time) andrelationship with the sound scattering layer (SSL)

SPC Fish Aggregating Device Information Bulletin #3 – March 1998
sounder in July 1993 around a FADmoored off the island of Nuku Hiva inthe Marquesas Group (FAD moored1.5 nm from the coast at a depth of450 m). These are preliminary resultsand take into consideration overallacoustic response values irrespectiveof individual target strengths (TS). Sixoperations were carried out over a 24-hour period but only the results ofthree of them will be presented herefor clarity reasons.
Acoustic density values were calculatedby depth stratum (10 strata each 25 m inwidth between the surface and 250 m)taking into account distance from theFAD (4 distance strata of 0.2 nm).
During the night-time acoustic surveys(Figure 13A), the high acoustic respons-es in the first 50 m (strata 25 and 50) aredue to the presence of a nocturnal deepscattering layer (DSL). Under this layer,some strong response values corre-spond to detections of single fish situ-ated between 75 m and 150 m. The firstdaytime trip (Figure 13B) reveals thedisappearance of the night deep scat-tering layer which had migrated deep-er, beyond the echosounderÕs verticalrange. Small schools of fish are presentvertically beneath the FAD to 125 m, asare isolated fish at greater depths(between 175 m and 250 m), 0.3 nmfrom the FAD. Early in the afternoon(Figure 13C) the aggregation wouldappear to be more compact close to theFAD. Detections are also observed atgreater depth (125 m and 150 m) fur-ther from the FAD.
An appraisal of the previous resultsmade it possible to reveal the highresponse to nocturnal acoustic sur-veys associated with the presence of adeep scattering layer in the top 50 m.At night, if the 0Ð250 m water layer isconsidered in its entirety, the intensityof this response thus creates back-ground noise which masks any verti-cal variations in acoustic responsedependent on other organisms such astunas. In order to discriminatebetween these two sources of acousticresponse (DSL, and predators apartfrom DSL) two depth strata were con-sidered individually, a 0Ð50 m stratumand a 50Ð250 m stratum.
132
4
6
10
148
12
16
DCP
0.8 nm
Figure 12Star pattern
acoustic survey work around FADs
25 75 125 175 2250.1
0.30.5
0.7
0
0.1
0.2
0.3
0.4
0.5
Densit�
acoustique
Profondeur (m)
Distance au DCP (nm)
A20:55
�21:15
25 75 125175 225
0.10.3
0.50.7
0
0.1
0.2
0.3
0.4
0.5
Densit�
acoustique
Profondeur (m)
Distance au
DCP (nm)
B09:00
�11:30
25 75125 175 225
0.10.3
0.50.7
0
0.1
0.2
0.3
0.4
0.5
Densit�
acoustique
Profondeur (m)
Distance au DCP (nm)
C13:10
�15:40
Acousticdensity
Depth (m)
Depth (m)
Depth (m)
Distanceto FAD (nm)
Distanceto FAD (nm)
Distanceto FAD (nm)
Acoustic density
Acousticdensity
A20:55
to21:15
B9:00to
11:30
C13:10
to15:40
FAD
Figure 13Acoustic response density distributions by depth stratum
(25 m stratum) according to distance from FAD (0.2 nm stratum)observed during successive acoustic surveys around
the Nuku Hiva FAD (Marquesas Group).
SPC Fish Aggregating Device Information Bulletin #3 – March 1998
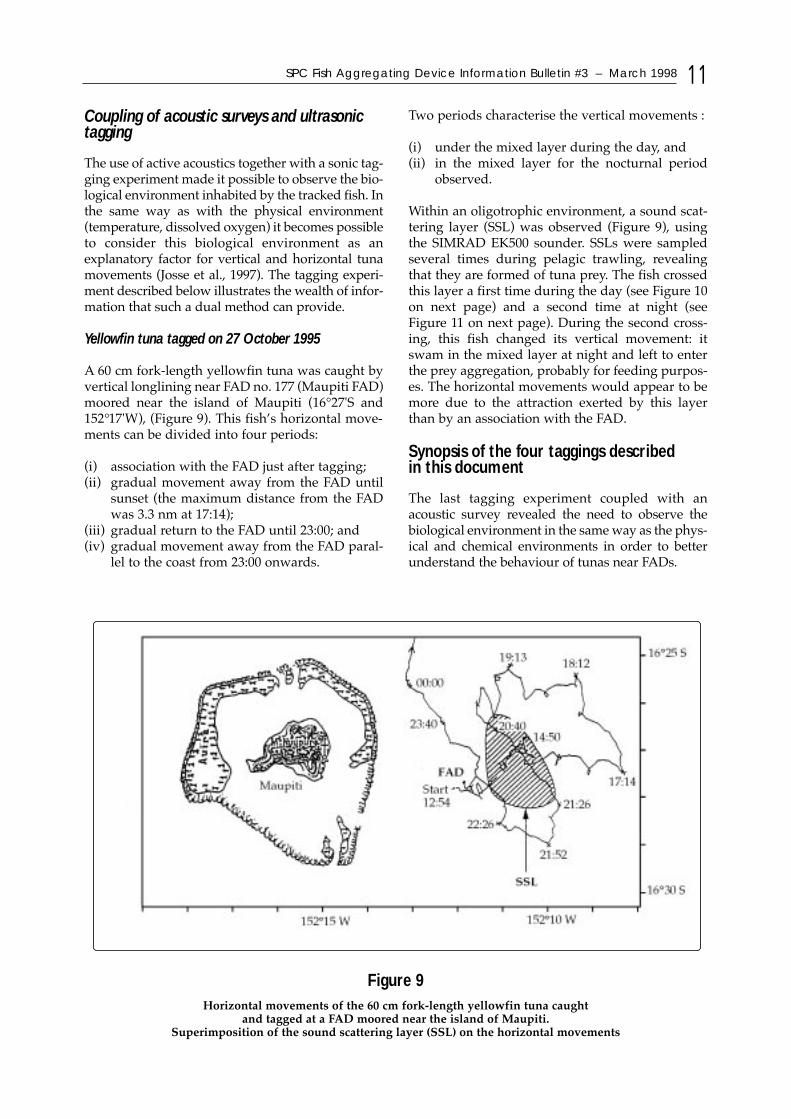
During the night-time, between 0 and 50 m,acoustic responses are high and located offshorerather than close to the coast (Figure 14A). In thedaytime, the acoustic response densities observedin this layer are low with the exception of someareas located near the FAD and, in this case, thehighest values are located between the FAD andthe coast (Figure 14B and C).
The spatial distribution of acoustic responsesbetween 50 and 250 m differs from that observedfor the upper layer (Figure 14D, E and F). Wherenight-time acoustic surveys are concerned(Figure 14D), no particular trend can be noted as tothe orientation of acoustic response intensities. Onthe other hand, this trend does appear with day-time surveys. In the same way as for the 0Ð50 mstratum, high acoustic densities are recorded nearthe FAD, as well as along certain radials
(Figure 14E and F). These radials are always locat-ed between the FAD and the coast (north-east andeast radials of Figure 14E, south-east radial ofFigure 14F). The high values near the FAD corre-spond to two small schools located in the top100 m and to some isolated fish echoes identifiedto a depth of 250 m and a distance from the FAD of0.45 nm (Abbes et al., 1995). Vertical longliningover these isolated echoes yielded young yel-lowfin tuna at depth of between 100 and 150 m.
This spatial heterogeneity could be due to the fishpositioning themselves in relation to a current. Theacoustic responses recorded at the greatest distancefrom the FAD are thought to be able to be attrib-uted to detections close to the sea floor which is ata depth of approximately 200 m at the end of theeast radial. These detections probably relate moreto the demersal than to the pelagic fish resource.
14
ShoreOffshore
A20:55to 21:15 B09:00
to 11:30 C13:10to 15:40
0≤ d < 0.03 0.03≤ d < 0.1 0.1≤ d < 0.4 0.4≤ d < 0.8 d > 0.8
D20:55to21:15 E09:00
to 11:30 F13:10to 15:40
0≤ d < 0.04 0.04≤ d < 0.1 0.1≤ d < 0.3 0.3≤ d < 0.7 d > 0.7
ShoreOffshore
Figure 14 Spatial distributions of acoustic response densities by 0.2 nm intervals as observed
in the 0Ð50 m stratum (A, B, C) and in the 50Ð250 m stratum (D, E, F) during a series of acoustic surveys carried out around the Nuku Hiva FAD (Marquesas Group).

SPC Fish Aggregating Device Information Bulletin #3 – March 1998
Discussion
The results presented in this paper and those underanalysis show that no real trends exist whichwould make it possible to define the behaviour oftunas in relation to FADs in simple terms.
At the scale of the individual specimen, the pub-lished results (Cayr� & Chabanne, 1986; Hollandet al., 1990a; Cayr�, 1991; Marsac et al., 1996;Marsac & Cayr�, 1997) as well as those presentedin this document demonstrate the variability oftagged tunasÕ horizontal and vertical movementsin the vicinity of FADs. Concerning horizontalmovement, tunas assumed to be associated with aFAD swim at a variable distance from it, up to5 nm in the daytime and 7 at night (Marsac &Cayr�, 1997). Tracking for several successive daysshowed that some tunas remained under the FADall the time, while others stayed close to the FADin the daytime and swam away from it during thenight, returning towards the FAD on the follow-ing day or leaving it in a horizontal movementpattern tied to the coast, or offshore, or attractedby other objects such as a new FAD. In othercases, a tuna could return to a FAD severalmonths later after an initial association with it(Klimley & Holloway, 1996).
Tagged tunasÕ vertical movements close to a FADvary in a given geographical area. The only con-stant factor in these movements concerns the nyc-themeral variation, with movements generally tak-ing place close to the surface at night rather than inthe daytime. This trend would appear to be inde-pendent of the tunaÕs relationship with the FAD,since it is observed with specimens not associatedwith FADs. However, some authors (Holland et al.,1990a; Cayr� & Marsac, 1993) have shown theinfluence of FADs on tunasÕ vertical movements.
One piece of information which makes it possibleto justify the heterogeneity observed in the behav-iour of tunas near FADs can be provided by ourobservations as represented on Figure 9. This resultsuggests that the spatial structure of the biologicalenvironment could be one of the explanatory fac-tors in the diverse ways in which the relationshipsof tunas to FADs express themselves, a theorywhich have not yet been put forward.
It is difficult to draw conclusions about the struc-ture and spatial organisation of FAD-generatedaggregations. Also, results differ regarding faunacomposition determined from the observation ofFAD-related catches. This difference should berelated to the diversity of fishing techniques used.Skipjack (Katsuwonus pelamis) and small yellowfintuna, generally swimming in mixed schools,(Depoutot, 1987; Cayr� et al., 1991; Sims, 1992;
Cillauren, 1994) account for the major proportionof catches from trolled aggregations. In FrenchPolynesia, handlining has almost entirely replacedtrolling around FADs (Josse, 1992). The albacore(Thunnus alalunga) accounts for approximately80 per cent of catches and is taken with lines 140 to270 m in length (Asine, pers. comm.). When arti-sanal fishermen target yellowfin, they usually useshorter lines (approximately 90 m long). Thesehandlines are set at random around the FAD with-in a radius of approximately 0.5 nm and their suc-cess would not appear to be connected with dis-tance from the FAD.
Current knowledge does not make it possible todeduce the specific composition of schools fromacoustic responses. However, with results recentlyobtained on target strength of tunas (Bertrand et al.,1997), future analysis of acoustic surveys carriedout around FADs should make it possible to char-acterise aggregation composition more accurately.
The results gained from acoustic surveys aroundFADs provide a partial image of the aggregation inits vertical and horizontal extensions. These resultsdepend on the sampling methodology (meansused and protocol). Depoutot (1987), usingacoustic survey techniques sampling the top 100 mof the ocean, demonstrated that aggregationsshowed major spatial and temporal variability,with acoustic responses diminishing during theday and increasing during the night. During thediurnal phase, the acoustic responses increase withdecreasing distance from the FAD without a cleartrend as to their orientation in relation to the FAD.At night, the acoustic responses are higher andincrease with distance from the shore.
These results concur with those presented in thispaper for the 0Ð50 m stratum. In contrast, we haveshown that fish echoes were identified down to adepth of 250 m and up to a distance of 0.3 nm fromthe FAD. In the case of sonic tagging, fish echoescould be recorded at a distance of 5 to 7 nm from theFAD and at depths of over 250 m. Maximum echodistance corresponds to the length of the radials car-ried out : 0.6 nm for Depoutot (1987) and 0.8 nm forthe observation described in this paper, whichshows the limits of this kind of experiment foraddressing the aggregation in every dimension.
It can be seen therefore that the issue regardingtuna aggregation dynamics around FADs, oftenaddressed by scientists, has not for the momentfound a satisfactory response. This answer is nev-ertheless the one the most keenly awaited by fish-ermen and coastal fishery managers using FADsto maintain and develop both artisanal and sportfisheries. This situation can be explained by twomain reasons.
15

SPC Fish Aggregating Device Information Bulletin #3 – March 1998
The first, as we have seen, is connected with thespatial and temporal limits of ultrasonic taggingoperations and acoustic surveys. In this connec-tion, Kleiber and Hampton (1994) stressed that:ÔThese tracking studies deal with individual ani-mals perhaps in the vicinity of one or a few FADs.They typically cover a time scale of days and a spa-tial scale of tens of kilometres. It is not clear how toextrapolate the findings to longer term movementswithin a population of tunas in a large area occu-pied by a given spatial arrangements of manyFADs.Õ Multiple-tagging with listening stations(Klimley & Holloway, 1996) improves the coveragein space and time of the results of tuna-FAD rela-tionship studies.
The second reason is connected with the restric-tions imposed by the issue of the relationshipbetween an aggregation and a FAD. To provideanswers supposes that all the mechanisms govern-ing a relationship between the two factors shouldbe taken into consideration. In particular, it isessential that the spatio-temporal observation scaleshould be higher than or equal to that in whichthese mechanisms act.
We believe that it is essential to distinguishbetween two spatio-temporal windows for fishlikely to gather around FADs (Figure 15): firstly, awindow corresponding to the FADÕs radius ofattraction (window A); secondly, a window whichcan be referred to as a comfort window (Postel,1966; Legett, 1977; Balchen, 1979; McKeown, 1984)which is defined by the biological quality of theenvironment (window B). The results of ultrasonictagging show that a FAD attraction radius isapproximately 5 nm in the daytime and 7 at night(Marsac & Cayr�, 1997), which could correspond tothe size of window A. The edges of the comfortwindow (window B) will be determined by theenvironmentÕs capacity to meet fishesÕ needs,in particular their food needs. One B windowcould contain several A windows (a number ofFADs). In this way, a fish can satisfy its needswithin a given A window, which would explaintheir back-and-forth movements close to a FADor why they remain associated with a FAD. If afish cannot meets its needs within an A win-dow, it leaves the A window, while remainingwithin a B1 comfort window (see Figure 15),where it may meet other FADs (A windows). Ifthis B1 window does not enable it to satisfy itsneeds, it may go to a B2 window and be able toassociate itself with FADs if these are present inthat window (Dagorn, 1994). Thus, whenKlimley and Holloway (1996), observe a timeinterval of 114 days before a tuna returns to aFAD, this tuna might have remained, duringthe period in question, within the same com-fort window, while it might or might not have
associated itself with other FADs, swum withinanother comfort windowÑwith or without anassociation with FADsÑand then again returned tothe FAD where it was tagged.
This working hypothesis is under test in the ECO-TAP programme. A modelling tool has been select-ed and the approach used calls upon recent devel-opments in the sphere of Artificial Life modelling.
The tridimensional biological environment (win-dow B = comfort window) of the tunas in themodel, comprises various A windows (FADs) 10 to12 nm apart. This biological environment corre-sponds to a prey environment based on acousticobservations carried out during ECOTAP.
TunaÕs movements are modelled by using artifi-cial neurone networks. In fact, an artificial tunaconsists of variety of internal and external sensorsand interprets the data from these sensors overtime, which makes it possible to determine itsbehaviour (swimming speed, direction anddepth) on the basis of stimuli perceived arounditself (prey, FADs).
This model is still under development. However,the initial results obtained concur with the resultsof movements observed during ultrasonic tagging(Dagorn et al., 1997). This approach thereforemakes it legitimate to study the relationshipsbetween tunas and FADs at space and time scalessuperior to those conventionally used so far. Thiskind of simulation, which calls upon the results ofacoustic surveys and ultrasonic tagging is anavenue of work which is currently being devel-oped in order to propose a fishery managementplan based on FAD deployments (distance fromthe coast and FAD network density).
16
A12
A21
A22
A23
A11
B1 B2
Figure 15
Example of FAD window layouts (Aij) around two different Bi comfort windows.

SPC Fish Aggregating Device Information Bulletin #3 – March 1998
Conclusion
Research on the theme of the relationships betweentuna aggregations and FADs has made consider-able progress over the past ten years. A range oftools has been developed within the ECOTAP pro-gramme to improve knowledge in this area.
The results obtained from ultrasonic taggingagree with those already published. The use ofacoustic surveys and sonic tagging in a coupledarrangement has made it possible to reveal theimportant role played by the biological environ-ment on tunasÕ horizontal and vertical move-ments. A similar association has made it possibleto carry out the first target strength measurementsfor tunas and thus future acoustic survey analysiswill make it possible to qualify and quantifyaggregation more accurately.
Acoustic observations of the biological environ-ment played a determining role in all our experi-ments. They lead us in particular to address the rel-evance of the scale of study of the relationshipbetween an aggregation and a FAD. Thus, webelieve that issues such as tunasÕ ÔfaithfulnessÕ to aFAD, exchange mechanisms between FADs and theattraction of a FAD should be considered on a scaletaking into account a spatio-temporal windowwhich can be referred as a comfort window. Theedges of this window correspond to the environ-mentÕs capacity to satisfy the needs of the resource.This working hypothesis is currently being testedusing an artificial life modelling approach.
On the experimental level, future observationswithin the study of the relationship between tunasand FADs will need to take into considerationspace and time scales greater than those so farused. In addition, then, to the instrumentsdescribed in this paper, those used in future willneed to make it possible to include the followingscales: network of echo-sounding buoys, networkof listening posts, pop up tags, conventional tag-ging and high-definition satellite station.
At a time when the exploitation of tuna resourcesaround floating objects is expanding considerablywithout it being yet possible to evaluate the conse-quences of this type of fishing on stocks, research onthe relationships between tuna and drifting andanchored floating objects is becoming more impor-tant than ever.
References
ABBES, R., A.S. ASINE, P. BACH, E. JOSSE, A.LEBOURGES & B. WENDLING. (1995). �tude ducomportement des thonid�s par lÕacoustique etla p�che � la palangre en Polyn�sie Fran�aise.
Rapport de la campagne ECOTAPP, Doc. Int.ORSTOM/IFREMER/EVAAM. 157 p.
BALCHEN, J.G. (1979). Modeling, prediction, andcontrol of fish behavior. In: Control and dynam-ic systems. Advances in theory and application.Leondes ed., 15, 99Ð146.
BERTRAND, A., E. JOSSE & J. MASS�. (1997).Preliminary results of acoustic target strengthmeasurements of Bigeye (Thunnus obesus) andYellowfin tuna (Thunnus albacares). 5th Indo-Pacific Fish Confer., 3Ð8 Nov. 1997, Noum�a.
BRILL, R.W., D.B. HOLTS, R.K.C. CHANG, S. SULLIVAN,H. DEWAR & F.G. CAREY. (1993). Vertical andhorizontal movements of striped marlin(Tetrapterus audax) near the Hawaiian Islands,determined by ultrasonic telemetry, with simul-taneous measurement of oceanic currents. Mar.Biol. 117, 567Ð574.
CAYR�, P. (1991). Behaviour of yellowfin tuna(Thunnus albacares) and skipjack tuna(Katsuwonus pelamis) around fish aggregatingdevices (FADs) in the Comoros Islands as deter-mined by ultrasonic tagging. Aquat. LivingResour., 4, 1Ð12.
CAYR� P. & J. CHABANNE. (1986). Marquage acous-tique et comportements de thons tropicaux (alba-core : Thunnus albacares et listao : Katsuwonuspelamis) au voisinage dÕun dispositif concentra-teur de poissons. Oc�anogr. Trop., 21 (2), 167Ð183.
CAYR�, P., D. LE TOUZE, D. NORUNGEE & J. WILLIAMS.(1991). Artisanal fishery of tuna around fishaggregating devices (FADs) in ComorosIslands. Preliminary estimate of FAD efficiency.In: Indo-Pacific Fishery Commission,Symposium on Artificials Reefs and FishAggregating Devices as tools for the manage-ment and Enhancement of Marine FisheryRessources, Colombo, Sri Lanka, 14Ð17 May1990, RAPA Report, 1991/11. 61Ð74
CAYR�, P. & F. MARSAC. (1993). Modelling the yel-lowfin tuna (Thunnus albacares) vertical distrib-ution using sonic tagging results and local envi-ronmental parameters. Aqu. Liv. Res., 6, 1Ð14.
CILLAUREN, E. (1994). Daily fluctuations in the pres-ence of Thunnus albacares and Katsuwonuspelamis around fish aggregating devicesanchored in Vanuatu. Oceania. Bul. Mar. Sci., 55(2-3), 581Ð591.
DAGORN, L. (1994). Le comportement des thonstropicaux mod�lis� selon les principes de la vieartificielle. PhD thesis, ENSA Rennes, 250 p.
17

SPC Fish Aggregating Device Information Bulletin #3 – March 1998
DAGORN, L., P. BACH & E. JOSSE. (1997). Modelingeffects of anchored FADs and prey distributionon horizontal and vertical movements of tunain the French Polynesia EEZ. Proceedings of the48th Annual Tuna Conference.
DEPOUTOT, C. (1987). Contribution � lÕ�tude des dis-positifs de concentration de poissons � partir delÕexp�rience polyn�sienne. ORSTOM Tahiti,Notes et Doc. Oc�anogr., 33, 170 p.
DINER, N. (1990). Syst�me INES-MOVIES : ManueldÕutilisation. Doc IFREMER Brest, 90 p.
FONTENEAU, A. (1992). P�che thoni�re et objets flot-tants : Situation mondiale et perspectives. Rec.Doc. Scient. ICCAT, 40, 459Ð472.
HOLLAND, K. N. (1996). Biological aspects of theassociation of tunas with FADs. SPC FADInformation Bulletin #2, 2Ð7.
HOLLAND, K.N., R.W. BRILL & R.K.C. CHANG. (1990a).Horizontal and vertical movements of yellowfinand bigeye tuna associated with fish aggregatingdevices. US Fish. Bull. 88-3, 493Ð507.
HOLLAND, K.N., R.W. BRILL & R.K.C. CHANG.(1990b). Horizontal and vertical movement ofPacific blue marlin captured and released usingsportfishing gear. US Fish. Bull. 88-2, 397Ð402.
HOLLAND, K.N., R.W. BRILL, R.K.C. CHANG, J. SIBERT
& D. FOURNIER. (1992). Physiological and behav-ioral thermoregulation in bigeye tuna (T. obe-sus). Nature, 358, 410Ð411.
JOHANNESSON, K.A. & R.B. MITSON. (1983). Fisheriesacoustics : A practical manual for aquatic bio-mass estimation. FAO Fish Tech. Pap., 240, 249 p.
JOSSE, E. (1992). Different ways of exploiting tunaassociated with Fish Aggregating Devicesanchored in French Polynesia. In: Internationalworkshop on the ecology and fisheries for tunasassociated with floating objects and on theassessment issues arising from the associationof tunas with floating objects. IATTC, 11Ð14February, 14 p.
JOSSE, E., P. BACH & L. DAGORN. (1997). TunaÐpreyrelationships studied by simultaeous sonic track-ings and acoustics surveys. 2nd Conference onFish Telemetry in Europe, La Rochelle, 5Ð9 April.
KLEIBER, P. & J. HAMPTON. (1994). Modeling effectsof FADs and islands on movement of skipjacktuna (Katsuwonus pelamis) : Estimating parame-ters from tagging data. Can. J. Fish. Aquat. Sci.,51, 2642Ð2653.
KLIMLEY, A.P. & C. HOLLOWAY. (1996). Automatedmonitoring of yellowfin tuna at HawaiianFADs. Proceedings of the 47th Annual TunaConference.
LEGGETT, W.C. (1977). The ecology of fish migra-tions, Ann. Rev. Ecol. Syst., Vol. 8, 285Ð308.
LEPROUX F. & A. DESURMONT. (1996). Latest type ofFAD used in French Polynesia. SPC FADInformation Bulletin #2, 13Ð15.
MARSAC, F. & P. CAYR�. (1997). Fish telemetryapplied to behaviour analysis of yellowfin tunamovements in a fish aggregating devices net-work. 2nd Conference on Fish Telemetry inEurope, La Rochelle, 5Ð9 April.
MARSAC, F., P. CAYR� & F. CONAND. (1996). Analysisof small scale movements of yellowfin tunaaround fish aggregating devices (FADs) usingsonic tagging. In: A.A. Anaganuzzi, K.A.Stobberup et N.J. Webb (Eds): Proceedings ofthe Expert Consultation on Indian Ocean Tunas,6th session, Colombo, Sri Lanka, 25Ð29September, 1995, IPTP Coll., 9.
MC KEOWN. (1984). Fish migration. Croom Helm,London & Sydney, 224 p.
MOARII, G. & F. LEPROUX. (1996). The drop-stonetechnique used by artisanal fishermen in FrenchPolynesia. SPC FAD Information Bulletin #1,16Ð18.
POSTEL, E. (1966). R�partition et abondance desthons dans lÕAtlantique tropical. In:Proceedings of the Symposium on the oceanog-raphy and fisheries resources of the tropicalAtlantic, Abidjan, Ivory Coast, 20Ð28 October1966, review papers and contributions, 109Ð138.Paris-Unesco.
SIMS, N. (1992). A cost-benefit analysis of fishaggregation devices (FADs) in the artisanal fish-eries in Rarotonga (Cook Islands). SPC Paperson Fisheries Science from the Pacific Islands, 1,7Ð10.
STRETTA, J.M., A. DELGADO DE MOLINA, J. ARIZ, G.DOMALAIN & J.C. SANTANA. (1996). Les esp�cesassoci�es aux p�ches thoni�res tropicales.Programme ORSTOM/IEO BIOECO/93/05,2�me partie; Scientific report, 58 p.
YUEN H.S.H. (1970). Behavior of skipjack tuna,Katsuwonus pelamis, as determined by trackingwith ultrasonic telemetry. J. Fish. Res. BdCanada, 27, 2071Ð2079.
18

SPC Fish Aggregating Device Information Bulletin #3 – March 1998
Effects on fishing results:number of fishermen, landings, prices and turnover
To determine the social and economic impact ofFADs in Reunion Island, as well as the ways inwhich they are used (Nguyen-Khoa, 1990 and1993), a survey form was designed during thestudy and will subsequently be used systematical-ly with the maximum number of fishers. Duringthe preliminary stages of this study, it becameapparent that, without FADs, many fishermenwould have abandoned their profession.
FADs have, therefore, played an important role inthe development of artisanal fisheries in ReunionIsland as the number of fishermen and the quanti-ties caught have increased constantly since theirintroduction.
This has, however, had some adverse effects on theReunion Island fish market. Relatively small in size(600 000 inhabitants and an annual consumption of
11 kg of fish per inhabitant, compared to 22 kg inmetropolitan France), this market mainly con-sumes bottom fish like snappers and groupers.Pelagic fish such as tuna and mahi-mahi are there-fore difficult to sell, as the market rapidly becomesoversupplied. The creation of an export trade is dif-ficult, especially as Seychellese and Mauritian arti-sanal fishermen and Reunionese longliners haveinundated the Indian Ocean and French marketswith their much lower prices.
Effect on prices
FAD fishing may, along with longliners, be partial-ly responsible, for the drop in tuna prices fromUS$ 5.5/kg 4 or even 6.5/kg in 1988 to US$ 4.5/kgor even 3.5/kg today, which is the break-even pointfor artisanal fishermen whose costs are high (use ofmotor launches 5). But it is difficult to get a moreprecise idea of their role in this drop in prices. Onthe international market, where only the competi-tion with imports has to be taken into considera-tion, the highest price for tuna is about US$ 2.9/kg.
19
The dynamics and effects of FADs in La Reunion Island by J.-P. Detolle 1, E.Tessier 2, D. Roos, F. René & J. Sacchi
1. IFREMER R�union, B.P. 60, 97822 Le Port Cedex, la R�union, France2. CRPMEM, 238 rue du Mar�chal Galli�ni, 97820 le Port, La R�union, France. E-mail: [email protected]. DETOLLE, J.P., E. TESSIER, D. ROOS, F. REN� & J. SACCHI. (1996). �tude en vue dÕoptimiser le co�t et la long�vit� des dispositifs de con-
centration de poissons de lÕ�le de La R�union, approche technico-�conomique. IFREMER/ RIDRV n¡94.14 RH/La R�union. 73 p.4. Original figures are in French Francs (FF), a conversion factor of US$ 1.00 = FF 5.50 has been used for this translated document.5. Note from the translator: in this English version, the term ÔskiffÕ means a small open motorised fishing boat and the term of
ÔlaunchÕ a bigger boat with a superstructure.
The following article has been translated from a French document entitled ÔStudy designed to optimise the costs andlifespans of fish aggregating devices in Reunion Island: A technical and economic approachÕ 3. This sudy was preparedby the main author to pass a DESS G�nie et Gestion de lÕEnvironnement (Higher Tertiary studies in EnvironmentEngineering and Management), at the University of Paris VII. In the following extract, the authors study the effectsof FADs on the artisanal fisheries of La Reunion.
SPC Fish Aggregating Device Information Bulletin #3 – March 1998
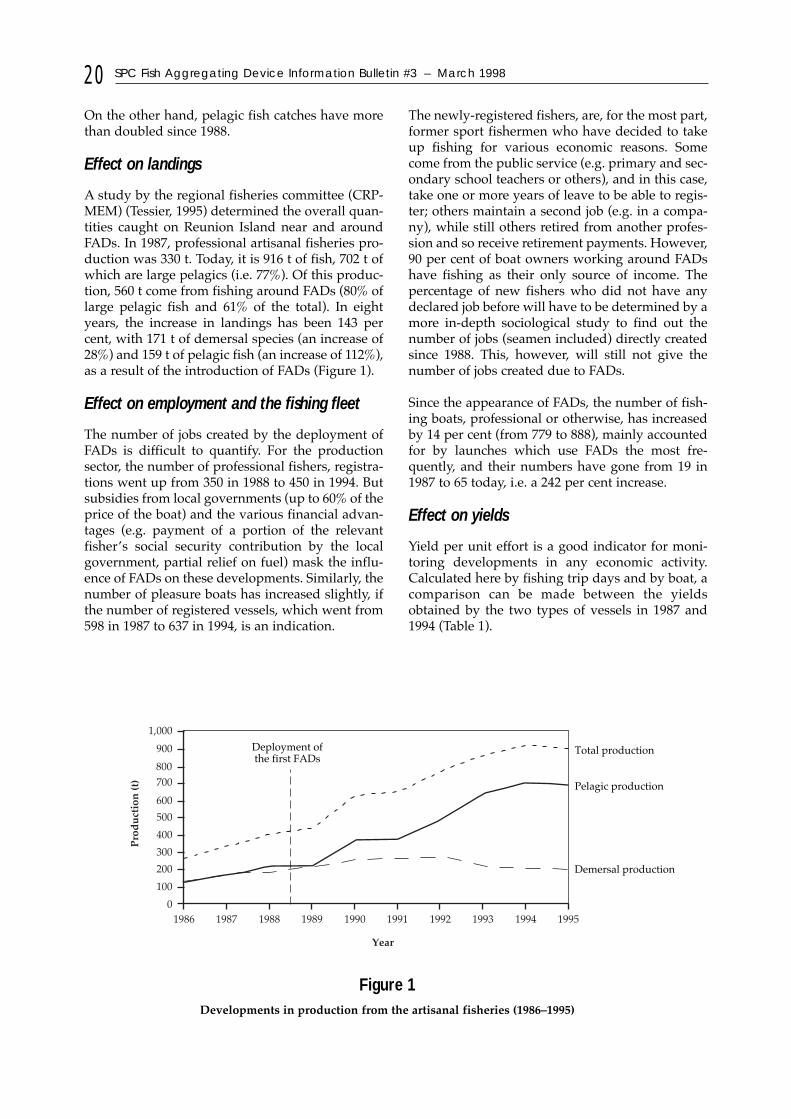
On the other hand, pelagic fish catches have morethan doubled since 1988.
Effect on landings
A study by the regional fisheries committee (CRP-MEM) (Tessier, 1995) determined the overall quan-tities caught on Reunion Island near and aroundFADs. In 1987, professional artisanal fisheries pro-duction was 330 t. Today, it is 916 t of fish, 702 t ofwhich are large pelagics (i.e. 77%). Of this produc-tion, 560 t come from fishing around FADs (80% oflarge pelagic fish and 61% of the total). In eightyears, the increase in landings has been 143 percent, with 171 t of demersal species (an increase of28%) and 159 t of pelagic fish (an increase of 112%),as a result of the introduction of FADs (Figure 1).
Effect on employment and the fishing fleet
The number of jobs created by the deployment ofFADs is difficult to quantify. For the productionsector, the number of professional fishers, registra-tions went up from 350 in 1988 to 450 in 1994. Butsubsidies from local governments (up to 60% of theprice of the boat) and the various financial advan-tages (e.g. payment of a portion of the relevantfisherÕs social security contribution by the localgovernment, partial relief on fuel) mask the influ-ence of FADs on these developments. Similarly, thenumber of pleasure boats has increased slightly, ifthe number of registered vessels, which went from598 in 1987 to 637 in 1994, is an indication.
The newly-registered fishers, are, for the most part,former sport fishermen who have decided to takeup fishing for various economic reasons. Somecome from the public service (e.g. primary and sec-ondary school teachers or others), and in this case,take one or more years of leave to be able to regis-ter; others maintain a second job (e.g. in a compa-ny), while still others retired from another profes-sion and so receive retirement payments. However,90 per cent of boat owners working around FADshave fishing as their only source of income. Thepercentage of new fishers who did not have anydeclared job before will have to be determined by amore in-depth sociological study to find out thenumber of jobs (seamen included) directly createdsince 1988. This, however, will still not give thenumber of jobs created due to FADs.
Since the appearance of FADs, the number of fish-ing boats, professional or otherwise, has increasedby 14 per cent (from 779 to 888), mainly accountedfor by launches which use FADs the most fre-quently, and their numbers have gone from 19 in1987 to 65 today, i.e. a 242 per cent increase.
Effect on yields
Yield per unit effort is a good indicator for moni-toring developments in any economic activity.Calculated here by fishing trip days and by boat, acomparison can be made between the yieldsobtained by the two types of vessels in 1987 and1994 (Table 1).
20
1,000
900
800700
600
500
400
300
200
100
01986 1987 1988 1989 1990 1991 1992 1993 1994 1995
Pro
du
ctio
n (t
)
Year
Deployment ofthe first FADs
Total production
Pelagic production
Demersal production
Figure 1Developments in production from the artisanal fisheries (1986Ð1995)

SPC Fish Aggregating Device Information Bulletin #3 – March 1998
Yields have therefore clearly increased, especiallyfor launches which are the principal users of FADsand which catch 90 per cent of their productionthere. It would seem that FADs have played a vitalrole in the development of both production andthe fleet.
The number of fishing trips annually, especially asweather conditions are the same for both types ofboats, have, on the other hand, remained fairlyconstant, for both categories of boat (Table 1).
Effect on turnover
Bearing in mind that the average price of fish perkilo for pelagic species went from US$ 5.20 in 1987to US$ 4.00 in 1994 (a drop of 21.4%) and from US$12.8 to US$ 11.8 during the same period for demer-sal species (decrease of 7.6%), the turnover forskiffs has been subject to a negligible decrease of1 per cent, while for launches, it has increased31 per cent. Table 2 shows this evolution, assumingthat demersal landings have remained constant, as
21Table 1: Comparison of average daily yields during the second quarters of 1987 and 1992 for skiffs and
launches (according to E. Tessier, 1995)
Table 2: Changes in production and turnover for launch and skiffs between the second quarters of 1987 and 1994
Average daily yields Ê Average numberof fishing-trip days
Skiffs Launches Skiffs Launches
Second quarter 1987 18 kg 50kg 23 days 28 days
Second quarter 1994 21 kg 85 kg 24 days 29 days
Second quarter 1987 Second quarter 1994
Yield/boat (kg) Yield/boat (kg) Change %
Pelagic species/skiff 60 150 +150.0
Demersal species/skiff 354 354 0.0
Total/skiff 414 504 +21.0
Pelagic species/launch 1 153 2 218 +92.0
Demersal species/launch 247 247 0.0
Total/launch 1 400 2 465 +76.0
Turnover/boat (US$) Turnover/boat (US$) Change (%)
Pelagic species/skiff 311 611 +96.0
Demersal species/skiff 4 538 4 190 Ð7.6
Total/skiff 4 849 4 801 Ð1.0
Pelagic species/launch 5 975 9 033 +51.0
Demersal species/launch 3 166 2 924 Ð7.6
Total/launch 9 141 11 957 +31.0

SPC Fish Aggregating Device Information Bulletin #3 – March 1998
the distinction between skiffs and launches was notmade in the 1987 statistics.
For those skiffs which fish for both pelagic and bot-tom-dwelling fish, FADs did not have much effect.The mooring of FADs allowed launches to increasetheir turnover by 31 per cent, in spite of an increasein costs.
Effect on costs
Fuel
FAD fishing techniques (drift methods and longlin-ing) generally use less fuel (about 3 times less) thantraditional trolling, as less engine power is used.Since there is less search time, the effective fishingtime is, in principle, increased (5 out of 10 hoursper day instead of 2 hours as before) and theamount of fuel used per trip is consequently lower.However, the practise of visiting several FADs aday (up to 7), has limited these effects.
For the record, it should be noted that the prices ofhigh octane petrol and diesel are respectively onlyUS$ 0.42 and US$ 0.33/l for fishermen, due to thetax incentives they benefit from; the cost incurredis therefore negligible. It can consequently be esti-mated that consumption has been reduced by30 per cent for launches and by an insignificantamount for skiffs.
Investments
FADs have, in contrast produced extra costs linkedto investment in bigger boats. At the beginning, thisinvolved tourist launches, but a few years ago,medium-sized boats of local manufacture appearedwhich had lower operating costs and were moresuitable for fishing around FADs than launches.
Registration as a fisher
For professional fishers, this covers both healthinsurance and retirement scheme contributions.These costs are very high for professional fishersand do not exist at all for sport fishers. They haveincreased slightly since 1988, but without any con-
nection to the implementation of FADs. In ReunionIsland, fishers have the choice of either paying fullcontributions or half-payments to limit costs, there-by decreasing their number of retirement points.
Social Security payments
Skiff fishers are registered between the third andfifth category. Half-payments are:
¥ US$ 2145 for a skipper in the third category,¥ US$ 2273 for a seaman in the third category,¥ US$ 2545 for a skipper in the fifth category,¥ US$ 2673 for a seaman in the fifth category.
Fishers in launches are in the sixth category andseamen in the third. Their half-payments are:
¥ US$ 2545 for a skipper,¥ US$ 2768 for a seaman.
This covers 360 days of professional activityannually.
The total annual fees for a skiff fisher are on aver-age between US$ 1636 and US$ 10 000 for one andup to US$ 16 364 for two. For a launch fisher, feesare between US$ 3636 and US$ 36 363. These feesinclude maritime social security (ENIM), familyallowance payments, maintenance, insurance,fishing gear and financial costs. In fact, theincreases in fees due to FADs were only felt bythose skiff fishers who decided to invest in alaunch. Except for such cases, costs haveremained unchanged overall for skiff fishers. Forlaunch fishers, it can be estimated that there was adrop in fuel consumption due to FADs of 20 to30 per cent, which is a very negligible sum if youtake into account the low cost of fuel in overalloperating costs.
Effect on profits,or gross operating surplus (GES)
Gross operating surplus = turnover Ð costs
To calculate profits per quarter shown in Table 3,average costs have been estimated at US$ 9090 per
year for a skiff andUS$ 21 820 per year for alaunch.
Skiffs, which had beenmore profitable beforeFADs due to limited costs,are today far behindlaunches in this area, aslaunches can make up forhigher costs by muchhigher yields near FADs.
22
Profit/boat (US$) Change
2nd quarter 1987 2nd quarter 1994
Skiff 2 582 2 527 -2%
Launch 1 818 4 673 +157%
Table 3: Changes in profits from 1987 and 1994 for skiffs and launches

SPC Fish Aggregating Device Information Bulletin #3 – March 1998
Other effects: sociological, big game fishing,environment (protection of bottom-fishresources) . . .
Another adverse effect of FADs is that pelagicspecies are not necessarily more abundant in thearea where the FAD is located. They do howevergather around the devices and are thus moreaccessible to fishers. One of the consequences is adecrease in catches in areas located away from theFADs. While around FADs, the most commonfishing technique is drift fishing, in areas awayfrom the devices, the only possible technique istrolling. This has resulted in a decrease in thisactivity which is mainly used by sport fishermen(big game fishing), even if only in order to avoidclients becoming seasick as drift line fishing isvery difficult to support. Sport fishing, whichused to be a feature of Reunion Island, is now los-ing some of its attractiveness for enthusiasts.FADs could therefore have a negative effects onthe islandÕs tourism industry.
Beside increases in pelagic species catches, one ofthe reasons for mooring FADs was to relieve bot-tom-dwelling resources from the excess pressureexercised by traditional coastal fisheries. This goalhas only been partially achieved. Due to lowerinvestments, and assured sales, older, more-tradi-tional fishers have remained faithful to bottomfishing. Younger fishermen have, for their part,been attracted by the possibilities of profit offeredby fishing around FADs. In fact, although tuna wassold for US$ 6.40/kg instead of the US$ 18.20/kg
paid for bottom fish, the fact that the tuna couldweigh up to 80 kg gave them hopes of high earn-ings more rapidly. Unfortunately, as the price oftuna has now dropped to less than US$ 4.5/kg, dueto sales difficulties, this fishery is today attractingfewer new fishers.
Exploitation of bottom resources has thus not beenreduced by the introduction of FADs. The numberof fishers living off these resources has simply sta-bilised while the number of fishers targeting pelag-ic resources has greatly increased. Young fishersare increasingly turning towards diversified activi-ties while trying to reconcile the high yieldprospects offered by FADs and the high prices forbottom fish, crustaceans and molluscs.
References
NGUYEN-KHOA, S. (1990). Impact socio-�conomiquedes DCP sur la p�che artisanale des poti-marara de lÕ�le de Tahiti. M�moire dÕing�nieuren Agronomie halieutique, ENSAR. 137 p.
NGUYEN-KHOA, S. (1993). Efficience et impacthalieutique, �conomique et social des DCPdans les soci�t�s insulaires Ñ lÕexp�rience duVanuatu. Rapport scientifique ORSTOM. 137 p.
TESSIER, E. (1995). �laboration dÕun suivi des statis-tiques de p�che pour La R�union. Doc. Ass.Thon. CAN R�union. IFREMER La R�union.27 p. + appendices.
23
Positive impacts
¥ Increase in fishermenÕs turnover and in total landings
¥ Development and modernisation of the fishing fleet
¥ Development of local boat-building
¥ Improvement of work conditions and safety
¥ Possible creation of jobs (non quantifiable)
¥ Decrease in search time and fuel use
¥ Stabilisation of bottom resources exploitation
¥ Increase in the number of days covered bysocial welfare for fishermen
Negative impacts
¥ Drop in the price of fish
¥ Negative impact on tourism i.e. big gamefishing
¥ High costs for local governments
¥ Possible conflicts between pleasure boatsand professional fishermen
¥ Risk-taking by skiff fishermen who ventureto distant FADs
Social and economic impacts of FADs

SPC Fish Aggregating Device Information Bulletin #3 – March 1998
Definition and description
Fish aggregating devices (FADs) are used to gatherlarge pelagic species, particularly tuna.
Fish generally congregate at nightfall, graduallyleaving the FAD after daybreak.
So, nightfall and daybreak are the best times forfishing. Tuna eat about 5 per cent of their bodyweight each dayÑjuveniles even moreÑrequiringthem to spend the day hunting within a radius of10 to 20 miles from the FAD.
The floating parts of FADs are generally made ofbamboo, drums, arrays of trawl floats, other metalor plastic buoyancy components in variousshapesÑin short, anything which can float andsupport the appendages attached to the first50 metres of line below the surface.
Two types of FADs are used:
¥ fixed FADs anchored to the bottom whichbecome regular fishing sites, and
¥ drifting FADs, natural or artificial, which areused particularly for industrial purse-seinefishing 3.
Background
It is generally acknowledged that anchored FADsoriginated in the Mediterranean region, where theywere first recorded in Malta during the 17th century.
They have always been used in traditional fishingin Tunisia during the tuna season.
The systematic use of FADs started in the early20th century in Indonesia and the PhilippineIslands.
They spread through the Pacific in the 1970s andfirst appeared in the Indian Ocean through FAOand European Union projects early in the 1980s.
The Western Indian Ocean experience
Array FADs (string of pressure-resistant buoys)
The use of arrays of trawl buoys for the floating sec-tions of FADs was first developed in the IndianOcean. This system allows the top part of the FAD tobe deeply submerged (Ð600 m) without sufferingdamage due to water pressure. This is their princi-pal advantage, as they require reduced buoyancy ofonly 250 to 300 l, compared to double or triple thisbuoyancy for FADs which must stay on the surface.
Consequently, there is much less tension on themooring and these FADs last for an amazingly longtime, on average more than two years, excludingboat accidents and vandalism.
In Mauritius, FADs of this kind lasted for over fouryears, but their reduced buoyancy (150 l) causedthem to disappear under water for six months eachyear, clearly hindering fishing. A satisfactory com-promise had to be found.
24
FADs – The Western Indian Ocean experienceby Michel de San 1 & Alain Pages 2
1. ex Coordinator of the Tuna Association; technical assistant to the division of marine resources of Madagascar. E-mail: [email protected]
2. Fisheries technologist3. This fishing technique is so advanced that floating FADs are fitted with echo-sounders coupled to emitting buoys which can be
contacted by radio at distances of up to 200 nm to receive by fax four surveys a minute giving quite a precise idea of the quanti-ty and species of tuna attracted. The most important issue is not to allow this relatively costly device to be ÔborrowedÕ by col-leagues. In the Indian Ocean, nearly 60 per cent of European fleetsÕ catches come from drifting FADs, amounting to some 120,000 tof surface tuna annually.

SPC Fish Aggregating Device Information Bulletin #3 – March 1998
Technical aspects
Figure 1 (on page 27) shows the FAD commonlyused in the Indian Ocean. The following remarksand design details concerning these FADs areinteresting:
¥ In areas where there is a possibility of theft orconflict between fishermen, the array is thread-ed onto a 35 m long steel cable sheathed in aplastic tubing.
¥ The regionÕs technicians have decided to elimi-nate shackles wherever possible and to replacethem with a direct thimble-swivel connection.
¥ In La Reunion, the use of stainless steel for theshackles, thimbles and swivels is experimented.However, care must be taken not to mix differ-ent types of metal due to very rapid electrolysis(about one month). This solution is feasible onthe upper part of the FAD (if there is no cable)but must be avoided on the lower sectionwhere, very often, engine blocks or concreteblocks with normal steel ring are used.
¥ Nylon rope is used on the upper part of FADs(Å 20% of depth) due to its negative buoyancywhich keeps it from floating to the surfacewhere it would be likely to be cut. Also, the endof the mooring lead is made of polypropyleneso that its positive buoyancy keeps it from drag-ging on the bottom.
¥ The net weight of the mooring, not countingchain, is estimated at 700 kg.
¥ The total length of the mooring lead is approxi-mately 20 per cent more than the depth.
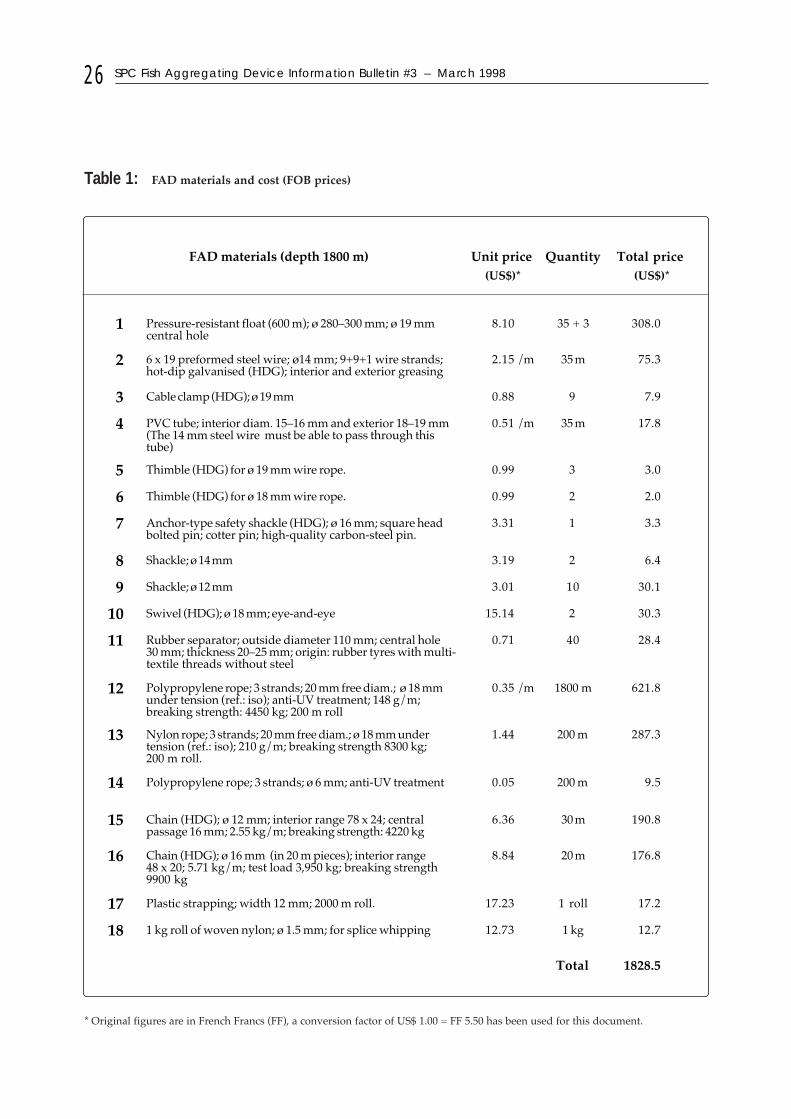
Costs
Table 1 (on page 26) shows the cost of the materialsneeded for a FAD and their technical specifications.
Shallow-water FADs in the Indian Ocean
Shallow-water FADs appeared in the Comorosaround the island of Anjouan as a result of theRegional Tuna Project of the Indian OceanCommission funded by the European Community.These FADs are moored in 200 to 600 metres ofwater at the edge or beginning of the continentalslope.
By combining the Reunionese deep-sea fishing(200 to 400 m) technique using live bait (see SPCFAD Bulletin #2), and the traditional Comoriandrop-stone technique using ÔchumÕ (minced fish),real success has been obtained with these shallow
FADs, leading to catches of large yellowfin andalbacore tunas weighing 10 to 80 kg.
Their success is also due to the short distances to becovered for non-motorised fishermen to reach them.
Rigging is similar to that of deep-water FADs, butonly 10 to 15 buoys, a single 12 mm chain mooringand 250 to 300 kg of ballast are used.
Location and mooring methods
It is important to remember that the FADs are bestplaced in areas where there is the combination oftuna, fishermen and marketing opportunities.
FADs aggregate all tuna present within a radius of10 to 20 nm for the night.
Until recent years, it was thought that FADs shouldbe moored 2Ð3 nm from the edge of the continentalslope at a depth of 1000 to 2000 m. But experiencein the Comoros with shallow-water FADs opens upother possibilities.
The commonly accepted minimum distance be-tween two FADs is 6 to 7 nm.
In this region, we rarely have deep echo-soundersavailable and when we do, they are not often inworking order. Once the site and location havebeen found by GPS, deployment is carried outusing an extra 800 to 1000 m of rope which is laterremoved. Beginners should know that first thefloating part is released, then the mooring line andonly when well positioned, the anchor. Proceedingin any other order carries a risk of damage to com-ponents and crew.
It is difficult to predict how profitable a FAD willbe. There must therefore be a reliable system tomonitor catches and visits by fishers to determinethe most effective spots to re-anchor FADs after theoriginal ones have been lost. In this way after a fewyears of trial and error, an effective and well-posi-tioned FAD system can be established.
Of the 10 FADs moored at new sites, two are verygood, three or four are average and the rest are notworth being replaced once they are lost.
Fishing techniques around FADs
The fishing techniques used around FADs in theWestern Indian Ocean are artisanal in nature. Theyare used by boats ranging from traditional paddleor sailing canoes to small dory-type boats with out-board motors, and small 10 m fishing boats. Threetypes of technique are used for fishing aroundFADs: trolling, drift fishing and fixed gear.
25
SPC Fish Aggregating Device Information Bulletin #3 – March 199826
FAD materials (depth 1800 m) Unit price Quantity Total price (US$)* (US$)*
Pressure-resistant float (600 m); ¿ 280Ð300 mm; ¿ 19 mmcentral hole
8.10 35 + 3 308.0
6 x 19 preformed steel wire; ¿14 mm; 9+9+1 wire strands;hot-dip galvanised (HDG); interior and exterior greasing
2.15 /m 35 m 75.3
Cable clamp (HDG); ¿ 19 mm 0.88 9 7.9
PVC tube; interior diam. 15Ð16 mm and exterior 18Ð19 mm(The 14 mm steel wire must be able to pass through thistube)
0.51 /m 35 m 17.8
Thimble (HDG) for ¿ 19 mm wire rope. 0.99 3 3.0
Thimble (HDG) for ¿ 18 mm wire rope. 0.99 2 2.0
Anchor-type safety shackle (HDG); ¿ 16 mm; square headbolted pin; cotter pin; high-quality carbon-steel pin.
3.31 1 3.3
Shackle; ¿ 14 mm 3.19 2 6.4
Shackle; ¿ 12 mm 3.01 10 30.1
Swivel (HDG); ¿ 18 mm; eye-and-eye 15.14 2 30.3
Rubber separator; outside diameter 110 mm; central hole30 mm; thickness 20Ð25 mm; origin: rubber tyres with multi-textile threads without steel
0.71 40 28.4
Polypropylene rope; 3 strands; 20 mm free diam.; ¿ 18 mmunder tension (ref.: iso); anti-UV treatment; 148 g/m;breaking strength: 4450 kg; 200 m roll
0.35 /m 1800 m 621.8
Nylon rope; 3 strands; 20 mm free diam.; ¿ 18 mm undertension (ref.: iso); 210 g/m; breaking strength 8300 kg;200 m roll.
1.44 200 m 287.3
Polypropylene rope; 3 strands; ¿ 6 mm; anti-UV treatment 0.05 200 m 9.5
Chain (HDG); ¿ 12 mm; interior range 78 x 24; centralpassage 16 mm; 2.55 kg/m; breaking strength: 4220 kg
6.36 30 m 190.8
Chain (HDG); ¿ 16 mm (in 20 m pieces); interior range48 x 20; 5.71 kg/m; test load 3,950 kg; breaking strength9900 kg
8.84 20 m 176.8
Plastic strapping; width 12 mm; 2000 m roll. 17.23 1 roll 17.2
1 kg roll of woven nylon; ¿ 1.5 mm; for splice whipping 12.73 1 kg 12.7
Total 1828.5
Table 1: FAD materials and cost (FOB prices)
* Original figures are in French Francs (FF), a conversion factor of US$ 1.00 = FF 5.50 has been used for this document.
1
2
3
4
5
6
7
8
9
10
11
12
13
14
15
16
17
18

SPC Fish Aggregating Device Information Bulletin #3 – March 1998 27
35 pressure-resist. floats (¿ 300 mm)
Cable clamps (¿ 19 mm)
Rubber separator between each float(20Ð25 mm thick)
Cable clamps (¿ 19 mm)
Wire cable (¿ 14 mm)
PVC tube (inside ¿ 16 mm)
Thimble (¿ 18 mm)
Thimbles (¿ 18 mm)
Swivel (¿ 19 mm)
Thimble (¿ 19 mm)
Thimble (¿ 19 mm)
Swivel (¿ 19 mm)
Safety shackle (¿ 16 mm)
20 m of chain (¿ 16 mm)
2 shackles (¿ 14 mm)
15 m of chain (¿ 12 mm)15 m of chain (¿ 12 mm)
Engine or cement blocks attached to the chain by ¿ 12 mm shackles
Nylon rope (¿ 20 mm, 3 strands)(length = 20% of depth)
Appendages made of plasticstrapping (12 mm width)
NylonÐpolypro. splice
Polypropylene rope (¿ 20 mm, 3 strands)(length = depth)
Figure 1Commonly-used Indian Ocean FAD

SPC Fish Aggregating Device Information Bulletin #3 – March 1998
These techniques vary depending on the means andthe stage of development of artisanal fisheries in thecountries concerned. The recent development ofnight fishing (La Reunion and Comoros) can benoted; its results are quite encouraging using thesame techniques as are used in the daytime.
Trolling
Rapid lure trolling
We will not go into rapid trolling as it concernssport fishing and is a very heavy fuel-user.
Slow lure trolling
The slow trolling technique involves trailing aplastic squid-type lure at a distance of 100 m whilegiving it lifelike movements by pulling and releas-ing the line. This type of fishing can also be donewith dead bait (e.g. squid or scad). The lines usedare 90Ð140/100 monofilament lines.
Slow trolling with live bait
Slow trolling with live bait is very effective withpredators like tuna and dolphinfish (mahi-mahi).The most spectacular form is sportfishing for mar-lin with live bait 5 to 10 kg in weight.
Drift fishing (handline)
Drift fishing with dead or live bait
Drift fishing takes place up-current from the FAD.One or more lines baited with pieces of fish, squidor live bait are allowed to drift in the current. Thistechnique makes it possible to target deep-watertuna (yellowfin or albacore), which are often largerin size than those caught at the surface.
Drop-stone with chum fishing technique (Comoros) 2
This unusual technique involves dropping the baitto the desired depth (100 to 200 m) using twostones, between which is held some chum (mincedfish) and the baited hook.
When the bait reaches the desired depth, a quickjerk on the line frees the rocks which are attachedto the line by a loop and a quick-release knot.
The stones drop to the bottom while the baitedhook emerges in the middle of a cloud of mincedfish which attracts tuna and whets their appetites.
Fixed gear
Horizontal drifting longlines or mini-longlines (see Figure 2)
Vertical tuna longlines (see Figure 3)
Fishing for, storing and using live bait
Live-bait fishing
This is essentially done at night using a lamparoÑoften a gas or petrol lamp or sometimes even a sim-ple petrol torch. The live bait are caught withmulti-rig type line to which are attached small flu-orescent octopuses or multicoloured silver woolflies. The diameter of the line rarely exceeds30/100.
Storing live bait
After being caught and carefully removed from thehook, (as wounded live bait die very quickly) thelive bait is placed in a tank of water (at least100 litres), in which the water circulates or ischanged by bucket. In the Comoros, a woven basketattached to the outside edge of the canoe is oftenused. Bait can be stored several days in a fishtrap.
Use of live bait
The live bait is taken from the tank with a scoopnet. It is generally hooked through the nostrils andonly rarely in the back (above the lateral line). Theforward position of the hook will help it to swimduring slow trolling. The hooks used are alwaysrelative to the size of the live bait and must be verysharp and strong.
It is possible, after positioning the boat up-currentfrom the FAD, to scatter a few baitfish as far as pos-sible from the boat; they will try to swim back tothe boat as quickly as possible for safety and attractpredators, particularly dolphinfish (mahi-mahi).
Artisanal pole-and-line fishing around FADs
Artisanal pole-and-line fishing has been attemptedwithout success by a Maldivian crew in Anjouan,Comoros. This activity involves two techniques:live-bait fishing and pole-and-line fishing.Traditionally, Maldivians fish for bait in the coralheads at daybreak. Sticks and divers are used toherd the fish into nets set by a coral head. The baitfor the day is kept on-board in a tank and fishing isa daytime activity.
28
2. Note from the editor: a very similar technique used in French Polynesia was described in details in the SPC FAD Bulletin #1.

SPC Fish Aggregating Device Information Bulletin #3 – March 1998
In the Comoros, which are volcanic islands withfew coral heads, very few of these fish werefound. Fishermen turned without much success tolamparo night fishing. The bait was stored infloating cages.
As for pole-and-line fishing itself, even when theproblem of bait had been partially resolved, it didnot have any success during our two-month stay inthe Comoros. Consequently, given the need toteach the fishermen three techniques, i.e. bait cap-ture, bait storage and pole-and-line fishing, andespecially given the small size of catches, wedecided to cut the experiment short.
An identical operation was carried out withoutsuccess by the FAO in Zanzibar in 1970. In contrast,in Western Samoa, a similar operation was success-fully carried out using bait raised by aquaculture(tilapia and mullet).
Fishermen’s involvement
One constant worry for fishery officers is maintain-ing the FAD networks and getting users to takeresponsibility for them. To date, only partial suc-cess has been achieved. Very often, the equipmentremains the responsibility of the government withdonor support. Fishermen sometimes take part inanchoring the devices and very often they partici-pate in their up-keep. In Anjouan, in the Comoros,a set of 30 shallow-water FADs has been made theresponsibility of village chiefs and fishermen at10 different sites. They are responsible for main-taining and replacing the devices off their villages.
For deep-water FADs, the government and projectsmost frequently assume this role. In La Reunion,fisheries organisations, in collaboration with themarine school, are responsible for the FAD network.In Mauritius, all the work is carried out by the gov-ernment. In the Philippines, FADs maintenance is,in some cases, carried out by the private sector.Private operators inform fishing companies of theexistence of tunas around one or more of theseFADs, and in return, are paid a catch-related fee.
In the area of artisanal fisheries, fishermen must beeducated and gradually obliged to organise them-selves at the very beginning of the design of a FADprogramme and become independent as far asequipment, mooring and maintenance of theirFADs are concerned.
Conclusion
The setting-up of a FAD network is a real revolutionfor artisanal and sport fishing. Beginning a FADoperation and making it sustainable for fishermenrequires regular activity over a period of severalyears, a major stock of equipment, and often out-side expertise for construction, deployment, main-tenance and operating methods. The social and eco-nomic context and future marketing problems mustbe taken into consideration. Neither must conflictsbetween fishermen and different fisheries beneglected. But there is a strong possibility that theresults will exceed your expectations.
29
Pressure-resistant 10 lbuoy and flag
180Ð200/100monofilament mainline,
400Ð550 m long
No. 3 snap + swivel
No. 3 snap + swivel
No. 1 snap + swivel
180Ð200/100monofilament line,
300 m long
5 l buoy
Heavy 400 lbswivels
Heavy 400 lb swivels
No. 1 snap+ swivel
140Ð160/100 mono. snood,15Ð20 m long
3Ð5/0 tuna-circle hookVMC 9729PS
or Mustad 6791
Figure 2Horizontal drifting longline
Figure 3Vertical drifting longline
140Ð160/100mono. snood15Ð20 m long
4Ð6/0 tuna hook
1Ð2 kg lead

SPC Fish Aggregating Device Information Bulletin #3 – March 1998
In Martinique, the first fish aggregrating devices(FADs) were deployed off the Atlantic coast in 1983(Sacchi & Lagin, 1983). These heavyweight devicescomprised a large floating component in order toprovide as much shade as possible under the FAD.At that time, shade was often referred to as one ofmain aggregating factors for large pelagic species.These initial trials rapidly demonstrated the use-fulness of such devices for small-scale local fishingand were naturally followed by other deploy-ments. Between June 1983 and February 1997,53 FADs were set around Martinique by IFREMER(French Institute of Research for OceanDevelopment) as part as of various research pro-grammes. Over this period, the experienceacquired in Martinique and other tropical regionsestablished certain rigging principles, therebyimproving FAD performance. In spite of theprogress made, however, losses are still too fre-quent. Technological research on FADs was there-fore included in IFREMERÕs programme on largepelagic species around Martinique (1995Ð1997).Two research topics have been selected:
¥ modelling FAD behaviour under the influenceof currents, and
¥ identifying the devicesÕ weak points.
Theoretical modelling work was supplemented bya series of measurements carried out at the IFRE-MER test site in Boulogne-sur-mer. These experi-ments made it possible to study the drag coeffi-cients of the various types of FAD raft currently inuse (e.g. single floating part, string of buoys). Inorder to facilitate the use of the model, a more user-friendly computer interface on Windows will bedesigned during the second phase of the study, tobegin in early 1998.
To increase the lifespan of these devices is one of thecommon goals of all fisheries development teams
responsible for building, deploying and maintain-ing a group of FADs. A choice must first be madeamong the three major types of devices dependingon the buoyancy required: heavyweight FADs(more than 300 l), medium-weight FADs (between150 and 300 l), and light-weight FADs (less than150 l). All the components of the device will bedetermined by this initial choice: e.g. the weight ofballast, the breaking strength of ropes, chains, andconnecting pieces, the amount of appendages.
Without any clearly-established correlationbetween the size of the device and that of its asso-ciated aggregations of fish, it can be assumed thatthe choice of the type of FAD is entirely guided bya concern for a long lifespan. A comparison of twotypes of devices as different as the ÔNiraiÕ ofOkinawa (Kakuma, 1997), which costs a milliondollars, and the ultra-light FADs of Guadeloupeanfishermen, which consist of 6 mm rope and someempty detergent containers, costing about3000 French Francs (Å US$ 550), well illustrates therange of technical options available for probablycomparable aggregating effects.
The cost of a group of FADs and their maintenancedepends on:
¥ the type of FAD,
¥ the materials chosen (e.g. the choice betweendifferent qualities of rope or buoys, orbetween stainless and galvanised steel forconnecting pieces, can make the cost vary byup to a factor of 10), and
¥ the devices lifespan.
It is therefore very important to identify accuratelyweaknesses and the consequences of the failure ofany one component on the survival of the device(Detolle et al., 1996).
30
Recovering FADs lost at a depth of 2000 mby Marc Taquet 1, Paul Gervain 2 & Alain Lagin 1
1. IFREMER (French Institute of Research for Ocean Development), Laboratoire de ressources halieutiques (Fisheries ResourcesLaboratory), Pointe Fort, 97231 Le Robert, Martinique (France). Marc TaquetÕs e-mail: [email protected]
2. POLKA, Navire oc�anographique et travaux maritimes, Rivi�re-sens, 97100 Basse-Terre, Guadeloupe (France)

SPC Fish Aggregating Device Information Bulletin #3 – March 1998
Martinican managers preference quickly turnedtowards lightweight devices (Figure 1). TheRegional Marine Fisheries Committee manages agroup of about 20 devices for professional fisher-men. This programme, designed to assist fisheriesdevelopment, is funded by the Martinique Regional
Council. These devices have generally given verysatisfactory results. Their use by professional fish-ermen, particularly off the Caribbean coast, isincreasing. Very large aggregations of certainspecies, like blackfin tuna (Thunnus atlanticus), arefrequently observed during the fisheries cruises
31
IFREMER
Flotteurs 4 litres trou central (800m)
thimbleswivelshacklethimble
ø 12 mm, galvanised
Polypropylene rope, ø12 mm (length = depth)
Cement blocks (2 x 150 kg)
Nylon rope ø 12mm (length = 20% of depth)
Nylon rope, ø 12 mm
Pressure float4 litres, 800 m resist.
Inflatablebuoy50 litres
lightradar reflector
flag
Aggregator(canvas cover)
Figure 1Design of the Martinican FAD
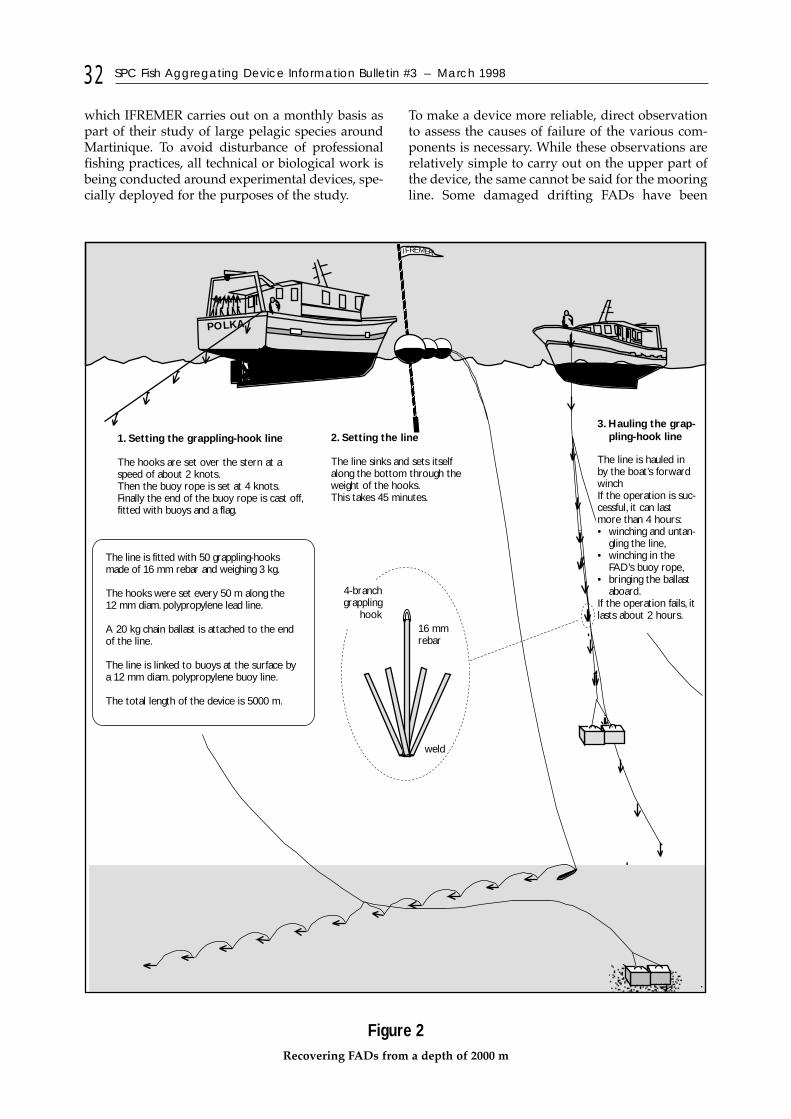
SPC Fish Aggregating Device Information Bulletin #3 – March 1998
which IFREMER carries out on a monthly basis aspart of their study of large pelagic species aroundMartinique. To avoid disturbance of professionalfishing practices, all technical or biological work isbeing conducted around experimental devices, spe-cially deployed for the purposes of the study.
To make a device more reliable, direct observationto assess the causes of failure of the various com-ponents is necessary. While these observations arerelatively simple to carry out on the upper part ofthe device, the same cannot be said for the mooringline. Some damaged drifting FADs have been
32
I FREMER
POLKA
1. Setting the grappling-hook line
The hooks are set over the stern at aspeed of about 2 knots.Then the buoy rope is set at 4 knots.Finally the end of the buoy rope is cast off,fitted with buoys and a flag.
The line is fitted with 50 grappling-hooksmade of 16 mm rebar and weighing 3 kg.
The hooks were set every 50 m along the12 mm diam. polypropylene lead line.
A 20 kg chain ballast is attached to the endof the line.
The line is linked to buoys at the surface bya 12 mm diam. polypropylene buoy line.
The total length of the device is 5000 m.
2. Setting the line
The line sinks and sets itselfalong the bottom through theweight of the hooks.This takes 45 minutes.
3. Hauling the grap-pling-hook line
The line is hauled inby the boat’s forwardwinchIf the operation is suc-cessful, it can lastmore than 4 hours:• winching and untan-
gling the line,• winching in the
FAD’s buoy rope,• bringing the ballast
aboard.If the operation fails, itlasts about 2 hours.
4-branchgrappling
hook
weld
16 mmrebar
Figure 2Recovering FADs from a depth of 2000 m

SPC Fish Aggregating Device Information Bulletin #3 – March 1998
found by fishermen, in these cases, inspection ofthe recovered part is of particular interest. In mostcases, the cause of failure can be identified. AroundMartinique, these recoveries have confirmed thetheory that accidental loss due to boats and wireleaders is common. Problems due to the use of cer-tain materials or to design faults have been identi-fied and corrected. Unfortunately, many devicesare never found again and so doubt persists on thelocation and cause of failure.
The theory that most FAD losses are accidental nat-urally implies that mooring line failures eitheroccur very close to the raft (when caused by boats)or in the upper 200 m (when caused by fishinglines). The parts of the FAD which remain on sta-tion after failure deserve attention for two reasons:i.e. identification of the causes of loss and observa-tion of the state of wear and tear of the deep-waterparts. Encouraged by the results obtained by thePolka during the recovery of lines of fishing trapslost at a depth of 500 m last May, we initiated acampaign to recover lost FADs.
The tool used was a line of grappling hooks 5000 mlong (Fig. 2). At the depth at which the grapplinghooks must work, it is not possible to drag the gear,because the movement of the boat would raise the
grappling hooks instead of dragging them alongthe bottom. Also, the power required to drag thegear would make it very difficult to be surewhether or not the line had hooked the FAD. Therewould be a risk of not hooking the device if thegrappling hooks slipped over the rope and a risk ofbreakage if the hooks did catch. The techniqueselected was to lay the line on the seafloor at thepresumed location of the FADÕs mooring line, thento slowly haul in the line using a winch. A stabili-sation period of 45 minutes is allowed between set-ting and hauling to be sure that all the hooks havesettled onto the bottom.
The success of the operation is closely linked to theaccuracy with which the FADÕs position is known.In fact, in order to lay the line at the right spot, theexact position of the anchor must be known and aneducated guess about the position of the remainingpart of the FADÕs mooring line must be made. Thisposition can depend on how the FAD was built. Ifthe rope is buoyant and has no dense intermediateparts , it will probably stretch out in the direction ofthe current.
During this cruise, we decided to lay the grapplingline perpendicular to the general current by stay-ing at less than 1000 metres from the supposed
position of the anchor. Weworked on two sites, at eachof which two FADs weremoored between August1995 and February 1997. Inthe interests of data compa-rability, we generally keptthe same mooring site whenreplacing a lost FAD. Theline-setting trajectories weredetermined using a comput-er-generated map preparedwith the Karto software(Y. Cadiou, 1994) (Figure 3).During the monthly cruises,GPS checks are carried outon a regular basis in order toobtain a scatter of points rep-resenting the various possi-ble positions of the FAD,depending on the currents.These checks facilitate thesearch for FADs which havea swing radius of about1500 metres.
The 13 attempts carried outduring the cruise allowed 3of the 4 FADs present in thework zone to be recovered intheir entirety. Examinationof the material recovered
33
Figure 3Directions of the grappling-hook line settings on the main site
14°41N
2
4
6
11
13
14°38N
61°15W61°18W
Bloc
1617
39
40
8
5
19
3
Diffèrentes positions des flotteursdu DCP relevées par GPSau cours de campagnes mensuelles° Different GPS positions of the FAD
floats plotted during monthly cruises

SPC Fish Aggregating Device Information Bulletin #3 – March 1998
resulted in the causes of failure being identi-fied. One FAD had been torn away from itsmooring by a boat as the stretching of its ropewas characteristic of very strong traction(Photo 1). The stainless steel wire leadersfrom fishing lines tangled at the exact loca-tion of the breakage point of the other twodevices, leave no doubt about the reason fortheir loss (Photo 2).
This confirms the theory based on observa-tions of FAD rafts recovered while adrift. Inaddition, many devices were lost betweenDecember and February when weather condi-tions were good. This period corresponds tothe time of the year when maritime traffic is atits heaviest (cruise ships) as well as the fishingseason for pelagic species, when FADs aremore heavily used. The use of steel wire lead-ers is considered in French Polynesia to be oneof the main causes for the loss of FADs.
On one of the FADs recovered (deployed in1995 and lost in 1996), we were able to exam-ine in detail the deep-water components. Theropes had not been subjected to any damage(Photo 3). Below the first 200 metres (from thesurface), no sign of aging, fouling or kinkingwas observed. The splices were in perfect con-dition and the whippings were in place. Theshackles and swivels located on the deep partshowed little corrosion and were in very goodcondition. The anchor was in its original con-dition (Photo 4). The thimbles which had notbeen secured by whipping were, however,badly damaged, but part of the damage wasdue to the strain exercised during recoverybecause of the weight of the anchor.Galvanised thimbles, nevertheless, constitutethe weak point of every connection, and asimple alternative must be implementedwithout delay.
For the deep-water section, the materials usedto construct FADs in Martinique are thereforeof sufficient quality to ensure a lifespan overtwo years as long as care is taken with rigging(e.g. splices, whipping). Care must be taken toprotect and strengthen the first 200 metres ofmooring line. The use, for the upper part ofthe device, of protective tubing and materialsresistant to damage caused by fishing linesshould restrict losses. However, the lifespanof FADs can be improved significantlythrough better visibility of the devices (radarreflectors and more efficient lighting) to limitdamage due to boats. Information campaignsdirected towards seafarers, shipping compa-nies and fishing groups can also reduce acci-dental losses.
34Photo 1
Photo 2
Photo 3
Photo 4

SPC Fish Aggregating Device Information Bulletin #3 – March 1998
References
CADIOU, Y. (1994). Karto : Programme de repr�sen-tation g�ographique, version 5.2. IFRE-MER/Nantes.
DETOLLE, J.P., E. TESSIER, D. ROOS, F. REN� & J.SACCHI. (1996). �tude en vue dÕoptimiser leco�t et la long�vit� des dispositifs de con-centration de poissons de lÕ�le de la R�union,approche technico-�conomique. IFREMER/RIDRV N¡94. 14 RH/La R�union.
KAKUMA, S. (1997). FAD fisheries of Okinawa,Japan. SPC FAD Information Bulletin #2.
SACCHI, J. & A. LAGIN. (1983). Exp�rimentation dedispositifs de concentration de poisson enMartinique. Document interne ISTPM. LeRobert, Martinique.
35
Safety system developed for light FADs 1
by Max Palladin 2
1. Reference: FAC Project: Sao Tome and Principe2. SEPIA, Immeuble International, 13 ave de la Gare, 78181, St Quentin en Yvelines cedex. ([email protected])
Between 1994 and 1996, the French Co-operationFund (FAC) supported a light FAD developmentproject as part of an artisanal fishery developmentprogramme in Sao Tome and Principe, started byFIDA in 1995.
This programme was managed by the French com-pany SEPIA (fisheries and aquaculture consul-tants) and supervised by Master Fisherman Jo�lDiquelou. With the benefit of experience from26 coastal and deep-water FAD deployments, thisprogramme made it possible to design a type ofFAD suitable for local conditions, which was eco-nomical to make and set and could be managedand maintained by the fishers themselves.
In addition to the usual problems encountered inprogrammes of this kind, the use by the fishers ofvery long drift gillnets added a further constraintby causing the loss of many devices. These nets,1000 to 2000 m in length and with a 2 m drop, arewidely used to catch flying fish from October toMay. When the nets drift and become entangledaround a FAD, the fishers often have no alternative
but to cut the mooring, leading to the irretrievableloss of the FAD.
In order to solve this problem, the project devel-oped an original safety system which makes it pos-sible to recover severed moorings and replace theupper part.
The FADs concerned consist of the following com-ponents: an anchor consisting of a lorry tyre filledwith concrete from which extend straps similar tocar safety belts, to which the mooring line is fixed.This line consists entirely of 10 mm diameterpolypropylene rope (length equal to 1.5 timesdepth). At the surface, a set of 10 buoys each of 4 lof buoyancy, plus a 60 l plastic float fitted with awooden mast, form the visible part of the FAD.
At approximately 20 m below the surface, three 4 lbuoys have been attached to the line followed bya weight of approximately 14 kg which can slidealong the mooring line. This weight consist of acement block with a centre hole made by insertinga PVC tube to protect the rope from chafing

SPC Fish Aggregating Device Information Bulletin #3 – March 1998
directly against the cement. Should the line besevered, the weight drops and releases the line,which comes back up to the surface and floats.The fishers can then rebuild the upper part of themooring, not forgetting of course to includeanother safety system.
This project has just been extended for a threeyear period (1997 to 2000) with funding fromCaisse fran�aise de d�veloppement to pursue the goalof setting 25 new FADs around the islands of thegroup and transferring their management to thefisher communities.
36
Figure1Diagram of the safety system developed on FADs in Sao Tome and Principe
FAO type FAD
Improved FAD with safety device
14 kg weight sliding along the upper part of the mooring
If the upper part is severed, the weight sinks and the 3 middle buoys rise to the surface
3 buoys (4 l) fixed20 m below the surface
10 buoys (4 l)+ 1 buoy (60 l)
10 mm ¿ polypropylene line(length = 1.5 times depth)
Lorry tirefilled with concrete

SPC Fish Aggregating Device Information Bulletin #3 – March 1998
Bigeye are financially the most important of thetunas fished in the Atlantic and are worthUS$ 600 million on the Japanese markets. Theintroduction of deep-water longliners and freezingsystems enabled Japanese vessels to catch bigeye inlarge quantities in the Atlantic. The Taiwanesefleet, which previously focused on albacore, hasalso switched largely its attention to bigeye due tohigh prices in Japan.
Dr Joao Gil Pereira, professor at the AzoresInstitute of Oceanography, is a specialist in tunaand he gave details of the Atlantic fishery at the16th Fisheries Week of the Azores conference heldin Horta in March 1997.
Catches of bigeye taken with longlines haveincreased significantly in recent years to 60 000 t in1994Ð95. ÔBigeye are caught in shoals close to thesurface, by baitboats and purse seiners. But they gointo deeper waters as far down as 500 mÑand thishad led to the development of deep longline gearspecifically for bigeye.Õ Dr Pereira said.
Bigeye are fished extensively by tuna seiners work-ing off west Africa and this fishery is becomingincreasingly associated with FADs.
ÔSince 1991 the use of FADs by tropical purse sein-ers has been increasing and tens of thousands offloating objects are drifting in the tropical Atlantic.ÕDr Pereira said.
Floating objects such as logs and rafts were used inthe past as these attracted small fish. Speciallydesigned buoys were then used for the same pur-pose and these were equipped with radiotransponders which could be traced using direc-tion-finder (DF) equipment.
More recently these have been replaced largely bybuoys fitted with satellite positioning devices.Seiners shoot around the FADsÑand this hasincreased to the extent that seiner fleets are relyingincreasingly on FADs. Therefore, they need tospend less time actively searching out for tuna.
Bigeye is taken as a by-catch in this fishery, whichtargets yellowfin and skipjack tuna, but the catchof juvenile bigeye by purse seiners has increasedfrom 10 000 t before 1991 to 30 000 t in 1994. Thisis primarily because of the increased use of FADsas bigeye form schools with skipjack and juvenileyellowfin tuna.
An additional juvenile bigeye fishery takes place inwest African waters with a live-bait fleet based inGhana. One other live bait fleet, targeting medium-size bigeye, is based in Dakar.
The technique consists in fishing in schools associ-ated to the fishing boat itself, effectively using theboat as a FAD. This technique is also used by theSpanish (Canary island) fleet. The Portuguese(Azores and Madeira) and Spanish (CanaryIslands) pole-and-line fishery further north takeslarger fish.
Catch levels of Atlantic bigeye are estimated tostand at around 100 000 t annually.
FADs ‘take too many juveniles’
ÔThe International Commission for the Conser-vation of Atlantic Tunas (ICCAT) feels that catchlevels of 100 000 t annually for bigeye cannot bemaintained,Õ Dr Joao Gil Pereira told the ICCATAzores conference.
37
Readings
Huge rise in bigeye catch in the Atlantic

SPC Fish Aggregating Device Information Bulletin #3 – March 1998
ÔMortality is calculated at being above the opti-mum level. This is overexploitation of the repro-ducing stock and overfishing of juveniles. Millionsof bigeye are caught at 2 to 3 kg and so it will benecessary to reduce use of FADsÕ.
ÔIf no measures are taken, catches will drop to lowlevels and a total of decline of the stock couldresult. ICCAT wants catches reduced to the levelsof 20 years ago, which is a drastic reduction.Õ
He went on to say that the Standing Committeeon Research and Statistics (SCRS) has proposedan intensive research programme, which wouldinclude wide-scale tagging, to see if catch levelsare sustainable.
ÔThe high value of the catch justifies this researchinto bigeye,Õ Dr Pereira said. He criticised ICCATCommissioners for ignoring the research proposedby scientists and their failure to adopt the neces-sary management measures.
He pointed out that the Europeans have a majorresponsibility in tuna research. ÔTuna research wasover-looked by Brussels for many years. It wasseen as a distant water fishery. But the situation ischanging. Europe is now the biggest exploiter oftuna resources in the Atlantic and Indian Oceans.Õ
Source: Fishing News International, May 1997
Note from the editor: Following expressions of concern by scien-tists, three fishing companies (ORTHONGELin France, OPTUC-ANABAC and OPAGACin Spain), which operate the majority ofEuropean purse-seiners, have decided toimplement a three-month moratorium on theuse of this technique in some parts of theAtlantic Ocean known as spawning sites.
38
The gathering behaviour of juveniles Trachurusjaponicus towards fish aggregating devices(FADs) was studied using an outdoor water tank(5 x 5 x 3 m) and different scale-model FADs(0.4 x 0.4 x 0.2 m).
The distribution pattern of juveniles Trachurusjaponicus changed with light intensity. In the day-time, the gathering behaviour to the FAD wasapparent, but not in night-time. The results evi-dently indicated that juvenile of Trachurus japonicusare independent of FAD in night-time. In order todetermine the gathering behaviour quantitatively,an index, related to the length of the time spentclose to the FAD, was introduced. The ratio of gath-
ering index varied with the shape and depth of thedifferent scale models. However, the resultsshowed small index value in all experiments.
It is suggested that localisation by visual stimula-tion may in some cases play an important part inthe taxis of fishes toward FAD. A visual stimulationmust be one of the factors but not the only factorwhich attracted juvenile Trachurus japonicus to theFAD. Further studies into the factors are necessary.
Source: Bulletin of the Japanese Society of FisheriesOceanography, Vol. 60, No. 4, 356Ð362 (inJapanese).
Effect of fish aggregating devices (FAD) for gathering juvenile Japanesehorse mackerel, Trachurus japonicusby Seong Wan Hong1, Mineo Okamoto2, Takehiko Imai3 and Shigeru Fuwa3
1. The United Graduate School of Agricultural Science, Kagoshima University, Kagoshima 890, Japan.2. Japan Marine Science and Technology Center, Yokosuka 237, Japan.3. Faculty of Fisheries, Kagoshima University, Kagoshima 890, Japan.

SPC Fish Aggregating Device Information Bulletin #3 – March 1998 39
This paper analyses acoustic tagging of 8 yellowfintunas (Thunnus albacares) undertaken around FishAggregating Devices (FADs) in La Reunion island(Indian Ocean). Emphasis is laid on the horizontalmovements and thus completes previous studieson vertical movements around the same FADs. Thefirst result of the present study deals with the rela-tive dwelling time of yellowfin over the distance toFAD where tagging was made, considering0.5 nautical mile (nm) intervals. Typical distribu-tions of the dwelling time are described, which aredifferent from day to night. At daytime, the fishremain in the close vicinity of the FAD (mostlywithin a 1 nm radius), whilst a drastic disassocia-tion from the FAD occurs at night. During the day,the attractive influence of the FAD disappears 5 nmaway; this finding leads to the suggestion that aminimum distance of 10 nm between neighbouringFADs should be applied in La Reunion to avoid
overlapping the influence radii. The second groupof results points out the potential use of the verticaland total swimming speeds as indicators of the for-aging activity of the fish and of the type of move-ments (behaviour of tight association to FAD, tran-sit among FADs or offshore migration, away fromthe area of FADs). The dayÐnight change affects thevertical activity, with large magnitude of verticalmovements exhibited at night. The total speed dur-ing the offshore movements is estimated about1.2 m/s: the shift from a phase of tight associationto FAD toward a phase of transit movement char-acterised by an increase of the total speed. A typol-ogy of the relationship between swimming speedand feeding activity is proposed and discussed.
Source: Document presented at: ÔSecond Con-ference on Fish Telemetry in EuropeÕ (LaRochelle, 5Ð9 April 1997)
Fish telemetry applied to behaviour analysis of yellowfin tunamovements in a fish aggregating devices networkby Francis Marsac 1 & Patrice Cayr� 2
1. ORSTOM-HEA, BP 5045 - 34032 Montpellier2. ORSTOM, 213 rue Lafayette, 75480 Paris Cedex 10
A significant portion of tuna catches is taken in thevicinity of floating objects like large pieces of float-ing wood. Recently, there has been strong pressureto abandon another mode of fishing tuna in easternPacific that is associated with dolphins because ofsocial concerns. This pressure may lead to anincreased reliance of fishermen on fishing aroundfloating wood. Most such timber comes from water-sheds containing tropical forests. Deforestation in
the vicinity of water courses will eventually lead toa gradual decrease in the influx of natural timber tooceans. The considerations raised in this note arepreliminary and speculative to stimulate discussionand further research rather than to make any defin-itive judgements or conclusions.
Source: Fisheries Research 25 (1996): 369Ð376
Tuna and trees: a reflection on a long-term perspective for tuna fishingaround floating logsby John F. Caddy & Jacek Majkowski
Marine Resources Service, Fishery Resources Division, Food and Agriculture Organization of the United Nations, Via delle Terme diCaracalla, 00100 Rome, Italy

SPC Fish Aggregating Device Information Bulletin #3 – March 1998
BACH, P., L. DAGORN, E. JOSSE, F.-X. BARD, R. ABBES, A.BERTRAND & C. MISSELIS. (1998). Experimentalresearch and fish aggregating devices (FADs) inFrench Polynesia. SPC FAD Information Bulletin #3.3Ð19.
BARUT, N.C. (1988). Food and feeding habits of yellowfintuna (Thunnus albacares), caught by handline aroundpayao in the Moro Gulf. IPTP/88/WP/18, FAO,Colombo, Sri Lanka. 39 p.
CAYR�, P. (1991). Behaviour of yellowfin tuna (Thunnusalbacares) and skipjack tuna (Katsuwonus pelamis)around fish aggregating devices (FADs) in theComoros Islands as determined by ultrasonic tag-ging. Aquat. Living Resour., 1991, 4: 1Ð12.
CAYR�, P. (1991). Dispositifs de Concentration dePoissons (DCP) et p�che artisanale. In: ÔActes de laConf�rence Thoni�re R�gionaleÕ (Antanarivo,Madagascar, 9Ð12 Mai 1990); Le Gall, de Reviers etRoger, Ed. scient., in the series ÔColloques etS�minairesÕ, ORSTOM Ed., Vol.144, 54Ð59.
CAYR�, P. (1991). Physiologie et �tude du comportement.Application pratique des r�sultats. In: ÔActes de laConf�rence Thoni�re R�gionaleÕ (Antanarivo,Madagascar, 9Ð12 Mai 1990); Le Gall, de Reviers etRoger, Ed. scient., in the series ÔColloques etS�minairesÕ, ORSTOM Ed., Vol.144, 61Ð65.
CAYR�, P. (1995). Comportement de lÕalbacore (Thunnusalbacares) � petite �chelle dÕespace et de temps etmod�lisation de sa distribution verticale � partir dedonn�es de marquage acoustique et de param�treslocaux dÕenvironnement. Jour. Rech. Oc�anogr.Vol. 20, (3Ð4): 146Ð149.
CAYR�, P. & J. CHABANNE. (1986). Marquage acoustique etcomportement de thons tropicaux (albacore: Thunnusalbacares, et listao: Katsuwonus pelamis) au voisinagedÕun dispositif concentrateur de poissons. Oc�anogr.trop., 21(2): 167Ð183.
CAYR�, P., J. CHABANNE, G. MOARI ET B. UGOLINI. (1986).Premi�res exp�riences de marquages acoustiques etde poursuite de thonid�s en Polyn�sie fran�aise. Cah.EVAAM, n¡ 11 : 44 p.
CAYR�, P. & F. MARSAC. (1993). Modelling the yellowfintuna (Thunnus albacares) vertical distribution usingsonic tagging results and local environmental para-meters. Aquat. Living Resources, 6: 1Ð14.
CONAND, F. (1995). �tude du comportement alimentaireet du comportement de d�placement suivi par mar-quage acoustique. Rapport dÕavancement de lÕactionIII du CAN Reunion, PTR2. Manuscript, 33 p.
DAGORN, L., P. BACH & E. JOSSE. (1997). Modeling effectsof anchored FADs and prey distribution on horizon-tal and vertical movements of tuna in the FrenchPolynesia EEZ. Proceedings of the 48th Annual TunaConference.
DETOLLE, J.P., E. TESSIER, D. ROOS, F. REN� & J. SACCHI.(1996). �tude en vue dÕoptimiser le co�t et lalong�vit� des dispositifs de concentration de pois-sons de lÕ�le de La R�union, approche technico-�conomique. IFREMER/ RIDRV n¡94.14 RH/LaR�union. 73 p.
DETOLLE, J.P., E. TESSIER, D. ROOS, F. REN� & J. SACCHI.(1998). The dynamics and effects of FADs in LaReunion Island. SPC FAD Information Bulletin #3.
FONTENEAU, A. (1992). P�che thoni�re et objets flottants :Situation mondiale et perspectives. Rec. Doc. Scient.ICCAT, 40, 459Ð472.
IZUMI, M. (1993). Introduction to payao development andmanagement in Okinawa, Japan. SPC FisheriesNewsletter No. 65. April/June 1993. 27Ð32.
MARSAC, F. & P. CAYR�. (1997). Fish telemetry applied tobehaviour analysis of yellowfin tuna movements in afish aggregating devices network. 2nd Conference onFish Telemetry in Europe, La Rochelle, 5Ð9 April.
MARSAC, F., P. CAYR� & F. CONAND. (1996). Analysis ofsmall scale movements of yellowfin tuna around fishaggregating devices (FADs) using sonic tagging. In:Anganuzzi, A.A, K.A Stobberup and N.J. Webb (eds),Proceedings of the Expert Consultation on IndianOcean tunas, 6th session, Colombo, Sri Lanka, 25Ð29Sept. 1995. IPTP Coll., Vol. 9: 151Ð159.
PALLADIN, M. (1998). Safety system developped for lightFADs. SPC FAD Information Bulletin #3. 35Ð36.
ROGER, C. (1994). The plankton of the tropical westernIndian ocean as a biomass indirectly supporting sur-face tunas (yellowfin, Thunnus albacares and skipjack,Katsuwonus pelamis). Envir. Biol. Fishes, 39: 161Ð172.
ROGER, C. (1994). Relationships among yellowfin andskipjack tuna, their prey-fish and plankton in thetropical western Indian Ocean. Fish. Oceanogr. 3(2):133Ð138.
ROGER, C. & R. GRANDPERRIN. (1976). Pelagic food webs inthe tropical Pacific. Limnol. Oceanogr. 21: 731Ð735.
SAN, M. DE & A, PAGES. (1998). FAD Ð The Western IndianOcean experience. SPC FAD Information Bulletin #3.24Ð29.
TAQUET, M., P. GERVAIN & A. LAGIN. (1998). RecoveringFADs lost at a depth of 2000 m. SPC FAD InformationBulletin #3. 30Ð35.
40
A preliminary bibliography of FAD-related literature. . . continuedFollowing our publication of a preliminary bibliography of FAD-related literature in the SPC FAD Bulletin #2, wehave received the following additions and corrections. Please, keep submitting all references that you would like toinclude, we will publish them in the next issue of this bulletin.
Pacific Islands Marine Resources Information System
PIMRIS is a joint project of 5 internationalorganisations concerned with fisheries andmarine resource development in the PacificIslands region. The project is executed by theSouth Pacific Commission (SPC), the SouthPacific Forum Fisheries Agency (FFA), theUniversity of the South Pacific (USP), theSouth Pacific Applied GeoscienceCommission (SOPAC), and the South PacificRegional Environment Programme (SPREP).Funding is provided by the CanadianInternational Development Agency (CIDA)and the Government of France. This bulletinis produced by SPC as part of its commit-
ment to PIMRIS. The aim of PIMRIS is toimprove the availability of information onmarine resources to users in the region, so asto support their rational development andmanagement. PIMRIS activities include: theactive collection, cataloguing and archivingof technical documents, especially ephemera(Ôgrey literatureÕ); evaluation, repackagingand dissemination of information; provisionof literature searches, question-and-answerservices and bibliographic support; andassistance with the development of in-coun-try reference collections and databases onmarine resources.
Copyright © 2022 FDOKUMEN