Experimental and numerical study of water flow in soil under irrigation in northern Senegal:...
14
Experimental and numerical study of water flow in soil under irrigation in northern Senegal: evidence of air entrapment C. H AMMECKER a , A. C. D. ANTONINO b , J. L. MAEGHT a & P. B OIVIN c,d a Institut de Recherche pour le De´veloppement, UR 67, route des pe`res maristes, BP 1386 Dakar, Senegal, b Departamento de Energia Nuclear, Universidade Federal de Pernambuco, Avenida Professor Luiz Freire 1000, Cidade Universitaria, Recife, PE 50740-540, Brazil, c Institut de Recherche pour le De´veloppement, UR 67, BP 5045, 34032 Montpellier Cedex 1, France, and d Ecole Polytechnique Fe ´de´rale de Lausanne, IATE-Pe´dologie, 1015 Lausanne, Switzerland Summary Irrigation by surge flooding does not always wet the soils thoroughly, and we have investigated the reasons for this on an irrigated plot in northern Senegal by monitoring the water budget during a rice cropping season (100 days). The amount of water added during each irrigation event was measured, and evapotranspiration and infiltration were estimated with lysimeters and Muntz infiltration rings, respect- ively. At the same time, piezometric levels, neutron probe values and water tension data were recorded at two stations in the plot. These measurements showed unusual results: infiltration rate was less than 1 10 6 mm s 1 (less than 0.1 mm a day), there was a constant water deficit during the entire irrigation period, around 50 cm deep, and tensiometers at 40 cm reacted very slowly to water infiltration. The water fluxes in the vadose zone derived from these data showed clearly a discrepancy between fluxes calculated from hydraulic gradients and fluxes calculated from mass conservation. The hydraulic gradients sug- gested a zero flux plane at 40 cm below the surface, but the calculated values of the fluxes overestimated by several orders of magnitude the infiltration rates determined on the plot, whereas fluxes determined from mass conservation matched far better. These results show that air was entrapped between the shallow water table and the wetting front, and this inhibited water infiltration. Modelling water flow down the soil profile with a computer program for simulating one-dimensional water movement (Hydrus) confirmed that single-phase models cannot describe imbibition in this situation. Simple infiltra- tion models based on a modified Green–Ampt equation accounting for air compression and air counter- flow, however, fit experimental infiltration data much better. We demonstrated that where surge flooding is associated with a shallow water table, as in many large irrigation schemes, one must take into account the presence of air to quantify the flow of water into the soil. Introduction The infiltration of water into soil has been much studied and quantified, especially through the Darcy equation extended to non-saturated porous media by Richards (1931). Many com- puter models quantifying water flow and water budget in soil profiles are now available. However, most of them are designed to quantify single-phase flow, namely only water flow, on the assumption that air escapes freely and does not affect the infil- tration of water into soil. This assumption is valid for a wide variety of situations encountered in the field. For surge flooding in irrigated paddy fields and under intense rain (Jarett et al., 1980), the assumption of free air escape is no longer valid, especially when the water table is close to the surface. Under these conditions air is trapped and compressed. The conse- quences of this on infiltration have been evaluated theoretically and in laboratory experiments on soil monoliths by Adriani & Franzini (1966), Vachaud et al. (1974), Touma & Vauclin (1986), Jalali-Farahani et al. (1993), Grismer et al. (1994), Latifi et al. (1994) and Wang et al. (1998). The most important effect of air compression is a sharp decrease in infiltration rate. Several authors observed and measured the air compression in the field Paper given at the Michel Rieu Memorial Colloquium, 8–10 October 2001, in Paris. Correspondence: C. Hammecker, IRD-MSEM, 300 av. Emile Jeanbreau, 34095 Montpellier Cedex, France. E-mail: [email protected] Received 13 November 2001; revised version accepted 7 May 2002 European Journal of Soil Science, September 2003, 54, 491–503 # 2003 Blackwell Publishing Ltd 491
Transcript of Experimental and numerical study of water flow in soil under irrigation in northern Senegal:...
Experimental and numerical study of water flowin soil under irrigation in northern Senegal:evidence of air entrapment
C. H AMMECKERa , A . C . D . ANTONINO
b, J. L. MAEGHTa & P. BOIVIN
c,d
aInstitut de Recherche pour le Developpement, UR 67, route des peres maristes, BP 1386 Dakar, Senegal, bDepartamento de Energia
Nuclear, Universidade Federal de Pernambuco, Avenida Professor Luiz Freire 1000, Cidade Universitaria, Recife, PE 50740-540,
Brazil, cInstitut de Recherche pour le Developpement, UR 67, BP 5045, 34032 Montpellier Cedex 1, France, and dEcole Polytechnique
Federale de Lausanne, IATE-Pedologie, 1015 Lausanne, Switzerland
Summary
Irrigation by surge flooding does not always wet the soils thoroughly, and we have investigated the
reasons for this on an irrigated plot in northern Senegal by monitoring the water budget during a rice
cropping season (100 days). The amount of water added during each irrigation event was measured, and
evapotranspiration and infiltration were estimated with lysimeters and Muntz infiltration rings, respect-
ively. At the same time, piezometric levels, neutron probe values and water tension data were recorded at
two stations in the plot. These measurements showed unusual results: infiltration rate was less than
1� 10�6 mm s�1 (less than 0.1mm a day), there was a constant water deficit during the entire irrigation
period, around 50 cm deep, and tensiometers at 40 cm reacted very slowly to water infiltration. The water
fluxes in the vadose zone derived from these data showed clearly a discrepancy between fluxes calculated
from hydraulic gradients and fluxes calculated from mass conservation. The hydraulic gradients sug-
gested a zero flux plane at 40 cm below the surface, but the calculated values of the fluxes overestimated
by several orders of magnitude the infiltration rates determined on the plot, whereas fluxes determined
from mass conservation matched far better. These results show that air was entrapped between the
shallow water table and the wetting front, and this inhibited water infiltration. Modelling water flow
down the soil profile with a computer program for simulating one-dimensional water movement
(Hydrus) confirmed that single-phase models cannot describe imbibition in this situation. Simple infiltra-
tion models based on a modified Green–Ampt equation accounting for air compression and air counter-
flow, however, fit experimental infiltration data much better. We demonstrated that where surge flooding
is associated with a shallow water table, as in many large irrigation schemes, one must take into account
the presence of air to quantify the flow of water into the soil.
Introduction
The infiltration of water into soil has been much studied and
quantified, especially through the Darcy equation extended to
non-saturated porous media by Richards (1931). Many com-
puter models quantifying water flow and water budget in soil
profiles are now available. However, most of them are designed
to quantify single-phase flow, namely only water flow, on the
assumption that air escapes freely and does not affect the infil-
tration of water into soil. This assumption is valid for a wide
variety of situations encountered in the field. For surge flooding
in irrigated paddy fields and under intense rain (Jarett et al.,
1980), the assumption of free air escape is no longer valid,
especially when the water table is close to the surface. Under
these conditions air is trapped and compressed. The conse-
quences of this on infiltration have been evaluated theoretically
and in laboratory experiments on soil monoliths by Adriani &
Franzini (1966), Vachaud et al. (1974), Touma & Vauclin
(1986), Jalali-Farahani et al. (1993), Grismer et al. (1994), Latifi
et al. (1994) and Wang et al. (1998). The most important effect
of air compression is a sharp decrease in infiltration rate. Several
authors observed and measured the air compression in the field
Paper given at the Michel Rieu Memorial Colloquium, 8–10 October
2001, in Paris.
Correspondence: C. Hammecker, IRD-MSEM, 300 av. Emile
Jeanbreau, 34095 Montpellier Cedex, France. E-mail:
Received 13 November 2001; revised version accepted 7 May 2002
European Journal of Soil Science, September 2003, 54, 491–503
# 2003 Blackwell Publishing Ltd 491
and quantified the decrease of infiltration rate (Bianchi &
Haskell, 1966; Dixon & Linden, 1972; Linden et al., 1977).
Others, such as Starr et al. (1978), have shown that flow is
unstable and that fingering arises from air’s becoming com-
pressed during infiltration. Otherwise little is known of the
entrapment of air in the field and its effect on infiltration under
crops. This phenomenon is of particular interest in flooded rice
cropping in arid regions where there is serious risk of salinization
because of the evaporative demands and lack of leaching.
We have studied the effect of air compression both directly
and indirectly, while quantifying the water budget under irri-
gated rice in northern Senegal, and we report the results below.
Experimental data of water infiltration and tensiometric pro-
files are used to show air entrapment. The comparison between
field experimental data and simulations by a traditional model
for single-phase flow, namely Hydrus (Simunek et al., 1998), is
used to quantify the importance of air entrapment. Finally,
infiltration is simulated with a Green–Ampt type equation,
adapted for air compression and counter-flow, and simulation
results are discussed.
Theory
The effect of air compression in front of a progressing wetting
front has been studied by Bouwer (1964), Morel-Seytoux &
Khanji (1974) and Wang et al. (1997), who established analyt-
ical infiltration equations accounting for air compression and
air counter-flow derived from the Green & Ampt (1911) infil-
tration equation:
iw ¼ �Ksðhwf � zÞ � h0
z; ð1Þ
where iw is the rate of water infiltration [LT�1], Ks is the
saturated hydraulic conductivity [LT�1], hwf is the soil water
pressure head [L] at the wetting front, z is the depth of the
wetting front [L], and h0 is the pressure head of water at the
surface [L]. Capillary pressure is defined as the pressure differ-
ence between the non-wetting fluid and the wetting fluid. Hence
in this case the water pressure head near the wetting front is
hwf ¼ ha � hc;
with ha and hc being, respectively, the air and the capillary
pressure heads. Whereas the air pressure depends on the pro-
gression of the wetting front, the water pressure depends itself
on the pore geometry according to Laplace’s law. When the
wetting front progresses and the air underneath cannot escape,
its pressure will increase until the capillary pressure and the
infiltration rate iw tends towards 0:
iw ¼ Kzþ h0 þ hc � ha
z
� �: ð2Þ
However, Wang et al. (1998) demonstrated experimentally that
air escapes when it reaches a pressure called air breaking
pressure, Hb, defined as
Hb ¼ h0 þ zþ hab; ð3Þ
where hab is the air-bubbling pressure of the soil. After the air
has escaped, the pressure decreases until it reaches the air-
closing value Hc:
Hc ¼ h0 þ zþ hwb; ð4Þ
where hwb is the water-bubbling pressure of the soil. Wang
et al. (1997) defined these two pressure values as the inflection
point on the drying and wetting retention curve of the soil,
and, assuming the applicability of the van Genuchten (1980)
model, they suggested their evaluation:
hab ¼ 1
�d
and
hwb ¼ 1=�wt � �; ð5Þ
where �¼ 0* 2 for sandy soils, �¼ 2* 5 for loamy soils, and
�¼ 5* 8 for clay soils. The subscripts d and wt stand, respect-
ively, for the drying and wetting scanning curve. When the
wetting curve is not available, it is usually admitted that
�wt¼ 2�d (Kool & Parker, 1987; Nielsen & Luckner, 1992).
We adopted this procedure in our study.
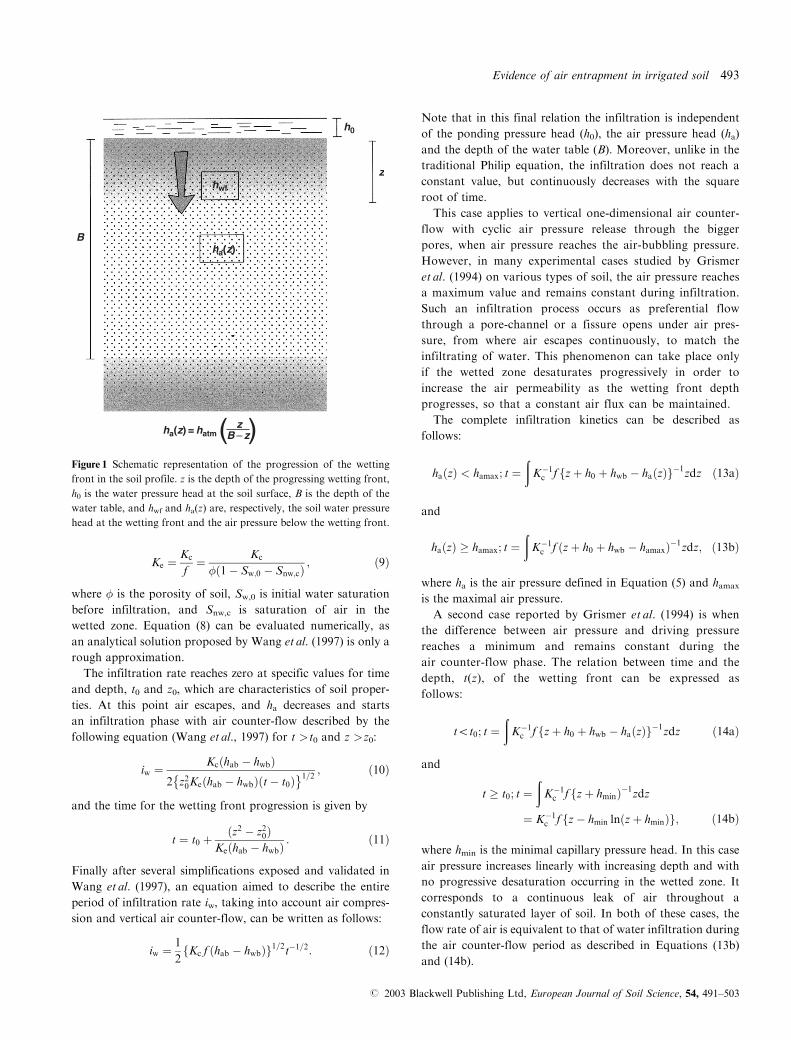
If the air behaves like a perfect gas then the air pressure can
be calculated according to Boyle’s law:
ha ¼ hatmz
B� z
� �; ð6Þ
where hatm is the atmospheric air pressure (& 1013 cm of
water) and B is the depth of the air-impermeable barrier,
which is usually the water table depth (Figure 1). From
Equations (4) and (5), the capillary pressure at the wetting
front hc is the water-bubbling pressure hwb during the infil-
tration phase. The instantaneous infiltration rate, iw, is then
given by
iw ¼ Kczþ h0 þ hwb � haðzÞ
z: ð7Þ
Here Kc is the saturated hydraulic conductivity for air-confining
conditions and corresponds to the reduction of saturated
hydraulic conductivity by the relative water conductivity krc:
Kc ¼ krcKs:
Experimental results show that 0.5 is a suitable value for
krc (Vachaud et al., 1974; Touma et al., 1984; Wang et al., 1998).
Equation (7) describes infiltration while air pressure
increases below the progressing wetting front, and the time t
when the wetting front reaches z is given by
t ¼ K�1e
ðz
zþ h0 þ hwb � haðzÞdz; ð8Þ
where Ke is the effective hydraulic conductivity, namely:
492 C. Hammecker et al.
# 2003 Blackwell Publishing Ltd, European Journal of Soil Science, 54, 491–503
Ke ¼Kc
f¼ Kc
�ð1� Sw;0 � Snw;cÞ; ð9Þ
where � is the porosity of soil, Sw,0 is initial water saturation
before infiltration, and Snw,c is saturation of air in the
wetted zone. Equation (8) can be evaluated numerically, as
an analytical solution proposed by Wang et al. (1997) is only a
rough approximation.
The infiltration rate reaches zero at specific values for time
and depth, t0 and z0, which are characteristics of soil proper-
ties. At this point air escapes, and ha decreases and starts
an infiltration phase with air counter-flow described by the
following equation (Wang et al., 1997) for t >t0 and z >z0:
iw ¼ Kcðhab � hwbÞ2 z20Keðhab � hwbÞðt� t0Þ� �1=2
; ð10Þ
and the time for the wetting front progression is given by
t ¼ t0 þðz2 � z20Þ
Keðhab � hwbÞ: ð11Þ
Finally after several simplifications exposed and validated in
Wang et al. (1997), an equation aimed to describe the entire
period of infiltration rate iw, taking into account air compres-
sion and vertical air counter-flow, can be written as follows:
iw ¼ 1
2fKc f ðhab � hwbÞg1=2t�1=2: ð12Þ
Note that in this final relation the infiltration is independent
of the ponding pressure head (h0), the air pressure head (ha)
and the depth of the water table (B). Moreover, unlike in the
traditional Philip equation, the infiltration does not reach a
constant value, but continuously decreases with the square
root of time.
This case applies to vertical one-dimensional air counter-
flow with cyclic air pressure release through the bigger
pores, when air pressure reaches the air-bubbling pressure.
However, in many experimental cases studied by Grismer
et al. (1994) on various types of soil, the air pressure reaches
a maximum value and remains constant during infiltration.
Such an infiltration process occurs as preferential flow
through a pore-channel or a fissure opens under air pres-
sure, from where air escapes continuously, to match the
infiltrating of water. This phenomenon can take place only
if the wetted zone desaturates progressively in order to
increase the air permeability as the wetting front depth
progresses, so that a constant air flux can be maintained.
The complete infiltration kinetics can be described as
follows:
haðzÞ < hamax; t ¼ðK�1
c f fzþ h0 þ hwb � haðzÞg�1zdz ð13aÞ
and
haðzÞ � hamax; t ¼ðK�1
c f ðzþ h0 þ hwb � hamaxÞ�1zdz; ð13bÞ
where ha is the air pressure defined in Equation (5) and hamax
is the maximal air pressure.
A second case reported by Grismer et al. (1994) is when
the difference between air pressure and driving pressure
reaches a minimum and remains constant during the
air counter-flow phase. The relation between time and the
depth, t(z), of the wetting front can be expressed as
follows:
t5t0; t ¼ðK�1
c f fzþ h0 þ hwb � haðzÞg�1zdz ð14aÞ
and
t � t0; t ¼ðK�1
c f fzþ hminÞ�1zdz
¼ K�1c f fz� hmin lnðzþ hminÞg; ð14bÞ
where hmin is the minimal capillary pressure head. In this case
air pressure increases linearly with increasing depth and with
no progressive desaturation occurring in the wetted zone. It
corresponds to a continuous leak of air throughout a
constantly saturated layer of soil. In both of these cases, the
flow rate of air is equivalent to that of water infiltration during
the air counter-flow period as described in Equations (13b)
and (14b).
B
hwf
ha(z)
h0
z
ha(z) = hatm ( zB – z)
Figure 1 Schematic representation of the progression of the wetting
front in the soil profile. z is the depth of the progressing wetting front,
h0 is the water pressure head at the soil surface, B is the depth of the
water table, and hwf and ha(z) are, respectively, the soil water pressure
head at the wetting front and the air pressure below the wetting front.
Evidence of air entrapment in irrigated soil 493
# 2003 Blackwell Publishing Ltd, European Journal of Soil Science, 54, 491–503
Materials and methods
The experimental site
The experiment was done in a 0.3-ha irrigated paddy field in
northern Senegal (16�400N, 15�W), in the middle valley of the
Senegal River. The field was 100m long and 30m wide, within
an irrigation scheme, dedicated mainly to rice cropping. The
soil profile is a 2-m layer of clay overlying a fine sandy sedi-
ment 5–6m thick. The soil itself is a heavy clay Vertisol with
polyhedral and vertic structures (slickensides), and with cracks
that widen and extend downwards from the surface as the soil
shrinks during drying. It contains 65–70% of clay minerals
which are mainly Fe-smectite (Favre et al., 2002) and kaolinite.
The water table is established in the sandy layer. Rice is grown
under flood irrigation, and a superficial pond of 5–25 cm is
maintained during the complete plant growth cycle (about
100 days). At a regional scale, the water table is fed by the
Senegal River, and its depth fluctuates between 2 and 3m
during the dry season. During the wet season when the
water level in the river rises to its maximum height, the piezo-
metric level sometimes reaches the soil surface. Moreover,
these movements of the water table are augmented locally
by leakage from the irrigation canals and by the irrigation
itself.
Experimental device
A complete water budget was computed to quantify the dif-
ferent water fluxes involved during the cropping cycle. Tensio-
metric data were recorded daily at the two sites in the field
(Figure 2) at 0, 20, 40, 60 and 80 cm. The matric tension for
stations 2 and 3 was recorded both manually with a mercury
manometer and continuously with electronic pressure trans-
ducers connected to a datalogger. The water content was meas-
ured at the three experimental stations with a neutron probe
(Nardeux, solo 20), at 10-cm intervals in a 1-m access tube.
The soil water content changes have been evaluated by relative
probe counts (C/C0, where C0 is the number of counts in water
and C is the number of counts in the soil) because the alternate
swelling and shrinking of the soil seriously complicated the
neutron probe calibration with volumetric water content.
Piezometric level was monitored weekly at five places: on
the edge of the irrigation canal, near the two tensiometric sites,
in the middle of the field, and outside the field opposite the
canal (Figure 2).
Water budget and soil water flow
The field was irrigated with siphon tubes running from the
canal to a defined spot at a constant height above ground
level. The water flux in the siphon tubes was calibrated for
different water levels in the canal. For each irrigation, its
duration, the water level in the canal and the number of siphon
tubes were recorded to enable us to calculate the water inputs.
The input flux was calculated by
qe ¼ nðahw þ bÞ; ð15Þ
where n is the number of siphons, hw is the height of the
water in the canal, and a and b are two fitting parameters for
calibration. The volume of water introduced in the field for
each irrigation is
Ve ¼ qeDt; ð16Þ
where Dt represents the duration of irrigation.
Precipitation was recorded with a rain gauge placed in the
middle of the field at 1.75m above the soil surface. Two
lysimeters (0.6m� 0.6m� 0.9m high sunk 0.6m into soil)
and two open Muntz cylinders (1.06m in diameter and 0.5m
high, of which 0.3m was in the soil) were set in the field for
calculating, respectively, evapotranspiration (ET) and infiltra-
tion rate (I) by monitoring water level in both devices, thus:
ET ¼ dhlysi
dt; ð17aÞ
and
I ¼ dhcyl
dt� ET: ð17bÞ
At each irrigation event, water was introduced in the device
through lateral holes, which were otherwise blocked with rub-
ber stoppers. The variation in water content (DS) in soil
profile to a depth Z, during a given time interval (t1� t0),
corresponds to the variation of the water content down the
soil profile. It can also be defined as the algebraic sum of the
inputs (irrigation or precipitation or both) P, the evapotran-
spiration ET, and the bottom flow (drainage or capillary rise
from a water table) Fb:
DS ¼ðð�t1 � �t0Þdz ð18aÞ
PlotDikeIrrigation
canal Piezometer
Clayey soil
Sandy soil
Distance from canal /m
Hei
ght /
m
P.aP.1 P.2 P.3
P.b P.cSt. 3St. 2
050 100 150 200
2
4
6
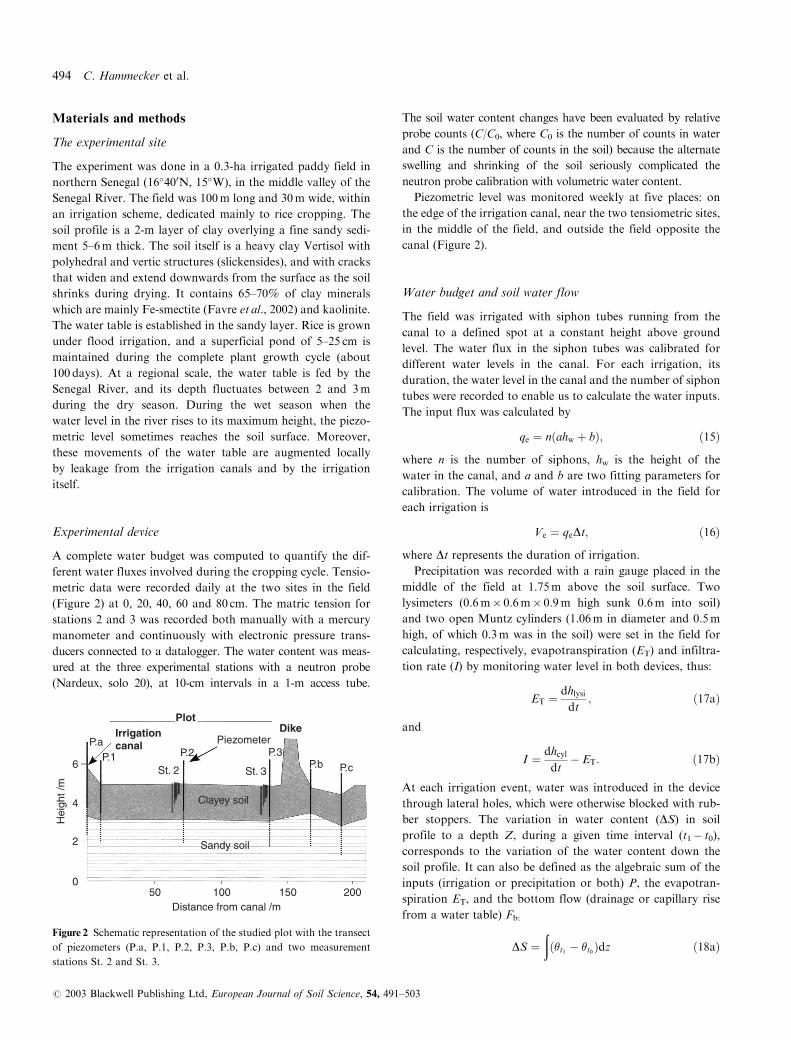
Figure 2 Schematic representation of the studied plot with the transect
of piezometers (P.a, P.1, P.2, P.3, P.b, P.c) and two measurement
stations St. 2 and St. 3.
494 C. Hammecker et al.
# 2003 Blackwell Publishing Ltd, European Journal of Soil Science, 54, 491–503
and
DS ¼ P� ET þ Fb: ð18bÞ
The amount of water leaving through the bottom of the profile
is given by Fb¼ qinfDt, where qinf is the flux there. The water
flux can be calculated at any depth z in the profile with the
Darcy equation:
qz ¼ �Kzð�ÞðrHÞz; ð19Þ
which in one dimension (vertical) is
qz ¼ �Kzð�ÞdH
dz
� �z
; ð20Þ
where Kz is the hydraulic conductivity at depth z, and (dH/dz)zis the hydraulic gradient at this depth. The sign of q indicates
the direction of the water flow: negative values indicate a
downward flow and positive values upward flow. The quantity
Kzþ1/2 is the geometric mean of Kz and Kzþ1, respectively the
hydraulic conductivity values at depth z and z þ 1.
The principle of continuity imposes
q�qt
¼ �rq: ð21Þ
In a soil profile with one-dimensional flow the variation in
water content (D�) at a depth zi, between the depths zi�1/2 and
ziþ1/2 and during a time interval Dt of Equation (21), becomes
D�Dt
� �i
¼qiþ1=2 � qi�1=2
ziþ1=2 � zi�1=2
� �; ð22Þ
where qi�1/2 et qiþ1/2 corresponds to water fluxes at the two
limits of the soil layer.
Unsaturated hydraulic properties of the soil profile
The chief unsaturated hydraulic properties were determined partly
in situ, down the soil profile, and partly at the laboratory.
Hydraulic conductivity was determined with a disc permeameter
(Perroux&White, 1988; Smettem&Clothier, 1989) every 20 cm in
a 1-m deep pit. Four cylinders of soil (diameter of 5 cm and length
of 6 cm) were sampled at each infiltration measurement point so
that we could determine the water retention curve and for particle-
size analysis. The retention curves were determined on cylindrical
soil samples by a method similar to that of Wind (1968). We
recorded simultaneously the shrinkage of the soil sample, and the
characteristic mass-wetness (�) against apparent density (�a) was
established (Braudeau et al., 1999). It was then possible to deter-
mine the relationship of actual water content (�) against pressure
head (h), despite the swelling and shrinking properties of this soil.
The unsaturated soil hydraulic parameters (van Genuchten,
1980) were determined by fitting models to experimental data
with the RETC code of van Genuchten et al. (1991). The
unsaturated soil hydraulic parameters were fitted to the clas-
sical van Genuchten functions (van Genuchten, 1980) for the
retention curve:
�ðhÞ ¼ ð�s � �rÞf1þ ð�hÞngm þ �r
and
Kð�Þ ¼ KsSlef1� ð1� S1=m
e Þmg2;
where � is the volumetric water content, h is the pressure head
[L], �s and �r are, respectively, the saturated and residual water
contents, and � [L�1], n and m are fitting parameters. Usually
m is considered as m ¼ 1� 1/n (Mualem, 1976). The saturated
hydraulic conductivity is Ks, and l is a fitting parameter found
to be equal to 0.5 for most soils (Mualem, 1976). The effective
saturation is defined as
Se ¼�ðhÞ � �s�s � �r
:
Hydraulic conductivity for the sandy soil in the aquifer was
measured in situ by the slug-test method (Bouwer & Rice,
1976), and the retention curve was derived from the particle-
size distribution (Arya et al., 1999).
The modelling
To quantify the effect of the presumed air compression on
infiltration, the experimental data were compared with numer-
ical simulations done with a single-phase one-dimensional
water flow model. The Hydrus model (Simunek et al., 1998)
employed for this calculation uses a numerical finite element
procedure to solve the Richards equation:
q�wqt
¼ qqz
Kqhqz
þ cos �
� �� �� S;
where �w is the volumetric water content, t is the time [T], h is
the pressure head [L], K is the hydraulic conductivity [LT�1], z
is the depth [L], � is the angle with a vertical axis, and S is a
sink or source term. The model was used (i) directly in forward
simulation with previously determined unsaturated hydraulic
parameters, and (ii) inversely to find out the best fitting par-
ameters. We did the actual fitting with Hydrus-2D (Simunek
et al., 1999), following the minimization of an objective func-
tion with a Marquardt–Levenberg algorithm. The considered
domain is a 3-m deep profile (2m of clayey soil and 1m of
aquifer), where the boundary conditions are both Dirichlet
conditions, namely the upper limit given by the ponding
water level in the plot and the lower level given by the depth
of the water table.
Results
Experimental data
Water budget. Recordings of the water inputs during the
cropping season, i.e. the precipitation and the irrigation
events, show that the total amount of water introduced in
Evidence of air entrapment in irrigated soil 495
# 2003 Blackwell Publishing Ltd, European Journal of Soil Science, 54, 491–503
the field was 3600m3, corresponding to 1.10m of water. Meas-
urements of the cumulative water level in the Muntz rings
show an equivalent amount of water, namely 1.06 and 1.07m
for stations 2 and 3 (Table 2). Despite the potential lateral loss
of water due to leakage throughout the field’s boundaries, the
estimation of the water inputs and the total water consump-
tion due to evapotranspiration and infiltration coincide. Dur-
ing the same period evapotranspiration was 0.95m at station 2
and 1.07m at station 3, corresponding to evaporation rates of
9.3mm day�1 and 10.6mm day�1, respectively, in agreement
with average values measured in this area for rice (Raes et al.,
1995; Boivin et al., 1999). This difference in evaporation rate
for the two stations is systematically recorded every year, and
arises mainly because station 3 is on the boundary of the plot
and of the irrigation scheme. It therefore was a drier and less
sheltered atmosphere than station 2, which is nearer to the
canal and in the centre of the plot. Infiltration was calculated
by integration of Equation (17b). Cumulative infiltration
reached 0.11m at station 2 and 0.0022m at station 3, over
the cropping season. Considering the accuracy of the measure-
ment method, the order of magnitude rather than the actual
value of this latter result has to be considered. The correspond-
ing average infiltration rates are, respectively, 12.8� 10�6 and
less than 1� 10�6mm s�1 (1.1mm day�1 and less than 0.1mm
day�1). These results are inconsistent with the order of magni-
tude of saturated hydraulic conductivity measured independ-
ently which ranged from 10�2 to 10�4mm s�1 (Table 1).
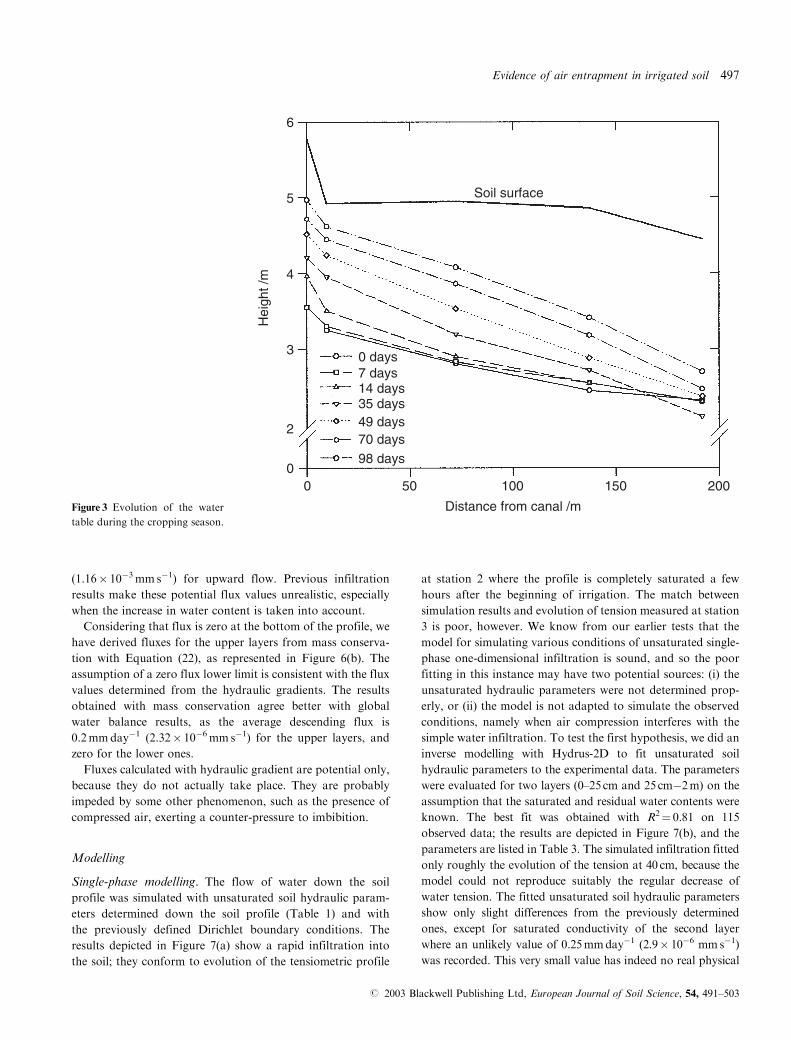
Piezometric results. The water table rose continuously during
the irrigation (Figure 3), presumably as a result of the water
added at the surface. However, it maintained a constant slope
from the canal towards the uncultivated area of about 1%.
This suggests that water table is supplied mainly by leaks from
the bottom of the canal.
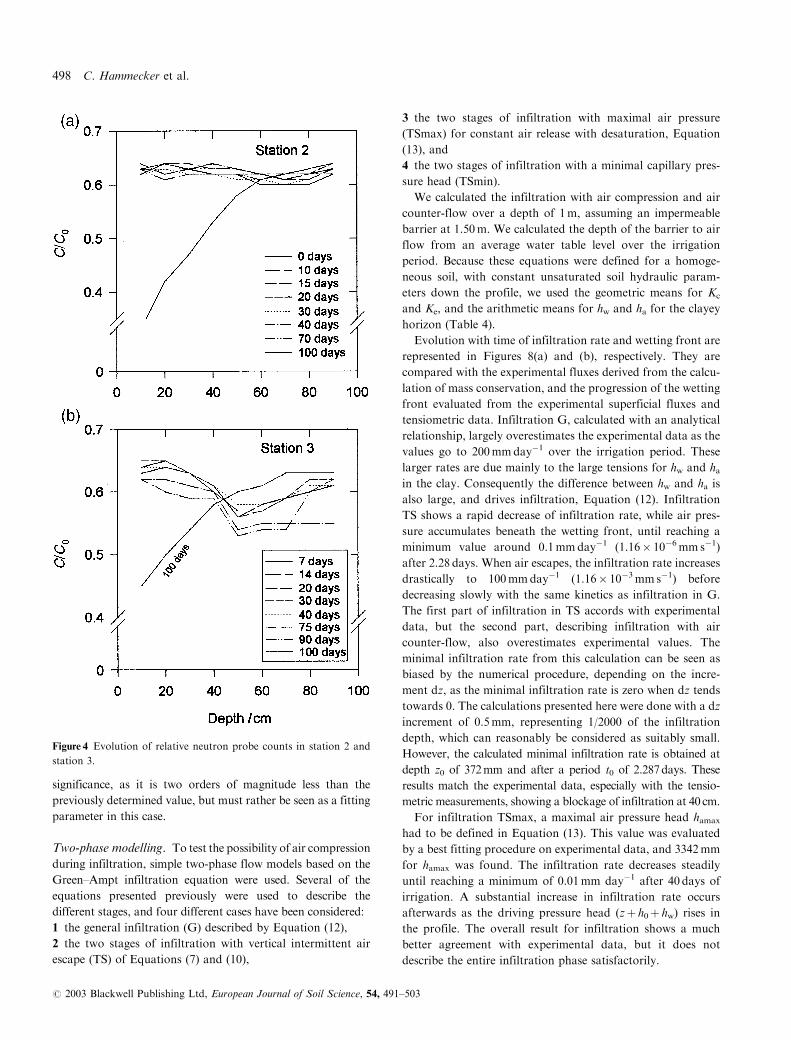
Water content profile. The soil at station 1, near the irriga-
tion canal, and at station 2 in the middle of the field (Figure 4a)
filled with water rapidly; after 1week of irrigation the soil
profiles became uniformly saturated (C/C0¼ 0.65) at these latter
stations. At station 3 the water content was distinctly depleted
at 50 cm (C/C0< 0.58) for 70days of the cropping season
(Figure 4b). At the end of the cropping season, when the super-
ficial layers had dried, the water profile became homogeneous.
The previously unsaturated zone at 50 cm depth saturated to a
C/C0 value of 0.62. This indicates a substantial retardation in
the water infiltration down the profiles because the wetting
front was blocked at around 50 cm.
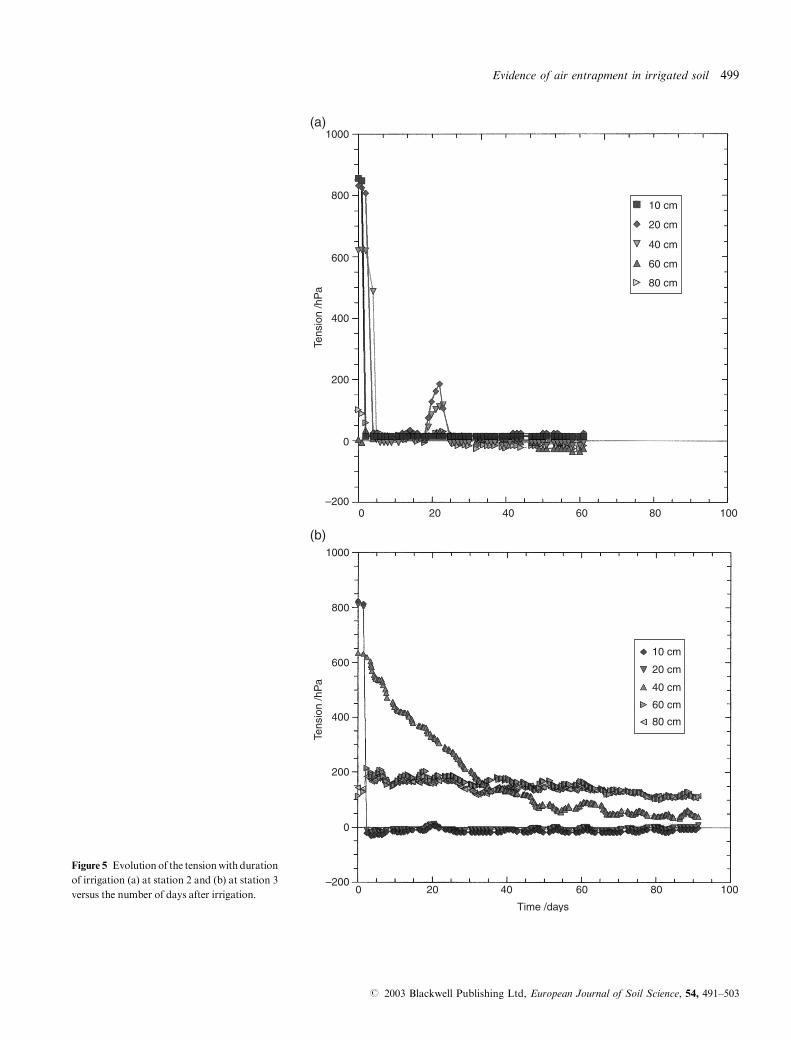
Tensiometric data. During the irrigation the water tension in
the soil profile at station 2 developed as expected: the tension
decreased sharply in the upper part of the profile for each
depth as the wetting front progressed with time (Figure 5a)
until saturation was reached. There was a short drought
20 days after the first irrigation, which corresponds to a halt
in the irrigation for application of fertilizer. Figure 5(b) shows
a similar behaviour at station 3, where the tensiometers at 10
and 20 cm follow the same pattern. However, at 40 cm the
tension decreased slowly in two stages: in the first 35 days the
tension decreased from 600 hPa to 100 hPa and it took a
further 50 days to reach 20 hPa. The tension in the two deeper
tensiometers remained constant during the entire experiment.
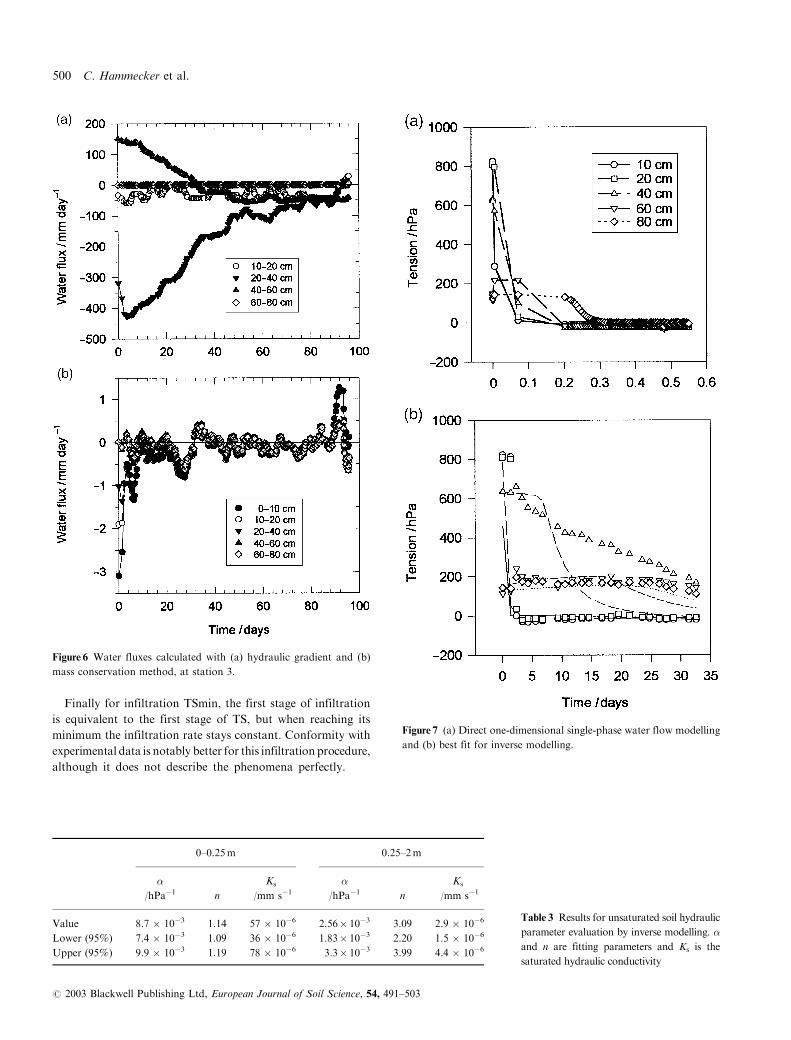
If we consider the hydraulic gradient and corresponding
hydraulic conductivity we can calculate the potential flux
between each instrumented node from Equation (20). The
results displayed in Figure 6(a) show that for the upper layers
(10–20 and 20–40 cm) water descended, whereas in the lower
ones (40–60 and 60–80 cm) it ascended or did not flow, in the
first 30 days after the beginning of irrigation. Consequently, a
zero-flux plane probably existed near 40 cm, where upward
and downward flows converge. Moreover, the flux in the
lower layers also equals zero as the tension at 60 and 80 cm
remained constant at 200 hPa during the irrigation. Below
40–50 cm the suction seems to have been unaffected by the
infiltration, unlike at station 2.
Potential fluxes derived from unsaturated soil parameters
and hydraulic gradients have values of up to 40 cmday�1
(4.63� 10�3mm s�1) for downward flow, and 10 cmday�1
Table 1 Unsaturated soil hydraulic parameters for the profile. �r repre-
sents the residual water content, �s is the saturated water content, �
and n are fitting parameters, Ks is the saturated hydraulic conductivity,
and d is the apparent soil density
a Ks d
Depth �r �s /hPa�1 n /mm s�1 /g cm�3
Surface 0 0.43 4.34� 10�3 1.22 3.80� 10�3 1.76
20 cm 0 0.39 1.25� 10�3 1.53 1.24� 10�3 1.72
40 cm 0 0.33 1.15� 10�3 2.65 0.349� 10�3 1.72
60 cm 0 0.34 1.24� 10�3 2.19 0.151� 10�3 1.74
80 cm 0 0.36 1.92� 10�3 1.13 0.464� 10�3 1.73
Aquifer 0.01 0.25 10� 10�3 1.54 50.0� 10�3 1.55
Table 2 Water budget at stations 2 and 3
Cumulative ET þ infiltration Cumulative ET Cumulative infiltration Average ET rate Average infiltration rate
/mm /mm s�1
Station 2 1061 949 111.6 107 � 10�6 12.8 � 10�6
Station 3 1072 1070 2.2 121 � 10�6 0.231 � 10�6
496 C. Hammecker et al.
# 2003 Blackwell Publishing Ltd, European Journal of Soil Science, 54, 491–503
(1.16� 10�3mm s�1) for upward flow. Previous infiltration
results make these potential flux values unrealistic, especially
when the increase in water content is taken into account.
Considering that flux is zero at the bottom of the profile, we
have derived fluxes for the upper layers from mass conserva-
tion with Equation (22), as represented in Figure 6(b). The
assumption of a zero flux lower limit is consistent with the flux
values determined from the hydraulic gradients. The results
obtained with mass conservation agree better with global
water balance results, as the average descending flux is
0.2mmday�1 (2.32� 10�6mm s�1) for the upper layers, and
zero for the lower ones.
Fluxes calculated with hydraulic gradient are potential only,
because they do not actually take place. They are probably
impeded by some other phenomenon, such as the presence of
compressed air, exerting a counter-pressure to imbibition.
Modelling
Single-phase modelling. The flow of water down the soil
profile was simulated with unsaturated soil hydraulic param-
eters determined down the soil profile (Table 1) and with
the previously defined Dirichlet boundary conditions. The
results depicted in Figure 7(a) show a rapid infiltration into
the soil; they conform to evolution of the tensiometric profile
at station 2 where the profile is completely saturated a few
hours after the beginning of irrigation. The match between
simulation results and evolution of tension measured at station
3 is poor, however. We know from our earlier tests that the
model for simulating various conditions of unsaturated single-
phase one-dimensional infiltration is sound, and so the poor
fitting in this instance may have two potential sources: (i) the
unsaturated hydraulic parameters were not determined prop-
erly, or (ii) the model is not adapted to simulate the observed
conditions, namely when air compression interferes with the
simple water infiltration. To test the first hypothesis, we did an
inverse modelling with Hydrus-2D to fit unsaturated soil
hydraulic parameters to the experimental data. The parameters
were evaluated for two layers (0–25 cm and 25 cm�2m) on the
assumption that the saturated and residual water contents were
known. The best fit was obtained with R2¼ 0.81 on 115
observed data; the results are depicted in Figure 7(b), and the
parameters are listed in Table 3. The simulated infiltration fitted
only roughly the evolution of the tension at 40 cm, because the
model could not reproduce suitably the regular decrease of
water tension. The fitted unsaturated soil hydraulic parameters
show only slight differences from the previously determined
ones, except for saturated conductivity of the second layer
where an unlikely value of 0.25mmday�1 (2.9� 10�6 mms�1)
was recorded. This very small value has indeed no real physical
0 days
Soil surface
Hei
ght /
m
7 days14 days35 days49 days70 days
98 days
00
3
4
5
6
2
50 100
Distance from canal /m
150 200
Figure 3 Evolution of the water
table during the cropping season.
Evidence of air entrapment in irrigated soil 497
# 2003 Blackwell Publishing Ltd, European Journal of Soil Science, 54, 491–503
significance, as it is two orders of magnitude less than the
previously determined value, but must rather be seen as a fitting
parameter in this case.
Two-phase modelling. To test the possibility of air compression
during infiltration, simple two-phase flow models based on the
Green–Ampt infiltration equation were used. Several of the
equations presented previously were used to describe the
different stages, and four different cases have been considered:
1 the general infiltration (G) described by Equation (12),
2 the two stages of infiltration with vertical intermittent air
escape (TS) of Equations (7) and (10),
3 the two stages of infiltration with maximal air pressure
(TSmax) for constant air release with desaturation, Equation
(13), and
4 the two stages of infiltration with a minimal capillary pres-
sure head (TSmin).
We calculated the infiltration with air compression and air
counter-flow over a depth of 1m, assuming an impermeable
barrier at 1.50m. We calculated the depth of the barrier to air
flow from an average water table level over the irrigation
period. Because these equations were defined for a homoge-
neous soil, with constant unsaturated soil hydraulic param-
eters down the profile, we used the geometric means for Kc
and Ke, and the arithmetic means for hw and ha for the clayey
horizon (Table 4).
Evolution with time of infiltration rate and wetting front are
represented in Figures 8(a) and (b), respectively. They are
compared with the experimental fluxes derived from the calcu-
lation of mass conservation, and the progression of the wetting
front evaluated from the experimental superficial fluxes and
tensiometric data. Infiltration G, calculated with an analytical
relationship, largely overestimates the experimental data as the
values go to 200mmday�1 over the irrigation period. These
larger rates are due mainly to the large tensions for hw and hain the clay. Consequently the difference between hw and ha is
also large, and drives infiltration, Equation (12). Infiltration
TS shows a rapid decrease of infiltration rate, while air pres-
sure accumulates beneath the wetting front, until reaching a
minimum value around 0.1mmday�1 (1.16� 10�6mm s�1)
after 2.28 days. When air escapes, the infiltration rate increases
drastically to 100mmday�1 (1.16� 10�3mm s�1) before
decreasing slowly with the same kinetics as infiltration in G.
The first part of infiltration in TS accords with experimental
data, but the second part, describing infiltration with air
counter-flow, also overestimates experimental values. The
minimal infiltration rate from this calculation can be seen as
biased by the numerical procedure, depending on the incre-
ment dz, as the minimal infiltration rate is zero when dz tends
towards 0. The calculations presented here were done with a dz
increment of 0.5mm, representing 1/2000 of the infiltration
depth, which can reasonably be considered as suitably small.
However, the calculated minimal infiltration rate is obtained at
depth z0 of 372mm and after a period t0 of 2.287days. These
results match the experimental data, especially with the tensio-
metric measurements, showing a blockage of infiltration at 40 cm.
For infiltration TSmax, a maximal air pressure head hamax
had to be defined in Equation (13). This value was evaluated
by a best fitting procedure on experimental data, and 3342mm
for hamax was found. The infiltration rate decreases steadily
until reaching a minimum of 0.01mm day�1 after 40 days of
irrigation. A substantial increase in infiltration rate occurs
afterwards as the driving pressure head (zþ h0þ hw) rises in
the profile. The overall result for infiltration shows a much
better agreement with experimental data, but it does not
describe the entire infiltration phase satisfactorily.
Figure 4 Evolution of relative neutron probe counts in station 2 and
station 3.
498 C. Hammecker et al.
# 2003 Blackwell Publishing Ltd, European Journal of Soil Science, 54, 491–503
1000
800
600
400
200
0
–200
Tens
ion
/hP
a
1000
800
600
400
200
0
–200
Tens
ion
/hP
a
10 cm
20 cm
40 cm
60 cm
80 cm
10 cm
20 cm
40 cm
60 cm
80 cm
0 20 40 60 80 100
0 20 40 60 80 100
Time /days
(a)
(b)
Figure 5 Evolution of the tensionwith duration
of irrigation (a) at station 2 and (b) at station 3
versus the number of days after irrigation.
Evidence of air entrapment in irrigated soil 499
# 2003 Blackwell Publishing Ltd, European Journal of Soil Science, 54, 491–503
Finally for infiltration TSmin, the first stage of infiltration
is equivalent to the first stage of TS, but when reaching its
minimum the infiltration rate stays constant. Conformity with
experimental data is notably better for this infiltration procedure,
although it does not describe the phenomena perfectly.
Figure 6 Water fluxes calculated with (a) hydraulic gradient and (b)
mass conservation method, at station 3.
Figure 7 (a) Direct one-dimensional single-phase water flow modelling
and (b) best fit for inverse modelling.
0–0.25m 0.25–2m
�
/hPa�1 n
Ks
/mm s�1
�
/hPa�1 n
Ks
/mm s�1
Value 8.7 � 10�3 1.14 57 � 10�6 2.56� 10�3 3.09 2.9 � 10�6
Lower (95%) 7.4 � 10�3 1.09 36 � 10�6 1.83� 10�3 2.20 1.5 � 10�6
Upper (95%) 9.9 � 10�3 1.19 78 � 10�6 3.3� 10�3 3.99 4.4 � 10�6
Table 3 Results for unsaturated soil hydraulic
parameter evaluation by inverse modelling. �
and n are fitting parameters and Ks is the
saturated hydraulic conductivity
500 C. Hammecker et al.
# 2003 Blackwell Publishing Ltd, European Journal of Soil Science, 54, 491–503
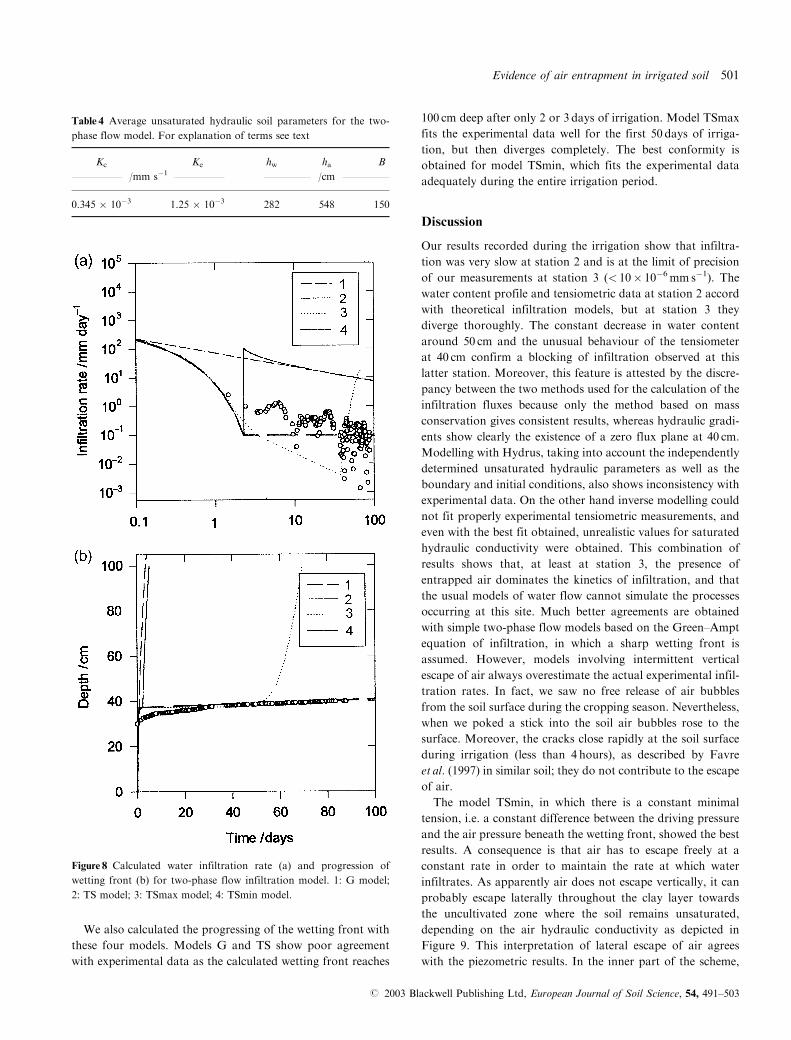
We also calculated the progressing of the wetting front with
these four models. Models G and TS show poor agreement
with experimental data as the calculated wetting front reaches
100 cm deep after only 2 or 3 days of irrigation. Model TSmax
fits the experimental data well for the first 50 days of irriga-
tion, but then diverges completely. The best conformity is
obtained for model TSmin, which fits the experimental data
adequately during the entire irrigation period.
Discussion
Our results recorded during the irrigation show that infiltra-
tion was very slow at station 2 and is at the limit of precision
of our measurements at station 3 (< 10� 10�6mm s�1). The
water content profile and tensiometric data at station 2 accord
with theoretical infiltration models, but at station 3 they
diverge thoroughly. The constant decrease in water content
around 50 cm and the unusual behaviour of the tensiometer
at 40 cm confirm a blocking of infiltration observed at this
latter station. Moreover, this feature is attested by the discre-
pancy between the two methods used for the calculation of the
infiltration fluxes because only the method based on mass
conservation gives consistent results, whereas hydraulic gradi-
ents show clearly the existence of a zero flux plane at 40 cm.
Modelling with Hydrus, taking into account the independently
determined unsaturated hydraulic parameters as well as the
boundary and initial conditions, also shows inconsistency with
experimental data. On the other hand inverse modelling could
not fit properly experimental tensiometric measurements, and
even with the best fit obtained, unrealistic values for saturated
hydraulic conductivity were obtained. This combination of
results shows that, at least at station 3, the presence of
entrapped air dominates the kinetics of infiltration, and that
the usual models of water flow cannot simulate the processes
occurring at this site. Much better agreements are obtained
with simple two-phase flow models based on the Green–Ampt
equation of infiltration, in which a sharp wetting front is
assumed. However, models involving intermittent vertical
escape of air always overestimate the actual experimental infil-
tration rates. In fact, we saw no free release of air bubbles
from the soil surface during the cropping season. Nevertheless,
when we poked a stick into the soil air bubbles rose to the
surface. Moreover, the cracks close rapidly at the soil surface
during irrigation (less than 4 hours), as described by Favre
et al. (1997) in similar soil; they do not contribute to the escape
of air.
The model TSmin, in which there is a constant minimal
tension, i.e. a constant difference between the driving pressure
and the air pressure beneath the wetting front, showed the best
results. A consequence is that air has to escape freely at a
constant rate in order to maintain the rate at which water
infiltrates. As apparently air does not escape vertically, it can
probably escape laterally throughout the clay layer towards
the uncultivated zone where the soil remains unsaturated,
depending on the air hydraulic conductivity as depicted in
Figure 9. This interpretation of lateral escape of air agrees
with the piezometric results. In the inner part of the scheme,
Table 4 Average unsaturated hydraulic soil parameters for the two-
phase flow model. For explanation of terms see text
Kc Ke hw ha B
/mm s�1 /cm
0.345 � 10�3 1.25 � 10�3 282 548 150
Figure 8 Calculated water infiltration rate (a) and progression of
wetting front (b) for two-phase flow infiltration model. 1: G model;
2: TS model; 3: TSmax model; 4: TSmin model.
Evidence of air entrapment in irrigated soil 501
# 2003 Blackwell Publishing Ltd, European Journal of Soil Science, 54, 491–503
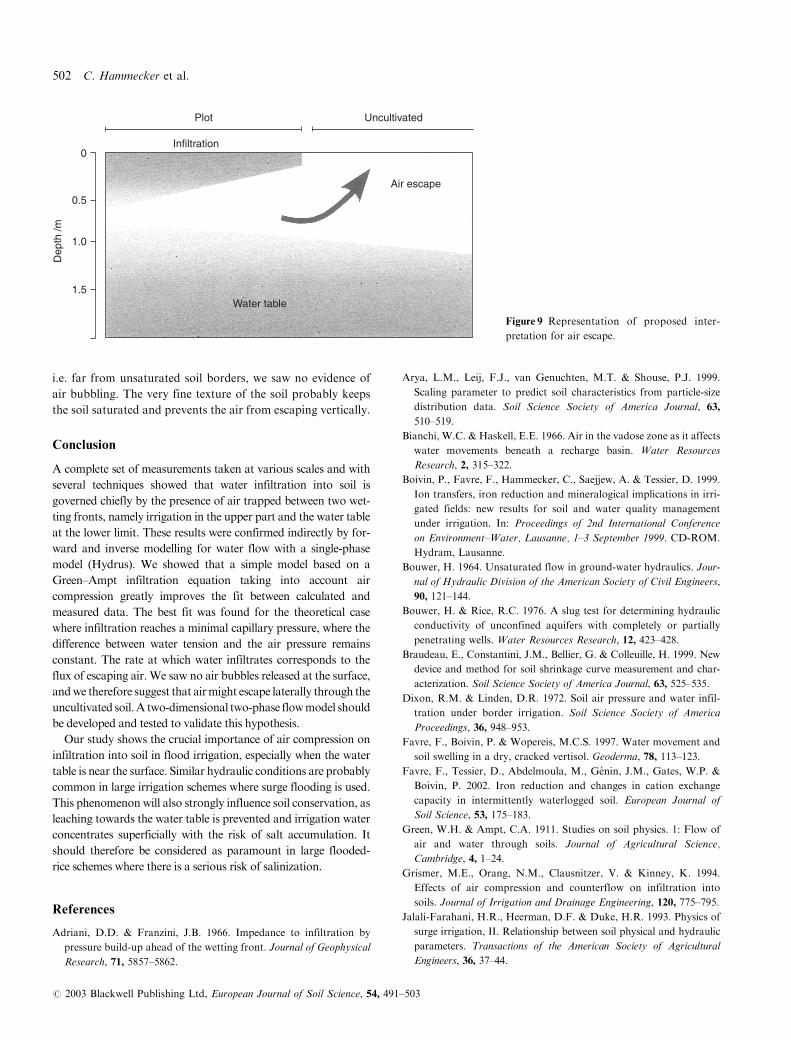
i.e. far from unsaturated soil borders, we saw no evidence of
air bubbling. The very fine texture of the soil probably keeps
the soil saturated and prevents the air from escaping vertically.
Conclusion
A complete set of measurements taken at various scales and with
several techniques showed that water infiltration into soil is
governed chiefly by the presence of air trapped between two wet-
ting fronts, namely irrigation in the upper part and the water table
at the lower limit. These results were confirmed indirectly by for-
ward and inverse modelling for water flow with a single-phase
model (Hydrus). We showed that a simple model based on a
Green–Ampt infiltration equation taking into account air
compression greatly improves the fit between calculated and
measured data. The best fit was found for the theoretical case
where infiltration reaches a minimal capillary pressure, where the
difference between water tension and the air pressure remains
constant. The rate at which water infiltrates corresponds to the
flux of escaping air. We saw no air bubbles released at the surface,
andwe therefore suggest that airmight escape laterally through the
uncultivated soil.A two-dimensional two-phase flowmodel should
be developed and tested to validate this hypothesis.
Our study shows the crucial importance of air compression on
infiltration into soil in flood irrigation, especially when the water
table is near the surface. Similar hydraulic conditions are probably
common in large irrigation schemes where surge flooding is used.
This phenomenon will also strongly influence soil conservation, as
leaching towards the water table is prevented and irrigation water
concentrates superficially with the risk of salt accumulation. It
should therefore be considered as paramount in large flooded-
rice schemes where there is a serious risk of salinization.
References
Adriani, D.D. & Franzini, J.B. 1966. Impedance to infiltration by
pressure build-up ahead of the wetting front. Journal of Geophysical
Research, 71, 5857–5862.
Arya, L.M., Leij, F.J., van Genuchten, M.T. & Shouse, P.J. 1999.
Scaling parameter to predict soil characteristics from particle-size
distribution data. Soil Science Society of America Journal, 63,
510–519.
Bianchi, W.C. & Haskell, E.E. 1966. Air in the vadose zone as it affects
water movements beneath a recharge basin. Water Resources
Research, 2, 315–322.
Boivin, P., Favre, F., Hammecker, C., Saejjew, A. & Tessier, D. 1999.
Ion transfers, iron reduction and mineralogical implications in irri-
gated fields: new results for soil and water quality management
under irrigation. In: Proceedings of 2nd International Conference
on Environment–Water, Lausanne, 1–3 September 1999. CD-ROM.
Hydram, Lausanne.
Bouwer, H. 1964. Unsaturated flow in ground-water hydraulics. Jour-
nal of Hydraulic Division of the American Society of Civil Engineers,
90, 121–144.
Bouwer, H. & Rice, R.C. 1976. A slug test for determining hydraulic
conductivity of unconfined aquifers with completely or partially
penetrating wells. Water Resources Research, 12, 423–428.
Braudeau, E., Constantini, J.M., Bellier, G. & Colleuille, H. 1999. New
device and method for soil shrinkage curve measurement and char-
acterization. Soil Science Society of America Journal, 63, 525–535.
Dixon, R.M. & Linden, D.R. 1972. Soil air pressure and water infil-
tration under border irrigation. Soil Science Society of America
Proceedings, 36, 948–953.
Favre, F., Boivin, P. & Wopereis, M.C.S. 1997. Water movement and
soil swelling in a dry, cracked vertisol. Geoderma, 78, 113–123.
Favre, F., Tessier, D., Abdelmoula, M., Genin, J.M., Gates, W.P. &
Boivin, P. 2002. Iron reduction and changes in cation exchange
capacity in intermittently waterlogged soil. European Journal of
Soil Science, 53, 175–183.
Green, W.H. & Ampt, C.A. 1911. Studies on soil physics. 1: Flow of
air and water through soils. Journal of Agricultural Science,
Cambridge, 4, 1–24.
Grismer, M.E., Orang, N.M., Clausnitzer, V. & Kinney, K. 1994.
Effects of air compression and counterflow on infiltration into
soils. Journal of Irrigation and Drainage Engineering, 120, 775–795.
Jalali-Farahani, H.R., Heerman, D.F. & Duke, H.R. 1993. Physics of
surge irrigation, II. Relationship between soil physical and hydraulic
parameters. Transactions of the American Society of Agricultural
Engineers, 36, 37–44.
0
0.5
1.0
1.5
Plot Uncultivated
Infiltration
Air escape
Water table
Dep
th /m
Figure 9 Representation of proposed inter-
pretation for air escape.
502 C. Hammecker et al.
# 2003 Blackwell Publishing Ltd, European Journal of Soil Science, 54, 491–503
Jarett, A.R., Hoover, J.R. & Paulson, C.D. 1980. Subsurface drainage,
air entrapment, infiltration in sand. Transactions of the American
Society of Agricultural Engineers, 80, 1424–1433.
Kool, J.B. & Parker, J.C. 1987. Development and evaluation of closed-
form expressions for hysteresic soil hydraulic properties. Water
Resources Research, 23, 105–114.
Latifi, H., Prasad, S.N. & Helweg, O.J. 1994. Air entrapment and
water infiltration in two-layered soil column. Journal of Irrigation
and Drainage Engineering, 120, 871–891.
Linden, D.R., Dixon, R.M. & Guitjens, J.C. 1977. Soil air pressure
under successive irrigations and simulated rain. Soil Science, 124,
135–139.
Morel-Seytoux, H.J. & Khanji, J. 1974. Derivation of an equation of
infiltration. Water Resources Research, 10, 795–800.
Mualem, Y. 1976. A newmodel for predicting the hydraulic conductivity
of unsaturated porous media.Water Resources Research, 12, 513–522.
Nielsen, D.R. & Luckner, L.M. 1992. Theoretical aspects to estimate
reasonable initial parameters and range limits in identification
procedures for soil hydraulic properties. In: Proceedings of International
Workshop on Indirect Methods for Estimating the Hydraulic Properties
of Unsaturated Soils (eds M.T. van Genuchten, F.J. Leij & L.J. Lund),
pp. 147–170. University of California, Riverside, CA.
Perroux, K.M. & White, I. 1988. Designs for disc permeameters. Soil
Science Society of America Journal, 52, 1205–1215.
Raes, D., Sy, B. & Deckers, J. 1995. Simulation of irrigation water
requirements of rice schemes in the Senegal river delta and valley.
In: Irrigated Rice in the Sahel: Prospects for Sustainable Development
(eds K.M. Miezan, M.C.S. Wopereis, M. Dingkhun, J. Deckers &
T.F. Randolph), pp. 411–419. Saint-Louis, Senegal.
Richards, L.A. 1931. Capillary conduction of liquids in porous media.
Physics, 1, 318–333.
Simunek, J., Huang, K. & van Genuchten, M.T. 1998. The HYDRUS
Code for Simulating the One-dimensional Movement of Water, Heat,
and Multiple Solutes in Variably-saturated Media, Version 6.0.
Research Report No 144, US Salinity Laboratory, US Department
of Agriculture, Riverside, CA.
Simunek, J., Sejna, M. & van Genuchten, M.T. 1999. The HYDRUS-
2D Software Package for Simulating the Two-dimensional Movement
of Water, Heat, and Multiple Solutes in Variably-saturated Media,
Version 2.0. US Salinity Laboratory, US Department of Agricul-
ture, Riverside, CA.
Smettem, K.R.J. & Clothier, B.E. 1989. Measuring unsaturated sorp-
tivity and hydraulic conductivity using multiple disc permeameters.
Journal of Soil Science, 40, 563–568.
Starr, J.L., Deroo, H.C., Frink, C.R. & Parlange, J.-Y. 1978. Leaching
characteristics of a layered field soil. Soil Science Society of America
Journal, 42, 386–391.
Touma, J. & Vauclin, M. 1986. Experimental and numerical analysis
of two-phase infiltration in partially saturated soil. Transport in
Porous Media, 1, 27–55.
Touma, J., Vachaud, G. & Parlange, J.-Y. 1984. Air and water flow in
a sealed, ponded vertical column: experiment and model. Soil
Science, 137, 181–187.
Vachaud, G., Gaudet, J.P. & Kuraz, K. 1974. Air and water flow
during ponded infiltration in a bounded column of soil. Journal of
Hydrology, 22, 89–108.
Van Genuchten, M.T. 1980. A closed-form equation for predicting the
hydraulic conductivity of unsaturated soils. Soil Science Society of
America Journal, 44, 892–898.
Van Genuchten, M.T., Leij, F.J. & Yates, S.R. 1991. The RETC Code
for Quantifying the Hydraulic Functions of Unsaturated Soils. US
Department of Agriculture, Riverside, CA.
Wang, Z., Feyen, J., Nielsen, D.R. & van Genuchten, M.T. 1997.
Two-phase flow infiltration equations accounting for air entrap-
ment effects. Water Resources Research, 33, 2759–2767.
Wang, Z., Feyen, J., van Genuchten, M.T. & Nielsen, D.R. 1998. Air
entrapment effects on infiltration rate and flow instability. Water
Resources Research, 34, 213–222.
Wind, G.P. 1968. Capillary conductivity data estimated by a simple
method. In: Water in the Unsaturated Zone (eds P.E. Rijtema &
H. Wassink), pp. 181–191. International Association of Scientific
Hydrology, Gentbrugge, Belgium.
Evidence of air entrapment in irrigated soil 503
# 2003 Blackwell Publishing Ltd, European Journal of Soil Science, 54, 491–503