Co-current air-water flow in downward sloping pipes - CiteSeerX
Public Choice 45:19-34 (1985). © 1985 Martinus Nijhoff Publishers, Dordrecht. Printed in the Netherlands.
Expenditures and votes: In search of downward-sloping curves in the United States and Great Britain*
A L F R E D G. CUZA.N**
R I C H A R D J. HEGGEN***
Abstract
An earlier paper showed a negative relation between increases and accelerations in F, the ratio of federal expenditures to GNP and E, the reelection or defeat of the incumbent party in the White House over the last 100 years. This paper argues that there also exists a negative rela- tion between V, the percentage of the popular vote cast for the incumbents, and F. This func- tion is displaced by wars and depressions and can drift over time, making it difficult to discover negative curves in the data. Dividing British and US data for the last 50 years into party periods yields clearly discernable negative functions for F and V for the incumbents.
Introduction
In an earlier paper on federal expenditures and presidential elections in the United States (US), we found that in 21 of the last 26 elections, fiscal ex- pansion was followed by the defeat of the incumbents and fiscal cut-back by their reelection (Cuz~n and Heggen, 1982). Those findings are consis- tent with Niskanen, who found a negative relation between real per capita federal expenditures and percent of the vote won by the incumbent party in the White House (Niskanen, 1979).
In this paper, we show that fiscal policy and election results in Great Bri- tain (GB) since 1935 behave in much the same way as in the US. We explain why fiscal expansion politically damages the incumbents with an economic model of expenditures and votes. The model incorporates a number of con-
* An earlier version was presented before the 1983 meeting of the Public Chocie Society, Savannah, 24 March. The authors wish to thank Gordon Tullock, whose relentless criticism did much to improve the paper. Thanks also to Arthur Doerr, James Witt, and others at The University of West Florida for their encouragement. Thanks, finally, to Judy Peters and Dale Ganus for typing many drafts of this manuscript.
** Department of Political Science, The University of West Florida, Pensacola, FL 32514.
*** Department of Civil Engineering, University of New Mexico, Albuquerque, NM 87131.

20
cepts and hypotheses familiar to Public Choice readers. These are Wagner's Law, Peacock and Wiseman's displacement effect, Downsian two-party competition, Niskanen's budget maximizers, Tullock's politi- cian, and the median-voter theorem.
The model: I
Table 1 describes five variables that make up the model. Three of the variables are fiscal: F, the ratio of expenditures to GNP; P, the change in F between election years; and ~, the change in ~ between election years. These variables are equivalent to the physical concepts of relative position, velocity, and acceleration/deceleration, respectively. The electoral variables are V, percent of the vote received by the party's candidate; E, reelection or defeat of the incumbent party; and P, percent of parliamen- tary seats won by the incumbent party in GB.
The functioning of the model rests on two fundamental hypotheses. The first is that F and V are negatively related as shown in Figure 1. F and V are inversely related because they are equivalent to a fiscal 'price' charged
Table 1. Fiscal and electoral variables, United States and Great Britain
Country
Variable United States Great Britain
Central $overnment expenditures. F F = Gross National Product
P
P
I-"
E
F - F~ - F i - t d F / F
F t - 1 - d t
where t is an election year and t - 1 a previous election year
¢ = ¢,-¢,_,
Percent of the popular vote won by incumbent party in the White House
Percent of the popular vote won by party that controls the Cabinet
Percent of parliamentary seats won by party that controls the Cabinet
Election outcome for incumbents, coded +1 (reelections) or - 1 (defea t)

21
>
~0
F'~ F, Expenditures /GNP
Figure 1. Expenditures and votes: A negative demand function for incumbents
the economy by the government, and to political 'demand' for the incum- bent party, respectively. According to the first law of demand, the higher the price, the smaller the quantity purchased or consumed. Hence, the higher F, the smaller the support found for the incumbents in general elec- tions (and, we might add, for 'government' in general). This presumes that if the price (F) is too high, the individual voter registers his displeasure by voting for any party but the incumbents. Hence, a downward-sloping political demand function expresses the relationship between F and V. This is shown by the D curve in Figure 1.
The second hypothesis of the model is that the incumbent party wishes to maximize expenditures provided it receives sufficient votes to be re- elected. This is similar to the desire of a firm to charge the highest possible price while remaining competitive in the market. Whereas the firm utilizes revenues to cover costs and make a profit, the incumbent party allocates expenditures to reduce interest-group pressure, reward its leaders and sup- porters, and influence public policy. Some parties may sacrifice reelection in order to exert an extraordinary influence on public policy or society for a short period, but, in general, parties seek to discover how much they can spend without incurring defeat. Thus, the model combines the Downsian notion of reelection-minded parties with Niskanen's budget maximization bureaucracy. The incumbent party, hoping to be reelected, yields to the bureaucracy but only up to a point, raising F no more than can be done and still retain power.
In a two-party democracy, where the incumbents are defeated if they fail to win at least 50% of the vote F grows until it reaches F*, at a V of half the votes cast. F* is the optimal or equilibrium level of expenditures for the

22
incumbent party. Beyond F* it is defeated; below F* it can spend more and still get sufficient votes for reelection. Note that F* splits the electorate in
half - those who prefer a higher and those who prefer a lower F. The
equilibrium level F* belongs to the median voter, as in other public choice models (Buchanan and Flowers, 1980).
This concludes the initial description of the model. In the following sec- tion, we test fiscal-electoral hypotheses derived from the model with American and British data. After that, we return to the model for addi- tional theoretical specification. Then we do additional testing. We con-
clude with general observations about expenditures and votes.
Hypothesis testing: I
In the earlier paper, we tested for a negative F - V function by examining
the effects of/+ and /~ on E. fl' and ~ represent the incumbent party 's fiscal policy relative to its predecessors. Different combinations of values for
these two variables make up different kinds of policies, as shown in Table 2.
Table 2 also shows our hypothesized electoral effects of each policy. On
t h e basis of a negative relation between F and V, and assuming F is near or at equilibrium, we hypothesize that expansionary policies will result in
defeat and cutback policies in reelection of the incumbents.
An expansionary policy is one in which e i t he r /+o r /~o r both are positive
and neither is negative.
A cut-back policy is one where ~+, P, or both are negative. Even in the
case where/+ is positive, if P is negative there has been a reduction in the rate of growth (velocity) in F, i.e., a deceleration. That is a form of fiscal
cutback. A third policy, the steady-state ' occurs when both fl' and 2 ~ are close to
zero. For the purpose of this paper, these variables take a value of zero if they fall between - 2 and +2.
Table 2. Fiscal policies and hypothesized election outcomes
Fiscal policy /e_/~ combination Hypothesized election outcome
Expansionary fl' or ff greater than zero Defeat but neither less than z e r o
Either ~ or ff less than zero
/e and P equal to zero
Cut-back Reelection
Steady-state Indeterminate

T a b l e 3. Fiscal policy and election outcome, United States, 1880-1980
23
Fiscal policy
Election o u t c o m e Expansionary Cut-back Total
Reelection 2 i 2
Defeat " 9 3
To ta l I I 15
Chi square = 9.64: d f = I
Significant at .005 level
14
12
26
Source: Appendix A,
T a b l e 4. Fiscal policy and election outcome. United States, 1936-1980
Fiscal policy
Election outcome Expansionary Cut-back Total
Reelection I 6 7
Defeat 4 1 5
Total 5 7 12
Chi square = 5.09; d f = I
Significant at .05 level
Source: Appendix A.
T a b l e 5. Fiscal policy and election outcome, Great Britain, 1935-1979
Fiscal policy
Election outcome Expansionary Cut-back Total
Reelection I 4 5
Defeat 4 2 6
Total 5 6 i I
Chi square: 2.49: d f = I
Significant at .15 level
Source: Appendix B.

24
We test the hypothesis shown in Table 2 with data from the US and GB assembled in the appendices. The US data include 26 elections held be- tween 1880 and 1980. The data on GB include only 11 elections between 1935 and 1979, a period with a two-party system similar to the US. In the 1983 election, the two-party system broke down in GB. But for much of the period after 1935, elections were decided between the Labor and Con- servative parties. (See also the Appendix for additional comments on British elections.)
Tables 3, 4 and 5 present data on fiscal policy and election outcome for the United States and Great Britain. Table 3 includes all 26 American elec- tions held between 1880 and 1980 while Table 4 includes only the 12 elec- tions held since 1936. This period is nearly coterminous with that of Table 5, which includes 11 British elections held between 1935 and 1979.
Chi-square analysis shows that the relationship between fiscal policy and election outcome is significant and in the direction we hypothesized. Fiscal expansion is usually followed by the defeat of the incumbents while fiscal cutbacks are normally followed by reelection. The relationship is stronger in the US than in GB. Eighty percent of the American elections and nearly 75% of the British elections conform to our expectations.
It is interesting to note that we did not find a single administration that pursued a steady state policy. There was always some policy change. This may reflect a political preference to distinguish every administration from its predecessor.
The model: II
Up to now we have discussed the political demand function as if the D curve in Figure 2 remained static over time. In this section of the paper we examine changes in the position of the curve caused by the 'displacements' of wars and depressions, secular forces like Wagner's Law, and changes in the legitimacy of the government. In the next section we search British and American history during the last 50 years for evidence of migrations or shifts in the fiscal demand curves of these two countries.
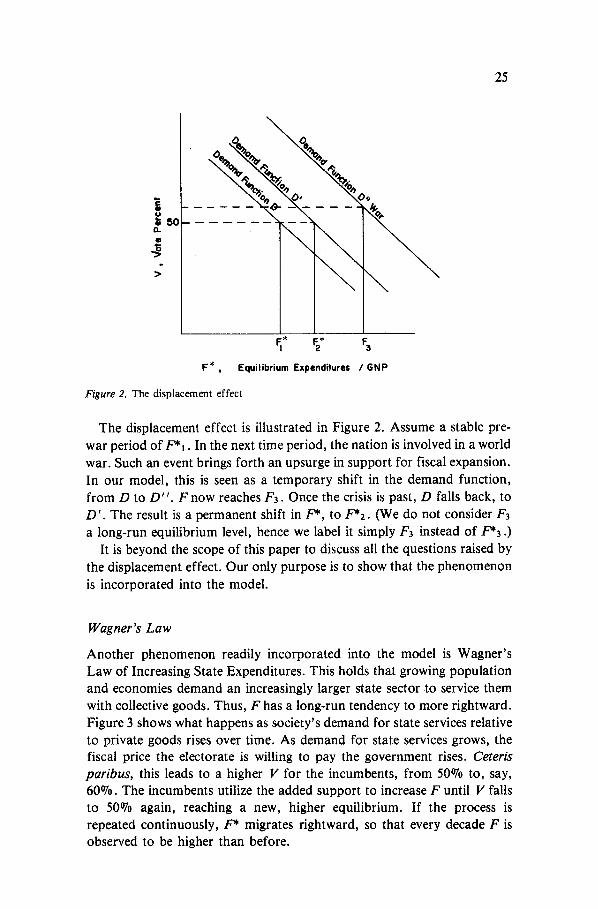
The displacement effect
Peacock and Wiseman (1961) and Kendrick (1955) noted the displacements in F caused by war or depression. During such periods of political and economic upheaval, F is known to take values much higher than what had been considered normal up to that time. After the crisis is over, F drops but settles at a level higher than before. They conclude that wars and depressions have a 'displacement' effect on F.
25
50
o
>
_
V F * , Equilil)tium Exl~enditure$ / ~ N P
Figure 2. The displacement effect
The displacement effect is illustrated in Figure 2. Assume a stable pre- war period of F*1. In the next time period, the nation is involved in a world war. Such an event brings forth an upsurge in support for fiscal expansion. In our model, this is seen as a temporary shift in the demand function, from D to D " . Fnow reaches F3. Once the crisis is past, D falls back, to D' . The result is a permanent shift in F*, to F*2. (We do not consider F3 a long-run equilibrium level, hence we label it simply F~ instead of F*a .)
It is beyond the scope of this paper to discuss all the questions raised by the displacement effect. Our only purpose is to show that the phenomenon is incorporated into the model.
Wagner's Law
Another phenomenon readily incorporated into the model is Wagner's Law of Increasing State Expenditures. This holds that growing population and economies demand an increasingly larger state sector to service them with collective goods. Thus, F has a long-run tendency to more rightward. Figure 3 shows what happens as societY'S demand for state services relative to private goods rises over time. As demand for state services grows, the fiscal price the electorate is willing to pay the government rises. Ceteris paribus, this leads to a higher V for the incumbents, from 50°70 to, say, 6007o. The incumbents utilize the added support to increase F until V falls to 50070 again, reaching a new, higher equilibrium. If the process is repeated continuously, F* migrates rightward, so that every decade F is observed to be higher than before.

26
I .o _°%,, \
o .
!-t . . . .
~.* E* E* t I I~ t 3
F*, Equilibrium Expenditures /GNP
Figure 3. Wagner's Law
There is considerable debate over the universality of Wagner's Law. It appears to hold only for some countries and for certain periods of time (Buchanan and Flowers, 1980). For our purposes, it is sufficient to show that Wagner's Law can be easily added to the model.
Changes in legitimacy
In another paper, we argued that the optimal F for any government depends on its legitimacy (Heggen and Cuz~in, 1981). The legitimacy of government has to do with the opinion its leaders, processes, and policies enjoy among the citizenry. It is roughly equivalent to its quality. The higher the public regards this to be, the higher F they support, ceteris paribus.
It seems reasonable to hypothesize that legitimacy grows with policy suc- cesses, victory in war, and the prestige of a nation's leaders. Conversely, defeat in war, reduced confidence in public officials, and perceived policy failures work in the opposite direction. These changes in attitudes and perceptions are influenced by ideology. Historically, a government's legitimacy can rise or fall, rise again, and so on in response to changes in ideology and events. This would have a pendulum effect on the D curve and, hence, F*.
To sum up: The political demand curve does not stand still. Rather, it shifts and migrates in response to parameter changes. Three important para- meters are: the occurrence of war, depression, or other major crisis; popula- tion and economic growth; and the legitimacy of the government.
27
5 0
4 0
~0 I~.
z ~ ,
• ~ ~0 I~
I0
© Reelection • Defeat
-~ G.B.
o . ~ , . . ~ = ,~ $ ~ ~ • _ ~ ~ ~ ~ _ ~ ~ ~ • •
YEAR
Figure 4. F and E, Grea t Britain and the Uni ted States, 1928-1980
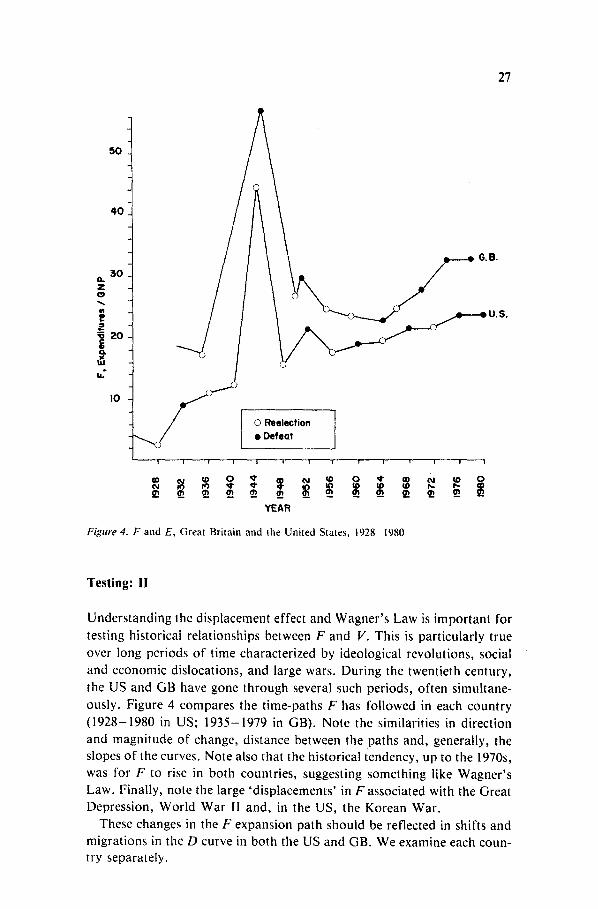
Testing: I!
Understanding the displacement effect and Wagner's Law is important for testing historical relationships between F and V. This is particularly true over long periods of time characterized by ideological revolutions, social and economic dislocations, and large wars. During the twentieth century, the US and GB have gone through several such periods, often simultane- ously. Figure 4 compares the time-paths F has followed in each country (1928-1980 in US; 1935-1979 in GB). Note the similarities in direction and magnitude of change, distance between the paths and, generally, the slopes of the curves. Note also that the historical tendency, up to the 1970s, was for F to rise in both countries, suggesting something like Wagner's Law. Finally, note the large 'displacements' in F associated with the Great Depression, World War II and, in the US, the Korean War.
These changes in the F expansion path should be reflected in shifts and migrations in the D curve in both the US and GB. We examine each coun- try separately.
28
o
q
%
%
~o °~a
0 Reelection
• Defeat _eT~ Korean War " I I
• %
4 e 8 IO 12 14 16 18 20 ~2 24, ~q
F, Expenditures / GN P
Figure 5. F and V, United States, 1928-1980
05, WW II
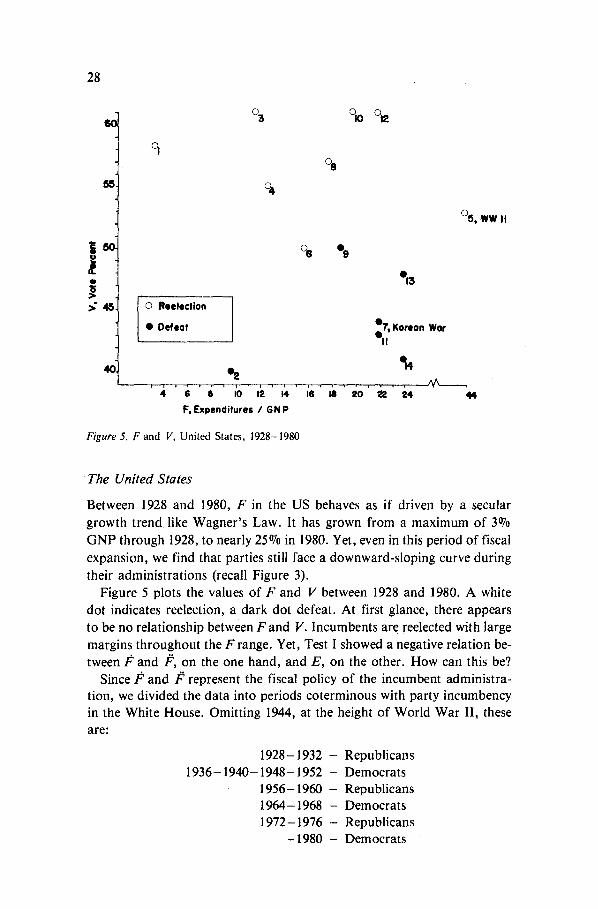
T h e United States
Between 1928 and 1980, F in the US behaves as if driven by a secular growth trend like Wagner's Law. It has grown from a maximum of 3% GNP through 1928, to nearly 25% in 1980. Yet, even in this period of fiscal expansion, we find that parties still face a downward-sloping curve during their administrations (recall Figure 3).
Figure 5 plots the values of F and V between 1928 and 1980. A white dot indicates reelection, a dark dot defeat. At first glance, there appears to be no relationship between F and V. Incumbents are reelected with large margins throughout the F range. Yet, Test I showed a negative relation be- tween ~¢ and ~, on the one hand, and E, on the other. How can this be?
Since fl" and /~ represent the fiscal policy of the incumbent administra- tion, we divided the data into periods coterminous with party incumbency in the White House. Omitting 1944, at the height of World War II, these are:
1928-1932 - Republicans 1936-1940-1948-1952 - Democrats
1956-1960 - Republicans 1964-1968 - Democrats 1972-1976 - Republicans
- 1 9 8 0 - Democrats

29
SO
55
"~ 50
• II. • ~ ,~
40
©
R Rqx~licon
D Oemocrot
c~Reslection
• Defeat
~ 2 4 6 8 I0 12 14 16 18 20 22 2~.
F, Expenditures / G N P
Figure 6. F and V, by Party incumbency, the United Stales, 1928-1980
Ol4 0
©5,WW IT
,;4
When the data are arranged this way, five downward sloping curves
emerge, one for every administration but the last (see Figure 6). The
average weighted slopes of these curves is - 5 . Thus, incumbents have lost an average of 5% points in V for every percent point F has increased
during their terms in office. The D curve appears to have shifted in the US four times: 1936, 1956,
1964 and 1972. These were years in which a new administration was first
reelected. In every case, the reelection followed a deceleration in F; in only
one case did F actually increase (see Appendix A). These facts provide clues as to how Wagner 's Law manifests itself
politically. Over time, population and economic growth add to the reser- voir of fiscal support held by the electorate. However, the accumulating
support is not released immediately. Rather, it builds up until two things happen:
(1) The incumbents are defeated and; (2) The new administration implements a cut-back policy.
Thus it appears that the electorate can be persuaded to support greater spending but only by a new administration that provides them with fiscal relief. This process is facilitated by the fact that a new administration brings youthful enthusiasm, fresh speeches and modern arguments for legi- timating additional spending.

30
Note that following every reelection held during peacetime since 1928, F increased. This supports our hypothesis that the incumbents are willing to sacrifice support in excess of 50% for additional spending.
The one administration that does not fit the historical pattern is Carter's Democratic administration, the last in the series. This is the first time in nearly 50 years that the D curve did not shift rightward during a newly- elected administration. Perhaps this was a random aberration. However, we cannot rule out the possibility that the D curve has stopped its historic rightward drift in the US. The political and diplomatic defeat suffered by the US in the Vietnam War, together with the Watergate scandals and sub- sequent revelations of corruption and immorality under Kennedy, John- son, and Nixon, have probably eroded the legitimacy of the presidency and the federal government as a whole. Greater skepticism about the usefulness of federal expenditures among intellectuals may have also contributed to the erosion of fiscal legitimacy among the public.
If this analysis is correct, F has reached the limits of its growth in the US for some time. Barring another patriotic war or some other displace- ment, F* is likely to remain close to 22%. Therefore, parties will probably not be reelected unless F stays at our below it. This is about where it was in 1976, when Ford's Republicans were defeated in a close election.
Our estimate of F* in the US does not augur well for the reelection of Reagan's Republicans. In 1984, F is projected to be 24%, above what a majority will support with their votes.
Great Britain
Unlike the US, GB does not seem to show any evidence of Wagner's Law. However, a war-related displacement is evident, as Figure 7 shows.
The first election, held in 1935, has the lowest F and one of the highest V in the data. The next election, held l0 years later, has the highest F and the lowest V in the data. This represents the loss of support incurred by Churchill's Conservatives during the enormous fiscal expansion of World War II. Victory over Hitler was not sufficient for reelection. After the war, F fell to a level above its value before the war.
The remaining elections, held between 1950 and 1979, are enclosed in a rectangle. Note that eight of the ten elections in the rectangle describe a downward-sloping curve with a slope of approximately -2. This is less than in the US, which suggests that in GB voters are less sensitive to changes in F. Whether this reflects cultural or institutional differences is beyond the scope of this paper to determine. Probably both forces are at work. The socialist ideology is older and more generally accepted in GB than in the US, and the parliamentary system weakens the tie between ex- penditures and votes because the executive is not independently elected by the people.

31
50
45
4 o .
•
01 o~
~ o!|
\® I0,
o Reelection • Oefeot
I
' ~ ' ~0' ~ ' ' ~ ' ~ ' ~ ' ~ ' ~ ' F, ~pendl~res /GNP
~, Approximole
lee Appendi~ 8
• 2
"~ ~s
Figure 7. F and V, Great Britain, 1935-1983
F* and the 1983 election in GB
From Figure 7, we calculate that F* in GB is no higher than 25%. In 1983, F is somewhere around 32%, considerably above what a majority of the voters support. This is reflected in the June election results. Thatcher's Conservatives received only 42°/0 o f the vote. But because the two-party system has broken down, a majority of the electorate almost evenly split its vote between the Labour party and the Social Democracy Alliance. By winning a plurality in well over half the Parliamentary seats, the Conser- vatives were reelected by what some newspapers called 'a landslide'. In the US, where the executive is elected by the people and the two-party system prevails, a V of 42% would be a serious defeat for the incumbents (e.g., the Democrats in 1968).
Actually, Thatcher received more votes than she should have, given the curve inFigure 7. The six extra percent points in V could be partially at- tributed to Britain's military victory in the Falklands. Whether this will turn out to be a permanent displacement of the D curve remains to be seen.
Summary and conclusion
We have found that fiscal expansion erodes the political support of the in- cumbents in the United States and Great Britain.
These findings may come as a surprise to many readers. Indeed, there appears to be an ingrained 'conventional wisdom' that spending gets politi-

32
clans elected. If so, shouldn't greater spending be rewarded, rather than punished at the polls?
This paradox, however, is more apparent than real. While spending does find support among constituencies and the public at large, ~it does not follow that more spending yields greater support. When F rises, for every vote gained in the bureaucracy and interest groups, more than one vote is lost in the electorate at large.
If our analogy with economics is valid, a negative function between ex- penditures and votes is understandable. When expenditures grow faster than GNP, F rises. This raises the fiscal price of government to the economy. Like rational consumers, the electorate responds by withdrawing support for the incumbents. This is the most practical means for voters in a democracy to reveal their unwillingness to pay the greater costs of addi- tional spending. (In a non-democratic government, additional spending would generate additional opposition, necessitating the imposition of greater coercion by government. See Heggen and Cuz~n, 1981.)
Our research suggests that a two-party presidential system reflects more directly and accurately the expenditure-vote relationships than a multi- party parliamentary system. This should give pause to those political scien- tists who regard the British system as superior to the American. Our research also should give encouragement to those who balk at greater government spending in either country. They are not as politically isolated as they may have thought. In fact, a majority tends to agree with them.
REFERENCES
Buchanan, J., and Flowers, M. (1980). The public finances. Homewood, IL: Richard D. Ir- win, Inc.
Cuz~,n, A.G., and Heggen, R. (1982). A fiscal model o f presidential elections in the United States: 1880-1980. Paper presented at the Southern Political Science Association, Atlanta, 28-30 October, 1982.
Downs, A. (1957). An economic theory o f democracy. New York: Harper and Row. Heggen, R., and Cuz~in, A. (1981), Legitimacy coercion and scope: An expansion-path
analysis applied to five central American countries and Cuba. Behavioral Science. Kendrick, M.S. (1955). A century and a half o f federal expenditures. New York: National
Bureau of Economic Research, Inc. Niskanen, W.A. (1979). Economic and fiscal effects on the popular vote for President. In
D. W. Rae and T.J. Eismeier (Eds.). Public policy and public choice. Beverly Hills: Sage Publications.
Niskanen, W. (1971). Bureaucracy and representative government. Chicago: Aldine-Ather- ton.
Peacock, A.R., and Wiseman, J. (1961). The growth o f public expenditures in the United Kingdom. Princeton: Princeton University Press.

33
A p p e n d i x A
F, ~, ~, E and V, United States 1880-1980
(*Result consistent with hypothesis; 0 not consistent; R -- Republican, D = Democrat.)
Case # Year F /e /~ V E Winner Result
1.
2.
3.
4.
5.
6.
7.
8 .
9.
10.
11.
12,
13.
14.
1876 3.4
1880 2.5 - 26 48
1884 2.3 - 0 8 + 18 48
1888 2.5 +09 + 17 49
1892 2.7 +08 -01 43
1896 2.9 +07 -01 47
1900 2.9 0 - 0 6 52
1904 2.7 - 0 7 - 0 7 56
1908 2.6 - 0 4 +03 52
1912 2.0 - 2 3 - 1 9 23
1916 2.8 +40 +63 49
1920 6.7 + 139 + 99 34
1924 3.5 - 4 8 - 187 54
1928 3.0 - 11 + 37 58
1932 9.2 + 197 + 208 40
1936 l l .0 +20 - 177 61
1940 I1.6 +05 - 15 55
1944 44.3 + 281 + 276 53
1948 14.9 - 66 - 347 50
1952 20.7 + 39 + 105 44
1956 17.1 - 17 - 56 57
1960 18.4 + 08 + 25 50
1964 18.6 +01 - 0 7 61
1968 20,8 + 12 + 11 43
1972 20.9 0 - 12 61
1976 22.6 + 08 + 08 48
1980 22.9 + 01 - 07 41
+ R
- D
- R
- D
- R
+ R
+ R
+ R
- D
+ D
- R
+ R
+ R
- 1 D
+1 D
+1 D
+1 D
+1 D
- 1 R
+ l R
- I D
+ l D
- l R
+ l R
- l D
- ! R
Case # assigned only to elections shown in Figure 6.
Sources: M.S. Kendrick, .4 Century and a Half o f Federal Expenditures (New York: National
Bureau of Economic Research, Inc., 1955); Joint Economic Committee, Economic Indicators (Washington), D.C.: 1980 and 1981); Congressional Quarterly's Guide to U.S. Elections (Washington, D.C., 1975); and R.M. Scammon and A.V. McGillivary (Eds.) America Votes, 14 (Washington, D.C.: Elections Research Center, 1981).

34
A p p e n d i x B
F, I ~, [r~ V, P and E: Great Britain, 1935-1979
(*Result consistent with hypothesis; 0 not consistent; C = Conservative, L = Labor.)
Case # Year F ~ /~ V P E Winner Result
1. 1935 16.9 ' 6 . 6 -25 48 63 2. 1945 56.4 233.7 231 36 33 3. 1950 25.6 - 52.8 -287 46 50 4. 1951 28.5 11.3 6~ 49 48 5. 1955 24.4 - 14.4 -25 50 55 6. 1959 23.0 -5 .7 8 50 58 7. 1964 21.7 - 5.7 0 43 50 8. 1966 23.5 8.3 14 48 58 9. 1970 27.3 16.2 8 43 46
10. 1974 31.9 16.8 1 38 47 1 1 . 1974 36 44 12. 1979 31.6 - . 9 -18 37 42
+ C - L
+ L - C
+ C + C - L
+ L
- C
N.A. C -1 L - 1 C
*
*
*
*
*
*
0 0 *
N.A. *
0
N.A. We leave this election out of Table 4 because, while the incumbents received less than 50% in both V and P, they apparently formed a minority government that did not last the
year.
Sources: D. Butler and A. Sl0man, British PoliticaIFacts 1900-1979 (New York: St. Martin's Press: 1980); B.R. Mitchell, EuroPean Historical Statistics 1750-1975 (New York: Facts on File, 1980). Europa Yearbook (London: various years).
Copyright © 2022 FDOKUMEN