Exercise induced muscle damage and recovery assessed by means of linear and non-linear sEMG analysis...
11
Journal of Electromyography and Kinesiology 11 (2001) 73–83 www.elsevier.com/locate/jelekin Exercise induced muscle damage and recovery assessed by means of linear and non-linear sEMG analysis and ultrasonography P. Sbriccoli a, b, c , F. Felici a, c,* , A. Rosponi a, c , A. Aliotta b , V. Castellano b , C. Mazza ` b , M. Bernardi a, b , M. Marchetti a, b a Department of Human Physiology and Pharmacology, Faculty of Medicine, Rome University “La Sapienza”, Piazzale Aldo Moro 5, 00185 Rome, Italy b S. Lucia Foundation Rehabilitation Hospital, Rome, Italy c I.U.S.M. University Institute of Motor Sciences, Rome, Italy Received 17 May 2000; received in revised form 9 October 2000; accepted 14 October 2000 Abstract This study was aimed at investigating the time-course and recovery from eccentric (EC) exercise induced muscle damage by means of surface electromyography (sEMG), ultrasonography (US), and blood enzymes. Five subjects (EC Group) performed two bouts of 35 EC maximum contractions with the biceps brachii of their non dominant arm, five subjects were tested without per- forming EC (Control Group: CNT). The maximal isometric force (MVC) was measured. Force and sEMG signals were recorded during 80% MVC isometric contractions. In EC and CNT subjects US assessment on non-dominant biceps brachii was performed; creatin kinase (CK) and lactic dehydrogenasis (LDH) plasma levels were also assessed. Force, sEMG and CK–LDH measurements were performed before EC and after it periodically for 4 weeks. The sEMG was analysed in time and frequency domains; a non- linear analysis (Lyapunov 1st exponent, L1) of sEMG was also performed. After EC, the MVC was reduced by 40% on average with respect to the pre-EC values. A significant decrease in the initial frequency content, and in the MDF and L1 decay (13–42% less than the pre-EC values, respectively) was also observed. The sEMG amplitude (Root Mean Square, RMS) was unchanged after EC. The US revealed an increase in muscle belly thickness and in local muscle blood flow after EC. A complete recovery of all the considered parameters was achieved in two weeks. In conclusion sEMG analysis was confirmed as an early indicator of muscle damage. Muscle recovery from damage is followed by both sEMG and US and this may have useful clinical implications. Non linear analysis (L1) was revealed to be sensitive to early sEMG modifications induced by EC as well as able to follow the post EC changes in the sEMG. 2001 Elsevier Science Ltd. All rights reserved. Keywords: Muscle damage; Surface electromyography; Median Frequency; Non-linear analysis; Ultrasonography 1. Introduction Delayed onset of muscle soreness (DOMS) is a clini- cal situation particularly evident after bouts of eccentric exercise (EC). DOMS appears some time after exercise (24 to 48 hours on average) and is characterised by sub- jective signs of muscle impairment, from moderate pain to a very sore sensation. Studies on muscle damage after EC focused on the assessment of early indicators of the damage itself [1,11,17,24,26]. Magnetic resonance (MR) * Corresponding author. Tel.: + 39-06-4991-0848; fax: + 39-06- 4991-0860. E-mail address: [email protected] (F. Felici). 1050-6411/01/$ - see front matter 2001 Elsevier Science Ltd. All rights reserved. PII:S1050-6411(00)00042-0 [10], ultrasonography (US) [3–24] and surface electro- myography (sEMG) [4,8,19] are the most effective tech- niques in detecting the early changes occurring within muscle which is damaged by EC. Magnetic resonance evidentiated an increase in the cross-sectional area of the elbow flexor muscles and a marked increase in signal intensity, as shown by an increase in the T2 relaxation time [10–24]. Ultrasonography showed that muscle oed- ema induced by EC can be identified by an increase in the echo-intensity within the injured muscle, and an increase in muscle belly thickness [3,24]. Magnetic res- onance (MR) and ultrasonography (US) are also effec- tive in following the recovery from muscle damage [10,24]. A previous study performed by Felici et al. [8], showed an early sEMG modification, consisting of a
-
Upload
independent -
Category
Documents
-
view
1 -
download
0
Transcript of Exercise induced muscle damage and recovery assessed by means of linear and non-linear sEMG analysis...
Journal of Electromyography and Kinesiology 11 (2001) 73–83www.elsevier.com/locate/jelekin
Exercise induced muscle damage and recovery assessed by meansof linear and non-linear sEMG analysis and ultrasonography
P. Sbriccolia, b, c, F. Felici a, c,*, A. Rosponia, c, A. Aliotta b, V. Castellanob,C. Mazzab, M. Bernardia, b, M. Marchetti a, b
a Department of Human Physiology and Pharmacology, Faculty of Medicine, Rome University “La Sapienza”, Piazzale Aldo Moro 5,00185 Rome, Italy
b S. Lucia Foundation Rehabilitation Hospital, Rome, Italyc I.U.S.M. University Institute of Motor Sciences, Rome, Italy
Received 17 May 2000; received in revised form 9 October 2000; accepted 14 October 2000
Abstract
This study was aimed at investigating the time-course and recovery from eccentric (EC) exercise induced muscle damage bymeans of surface electromyography (sEMG), ultrasonography (US), and blood enzymes. Five subjects (EC Group) performed twobouts of 35 EC maximum contractions with the biceps brachii of their non dominant arm, five subjects were tested without per-forming EC (Control Group: CNT). The maximal isometric force (MVC) was measured. Force and sEMG signals were recordedduring 80% MVC isometric contractions. In EC and CNT subjects US assessment on non-dominant biceps brachii was performed;creatin kinase (CK) and lactic dehydrogenasis (LDH) plasma levels were also assessed. Force, sEMG and CK–LDH measurementswere performed before EC and after it periodically for 4 weeks. The sEMG was analysed in time and frequency domains; a non-linear analysis (Lyapunov 1st exponent, L1) of sEMG was also performed. After EC, the MVC was reduced by 40% on averagewith respect to the pre-EC values. A significant decrease in the initial frequency content, and in the MDF and L1 decay (13–42%less than the pre-EC values, respectively) was also observed. The sEMG amplitude (Root Mean Square, RMS) was unchangedafter EC. The US revealed an increase in muscle belly thickness and in local muscle blood flow after EC. A complete recovery ofall the considered parameters was achieved in two weeks. In conclusion sEMG analysis was confirmed as an early indicator ofmuscle damage. Muscle recovery from damage is followed by both sEMG and US and this may have useful clinical implications.Non linear analysis (L1) was revealed to be sensitive to early sEMG modifications induced by EC as well as able to follow thepost EC changes in the sEMG. 2001 Elsevier Science Ltd. All rights reserved.
Keywords:Muscle damage; Surface electromyography; Median Frequency; Non-linear analysis; Ultrasonography
1. Introduction
Delayed onset of muscle soreness (DOMS) is a clini-cal situation particularly evident after bouts of eccentricexercise (EC). DOMS appears some time after exercise(24 to 48 hours on average) and is characterised by sub-jective signs of muscle impairment, from moderate painto a very sore sensation. Studies on muscle damage afterEC focused on the assessment of early indicators of thedamage itself [1,11,17,24,26]. Magnetic resonance (MR)
* Corresponding author. Tel.:+39-06-4991-0848; fax:+39-06-4991-0860.
E-mail address:[email protected] (F. Felici).
1050-6411/01/$ - see front matter 2001 Elsevier Science Ltd. All rights reserved.PII: S1050-6411 (00)00042-0
[10], ultrasonography (US) [3–24] and surface electro-myography (sEMG) [4,8,19] are the most effective tech-niques in detecting the early changes occurring withinmuscle which is damaged by EC. Magnetic resonanceevidentiated an increase in the cross-sectional area of theelbow flexor muscles and a marked increase in signalintensity, as shown by an increase in the T2 relaxationtime [10–24]. Ultrasonography showed that muscle oed-ema induced by EC can be identified by an increase inthe echo-intensity within the injured muscle, and anincrease in muscle belly thickness [3,24]. Magnetic res-onance (MR) and ultrasonography (US) are also effec-tive in following the recovery from muscle damage[10,24]. A previous study performed by Felici et al. [8],showed an early sEMG modification, consisting of a
74 P. Sbriccoli et al. / Journal of Electromyography and Kinesiology 11 (2001) 73–83
shift of the Median Frequency (MDF) power spectratowards the lower frequencies at 80% and 50% MVC.This modification, evident from 1 hour after EC, wasstill present at the end of the experiment (1 week), andwas assumed by the authors to be an indirect earlymarker of EC induced muscle damage.
The purpose of this study was to further investigatethe changes in sEMG related to EC induced muscle dam-age until a complete recovery of muscle function wasachieved. The sEMG was characterised by time and fre-quency domain analysis. We adopted the root meansquare (RMS) value of the sEMG as an indicator of theextent of muscle activation. The median frequency(MDF) of sEMG power spectrum is used to provide anindication of the average muscle fibre conduction velo-city [14].
In the present research we decided to support theclassical analysis tools with a non-linear one, i.e. thelargest exponent of the Lyapunov spectrum (L1). Anysystem with at least one positive Lyapunov exponent isdefined as chaotic. As stated in Elbert [7] “Chaos isdefined as unforeseen behaviour in a deterministic sys-tem, or in layman’s terms: chaos is apparently lawlessbehaviour totally ruled by deterministic laws”. The valueand power of chaotic system analyses is their ability todetect transient and embedded determinism in systemswhich are apparently stochastic [28]. The implemen-tation of frequency analysis with non-linear techniques(recurrence plot analysis, RPA) in the sEMG studies hasrecently been suggested [28]. The authors’ conclusionwas that both analyses could be combined to give a fullerassessment of sEMG during light or heavy contractions.The role of RPA in detecting non stationary states, suchas fatigue, and in the diagnosis of neuro-muscular dis-eases, were considered fields for productive research[27]. The first Lyapunov exponent method we adoptedas an alternative to RPA had been demonstrated to bea profitable tool in analysing normal and pathologicalelectroencephalographic signals [7] as well as breathingpattern [29]. The time course of L1 has been utilised inorder to detect changes within the status of a systemand it showed clear modifications when a physiologicalsystem goes towards a pathological condition [16].Therefore we decided to integrate the classical — RMSand MDF — analysis with this specific non-linear toolwhen assessing the early sEMG modifications occurringas a consequence of EC.
Muscle damage and recovery were revealed also bymeans of the accepted indicators of muscle damage suchas creatin–kinase (CK) and lactic dehydrogenases (LDH)plasma levels and ultrasonographic (US) measurementswhich were performed during the entire experimentaltime. In addition to the standard US imaging, we addedDoppler US in order to evaluate local muscle blood flow.Since the effects of an acute phase reaction appear asearly as the first hours following EC [1], US easily
revealed a modification in the local muscle blood flow,as well as a change in muscle belly thickness, as a conse-quence of swelling and oedema occurring within theinjured muscle.
2. Methods
2.1. Subjects
Ten healthy sedentary subjects (for anthropometricdata see Table 1) gave written consent to take part inthis experiment. At the time of the experiment they wereall in a good physical condition and did not suffer fromany neuromuscular disease. Furthermore, none of themwas involved in any systematic training. Furthermore allthe subjects were asked not to perform any kind of resist-ance training involving the upper limbs during the four-week period of the experiment. The biceps brachii of thenon-dominant arm was tested. The experimental groupwas subdivided at random into two groups. Five subjectswere subjected to eccentric exercise (EC group), whichwas performed on the biceps brachii of their non-domi-nant arm only (the left one in all subjects). Five subjects(Control group: CNT) were tested without performingthe eccentric exercise.
2.2. CK–LDH determination (EC–CNT group)
Blood samples (8 ml) were drawn by venipuncture ofthe antecubital vein before and 1 hour after EC, and then2, 4, 7, 14, 21 and 28 days after EC. The blood sampleswere collected, and sent to a laboratory (IRCCS S.Lucia) for the determination of CK–LDH plasma levels.CK plasma levels were assessed using a kit Unimate 3CK (Roche) at a temperature of 37°C. Normal valuesfor CK using this method should be,165 Ul21 forwomen and,190 for men. LDH was assessed usingUnimate 3 LDH SFBC (Roche) at a temperature of37°C; normal expected values for adults range between190–380 Ul21.
2.3. Ultrasonography (US) — EC–CNT group
All subjects underwent a US evaluation on both upperlimbs using an ecograph (Esaote AU 580), with a PulsedWave (PW) Doppler and a Colour Flow Mode (CFM).The US assessment consisted of measuring the thicknessof the elbow flexors on both arms, and giving an estimateof the local muscle blood flow. The subject, lying in asupine posture, placed his/her arm, relaxed, in a palm-up position, and a 7.5 MHz probe was positioned overthe skin covering the muscle belly (1/3 medium, maxthickness) for the transverse scan of the elbow flexors.Muscle thickness was detected by measuring the dis-tance between the skin and the edge of the humerus.
75P. Sbriccoli et al. / Journal of Electromyography and Kinesiology 11 (2001) 73–83
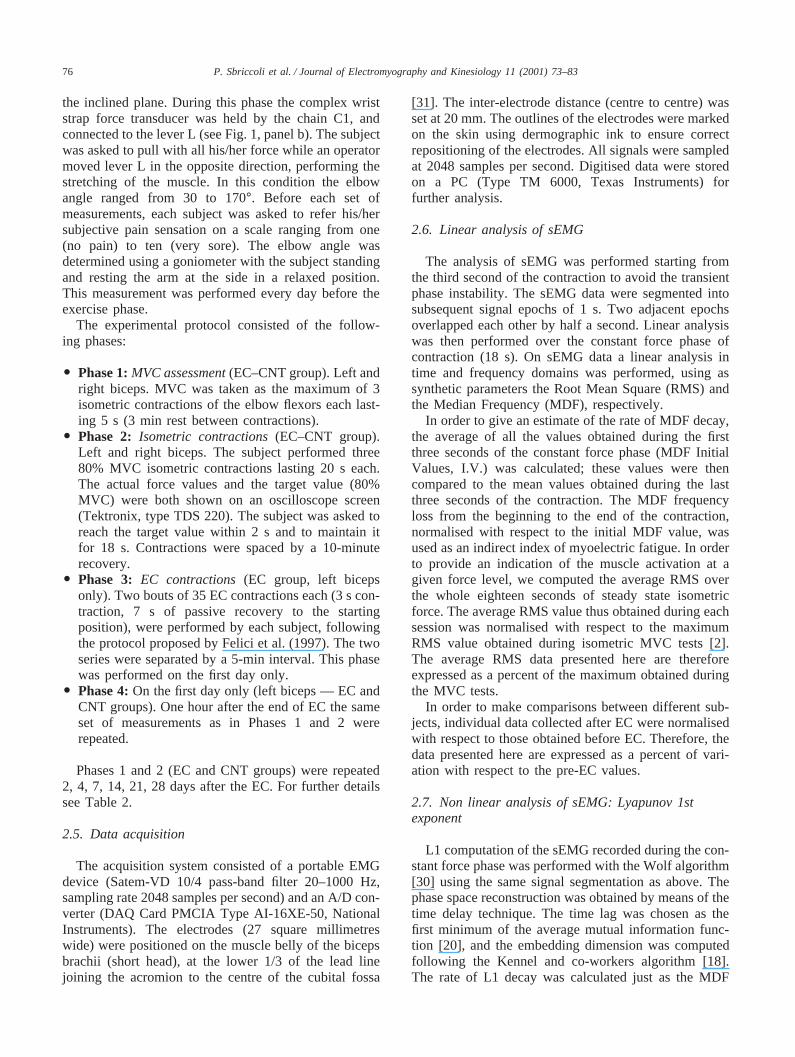
Table 1Subjects
Subject Groupa Sex Age (years) Weight (kg) Height (cm) Dominant Arm
S1 EC M 26 70 174 RS2 EC F 26 56 164 RS3 EC F 34 53 164 RS4 EC M 31 60 175 RS5 EC M 37 72 172 RS6 CNT F 26 66 168 RS7 CNT M 25 61 178 RS8 CNT F 23 52 162 RS9 CNT M 34 88 182 RS10 CNT F 32 50 162 RMean±sd 29.4±4.8 62.8±11.6 170.1±7.1
a EC, eccentric; CNT, control.
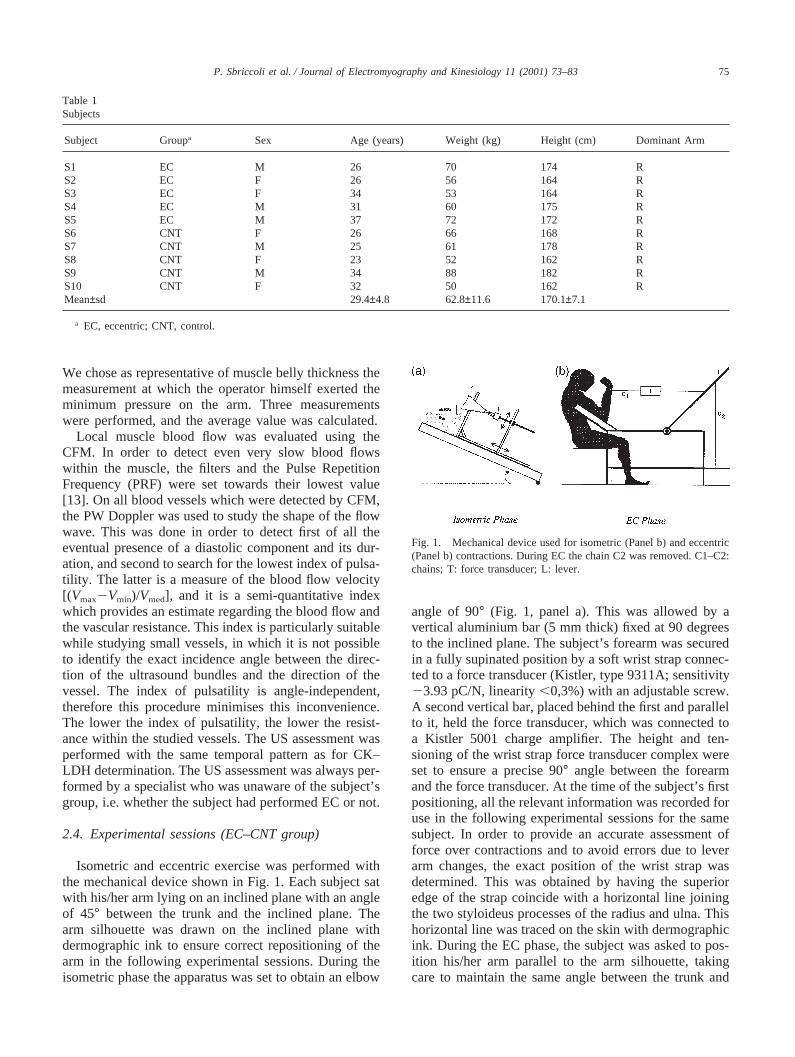
We chose as representative of muscle belly thickness themeasurement at which the operator himself exerted theminimum pressure on the arm. Three measurementswere performed, and the average value was calculated.
Local muscle blood flow was evaluated using theCFM. In order to detect even very slow blood flowswithin the muscle, the filters and the Pulse RepetitionFrequency (PRF) were set towards their lowest value[13]. On all blood vessels which were detected by CFM,the PW Doppler was used to study the shape of the flowwave. This was done in order to detect first of all theeventual presence of a diastolic component and its dur-ation, and second to search for the lowest index of pulsa-tility. The latter is a measure of the blood flow velocity[(Vmax2Vmin)/Vmed], and it is a semi-quantitative indexwhich provides an estimate regarding the blood flow andthe vascular resistance. This index is particularly suitablewhile studying small vessels, in which it is not possibleto identify the exact incidence angle between the direc-tion of the ultrasound bundles and the direction of thevessel. The index of pulsatility is angle-independent,therefore this procedure minimises this inconvenience.The lower the index of pulsatility, the lower the resist-ance within the studied vessels. The US assessment wasperformed with the same temporal pattern as for CK–LDH determination. The US assessment was always per-formed by a specialist who was unaware of the subject’sgroup, i.e. whether the subject had performed EC or not.
2.4. Experimental sessions (EC–CNT group)
Isometric and eccentric exercise was performed withthe mechanical device shown in Fig. 1. Each subject satwith his/her arm lying on an inclined plane with an angleof 45° between the trunk and the inclined plane. Thearm silhouette was drawn on the inclined plane withdermographic ink to ensure correct repositioning of thearm in the following experimental sessions. During theisometric phase the apparatus was set to obtain an elbow
Fig. 1. Mechanical device used for isometric (Panel b) and eccentric(Panel b) contractions. During EC the chain C2 was removed. C1–C2:chains; T: force transducer; L: lever.
angle of 90° (Fig. 1, panel a). This was allowed by avertical aluminium bar (5 mm thick) fixed at 90 degreesto the inclined plane. The subject’s forearm was securedin a fully supinated position by a soft wrist strap connec-ted to a force transducer (Kistler, type 9311A; sensitivity23.93 pC/N, linearity,0,3%) with an adjustable screw.A second vertical bar, placed behind the first and parallelto it, held the force transducer, which was connected toa Kistler 5001 charge amplifier. The height and ten-sioning of the wrist strap force transducer complex wereset to ensure a precise 90° angle between the forearmand the force transducer. At the time of the subject’s firstpositioning, all the relevant information was recorded foruse in the following experimental sessions for the samesubject. In order to provide an accurate assessment offorce over contractions and to avoid errors due to leverarm changes, the exact position of the wrist strap wasdetermined. This was obtained by having the superioredge of the strap coincide with a horizontal line joiningthe two styloideus processes of the radius and ulna. Thishorizontal line was traced on the skin with dermographicink. During the EC phase, the subject was asked to pos-ition his/her arm parallel to the arm silhouette, takingcare to maintain the same angle between the trunk and
76 P. Sbriccoli et al. / Journal of Electromyography and Kinesiology 11 (2001) 73–83
the inclined plane. During this phase the complex wriststrap force transducer was held by the chain C1, andconnected to the lever L (see Fig. 1, panel b). The subjectwas asked to pull with all his/her force while an operatormoved lever L in the opposite direction, performing thestretching of the muscle. In this condition the elbowangle ranged from 30 to 170°. Before each set ofmeasurements, each subject was asked to refer his/hersubjective pain sensation on a scale ranging from one(no pain) to ten (very sore). The elbow angle wasdetermined using a goniometer with the subject standingand resting the arm at the side in a relaxed position.This measurement was performed every day before theexercise phase.
The experimental protocol consisted of the follow-ing phases:
O Phase 1:MVC assessment(EC–CNT group). Left andright biceps. MVC was taken as the maximum of 3isometric contractions of the elbow flexors each last-ing 5 s (3 min rest between contractions).
O Phase 2: Isometric contractions(EC–CNT group).Left and right biceps. The subject performed three80% MVC isometric contractions lasting 20 s each.The actual force values and the target value (80%MVC) were both shown on an oscilloscope screen(Tektronix, type TDS 220). The subject was asked toreach the target value within 2 s and to maintain itfor 18 s. Contractions were spaced by a 10-minuterecovery.
O Phase 3: EC contractions(EC group, left bicepsonly). Two bouts of 35 EC contractions each (3 s con-traction, 7 s of passive recovery to the startingposition), were performed by each subject, followingthe protocol proposed by Felici et al. (1997). The twoseries were separated by a 5-min interval. This phasewas performed on the first day only.
O Phase 4:On the first day only (left biceps — EC andCNT groups). One hour after the end of EC the sameset of measurements as in Phases 1 and 2 wererepeated.
Phases 1 and 2 (EC and CNT groups) were repeated2, 4, 7, 14, 21, 28 days after the EC. For further detailssee Table 2.
2.5. Data acquisition
The acquisition system consisted of a portable EMGdevice (Satem-VD 10/4 pass-band filter 20–1000 Hz,sampling rate 2048 samples per second) and an A/D con-verter (DAQ Card PMCIA Type AI-16XE-50, NationalInstruments). The electrodes (27 square millimetreswide) were positioned on the muscle belly of the bicepsbrachii (short head), at the lower 1/3 of the lead linejoining the acromion to the centre of the cubital fossa
[31]. The inter-electrode distance (centre to centre) wasset at 20 mm. The outlines of the electrodes were markedon the skin using dermographic ink to ensure correctrepositioning of the electrodes. All signals were sampledat 2048 samples per second. Digitised data were storedon a PC (Type TM 6000, Texas Instruments) forfurther analysis.
2.6. Linear analysis of sEMG
The analysis of sEMG was performed starting fromthe third second of the contraction to avoid the transientphase instability. The sEMG data were segmented intosubsequent signal epochs of 1 s. Two adjacent epochsoverlapped each other by half a second. Linear analysiswas then performed over the constant force phase ofcontraction (18 s). On sEMG data a linear analysis intime and frequency domains was performed, using assynthetic parameters the Root Mean Square (RMS) andthe Median Frequency (MDF), respectively.
In order to give an estimate of the rate of MDF decay,the average of all the values obtained during the firstthree seconds of the constant force phase (MDF InitialValues, I.V.) was calculated; these values were thencompared to the mean values obtained during the lastthree seconds of the contraction. The MDF frequencyloss from the beginning to the end of the contraction,normalised with respect to the initial MDF value, wasused as an indirect index of myoelectric fatigue. In orderto provide an indication of the muscle activation at agiven force level, we computed the average RMS overthe whole eighteen seconds of steady state isometricforce. The average RMS value thus obtained during eachsession was normalised with respect to the maximumRMS value obtained during isometric MVC tests [2].The average RMS data presented here are thereforeexpressed as a percent of the maximum obtained duringthe MVC tests.
In order to make comparisons between different sub-jects, individual data collected after EC were normalisedwith respect to those obtained before EC. Therefore, thedata presented here are expressed as a percent of vari-ation with respect to the pre-EC values.
2.7. Non linear analysis of sEMG: Lyapunov 1stexponent
L1 computation of the sEMG recorded during the con-stant force phase was performed with the Wolf algorithm[30] using the same signal segmentation as above. Thephase space reconstruction was obtained by means of thetime delay technique. The time lag was chosen as thefirst minimum of the average mutual information func-tion [20], and the embedding dimension was computedfollowing the Kennel and co-workers algorithm [18].The rate of L1 decay was calculated just as the MDF
77P. Sbriccoli et al. / Journal of Electromyography and Kinesiology 11 (2001) 73–83
Table 2Experimental protocola
Phase 1: MVC assessment (EC–CNT Group) | |Left biceps | |Elbow angle measurement | |MVC measurement (3×5 s) 3 min rest between each test | |
| |Phase 2: Isometric contractions (EC–CNT Group) | |15 min rest | |80% MVC measurement (3×20 s) 5 min rest between each test | |
| |Phase 3: EC contractions (EC Group)b | HLeft biceps | BTwo sets of 35 eccentric contractions each lasting 10 s (3 s stretching, 7 s passive return to the starting position) |5 min rest between the two sets |
|Phase 4: (EC–CNT Group)c H
A
a CK–LDH sampling/US assessment (EC–CNT Group) were done before Phase 1 and after Phase 3 on the first day, and before Phase 1 on thefollowing days. Phases 1 and 2 were performed for four weeks. Arrow A denotes the duration of the first day experiment, arrow B denotes theduration of the experiments performed on the next sessions.
b Phase 3 performed on the 1st day only.c Phase 4 performed on the 1st day only. Same as in Phase 1 and 2.
one, and the data obtained were represented as well asa percentage of variation with respect to the baselinevalues (pre-EC).
2.8. Statistical analysis
Post EC data were reported as a percentage of the preEC values (baseline). A paired T-test was performed onall the post EC data, and the level of significance wasset atp,0.05. The variation of MDF-L1 I.V., MDF-L1decay versus time were represented as regression lines.The significance of these lines was tested using corre-lation coefficients (R) enteringF-distribution table [25].The confidence interval of the regression lines was setto 95% and was estimated on the basis of the standarddeviations. When two regression lines were drawn on thesame graph, the two regression coefficients were used totest for the equality of the two lines.
3. Results
3.1. MVC–stiffness–CK
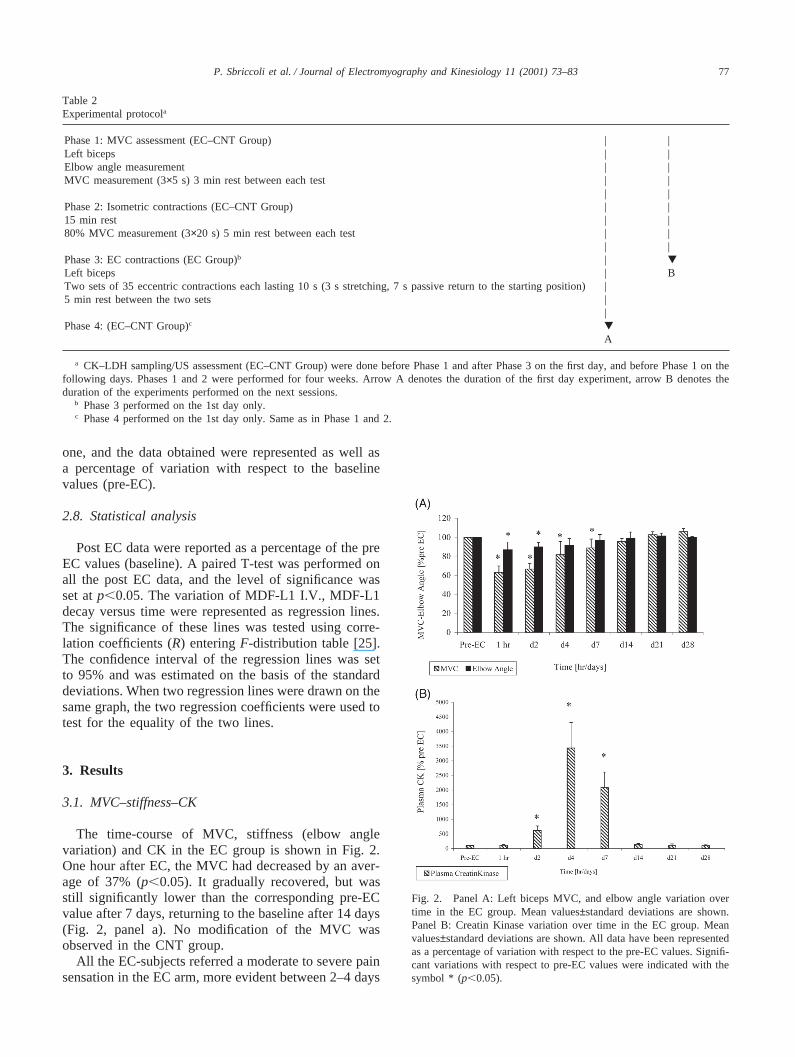
The time-course of MVC, stiffness (elbow anglevariation) and CK in the EC group is shown in Fig. 2.One hour after EC, the MVC had decreased by an aver-age of 37% (p,0.05). It gradually recovered, but wasstill significantly lower than the corresponding pre-ECvalue after 7 days, returning to the baseline after 14 days(Fig. 2, panel a). No modification of the MVC wasobserved in the CNT group.
All the EC-subjects referred a moderate to severe painsensation in the EC arm, more evident between 2–4 days
Fig. 2. Panel A: Left biceps MVC, and elbow angle variation overtime in the EC group. Mean values±standard deviations are shown.Panel B: Creatin Kinase variation over time in the EC group. Meanvalues±standard deviations are shown. All data have been representedas a percentage of variation with respect to the pre-EC values. Signifi-cant variations with respect to pre-EC values were indicated with thesymbol * (p,0.05).
78 P. Sbriccoli et al. / Journal of Electromyography and Kinesiology 11 (2001) 73–83
after the EC strain, which was also paralleled by dif-ficulty in fully extending the EC arm, as revealed by areduction in the elbow angle (Fig. 2, panel a). The aug-mented stiffness of the biceps muscle peaked, on aver-age, 2 days after EC (p,0.05). These symptoms com-pletely disappeared in a couple of days.
CK plasma level started increasing 1–2 days after EC,reaching its peak between day 4 and day 7. It returnedto the pre-EC value 14 days after EC (see Fig. 2, panelb). Only one subject did not show any significant changein CK plasma level. In the CNT group no increase inCK plasma level was observed.
3.2. sEMG modifications
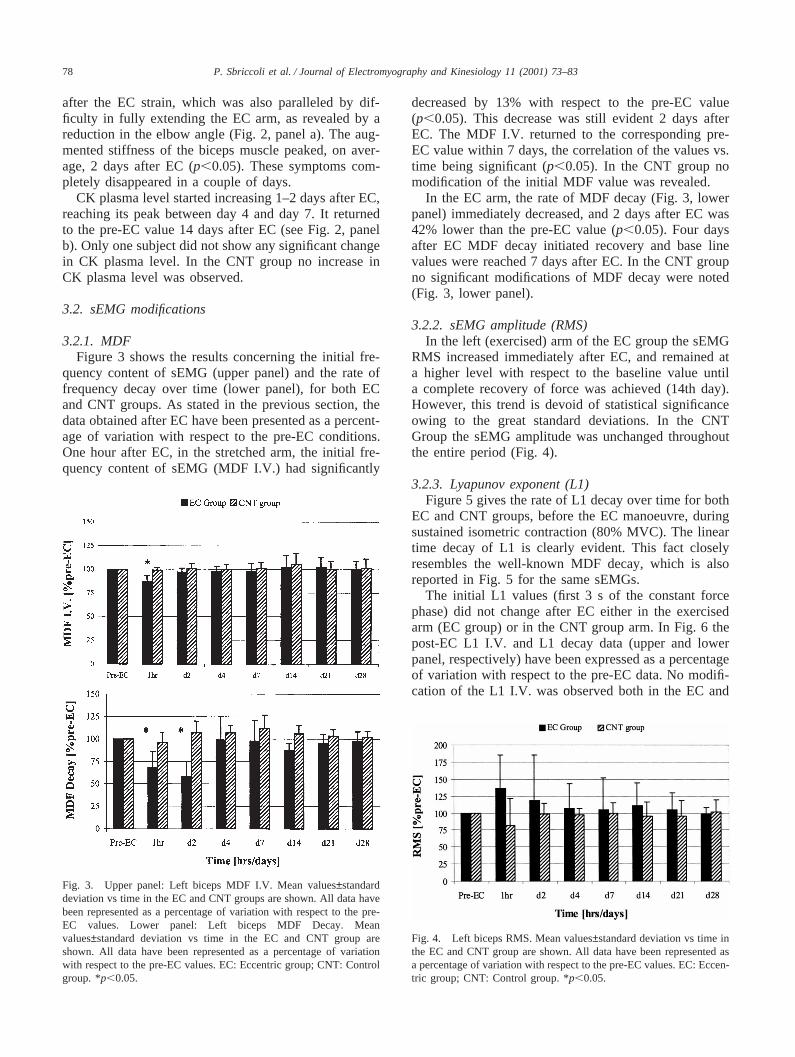
3.2.1. MDFFigure 3 shows the results concerning the initial fre-
quency content of sEMG (upper panel) and the rate offrequency decay over time (lower panel), for both ECand CNT groups. As stated in the previous section, thedata obtained after EC have been presented as a percent-age of variation with respect to the pre-EC conditions.One hour after EC, in the stretched arm, the initial fre-quency content of sEMG (MDF I.V.) had significantly
Fig. 3. Upper panel: Left biceps MDF I.V. Mean values±standarddeviation vs time in the EC and CNT groups are shown. All data havebeen represented as a percentage of variation with respect to the pre-EC values. Lower panel: Left biceps MDF Decay. Meanvalues±standard deviation vs time in the EC and CNT group areshown. All data have been represented as a percentage of variationwith respect to the pre-EC values. EC: Eccentric group; CNT: Controlgroup. *p,0.05.
decreased by 13% with respect to the pre-EC value(p,0.05). This decrease was still evident 2 days afterEC. The MDF I.V. returned to the corresponding pre-EC value within 7 days, the correlation of the values vs.time being significant (p,0.05). In the CNT group nomodification of the initial MDF value was revealed.
In the EC arm, the rate of MDF decay (Fig. 3, lowerpanel) immediately decreased, and 2 days after EC was42% lower than the pre-EC value (p,0.05). Four daysafter EC MDF decay initiated recovery and base linevalues were reached 7 days after EC. In the CNT groupno significant modifications of MDF decay were noted(Fig. 3, lower panel).
3.2.2. sEMG amplitude (RMS)In the left (exercised) arm of the EC group the sEMG
RMS increased immediately after EC, and remained ata higher level with respect to the baseline value untila complete recovery of force was achieved (14th day).However, this trend is devoid of statistical significanceowing to the great standard deviations. In the CNTGroup the sEMG amplitude was unchanged throughoutthe entire period (Fig. 4).
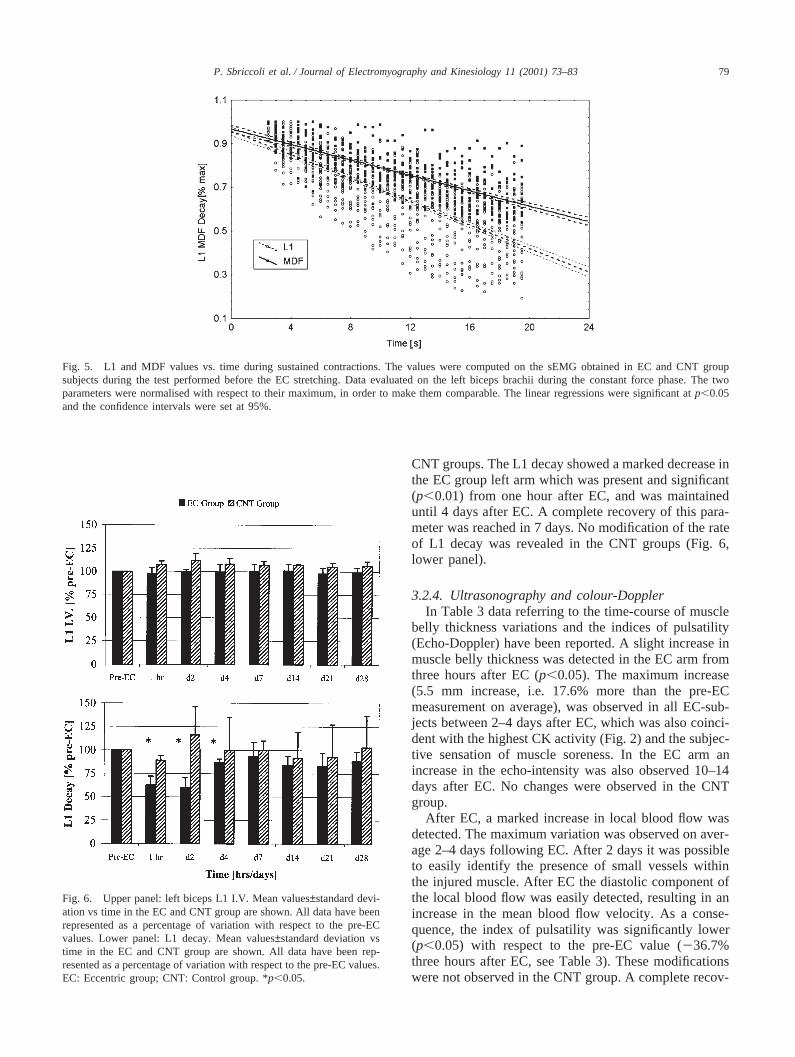
3.2.3. Lyapunov exponent (L1)Figure 5 gives the rate of L1 decay over time for both
EC and CNT groups, before the EC manoeuvre, duringsustained isometric contraction (80% MVC). The lineartime decay of L1 is clearly evident. This fact closelyresembles the well-known MDF decay, which is alsoreported in Fig. 5 for the same sEMGs.
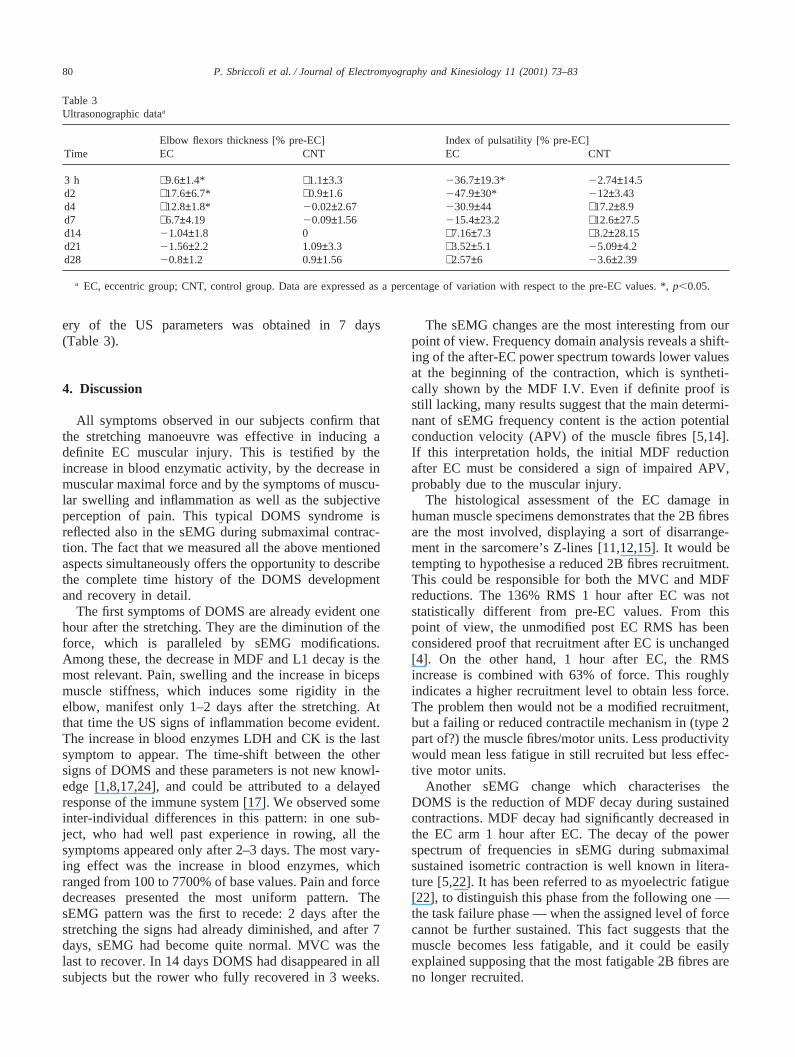
The initial L1 values (first 3 s of the constant forcephase) did not change after EC either in the exercisedarm (EC group) or in the CNT group arm. In Fig. 6 thepost-EC L1 I.V. and L1 decay data (upper and lowerpanel, respectively) have been expressed as a percentageof variation with respect to the pre-EC data. No modifi-cation of the L1 I.V. was observed both in the EC and
Fig. 4. Left biceps RMS. Mean values±standard deviation vs time inthe EC and CNT group are shown. All data have been represented asa percentage of variation with respect to the pre-EC values. EC: Eccen-tric group; CNT: Control group. *p,0.05.
79P. Sbriccoli et al. / Journal of Electromyography and Kinesiology 11 (2001) 73–83
Fig. 5. L1 and MDF values vs. time during sustained contractions. The values were computed on the sEMG obtained in EC and CNT groupsubjects during the test performed before the EC stretching. Data evaluated on the left biceps brachii during the constant force phase. The twoparameters were normalised with respect to their maximum, in order to make them comparable. The linear regressions were significant atp,0.05and the confidence intervals were set at 95%.
Fig. 6. Upper panel: left biceps L1 I.V. Mean values±standard devi-ation vs time in the EC and CNT group are shown. All data have beenrepresented as a percentage of variation with respect to the pre-ECvalues. Lower panel: L1 decay. Mean values±standard deviation vstime in the EC and CNT group are shown. All data have been rep-resented as a percentage of variation with respect to the pre-EC values.EC: Eccentric group; CNT: Control group. *p,0.05.
CNT groups. The L1 decay showed a marked decrease inthe EC group left arm which was present and significant(p,0.01) from one hour after EC, and was maintaineduntil 4 days after EC. A complete recovery of this para-meter was reached in 7 days. No modification of the rateof L1 decay was revealed in the CNT groups (Fig. 6,lower panel).
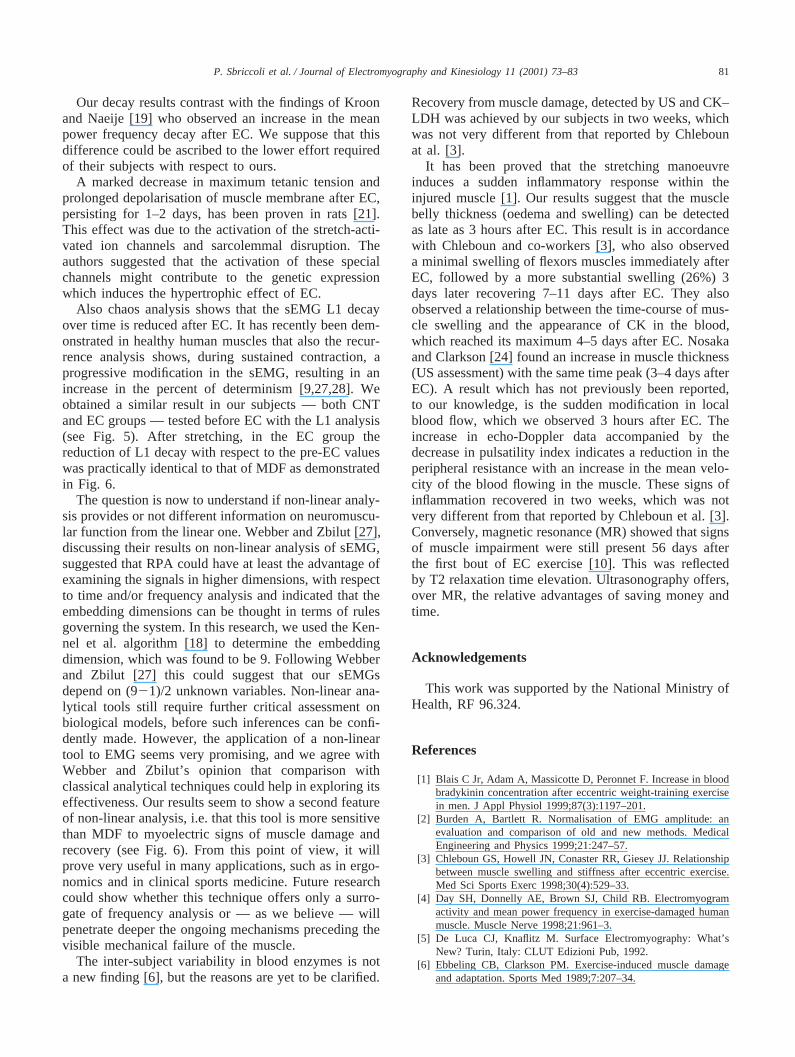
3.2.4. Ultrasonography and colour-DopplerIn Table 3 data referring to the time-course of muscle
belly thickness variations and the indices of pulsatility(Echo-Doppler) have been reported. A slight increase inmuscle belly thickness was detected in the EC arm fromthree hours after EC (p,0.05). The maximum increase(5.5 mm increase, i.e. 17.6% more than the pre-ECmeasurement on average), was observed in all EC-sub-jects between 2–4 days after EC, which was also coinci-dent with the highest CK activity (Fig. 2) and the subjec-tive sensation of muscle soreness. In the EC arm anincrease in the echo-intensity was also observed 10–14days after EC. No changes were observed in the CNTgroup.
After EC, a marked increase in local blood flow wasdetected. The maximum variation was observed on aver-age 2–4 days following EC. After 2 days it was possibleto easily identify the presence of small vessels withinthe injured muscle. After EC the diastolic component ofthe local blood flow was easily detected, resulting in anincrease in the mean blood flow velocity. As a conse-quence, the index of pulsatility was significantly lower(p,0.05) with respect to the pre-EC value (236.7%three hours after EC, see Table 3). These modificationswere not observed in the CNT group. A complete recov-
80 P. Sbriccoli et al. / Journal of Electromyography and Kinesiology 11 (2001) 73–83
Table 3Ultrasonographic dataa
Elbow flexors thickness [% pre-EC] Index of pulsatility [% pre-EC]Time EC CNT EC CNT
3 h +9.6±1.4* +1.1±3.3 236.7±19.3* 22.74±14.5d2 +17.6±6.7* +0.9±1.6 247.9±30* 212±3.43d4 +12.8±1.8* 20.02±2.67 230.9±44 +17.2±8.9d7 +6.7±4.19 20.09±1.56 215.4±23.2 +12.6±27.5d14 21.04±1.8 0 +7.16±7.3 +3.2±28.15d21 21.56±2.2 1.09±3.3 +3.52±5.1 25.09±4.2d28 20.8±1.2 0.9±1.56 +2.57±6 23.6±2.39
a EC, eccentric group; CNT, control group. Data are expressed as a percentage of variation with respect to the pre-EC values. *,p,0.05.
ery of the US parameters was obtained in 7 days(Table 3).
4. Discussion
All symptoms observed in our subjects confirm thatthe stretching manoeuvre was effective in inducing adefinite EC muscular injury. This is testified by theincrease in blood enzymatic activity, by the decrease inmuscular maximal force and by the symptoms of muscu-lar swelling and inflammation as well as the subjectiveperception of pain. This typical DOMS syndrome isreflected also in the sEMG during submaximal contrac-tion. The fact that we measured all the above mentionedaspects simultaneously offers the opportunity to describethe complete time history of the DOMS developmentand recovery in detail.
The first symptoms of DOMS are already evident onehour after the stretching. They are the diminution of theforce, which is paralleled by sEMG modifications.Among these, the decrease in MDF and L1 decay is themost relevant. Pain, swelling and the increase in bicepsmuscle stiffness, which induces some rigidity in theelbow, manifest only 1–2 days after the stretching. Atthat time the US signs of inflammation become evident.The increase in blood enzymes LDH and CK is the lastsymptom to appear. The time-shift between the othersigns of DOMS and these parameters is not new knowl-edge [1,8,17,24], and could be attributed to a delayedresponse of the immune system [17]. We observed someinter-individual differences in this pattern: in one sub-ject, who had well past experience in rowing, all thesymptoms appeared only after 2–3 days. The most vary-ing effect was the increase in blood enzymes, whichranged from 100 to 7700% of base values. Pain and forcedecreases presented the most uniform pattern. ThesEMG pattern was the first to recede: 2 days after thestretching the signs had already diminished, and after 7days, sEMG had become quite normal. MVC was thelast to recover. In 14 days DOMS had disappeared in allsubjects but the rower who fully recovered in 3 weeks.
The sEMG changes are the most interesting from ourpoint of view. Frequency domain analysis reveals a shift-ing of the after-EC power spectrum towards lower valuesat the beginning of the contraction, which is syntheti-cally shown by the MDF I.V. Even if definite proof isstill lacking, many results suggest that the main determi-nant of sEMG frequency content is the action potentialconduction velocity (APV) of the muscle fibres [5,14].If this interpretation holds, the initial MDF reductionafter EC must be considered a sign of impaired APV,probably due to the muscular injury.
The histological assessment of the EC damage inhuman muscle specimens demonstrates that the 2B fibresare the most involved, displaying a sort of disarrange-ment in the sarcomere’s Z-lines [11,12,15]. It would betempting to hypothesise a reduced 2B fibres recruitment.This could be responsible for both the MVC and MDFreductions. The 136% RMS 1 hour after EC was notstatistically different from pre-EC values. From thispoint of view, the unmodified post EC RMS has beenconsidered proof that recruitment after EC is unchanged[4]. On the other hand, 1 hour after EC, the RMSincrease is combined with 63% of force. This roughlyindicates a higher recruitment level to obtain less force.The problem then would not be a modified recruitment,but a failing or reduced contractile mechanism in (type 2part of?) the muscle fibres/motor units. Less productivitywould mean less fatigue in still recruited but less effec-tive motor units.
Another sEMG change which characterises theDOMS is the reduction of MDF decay during sustainedcontractions. MDF decay had significantly decreased inthe EC arm 1 hour after EC. The decay of the powerspectrum of frequencies in sEMG during submaximalsustained isometric contraction is well known in litera-ture [5,22]. It has been referred to as myoelectric fatigue[22], to distinguish this phase from the following one —the task failure phase — when the assigned level of forcecannot be further sustained. This fact suggests that themuscle becomes less fatigable, and it could be easilyexplained supposing that the most fatigable 2B fibres areno longer recruited.
81P. Sbriccoli et al. / Journal of Electromyography and Kinesiology 11 (2001) 73–83
Our decay results contrast with the findings of Kroonand Naeije [19] who observed an increase in the meanpower frequency decay after EC. We suppose that thisdifference could be ascribed to the lower effort requiredof their subjects with respect to ours.
A marked decrease in maximum tetanic tension andprolonged depolarisation of muscle membrane after EC,persisting for 1–2 days, has been proven in rats [21].This effect was due to the activation of the stretch-acti-vated ion channels and sarcolemmal disruption. Theauthors suggested that the activation of these specialchannels might contribute to the genetic expressionwhich induces the hypertrophic effect of EC.
Also chaos analysis shows that the sEMG L1 decayover time is reduced after EC. It has recently been dem-onstrated in healthy human muscles that also the recur-rence analysis shows, during sustained contraction, aprogressive modification in the sEMG, resulting in anincrease in the percent of determinism [9,27,28]. Weobtained a similar result in our subjects — both CNTand EC groups — tested before EC with the L1 analysis(see Fig. 5). After stretching, in the EC group thereduction of L1 decay with respect to the pre-EC valueswas practically identical to that of MDF as demonstratedin Fig. 6.
The question is now to understand if non-linear analy-sis provides or not different information on neuromuscu-lar function from the linear one. Webber and Zbilut [27],discussing their results on non-linear analysis of sEMG,suggested that RPA could have at least the advantage ofexamining the signals in higher dimensions, with respectto time and/or frequency analysis and indicated that theembedding dimensions can be thought in terms of rulesgoverning the system. In this research, we used the Ken-nel et al. algorithm [18] to determine the embeddingdimension, which was found to be 9. Following Webberand Zbilut [27] this could suggest that our sEMGsdepend on (921)/2 unknown variables. Non-linear ana-lytical tools still require further critical assessment onbiological models, before such inferences can be confi-dently made. However, the application of a non-lineartool to EMG seems very promising, and we agree withWebber and Zbilut’s opinion that comparison withclassical analytical techniques could help in exploring itseffectiveness. Our results seem to show a second featureof non-linear analysis, i.e. that this tool is more sensitivethan MDF to myoelectric signs of muscle damage andrecovery (see Fig. 6). From this point of view, it willprove very useful in many applications, such as in ergo-nomics and in clinical sports medicine. Future researchcould show whether this technique offers only a surro-gate of frequency analysis or — as we believe — willpenetrate deeper the ongoing mechanisms preceding thevisible mechanical failure of the muscle.
The inter-subject variability in blood enzymes is nota new finding [6], but the reasons are yet to be clarified.
Recovery from muscle damage, detected by US and CK–LDH was achieved by our subjects in two weeks, whichwas not very different from that reported by Chlebounat al. [3].
It has been proved that the stretching manoeuvreinduces a sudden inflammatory response within theinjured muscle [1]. Our results suggest that the musclebelly thickness (oedema and swelling) can be detectedas late as 3 hours after EC. This result is in accordancewith Chleboun and co-workers [3], who also observeda minimal swelling of flexors muscles immediately afterEC, followed by a more substantial swelling (26%) 3days later recovering 7–11 days after EC. They alsoobserved a relationship between the time-course of mus-cle swelling and the appearance of CK in the blood,which reached its maximum 4–5 days after EC. Nosakaand Clarkson [24] found an increase in muscle thickness(US assessment) with the same time peak (3–4 days afterEC). A result which has not previously been reported,to our knowledge, is the sudden modification in localblood flow, which we observed 3 hours after EC. Theincrease in echo-Doppler data accompanied by thedecrease in pulsatility index indicates a reduction in theperipheral resistance with an increase in the mean velo-city of the blood flowing in the muscle. These signs ofinflammation recovered in two weeks, which was notvery different from that reported by Chleboun et al. [3].Conversely, magnetic resonance (MR) showed that signsof muscle impairment were still present 56 days afterthe first bout of EC exercise [10]. This was reflectedby T2 relaxation time elevation. Ultrasonography offers,over MR, the relative advantages of saving money andtime.
Acknowledgements
This work was supported by the National Ministry ofHealth, RF 96.324.
References
[1] Blais C Jr, Adam A, Massicotte D, Peronnet F. Increase in bloodbradykinin concentration after eccentric weight-training exercisein men. J Appl Physiol 1999;87(3):1197–201.
[2] Burden A, Bartlett R. Normalisation of EMG amplitude: anevaluation and comparison of old and new methods. MedicalEngineering and Physics 1999;21:247–57.
[3] Chleboun GS, Howell JN, Conaster RR, Giesey JJ. Relationshipbetween muscle swelling and stiffness after eccentric exercise.Med Sci Sports Exerc 1998;30(4):529–33.
[4] Day SH, Donnelly AE, Brown SJ, Child RB. Electromyogramactivity and mean power frequency in exercise-damaged humanmuscle. Muscle Nerve 1998;21:961–3.
[5] De Luca CJ, Knaflitz M. Surface Electromyography: What’sNew? Turin, Italy: CLUT Edizioni Pub, 1992.
[6] Ebbeling CB, Clarkson PM. Exercise-induced muscle damageand adaptation. Sports Med 1989;7:207–34.

82 P. Sbriccoli et al. / Journal of Electromyography and Kinesiology 11 (2001) 73–83
[7] Elbert T, Ray WJ, Kowalik ZJ, Skinner JE, Graf KE, BirbaumerN. Chaos and physiology: deterministic chaos in excitable cellassemblies. Physiol Rev 1994;74:1–47.
[8] Felici F, Colace L, Sbriccoli P. Surface EMG modifications aftereccentric exercise. J Electromyogr Kinesiol 1997;7:193–202.
[9] Filligoi GC, Felici F. Detection of hidden rhythms in surfaceEMG signals with a non-linear time-series tool. Medical Engin-eering and Physics 1999;21:439–48.
[10] Foley JM, Jayaraman RC, Prior BM, Pivarnik JM, Meyer RA.MR measurements of muscle damage and adaptation after eccen-tric exercise. J Appl Physiol 1999;87(6):2311–8.
[11] Friden J, Lieber RL. Structural and mechanical basis of exercise-induced muscle injury. Med Sci Sports Exerc 1992;24:521–30.
[12] Friden J, Sjostrom M, Ekblom B. Myofibrillar damage followingintense eccentric exercise in man. Int J Sports Med 1983;4:170–6.
[13] Gosling RG, King DH. Ultrasonic angiology. In: Harcus AW,Adamsons L, editors. Arteries and Veins. Edinburgh: ChurchillLivingstone, 1975:61–98.
[14] Hagg GM. Interpretation of EMG spectral alterations and alter-ation indexes at sustained contractions. J Appl Physiol1992;73:1211–7.
[15] Hortobagyi T, Houmard J, Fraser D, Dunek R, Lambert J, TracyJ. Normal forces and myofibrillar disruption after repeated eccen-tric exercise. J Appl Physiol 1998;84(2):492–8.
[16] Iasemidis LD, Sackellares JC, Zaveri HP, Williams WJ. Phasespace topography and Lyapunov exponent of electrocorticogramsin partial seizures. Brain Topography 1990;2(3):187–201.
[17] Jones DA, Newham DJ, Round JM, Tolfree SEJ. Experimentalhuman muscle damage: morphological changes in relation toother indices of damage. J Physiol 1986;375:435–48.
[18] Kennel MB, Brown R, Abarbanel HDI. Determining embeddingdimension for phase-space reconstruction using a geometricalconstruction. Physical Rev A 1992;45:3403–11.
[19] Kroon GW, Naeije M. Recovery of the human biceps electromy-ogram after heavy eccentric, concentric or isometric exercise. EurJ Appl Physiol 1991;63:444–8.
[20] Liebert W, Schuster HG. Proper choice of the time delay for theanalysis of chaotic time series. Physics Lett A 1989;142:107–10.
[21] McBride T, Stockert BW, Gorin FA, Carlsen RC. Stretch-acti-vated ion channels contribute to membrane depolarization aftereccentric exercise. J Appl Physiol 2000;88:91–101.
[22] Merletti R, Lo Conte LR, Orizio C. Indices of muscle fatigue. JElectromyogr Kinesiol 1991;1:20–33.
[23] Newham DJ. The consequences of eccentric contractions andtheir relationship to delayed onset muscle pain. Eur J Appl Phy-siol 1998;57:353–9.
[24] Nosaka K, Clarkson PM. Changes in indicators of inflammationafter eccentric exercise of the elbow flexors. Med Sci SportsExerc 1996;28(8):953–61.
[25] Sachs L. Applied Statistics. A Handbook of Techniques. 2nd ed.Springer Verlag, 1984.
[26] Stauber WT. Eccentric action of muscles: Physiology, injury, andadaptation. Exerc Sports Sci Rev 1989;17:157–85.
[27] Webber CL Jr, Zbilut JP. Dynamical assessment of physiologicalsystems and states using recurrence plot strategies. J Appl Physiol1994;76(2):965–73.
[28] Webber CL Jr, Schmidt MA, Walsh JM. Influence of isometricloading on biceps EMG dynamics as assessed by linear and non-linear tools. J Appl Physiol 1995;78(3):814–22.
[29] Webber CL Jr, Rhythmogenesis of deterministic breathing pat-terns. Springer Series in Synergetics 1991;55:177–91.
[30] Wolf A, Swift JB, Swinney HL, Vastano JA. Determining Lyapu-nov exponents from a time series. Physica D 1985;16:285.
[31] Zipp P. Recommendation for the standardization of lead positionsin surface electromyography. Eur J Appl Physiol 1982;50:41–54.
Paola Sbriccoli was born in 1964. In 1986 shegraduated “cum laude” at the ISEF (SuperiorInstitute of Physical Education) of Rome. In1994 she received her Medical Doctor degreefrom the University of Rome “La Sapienza” andin 1998 she specialized “cum laude” in SportMedicine. Since 1991 she has worked, first as amedical student and then as a qualified Doctor,at the Institute of Human Physiology of thesame University, where she is actually a Ph.D.student in Physiopathology of Movement. Hermain interests in research are non invasive
assessment of muscle damage and repair, and linear and non-linear analy-sis of sEMG signals in healthy humans.
Francesco Feliciwas born in 1957. He gradu-ated “cum laude” in Medicine in 1982 and speci-alized “cum laude” in Sport Medicine in 1985.He was visiting researcher at the NeuromuscularResearch Center of Boston University during1990. From 1983 to 2000 he was appointed asresearcher of the University of Rome “La Sapi-enza” Institute of Human Physiology. Hispresent appointment is with the University Insti-tute of Motor Sciences of Rome, Faculty ofMotor Sciences. His main research interests areexercise physiology and biomechanics in heal-
thy subjects with special emphasis on regulation of motor units recruitmentand firing rate during voluntary contractions.
Alessandro Rosponi was born in 1967. Hereceived his Medical Doctor degree in 1995from the University of Rome “La Sapienza” andis a student in the Postgraduate Sports MedicineSchool. Since 1993 he has worked first as amedical student and then as a Doctor at the Insti-tute of Human Physiology of the same Univer-sity. His research interests are related in the fieldof physiology applied to physical exercise, mus-cle physiology and muscle adaptations to alti-tude.
Antonio Aliotta was born in 1961. He receivedhis Medical Doctor degree “cum laude” in 1987from the Catholic University of Sacro Cuore ofRome. He specialized “cum laude” in Gastroen-terology and Digestive Endoscopy in 1991 at thesame university. He is a member of the ItalianSociety of Ultrasonology in Medicine andBiology (SIUMB). Since 1987 he has taught atthe SIUMB (Policlinico Gemelli, Rome, Italy).Since 1990 he has been responsible for theEchographic Unit at the ALITALIA Company.Since 1993 he has been responsible for the
Echographic Unit at the S. Lucia Foundation, Rehabilitation Hospital,Rome, Italy. He is co-author of many international papers concerningultrasonography in medicine.
Vincenzo Castellano was born in 1931. Hereceived his Medical Doctor degree from theUniversity of Rome “La Sapienza” in 1955. Heis a specialist in Orthopaedics, in Physiatrics andin General Surgery. He is a former HeadOrthopedist at the Paraplegic Center in OstiaLido, Rome; a former Professor both of theSchool of Specialization in Physical Medicineand Rehabilitation and of the School of Special-isation in Urology at the University of Rome“Tor Vergata”; and former Professor of theSchool of Rehabilitation Therapy at the Hospital
San Giovanni in Rome. He is Chairman of the Biomedical Committee ofthe Italian Soccer Federation (FIGC, Italian Olympic Committee). He isa scientific consultant for the Rehabilitation Hospital IRCCS Santa Luciain Rome.
83P. Sbriccoli et al. / Journal of Electromyography and Kinesiology 11 (2001) 73–83
Claudia Mazza was born in 1973. She got herdegree in 1999 from the faculty of Engineeringat the University of Rome “La Sapienza”, witha thesis on the non-linear analysis of the sEMGsignal. She worked at the Human PhysiologyInstitute at the University “La Sapienza” ofRome until May 1999 and at the present she isworking at the INAIL RTR Centre in Viareggio(Lucca, Italy), where she is taking part in aresearch project in the development of newrehabilitative technologies.
Marco Bernardi was born in 1961. He receivedhis Medical Doctor degree in 1987 from theUniversity of Rome “La Sapienza” and special-ized in Sports Medicine in 1991. Since 1985 hehas worked, first as a medical student and thenas a qualified Doctor, at the Institute of HumanPhysiology of the same University, where hecurrently works as a researcher and teachesHuman Physiology at the Faculty of Medicine.From February 1993 to June 1994 he conductedresearch in motor unit recruitment strategy (aresearch topic in which he is still involved) at
the Bioengineering Laboratory of the Louisiana State University MedicalCenter in New Orleans, Louisiana, USA. His other main areas of scientific
interest are exercise physiology both in healthy and physically handi-capped subjects and rehabilitation and locomotor recovery of disabledpatients. He is a member of the Italian Society of Physiology, the EuropeanCollege of Sport Science, the American College of Sport Medicine andthe International Society for Electromyography and Kinesiology. He is ascientific consultant for the S. Lucia Foundation Rehabilitation Hospital,Rome, Italy. He is President of the Italian Medical Committee of the Ital-ian Sports Federation of the Disabled.
Marco Marchetti was born in 1931. Hereceived his Medical Doctor Degree from theUniversity of Rome “La Sapienza” in 1955.Since 1955 he has worked, first as a medicalstudent and then as Assistant, at the Institute ofHuman Physiology of the same University,where he currently is Full Professor. He is alsoProfessor and Director of the SpecialisationSchool of Sport Medicine of the University ofRome “La Sapienza”. His main areas of scien-tific interest are sport physiology both in healthy(particularly in sailing) and in physically handi-
capped subjects, biomechanics of walking both in normal subjects anddisabled patients and muscle physiology. He is a scientific consultant forthe Rehabilitation Hospital Santa Lucia (Rome, Italy). He is a member ofthe Italian Medical Committee of the Italian Federation of Sailing (FIV)and International Society for Electromyography and Kinesiology.