Excel Versions - Plum Solutions
15
Excel Versions T his document contains supplementary material to the book Using Excel for Business Analysis: A Guide to Financial Modelling Fundamentals. It compares the different versions of Excel that are currently being used by analysts in a Windows environment, as well as an overview of using Excel on a Mac. CONTENTS History of Excel Versions 1 Current Excel Usage 2 Key Poll Findings 2 Which Version Am I Using? 3 Major Changes between Versions 4 Excel 2007–2010 Compatibility 6 Upgrading from Excel 2007 to Excel 2010 7 Major Changes between Versions 7 Improvements to the Charts between Versions 10 New Calculation and Function Features 11 Additional Changes Made to Excel 2010 11 Filter Options 11 Should You Upgrade? 13 Using Excel on a Mac 13 Excel for Mac 2008 14 Excel for Mac 2011 14 Automating Repetitive Tasks 14 Run Excel for Windows from a Mac 14 Compatibility 15 There are currently three different versions of Excel that modellers are likely to be using: Excel 2003, 2007, or 2010. Ordinarily, it would not be such a big deal but the differences between Excel 2003 were so great, it does have quite a big impact on heavy- duty Excel users such as financial modellers, and therefore we need to consider, the implications of the changes between the different versions in detail. HISTORY OF EXCEL VERSIONS Excel 2003 was released in November 2003, and there was not a huge change between this version and its predecessors, Excel 2002 (XP) and Excel 2000. However, in Jan- uary 2007, Office 2007 was released, which was wildly different in terms of interface from anything users had even seen. The 2010 version was released in June 2010 which had a few changes, but nothing like the change between 2003 and 2007. Excel Versions 22 June 2012; 21:0:42 1
-
Upload
khangminh22 -
Category
Documents
-
view
1 -
download
0
Transcript of Excel Versions - Plum Solutions
Excel Versions
This document contains supplementary material to the book Using Excel for BusinessAnalysis: A Guide to Financial Modelling Fundamentals. It compares the different
versions of Excel that are currently being used by analysts in a Windows environment,as well as an overview of using Excel on a Mac.
CONTENTS
History of Excel Versions 1Current Excel Usage 2
Key Poll Findings 2Which Version Am I Using? 3Major Changes between Versions 4Excel 2007–2010 Compatibility 6
Upgrading from Excel 2007 to Excel 2010 7Major Changes between Versions 7Improvements to the Charts between Versions 10New Calculation and Function Features 11Additional Changes Made to Excel 2010 11
Filter Options 11Should You Upgrade? 13Using Excel on a Mac 13Excel for Mac 2008 14Excel for Mac 2011 14Automating Repetitive Tasks 14Run Excel for Windows from a Mac 14Compatibility 15
There are currently three different versions of Excel that modellers are likely to beusing: Excel 2003, 2007, or 2010. Ordinarily, it would not be such a big deal but thedifferences between Excel 2003 were so great, it does have quite a big impact on heavy-duty Excel users such as financial modellers, and therefore we need to consider, theimplications of the changes between the different versions in detail.
HISTORY OF EXCEL VERSIONS
Excel 2003 was released in November 2003, and there was not a huge change betweenthis version and its predecessors, Excel 2002 (XP) and Excel 2000. However, in Jan-uary 2007, Office 2007 was released, which was wildly different in terms of interfacefrom anything users had even seen. The 2010 version was released in June 2010 whichhad a few changes, but nothing like the change between 2003 and 2007.
Excel Versions 22 June 2012; 21:0:42
1
CURRENT EXCEL USAGE
When Excel 2007 was first released four years ago, it caused division amongst analystsand financial modellers, with many vowing to stay as far away from it as possible. Thenew ribbon layout has been described as chaotic, not intuitive, and as one pollrespondent says: “it does my head in”! From a financial modelling perspective ofcourse, model structure, layout, and best practice are far more important than the fancynew tools introduced by Excel 2007, and many modellers have shunned the new ver-sion for the past few years in favour of its more primitive predecessor. It can certainlytake some getting used to, but there are many new features which make it worthwhile,such as new functions, increased file size, and additional charting options and tools.
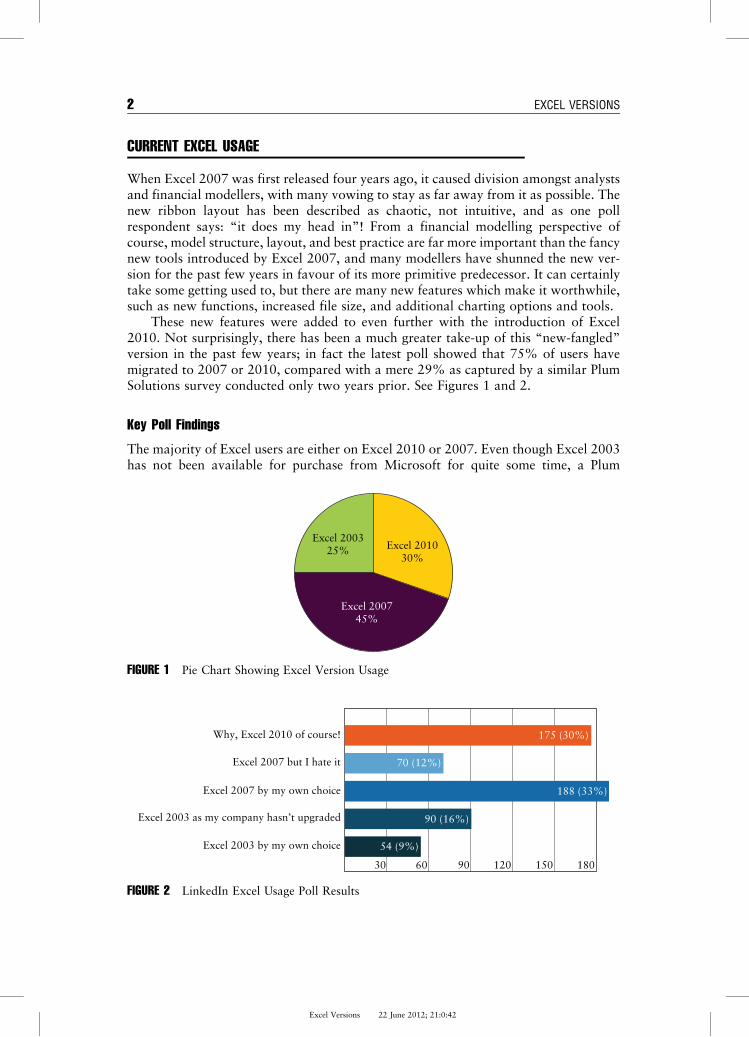
These new features were added to even further with the introduction of Excel2010. Not surprisingly, there has been a much greater take-up of this “new-fangled”version in the past few years; in fact the latest poll showed that 75% of users havemigrated to 2007 or 2010, compared with a mere 29% as captured by a similar PlumSolutions survey conducted only two years prior. See Figures 1 and 2.
Key Poll Findings
The majority of Excel users are either on Excel 2010 or 2007. Even though Excel 2003has not been available for purchase from Microsoft for quite some time, a Plum
Why, Excel 2010 of course! 175 (30%)
70 (12%)
188 (33%)
90 (16%)
54 (9%)
Excel 2007 but I hate it
Excel 2007 by my own choice
Excel 2003 as my company hasn’t upgraded
Excel 2003 by my own choice
30 60 90 120 150 180
FIGURE 2 LinkedIn Excel Usage Poll Results
Excel 200325% Excel 2010
30%
Excel 200745%
FIGURE 1 Pie Chart Showing Excel Version Usage
Excel Versions 22 June 2012; 21:0:42
2 EXCEL VERSIONS

Solutions survey which was conducted in 2011 showed that 25% of Excel users werestill on 2003—most of them because their company simply had not upgraded yet and sothey had no option. Excel 2003 will eventually be phased out over the next few years,but until then, no matter which version of Excel you are using, financial modellers stillneed to be aware of the differences between the versions. This is particularly the case interms of functionality, where if a function, tool, or colour, is created in 2010 or 2007,and then opened in 2003 it can lose functionality. At times, it can simply mean a slightdifference in interface, but often, as with the example of new functions not available in2003, it can cause errors to be displayed.
Many users accept Microsoft Excel’s dominance in the marketplace and are keento keep their skills up to date by voluntarily upgrading to the latest version. Less than10% have remained on Excel 2003 through their own choice, an indication perhapsthat most people are not resistant to change where their computer skills are concerned.Of those who dislike the newer versions, under-25s and over-54s did so in equalmeasure, reflecting perhaps that older and younger age groups are more resistant tochange. A massive 33% of those who have embraced the new Excel 2010 are in the30–36 year old age bracket.
The ribbon, which was new to Office 2007, is the source of most complaints, withcomments such as “illogical layout”, “why fix [the menu system] when it ain’t broke?”and “hated ribbons initially, but getting used to it.” However, a number of commentsdid welcome the ribbon—and one even trashed the old menu system.
WHICH VERSION AM I USING?
If you have got toolbars at the top of your screen which expand to drop-down menus,you are using what some call classic Excel: Excel 2003 or earlier. See Figure 3.
If your screen looks like Figure 4, with a Microsoft button in the top left-handcorner, and a ribbon instead of drop-down menus, you are using Excel 2007.
FIGURE 3 Classic Excel
Excel Versions 22 June 2012; 21:0:42
Excel Versions 3
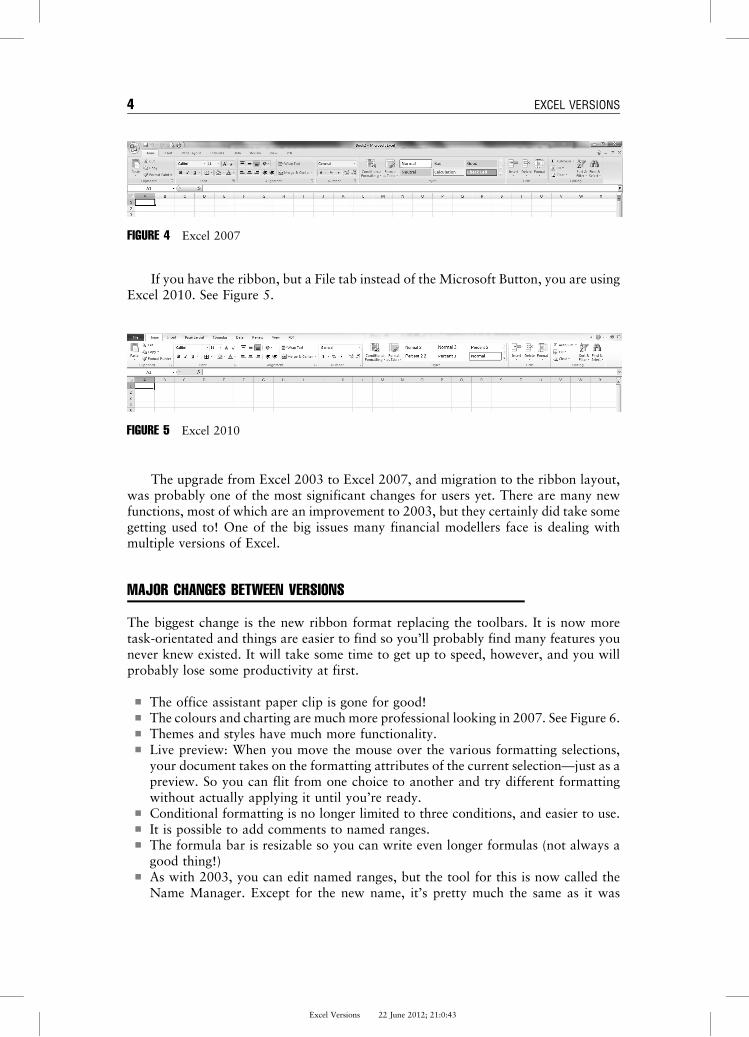
If you have the ribbon, but a File tab instead of the Microsoft Button, you are usingExcel 2010. See Figure 5.
The upgrade from Excel 2003 to Excel 2007, and migration to the ribbon layout,was probably one of the most significant changes for users yet. There are many newfunctions, most of which are an improvement to 2003, but they certainly did take somegetting used to! One of the big issues many financial modellers face is dealing withmultiple versions of Excel.
MAJOR CHANGES BETWEEN VERSIONS
The biggest change is the new ribbon format replacing the toolbars. It is now moretask-orientated and things are easier to find so you’ll probably find many features younever knew existed. It will take some time to get up to speed, however, and you willprobably lose some productivity at first.
n The office assistant paper clip is gone for good!n The colours and charting are much more professional looking in 2007. See Figure 6.n Themes and styles have much more functionality.n Live preview: When you move the mouse over the various formatting selections,
your document takes on the formatting attributes of the current selection—just as apreview. So you can flit from one choice to another and try different formattingwithout actually applying it until you’re ready.
n Conditional formatting is no longer limited to three conditions, and easier to use.n It is possible to add comments to named ranges.n The formula bar is resizable so you can write even longer formulas (not always a
good thing!)n As with 2003, you can edit named ranges, but the tool for this is now called the
Name Manager. Except for the new name, it’s pretty much the same as it was
FIGURE 5 Excel 2010
FIGURE 4 Excel 2007
Excel Versions 22 June 2012; 21:0:43
4 EXCEL VERSIONS

before, although you can now delete multiple names at once and assign commentsto each name.
n The size of each worksheet has expanded from 65,000 to over 1 million rows!n It now remembers up to fifty recently used files instead of nine.n There are more options in the right-click menu.n Sort and Filter are now together, so you can sort from the filter drop-down list.n Sorting limits have increased from three to 64 levels and you can even sort by
colour! (This feature is activated when at least one cell contains a fill or fontcolour.)
n It has a new file format which facilitates integration with external data sources,and also offers reduced file sizes and improved data recovery. In Excel 2007, thedefault format for an Excel workbook is the XML-based file format (.xlsx). Ifthe file contains macros, the format will need to be .xlsm.
n On Demand ribbons, which only appear when required for less used tools likepivot tables, charts, etc. Although many new users hate the ribbon, the OnDemand feature is much better than the old Excel 2003, which clutter up yourscreen, sometimes do not load when you open Excel, and remain floating after youdon’t need them anymore.
n Pivot tables and charting do not use wizards anymore, and are completelydifferent.
Completely New in 2007
n Many previously custom functions are now standard, including: IFERROR,EOMONTH, SUMIFS, COUNTIFS, AVERAGEIFS, XNPV, and XIRR.
n Data bars in conditional formatting will show dynamic bar relative to the size ofthe value in the cell.
n Remove duplicates tool. (Very useful!)
FIGURE 6 Styles in Excel 2007/10
Excel Versions 22 June 2012; 21:0:43
Excel Versions 5

TIP
Press the Alt key, and the ribbon shortcut keys will appear as shown in Figure 7.
If you really hate the ribbons in Excel 2007 but are stuck with it, you can alsopurchase add-in software that installs the classic menu for Excel 2007 or 2010, whichlooks like Figure 8.
EXCEL 2007--2010 COMPATIBILITY
Until everyone has upgraded to the new version, compatibility will remain the biggestchallenge for Excel 2007 users, especially if others need to open themodel in 2003. Thereare a number of new functions in 2007/10 which are not available in 2003. If you are theonly person using 2007/10 and everyone in your office or your clients are still on 2003,you will have to make sure you do not use the new functions, otherwise you will havecompatibility issues. Note that all the great graphics and colours still look fine when youopen the model in 2003, as long as you do not use a formula not supported in 2003.
A compatibility checker tells you if your workbook contains features that previousversions of Excel will not support. But be careful—you will need to remember to save a
FIGURE 7 Shortcut Keys Excel 2007/10
FIGURE 8 Classic Menu in Excel 2007/10
Excel Versions 22 June 2012; 21:0:44
6 EXCEL VERSIONS
document in Excel 2003 format to maintain compatibility with other users until thenew 2007 file format becomes the standard. While Microsoft has released a converterto read 2007 files in earlier versions, do not rely on your colleagues to have it installed.
If you use new functions not available in 2003, the compatibility checker will keepadvising you to save a copy in 2003, which gets rather annoying after a while.
Upgrading from Excel 2007 to Excel 2010
The introduction of Office 2007 caused such an uproar that upgrade from Excel 2007to Excel 2010 was completed very quickly. Most of the complaints were because the2007 version had completely changed the menu navigation. While Microsoft attemptedto simplify the navigation screens to market the product to a general public, the impactwas felt across all professions. The Office 2010 environment was quickly scaled backand made more instinctual to the users that operate the system on a daily basis.
MAJOR CHANGES BETWEEN VERSIONS
The first major change to Office 2010 is the performance of the software. Included inthe package, Microsoft offers Excel 2010 in the 64-bit format. This uses substantiallymore memory to maximise performance for calculating complex equations. Microsoftintroduces High Performance Computing (HPC), which solves complex calculationsusing multiple computers. This allows Excel to offload complex calculations to othercomputers on the network. It allows the computer to calculate other parts in aworkbook in parallel, increasing performance of the software.
The biggest change for Office 2010 is the move back to the classic format andnavigation in the menu screens. The most noticeable change is that the Microsoft Officebutton is no longer present in the 2010 version.
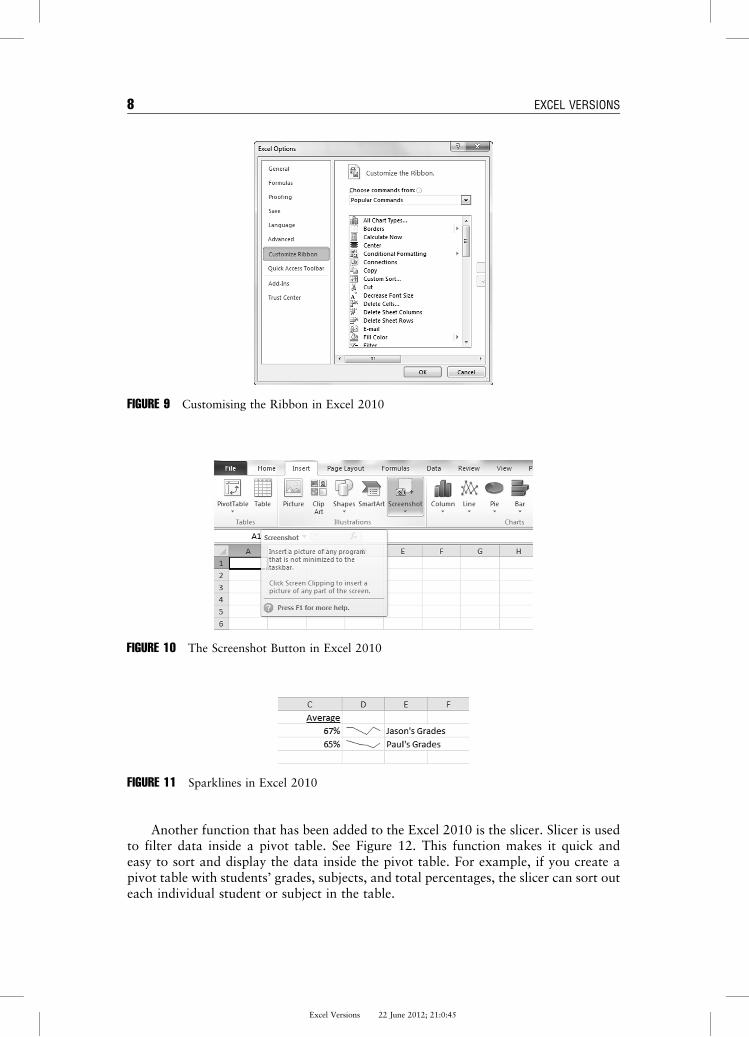
One of the most powerful changes that were added to Excel 2010 is the ability tocustomise the ribbon and toolbars. In Excel 2003, the toolbar is very customisable.Users were accustomed to moving their menu bar around, and only showing the toolsthat they used frequently. This customisation ability was drastically reduced with theExcel 2007 ribbon, where there is very little freedom to change the menu. Excel 2010,however, allows you to create your own workspace environment. You can click onExcel Options as shown in Figure 9 and customise the ribbon to add menus, tabs, orfunctions any way you like.
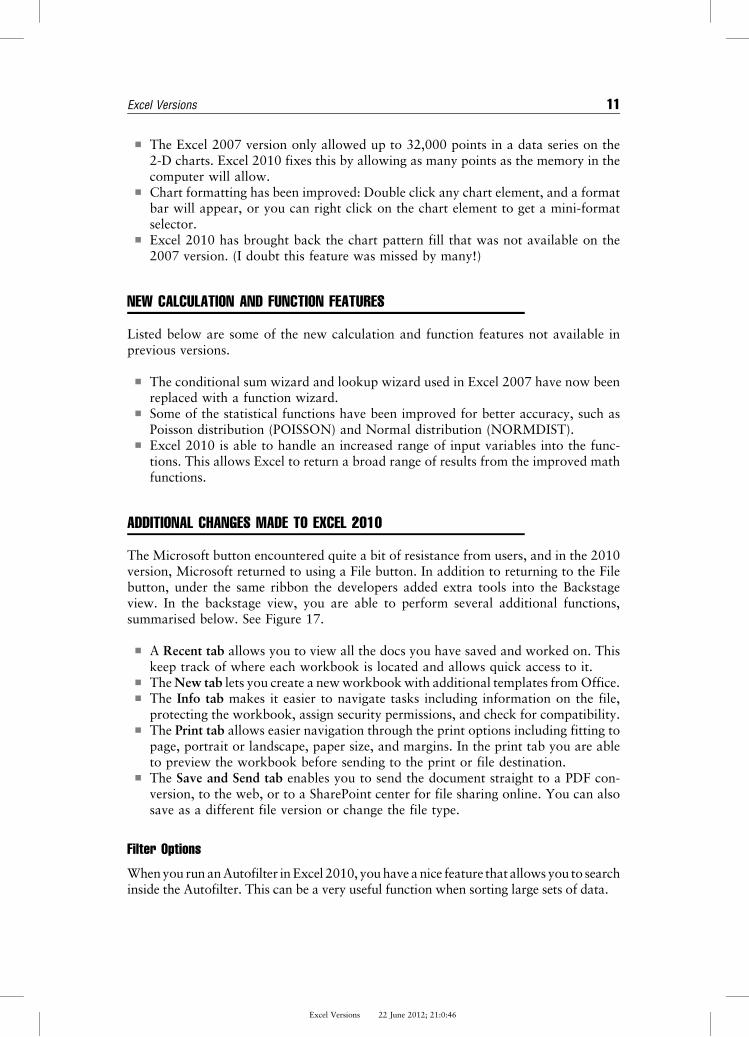
The changes between Excel 2007 and 2010 are quite difficult to detect because theHome tabs are virtually identical. However, there are some significant improvementson the other tabs inside Excel.
Inside the Insert tab, the first noticeable difference between 2007 and 2010 is theScreenshot button. This function allows you to capture a screen anywhere on yourdesktop and import it into the office environment. See Figure 10.
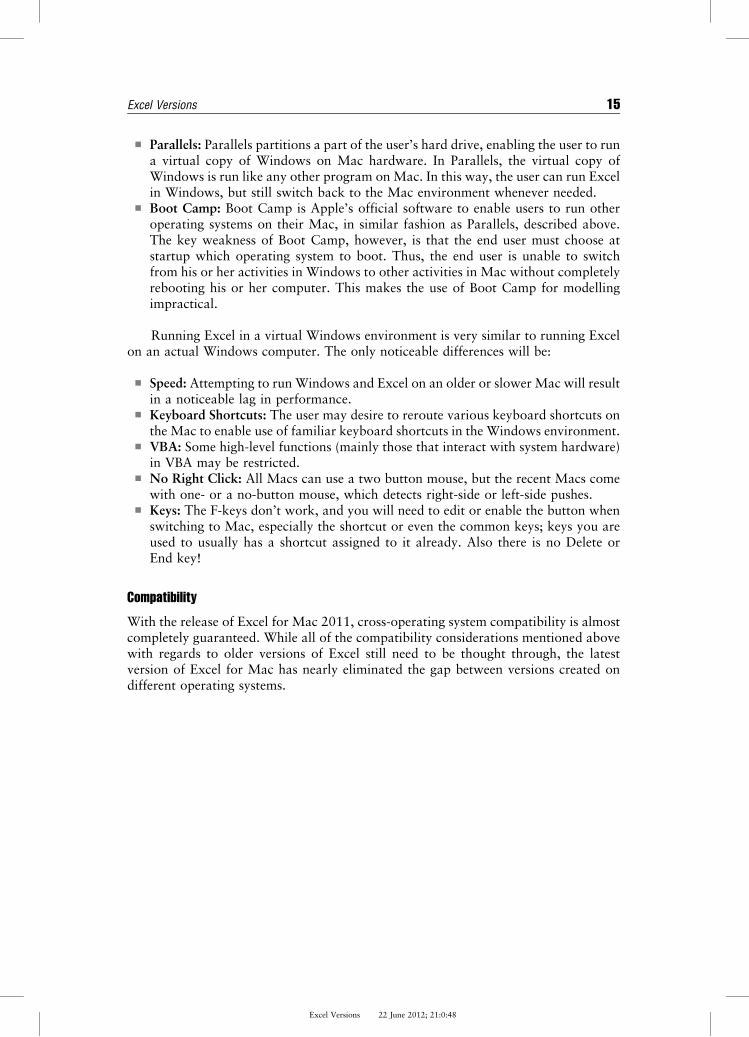
The next noticeable improvement is the new feature called sparklines, which isgreat for inserting miniature charts into reports and dashboards. Sparklines are smallmini-charts that can be plotted to enhance the visualisation of the tabular data. SeeFigure 11. This function enables you to insert a line, bar, or win/loss into a single cell.This will allow you to add enhanced visual data analysis functions into pivot tables anddashboards.
Excel Versions 22 June 2012; 21:0:45
Excel Versions 7
Another function that has been added to the Excel 2010 is the slicer. Slicer is usedto filter data inside a pivot table. See Figure 12. This function makes it quick andeasy to sort and display the data inside the pivot table. For example, if you create apivot table with students’ grades, subjects, and total percentages, the slicer can sort outeach individual student or subject in the table.
FIGURE 9 Customising the Ribbon in Excel 2010
FIGURE 10 The Screenshot Button in Excel 2010
FIGURE 11 Sparklines in Excel 2010
Excel Versions 22 June 2012; 21:0:45
8 EXCEL VERSIONS

Excel 2010 has improved the tab under Pivot Table by adding a Show Values drop-down menu that allows you to quickly change how to show the information in thetable. You can also change the values inside the table by using the drop-down menu:Summarise values by.
Excel 2010 also adds a new feature into the Paste function. The Paste function nowhas previews built in, so when you copy and right-hand click, you can see each specialtyyou can use and what it looks like before you select it. See Figure 13.
Excel 2007 had made substantial improvements to the conditional formattingfunction inside Excel. It is much easier to fill cells based on a value or rules inside it, andthe visual displays such as data bars, colour scales, and icon sets are very easy touse, and visually appealing. See Figures 14–16. Excel 2010 has added a little bit ofadditional functionality such as data bars with solid fill instead of a gradient. Thedata visualisation gurus were not very happy about a bar chart without solid com-parison lines!
FIGURE 12 Pivot Table Using Slicer in Excel 2010
FIGURE 13 Paste Options in Excel 2010
Excel Versions 22 June 2012; 21:0:45
Excel Versions 9

IMPROVEMENTS TO THE CHARTS BETWEEN VERSIONS
Microsoft made some significant changes to the chart features inside Excel 2010. Thishas improved Excel’s graphing and charting functionalities.
n Excel 2010 has enhanced the chart capability by supporting macro recording torecord format changes to the charts. The Excel 2007 version did not producemacro code when creating format changes with recording.
FIGURE 14 Data Bar Tool in Excel 2010
FIGURE 15 Data Bars in Excel 2007
FIGURE 16 Data Bars in Excel 2010
Excel Versions 22 June 2012; 21:0:46
10 EXCEL VERSIONS
n The Excel 2007 version only allowed up to 32,000 points in a data series on the2-D charts. Excel 2010 fixes this by allowing as many points as the memory in thecomputer will allow.
n Chart formatting has been improved: Double click any chart element, and a formatbar will appear, or you can right click on the chart element to get a mini-formatselector.
n Excel 2010 has brought back the chart pattern fill that was not available on the2007 version. (I doubt this feature was missed by many!)
NEW CALCULATION AND FUNCTION FEATURES
Listed below are some of the new calculation and function features not available inprevious versions.
n The conditional sum wizard and lookup wizard used in Excel 2007 have now beenreplaced with a function wizard.
n Some of the statistical functions have been improved for better accuracy, such asPoisson distribution (POISSON) and Normal distribution (NORMDIST).
n Excel 2010 is able to handle an increased range of input variables into the func-tions. This allows Excel to return a broad range of results from the improved mathfunctions.
ADDITIONAL CHANGES MADE TO EXCEL 2010
The Microsoft button encountered quite a bit of resistance from users, and in the 2010version, Microsoft returned to using a File button. In addition to returning to the Filebutton, under the same ribbon the developers added extra tools into the Backstageview. In the backstage view, you are able to perform several additional functions,summarised below. See Figure 17.
n A Recent tab allows you to view all the docs you have saved and worked on. Thiskeep track of where each workbook is located and allows quick access to it.
n TheNew tab lets you create a newworkbookwith additional templates fromOffice.n The Info tab makes it easier to navigate tasks including information on the file,
protecting the workbook, assign security permissions, and check for compatibility.n The Print tab allows easier navigation through the print options including fitting to
page, portrait or landscape, paper size, and margins. In the print tab you are ableto preview the workbook before sending to the print or file destination.
n The Save and Send tab enables you to send the document straight to a PDF con-version, to the web, or to a SharePoint center for file sharing online. You can alsosave as a different file version or change the file type.
Filter Options
Whenyou runanAutofilter inExcel 2010, youhave anice feature that allows you to searchinside the Autofilter. This can be a very useful function when sorting large sets of data.
Excel Versions 22 June 2012; 21:0:46
Excel Versions 11

When you have data on a table, the filter and sort will stay in the column heading,even when you scroll down. This is very convenient because you can always tell whatthe column content is without having to scroll to the top.
FIGURE 17 Backstage View in Excel 2010
FIGURE 18 Autofilter in Excel 2010
Excel Versions 22 June 2012; 21:0:46
12 EXCEL VERSIONS

Should You Upgrade?
According to the Plum Solutions survey, in 2011, 25% of Excel users were still usingExcel 2003 or earlier. If you plan to look for work soon, and you wonderwhich version of Excel future employers will want to see on your resume, Excel 2010is a must. But having familiarity with both versions will certainly improve yourmarketability.
If the updated features such as new functions and increased capacity are notenough to tempt you, there are many reasons to upgrade—by remaining on classicExcel you are really just delaying the inevitable. Excel 2003 is out of date: The oldOffice platform was built on what are now antiquated technologies. The leap to Office2007 represents a clean break in platform design.
The main reason many companies upgrade is because they are working with clientsor external parties using the later versions, and it’s just easier if you are using the sameversion. They often also upgrade to obtain some of the new features, in particularly theimproved file format which has much greater capacity.
USING EXCEL ON A MAC
Using Excel on a Mac for financial modelling has only recently become a viable option.Although Microsoft has been releasing versions of Excel for Mac since 1985, onlyrecently has the Mac version of the program been nearly as robust as its Windowscounterpart. Given the preference of many computer users for the Mac platform, and theplethora of options for automation that Mac’s OSX provides (Automator, Applescript,etc.), the inadequacies of Microsoft’s previous Mac releases were severely criticised.
The Excel for Mac 2011 user interface closely resembles that of Windows Excel2010. Excel 2011 doesn’t rely as heavily on the toolbox as previous versions of thesoftware; instead, commands are arranged on menus and a ribbon. The ribbon issimilar to that of its Windows counterpart, although it is not identical across platformsas seen in the images below.
Excel 2011 (Mac)
Excel 2010 (Windows)
Because of differences in underlying technologies, the user experience and func-tionality cannot be fully replicated from one platform to the other. For example theribbon interface found in the Windows version of the software is available in the Mac
Excel Versions 22 June 2012; 21:0:47
Excel Versions 13

version of the software too. However, because of Apple technologies, menus are stillavailable and several tools can still be accessed using the toolbox.
The ribbon is not identical across platforms, which may lead to confusion for usersworking in both environments, and will cause slight variations in instructions fordifferent tasks.
Excel for Mac 2008
Excel for Mac 2008 is the equivalent of Windows Excel 2007. One of the mostnoticeably absent features of Excel for Mac 2008 was the lack of VBA (Visual Basic forApplications) support; for this reason, it was not often used by serious analysts andmodellers. VBA was removed from Office 2008, as it was feared that it would be toounstable to run natively on Mac’s OSX.
This caused no small amount of problems for business users who had createdhighly sophisticated spreadsheets in previous versions of Excel, which included VBAmacros. Critical add-ins, such as Solver, were also not supported.
Excel for Mac 2008 also did not include Microsoft Office’s new Ribbon GUI,which had been released for Windows in 2007.
Excel for Mac 2011
With the release of Excel for Mac 2011, serious Excel users finally have the option ofusing Excel on the Mac platform. Excel’s powerful VBA scripting language has beennatively integrated into Mac’s Cocoa development platform. The customisable RibbonGUI has also been integrated, though the menu groupings differ slightly in name fromtime to time.
With the release of Excel 2011, Excel for Mac became a possible competitor toWindows Excel. As you will see in this book, only very rarely does one find a functionor feature available in the Windows version of Excel that is not available in the Macversion.
Automating Repetitive Tasks
One key benefit of working with Excel for Mac (as opposed to the alternative presentedbelow) is the ability to automate repetitive tasks with Mac’s Automator applicationand Applescript scripting language. Using the powerful combination of VBA andApplescript, one might, for instance, write an application that asks Excel for a namefrom a column called Company Name, run a web search for that company name,navigate to the first page returned from the search, parse all contact informationfrom that page, and pass the contact information back to Excel for population of pre-defined fields.
Run Excel for Windows from a Mac
Even though one still might not want to use Excel for Mac, it is still possible to useExcel on a Mac using software that allows one to install the Windows operating systemon a Mac. Several software options are available.
Excel Versions 22 June 2012; 21:0:48
14 EXCEL VERSIONS
n Parallels: Parallels partitions a part of the user’s hard drive, enabling the user to runa virtual copy of Windows on Mac hardware. In Parallels, the virtual copy ofWindows is run like any other program on Mac. In this way, the user can run Excelin Windows, but still switch back to the Mac environment whenever needed.
n Boot Camp: Boot Camp is Apple’s official software to enable users to run otheroperating systems on their Mac, in similar fashion as Parallels, described above.The key weakness of Boot Camp, however, is that the end user must choose atstartup which operating system to boot. Thus, the end user is unable to switchfrom his or her activities in Windows to other activities in Mac without completelyrebooting his or her computer. This makes the use of Boot Camp for modellingimpractical.
Running Excel in a virtual Windows environment is very similar to running Excelon an actual Windows computer. The only noticeable differences will be:
n Speed: Attempting to run Windows and Excel on an older or slower Mac will resultin a noticeable lag in performance.
n Keyboard Shortcuts: The user may desire to reroute various keyboard shortcuts onthe Mac to enable use of familiar keyboard shortcuts in the Windows environment.
n VBA: Some high-level functions (mainly those that interact with system hardware)in VBA may be restricted.
n No Right Click: All Macs can use a two button mouse, but the recent Macs comewith one- or a no-button mouse, which detects right-side or left-side pushes.
n Keys: The F-keys don’t work, and you will need to edit or enable the button whenswitching to Mac, especially the shortcut or even the common keys; keys you areused to usually has a shortcut assigned to it already. Also there is no Delete orEnd key!
Compatibility
With the release of Excel for Mac 2011, cross-operating system compatibility is almostcompletely guaranteed. While all of the compatibility considerations mentioned abovewith regards to older versions of Excel still need to be thought through, the latestversion of Excel for Mac has nearly eliminated the gap between versions created ondifferent operating systems.
Excel Versions 22 June 2012; 21:0:48
Excel Versions 15