Examining Trust and Risk in Mobile Money Acceptance in ...
22
sustainability Article Examining Trust and Risk in Mobile Money Acceptance in Uganda Ronald Baganzi ID and Antonio K. W. Lau * School of Management, Kyung Hee University, Seoul 130-701, Korea; [email protected] * Correspondence: [email protected]; Tel.: +82-2-961-9376 Received: 30 October 2017; Accepted: 1 December 2017; Published: 3 December 2017 Abstract: Mobile money adoption can contribute to achieving Sustainable Development Goals in Uganda but the factors affecting its sustainable adoption remain largely unknown. This paper explores the extent to which mobile money users’ trust and risk perceptions affect mobile money services adoption of in Uganda. A survey was conducted with 438 mobile money users from Uganda and data was analyzed using Partial Least Squares (PLS) Structural Equation Modelling (SEM). From the results, we obtained new empirical evidence for applying trust and risk perceptions for analyzing mobile money acceptance. We found that mobile money users rely on the structural soundness of mobile money services providers and their ability to provide mobile money services with low perceived risk. Performance expectancy, perceived risk and structural assurance significantly influenced behavioral intention to adopt mobile money. Trust belief did not significantly influence behavioral intention. These results help us to understand and promote mobile banking services in underdeveloped countries, which is of practical and scientific interests. We finally provide practical implications for mobile money services providers, commercial banks and central banks in Africa. Keywords: mobile money; sustainable adoption; trust; risk; self-efficacy; mobile money users; Uganda 1. Introduction In 2015, Sustainable Development Goals (SDGs) were adopted by member states of the United Nations (UN) to: fight injustice and inequality, end poverty and combat climate change by 2030 [1] (p. 4). To achieve SDGs, mobile technology is essential because it provides a platform for improving social and economic development, as it provides access to applications that address social challenges faced by vulnerable people and enables new innovations [2] (p. 1) for building societies that are environmentally sustainable [1] (p. 4). The mobile industry has made significant progress against SDGs through increased connectivity and information access by enabling mobile money to contribute to productivity and poverty eradication [1] (p. 4). Sending and receiving monetary value is possible using mobile money transfer on the mobile phone [3,4]. This has resulted in mobile money users’ convenience and flexibility as they are able to transact anytime, anywhere [5–7]. However, the growth of mobile money innovations comes with concern over security and risks [8,9]. As mobile money services continue to gain widespread consumer adoption, there is a growing concern about the risk and trust in the application [8,10]. We, therefore, posit that mobile money users’ risk and trust perceptions may influence the acceptance of mobile money services [7,9,11]. On the other hand, much as some researchers have picked serious interest in studying the acceptance of information technology (IT) applications [12–14], a few scholars have researched on mobile money adoption in poor countries [2,7,11,15,16]. Therefore, the dearth of research on understanding implications of trust and risk on the acceptance of mobile money in Uganda makes it worthwhile to study. Uganda is one of the countries in East Africa, a region that has been at the forefront of mobile money revolution in Africa in the past six years [17]. It is anticipated that the financial services sector Sustainability 2017, 9, 2233; doi:10.3390/su9122233 www.mdpi.com/journal/sustainability
-
Upload
khangminh22 -
Category
Documents
-
view
3 -
download
0
Transcript of Examining Trust and Risk in Mobile Money Acceptance in ...
sustainability
Article
Examining Trust and Risk in Mobile MoneyAcceptance in Uganda
Ronald Baganzi ID and Antonio K. W. Lau *
School of Management, Kyung Hee University, Seoul 130-701, Korea; [email protected]* Correspondence: [email protected]; Tel.: +82-2-961-9376
Received: 30 October 2017; Accepted: 1 December 2017; Published: 3 December 2017
Abstract: Mobile money adoption can contribute to achieving Sustainable Development Goals inUganda but the factors affecting its sustainable adoption remain largely unknown. This paperexplores the extent to which mobile money users’ trust and risk perceptions affect mobile moneyservices adoption of in Uganda. A survey was conducted with 438 mobile money users from Ugandaand data was analyzed using Partial Least Squares (PLS) Structural Equation Modelling (SEM).From the results, we obtained new empirical evidence for applying trust and risk perceptions foranalyzing mobile money acceptance. We found that mobile money users rely on the structuralsoundness of mobile money services providers and their ability to provide mobile money serviceswith low perceived risk. Performance expectancy, perceived risk and structural assurance significantlyinfluenced behavioral intention to adopt mobile money. Trust belief did not significantly influencebehavioral intention. These results help us to understand and promote mobile banking services inunderdeveloped countries, which is of practical and scientific interests. We finally provide practicalimplications for mobile money services providers, commercial banks and central banks in Africa.
Keywords: mobile money; sustainable adoption; trust; risk; self-efficacy; mobile money users; Uganda
1. Introduction
In 2015, Sustainable Development Goals (SDGs) were adopted by member states of theUnited Nations (UN) to: fight injustice and inequality, end poverty and combat climate changeby 2030 [1] (p. 4). To achieve SDGs, mobile technology is essential because it provides a platform forimproving social and economic development, as it provides access to applications that address socialchallenges faced by vulnerable people and enables new innovations [2] (p. 1) for building societiesthat are environmentally sustainable [1] (p. 4). The mobile industry has made significant progressagainst SDGs through increased connectivity and information access by enabling mobile money tocontribute to productivity and poverty eradication [1] (p. 4). Sending and receiving monetary value ispossible using mobile money transfer on the mobile phone [3,4]. This has resulted in mobile moneyusers’ convenience and flexibility as they are able to transact anytime, anywhere [5–7]. However,the growth of mobile money innovations comes with concern over security and risks [8,9]. As mobilemoney services continue to gain widespread consumer adoption, there is a growing concern aboutthe risk and trust in the application [8,10]. We, therefore, posit that mobile money users’ risk andtrust perceptions may influence the acceptance of mobile money services [7,9,11]. On the other hand,much as some researchers have picked serious interest in studying the acceptance of informationtechnology (IT) applications [12–14], a few scholars have researched on mobile money adoption inpoor countries [2,7,11,15,16]. Therefore, the dearth of research on understanding implications of trustand risk on the acceptance of mobile money in Uganda makes it worthwhile to study.
Uganda is one of the countries in East Africa, a region that has been at the forefront of mobilemoney revolution in Africa in the past six years [17]. It is anticipated that the financial services sector
Sustainability 2017, 9, 2233; doi:10.3390/su9122233 www.mdpi.com/journal/sustainability
Sustainability 2017, 9, 2233 2 of 22
will be transformed in the coming decades by information technologies, especially mobile money [17].Mobile money transactions across borders will be more relevant than today because of the East AfricanCommon Market, which will enable free services trading [18]. Mobile money transfer is an IT-drivendevelopment that has had a positive impact on financial inclusion of poor citizens [2,7,15,16] and hashelped central banks from a regulatory point of view [16,19]. Achieving financial inclusion is a bigstep towards attaining sustainable economic development in poor countries [1,6]. Mobile money hastransformed accessibility to financial services in East Africa [19]. It has improved welfare of peopleby positively impacting on household income [2]. Remittances received contribute to income directly,thereby reducing risk and liquidity constraints [2]. This has promoted agricultural commercialization,rural development and poverty reduction [2]. The number of people with mobile money accountsfar exceeds those with bank accounts in East Africa [17]. Registered mobile money users in Ugandaincreased from 17.9 Million to 19.8 Million between 2014 and 2015, as accounts in banks remainedat 5 Million [20]. However, this growing adoption of mobile money raises consumer protectionconcerns [10]. These include agent fraud; inappropriate disclosure of charges; system downtime;and agent liquidity issues [10]. The rate of mobile money adoption in East African countries alsodiffers [11]. For example, Kenya has a higher adoption rate than Uganda or Tanzania [2]. It is notedthat while M-Pesa (M stands for mobile; Pesa refers to money in Swahili [2,4]) has accelerated financialinclusion to millions of unbanked Kenyans, Uganda lags behind in its mobile money adoption rate [2].
Therefore, since it is unclear how Ugandan mobile money users perceive the technologyapplication, the objective of our study is to contribute to the mobile money literature on exploringthe risk and trust perceptions associated with the acceptance of mobile money services in Uganda.We develop a model for explaining how trust plays a critical role in users’ behavioral intention toadopt mobile money services. We posit that mobile money users’ risk perception should be studiedalongside trust in mobile money applications. We, therefore, ask the research question: How dotrust and risk perceptions of Ugandan mobile money users influence the sustainable adoption ofmobile money? We specifically examine three personal trait constructs like self-efficacy, trust beliefand structural assurance [21]. Kim et al. [22] found perceived risk to have an impact on behavioralintention towards e-payments systems, so we use perceived risk as a construct to study mobilemoney adoption. In practices, this study will help mobile money services providers, commercialbanks and central banks to understand how mobile money users would perceive mobile moneyapplication. This will enable them to assess trust and reduce risk perceptions towards its eventualsustainable adoption. Central banks may use this research result to improve their public policieslike mobile money customer protection. Analysis of mobile money usage, which is a substitute forsome banking services, may also help commercial banks come up with counter-measures for retainingcustomers. The mobile money services providers can also refer to this study for developing strategiesfor mass adoption.
In the next part of this paper, we review mobile money adoption related literature, followedby a discussion of the conceptual framework and hypotheses development. These are followed bythe research methodology, which involves data analysis using SmartPLS 2.0M3 structural equationmodelling (SEM). We conclude the study with discussions of the results, contributions, limitations andfuture study suggestions.
2. Literature Review
We review the mobile money technological developments and discuss prior studies related tomobile money services adoption in East Africa. We point out the best examples of mobile money,which are M-Pesa and Mobile Telephone Networks (MTN) mobile money. The two have led the mobilemoney services revolution in East Africa.
Sustainability 2017, 9, 2233 3 of 22
2.1. Mobile Money
Mobile money is a service for transferring money that is mobile phone-based [15]. It uses ITtools and channels that are non-banking for extending financial services to subscribers who cannot bereached by banks [15]. Mobile money services accelerate the speed of money transfer as funds movein electronic instead of the physical form [23]. To transfer money, a mobile phone user registers witha mobile money agent and then deposits cash [6]. This cash is shown as e-money in an e-wallet on thesender’s SIM card [23]. The e-money can be sent to the receiver’s phone. The e-money balance can beconverted back into cash by the receiver on visiting an agent [23].
2.2. Mobile Money Adoption in East Africa
The best example of mobile money in East Africa is M-Pesa in Kenya, which was launched in 2007by Safaricom [23]. Mobile money has helped bring 194,000 Kenyans out of poverty [1]. In 2008,Vodacom launched M-Pesa while Zantel launched Z-Pesa in Tanzania [19]. MTN mobile money inUganda was launched in 2009 with at least 1000 users. Since its launch, several other players like Airtelmoney, M-cash, Ezee-money, M-Sente and Orange money have also joined the Ugandan market [19].Micropay is the latest entrant to the Ugandan mobile money market, bringing the number of serviceproviders to seven [24]. This has increased the number of registered mobile money users to at least21.6 million [24].
Mobile money is already providing a partial substitute for bank retail services payments and couldchallenge banks’ dominance in other services like deposits [17]. Ssonko and Tait [16] found mobilemoney to complement rather than substitute bank account ownership. Currently, it enables users tocarry out the following services: Western Union money transfer; utility bill payments; tax remittances;fuel payments at petrol stations; school fees payments; bulk salary payments; mobile phone-basedTreasury bonds; and mobile money loans [5]. Transfers across borders using M-Pesa hit 17 billionKenya shillings ever since the service was introduced [25]. Kenya rolled out the mobile phone-basedT-bond—the M-Akiba bond—through the mobile money platform [26]. Mobile money loans are inthe form of M-Shwari in Kenya, M-Pawa in Tanzania and MoKash in Uganda. Rwanda uses TigoCash, MTN mobile money and Airtel money. The adoption of mobile money has resulted in economicactivities and labor demand which have created employment opportunities in East Africa [2]. This hascontributed to the Sustainable Development Goals.
The literature associated with mobile banking offers valuable insight into mobile money adoptionbecause in both cases users face e-payment systems but there are some differences in the way customersperceive their value [15,27]. Kim et al. [22] investigated factors influencing the acceptance of ICTapplications like mobile money. Their results found trust and risk as important factors. Their studyalso provides ground for other constructs like attitude, perceived usefulness and self-efficacy,which influence mobile money adoption.
To explain mobile money adoption, we identified the determinant factors based on the diffusion ofinnovation model [28], Unified Theory of Acceptance and Use of Technology (UTAUT) [29], the Theoryof Planned Behavior (TPB) [30] and the Technology Acceptance Model (TAM) [31]. Based on TPB,users’ adoption of mobile money is explained by their intentions [15,32]. The intentions are a functionof subjective norms, attitude and perceived behavioral control [30,33]. Mobile money user intention fortransactional services is of practical and scientific interest. TAM has been praised over the years for itscontribution towards the understanding of consumer behavior [34]. The model was studied because itwas found that the factors determining adoption intention of m-payment and m-banking are applicableto mobile money context [11]. According to Lu et al. [35], TAM is a powerful framework that explainsthe different factors that influence customers’ behavioral intention to use mobile-based services.Extended TAM was used by Ssonko and Tait [16] in the mobile money services context in Ugandato determine the effect of mobile money adoption on financial inclusion. Chauhan [7] integratedtrust in TAM to study how the poor citizens of India accept mobile money. Lee et al. [36] includedperceived risk and trust in the TAM to establish their impact on behavioral intention. Their results
Sustainability 2017, 9, 2233 4 of 22
found perceived usefulness and trust to affect behavioral intention, trust mediated the impact ofperceived risk on behavioral intention. Therefore, we extend this study by examining the two factors(trust and risk) further.
3. Conceptual Framework and Hypothesis Development
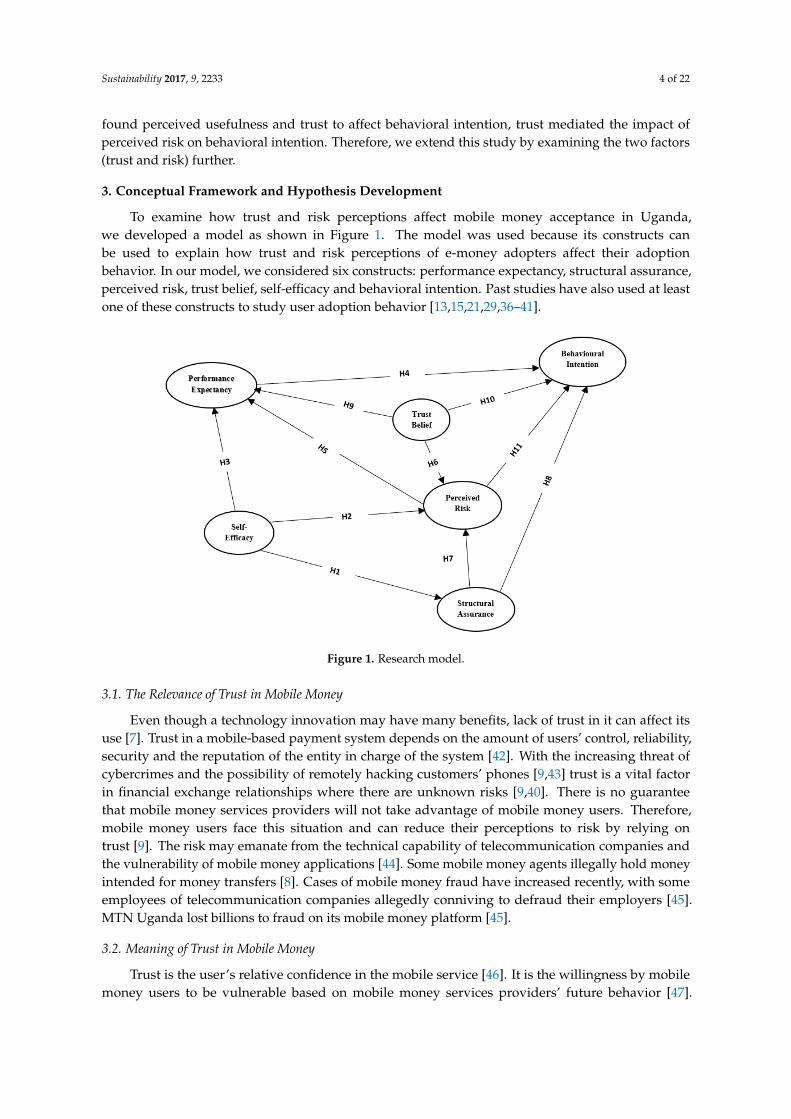
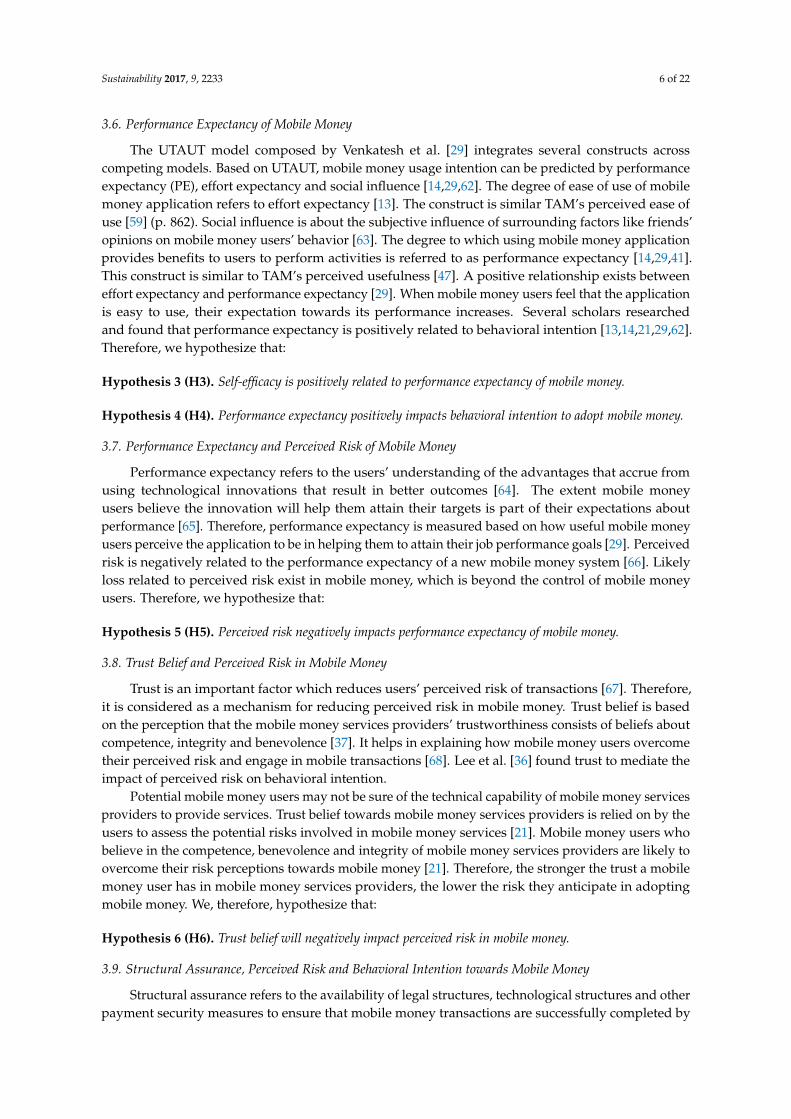
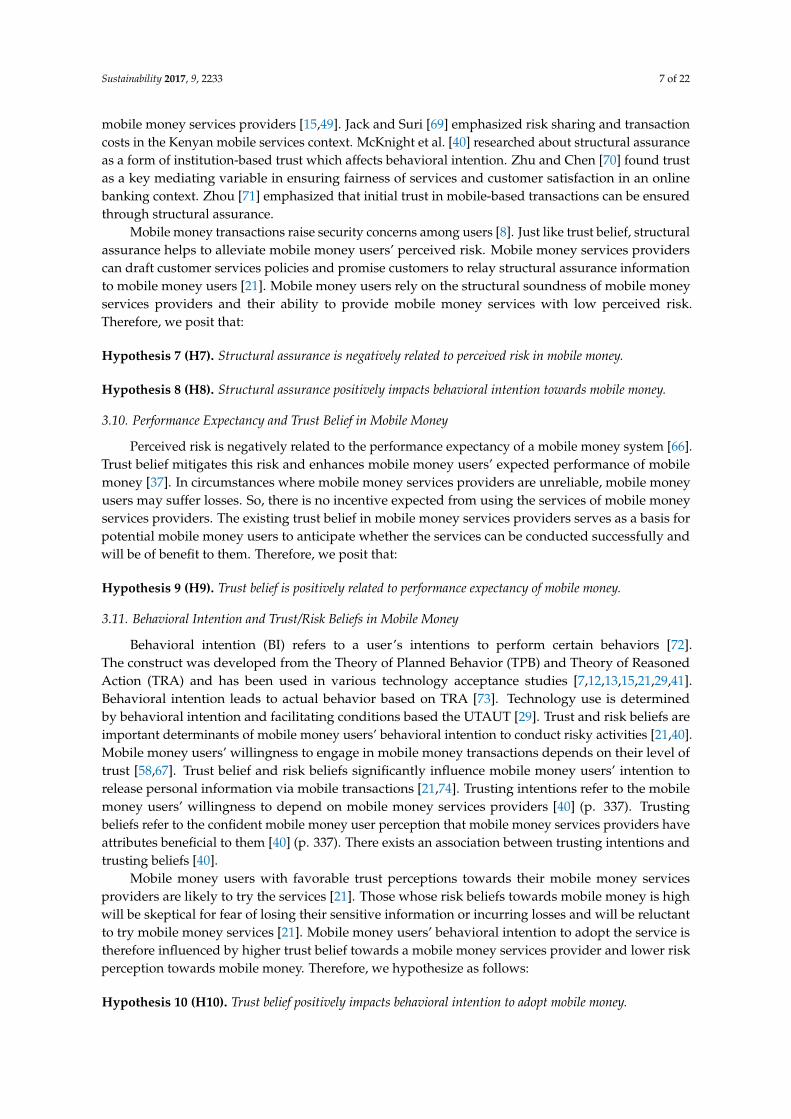
To examine how trust and risk perceptions affect mobile money acceptance in Uganda,we developed a model as shown in Figure 1. The model was used because its constructs canbe used to explain how trust and risk perceptions of e-money adopters affect their adoptionbehavior. In our model, we considered six constructs: performance expectancy, structural assurance,perceived risk, trust belief, self-efficacy and behavioral intention. Past studies have also used at leastone of these constructs to study user adoption behavior [13,15,21,29,36–41].
Sustainability 2017, 9, 2233 4 of 22
3. Conceptual Framework and Hypothesis Development
To examine how trust and risk perceptions affect mobile money acceptance in Uganda, we
developed a model as shown in Figure 1. The model was used because its constructs can be used to
explain how trust and risk perceptions of e-money adopters affect their adoption behavior. In our
model, we considered six constructs: performance expectancy, structural assurance, perceived risk,
trust belief, self-efficacy and behavioral intention. Past studies have also used at least one of these
constructs to study user adoption behavior [13,15,21,29,36–41].
Figure 1. Research model.
3.1. The Relevance of Trust in Mobile Money
Even though a technology innovation may have many benefits, lack of trust in it can affect its use [7].
Trust in a mobile-based payment system depends on the amount of users’ control, reliability, security
and the reputation of the entity in charge of the system [42]. With the increasing threat of cybercrimes
and the possibility of remotely hacking customers’ phones [9,43] trust is a vital factor in financial
exchange relationships where there are unknown risks [9,40]. There is no guarantee that mobile money
services providers will not take advantage of mobile money users. Therefore, mobile money users face
this situation and can reduce their perceptions to risk by relying on trust [9]. The risk may emanate
from the technical capability of telecommunication companies and the vulnerability of mobile money
applications [44]. Some mobile money agents illegally hold money intended for money transfers [8].
Cases of mobile money fraud have increased recently, with some employees of telecommunication
companies allegedly conniving to defraud their employers [45]. MTN Uganda lost billions to fraud on
its mobile money platform [45].
3.2. Meaning of Trust in Mobile Money
Trust is the user’s relative confidence in the mobile service [46]. It is the willingness by mobile
money users to be vulnerable based on mobile money services providers’ future behavior [47]. Based
Figure 1. Research model.
3.1. The Relevance of Trust in Mobile Money
Even though a technology innovation may have many benefits, lack of trust in it can affect itsuse [7]. Trust in a mobile-based payment system depends on the amount of users’ control, reliability,security and the reputation of the entity in charge of the system [42]. With the increasing threat ofcybercrimes and the possibility of remotely hacking customers’ phones [9,43] trust is a vital factorin financial exchange relationships where there are unknown risks [9,40]. There is no guaranteethat mobile money services providers will not take advantage of mobile money users. Therefore,mobile money users face this situation and can reduce their perceptions to risk by relying ontrust [9]. The risk may emanate from the technical capability of telecommunication companies andthe vulnerability of mobile money applications [44]. Some mobile money agents illegally hold moneyintended for money transfers [8]. Cases of mobile money fraud have increased recently, with someemployees of telecommunication companies allegedly conniving to defraud their employers [45].MTN Uganda lost billions to fraud on its mobile money platform [45].
3.2. Meaning of Trust in Mobile Money
Trust is the user’s relative confidence in the mobile service [46]. It is the willingness by mobilemoney users to be vulnerable based on mobile money services providers’ future behavior [47].
Sustainability 2017, 9, 2233 5 of 22
Based on McKnight and Chervany’s [48] trust topology, we examine the dimensions of trust: structuralassurance (SA) and trust belief (TB).
The trust perception about mobile money services providers refers to structural assurance [49].Structural assurance helps to reduce mobile money users’ perceived risk. Mobile money transactionsare uncertain and vulnerable and therefore entail potential risk [50]. Trust belief is based on theperception that the mobile money services providers’ trustworthiness consists of beliefs aboutcompetence, integrity and benevolence [37,51]. Trust is crucial because it reduces users’ fears andworries about mobile money transactions [9,50]. Trust in mobile money encompasses three keydimensions: ability, benevolence and integrity [52]. Ability means that mobile money servicesproviders possess the necessary experience and knowledge to fulfil their tasks [40] (p. 337). Integrityimplies the mobile money services providers stick to their promises [40] (p. 337). Benevolence meansthe mobile money services providers are concerned about the interests of mobile money users and notonly their expected benefits [40] (p. 337).
3.3. Perceived Risk in Mobile Money
Consumer adoption of mobile technologies is affected by security concerns and the possibility ofremotely hacking customers’ mobile phones [9,43]. Perceived risk is defined as a belief that unexpectedevents may occur [53]. It is the possibility that the mobile money user might incur financial losses orlose personal information as a result of using mobile transactions [46]. It measures beliefs of uncertaintyabout possible negative consequences [54]. Mobile money and internet banking are prone to similarrisks [55]. The perceived risk of using mobile money is assumed to be larger than that of using internetbanking [56]. The largest potential risk facing mobile money is probably an operational risk and centralbanks are concerned about its potential disruptive impact on the payments system [57]. Perceived riskhas been found by past studies as a significant factor influencing adoption intention towards mobilepayments [37,39,58,59].
3.4. Self-Efficacy and Mobile Money
Self-efficacy is a person’s belief in what they can do using their skills and capabilities, or howdifficult or easy it would be to carry out a behavior [42]. It is the confidence that a mobile money userpossesses in using mobile money application [46]. Duane et al. [42] discussed mobile self-efficacy (MSE),which measures users’ confidence in mastering mobile applications. Our study focuses on establishingwhether mobile money users have the ability and skills to execute mobile money services. Therefore,mobile money self-efficacy is the users’ judgement of their capability to use mobile money application.Luo et al. [21] found self-efficacy to be positively related to structural assurance. Self-efficacy wasfound to have effects on mobile services adoption [60]. Therefore, potential mobile money users withhigh self-efficacy level will have high trust perception towards the mobile money services providers.We thus hypothesize that:
Hypothesis 1 (H1). Self-efficacy positively impacts structural assurance.
3.5. Self-Efficacy and Perceived Risk in Mobile Money
Mobile money requires some level of user competence to complete transactions successfully.Self-efficacy reduces the perceived risk in mobile money. The level of self-efficacy is directly relatedto the users’ ability to execute mobile money transactions [61]. Mobile money users with a highself-efficacy level will anticipate lower loss from adverse circumstances such as transaction errors ormobile money fraud [21]. Therefore, we hypothesize that:
Hypothesis 2 (H2). Self-efficacy negatively impacts perceived risk in mobile money.
Sustainability 2017, 9, 2233 6 of 22
3.6. Performance Expectancy of Mobile Money
The UTAUT model composed by Venkatesh et al. [29] integrates several constructs acrosscompeting models. Based on UTAUT, mobile money usage intention can be predicted by performanceexpectancy (PE), effort expectancy and social influence [14,29,62]. The degree of ease of use of mobilemoney application refers to effort expectancy [13]. The construct is similar TAM’s perceived ease ofuse [59] (p. 862). Social influence is about the subjective influence of surrounding factors like friends’opinions on mobile money users’ behavior [63]. The degree to which using mobile money applicationprovides benefits to users to perform activities is referred to as performance expectancy [14,29,41].This construct is similar to TAM’s perceived usefulness [47]. A positive relationship exists betweeneffort expectancy and performance expectancy [29]. When mobile money users feel that the applicationis easy to use, their expectation towards its performance increases. Several scholars researchedand found that performance expectancy is positively related to behavioral intention [13,14,21,29,62].Therefore, we hypothesize that:
Hypothesis 3 (H3). Self-efficacy is positively related to performance expectancy of mobile money.
Hypothesis 4 (H4). Performance expectancy positively impacts behavioral intention to adopt mobile money.
3.7. Performance Expectancy and Perceived Risk of Mobile Money
Performance expectancy refers to the users’ understanding of the advantages that accrue fromusing technological innovations that result in better outcomes [64]. The extent mobile moneyusers believe the innovation will help them attain their targets is part of their expectations aboutperformance [65]. Therefore, performance expectancy is measured based on how useful mobile moneyusers perceive the application to be in helping them to attain their job performance goals [29]. Perceivedrisk is negatively related to the performance expectancy of a new mobile money system [66]. Likelyloss related to perceived risk exist in mobile money, which is beyond the control of mobile moneyusers. Therefore, we hypothesize that:
Hypothesis 5 (H5). Perceived risk negatively impacts performance expectancy of mobile money.
3.8. Trust Belief and Perceived Risk in Mobile Money
Trust is an important factor which reduces users’ perceived risk of transactions [67]. Therefore,it is considered as a mechanism for reducing perceived risk in mobile money. Trust belief is basedon the perception that the mobile money services providers’ trustworthiness consists of beliefs aboutcompetence, integrity and benevolence [37]. It helps in explaining how mobile money users overcometheir perceived risk and engage in mobile transactions [68]. Lee et al. [36] found trust to mediate theimpact of perceived risk on behavioral intention.
Potential mobile money users may not be sure of the technical capability of mobile money servicesproviders to provide services. Trust belief towards mobile money services providers is relied on by theusers to assess the potential risks involved in mobile money services [21]. Mobile money users whobelieve in the competence, benevolence and integrity of mobile money services providers are likely toovercome their risk perceptions towards mobile money [21]. Therefore, the stronger the trust a mobilemoney user has in mobile money services providers, the lower the risk they anticipate in adoptingmobile money. We, therefore, hypothesize that:
Hypothesis 6 (H6). Trust belief will negatively impact perceived risk in mobile money.
3.9. Structural Assurance, Perceived Risk and Behavioral Intention towards Mobile Money
Structural assurance refers to the availability of legal structures, technological structures and otherpayment security measures to ensure that mobile money transactions are successfully completed by
Sustainability 2017, 9, 2233 7 of 22
mobile money services providers [15,49]. Jack and Suri [69] emphasized risk sharing and transactioncosts in the Kenyan mobile services context. McKnight et al. [40] researched about structural assuranceas a form of institution-based trust which affects behavioral intention. Zhu and Chen [70] found trustas a key mediating variable in ensuring fairness of services and customer satisfaction in an onlinebanking context. Zhou [71] emphasized that initial trust in mobile-based transactions can be ensuredthrough structural assurance.
Mobile money transactions raise security concerns among users [8]. Just like trust belief, structuralassurance helps to alleviate mobile money users’ perceived risk. Mobile money services providerscan draft customer services policies and promise customers to relay structural assurance informationto mobile money users [21]. Mobile money users rely on the structural soundness of mobile moneyservices providers and their ability to provide mobile money services with low perceived risk.Therefore, we posit that:
Hypothesis 7 (H7). Structural assurance is negatively related to perceived risk in mobile money.
Hypothesis 8 (H8). Structural assurance positively impacts behavioral intention towards mobile money.
3.10. Performance Expectancy and Trust Belief in Mobile Money
Perceived risk is negatively related to the performance expectancy of a mobile money system [66].Trust belief mitigates this risk and enhances mobile money users’ expected performance of mobilemoney [37]. In circumstances where mobile money services providers are unreliable, mobile moneyusers may suffer losses. So, there is no incentive expected from using the services of mobile moneyservices providers. The existing trust belief in mobile money services providers serves as a basis forpotential mobile money users to anticipate whether the services can be conducted successfully andwill be of benefit to them. Therefore, we posit that:
Hypothesis 9 (H9). Trust belief is positively related to performance expectancy of mobile money.
3.11. Behavioral Intention and Trust/Risk Beliefs in Mobile Money
Behavioral intention (BI) refers to a user’s intentions to perform certain behaviors [72].The construct was developed from the Theory of Planned Behavior (TPB) and Theory of ReasonedAction (TRA) and has been used in various technology acceptance studies [7,12,13,15,21,29,41].Behavioral intention leads to actual behavior based on TRA [73]. Technology use is determinedby behavioral intention and facilitating conditions based the UTAUT [29]. Trust and risk beliefs areimportant determinants of mobile money users’ behavioral intention to conduct risky activities [21,40].Mobile money users’ willingness to engage in mobile money transactions depends on their level oftrust [58,67]. Trust belief and risk beliefs significantly influence mobile money users’ intention torelease personal information via mobile transactions [21,74]. Trusting intentions refer to the mobilemoney users’ willingness to depend on mobile money services providers [40] (p. 337). Trustingbeliefs refer to the confident mobile money user perception that mobile money services providers haveattributes beneficial to them [40] (p. 337). There exists an association between trusting intentions andtrusting beliefs [40].
Mobile money users with favorable trust perceptions towards their mobile money servicesproviders are likely to try the services [21]. Those whose risk beliefs towards mobile money is highwill be skeptical for fear of losing their sensitive information or incurring losses and will be reluctantto try mobile money services [21]. Mobile money users’ behavioral intention to adopt the service istherefore influenced by higher trust belief towards a mobile money services provider and lower riskperception towards mobile money. Therefore, we hypothesize as follows:
Hypothesis 10 (H10). Trust belief positively impacts behavioral intention to adopt mobile money.
Sustainability 2017, 9, 2233 8 of 22
Hypothesis 11 (H11). Perceived risk is negatively related to behavioral intention to adopt mobile money.
4. Research Methodology
This research is built based on data from a survey of mobile money users in Uganda. We contacted520 participants in a face-to-face interview by convenience sampling. The data were collected bythe authors with the support of research assistants who were trained prior to going to the field.Participation was on a voluntary basis. Before each interview, study objectives were explained toparticipants. We promised respondents to treat collected data confidentially and only use it for researchpurposes. Respondents were requested for verbally informed consent to participate.
4.1. Design of the Study and Sampling Distribution
To examine the proposed model, we used a survey research methodology. A questionnairewas designed with a range of questions intended to measure the various constructs under study.A field survey was conducted by interviewing mobile money agents in Kampala, the capital city ofUganda, from 5 June to 30 June 2017. Kampala is the busiest and most populous district with thehighest number of mobile money agents [16]. The estimated accessible population of Kampala is1,578,133 people [16] (p.35). The suburbs of Kampala surveyed include; Nakawa, Nakasero, Ntinda,Bukoto, Kamwokya, Kyebando, Mulago, Wandegeya, Makerere, Mengo, Old Kampala, Kampala road,Garden city, Nakulabye, Bwaise and Kawempe.
The sample size for this study is based on the formula suggested by Nduneseokwu et al. [32] (p. 6);
S = Z2 × p × 1 − p/(margin of error)2 (1)
where S is the sample size, Z is the Z score at 95% level of confidence, p is the standard deviationwhich is normally 0.5, margin o f error relates to confidence interval (±5%). As recommended byNduneseokwu et al. [32], we determine the sample size for an infinite population at Z = 1.96 and 95%confidence level, which results in 384 as sample size. Nduneseokwu et al. [32] further suggested anadjustment to the population (1,578,133) of Kampala city, to obtain an adjusted population size byusing the following formula:
Sadjusted = (S)/1 + [(S − 1)/population] (2)
The results of the adjusted sample size suggest that we need a minimum of 384 valid responses.Ssonko and Tait [16] (p. 36) estimated the minimum sample size to be 400 valid responses forKampala city.
The field survey was selected as the most effective way to gather perception data fromUgandan mobile money agents who are experienced in transacting using mobile moneyapplication because a large number of respondents could be reached and their responsescollected. Nduneseokwu et al. [32] (p. 6) and Chuchird et al. [75] (p. 2) used field surveys for datacollection. Also, because the level of internet connection in Uganda is still poor, the field survey wasthe most appropriate way of reaching respondents as compared to an online survey. A cross-sectionalsurvey was used because of its advantages such as low cost involved in implementation as well as therelatively low demand placed on respondents [76].
The questionnaire consisted of two sections; demographic information and measures of variablesunder study. Out of the contacted 520 mobile money agents, 500 accepted to attempt our questionnaires.Registered mobile money agents operate small kiosks along the streets and in busy trading centersin the suburbs of Kampala. Explanations were done where the agents required clarifications. All the500 questionnaires were received back from the respondents for examination [77] (p. 48). We usedthese respondents as a representative sample because they were legally registered and had the mobilemoney experience required for our study.
Sustainability 2017, 9, 2233 9 of 22
4.2. Measurement Development
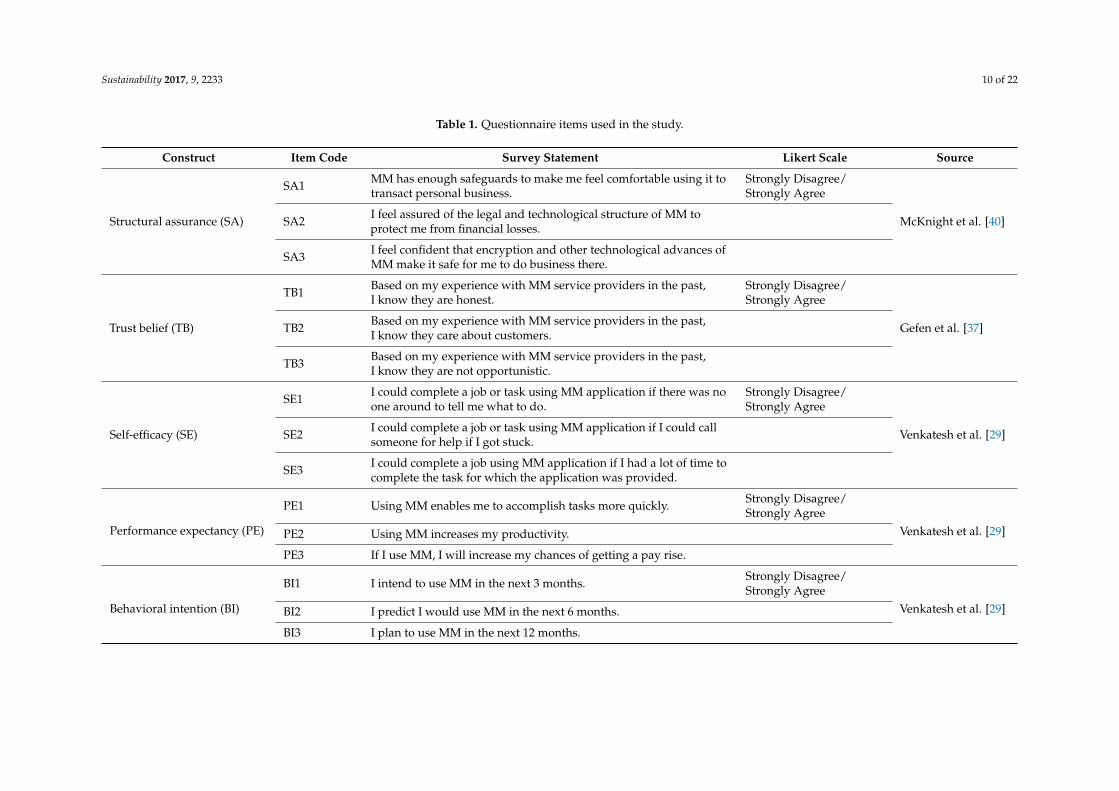
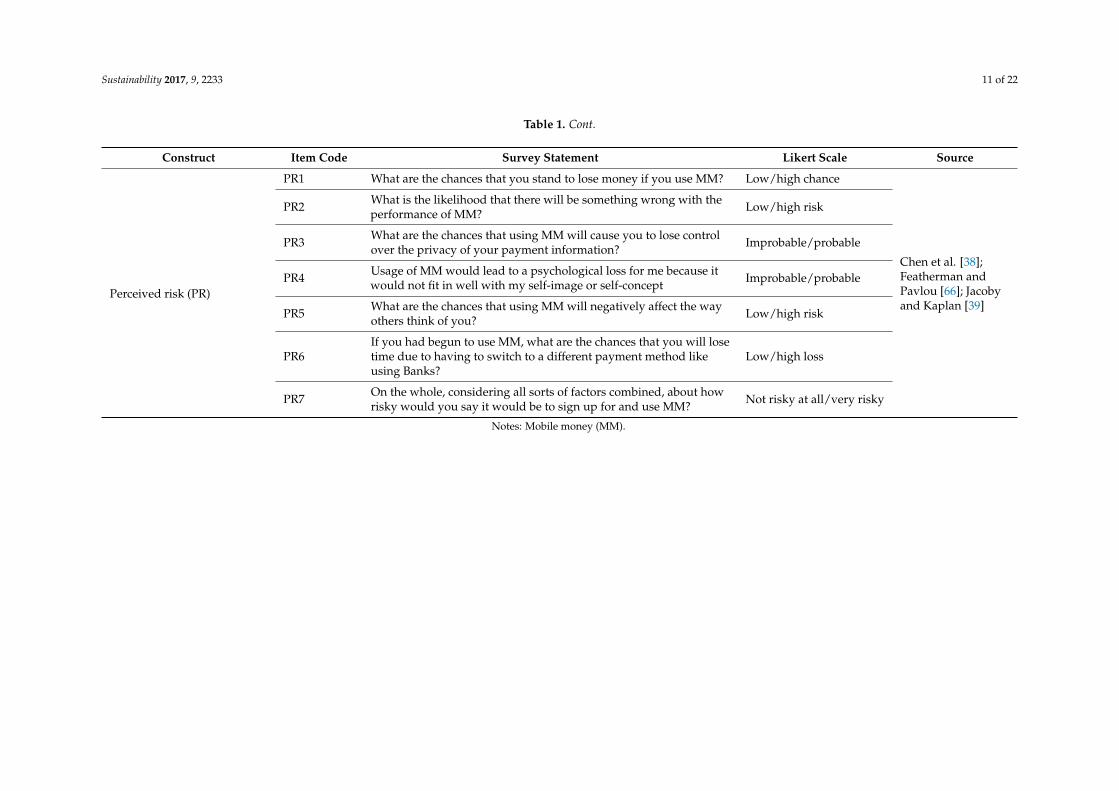
To ensure valid and reliable measures, the instruments used were based on past research andmodified to suit mobile money research context. Three items of McKnight et al. [40] were usedto measure structural assurance (SA). Three items of Gefen et al. [37] were used to measure trustbelief (TB). Three items of Venkatesh et al. [29] were used to measure self-efficacy (SE). Performanceexpectancy (PE) was measured by three items [29]. Behavioral intention (BI) was measured usingthree items [29]. Perceived risk (PR) was measured using seven items developed for mobile moneycontext with reference to Chen et al. [38], Featherman and Pavlou [66] and Jacoby and Kaplan [39].Five-point Likert scales were applied in measuring all the constructs. Table 1 shows the resultingquestionnaire items used for the study. A pre-test of all items was done with academic experts andgraduate students to ensure that their meaning and understanding was clear. Five control variables forprediction intention towards mobile money services were included in the study. They are; age, gender,the level of education, mobile money usage experience and mobile money services provider preference.
5. Data Analysis and Results
5.1. Descriptive Statistics
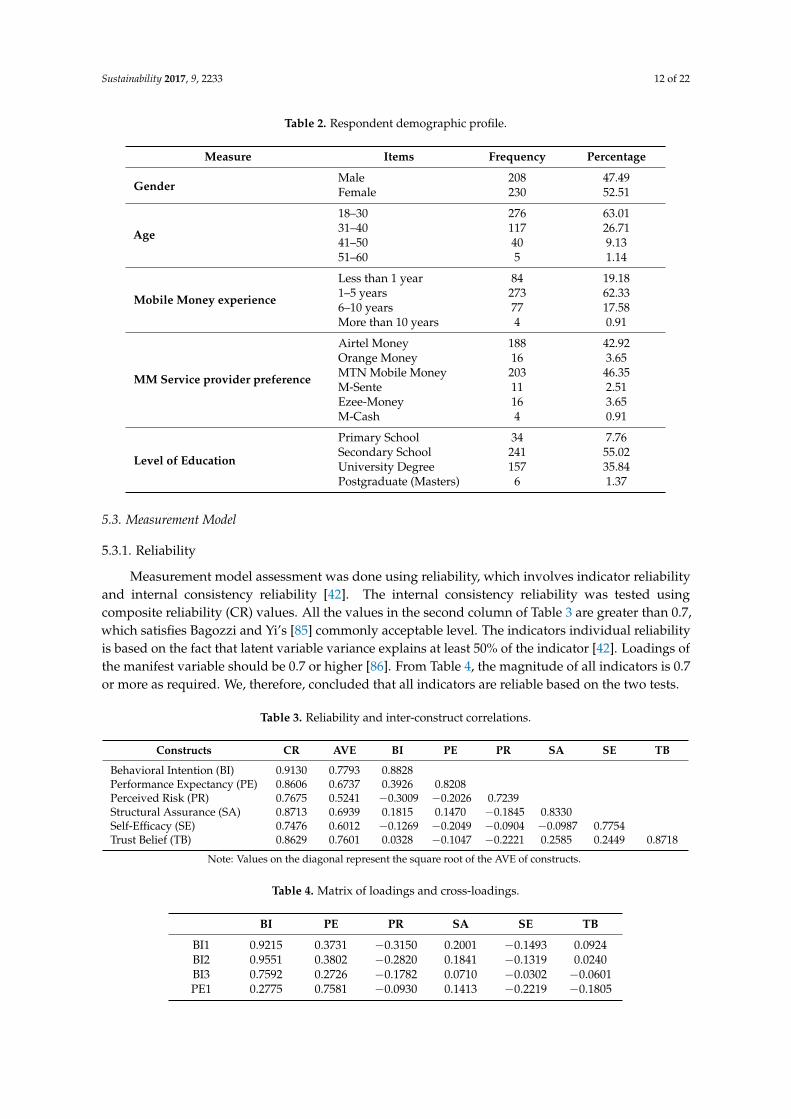
Out of the 500 responses, we removed 62 invalid responses due to missing data, inconsistentanswers and outliers [77] (p. 50). This resulted in 438 valid responses for analysis. Given that theminimum acceptable sample size is 384 valid responses, 438 valid responses represent an acceptablesample size. The sample descriptive statistics are as shown in Table 2. Of the 438 respondents:53% were female and 47% were male; 276 were 18–30 years old, 117 were 31–40 years old while 81 wereover 40 years of age. Among the entire respondents, 19% of them had mobile money experience ofless than 1 year, while 62% had 1–5 years and 18 % had 6–10 years’ experience. Of the respondents,46% preferred using MTN mobile money, 43% preferred Airtel money, 4% preferred Orange money,4% preferred Ezee-money, 2% preferred M-Sente and 1% preferred M-Cash. Further analysis ofthe level of education of respondents revealed that 8% had primary school education, 55% hadsecondary school education, 36% had University education and 1% were postgraduates. The sampleis appropriate for testing the instruments as educated people are enthusiastic to adopt new mobilemoney technologies [41].
5.2. Analysis of Results
We used a two-step approach recommended by Anderson and Gerbing [78] for data analysis.Step one involves the measurement model analysis, while step two tests the structural relationshipsamong latent constructs [78]. SmartPLS 2.0M3 (SmartPLS GmbH, Bönningstedt, Germany), a StructuralEquation Modelling (SEM) application [79], helped in examining the testing of hypotheses, structuralmodel and measurement model [33] (p. 10) because of the following reasons. Firstly, as suggested byChin and Newsted [80], the PLS method places fewer restrictions on the measurement scales, residualdistribution and sample size and is therefore suitable for our explorative study. Secondly, the data arenon-normal in most consumer behavior studies and PLS is not bound by the normality assumption [81]that is required in covariance-based SEM [82]. Thirdly, the estimates of mediation effects provided byPLS are accurate and the approach accounts for measurement errors [83]. Fourthly, PLS allows theindicators to vary by contributing to the latent variables composite score and does not require equalityof weights for all indicators [84]. Finally, PLS provides an alternative method to test theory [12,82].
Sustainability 2017, 9, 2233 10 of 22
Table 1. Questionnaire items used in the study.
Construct Item Code Survey Statement Likert Scale Source
Structural assurance (SA)
SA1 MM has enough safeguards to make me feel comfortable using it totransact personal business.
Strongly Disagree/Strongly Agree
McKnight et al. [40]SA2 I feel assured of the legal and technological structure of MM toprotect me from financial losses.
SA3 I feel confident that encryption and other technological advances ofMM make it safe for me to do business there.
Trust belief (TB)
TB1 Based on my experience with MM service providers in the past,I know they are honest.
Strongly Disagree/Strongly Agree
Gefen et al. [37]TB2 Based on my experience with MM service providers in the past,I know they care about customers.
TB3 Based on my experience with MM service providers in the past,I know they are not opportunistic.
Self-efficacy (SE)
SE1 I could complete a job or task using MM application if there was noone around to tell me what to do.
Strongly Disagree/Strongly Agree
Venkatesh et al. [29]SE2 I could complete a job or task using MM application if I could callsomeone for help if I got stuck.
SE3 I could complete a job using MM application if I had a lot of time tocomplete the task for which the application was provided.
Performance expectancy (PE)
PE1 Using MM enables me to accomplish tasks more quickly. Strongly Disagree/Strongly Agree
Venkatesh et al. [29]PE2 Using MM increases my productivity.
PE3 If I use MM, I will increase my chances of getting a pay rise.
Behavioral intention (BI)
BI1 I intend to use MM in the next 3 months. Strongly Disagree/Strongly Agree
Venkatesh et al. [29]BI2 I predict I would use MM in the next 6 months.
BI3 I plan to use MM in the next 12 months.
Sustainability 2017, 9, 2233 11 of 22
Table 1. Cont.
Construct Item Code Survey Statement Likert Scale Source
Perceived risk (PR)
PR1 What are the chances that you stand to lose money if you use MM? Low/high chance
Chen et al. [38];Featherman andPavlou [66]; Jacobyand Kaplan [39]
PR2 What is the likelihood that there will be something wrong with theperformance of MM? Low/high risk
PR3 What are the chances that using MM will cause you to lose controlover the privacy of your payment information? Improbable/probable
PR4 Usage of MM would lead to a psychological loss for me because itwould not fit in well with my self-image or self-concept Improbable/probable
PR5 What are the chances that using MM will negatively affect the wayothers think of you? Low/high risk
PR6If you had begun to use MM, what are the chances that you will losetime due to having to switch to a different payment method likeusing Banks?
Low/high loss
PR7 On the whole, considering all sorts of factors combined, about howrisky would you say it would be to sign up for and use MM? Not risky at all/very risky
Notes: Mobile money (MM).
Sustainability 2017, 9, 2233 12 of 22
Table 2. Respondent demographic profile.
Measure Items Frequency Percentage
GenderMale 208 47.49Female 230 52.51
Age
18–30 276 63.0131–40 117 26.7141–50 40 9.1351–60 5 1.14
Mobile Money experience
Less than 1 year 84 19.181–5 years 273 62.336–10 years 77 17.58More than 10 years 4 0.91
MM Service provider preference
Airtel Money 188 42.92Orange Money 16 3.65MTN Mobile Money 203 46.35M-Sente 11 2.51Ezee-Money 16 3.65M-Cash 4 0.91
Level of Education
Primary School 34 7.76Secondary School 241 55.02University Degree 157 35.84Postgraduate (Masters) 6 1.37
5.3. Measurement Model
5.3.1. Reliability
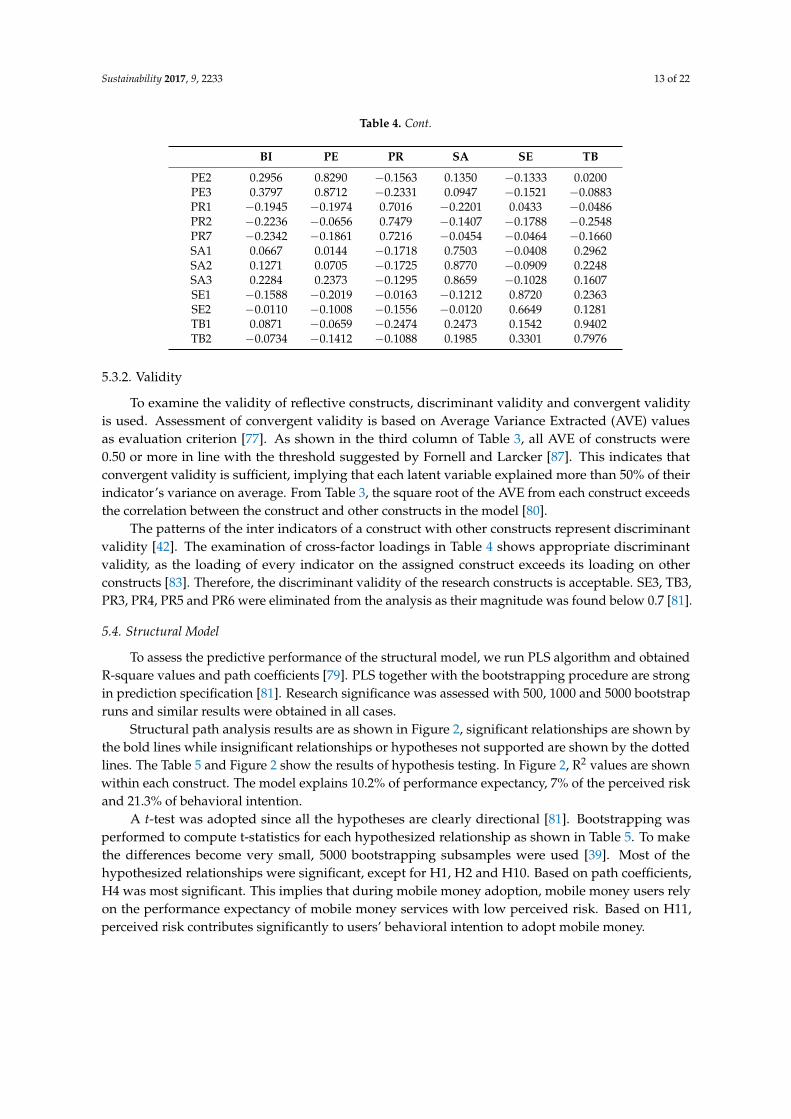
Measurement model assessment was done using reliability, which involves indicator reliabilityand internal consistency reliability [42]. The internal consistency reliability was tested usingcomposite reliability (CR) values. All the values in the second column of Table 3 are greater than 0.7,which satisfies Bagozzi and Yi’s [85] commonly acceptable level. The indicators individual reliabilityis based on the fact that latent variable variance explains at least 50% of the indicator [42]. Loadings ofthe manifest variable should be 0.7 or higher [86]. From Table 4, the magnitude of all indicators is 0.7or more as required. We, therefore, concluded that all indicators are reliable based on the two tests.
Table 3. Reliability and inter-construct correlations.
Constructs CR AVE BI PE PR SA SE TB
Behavioral Intention (BI) 0.9130 0.7793 0.8828Performance Expectancy (PE) 0.8606 0.6737 0.3926 0.8208Perceived Risk (PR) 0.7675 0.5241 −0.3009 −0.2026 0.7239Structural Assurance (SA) 0.8713 0.6939 0.1815 0.1470 −0.1845 0.8330Self-Efficacy (SE) 0.7476 0.6012 −0.1269 −0.2049 −0.0904 −0.0987 0.7754Trust Belief (TB) 0.8629 0.7601 0.0328 −0.1047 −0.2221 0.2585 0.2449 0.8718
Note: Values on the diagonal represent the square root of the AVE of constructs.
Table 4. Matrix of loadings and cross-loadings.
BI PE PR SA SE TB
BI1 0.9215 0.3731 −0.3150 0.2001 −0.1493 0.0924BI2 0.9551 0.3802 −0.2820 0.1841 −0.1319 0.0240BI3 0.7592 0.2726 −0.1782 0.0710 −0.0302 −0.0601PE1 0.2775 0.7581 −0.0930 0.1413 −0.2219 −0.1805
Sustainability 2017, 9, 2233 13 of 22
Table 4. Cont.
BI PE PR SA SE TB
PE2 0.2956 0.8290 −0.1563 0.1350 −0.1333 0.0200PE3 0.3797 0.8712 −0.2331 0.0947 −0.1521 −0.0883PR1 −0.1945 −0.1974 0.7016 −0.2201 0.0433 −0.0486PR2 −0.2236 −0.0656 0.7479 −0.1407 −0.1788 −0.2548PR7 −0.2342 −0.1861 0.7216 −0.0454 −0.0464 −0.1660SA1 0.0667 0.0144 −0.1718 0.7503 −0.0408 0.2962SA2 0.1271 0.0705 −0.1725 0.8770 −0.0909 0.2248SA3 0.2284 0.2373 −0.1295 0.8659 −0.1028 0.1607SE1 −0.1588 −0.2019 −0.0163 −0.1212 0.8720 0.2363SE2 −0.0110 −0.1008 −0.1556 −0.0120 0.6649 0.1281TB1 0.0871 −0.0659 −0.2474 0.2473 0.1542 0.9402TB2 −0.0734 −0.1412 −0.1088 0.1985 0.3301 0.7976
5.3.2. Validity
To examine the validity of reflective constructs, discriminant validity and convergent validityis used. Assessment of convergent validity is based on Average Variance Extracted (AVE) valuesas evaluation criterion [77]. As shown in the third column of Table 3, all AVE of constructs were0.50 or more in line with the threshold suggested by Fornell and Larcker [87]. This indicates thatconvergent validity is sufficient, implying that each latent variable explained more than 50% of theirindicator’s variance on average. From Table 3, the square root of the AVE from each construct exceedsthe correlation between the construct and other constructs in the model [80].
The patterns of the inter indicators of a construct with other constructs represent discriminantvalidity [42]. The examination of cross-factor loadings in Table 4 shows appropriate discriminantvalidity, as the loading of every indicator on the assigned construct exceeds its loading on otherconstructs [83]. Therefore, the discriminant validity of the research constructs is acceptable. SE3, TB3,PR3, PR4, PR5 and PR6 were eliminated from the analysis as their magnitude was found below 0.7 [81].
5.4. Structural Model
To assess the predictive performance of the structural model, we run PLS algorithm and obtainedR-square values and path coefficients [79]. PLS together with the bootstrapping procedure are strongin prediction specification [81]. Research significance was assessed with 500, 1000 and 5000 bootstrapruns and similar results were obtained in all cases.
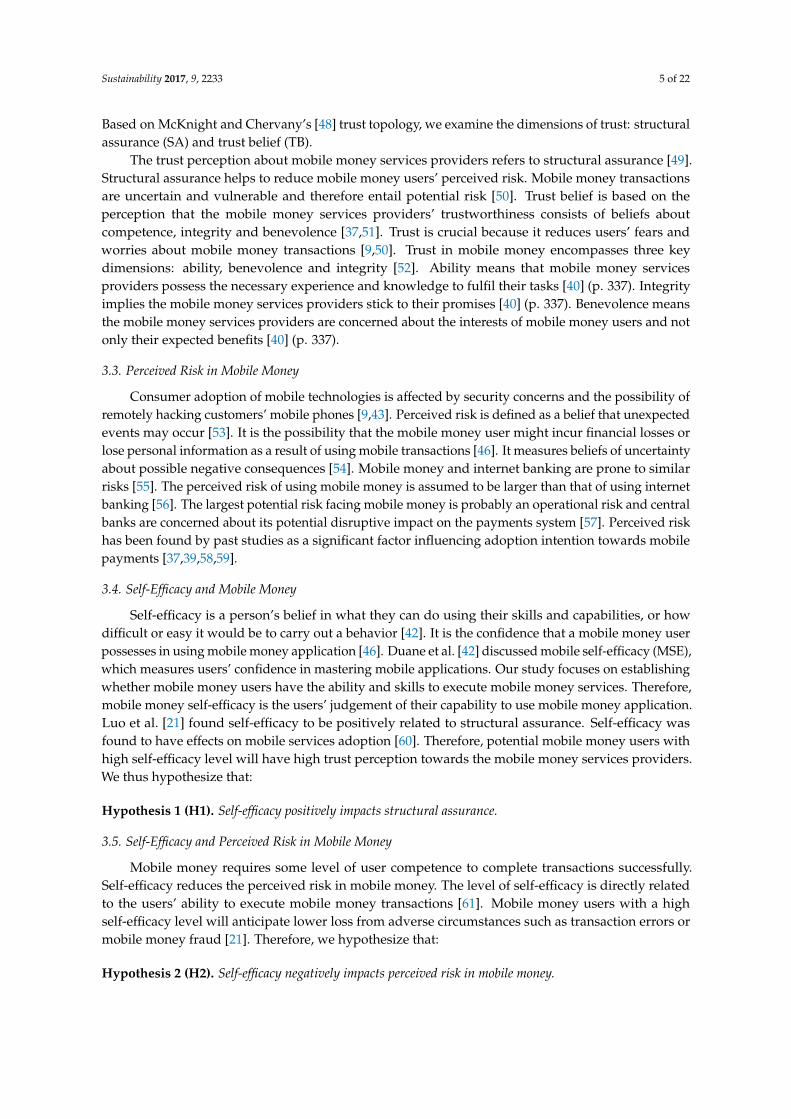
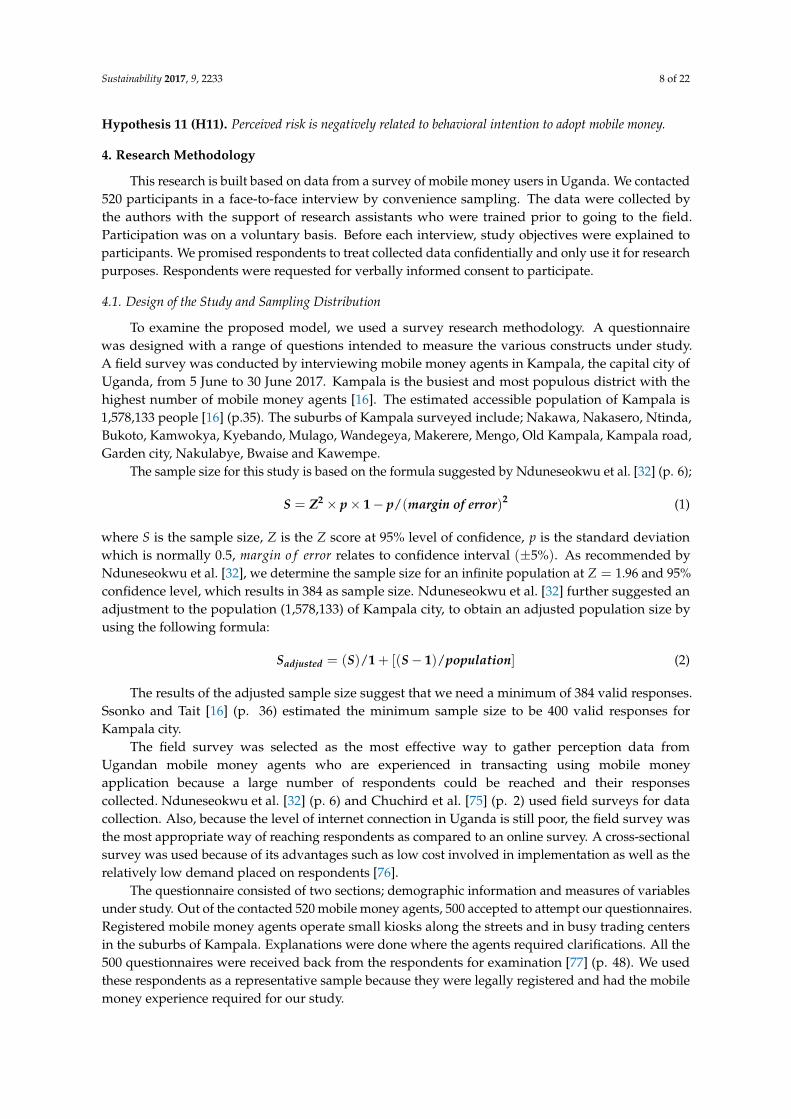
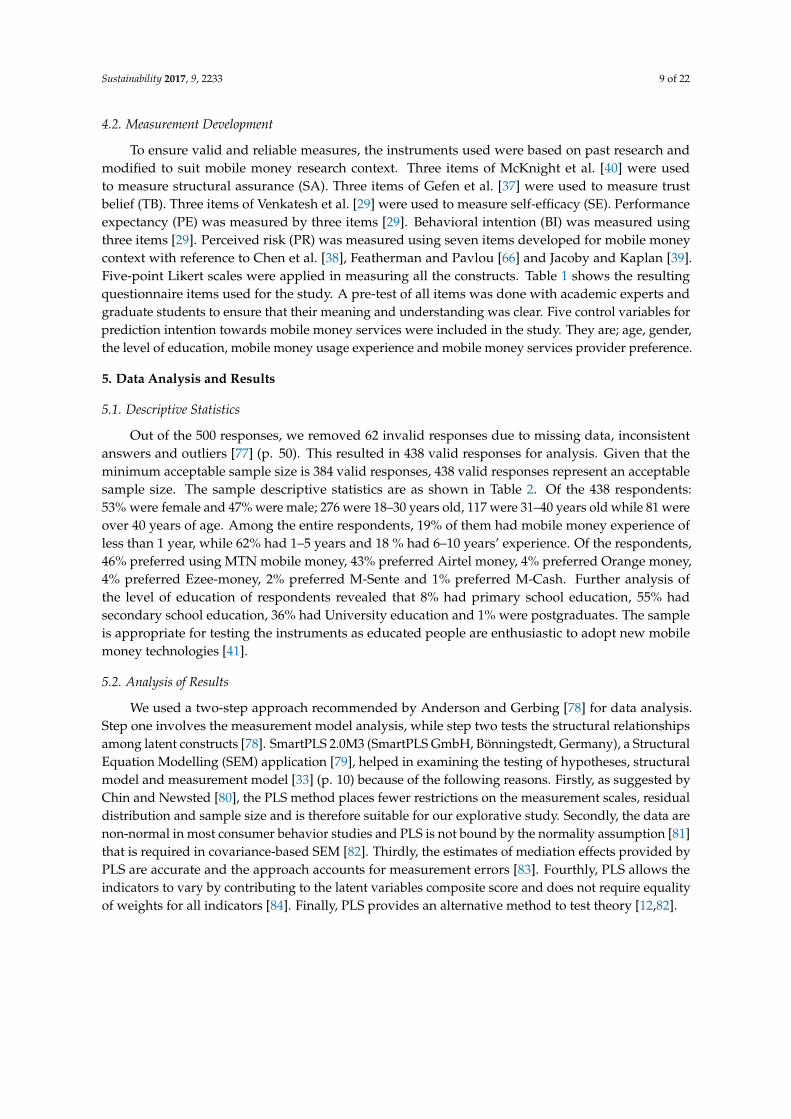
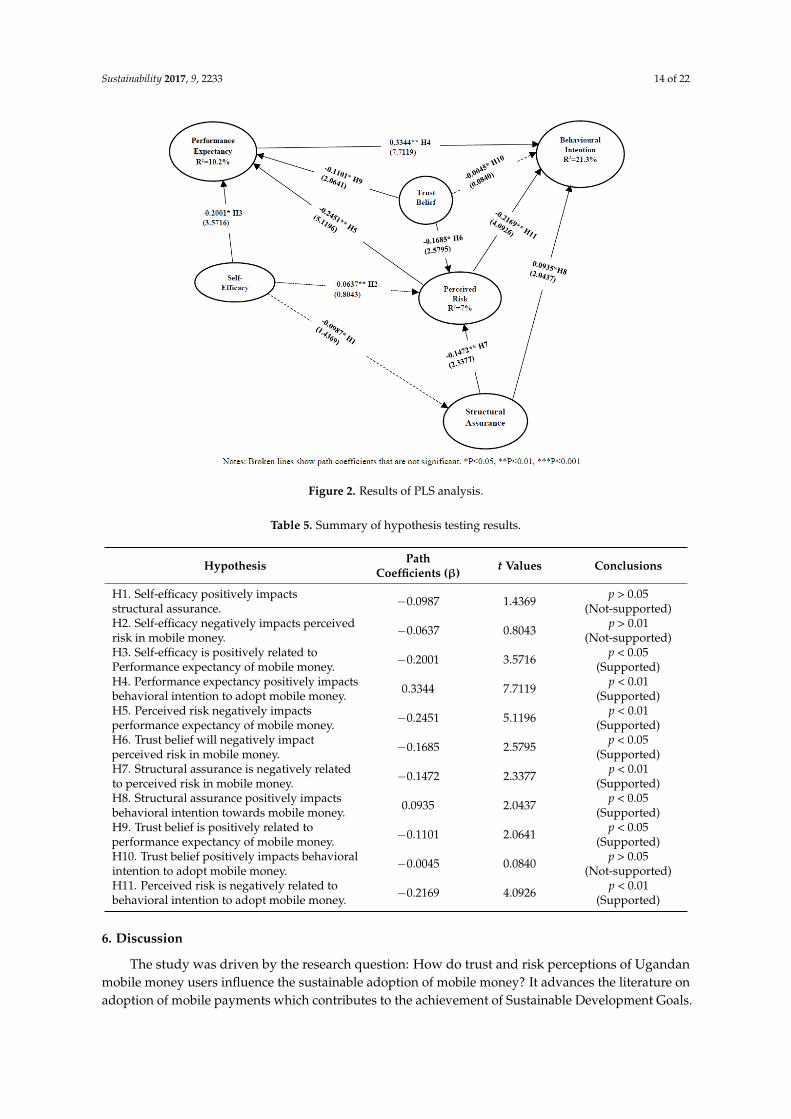
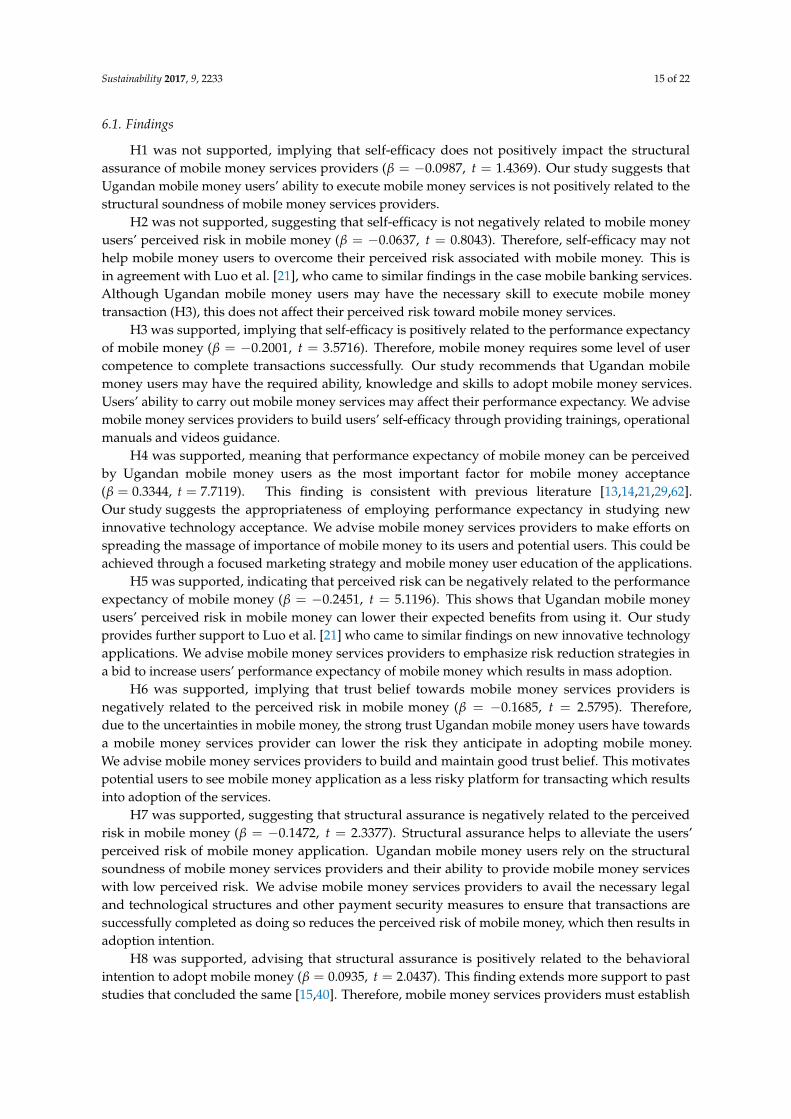
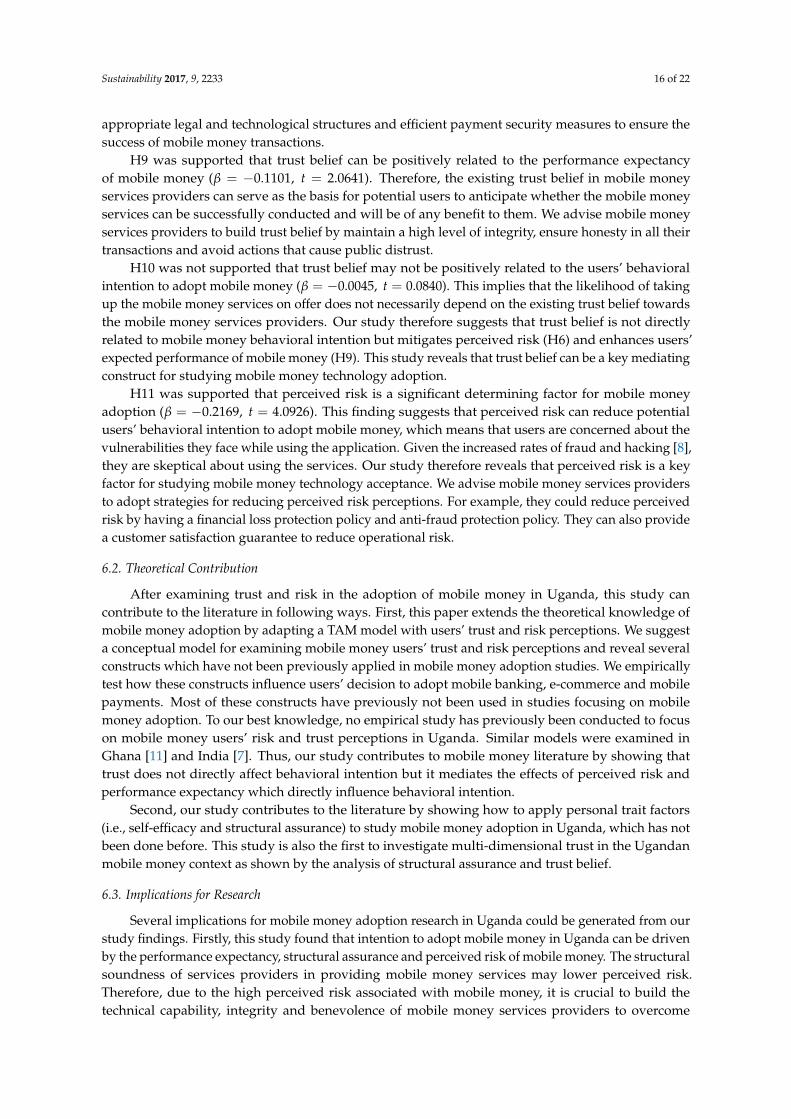
Structural path analysis results are as shown in Figure 2, significant relationships are shown bythe bold lines while insignificant relationships or hypotheses not supported are shown by the dottedlines. The Table 5 and Figure 2 show the results of hypothesis testing. In Figure 2, R2 values are shownwithin each construct. The model explains 10.2% of performance expectancy, 7% of the perceived riskand 21.3% of behavioral intention.
A t-test was adopted since all the hypotheses are clearly directional [81]. Bootstrapping wasperformed to compute t-statistics for each hypothesized relationship as shown in Table 5. To makethe differences become very small, 5000 bootstrapping subsamples were used [39]. Most of thehypothesized relationships were significant, except for H1, H2 and H10. Based on path coefficients,H4 was most significant. This implies that during mobile money adoption, mobile money users relyon the performance expectancy of mobile money services with low perceived risk. Based on H11,perceived risk contributes significantly to users’ behavioral intention to adopt mobile money.
Sustainability 2017, 9, 2233 14 of 22Sustainability 2017, 9, x FOR PEER REVIEW 14 of 22
Figure 2. Results of PLS analysis.
Table 5. Summary of hypothesis testing results.
Hypothesis Path
Coefficients (𝛃) t Values Conclusions
H1. Self-efficacy positively impacts structural
assurance. −0.0987 1.4369
p > 0.05
(Not-supported)
H2. Self-efficacy negatively impacts perceived risk in
mobile money. −0.0637 0.8043
p > 0.01
(Not-supported)
H3. Self-efficacy is positively related to Performance
expectancy of mobile money. −0.2001 3.5716
p < 0.05
(Supported)
H4. Performance expectancy positively impacts
behavioral intention to adopt mobile money. 0.3344 7.7119
p < 0.01
(Supported)
H5. Perceived risk negatively impacts performance
expectancy of mobile money. −0.2451 5.1196
p < 0.01
(Supported)
H6. Trust belief will negatively impact perceived risk
in mobile money. −0.1685 2.5795
p < 0.05
(Supported)
H7. Structural assurance is negatively related to
perceived risk in mobile money. −0.1472 2.3377
p < 0.01
(Supported)
H8. Structural assurance positively impacts
behavioral intention towards mobile money. 0.0935 2.0437
p < 0.05
(Supported)
H9. Trust belief is positively related to performance
expectancy of mobile money. −0.1101 2.0641
p < 0.05
(Supported)
H10. Trust belief positively impacts behavioral
intention to adopt mobile money. −0.0045 0.0840
p > 0.05
(Not-supported)
H11. Perceived risk is negatively related to behavioral
intention to adopt mobile money. −0.2169 4.0926
p < 0.01
(Supported)
Figure 2. Results of PLS analysis.
Table 5. Summary of hypothesis testing results.
Hypothesis PathCoefficients (β) t Values Conclusions
H1. Self-efficacy positively impactsstructural assurance. −0.0987 1.4369 p > 0.05
(Not-supported)H2. Self-efficacy negatively impacts perceivedrisk in mobile money. −0.0637 0.8043 p > 0.01
(Not-supported)H3. Self-efficacy is positively related toPerformance expectancy of mobile money. −0.2001 3.5716 p < 0.05
(Supported)H4. Performance expectancy positively impactsbehavioral intention to adopt mobile money. 0.3344 7.7119 p < 0.01
(Supported)H5. Perceived risk negatively impactsperformance expectancy of mobile money. −0.2451 5.1196 p < 0.01
(Supported)H6. Trust belief will negatively impactperceived risk in mobile money. −0.1685 2.5795 p < 0.05
(Supported)H7. Structural assurance is negatively relatedto perceived risk in mobile money. −0.1472 2.3377 p < 0.01
(Supported)H8. Structural assurance positively impactsbehavioral intention towards mobile money. 0.0935 2.0437 p < 0.05
(Supported)H9. Trust belief is positively related toperformance expectancy of mobile money. −0.1101 2.0641 p < 0.05
(Supported)H10. Trust belief positively impacts behavioralintention to adopt mobile money. −0.0045 0.0840 p > 0.05
(Not-supported)H11. Perceived risk is negatively related tobehavioral intention to adopt mobile money. −0.2169 4.0926 p < 0.01
(Supported)
6. Discussion
The study was driven by the research question: How do trust and risk perceptions of Ugandanmobile money users influence the sustainable adoption of mobile money? It advances the literature onadoption of mobile payments which contributes to the achievement of Sustainable Development Goals.
Sustainability 2017, 9, 2233 15 of 22
6.1. Findings
H1 was not supported, implying that self-efficacy does not positively impact the structuralassurance of mobile money services providers (β = −0.0987, t = 1.4369). Our study suggests thatUgandan mobile money users’ ability to execute mobile money services is not positively related to thestructural soundness of mobile money services providers.
H2 was not supported, suggesting that self-efficacy is not negatively related to mobile moneyusers’ perceived risk in mobile money (β = −0.0637, t = 0.8043). Therefore, self-efficacy may nothelp mobile money users to overcome their perceived risk associated with mobile money. This isin agreement with Luo et al. [21], who came to similar findings in the case mobile banking services.Although Ugandan mobile money users may have the necessary skill to execute mobile moneytransaction (H3), this does not affect their perceived risk toward mobile money services.
H3 was supported, implying that self-efficacy is positively related to the performance expectancyof mobile money (β = −0.2001, t = 3.5716). Therefore, mobile money requires some level of usercompetence to complete transactions successfully. Our study recommends that Ugandan mobilemoney users may have the required ability, knowledge and skills to adopt mobile money services.Users’ ability to carry out mobile money services may affect their performance expectancy. We advisemobile money services providers to build users’ self-efficacy through providing trainings, operationalmanuals and videos guidance.
H4 was supported, meaning that performance expectancy of mobile money can be perceivedby Ugandan mobile money users as the most important factor for mobile money acceptance(β = 0.3344, t = 7.7119). This finding is consistent with previous literature [13,14,21,29,62].Our study suggests the appropriateness of employing performance expectancy in studying newinnovative technology acceptance. We advise mobile money services providers to make efforts onspreading the massage of importance of mobile money to its users and potential users. This could beachieved through a focused marketing strategy and mobile money user education of the applications.
H5 was supported, indicating that perceived risk can be negatively related to the performanceexpectancy of mobile money (β = −0.2451, t = 5.1196). This shows that Ugandan mobile moneyusers’ perceived risk in mobile money can lower their expected benefits from using it. Our studyprovides further support to Luo et al. [21] who came to similar findings on new innovative technologyapplications. We advise mobile money services providers to emphasize risk reduction strategies ina bid to increase users’ performance expectancy of mobile money which results in mass adoption.
H6 was supported, implying that trust belief towards mobile money services providers isnegatively related to the perceived risk in mobile money (β = −0.1685, t = 2.5795). Therefore,due to the uncertainties in mobile money, the strong trust Ugandan mobile money users have towardsa mobile money services provider can lower the risk they anticipate in adopting mobile money.We advise mobile money services providers to build and maintain good trust belief. This motivatespotential users to see mobile money application as a less risky platform for transacting which resultsinto adoption of the services.
H7 was supported, suggesting that structural assurance is negatively related to the perceivedrisk in mobile money (β = −0.1472, t = 2.3377). Structural assurance helps to alleviate the users’perceived risk of mobile money application. Ugandan mobile money users rely on the structuralsoundness of mobile money services providers and their ability to provide mobile money serviceswith low perceived risk. We advise mobile money services providers to avail the necessary legaland technological structures and other payment security measures to ensure that transactions aresuccessfully completed as doing so reduces the perceived risk of mobile money, which then results inadoption intention.
H8 was supported, advising that structural assurance is positively related to the behavioralintention to adopt mobile money (β = 0.0935, t = 2.0437). This finding extends more support to paststudies that concluded the same [15,40]. Therefore, mobile money services providers must establish
Sustainability 2017, 9, 2233 16 of 22
appropriate legal and technological structures and efficient payment security measures to ensure thesuccess of mobile money transactions.
H9 was supported that trust belief can be positively related to the performance expectancyof mobile money (β = −0.1101, t = 2.0641). Therefore, the existing trust belief in mobile moneyservices providers can serve as the basis for potential users to anticipate whether the mobile moneyservices can be successfully conducted and will be of any benefit to them. We advise mobile moneyservices providers to build trust belief by maintain a high level of integrity, ensure honesty in all theirtransactions and avoid actions that cause public distrust.
H10 was not supported that trust belief may not be positively related to the users’ behavioralintention to adopt mobile money (β = −0.0045, t = 0.0840). This implies that the likelihood of takingup the mobile money services on offer does not necessarily depend on the existing trust belief towardsthe mobile money services providers. Our study therefore suggests that trust belief is not directlyrelated to mobile money behavioral intention but mitigates perceived risk (H6) and enhances users’expected performance of mobile money (H9). This study reveals that trust belief can be a key mediatingconstruct for studying mobile money technology adoption.
H11 was supported that perceived risk is a significant determining factor for mobile moneyadoption (β = −0.2169, t = 4.0926). This finding suggests that perceived risk can reduce potentialusers’ behavioral intention to adopt mobile money, which means that users are concerned about thevulnerabilities they face while using the application. Given the increased rates of fraud and hacking [8],they are skeptical about using the services. Our study therefore reveals that perceived risk is a keyfactor for studying mobile money technology acceptance. We advise mobile money services providersto adopt strategies for reducing perceived risk perceptions. For example, they could reduce perceivedrisk by having a financial loss protection policy and anti-fraud protection policy. They can also providea customer satisfaction guarantee to reduce operational risk.
6.2. Theoretical Contribution
After examining trust and risk in the adoption of mobile money in Uganda, this study cancontribute to the literature in following ways. First, this paper extends the theoretical knowledge ofmobile money adoption by adapting a TAM model with users’ trust and risk perceptions. We suggesta conceptual model for examining mobile money users’ trust and risk perceptions and reveal severalconstructs which have not been previously applied in mobile money adoption studies. We empiricallytest how these constructs influence users’ decision to adopt mobile banking, e-commerce and mobilepayments. Most of these constructs have previously not been used in studies focusing on mobilemoney adoption. To our best knowledge, no empirical study has previously been conducted to focuson mobile money users’ risk and trust perceptions in Uganda. Similar models were examined inGhana [11] and India [7]. Thus, our study contributes to mobile money literature by showing thattrust does not directly affect behavioral intention but it mediates the effects of perceived risk andperformance expectancy which directly influence behavioral intention.
Second, our study contributes to the literature by showing how to apply personal trait factors(i.e., self-efficacy and structural assurance) to study mobile money adoption in Uganda, which has notbeen done before. This study is also the first to investigate multi-dimensional trust in the Ugandanmobile money context as shown by the analysis of structural assurance and trust belief.
6.3. Implications for Research
Several implications for mobile money adoption research in Uganda could be generated from ourstudy findings. Firstly, this study found that intention to adopt mobile money in Uganda can be drivenby the performance expectancy, structural assurance and perceived risk of mobile money. The structuralsoundness of services providers in providing mobile money services may lower perceived risk.Therefore, due to the high perceived risk associated with mobile money, it is crucial to build thetechnical capability, integrity and benevolence of mobile money services providers to overcome
Sustainability 2017, 9, 2233 17 of 22
risk perceptions. The results reveal the relevance of the adoption stage of mobile money services.During this early stage of mobile money adoption in Uganda, mobile money users’ uncertainty aboutthe underlying technology in mobile money is high. A personal trait factor such as self-efficacy isidentified as a major determinant of perceived risk and indirectly influences the behavioral intention.Multi-dimensional trust may play various roles in mobile money adoption. Structural assurance ortrust towards a mobile money platform can be a mechanism for overcoming the perceived risk ofmobile money and directly impact behavioral intention, while trust belief can also directly impactbehavioral intention. The findings of our research contribute to the understanding of Ugandan mobilemoney users’ risk and trust perceptions which are useful for mobile money studies in East Africa atlarge. The constructs under this study may be applied in other countries like Kenya in M-Pesa contextand Tanzania in Z-Pesa context, so as to further verify the understanding of trust and risk perceptionin mobile money in Africa.
Secondly, the study of mobile money adoption can be useful to central banks in relation to financialinclusion and improvement of the ability to transfer money, which are important to achieve sustainabledevelopment. Mobile money adoption, if well facilitated, can help central bank authorities to attaintheir target of reaching the unbanked rural populations in East Africa. Mobile money is very usefulto the poor population due to low transaction costs, the safety of money and processing speed [7].Its success will be dictated by the rate of its sustainable adoption. Therefore, according to our study,central banks are recommended to continue to design mobile money regulations that do not stifle thevaluable innovation. They may promote public policies such as mobile money customer protection.This will help customers overcome their perceived risk of mobile money and encourage a sense ofsecurity. We, therefore, advise central banks to encourage more research studies on mobile moneyadoption and financial inclusion.
Lastly, our study shows that 7% of the predictive power of the model is explained by perceivedrisk, which is large in comparison to other constructs under study. Central banks may not be ableto regulate this mobile money risk, as it emanates from telecommunication companies’ IT systems.However, they can work in partnership with communications regulators to ensure that their prudentialpriorities are met [44]. The few studies on mobile money adoption have focused on the TAM variables,this has created a need for more research on perceived risk in mobile money. We, therefore, suggestfuture research to explore this area.
6.4. Implications for Practice
We may offer useful practical implications for managers in telecommunications companiesoffering mobile money services in Uganda. Firstly, we suggest that the performance expectancy ofmobile money is an important factor in adoption intention. Thus, to encourage the mobile moneyadoption, mobile money services providers may show the benefits of using mobile money to potentialcustomers. Increased user education of MoKash, mobile money apps used in smartphones and mobilemoney Western Union transfers should be able to facilitate adoption intention.
Secondly, during the adoption of mobile money services, users may have some ideas about thebenefits of technology application as a medium for transactions. Based on this study, the significanceof structural assurance may imply that an effective strategy towards helping Ugandan users to reducetheir mobile money risk perceptions is to increase their education about the mobile money applicationand its security features.
Thirdly, perceived risk is a significant factor in mobile money adoption. By modelling perceivedrisk with other indicators, the research shows several risk considerations that can affect the adoption ofmobile money services in Uganda. If mobile money services providers launch the services, they mayemphasize measures to counter those risk perceptions: for example, they could provide a customersatisfaction guarantee for reducing the customer’s operational risk.
Fourthly, public policy issues pertaining to consumer protection should be developed bygovernment agents in order to ensure structural assurance, helping alleviate Ugandan users’ perceived
Sustainability 2017, 9, 2233 18 of 22
risk in the mobile money application. Central banks may regulate that mobile money services providersneed to carry out proper disclosure of their terms and conditions, like transaction fees for customeraccess to financial services. A tight controlled regulatory policy focusing on transaction security andreduction of mobile money fraud cases may increase trust.
Fifthly, according to our study, 62% of the respondents had at least one mobile money transactionexperience within the last five years. This implies that mobile money is in its infancy stage in Uganda.63% of them were aged 18 to 30 years, which shows that the majority of Ugandan users are the youthfulgeneration being ambitious to learn new technologies. Of the respondents, 55% had a secondary schooleducation while 36% had a university education, which implies that most Ugandan users wereeducated. Therefore, we advise mobile money service providers to target their services offeringstowards the age group from 18 to 30 years and the educated users who are the potential customers.This information may be useful for companies to develop an effective marketing strategy for mobilemoney adoption in Uganda.
Last but not least, mobile money has been used as a substitute for commercial bank depositsin Uganda. By looking at the findings from the commercial banks’ perspective, executive officersmay be able to know which variables they can manipulate to compete with mobile money. Therefore,when designing new banking services, they should be mindful of factors like customer perceived risk,structural assurance and trust. They may also need to continue partnering with mobile money servicesproviders to realize synergetic benefits.
7. Limitations and Future Research Directions
This study countered limitations that create room for future research in the mobile money sector.Firstly, responses that were collected using a field study which may not fully represent the entirepopulation. This could cause some bias towards the contacted population. Therefore, future researchinvolving an online survey is encouraged to cover the opinions of those mobile money users whodid not have access to the field survey. Secondly, the study was carried out in June 2017 usingcross-sectional survey. Reliability can be improved by carrying out a longitudinal analysis of over a sixmonth to one year period. This would cover various respondents’ opinions over a longer period of time.Thirdly, we used a field survey questionnaire to collect the measures of the constructs under study atthe same point in time. Some common method variance may exist. More research using methods thatinvolves qualitative and quantitative approaches is encouraged. Fourthly, the data used for empiricalanalysis was collected from respondents in Uganda who have characteristics differing from subjects inother parts of the world. Future research could focus on the replication of a similar topic in anotherpart of the world like Korea, Kenya, Tanzania and India. This would aid in the assessment of thevalidity of the proposed research model across different countries. Finally, other variables, like theadded value of mobile payments, the attractiveness of alternatives, a disposition to trust, perceivedease of use, attitude, social influence, effort expectancy and innovativeness in new technologies, couldbe introduced into the model and tested to view results. This will improve the explanatory power ofthe model.
8. Conclusions
The purpose of this study was to examine how trust and risk perceptions influence on theacceptance of mobile money in Uganda. It is crucial to understand how to empower African peopleto use financial services for Sustainable Development Goals (SDGs) and mobile money is an enablerbeing promoted by many African countries. Such mobile money adoption helps financial inclusion ofthe unbanked and underbanked and its related economic activities can improve employment reducingpoverty and facilitating sustainable economic development. However, there are very limited studies tounderstand how to encourage user participation in Africa. Thus, our study is conducted to measuremobile money user intention for transactional services in Uganda, which can be of practical andscientific interest in terms of sustainable development in Africa. Our study suggests that mobile
Sustainability 2017, 9, 2233 19 of 22
money user intention is a function of performance expectancy, perceived risk and structural assurance.Personal trait factors like self-efficacy, trust belief and structural assurance can play a significant role ininfluencing consumers’ perceptions toward mobile money acceptance.
The results suggest that perceptions towards mobile money adoption can help mobile moneyservices providers, commercial banks and central banks to see how customers interact with mobilemoney technology, thereby enabling them to assess trust and reduce risk perceptions towardssustainable adoption. The findings may help mobile money services providers to come up witheffective marketing strategies for encouraging customers to adopt mobile money applications.Commercial banks are advised to come up with counter-measures like a partnership with mobilemoney services providers so as to realize synergetic benefits. Central banks may need to improve theirpublic policies like mobile money customer protection. We hope that the findings of this study canstimulate future research on the sustainable adoption of mobile money technologies.
Acknowledgments: This work was supported by the National Research Foundation of Korea Grant funded by theKorean Government (NRF-2014S1A5A8018136). We acknowledge the support from the Central Bank of Uganda.We thank the anonymous reviewers for their invaluable comments. The views expressed in this article are thoseof the authors and not necessarily the institutions affiliated with the study. The usual caveats apply.
Author Contributions: Ronald Baganzi and Antonio K.W. Lau designed and formulated the theoreticalframework; designed the questionnaire, data analysis methods and analyzed the data. Ronald Baganzi andAntonio K.W. Lau wrote the paper. All authors contributed to reading and approving the final manuscript.
Conflicts of Interest: The authors declare no conflict of interest. The founding sponsors had no role in the designof the study; in the collection, analyses, or interpretation of data; in the writing of the manuscript and in thedecision to publish the results.
References
1. GSMA (Global System for Mobile Association). The Mobile Economy 2017; Global System for MobileAssociation: London, UK, 2017.
2. Kikulwe, E.M.; Fischer, E.; Qaim, M. Mobile Money, Smallholder Farmers, and Household Welfare in Kenya.PLoS ONE 2014, 9, e109804. [CrossRef] [PubMed]
3. Firpo, J. E-Money—Mobile Money—Mobile Banking—What’s the Difference? Available online: http://blogs.worldbank.org/psd/e-money-mobile-money-mobile-banking-what-s-the-difference (accessed on30 June 2017).
4. Mugambi, A.; Njunge, C.; Yang, S.C. Mobile-Money Benefits and Usage: The Case of M-PESA. IT Prof. 2014,16, 16–21. [CrossRef]
5. Bank of Uganda. Bank of Uganda Annual Report FY 2015/2016; Bank of Uganda: Kampala, Uganda, 2015.6. Bisht, S.S.; Mishra, V. ICT-Driven Financial Inclusion Initiatives for Urban Poor in Developing Economy:
Implications for Public Policy. Behav. Inf. Technol. 2016, 35, 817–832. [CrossRef]7. Chauhan, S. Acceptance of Mobile Money by Poor Citizens of India: Integrating Trust into the Technology
Acceptance Model. Info 2015, 17, 58–68. [CrossRef]8. Kasekende, L. Bank of Uganda’s Role in Monetary Policy, Regulation and Financial Sector Development;
Bank of Uganda: Kampala, Uganda, 2014.9. Malaquias, R.F.; Hwang, Y.-J. An Empirical Study on Trust in Mobile Banking: A Developing Country
Perspective. Comput. Hum. Behav. 2016, 54, 453–461. [CrossRef]10. Njoroge, P. Financial Inclusion in Sub-Saharan Africa; Central Bankers’ Speeches; Central Bank of Kenya:
Nairobi, Kenya, 2016.11. Tobbin, P.; Kuwornu, J.K.M. Adoption of Mobile Money Transfer Technology: Structural Equation Modeling
Approach. Eur. J. Bus. Manag. 2011, 3, 59–78.12. Adapa, S.; Roy, S.K. Consumers’ Post-Adoption Behaviour towards Internet Banking: Empirical Evidence
from Australia. Behav. Inf. Technol. 2017, 36, 1–14. [CrossRef]13. Al-Gahtani, S.S.; Hubona, G.S.; Wang, J. Information Technology (IT) in Saudi Arabia: Culture and the
Acceptance and Use of IT. Inf. Manag. 2007, 44, 681–691. [CrossRef]14. Venkatesh, V.; Thong, J.; Xu, X. Consumer Acceptance and User of Information Technology: Extending the
Unified Theory of Acceptance and Use of Technology. MIS Q. 2012, 36, 157–178.
Sustainability 2017, 9, 2233 20 of 22
15. Upadhyay, P.; Jahanyan, S. Analyzing User Perspective on the Factors Affecting Use Intention ofMobile-Based Transfer Payment. Internet Res. 2016, 26, 38–56. [CrossRef]
16. Ssonko, G.W.; Tait, M. Effect of Mobile Money on Financial Inclusion. In Proceedings of the Southern AfricanInstitute of Management Scientists (SAIMS) Conference, Bloemfontein, South Africa, 10–12 September 2017;pp. 30–59.
17. Mutebile, E.T. Mobile Money and the Economy; Central Bankers’ Speeches; Bank for International Settlements:Kampala, Uganda, 2015.
18. Mutebile, E.T. Bank of Uganda’s 50th Anniversary; Central Bankers’ Speeches; Bank for InternationalSettlements: Kampala, Uganda, 2016.
19. Nampewo, D.; Tinyinondi, G.A.; Kawooya, D.R.; Ssonko, G.W. Determinants of Private Sector Credit inUganda: The Role of Mobile Money. Financ. Innov. 2016, 2, 1–16. [CrossRef]
20. Kasekende, L. Improving Financial Literacy in Uganda; Central Bankers’ Speeches; Bank for InternationalSettlements: Kampala, Uganda, 2015.
21. Luo, X.; Li, H.; Zhang, J.; Shim, J.P. Examining Multi-Dimensional Trust and Multi-Faceted Risk in InitialAcceptance of Emerging Technologies: An Empirical Study of Mobile Banking Services. Decis. Support Syst.2010, 49, 222–234. [CrossRef]
22. Kim, D.J.; Ferrin, D.L.; Rao, H.R. A Trust-Based Consumer Decision-Making Model in Electronic Commerce:The Role of Trust, Perceived Risk, and Their Antecedents. Decis. Support Syst. 2008, 44, 544–564. [CrossRef]
23. Morawczynski, O. Exploring the Usage and Impact of “transformational” mobile Financial Services: The Caseof M-PESA in Kenya. J. East. Afr. Stud. 2009, 3, 509–525. [CrossRef]
24. Bank of Uganda. Bank of Uganda Annual Supervision Report; Bank of Uganda: Kampala, Uganda, 2016.25. Okuttah, M. Safaricom M-Pesa Transfers across Borders Hit Sh17bn. Business Daily, 4 January 2016.26. Nwaniki, C. Kenya Plans March Rollout of Mobile Phone-Based T-Bond. Business Daily, 11 January 2016.27. Laukkanen, T. Internet vs. Mobile Banking: Comparing Customer Value Perceptions. Bus. Process Manag. J.
2007, 13, 788–797. [CrossRef]28. Rogers, E.M. Diffusion of Innovations; Free Press: Glencoe, UK, 1962.29. Venkatesh, V.; Morris, M.G.; Davis, G.B.; Davis, F.D. User Acceptance of Information Technology: Toward
a Unified View. MIS Q. 2003, 27, 425–478. [CrossRef]30. Ajzen, I.; Fishbein, M. Understanding Attitudes & Predicting Social Behavior; Prentice Hall: Sydney, Australia, 1985.31. Davis, F.D. Perceived Usefulness, Perceived Ease of Use, and User Acceptance of Information Technology.
MIS Q. 1989, 13, 319–340. [CrossRef]32. Nduneseokwu, C.K.; Qu, Y.; Appolloni, A. Factors Influencing Consumers’ Intentions to Participate in
a Formal E-Waste Collection System: A Case Study of Onitsha, Nigeria. Sustainability 2017, 9, 881. [CrossRef]33. Chung, N.-H.; Koo, C.-M.; Lee, K.-M. Assessing the Impact of Mobile Technology on Exhibition Attendees’
Unplanned Booth Visit Behaviour. Sustainability 2017, 9, 884. [CrossRef]34. Tobbin, P. The Adoption of Transformational Mobile Banking by the Unbanked. Digiworld Econ. J. 2012, 86,
103–223.35. Lu, J.; Yu, C.-S.; Liu, C.; Yao, J.E. Technology Acceptance Model for Wireless Internet. J. Internet Res. 2003, 13,
206–222. [CrossRef]36. Lee, K.-S.; Lee, H.-S.; Kim, S.-Y. Factors Influencing the Adoption Behavior of Mobile Banking: A South
Korean Perspective. J. Internet Bank. Commer. 2007, 12, 92–114.37. Gefen, D.; Karahanna, E.; Straub, D.W. Trust and TAM in Online Shopping: An Integrated Model. MIS Q.
2003, 27, 51–90. [CrossRef]38. Chen, Y.; Yan, X.; Fan, W.; Gordon, M. The Joint Moderating Role of Trust Propensity and Gender on
Consumers’ Online Shopping Behavior. Comput. Hum. Behav. 2015, 43, 272–283. [CrossRef]39. Jacoby, J.; Kaplan, L.B. The Components of Perceived Risk. Adv. Consum. Res. 1972, 3, 382–393.40. McKnight, D.H.; Choudhury, V.; Kacmar, C. Developing and Validating Trust Measures for E-Commerce:
An Integrative Typology. Inf. Syst. Res. 2002, 13, 334–359. [CrossRef]41. Oliveira, T.; Thomas, M.; Baptista, G.; Campos, F. Mobile Payment: Understanding the Determinants of
Customer Adoption and Intention to Recommend the Technology. Comput. Hum. Behav. 2016, 61, 404–414.[CrossRef]
42. Duane, A.; O’Reilly, P.; Andreev, P. Realising M-Payments: Modelling Consumers’ Willingness to M-PayUsing Smart Phones. Behav. Inf. Technol. 2014, 33, 318–334. [CrossRef]
Sustainability 2017, 9, 2233 21 of 22
43. Federal Reserve Bank. Current Use of Mobile Banking and Payments. Available online: https://www.federalreserve.gov/econresdata/mobile-devices/2012-current-use-mobile-banking-payments.htm(accessed on 30 June 2017).
44. Kasekende, L. Mobile Money Services—Talking Points. Available online: http://nyucted.org/wp-content/uploads/2012/11/louis-kasekende-mobile-money-uganda2.pdf (accessed on 7 April 2017).
45. Morawczynski, O. Fraud in Uganda: How Millions Were Lost to Internal Collusion. Available online: https://www.cgap.org/blog/fraud-uganda-how-millions-were-lost-internal-collusion (accessed on 30 June 2017).
46. Al-Jabri, I.M. The Intention to Use Mobile Banking: Further Evidence from Saudi Arabia. S. Afr. J. Bus. Manag.2015, 46, 23–34.
47. Zhou, T. Understanding the Determinants of Mobile Payment Continuance Usage. Ind. Manag. Data Syst.2014, 114, 936–948. [CrossRef]
48. McKnight, D.H.; Chervany, N.L. What Trust Means in E-Commerce Customer Relationships:An Interdisciplinary Conceptual Typology. Int. J. Electron. 2002, 6, 35–59. [CrossRef]
49. Zhou, T. An Empirical Examination of Initial Trust in Mobile Payment. Wirel. Pers. Commun. 2014, 77,1519–1531. [CrossRef]
50. Lu, Y.; Yang, S.; Chau, P.Y.K.; Cao, Y. Dynamics between the Trust Transfer Process and Intention to UseMobile Payment Services: A Cross-Environment Perspective. Inf. Manag. 2011, 48, 393–403. [CrossRef]
51. Park, J.-K.; Gunn, F.; Han, S.-L. Multidimensional Trust Building in E-Retailing: Cross-Cultural Differencesin Trust Formation and Implications for Perceived Risk. J. Retail. Consum. Serv. 2012, 19, 304–312. [CrossRef]
52. Gefen, D.; Straub, D.W. Consumer Trust in B2C E-Commerce and the Importance of Social Presence:Experiments in E-Products and E-Services. Omega 2004, 32, 407–424. [CrossRef]
53. Lin, K.-M. Understanding Undergraduates’ Problems from Determinants of Facebook Continuance Intention.Behav. Inf. Technol. 2016, 35, 693–705. [CrossRef]
54. Thakur, R.; Srivastava, M. Adoption Readiness, Personal Innovativeness, Perceived Risk and Usage Intentionacross Customer Groups for Mobile Payment Services in India. Internet Res. 2014, 24, 369–392. [CrossRef]
55. Lee, M.S.Y.; McGoldrick, P.J.; Keeling, K.A.; Doherty, J. Using ZMET to Explore Barriers to the Adoption of3G Mobile Banking Services. Int. J. Retail Distrib. Manag. 2003, 31, 340–348. [CrossRef]
56. Nel, J.; Boshoff, C. The Impact of Cross-Channel Cognitive Evaluations on the Continued Use Intentions ofMobile Banking. Manag. Dyn. 2014, 23, 2–19.
57. Kasekende, L. What Role Does Financial Inclusion Play in the Policy Agenda for Inclusive Growth inSub-Saharan Africa? Development 2014, 57, 481–487. [CrossRef]
58. Kim, K.K.; Prabhakar, B. Initial Trust, Perceived Risk, and the Adoption of Internet Banking. Proc. ICIS 2000,1, 537–543.
59. Slade, E.L.; Dwivedi, Y.K.; Piercy, N.C.; Williams, M.D. Modeling Consumers’ Adoption Intentions ofRemote Mobile Payments in the United Kingdom: Extending UTAUT with Innovativeness, Risk, and Trust.Psychol. Mark. 2015, 32, 860–873. [CrossRef]
60. Yang, K. The Effects of Technology Self-Efficacy and Innovativeness on Consumer Mobile Data ServiceAdoption between American and Korean Consumers. J. Int. Consum. Mark. 2010, 22, 117–127. [CrossRef]
61. Faqih, K.M.S. Exploring the Influence of Perceived Risk and Internet Self-Efficacy on Consumer OnlineShopping Intentions: Perspective of Technology Acceptance Model. Int. Manag. Rev. 2013, 9, 67–78.
62. Zhou, T. Examining Location-Based Services Usage From the Perspectives of Unified Theory of Acceptanceand Use of Technology and Privacy Risk. J. Electron. Commer. Res. 2012, 13, 135–144.
63. López-Nicolás, C.; Molina-Castillo, F.J.; Bouwman, H. An Assessment of Advanced Mobile ServicesAcceptance: Contributions from TAM and Diffusion Theory Models. Inf. Manag. 2008, 45, 359–364.[CrossRef]
64. Zhou, T. Exploring Mobile User Acceptance Based on UTAUT and Contextual Offering. In Proceedings ofthe International Symposium on Electronic Commerce and Security, Guangzhou, China, 3–5 August 2008;pp. 241–245.
65. Chen, K.-Y.; Chang, M.-L. User Acceptance of “near Field Communication” Mobile Phone Service:An Investigation Based on the “Unified Theory of Acceptance and Use of Technology” Model. Serv. Ind. J.2013, 33, 609–623. [CrossRef]
66. Featherman, M.S.; Pavlou, P.A. Predicting E-Services Adoption: A Perceived Risk Facets Perspective. Int. J.Hum. Comput. Stud. 2003, 59, 451–474. [CrossRef]
Sustainability 2017, 9, 2233 22 of 22
67. Wang, E.S.-T.; Lin, R.-L. Perceived Quality Factors of Location-Based Apps on Trust, Perceived Privacy Risk,and Continuous Usage Intention. Behav. Inf. Technol. 2016, 36, 2–10. [CrossRef]
68. Jarvenpaa, S.; Tractinsky, N.; Saarinen, L. Consumer Trust in an Internet Store: A Cross-Cultural Validation.J. Comput. Commun. 1999, 5, 1–35. [CrossRef]
69. Jack, W.; Suri, T. Risk Sharing and Transactions Costs: Evidence from Kenya’s Mobile Money Revolution.Am. Econ. Rev. 2014, 104, 183–223. [CrossRef]
70. Zhu, Y.; Chen, H. Service Fairness and Customer Satisfaction in Internet Banking. Internet Res. 2012, 22,482–498. [CrossRef]
71. Zhou, T. An Empirical Examination of Initial Trust in Mobile Banking. Internet Res. 2011, 21, 527–540.[CrossRef]
72. Ajzen, I.; Fishbein, M. Belief, Attitude, Intention, and Behaviour: An Introduction to Theory and Research;Addison-Wesley: Reading, MA, USA, 1975.
73. Kwee-Meier, S.; Butzler, J.; Schlick, C. Development and Validation of a Technology Acceptance Model forSafety-Enhancing, Wearable Systems. Behav. Inf. Technol. 2016, 35, 394–409. [CrossRef]
74. Malhotra, N.K.; Kim, S.-S.; Agarwal, J. Internet Users’ Information Privacy Concerns (IUIPC): The Construct,the Scale, and a Causal Model. Info Sys. Res. 2004, 15, 336–355. [CrossRef]
75. Chuchird, R.; Sasaki, N.; Abe, I. Influencing Factors of the Adoption of Agricultural Irrigation Technologiesand the Economic Returns: A Case Study in Chaiyaphum Province, Thailand. Sustainability 2017, 9, 1524.[CrossRef]
76. Zikmund, W.G. Business Research Methods, 7th ed.; Thomson/South-Western: Cincinnati, OH, USA, 2003.77. Hair, J.F.; Hult, G.T.M.; Ringle, C.M.; Sarstedt, M. A Primer on Partial Least Squares Structural Equation
Modelling (PLS-SEM); SAGE Publications, Inc.: London, UK, 2014.78. Anderson, J.; Gerbing, D. Structural Equation Modelling in Practice: A Review and Recommended Two-Step
Approach. Psychol. Bull. 1988, 103, 411–423. [CrossRef]79. Park, J.-Y.; Sung, C.-S.; Im, I. Does Social Media Use Influence Entrepreneurial Opportunity? A Review of Its
Moderating Role. Sustainability 2017, 9, 1593. [CrossRef]80. Chin, W.W.; Newsted, P.R. Structural Equation Modeling Analysis with Small Samples Using Partial
Least Squares. In Statistical Strategies for Small Sample Research; Hoyle, R.H., Ed.; SAGE Publications, Inc.:Thousand Oaks, CA, USA, 1999.
81. Lu, J.; Wei, J.; Yu, C.-S.; Liu, C. How Do Post-Usage Factors and Espoused Cultural Values Impact MobilePayment Continuation? Behav. Inf. Technol. 2016, 36, 140–164. [CrossRef]
82. Henseler, J.; Ringle, C.M.; Sinkovics, R.R. The Use of Partial Least Squares Path Modeling in InternationalMarketing. Adv. Int. Mark. 2009, 20, 277–319.
83. Chin, W.W. The Partial Least Squares Approach for Structural Equation Modeling. In Modern Methods forBusiness Research; Marcoulides, G.A., Ed.; Lawrence Erlbaum Associates: Hillsdale, NJ, USA, 1998.
84. Hair, J.F.; Bill, B.; Barry, B.; Rolph, E.A. Multivariate Data Analysis; Pearson: Englewood Cliffs, NJ, USA, 2009.85. Bagozzi, R.P.; Yi, Y.-J. On the Evaluation of Structural Equation Models. J. Acad. Mark. Sci. 1988, 16, 74–94.
[CrossRef]86. Gefen, D.; Straub, D.W.; Boudreau, M.-C. Structural Equation Modeling and Regression: Guidelines for
Research and Practice. CAIS 2000, 4, 1–70.87. Fornell, C.; Larcker, D.F. Evaluating Structural Equation Models with Unobservable Variables and
Measurement Error. J. Mark. 1981, 1, 39–50. [CrossRef]
© 2017 by the authors. Licensee MDPI, Basel, Switzerland. This article is an open accessarticle distributed under the terms and conditions of the Creative Commons Attribution(CC BY) license (http://creativecommons.org/licenses/by/4.0/).