Examining the Clinical and Genetic Overlap of Attention Deficit ...
195
Examining the Clinical and Genetic Overlap of Attention Deficit Hyperactivity Disorder and Autism Spectrum Disorder Traits Joanna Martin Ph.D. 2014 Supervisors: Dr Marian Hamshere Prof Anita Thapar Prof Michael O’Donovan
-
Upload
khangminh22 -
Category
Documents
-
view
5 -
download
0
Transcript of Examining the Clinical and Genetic Overlap of Attention Deficit ...
Examining the Clinical and Genetic Overlap of
Attention Deficit Hyperactivity Disorder and
Autism Spectrum Disorder Traits
Joanna Martin
Ph.D. 2014
Supervisors:
Dr Marian Hamshere
Prof Anita Thapar
Prof Michael O’Donovan

i
Declaration and Statements
DECLARATION
This work has not been submitted in substance for any other degree or award at this or any other
university or place of learning, nor is being submitted concurrently in candidature for any degree or
other award.
Signed ………………………………………… (candidate) Date …………………………
STATEMENT 1
This thesis is being submitted in partial fulfilment of the requirements for the degree of PhD.
Signed ………………………………………… (candidate) Date …………………………
STATEMENT 2
This thesis is the result of my own independent work/investigation, except where otherwise stated.
Other sources are acknowledged by explicit references. The views expressed are my own.
Signed ………………………………………… (candidate) Date …………………………
STATEMENT 3
I hereby give consent for my thesis, if accepted, to be available online in the University’s Open
Access repository and for inter-library loan, and for the title and summary to be made available to
outside organisations.
Signed ………………………………………… (candidate) Date …………………………
STATEMENT 4: PREVIOUSLY APPROVED BAR ON ACCESS
I hereby give consent for my thesis, if accepted, to be available online in the University’s Open
Access repository and for inter-library loans after expiry of a bar on access previously approved by
the Academic Standards & Quality Committee.
Signed ………………………………………… (candidate) Date …………………………

ii
Acknowledgements
I am extremely grateful to my PhD supervisors Dr Marian Hamshere, Prof Anita Thapar and Prof
Michael O’Donovan for their dependable and continuous support and guidance over the last few
years. I really value the time and energy they spent discussing ideas and results with me, reading
iterations of drafts throughout the publication process of the results chapters in this thesis, and
mentoring me through all the intricacies of an academic career. Their kind and dedicated help has
made my PhD an enjoyable time and made me feel prepared for the next steps in my academic
career.
I would also like to thank my other co-authors on my publications, Dr Miriam Cooper, Dr Kate
Langley, Dr Evangelia Stergiakouli and Sir Prof Michael Rutter, for assisting me with interpreting
results, developing ideas and editing my writing. Thanks also go to Prof Gordon Harold for advice
on choice and interpretation of factor solutions as well as proofreading the manuscript for chapter 3
and to Dr Stephan Collishaw for advice and comments on a draft of the manuscript for chapter 5.
I am grateful to all the families and children who gave their time, data and biological samples to the
ADHD and ALSPAC studies, as well as the paediatricians, CAMHS clinicians, research teams and
admin staff who recruited the families, collected the data and helped with these projects. These
studies were funded by Baily Thomas Charitable Trust, Action Medical Research and the Wellcome
Trust. Thanks to the ALSPAC executive committee for allowing me to use this dataset for my PhD
and thanks to the Psychiatric Genomics Consortium ADHD group for providing the genetic
discovery data. I would also like to thank the Medical Research Council and the School of Medicine
at Cardiff University for funding me to do this work.
I am very grateful to my colleagues and friends for constant moral and practical support, especially
Ruth, Gemma, Olga, Miriam, Jo, Liam, Katie, Maria and Sharifah. Special thanks go to Ruth and
Liam for helping me to get to grips with SEM. I am also extremely grateful to my family and my
husband Devin for always being there for me and also for letting me incessantly talk about my PhD.

iii
Thesis Summary
Attention deficit hyperactivity disorder (ADHD) is a common and impairing neurodevelopmental
disorder, which frequently co-occurs with autism spectrum disorder (ASD). Both disorders are
highly heritable and recent studies report a substantial degree of overlap in genetic risks for ADHD
and ASD. The overall objective of this thesis is to examine the clinical co-occurrence and shared
genetic susceptibility of these conditions, as well as of related developmental problems.
First, the presentation of ASD traits is examined in a clinical sample of children diagnosed with
ADHD. This is followed by an assessment of whether the presence of ASD traits in children with
ADHD is associated with additional cognitive or developmental difficulties. Lastly, it is investigated
whether common genetic risk variants which are associated with clinically-diagnosed ADHD are
also associated with ADHD traits, ASD-like social-communication difficulties and neurocognitive
abilities (i.e. IQ, working memory, inhibitory control and facial emotion recognition) in children
from a general population sample.
The results show that ASD traits split into separate, albeit correlated dimensions of social-
communication difficulties and restrictive, repetitive behaviours (RRBs) in children with ADHD.
They also suggest that there may be some overlap of RRBs and hyperactive-impulsive ADHD
symptoms. Increasing levels of ASD traits in children with ADHD are found to index more ADHD
symptoms, as well as lower cognitive abilities and a greater likelihood of developmental difficulties.
Finally, the results demonstrate that common genetic risk variants relevant to ADHD diagnosis are
associated with ADHD and social-communication problems as well as cognitive difficulties (lower IQ
and working memory abilities) in children in the general population.
This thesis extends our understanding of the clinical importance of assessing ASD in the context of
ADHD. Furthermore, the findings demonstrate that common genetic risk variants for childhood
ADHD are also relevant to other neurodevelopmental and cognitive outcomes in the general
population.

iv
Publications resulting from work in this thesis
Martin, J., Hamshere, M., Stergiakouli, E., O’Donovan, M. C., & Thapar, A. (2014). Neurocognitive
abilities in the general population and polygenic risk scores for attention deficit
hyperactivity disorder. Journal of Child Psychology and Psychiatry (Epub ahead of print]).
doi:10.1111/jcpp.12336
Martin, J., Hamshere, M. L., Stergiakouli, E., O’Donovan, M. C., & Thapar, A. (2014). Genetic Risk
for Attention Deficit Hyperactivity Disorder Contributes to Neurodevelopmental Traits in
the General Population. Biological Psychiatry, 76(8), 664-671.
Cooper, M.*, Martin, J.*, Langley, K., Hamshere, M., & Thapar, A. (* joint 1st authors). (2014).
Autistic traits in children with ADHD index clinical and cognitive problems. European Child
and Adolescent Psychiatry, 23(1), 23-34.
Martin, J., Hamshere, M. L., O’Donovan, M. C., Rutter, M., & Thapar, A. (2013). Factor structure of
autistic traits in children with ADHD. Journal of Autism and Developmental Disorders, 44(1),
204-215.

v
Additional, related publications to which I have contributed
Martin J., O’Donovan M. C., Thapar A., Langley K., Williams N. (In Press). The relative contribution
of common and rare genetic variants to ADHD. Translational Psychiatry.
Martin, J., Cooper, M., Hamshere, M., Pocklington, A., Scherer, S., Kent, L., Gill, M., Owen, M.,
Williams, N., O’Donovan, M., Thapar, A., Holmans, P. (2014). Biological overlap of
Attention-Deficit/Hyperactivity Disorder and Autism Spectrum Disorder: Evidence from
copy number variants. Journal of the American Academy of Child & Adolescent Psychiatry, 53,
761-770.e26
Hamshere, M. L., Langley, K., Martin, J., Agha, S. S., Stergiakouli, E., Anney, R. J., Buitelaar, J., et
al. (2013). High loading of polygenic risk for ADHD in children with comorbid aggression.
American Journal of Psychiatry, 170(8), 909-916.
Ahuja, A.*, Martin, J.*, Langley, K., & Thapar, A. (2013). (* joint 1st authors). Intellectual disability
in children with ADHD. Journal of Pediatrics, 163(3), 890-895.e1.
Hamshere, M. L., Stergiakouli, E., Langley, K., Martin, J., Holmans, P., Kent, L., Owen, M. J., et al.
(2013). A shared polygenic contribution between childhood ADHD and adult schizophrenia.
The British Journal of Psychiatry, 203(2), 107-111.

vi
Table of Contents
Declaration and Statements .......................................................................................................... i
Acknowledgements ...................................................................................................................... ii
Thesis Summary .......................................................................................................................... iii
Publications resulting from work in this thesis ............................................................................. iv
Additional, related publications to which I have contributed ......................................................... v
Index of tables ............................................................................................................................. viii
Index of figures ............................................................................................................................ ix
Background Literature ........................................................................................ 1 Chapter 1
1.1 Introduction ............................................................................................................................. 1
1.2 Definitions & diagnoses ........................................................................................................... 1
1.3 Dimensionality ......................................................................................................................... 5
1.4 Prevalence ............................................................................................................................... 6
1.5 Phenotypic overlap of ADHD and ASD .................................................................................... 8
1.6 Genetic risk factors .................................................................................................................15
1.7 Genetic overlap of ADHD and ASD ........................................................................................ 28
1.8 Summary & limitations of existing literature .......................................................................... 31
1.9 Thesis aims & hypotheses ....................................................................................................... 33
Description of Samples ...................................................................................... 35 Chapter 2
2.1 Clinical sample of children diagnosed with ADHD ................................................................. 35
2.2 Children from the general population .................................................................................... 42
2.3 Brief notes regarding measures and sample sizes .................................................................. 48
Factor Structure of Autistic Traits in Children with ADHD .................................... 49 Chapter 3
3.1 Summary ............................................................................................................................... 49
3.2 Introduction ........................................................................................................................... 50
3.3 Method .................................................................................................................................. 53
3.4 Results ................................................................................................................................... 55
3.5 Discussion .............................................................................................................................. 62
Autistic Traits in Children with ADHD Index Cognitive and Developmental ProblemsChapter 4
...................................................................................................................................... 67
4.1 Summary ............................................................................................................................... 67
4.2 Introduction .......................................................................................................................... 68
4.3 Method .................................................................................................................................. 70
4.4 Results................................................................................................................................... 74
4.5 Discussion ............................................................................................................................. 82
Genetic Risk for ADHD Contributes to Neurodevelopmental Traits in the General Chapter 5
Population ...................................................................................................................... 88
5.1 Summary ............................................................................................................................... 88
5.2 Introduction ........................................................................................................................... 89
5.3 Method .................................................................................................................................. 90
5.4 Results ................................................................................................................................... 96
5.5 Discussion ............................................................................................................................. 103
Neurocognitive Abilities in the General Population and Polygenic Risk Scores for Chapter 6
ADHD ............................................................................................................................ 108

vii
6.1 Summary ............................................................................................................................. 108
6.2 Introduction ........................................................................................................................ 109
6.3 Method ................................................................................................................................. 112
6.4 Results ................................................................................................................................. 116
6.5 Discussion ........................................................................................................................... 124
General Discussion .......................................................................................... 129 Chapter 7
7.1 Summary of results .............................................................................................................. 129
7.2 Implications of the results ..................................................................................................... 130
7.3 Methodological considerations ............................................................................................. 134
7.4 Summary of strengths and limitations .................................................................................. 143
7.5 Suggestions for future work .................................................................................................. 145
7.6 Conclusion ........................................................................................................................... 146
References .....................................................................................................................148
Appendices .................................................................................................................... 170
Appendix 2.1: The Social Communication Questionnaire ........................................................... 170
Appendix 2.2: Quality control procedures for genetic data ........................................................ 170
Appendix 2.3: The Social and Communication Disorders Checklist ............................................ 171
Appendix 2.4: The Children’s Communication Checklist – pragmatic language subscales .......... 171
Appendix 3.1: Pattern matrix of loadings for factor analysis of SCQ items and ADHD symptoms:
5-factor solution ......................................................................................................................... 172
Appendix 3.2: Pattern matrix of loadings for factor analysis of SCQ items; Children with ID
excluded..................................................................................................................................... 173
Appendix 3.3: Pattern matrix of loadings for factor analysis of SCQ items and ADHD symptoms;
Children with ID excluded .......................................................................................................... 174
Appendix 3.4: Pattern matrix of loadings for factor analysis of SCQ items; Females excluded ... 175
Appendix 3.5: Pattern matrix of loadings for factor analysis of SCQ items and ADHD symptoms;
Females excluded ....................................................................................................................... 176
Appendix 5.1: Associations of polygenic score with ADHD and ASD-related phenotypes in
ALSPAC ..................................................................................................................................... 178
Appendix 5.2: Associations of ADHD and ASD-related phenotypes with ADHD polygenic scores
calculated based on the primary discovery sample, using a variety of p-value thresholds (linear
regressions) ................................................................................................................................ 179
Appendix 6.1: Associations between polygenic risk scores with ADHD traits and neurocognitive
measures as correlated outcomes ............................................................................................. 180
Appendix 6.2: Associations of polygenic risk scores with neurocognitive outcomes.................. 182
Appendix 6.3: Association between polygenic risk scores (based on the replication discovery
sample) with working memory at age 10.5 years ........................................................................ 183
Appendix 6.4: Associations between polygenic risk scores and neurocognitive measures, using
listwise deletion ......................................................................................................................... 183

viii
Index of tables
Table 1.1: DSM-5 and ICD-10 Diagnostic Criteria for ADHD .............................................................. 3
Table 1.2: DSM-IV and DSM-5 Diagnostic Criteria for ASD ................................................................ 4
Table 2.1: Characteristics & demographics of the clinical ADHD sample ......................................... 40
Table 2.2: Characteristics & demographics of the ALSPAC sample ................................................. 47
Table 2.3: List of behavioural and cognitive measures available in both samples ............................ 48
Table 3.1: Factor correlations for both EFA analyses ....................................................................... 56
Table 3.2: Pattern matrix of loadings for factor analysis of SCQ items ............................................. 57
Table 3.3: Pattern matrix of loadings for factor analysis of SCQ items and ADHD symptoms.......... 59
Table 3.4: Factor score correlations with age and IQ ....................................................................... 61
Table 3.5: Association of factor scores with gender and presence of ID ........................................... 61
Table 4.1: Sample characteristics in relation to Social Communication Questionnaire scores .......... 75
Table 4.2: Associations of Social Communication Questionnaire scores with cognitive and
developmental outcomes ................................................................................................................ 77
Table 4.3: Secondary analyses – multivariate regressions of ASD sub-domains in relation to
significant outcomes ....................................................................................................................... 79
Table 4.4: Associations of Social Communication Questionnaire with cognitive and developmental
outcomes, excluding those with ID (N=85) ...................................................................................... 80
Table 4.5: Social Communication Questionnaire score as a binary predictor of cognitive and
developmental outcomes ............................................................................................................... 81
Table 5.1: Number of SNPs from the clinical ADHD discovery sample mapped to alleles & used to
calculate polygenic risk scores at each threshold ............................................................................ 93
Table 5.2: ADHD and ASD diagnoses in the sample ........................................................................ 96
Table 5.3: Pearson correlation coefficients of ADHD and social-communication measures ............. 98
Table 5.4: Associations of polygenic risk scores with ADHD and ASD-related phenotypes in ALSPAC
....................................................................................................................................................... 101
Table 5.5: Secondary analysis – Associations of polygenic risk scores with ADHD at age 10 years . 101
Table 5.6: Replication analyses – Associations of polygenic risk scores based on second discovery
sample with ADHD at both time points ......................................................................................... 102
Table 6.1: Pearson correlation coefficients for the neurocognitive and neurodevelopmental
measures ....................................................................................................................................... 116

ix
Index of figures
Figure 2.1: Distribution of IQ in the clinical ADHD sample ............................................................... 41
Figure 2.2: Distribution of IQ in the ALSPAC sample ....................................................................... 47
Figure 4.1: Distribution of total Social Communication Questionnaire scores in the sample ............ 75
Figure 5.1: Histograms of ADHD & social-communication traits in the ALSPAC sample ................. 95
Figure 5.2: Simulated data showing Poisson and negative binomial distributions ........................... 95
Figure 5.3: Mean z-scores of ADHD & social-communication outcomes, displayed by diagnostic
group .............................................................................................................................................. 97
Figure 5.4: Structural equation modelling of polygenic risk scores predicting multiple correlated
outcomes ........................................................................................................................................ 99
Figure 6.1: Confirmatory factor analytic/latent variable model of neurodevelopmental outcomes 117
Figure 6.2: Association between polygenic risk scores with IQ ....................................................... 118
Figure 6.3: Association between polygenic risk scores with working memory at age 8 years ......... 119
Figure 6.4: Association between polygenic risk scores with inhibitory control ............................... 119
Figure 6.5: Association between polygenic risk scores with facial emotion recognition ................ 120
Figure 6.6: Association between polygenic scores with working memory at age 10 years ............. 120
Figure 6.7: Associations between polygenic risk scores with IQ and working memory (age 8 years) as
correlated outcomes ...................................................................................................................... 121
Figure 6.8: Associations of neurocognitive phenotypes with ADHD polygenic scores calculated
based on the primary discovery sample, using a variety of p-value thresholds (linear regressions) 122
Figure 6.9: Association between polygenic risk scores (based on replication discovery sample) with
IQ ................................................................................................................................................... 123
Figure 6.10: Association between polygenic risk scores (based on replication discovery sample) with
working memory ........................................................................................................................... 124

1
Chapter 1
Background Literature
1.1 Introduction
The overall aim of this thesis is to inform our understanding of the presentation and aetiology of
attention deficit hyperactivity disorder (ADHD) by examining its clinical and genetic relationship
with autism spectrum disorder (ASD) and other early developmental and cognitive problems. This
chapter will first consider important diagnostic and clinical features of ADHD and ASD. This will be
followed by a discussion of the clinical overlap and similarities in neurocognitive and developmental
deficits associated with ADHD and ASD. The focus will then turn to examining the heritability,
genetic architecture (i.e. the number, frequencies and effect sizes of risk variants) and genetic
overlap of the two conditions. Finally, limitations of current research will be discussed and the
specific aims of the thesis will be outlined.
1.2 Definitions & diagnoses
ADHD is a childhood-onset neurodevelopmental condition characterised by developmentally
inappropriate levels of inattention, hyperactivity and impulsivity. The recently released Diagnostic
and Statistical Manual of Mental Disorders, Fifth Edition (DSM-5) has seen several reasonably subtle
changes to diagnostic recommendations and criteria for ADHD, although the core deficits
characterising this condition remain largely comparable to those in the DSM-IV. ADHD is also
known as Hyperkinetic Disorder in the ICD-10 (the International Classification of Diseases), which is
currently under revision. The diagnostic criteria for ADHD and Hyperkinetic Disorder can be found
in Table 1.1 below. Given the developmental nature of ADHD, the diagnostic criteria stipulate early
onset of core features, i.e. prior to age 12 years (age 7 years in ICD-10 and previously in DSM-IV).
Although associated with early childhood, ADHD symptoms often persist into adolescence and
adulthood and are associated with risk for other psychiatric problems and poor outcomes (Barkley

2
et al., 2006; Langley et al., 2010; Mannuzza et al., 1993, 1998; Yoshimasu et al., 2012). Longitudinal
studies suggest that ADHD symptoms, particularly those of hyperactivity and impulsivity, can
decrease somewhat over time, though rates of full remission are not high (Hill & Schoener, 1996;
Lahey et al., 2005). DSM-IV included three diagnostic subtypes of ADHD: predominantly inattentive
presentation, predominantly hyperactive-impulsive presentation and combined presentation.
However, the developmental stability of these subtypes is rather poor, with the mix of inattentive
and hyperactive-impulsive symptoms in affected children fluctuating over time (Willcutt et al.,
2012). The DSM-5 no longer considers these as ‘subtypes’ but rather allows for descriptive
presentation specifiers for a diagnosis of ADHD, corresponding to each of the DSM-IV subtypes.
Historically, it has been recommended in diagnostic manuals (e.g. ICD-10 & DSM-IV) that ADHD
could not be diagnosed in an individual with an existing diagnosis of a ‘pervasive developmental
disorder’, now known as ‘autism spectrum disorder’ (ASD) in DSM-5. However, the past decade has
seen an abundance of evidence from research studies disputing this exclusion (discussed below),
which has resulted in the removal of this restriction in the DSM-5. The core criteria of ASD are
distinct to those of ADHD (see Table 1.2). ASD is characterised by difficulties in social
communication and social interaction, as well as restrictive, repetitive or stereotyped patterns of
behaviours, interests or activities. The DSM-5 has seen the merging of a number of supposed
subtypes of ASD (i.e. classical autism, Asperger’s syndrome and ‘pervasive developmental disorder-
not otherwise specified’). The DSM-5 also introduced a new diagnostic category called ‘Social
Communication Disorder’, which is likely to apply to individuals not meeting full criteria for ASD, by
virtue of absence of clear restrictive and repetitive behaviours. It is unclear though whether this
separate diagnostic category is substantially different from the social communication and social
interaction domain of ASD (Skuse, 2012). Moreover, there is a lack of supportive evidence for this
new diagnostic category, suggesting that social communication and pragmatic language
impairments may be best considered as a dimension of symptoms (Norbury, 2014).

3
Table 1.1: DSM-5 and ICD-10 Diagnostic Criteria for ADHD
This table has been removed by the author for copyright reasons.

4
Table 1.2: DSM-IV and DSM-5 Diagnostic Criteria for ASD
This table has been removed by the author for copyright reasons.
5
1.3 Dimensionality
Whilst clinical diagnoses are defined categorically, psychopathology can also be viewed
dimensionally, with the diagnosed condition seen as the extreme end of a continuous distribution of
traits in the general population. There is evidence that ADHD symptoms are continuously
distributed in children from the general population (Rodriguez et al., 2007). Similarly, ASD traits
have also been shown to be continuously distributed in population samples (Constantino & Todd,
2003; Posserud et al., 2006). The lack of a discontinuity at the severe end of distributions of ADHD
and ASD traits indicates that there is likely to be no clear, definitive point where sub-threshold
levels of these traits abruptly become clinically meaningful and indicative of disorder.
Importantly, clinical diagnoses are not simply defined by the presence of a certain amount of
symptoms, but also by the additional impairment in daily functioning attributable to these
symptoms and other features (e.g. pervasiveness of ADHD symptoms across multiple settings).
Indeed, children with sub-threshold ADHD symptoms (i.e. not meeting full criteria for ADHD)
frequently have comorbid problems and present with impairment of functioning as compared with
controls (Balázs & Keresztény, 2014; Hong et al., 2014). There is little doubt that categorical clinical
diagnoses are meaningful and important for decisions regarding treatment. However, utilising
categorical diagnoses for research, with the aim of understanding the biological underpinnings of
these disorders and informing classification, is arguably less valuable and even somewhat circular.
As such, considering these conditions as distributions of continuous traits may be a valuable
research approach. In recent years, the National Institute for Mental Health developed a novel
framework called the Research Domain Criteria (RDoC) for the purpose of researching the aetiology
and nature of mental health problems (Casey et al., 2013; Insel et al., 2010). The RDoC framework
relies on a dimensional cross-diagnostic approach to investigate underlying biology of mental
health across the life span. The hope is that research using this framework will help to develop a
new, more biologically-oriented classification system for mental health problems.

6
Multiple dimensions
ADHD has long been considered to consist of two distinct but correlated symptom domains; these
are inattentive and hyperactive-impulsive symptoms. Numerous studies, including factor analyses,
have supported the division of ADHD into these two separate, albeit strongly related domains
(Willcutt et al., 2012). Historically, ASD symptoms have been divided into a triad of impairments,
with deficits of communication, social-interaction problems and restrictive-repetitive behaviours
(RRBs) considered separately. Although the different ASD behaviours occur together more than
expected by chance, correlations between them are only moderate, suggesting that the sub-
domains are to some extent clinically separable (Happé & Ronald, 2008; Ronald et al., 2006b).
Factor analyses of autistic traits in clinical ASD and community samples using a variety of ASD
measurement tools generally indicate that multiple factors account for the observed covariance
structure of ASD symptoms and traits (Happé & Ronald, 2008; Mandy & Skuse, 2008). Likely due to
differences in study design (e.g. the types of measures used to assess ASD), there is little
agreement in terms of the specific factors and their composition. However, nearly all factor analytic
studies derive at least one factor related to social-communication features and a separate factor
related to ‘non-social’ behaviour or RRBs (Mandy & Skuse, 2008). In DSM-5, ASD is now considered
to be divisible into the two dimensions of social-communication difficulties and RRBs. As such,
ADHD and ASD can each be conceptualised as consisting of two related core dimensions of
behavioural traits.
1.4 Prevalence
ADHD and ASD are two of the most common neurodevelopmental disorders. Reliable prevalence
rates are difficult to measure accurately due to methodological heterogeneity across geographical
location and across time. One meta-analysis of 102 studies has estimated the world-wide point
prevalence of childhood ADHD to be 5.3% (Polanczyk et al., 2007), though there is wide
geographical variability. More recent meta-analyses of studies using only DSM-IV diagnostic criteria

7
suggest that the prevalence rate of ADHD is between 5.9-7.1%, depending on source of informant
(Willcutt, 2012). Prevalence of ADHD in the UK has been estimated at about 2.2% for any DSM-IV
ADHD diagnosis (Ford et al., 2003) and 1.4% for ICD-10 Hyperkinetic Disorders (Meltzer et al.,
2000). ASD has been estimated to affect about 0.3-1.0% of children (Elsabbagh et al., 2012; Rutter,
2005). Although estimates of prevalence of both ADHD and ASD appear to have increased in the
past few decades (Elsabbagh et al., 2012; Visser et al., 2010), a number of factors are likely to
account for this. A recent meta-regression of 135 ADHD prevalence studies suggests that after
accounting for heterogeneity of study methods, prevalence rates have not increased significantly
over the last three decades (Polanczyk et al., 2014). A review of prevalence studies of ASD suggests
that changing diagnostic classifications, under-powered studies and methodological heterogeneity
may account for rising prevalence rates (Fisch, 2012). In general, it would seem that changes in
diagnostic criteria and growing recognition and awareness, particularly of more mild forms of the
conditions, may largely account for apparently growing prevalence rates of ADHD and ASD in clinic
populations.
Gender
One important observation with regards to prevalence of childhood ADHD and ASD is that both
conditions have a significantly higher rate of occurrence in males than females. Depending on the
sample type, the male:female ratio of ADHD is about 3-7:1 (Lahey et al., 1994; Polanczyk et al.,
2007) and for ASD this ratio is about 3-8:1 (Baird et al., 2006; Keen & Ward, 2004). In children with
ADHD, this gender difference is particularly noticeable in children ascertained from clinics relative
to community samples (Gershon, 2002), possibly due to higher levels of comorbid behavioural
problems in males, resulting in higher levels of clinical referrals in males (Levy et al., 2005). On the
other hand, the gender discrepancy in ASD is higher in populations of “high-functioning” children
(i.e. those who have fewer cognitive difficulties), as compared with children with ASD who have
comorbid intellectual disability (Fombonne, 2003).
8
1.5 Phenotypic overlap of ADHD and ASD
Symptom co-occurrence
As mentioned earlier, a fairly recent diagnostic development is that the DSM-5 now allows for a
joint diagnosis of both ADHD and ASD in one individual. This change from previous diagnostic
manuals was prompted by numerous studies which highlighted the high rates of co-occurrence of
these conditions. This observed overlap questioned the assumption made in the DSM-IV and ICD-10
that the presence of ADHD traits in ASD could be accounted for by core ASD symptoms. Some have
argued that although it is plausible that certain ADHD behaviours (e.g. excessive motor activity or
inattention to social stimuli) may be explained by the presence of ASD symptoms (i.e. frequent
repetitive motor behaviours or social difficulties), many ADHD symptoms in children with ASD
cannot easily be explained by the ASD symptoms (Reiersen, 2011). Furthermore, the clinical
characteristics (in terms of symptom types and onset) of ADHD symptoms are similar in children
with ADHD with and without ASD (Frazier et al., 2001). As such, the examination of ADHD
symptoms in the context of ASD, and vice versa, is an important and growing research area.
Indeed, studies examining the prevalence of comorbid conditions in children diagnosed with ADHD
show that ASD is one of the most commonly co-occurring disorders and more generally, that
children with ADHD have elevated levels of sub-clinical ASD symptoms as compared with control
children (Grzadzinski et al., 2011; Kochhar et al., 2011; Kotte et al., 2013; Mulligan et al., 2009a;
Nijmeijer et al., 2009; Rommelse et al., 2009). Similarly, studies of children with ASD show high
rates of clinically meaningful ADHD symptoms (Gadow et al., 2006; Ghaziuddin et al., 1998;
Goldstein & Schwebach, 2004; Simonoff et al., 2008; Thede & Coolidge, 2007; Yerys et al., 2009b;
Yoshida & Uchiyama, 2004). Estimates suggest that between 20-50% of children with ADHD meet
diagnostic criteria for ASD and 30-80% of children with ASD meet criteria for ADHD (Rommelse et
al., 2010).

9
Overlap of ADHD and ASD symptoms has also been noted in general population and twin samples
(Lichtenstein et al., 2010; Reiersen et al., 2007; Ronald et al., 2008). Furthermore, longitudinal
trajectory analysis in the general population shows that children with persistently high levels of
ADHD traits tend to also have persistently high levels of social-communication difficulties (St
Pourcain et al., 2011). Longitudinal analyses in twins also highlight that ADHD and ASD traits show
associations between the ages of 8 and 12 years, with ADHD possibly predicting ASD more strongly
than ASD predicting later ADHD (Taylor et al., 2012). There is also some suggestion that ADHD and
ASD diagnoses are unstable over time, with some children meeting criteria for ASD in early
childhood but developing a symptom profile meeting only ADHD criteria at a later age (Fein et al.,
2005).
Factor structure
Interestingly, the co-occurrence of ADHD with ASD symptoms has been demonstrated to occur
within all three of the DSM-IV ASD sub-domains, though restrictive-repetitive behaviours have
been found to be less frequent than social and communication deficits in children with ADHD
(Rommelse et al., 2011). Although it is generally accepted that ASD splits into multiple dimensions
(as discussed in section 1.3), it is not clear whether the presence of ADHD affects the nature of ASD
symptoms. Furthermore, it is not clear whether any individual ADHD and ASD symptoms are
especially likely to co-occur in a clinical sample of children diagnosed with these conditions. One
factor analysis of ADHD and ASD symptoms in a community sample of children suggested that the
core diagnostic criteria of ADHD and ASD are distinct in terms of factor loadings (i.e. ADHD and
ASD symptoms load on separate sets of factors; Ghanizadeh, 2010). However, given prevalence
rates of 5% and less in general population samples (Polanczyk et al., 2007; Rutter, 2005), it is not
known whether there is a different pattern of clustering of ADHD and ASD symptoms at the more
extreme end of the distribution of these traits. These questions will be addressed in chapter 3 of this
thesis.

10
Clinical meaning
Another important question about the co-occurrence of ADHD and ASD traits seen in clinical and
community samples is whether the severity of ASD traits indexes a different clinical profile of ADHD
and associated developmental and cognitive features. One study has suggested that children with
ADHD with high levels of ASD traits may be more likely to have the more severe, DSM-IV combined
subtype of ADHD than children with ADHD with low levels of ASD traits (Grzadzinski et al., 2011).
Similarly, ASD trait scores within a clinical ADHD sample have been found to be associated with
higher levels of hyperactive-impulsive symptoms, with possible association with more inattentive
ADHD symptoms (Kröger et al., 2011). Conversely, studies in children with ASD suggest that co-
occurring ADHD symptoms also index a more severe profile of ASD symptoms (Gadow et al., 2006;
Holtmann et al., 2007; Yerys et al., 2009b), although some do not find this pattern of results
(Ghaziuddin et al., 2010). On the whole, the results suggest that the co-occurrence of ADHD and
ASD is of clinical significance.
Co-occurring psychopathology
ADHD and ASD not only frequently co-occur, but both conditions are commonly also associated
with other forms of psychopathology. ADHD is associated with especially high rates of oppositional
defiant disorder (ODD) and conduct disorder (CD), as well as anxiety, depression, Tourette's
syndrome and other psychiatric disorders (Biederman et al., 1991; Larson et al., 2011; Rommelse et
al., 2009). Children with ASD also frequently display disruptive behaviours (i.e. ODD and CD),
anxiety and mood problems (de Bruin et al., 2007; Mukaddes & Fateh, 2010; Simonoff et al., 2008;
Thede & Coolidge, 2007).
A comparison of comorbid psychopathology in children with ADHD or ASD suggests that rates of
oppositional, conduct and depression problems are similar, although children with ASD have higher
rates of anxiety problems (van Steensel et al., 2013). Studies also suggest that increasing levels of
ASD traits in children with ADHD may index higher rates of comorbid ODD and CD (Mulligan et al.,

11
2009a), although smaller studies do not find this effect (Grzadzinski et al., 2011; Kröger et al., 2011).
Similarly, children with co-occurring ADHD and ASD seem to have higher rates of comorbid ODD,
CD, anxiety and depression problems than children with ASD-only (Gadow et al., 2006; Guttmann-
Steinmetz et al., 2009, 2010; Holtmann et al., 2007; Yerys et al., 2009b). Taken as a whole, the
evidence suggests that co-occurring ADHD and ASD traits in children with either condition appear
to index higher levels of comorbid psychopathology.
Associated neurocognitive & developmental difficulties
General cognitive ability
Children with ADHD & ASD show similar deficits in a number of neurocognitive domains, as well as
impairments with respect to other developmental domains (e.g. motor coordination). ADHD and
ASD commonly co-occur with intellectual disability (ID) and both conditions tend to be associated
with lower general cognitive ability (e.g. IQ) than in typically developing individuals (Dykens &
Hodapp, 2001; Frazier et al., 2004; Matson & Shoemaker, 2009; Russell et al., 2014; Voigt et al.,
2006). This relationship is so strong that it has been argued that it is conceptually problematic to
match groups of children with ADHD or other neurodevelopmental problems on IQ, when
comparing against typically developing controls, or to co-vary for IQ in such comparisons (Dennis et
al., 2009). Such methods may introduce biases and remove important variance related to the
phenotypes of interest, potentially resulting in misleading findings. The common exclusion of
children with IQ<70 from studies of ADHD and ASD also limits the clinical representativeness of
such samples and may reduce the power of analyses involving IQ. For instance, although there is
some suggestion that variation in IQ is not associated with the presence of ASD traits in children
with ADHD (Grzadzinski et al., 2011; Kochhar et al., 2011) or ADHD traits in children with ASD
(Gadow et al., 2006; Guttmann-Steinmetz et al., 2009), the exclusion of children with low IQs is an
important limitation of these studies which needs to be addressed.

12
Executive functioning
In addition to an association with general cognitive difficulties, ADHD and ASD have also been
associated with deficits in executive functioning (EF), which is a broad umbrella term for a number
of related higher-order cognitive processes involved in self-regulation and mental control. Amongst
these processes are working memory (the part of short-term memory involved in conscious
processing of information), response inhibition (the process of suppressing inappropriate or
unnecessary actions), interference control (the ability to selectively inhibit processing of irrelevant
information), planning (the cognitive processes involved in formulating and selecting a sequence of
thoughts or actions to reach a goal) and cognitive flexibility (the mental ability to switch between
different concepts in response to changing situational demands). Given how broad the concept of
EF is, it is useful to conceptualise EF in terms of these individual domains rather than as a single
entity for the purposes of research. Many studies exploring EF cognitive processes in children with
ADHD and ASD suggest that these deficits may act as risk factors. Another way of considering the
role of EF in neurodevelopment is to view ‘intact’ or good EF abilities as a protective factor, which
compensates for atypical functioning of other neural systems in children at genetic risk for ADHD or
ASD (Johnson, 2012). As yet, the nature of the association between EF deficits and
neurodevelopmental problems is unclear.
A review and meta-analysis of EF deficits in ADHD, across a large number of participants in 97
studies, found an overall moderate effect size (Willcutt et al., 2008). This meta-analysis found that
the strongest and most consistent associations with ADHD came from measures of response
inhibition, working memory, vigilance and planning. However, although consistent group
differences between children with and without ADHD emerge in these EF domains when multiple
studies are pooled, heterogeneity within ADHD needs to be considered. Indeed, only about half of
the children in an ADHD sample can be reasonably classified as “impaired” on any given EF measure
relative to controls (Nigg et al., 2005). It has also been suggested that variability in EF abilities may
be used to find more homogenous subtypes of ADHD by clustering children according to their EF

13
profiles (Roberts et al., 2013). However, it is important to note that cognitive difficulties in ADHD
may fluctuate, for example depending on the level of incentive offered during testing (Kuntsi et al.,
2009).
In ASD, a review and meta-analysis of EF studies found medium to large effect sizes for difficulties
in planning, cognitive flexibility, inhibition, working memory, vigilance and fluency (Willcutt et al.,
2008). Studies comparing children with a primary diagnosis of ADHD or ASD have had mixed
results, with some detecting differences and some similarities in any given EF sub-domain
(Rommelse et al., 2011). One review has suggested that there may be a “double dissociation” in
ADHD and ASD in terms of EF, with ASD being more strongly associated with problems in cognitive
flexibility and planning and ADHD being more strongly associated with deficits in sustained
attention and response inhibition (Gargaro et al., 2011). However, the evidence for such a double
dissociation is inconclusive and another review of EF studies concludes that in general, EF deficits in
various sub-domains (e.g. response inhibition, working memory, vigilance) are qualitatively similar
in both conditions, although they can vary in degree of severity (Rommelse et al., 2011).
Nevertheless, this review also highlights the lack of sufficient research examining the relationship of
EF difficulties to traits of both phenotypes; studies to date are small, with inconsistencies in
methodology, inclusion criteria and the specific EF sub-domains tested, making it difficult to make
any firm conclusions.
Social cognition
Social cognition is the ability to reason about another person’s emotions and thoughts and
encompasses the perception of facial expressions, affective prosody (emotional tone of language)
and body posture, as well as theory of mind, empathy and humour processing (Uekermann et al.,
2010). The majority of studies investigating social cognitive abilities of children with ADHD and ASD
have focused on theory of mind (ToM), which is the ability to ascribe mental states to others, as well
as on facial emotion recognition abilities (Demopoulos et al., 2013).

14
ToM difficulties, have long been implicated as a core feature of ASD in affected children (Baron-
Cohen, 1989, 2000). However, ToM abilities appear to be largely unimpaired in ADHD (Geurts et al.,
2010; Uekermann et al., 2010). Moreover, in children with ASD and co-occurring ADHD symptoms,
ToM difficulties appear to be associated with ASD, not ADHD symptoms (Ames & White, 2011).
This literature suggests that ToM deficits are primarily implicated in ASD and not ADHD.
On the other hand, difficulties with facial emotion recognition appear to be associated with both
conditions. Reviews find somewhat mixed results for facial emotion recognition abilities in children
with ADHD, but generally studies indicate some difficulties in ADHD relative to controls (Collin et
al., 2013; Uekermann et al., 2010). A recent meta-analysis of 48 studies found that facial emotion
recognition difficulties were significantly associated with ASD (Uljarevic & Hamilton, 2012),
although another review highlights that findings are inconsistent and suggests that many
individuals with ASD develop compensatory mechanisms in this domain (Harms et al., 2010).
Indeed, a recent population study has suggested that although females with traits of social-
communication difficulties perform relatively well on facial emotion recognition tasks as compared
with males with equivalent levels of these traits, both genders struggle on an unfamiliar task of
recognising emotions from abstract social motion cues (Kothari et al., 2013). As such, although
facial emotion recognition difficulties are related to ASD, they may not affect all individuals equally.
The few studies comparing children diagnosed with ADHD or ASD in terms of emotion recognition
abilities are somewhat inconsistent. One small study suggested that children with ADHD and those
with co-occurring ADHD and ASD show more pronounced difficulties in facial emotion recognition
than children with ASD only (Sinzig et al., 2008b). However, a recent, larger study reported that
children with ASD perform significantly worse than those with ADHD on tasks of both facial and
vocal emotion processing (Demopoulos et al., 2013). Although it would seem that both ADHD and
ASD are associated to some extent with deficits in facial emotion recognition, there is some
suggestion that children with ASD have specific abnormalities in gaze processing when viewing

15
faces, whereas those with ADHD may have early visual attention problems (Tye et al., 2013). It is
important to note that there is variability within children with ADHD and ASD, with not all children
showing deficits in facial emotion recognition. Furthermore, difficulties in the domains of general
cognition, executive functioning and social cognition are not unique to ADHD and ASD, but rather
these deficits are also associated with other neurodevelopmental and psychiatric disorders,
including anxiety, tic, depressive and psychotic disorders (David et al., 2008; Fett et al., 2011;
Willcutt et al., 2008).
Other developmental difficulties
Children with ADHD and ASD also frequently present with comorbid learning (e.g. reading or
mathematical) difficulties (Capano et al., 2008; Dykman & Ackerman, 1991; Jones et al., 2009;
Mayes & Calhoun, 2006), motor difficulties, such as developmental co-ordination disorder (Blondis,
1999; Fournier et al., 2010; Lingam et al., 2010), and sensory difficulties (Cheung & Siu, 2009; Dunn
& Bennett, 2002; Kern et al., 2007; Mangeot et al., 2001; Yochman et al., 2004), the latter of which
have been newly added to the DSM-5 diagnostic criteria for ASD. There is some evidence that
autistic traits in children with ADHD are associated with higher rates of motor and language
problems (Mulligan et al., 2009a; Reiersen et al., 2008b). However, further studies are necessary to
confirm these findings and clarify the specifics of the relationship between ADHD and ASD traits
with developmental and cognitive deficits. This topic will be examined in chapter 4.
1.6 Genetic risk factors
Family studies
There is considerable evidence from family, twin and adoption studies highlighting the importance
of genetic risk factors for ADHD and ASD. These studies examine similarities in the psychiatric
outcomes of individuals who differ in their degree of biological relatedness and amount of shared
environment. Studies consistently show that parents and siblings of clinically-referred children with
ADHD have increased rates of ADHD and higher rates of sub-threshold symptoms of ADHD, as

16
compared with healthy controls (Biederman, 2005). Indeed, the presence of parental ADHD in a
sample of children diagnosed with ADHD is associated with more severe levels of ADHD in the
children, as well as other adverse clinical outcomes (Agha et al., 2013).
ASD family studies also find that relatives of affected children show elevated levels of social,
communication and learning difficulties compared to controls, referred to as the ‘broader autism
phenotype’ (Bailey et al., 1998; Constantino et al., 2006; Pickles et al., 2000). Likewise, comparing
broader autism phenotype traits in biological and non-biological relatives (e.g. adoptive or step-
parents of probands with ASD) confirms the familial nature of ASD (Szatmari et al., 2000). A
comparison of parents of multiple affected children (commonly referred to as “multiplex” families)
to those with no more than one affected child (i.e. “simplex” families) finds higher levels of ASD
traits in the former (Bernier et al., 2011), suggesting that there may be some manifestations of ASD
that are more familial (i.e. with higher genetic loading) than others. Although family studies
indicate that ADHD and ASD are both highly familial, unlike twin and adoption studies, such studies
cannot fully disentangle the relative importance of genetic and environmental influences on these
conditions.
Twin and adoption studies
The twin study design, on the other hand, has been widely used to examine the role of genetic and
environmental influences on the manifestation of ADHD and ASD. In this design, concordance rates
for a disorder are compared in monozygotic (identical; MZ) and dizygotic (non-identical; DZ) twins.
Twin studies make the assumption that MZ twins share 100% of their genome, whereas DZ twins
share 50% of their genome (equivalent to the proportion of the genome shared on average by
typical siblings) and that both sets of twins, assuming they are raised together, share the same
environment, to the same extent. Structural equation modelling can be used to estimate the
proportion of genetic, shared environmental and unique environmental influences on phenotype.
Importantly, this method will capture both inherited genetic variants (i.e. those likely to be present

17
in other family members), as well as spontaneously-occurring or de novo germline mutations, which
occurred prior to splitting of the zygote in the identical twins. Additionally, contributions from
gene-environment correlations and gene-gene interactions may be captured by the heritability
estimates.
Twin studies have shown that ADHD and ASD are both highly heritable. A review of 20 clinical and
community twin studies of ADHD estimated the mean heritability for ADHD to be approximately
76%, with the environment playing only a modest role (Faraone et al., 2005). With regards to ASD, a
recent review of more than 30 twin studies highlighted the consistent finding of high heritability in
both narrowly- and broadly-defined ASD samples, as well as in general population samples, with
the majority of heritability estimates ranging from 60-90% (Ronald & Hoekstra, 2011). This review
also reported that non-shared environmental influences (a term that includes any measurement
error) may play a moderate role in ASD, but that there are only modest effects, if any, of shared
environmental influences.
The similar heritability rates in clinical and community samples indicate that ADHD and ASD in the
population are as heritable as clinically-defined ADHD and ASD. This further suggests that ADHD
and ASD are likely to be extreme ends of continuously distributed traits in the population.
Moreover, heritability rates for ADHD and ASD tend to be comparable when calculated using
different categorical cut-offs (i.e. screening or more stringent diagnostic cut-off points) or as a
continuous distribution of symptom scores, in a given twin sample (Larsson et al., 2011; Levy et al.,
1997; Lundström et al., 2012; Robinson et al., 2011; Ronald et al., 2006a). However, one study found
that heritability rates for continuously assessed ADHD and ASD traits are a little lower than for
categorical diagnoses, though with overlapping confidence intervals (Anckarsäter et al., 2012). On
the whole, these studies imply that genetic risk variants relevant to ADHD and ASD diagnosis may
also be important for manifestation of symptoms at the milder ends of the distributions of ADHD
and ASD traits.

18
Twin studies have also been used to estimate heritability rates separately for the core dimensions of
ADHD and ASD. For ADHD, estimates of heritability for inattentive and hyperactive-impulsive
symptoms range from 59-79% and 55-88%, respectively (Greven et al., 2011; Larsson et al., 2006;
McLoughlin et al., 2007). Bivariate genetic analyses show substantial co-heritability of the two
ADHD dimensions, as well as some level of genetic heterogeneity and specificity, with about 55-
62% of genetic influences shared (Greven et al., 2011; McLoughlin et al., 2007). Likewise,
communication deficits, social interaction deficits and restrictive repetitive behaviours all show high
heritability (71-77%), but with moderate genetic correlations (23-53%), suggesting that the three
DSM-IV sub-domains are also genetically separable to some extent (Ronald et al., 2006b). The
genetic heterogeneity of the core ADHD and ASD dimensions suggests that it may be worthwhile
to consider these separately in molecular genetic studies. Further work is needed to evaluate
whether this is a valuable approach.
There are several limitations of the assumptions made by twin analyses. Firstly, MZ twins may not
be 100% genetically identical as a result of post-germline somatic mutations. Phenotypes of MZ
twins may also differ based on epigenetic changes throughout development, which may affect gene
expression. Furthermore, it is possible that MZ twins share more aspects of their rearing
environment, than do DZ twins. Moreover, given the higher incidence of prematurity and low birth
weight in twins (Luke & Keith, 1992), they may not be an entirely representative subgroup of the
population. The interpretation of the exact heritability estimates from twin studies is also
complicated somewhat by the fact that ASD, and to a lesser extent ADHD, have relatively low
prevalence in population samples of twins, which may reduce statistical power to accurately
estimate the proportion of genetic risk factors involved in these disorders.
Adoption studies also contribute evidence to the importance of genetic risk factors for ADHD.
Studies show that biological parents of children with ADHD are more likely to be diagnosed with or
have elevated traits of ADHD than adoptive parents or control adults (Alberts-Corush et al., 1986;

19
Sprich et al., 2000). Because of the many practical difficulties with conducting adoption studies, the
sample sizes of these studies have tended to be low. Also, adopted children who are at genetic risk
for ADHD are also likely to have been exposed to potential prenatal adversity as well as early
postnatal environmental risk factors prior to adoption. This is because their biological parents are
likely to have had ADHD or other psychiatric problems themselves, thereby passing on this genetic
risk as well as affecting the early environment.
However, despite the limitations of each design, family, adoption and twin studies provide
consistent and robust evidence to suggest that ADHD and ASD are both familial and highly
heritable. This is regardless of whether these conditions are assessed categorically or continuously,
or whether they are considered as unitary constructs or multiple dimensions. Given this high
heritability, numerous molecular genetic studies have investigated and begun to shed some light on
the genetic architecture (i.e. the number, frequencies and effect sizes of risk variants) and
underlying biology of these conditions.
Molecular genetic studies
Common genetic variants
Early molecular genetic studies investigating the source of the high heritability rates of ADHD and
ASD focused on linkage analyses to try to identify regions of interest and association studies of
candidate genes to try to identify specific genes involved in these disorders. However, the results of
these studies are limited in identifying specific genetic risk variants. A meta-analysis of seven
independent linkage studies of ADHD reported one region (16q23.1) of genome-wide significant
linkage (Zhou et al., 2008). A comprehensive review of linkage studies in ASD reported only two loci
(17q11-21 and 7q) which have been replicated at genome-wide significant levels (Abrahams &
Geschwind, 2008). The scarcity of significant results in linkage studies is likely, at least in part, due
to the small effect sizes of risk genes and the small sample sizes of these studies.

20
Although the pathogenesis of these disorders is unknown, candidate gene studies endeavoured to
use a hypothesis-driven approach to select genes to study (e.g. based on evidence from the
pharmacological treatment of ADHD) and compared allele frequencies in cases and controls.
However, the sample sizes in these studies have been relatively small and the results are fairly
inconsistent. Although reviews and meta-analyses point to converging evidence from human
studies and mouse models for some of the most well-studied candidate genes, estimated effect
sizes are rather small (Abrahams & Geschwind, 2008; Gizer et al., 2009). For example, a meta-
analysis of 18 candidate genes for ADHD found significant associations for the following 6 genes:
DAT1, DRD4, DRD5, 5HTT, HTR1B, and SNAP25 (Gizer et al., 2009). However, the effect sizes
reported were modest (odds ratios ranging from 1.12-1.33). On the whole, these early studies
demonstrated that the genetic variants contributing to ADHD and ASD are likely to have quite small
effects and that larger samples are needed to have sufficient power to detect true risk variants.
More recent improvements in genotyping technology have given rise to genome-wide association
studies (GWAS), which typically use regression analyses to compare allele frequencies in affected
and unrelated, unaffected individuals (i.e. cases vs. controls). An alternative to this case-control
approach is to compare allele frequencies in affected offspring and both parents; in this situation,
unaffected parents are considered to be “pseudo-controls”, with the non-transmitted genotypes
used as the control data (Mick et al., 2010).
GWAS examine variants across the whole genome in a hypothesis-free manner with regards to the
disease pathophysiology. Standard GWAS chips tend to genotype about 500,000-1,000,000 single
nucleotide polymorphisms (SNPs). These genotyped SNPs capture a large proportion of human
common genetic variation (typically with >1% minor allele frequency), owing to the fact that
genotyped markers are often highly correlated with many untyped markers. This correlation is
known as linkage disequilibrium, which is a term that refers to the non-random association of alleles
across multiple sites in the genome. Testing the genome-wide burden of so many SNPs for

21
association with disease results in a high multiple testing burden. To account for this, the generally
accepted threshold for a SNP to be considered genome-wide significant is p<5 x 10⁻⁸ (Dudbridge &
Gusnanto, 2008).
Several GWAS of childhood ADHD have been published to date, with no SNPs yet crossing this
threshold for significance (Hinney et al., 2011; Mick et al., 2010; Neale et al., 2008, 2010b;
Stergiakouli et al., 2012; Yang et al., 2013). The largest published ADHD GWAS, a meta-analysis of 4
samples using data from a total of 2,064 parent-offspring trios, 896 cases and 2,455 controls, also
revealed no significant individual SNPs (Neale et al., 2010a). This meta-analysis was the product of
an international collaboration of multiple research groups, known as the Psychiatric Genomics
Consortium (PGC). The PGC is in the process of substantially increasing the sample size of
genotyped ADHD cases and controls to enable a much larger meta-analysis of ADHD GWAS to be
performed.
There have also been several publications of ASD GWAS, which collectively report only 2 SNPs at
the level of genome-wide significance and another 7 near this significance threshold (Anney et al.,
2010, 2012; Ma et al., 2009; Wang et al., 2009; Weiss et al., 2009). Sample sizes in these studies
have likely been too small for detecting genome-wide significant risk variants, regardless of the
minor allele frequencies of the SNPs. The largest of these studies to date consisted of 2,705 parent-
offspring trios (Anney et al., 2012).
Recent successes from the PGC schizophrenia research group demonstrate that much larger sample
sizes than are currently available for ADHD and ASD will be needed to detect true genome-wide
significant variants. For example, one of the earlier collaborative schizophrenia GWAS found 7
genome-wide significant SNPs using a total sample of 17,836 cases and 33,859 controls (Ripke et al.,
2011), while the most recent schizophrenia GWAS meta-analysis reported 128 independent
genome-wide significant SNPs based on a total analysis of 36,989 cases and 113,075 controls
(Schizophrenia Working Group of the Psychiatric Genomics Consortium, 2014). It is clear that

22
psychiatric conditions such as ADHD, ASD or schizophrenia, are complex, with hundreds or even
thousands of genetic variants with small effects likely to play a role. Larger collaborative samples of
ADHD and ASD cases will be necessary for the discovery of specific common genetic variants and to
determine whether the genetic architecture of these disorders is similar.
A number of studies have used the method of ‘polygenic risk score analysis’, sometimes also
referred to as ‘polygenic risk profiling’, to harness the information provided by available GWAS
(Purcell et al., 2009). Using this method, a pre-specified p-value threshold is used to select alleles
more common in cases than controls from the discovery GWAS sample. This set of ‘risk’ alleles is
then used to calculate a ‘polygenic risk score’ for each individual in an independent set of cases and
controls. Thus, thousands of genetic variants, most showing only very weak association with the
phenotype of interest, are used en masse to summarise each individual’s burden of common genetic
risk variants for that phenotype. A recent analysis using this method demonstrates that children
clinically diagnosed with ADHD (N=452) have significantly higher polygenic risk scores for ADHD
(based on an independent discovery sample) than controls (N=5,081), although with a very modest
effect size (Hamshere et al., 2013a). Likewise, polygenic risk score analysis in an ASD sample
(N=1,301), using an independent clinical ASD discovery GWAS (N=1,404), shows that children with
ASD have higher polygenic risk scores than pseudo-controls (i.e. the non-transmitted parental
genotypes), with only a very small effect size (Anney et al., 2012). Thus, these studies suggest that
despite the small sample sizes, GWAS analyses are detecting some true SNP associations and
collectively, these variants do play an important, if not necessarily large, role in risk for ADHD and
ASD. However, effect sizes are dependent on sample sizes and in analyses of low sample size,
predictive ability tends to be better with larger SNP sets (i.e. using less stringent p-value thresholds)
(Wray et al., 2014).
A recent method called ‘genomic-relationship-matrix restricted maximum likelihood’ (GREML)
using the software Genome-wide Complex Trait Analysis (GCTA) (Yang et al., 2011) has been used

23
to further demonstrate the relevance of common genetic variants to ADHD and ASD. This method
allows for the estimation of heritability attributable to markers on GWAS SNP arrays (or indexed by
linkage disequilibrium). This estimate of heritability is sometimes called ‘SNP-chip’ or ‘narrow-
sense’ heritability. This method considers the genetic similarity of each pair of cases and each pair
of control individuals and determines whether these comparisons are on average higher for cases
than controls (Lee et al., 2013). A recent international collaborative study undertaken by the PGC
estimated the heritability from SNPs to be 28% for ADHD and 17% for ASD (Lee et al., 2013). A
genome-wide analysis of Han Chinese children estimated 42% heritability for ADHD from SNPs,
which although higher than the estimate from the PGC sample, was not significantly different in a
direct comparison (Yang et al., 2013).
One study has shown that SNP heritability estimates for ASD differ depending on ascertainment of
the sample; simplex ASD cases (i.e. those with no affected first degree relatives) showed SNP
heritability estimates of 40-50%, while multiplex cases (i.e. those with one or more affected
relatives) showed a higher heritability estimate, of 65.5% (Klei et al., 2012). This is consistent with
the expectation that there is higher genetic loading in multiplex families and that spontaneous rare
mutations and other non-inherited genetic risk factors are likely to play a more important role in
non-familial ASD. Another recent study used the GREML method in a Swedish population sample of
individuals with ASD and unaffected controls and estimated the heritability for ASD based on SNPs
to be approximately 49% (Gaugler et al., 2014). Both of these studies also reported that liability
variants are distributed across the genome, with heritability estimates for each chromosome
correlated with the length of the chromosome (Gaugler et al., 2014; Klei et al., 2012).
The SNP-chip heritability estimates of these studies are substantially higher than those reported by
the PGC analysis (17%). This discrepancy may be a result of the PGC analysis employing pseudo-
controls to estimate SNP heritability (Lee et al., 2013), given that SNP heritability estimates from
pseudo-controls based on parents of ASD children are considerable (38%) (Klei et al., 2012).

24
Although one of the benefits of using pseudo-controls based on the parent-offspring trio design is
reducing biases from population stratification, this design may be less sensitive than the case-
control design for estimating SNP heritability.
Population stratification is an important issue to consider, as the GREML method may conceivably
be sensitive to even minor differences in case and control ancestry. Typical use of a strict identity-
by-descent quality control filter for removing marginally-related individuals and the fitting of
principal components derived from SNP data as covariates will correct for population stratification
effects to some extent (Lee et al., 2013). Furthermore, as with all case-control genetic analyses, it is
important to ensure that the cases and controls come from as close and comparable a genetic
background as possible, otherwise SNP heritability estimates could be inflated.
Overall, these recent GREML studies indicate that a certain proportion of estimated heritability
from twin studies can be attributable to additive, common genetic variants. However, SNP
heritability estimates are substantially lower than heritability estimates based on twin studies. This
is likely because unlike twin studies, the GREML method does not consider the role of rare, de novo
and non-additive genetic variation and the analysis is restricted to the common variants tagged on
genotyping arrays. A direct comparison of the twin and GREML methods could provide insight into
the relative proportion of common genetic variants in disease risk. However, a recent comparison of
these methods in a population sample of twin children reports no significant genetic influence of
SNPs to heritability estimates using the GREML method for behavioural problems, including ADHD
and ASD traits (Trzaskowski et al., 2013). This result is inconsistent with the studies in clinical
populations discussed above (Klei et al., 2012; Lee et al., 2013; Yang et al., 2013). It is not clear why
this might be but it could be related to the lower power of a non-clinical community sample, where
only a small proportion of the children will have had clinically significant behavioural problems
(Faraone, 2013). However, similar analyses in a different population sample found significant SNP-
chip heritability estimates for social-communication problems; about 18% for pragmatic language

25
scores and 24% for parent-rated social cognition scores at age 8 years (St Pourcain et al., 2013,
2014). Although further work is needed to clarify the full extent of the contribution of common
genetic variants to ADHD and ASD, particularly at the lower end of the severity spectrum (i.e.
ADHD and ASD traits in community samples), it is clear from GWAS data that common variants do
play a significant role in both of these conditions.
Studies of rare genetic mutations
There is also support in the literature for the involvement of rare genetic variants in ADHD and ASD.
It has been known for many years that numerous genetic syndromes (with known genetic risks) are
associated with either or both of these conditions. Some of the more common examples of such
syndromes include Fragile X syndrome, Velo-cardio-facial syndrome (VCFS), Tuberous Sclerosis
complex, Smith-Lemli-Opitz syndrome and Williams-Beuren syndrome (Lo-Castro et al., 2011;
Weiss, 2009). These syndromes are frequently also accompanied by intellectual disability and
multiple other medical and physical issues. However, individuals with these syndromes do not
always manifest ADHD or ASD; in other words, the known genetic risk variants for these syndromes
have incomplete penetrance for behavioural phenotypes. Moreover, collectively, these conditions
are very rare and cannot account for more than a small proportion of ADHD and ASD cases.
More recent genome-wide scans have implicated the role of copy number variants (CNVs), which
are sub-microscopic deletions and duplications of sections of DNA. In ADHD, several studies report
an overall burden of large (>100kb or >500kb) and rare (<1% population frequency) CNVs in children
with ADHD, when compared with population controls (Williams et al., 2010, 2012; Yang et al., 2013).
Although others have reported no overall burden of CNVs in ADHD cases relative to controls (Elia et
al., 2010; Lionel et al., 2011), this may be because of differences in consideration of length and rarity
of analysed CNVs. For example, Lionel and colleagues (2011) looked at CNVs>20kb in length, and
defined “rare” to mean not overlapping more than 50% of a control CNV, whereas Elia and
colleagues (2010) do not report restricting CNVs in this way for the burden analysis. This is an

26
important methodological distinction because larger and rarer CNVs have better concordance
across different genotyping chips, are determined with greater accuracy and are more robustly
associated with neurodevelopmental disorders (Williams et al., 2010). One important point to note
is that only a small proportion of affected children have such large deletions or duplications and
only a handful of specific loci (e.g. duplications at 15q13.3 and 16p13.11) have been especially
enriched in ADHD cases relative to controls (Williams et al., 2010, 2012).
There have been many more studies implicating CNVs in children with ASD. Multiple studies have
shown that there is a higher global burden of rare CNVs (of various size) in ASD as compared with
population controls (Glessner et al., 2009; Levy et al., 2011; Marshall et al., 2008; Pinto et al., 2010).
Several studies have highlighted the particular relevance of de novo CNVs (Sanders et al., 2011),
especially in children from simplex families (Marshall et al., 2008; Sebat et al., 2007). Other studies
highlight that a ‘double hit’ of two large CNVs is more common in children with ASD than in
controls (Girirajan et al., 2012) and that females with ASD are more likely than males to be affected
by a large, particularly disruptive (i.e. affecting more genes) de novo CNV (Gilman et al., 2011; Levy
et al., 2011). Furthermore, other chromosomal abnormalities such as inversions, insertions and
translocations are also likely to play a role in ASD (Talkowski et al., 2012). Thus, the evidence to
date strongly implicates the role of CNVs in the aetiology of both ADHD and ASD.
Recent technological advances in genomics have led to studies involving sequencing entire exomes,
at ever decreasing costs. Although four recent moderately large exome sequencing studies do not
report an excess burden of rare single nucleotide mutations in children with ASD relative to their
unaffected family members, the studies have revealed some interesting first results (Iossifov et al.,
2012; Neale et al., 2012; O’Roak et al., 2012; Sanders et al., 2012). In particular, de novo mutations
identified in children with ASD were more likely to be nonsense or non-synonymous mutations than
those present in unaffected siblings (Iossifov et al., 2012; Neale et al., 2012; Sanders et al., 2012).
Nonsense mutations are point mutations that are predicted to result in non-functional proteins (e.g.

27
because an early translation codon is introduced, resulting in protein truncation). These types of
mutations are thus potentially more likely to play a causal role in ASD. Numerous much smaller
sequencing studies, some targeting only certain genes in a hypothesis-driven manner, have also
yielded preliminary results of rare mutations, many de novo, thereby implicating dozens of putative
candidate risk genes (Devlin & Scherer, 2012). However, given the rarity of individual point
mutations, ASD sequencing studies are not yet sufficiently large to conclusively implicate specific
candidate genes in disease risk for ASD. To date, there have been no published studies of exome
sequencing of large groups of ADHD families. However, future large exome sequencing and also
whole genome sequencing studies may yield further insights into specific rare genetic mutations
and the biological mechanisms that they disrupt in these conditions.
Biological pathway analyses
As discussed above, numerous genetic studies of ADHD and ASD have implicated a range of genetic
variants on a spectrum of frequencies, from very rare mutations to common SNPs. However,
sample sizes in these studies are currently underpowered to reliably detect specific causal variants.
An alternative method of examining the underlying biology of these conditions is to use information
from gene annotation databases to determine whether genetic variants associated (often only
weakly) with these conditions cluster together in functional biological pathways or networks.
In ADHD, one such study identified a number of CNVs disrupting a network of glutamate receptor
genes (Elia et al., 2012). Another study combined information from published ADHD GWAS findings
with pathway analysis and a literature search to implicate a network of genes linked to ‘neurite
outgrowth’ functions (Poelmans et al., 2011). A pathway analysis combining information from
GWAS SNPs and rare CNVs detected thirteen biological pathways (including ones related to
cholesterol as well as development of the central nervous system), which were enriched for both
types of variants, suggesting that both common and rare variants disrupt some similar biological
processes in ADHD (Stergiakouli et al., 2012). Others have explored candidate biological pathways

28
chosen a priori in relation to phenotype and found that clusters of genes related to serotonin,
dopamine, noradrenaline, and neurite outgrowth moderate the severity of hyperactive-impulsive
symptoms in children with ADHD (Bralten et al., 2013).
In ASD, pathway analyses of rare CNV data implicate networks of genes related to synapse
development and maintenance, axon targeting, neuron motility, neurotransmission, cellular
proliferation, projection and motility, and GTPase/Ras signalling (Gilman et al., 2011; Guilmatre et
al., 2009; Pinto et al., 2010). One study used data from gene expression networks and found that
common and rare variants which have previously been implicated in ASD converge on networks of
genes involved in synaptic and neuronal plasticity (Ben-David & Shifman, 2012). Exome sequencing
shows that many of the identified de novo mutations in ASD cases have related functions; many of
them occur in highly interconnected protein networks and show a high degree of connectivity to
previously reported genes (Neale et al., 2012; O’Roak et al., 2012). Thus, pathway analyses are
beginning to shed light on the types of biological pathways that are being disrupted by common
and rare variants in ADHD and ASD.
1.7 Genetic overlap of ADHD and ASD
As has been discussed thus far, there is substantial evidence for the clinical co-occurrence of ADHD
and ASD (see section 1.5) and for the high heritability of both conditions (see section 1.6).
Moreover, as will be discussed next, family and twin studies show that these conditions also share
genetic aetiology. Two family studies report that siblings of children with ADHD have elevated ASD
scores relative to controls, although this effect may be limited to male siblings (Mulligan et al.,
2009a; Nijmeijer et al., 2009). A more recent family study reported elevated levels of both ADHD
and ASD symptoms in the unaffected siblings of both ADHD and ASD probands (Oerlemans et al.,
2014). A recent population study found that a diagnosis of ADHD in the mother predicted a 6-fold
risk for ADHD and a 2.5-fold risk for ASD in offspring, highlighting the important role of shared
familial transmission of genetic risk for ADHD and ASD (Musser et al., 2014). Bivariate analyses in a

29
UK community twin sample (N=6,099 twin pairs) show that ADHD and ASD traits at age 8 years are
moderately co-heritable, with a genetic correlation of about 0.56-0.57 in the entire population
sample and about 0.62-0.72 at the quantitative extremes of ADHD and ASD trait distributions
(Ronald et al., 2008). A follow-up study using this sample further showed that childhood ADHD and
ASD traits at age 8 years are also moderately genetically correlated with ADHD and ASD traits at
age 12 years, with the strongest genetic overlap of ADHD traits at age 8 and ASD communication
difficulties at age 12 (Taylor et al., 2012). A study of Australian young adult twins (N=284 pairs)
confirmed that ADHD and ASD traits were moderately genetically correlated in young adults
(Reiersen et al., 2008a). A large Swedish population twin study (N=8,429 twin pairs) estimated that
about 60% of the genetic variation in liability for ASD at a diagnostic level was shared with ADHD
(Lichtenstein et al., 2010). Thus, a number of family and twin studies highlight that ADHD and ASD
share genetic aetiology, both at a clinical/diagnostic level, as well as in the full distribution of traits
in the population.
Several molecular genetic studies have recently shed some light on possible sources of the co-
heritability of ADHD and ASD. Three genome-wide studies have found that large, rare CNVs
associated with ADHD are enriched for loci which have previously been reported in ASD (Lionel et
al., 2011; Williams et al., 2010, 2012). Furthermore, a pathway analysis of CNVs in ADHD and ASD
cases shows a significant overlap in biological pathways disrupted by large, rare CNVs, even when
physically overlapping CNV loci are excluded from the analysis (Martin et al, 2014). Thus, these
studies suggest that large, rare CNVs may contribute to some of the observed overlap in genetic
aetiology of ADHD and ASD. However, as mentioned earlier, these variants are quite rare and
therefore other types of genetic variants are also likely to be important.
Given that GWAS studies have thus far not robustly implicated many specific common variants
(SNPs) in ADHD or ASD, it is too early to conclude from these studies whether individual variants
contribute to the co-heritability of these phenotypes. Two recent cross-disorder international

30
collaboration studies from the PGC have used GWAS data to explore whether common genetic
variants from ADHD, ASD and three adult psychiatric conditions (schizophrenia, bipolar disorder
and major depressive disorder) overlap. Both of these studies utilised the same datasets, including
the largest currently available published datasets for ADHD and ASD (Anney et al., 2012; Neale et
al., 2010a). The first study, which assessed whether polygenic risk scores based on each discovery
GWAS could be used to predict case status in the other dataset, found no significant overlap of
common genetic variants for ADHD and ASD for all p-value selection thresholds (Smoller et al.,
2013). The second study used the method of GREML and found that the co-heritability estimate
(based on common variants) for ADHD and ASD did not differ from zero (Lee et al., 2013). In
contrast, both of these studies report significant cross-disorder overlaps for comparisons of other
pairs of disorders (e.g. schizophrenia and bipolar disorder).
Although these results are surprising given the high co-heritability estimates of twin studies, the
results need to be interpreted in light of several key methodological considerations. Firstly, the
sample sizes of the most recent published ADHD and ASD GWAS are much smaller than those
available for the other PGC disorders (schizophrenia, bipolar disorder and major depressive
disorder). Furthermore, the use of a trio design for the entire sample in the ASD dataset and some
of the samples in the ADHD GWAS may have weakened the power to detect associated risk
variants. As discussed in section 1.6, such a design makes use of pseudo-controls, which assumes
that the non-transmitted parental DNA is equivalent to that of unaffected controls. As mentioned
earlier, such an assumption may be flawed (Klei et al., 2012). As such, it is too early to determine
whether common variants play a major role in the observed co-heritability of ADHD and ASD. This
issue will be examined in chapters 5 and 6.
Genetic overlap with other disorders and traits
The high heritability and shared genetic aetiology of ADHD and ASD is by no means unique to this
pair of disorders. Other neurodevelopmental disorders (e.g. developmental coordination disorder or

31
specific language impairment) are also highly heritable (Bishop et al., 2008; Martin et al., 2006), as
are cognitive abilities such as executive functioning and IQ (Ando et al., 2001; Anokhin et al., 2003;
Deary et al., 2009; Kuntsi et al., 2006). A large Swedish population twin study found that there is a
substantial amount of shared genetic risk across ASD and learning disorders, developmental
coordination disorder and tic disorders, although this was not quite as high as the overlap seen for
ADHD and ASD, mentioned earlier (Lichtenstein et al., 2010). Modest to high overlap in genetic
aetiology can also be seen between ADHD and developmental coordination disorder (Martin et al.,
2006). Twin studies also suggest that lower IQ is highly co-heritable with ADHD traits and diagnosis
(Kuntsi et al., 2004) and modestly to highly co-heritable with ASD (Hoekstra et al., 2010; Nishiyama
et al., 2009). Furthermore, shared genetic risks have also been reported by family and molecular
genetic studies for childhood ADHD and ASD with adult psychiatric conditions such as
schizophrenia and bipolar disorder (Faraone et al., 2012; Hamshere et al., 2013b; Sullivan et al.,
2012). Indeed, it would seem that overlap in genetic risks is common across most child and adult
psychiatric conditions (Doherty & Owen, 2014). As such, studying the nature of the shared genetic
aetiology of ADHD, ASD and related cognitive and developmental difficulties may have broader
implications for understanding genetic risk factors for human psychopathology across the lifespan.
Moreover, studying associated cognitive and developmental problems may have the potential to
further characterise these conditions and to increase the power of genetic analyses by considering
the clinical heterogeneity of ADHD and ASD.
1.8 Summary & limitations of existing literature
In summary, ADHD and ASD are neurodevelopmental/psychiatric disorders, which show similar
patterns of comorbidity and associated cognitive deficits and similarly high levels of heritability.
They overlap clinically and share a considerable proportion of their genetic aetiology. It is
abundantly clear from molecular genetic studies that these complex psychiatric conditions are
multifactorial, with hundreds or even thousands of genetic risk variants likely to be involved (Anney

32
et al., 2012; Hamshere et al., 2013a; Klei et al., 2012; Lee et al., 2013; Yang et al., 2013). Genetic
studies have implicated variants on a spectrum of frequencies, both those that are inherited and
those occurring de novo. Although environmental factors are also likely to play an important role,
twin studies suggest that genetic risk factors account for a high proportion of the aetiology of these
conditions. Given that they are both complex psychiatric conditions, there are likely to be many
causal (genetic and environmental) routes for manifesting ADHD or ASD.
It is also important to note that ADHD and ASD show a high degree of clinical phenotypic
heterogeneity. Although rates of co-occurrence are high, not all children with ADHD will have ASD
and vice versa. Similarly, children with either or both conditions vary in the severity of their
phenotype and in terms of presence of comorbid psychopathology and co-occurring cognitive and
developmental difficulties. Although it is clear that large datasets are necessary for gene discovery
(e.g. through GWAS or exome/genome sequencing), there is also a need for further investigation of
the clinical heterogeneity of these phenotypes in relation to genetic risk factors.
Despite growing clinical recognition that ADHD and ASD are related and can both be assessed in a
child presenting with developmental problems, there are many gaps in our understanding of how
these conditions relate to one another clinically. For example, it is not clear whether ASD symptoms
can be accurately assessed in children with ADHD and whether the meaning of these symptoms is
similar to that in children without ADHD. Also, the extent of the clinical impact of ASD symptoms in
children with ADHD on other early developmental and cognitive outcomes is as yet unknown.
Furthermore, the source of the high co-heritability and shared genetic aetiology of ADHD and ASD
needs to be further explored. Although overlap in CNV loci appears to contribute to this observed
co-heritability, such CNVs are rare and cannot fully account for the findings of twin studies. Several
recent studies of common SNPs suggest that there is no clear overlap but these studies utilised
relatively small and underpowered clinical samples, with a considerable proportion of the samples
using pseudo-controls. Given the dimensional nature of ADHD, additional analyses assessing ADHD

33
and ASD as quantitative traits in relation to common genetic variants may shed more light on
whether these variants play a role in the genetic overlap reported by twin and family studies.
Similarly, research should consider whether common genetic variants which may play a role in
clinical ADHD or ASD are also relevant to cognitive difficulties associated with ADHD and ASD.
1.9 Thesis aims & hypotheses
This thesis is divided into two parts. The first objective is to examine the presentation of ASD traits
in the context of an ADHD diagnosis, using a clinical sample. The aims are to:
1. Determine whether the factor structure of ASD traits in a clinical sample of children with ADHD
is similar to that found in samples of children with ASD and children from the general
population. It is hypothesised that social-communication deficits and restrictive-repetitive
behaviours will be accounted for by separate, albeit correlated, factors. (Chapter 3)
2. Determine whether ADHD symptoms and ASD traits in a clinical sample of children with ADHD
overlap or are distinct from one another, i.e. whether in a combined factor analysis, ADHD
symptoms and ASD traits are accounted for by separate factors or not. (Chapter 3)
3. Determine whether ASD traits in children with ADHD index a more severe profile of cognitive
difficulties and delayed development. (Chapter 4)
The second objective is to determine whether common genetic risk variants for clinically-diagnosed
ADHD are relevant to ADHD and ASD traits and related neurocognitive abilities in a general
population sample. The specific aims are to:
1. Determine whether common genetic risk variants relevant to clinically diagnosed ADHD are
associated with traits of ADHD and ASD in children from the general population. (Chapter 5)
2. Determine whether common genetic risk variants relevant to ADHD diagnosis are associated
with neurocognitive difficulties (i.e. general cognition, executive functioning and social
cognition). (Chapter 6)

34
The next chapter will provide a general description of the two samples used for addressing the
above aims. Chapters 3 and 4 will address the first objective and chapters 5 and 6 will address the
second objective. Chapter 7 will conclude the thesis with a more general discussion of the
implications of the findings, methodological considerations, strengths and limitations and
suggestions for future work.
35
Chapter 2
Description of Samples
This chapter describes in detail the samples used in this thesis. It also gives an overview of the
measures, with some background information on their psychometric properties. Details of study-
specific inclusion criteria, additional details of measures and data analysis procedures are presented
in the relevant chapters. The analyses are based on two samples. Chapters 3 and 4 utilise data from
a clinical sample of children diagnosed with ADHD, whereas chapters 5 and 6 are based on data
from children taking part in the Avon Longitudinal Study of Parents and Children (ALSPAC), a
general population cohort sample.
2.1 Clinical sample of children diagnosed with ADHD
Recruitment & Procedures
Children aged 5 to 18 years with a confirmed or suspected clinical diagnosis of ADHD were recruited
through Child and Adolescent Psychiatry or Paediatric out-patient clinics in Wales and across the
United Kingdom for a study of genetic and environmental influences on ADHD. Clinicians
completed a brief referral form with the parents of the study child. The form contained information
on contact details of the family, the name and position of the referrer and the clinical diagnoses of
the child. Once referred to the study, the parents were contacted by telephone either by an
administrator or one of the research psychologists on the study team. A screening questionnaire
was completed over the telephone in order to explain the study briefly and to determine eligibility
of the child (see below for study inclusion and exclusion criteria).
If no cause for exclusion was noted during the telephone screening interview, a time was arranged
with the parents for the study team to visit the family’s home in order to carry out the assessments.
The family was also given the alternative option to come to the University Hospital of Wales,
Cardiff, for the assessments, with travel expenses covered (only N=3 chose this option). A

36
questionnaire pack with information sheets was sent in advance of the visit and collected or
completed at the visit. Two trained psychology graduate research assistants visited the family, as
arranged. One of the researchers interviewed the parent(s), assisted with questionnaire completion
and obtained a DNA sample from biological parents. Meanwhile, the second researcher
administered the cognitive assessments and obtained a blood or saliva sample from the child.
Assessments lasted approximately 2-3 hours.
Approval for the study was obtained from the North West England and Wales Multicentre Research
Ethics Committees. Written informed consent to participate was obtained from parents and
children aged 16 years and older and assent was gained from children under 16 years of age.
Families were provided with a thank-you payment in the form of a high street voucher for £15.
Newsletters were sent at the end of the study to inform participants about the key results of the
research.
Inclusion & exclusion criteria
Information obtained at the time of referral, during the screening telephone interview and at the
home visit was used to determine inclusion in the study. The main inclusion criterion was the
presence of a diagnosis of DSM-IV or DSM-III-R ADHD, confirmed by research diagnostic interview
(Angold et al., 1995). Exclusion criteria were a known clinician’s diagnosis of ASD, schizophrenia,
Tourette’s syndrome, bipolar disorder, history of epilepsy, brain damage or any other neurological
or genetic disorder. Presence of Tourette’s syndrome or bipolar disorder was assessed using the
research diagnostic interview (Angold et al., 1995). Presence of intellectual disability (ID; IQ<70) was
not an exclusion criterion for the study; however, for sensitivity, the main analyses in chapters 3 and
4 are repeated without this group of children. These inclusion criteria resulted in an overall sample
size of N=1,132 children, recruited over the course of several related grants.

37
Phenotypic measures
ADHD & clinical comorbidities
Research diagnoses of ADHD and psychiatric comorbidities were ascertained using the parent
version of the Child and Adolescent Psychiatric Assessment (CAPA) (Angold et al., 1995), a semi-
structured diagnostic interview. The CAPA includes items that allow investigators to generate both
symptom counts and categorical diagnoses of the presence of psychiatric disorders. Parents were
asked about the presence of each of the 18 ADHD symptoms from the DSM-IV/ICD-10 and about
impairment of functioning. Please refer back to Table 1.1 for details of ADHD diagnostic criteria.
The total number of symptoms was summed for inattentive and hyperactive-impulsive traits
separately (out of 9 each), as well as for total ADHD traits (out of 18). Confirmation of pervasiveness
of ADHD symptoms and impairment across settings, which is necessary for a DSM-IV diagnosis,
was assessed through questionnaires sent to the child’s school (DuPaul and Conner’s teacher rating
scale (Conners et al., 1998; DuPaul, 1981)) or the Child ADHD Teacher Telephone Interview (ChATTI
(Holmes et al., 2004)). CAPA interviews were undertaken by trained psychologists and were
audiotaped. Cases were discussed weekly with the supervising child and adolescent psychiatrist
(Professor Anita Thapar). Inter-rater reliability for ADHD diagnostic subtype, assessed using 60
cases, was perfect (κ=1.0).
Comorbid psychiatric disorders assessed using the CAPA were DSM-IV oppositional defiant disorder
(ODD), conduct disorder (CD), anxiety disorders (generalised anxiety disorder, social anxiety or
separation anxiety) and depression. As CD was the primary outcome for the original study, an inter-
rater reliability estimate was calculated for parent-rated CD symptoms; inter-rater reliability was
very good (κ =0.98). Children aged 12 years and over also completed the child version of the CAPA
(Angold & Costello, 1995), assessing only these comorbid problems (but not ADHD). In accordance
with previous research, a symptom was considered as present if either the parent or child reported
it (Langley et al., 2010). Symptom totals and diagnoses were calculated according to DSM-IV.

38
ASD traits
ASD traits were assessed using the Social Communication Questionnaire (SCQ), formerly known as
the Autism Screening Questionnaire (Berument et al., 1999; Rutter et al., 2003). The SCQ is a
validated 40-item parent-rated questionnaire, based on the Autism Diagnostic Interview-Revised
(ADI-R) (Lord et al., 1994). Parents responded to each question by marking ‘yes’ or ‘no’ on the form.
Items were re-coded to indicate presence or absence of the autistic behaviour. A total score of
autistic traits was then calculated. Item 1 is a language screening item and was not included in
calculating the overall total. A score of 15 or greater has been suggested to indicate clinically-
relevant levels of autistic traits (Berument et al., 1999). This measure is unavailable for children
recruited at the beginning of the study, as it was introduced into the protocol partway through the
study. SCQ data were available for N=821 children. See Appendix 2.1 for a list of all SCQ items.
Cognitive assessments
Parents were asked to withhold stimulant medication from their child for 24 hours prior to testing.
However, this was not enforced strictly and a proportion of the parents chose to give their child
their usual medication (N=634 (66.7%) of parents complied).
Full-scale IQ was assessed using the Wechsler Intelligence Scale for Children, version III (WISC-III;
N=387) or IV (WISC-IV; N=620), using all 10 subtests (Wechsler, 1992, 2003). The WISC-III was based
on the following four components: Verbal Comprehension Factor, Freedom from Distractibility
Factor, Perceptual Organisation Factor and Processing Speed Factor. The WISC-IV, an updated
version of the WISC-III, was based on the following four indices: Verbal Comprehension Index,
Perceptual Reasoning Index, Working Memory Index and Processing Speed. The Digit Span subtest
of the WISC-IV is a measure of verbal working memory. The task requires the child to repeat lists of
digits in a) the presented order and b) reverse order. It has been used in previous research to assess
this domain of functioning in children with ADHD and ASD (Gau & Shang, 2010; Poirier et al., 2011).

39
The Wechsler Objective Reading Dimensions (WORD) (Wechsler, 1993) was administered to assess
basic reading, spelling and reading comprehension abilities. Due to time restrictions, this measure
was only administered in children up to the age of 12 years. The Intra-Extra Dimensional Shift task
from the British Cambridge Neuropsychological Battery (CANTAB) (Cambridge Cognition, 1996)
was administered as a measure of executive functioning (set shifting, visual discrimination and
attentional flexibility). This computer-based task requires the child to learn to discriminate between
two shapes, while ignoring an additional dimension (white lines) overlaying the target shapes. This
is followed by a test of whether the child can learn to shift attention to the previously irrelevant
dimension. This task is based on the Wisconsin Card Sorting Task (WCST) (Berg, 1948).
Other parent-completed questionnaires
Parents were asked general questions about their child’s speech and motor development at the
interview; these were: “was your child talking by age 2?”, “has your child ever had speech therapy?”,
“was your child walking by 18 months?”, and “is your child clumsy? –not at all, –just a little, –pretty
much, –very much”. Children who were not talking by age 2 and/or had had speech therapy were
classed as positive for this broad measure of language problems. Children who were not walking by
18 months and/or were clumsy “pretty much” or “very much” were classed as positive for this broad
measure of motor problems.
Family annual income, parental employment status and parental educational attainment were
assessed by parental questionnaire. Low income was defined as annual family income <£20,000
(equivalent ~US$32,000), and low educational attainment was defined as having left school without
qualifications (GCSE or equivalent) at age 16 years. Socioeconomic status (SES) was classified by
the occupation of the main family wage earner using the UK Standard Occupation Classification
(Office of National Statistics, 2001). Three SES categories were defined (low: unskilled
workers/unemployed; medium: manual and non-manual skilled/partially skilled workers; high:
professional and managerial workers). Parents were also asked about their ethnicity as well as that
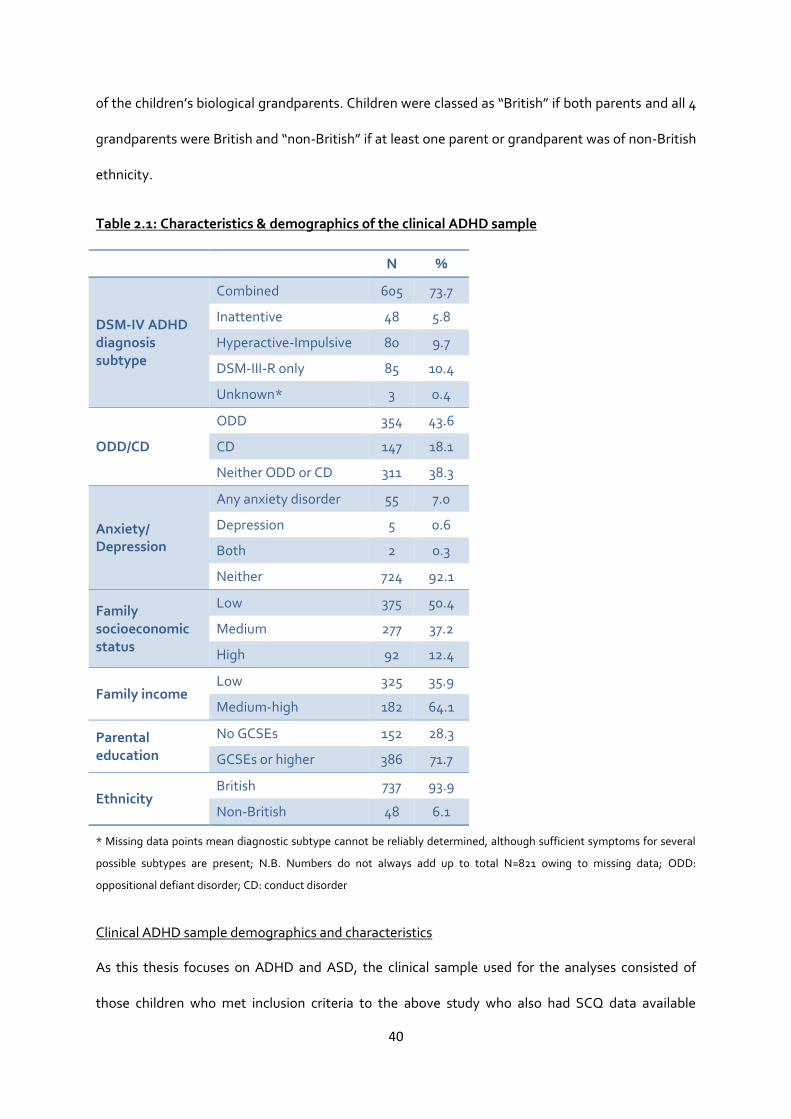
40
of the children’s biological grandparents. Children were classed as “British” if both parents and all 4
grandparents were British and “non-British” if at least one parent or grandparent was of non-British
ethnicity.
Table 2.1: Characteristics & demographics of the clinical ADHD sample
N %
DSM-IV ADHD diagnosis subtype
Combined 605 73.7
Inattentive 48 5.8
Hyperactive-Impulsive 80 9.7
DSM-III-R only 85 10.4
Unknown* 3 0.4
ODD/CD
ODD 354 43.6
CD 147 18.1
Neither ODD or CD 311 38.3
Anxiety/ Depression
Any anxiety disorder 55 7.0
Depression 5 0.6
Both 2 0.3
Neither 724 92.1
Family socioeconomic status
Low 375 50.4
Medium 277 37.2
High 92 12.4
Family income Low 325 35.9
Medium-high 182 64.1
Parental education
No GCSEs 152 28.3
GCSEs or higher 386 71.7
Ethnicity British 737 93.9
Non-British 48 6.1
* Missing data points mean diagnostic subtype cannot be reliably determined, although sufficient symptoms for several
possible subtypes are present; N.B. Numbers do not always add up to total N=821 owing to missing data; ODD:
oppositional defiant disorder; CD: conduct disorder
Clinical ADHD sample demographics and characteristics
As this thesis focuses on ADHD and ASD, the clinical sample used for the analyses consisted of
those children who met inclusion criteria to the above study who also had SCQ data available

41
(N=821). Of these, N=124 children were female (15.1%). The children were aged on average 10.3
years old (SD=2.9 years, range=5-18 years). Table 2.1 shows the breakdown of DSM-IV research
diagnoses in the sample, as well as socio-demographic characteristics of the children. The mean IQ
in the sample was 83.9 (SD=13.7, range=43-124). Figure 2.1 shows the distribution of IQ scores.
There were N=97 children (12.6%) with intellectual disability as assessed by IQ<70.
Figure 2.1: Distribution of IQ in the clinical ADHD sample
Genetic data
A proportion (49%; N=559) of the whole ADHD sample of N=1,132 children were genotyped for the
purpose of a genome-wide association study (Stergiakouli et al., 2012). DNA from children meeting
DSM-IV ADHD criteria, assessed using the same diagnostic interview, was also available from
collaborators in St. Andrews, Scotland (N=44) and Dublin, Ireland (N=196). DNA for all ADHD cases
(N=799 total) was extracted from saliva or peripheral blood samples and the samples were
genotyped with the Illumina (San Diego, CA, USA) Human660W-Quad BeadChip. Control genetic
data were obtained from the Wellcome Trust Case-Control Consortium-Phase 2 (WTCCC2) (The

42
Wellcome Trust Case Control Consortium, 2007). This dataset comprised 3,000 individuals from the
1958 British Birth Cohort and 3,000 individuals from the UK Blood Services collection. Combining
these two samples for use as comparison subjects in genetic association studies using UK case
samples has been validated (The Wellcome Trust Case Control Consortium, 2007). Control DNA
samples were genotyped by WTCCC2 using the Illumina Human1.2M BeadChip. BeadStudio
(version 2.0) was used to assign genotypes.
Quality control procedures are described in detail in the GWAS publication (Stergiakouli et al., 2012)
and a brief description of these procedures can be found in Appendix 2.2. After quality control,
genome-wide data were available for N=727 case subjects and N=5,081 control subjects for 502,702
autosomal SNPs. The results of this published GWAS were used for the purpose of generating
polygenic risk scores in the general population sample for analyses presented in chapters 5 and 6.
2.2 Children from the general population
Recruitment & Procedures
The Avon Longitudinal Study of Parents and Children (ALSPAC) is a large, well-characterised
longitudinal dataset (Boyd et al., 2013; Fraser et al., 2013). ALSPAC originally recruited N=14,541
pregnant women resident in Avon, England, with expected delivery dates between April 1, 1991,
and December 31, 1992. Of these pregnancies, N=13,988 children were alive at 1 year of age. An
additional 713 children who would have been eligible but whose mothers did not enrol during
pregnancy were enrolled after age 7, resulting in a total sample of N=14,701 children alive at age 1
year. The study website (http://www.bris.ac.uk/alspac/researchers/data-access/data-dictionary/)
contains details of all available data through a fully searchable data dictionary. Ethical approval for
the study was obtained from the ALSPAC Ethics and Law Committee and Local Research Ethics
Committees. The analyses presented in this thesis were approved by the ALSPAC Executive
Committee (project reference B1342).

43
Data collection in this sample occurred at numerous time-points through a variety of means and is
still ongoing. The data used in this thesis were primarily obtained through parent-completed postal
questionnaires regarding the study child, as well as from direct cognitive assessments of the child at
several ‘Focus’ clinics.
Inclusion & exclusion criteria
Children from triplet and quadruplet births were excluded from the analysed sample. Furthermore,
only one child from twin births was included in the analysis due to genotyping quality control
procedures (see section on Genetic data below for further details). Details on inclusion criteria for
analyses in chapters 5 and 6 are presented in sections 5.3 and 6.3. Briefly, only children who had
both genetic data after quality control and phenotype data were included. Phenotype data for the
ADHD and ASD-related measures were considered as available if children had <30% missing items.
Children with intellectual disability (IQ<70) or diagnosed ADHD or ASD were included in the
analyses.
Phenotypic measures
ADHD & ASD-related measures
Data on ADHD traits were collected using the parent-rated Development and Well-Being
Assessment (DAWBA), when participants were aged approximately 7 years and 7 months old
(Goodman et al., 2008). The DAWBA is a semi-structured assessment package that generates DSM-
IV diagnoses and symptom scores of childhood psychopathology. Scores were calculated for
inattentive and hyperactive-impulsive traits separately, as well as a score for total ADHD traits. The
DAWBA was also completed by parents when children were at the approximate age of 10 years and
8 months. Total and subtype ADHD scores were also calculated at this age.
Social-communication traits were assessed using the Social and Communication Disorders
Checklist (SCDC), which was administered at the same time as the DAWBA ADHD measures (Skuse
et al., 2005) and the pragmatic language subscales of the Children’s Communication Checklist

44
(CCC), which parents completed when children were at the approximate age of 9 years and 7
months (Bishop, 1998). A quantitative measure of restricted, repetitive behaviours was not
available. Both the CCC and the SCDC have been shown to have good predictive reliability for a
clinical diagnosis of ASD in the ALSPAC sample (Steer et al., 2010). The CCC shows good reliability
(0.80), internal consistency (0.80-0.87) and validity for language problems (Bishop, 1998) and the
SCDC shows good internal consistency (0.93), high test-retest reliability (0.81) and validity for a
diagnosis of ASD (Skuse et al., 2005). The SCDC assesses social cognition and understanding,
whereas the CCC pragmatic language subscales measure the ability to use language in a social
context. Please see Appendices 2.3 and 2.4 for a list of the items making up the SCDC and the CCC
pragmatic language subscales. Previous research has shown that children with ADHD or ASD have
lower pragmatic language ability scores than typically developing controls, but those with ASD
have lower scores than those with ADHD (Geurts et al., 2010). The CCC data were used to calculate
a pragmatic language total score, based on the following five sub-scales: inappropriate initiation,
coherence, stereotyped conversation, conversational context and conversational rapport. A total
score for social cognition, as assessed with the SCDC, was also calculated.
Information was also available on categorical DSM-IV ADHD diagnoses based on the full set of
DAWBA items at approximately age 7 years. Data on ASD diagnoses were available based on
clinical records, utilising a clinician’s diagnosis of ASD (Williams et al., 2008).
Neurocognitive measures
As part of the on-going ALSPAC longitudinal study, families were invited to attend a ‘Focus’ clinic
when the children were at the approximate age of 8.5 years. A number of neuropsychological tests
were carried out with the children during this clinic.
A short form of the WISC-III assessment was employed, with alternate items from all 10 subtests
administered (Wechsler, 1992). This test was used to obtain an estimate of verbal IQ, performance
IQ and full scale IQ. The WISC-III Digit Span task was administered in addition to the above 10

45
subtests. This task is nearly identical to the WISC-IV subtest of the same name (described earlier in
section 2.1) and provides a measure of verbal working memory.
Attentional inhibitory control was assessed using the Opposite Worlds task from the Tests of
Everyday Attention for Children battery (Robertson et al., 1996). The first part of the task (the Same
Worlds control condition) requires the child to read a list of consecutive numbers comprising “1”s
and “2”s. The second part of the task (the Opposite Worlds experimental condition) requires the
child to inhibit the predominant response by saying “two” when presented with the number one
and vice versa. The mean time taken to complete the Same Worlds trials was subtracted from the
mean time for the Opposite Worlds trials to obtain a measure of attentional inhibitory control.
Facial emotion recognition was assessed using a computerised version of the faces subtest of the
Diagnostic Analysis of Nonverbal Accuracy (DANVA) (Nowicki & Duke, 1994). Children were
presented with 24 children’s faces and were asked to state which of four emotions (happy, sad,
angry or fearful) the face was showing. Half of the faces had high emotional intensity (the easy
condition) and half of the faces had low emotional intensity (the hard condition). A sum of the total
number of errors made was calculated to give a measure of facial emotion recognition difficulties.
Families were also invited to attend another ‘Focus’ clinic when the children were at the
approximate age of approximately 10.5 years. At this time, the children completed the Counting
Span Task, a measure of working memory. In this task, children needed to count red dots on a
screen of blue and red dots, while trying to recall the number of red dots on previously presented
screens. This task provides a ‘global score’ measure, corresponding to the number of correct trials.
Other measures
For assessments of social background, questionnaires were used to assess social class based on
parental occupations, parental educational level and household ownership status. As with the
clinical ADHD sample described in section 2.1, three SES categories were defined (low: unskilled
workers/unemployed; medium: manual and non-manual skilled/partially skilled workers; high:

46
professional and managerial workers) based on maternal and paternal reported occupations.
Families were also split into whether the parents reported owning their house/having a mortgage or
not. Maternal education levels were split into the binary variable of whether mothers had attained
a) A-levels or higher education or b) only vocational or GCSE-level education.
Genetic data
A total of 9,912 ALSPAC children were genotyped using the Illumina HumanHap550 quad genome-
wide SNP genotyping platform by 23andMe subcontracting the Wellcome Trust Sanger Institute,
Cambridge, UK and the Laboratory Corporation of America, Burlington, NC, USA. Quality control
procedures were performed by ALSPAC researchers and are described in Appendix 2.2. After
quality control, genome-wide data were available for N=8,231 of the children. The dataset
contained 500,527 SNPs.
An additional step in quality control was undertaken because of the nature of the genetic analyses
performed in chapters 5 and 6, which involved using the ADHD clinical sample as a discovery sample
for analyses (see chapters 5 and 6 for details). To ensure that there were no related individuals in
both samples, an identity by descent (IBD) analysis was conducted by Dr Evie Stergiakouli, a co-
author on the publications resulting from chapters 5 and 6, across the clinical ADHD sample and the
ALSPAC sample, using PLINK (Purcell et al., 2007). This was deemed necessary because a large
proportion of the children in the discovery clinical ADHD sample (N=559; 70%) and all of the target
ALSPAC sample were recruited from a similar geographical region (Wales and Southwest England)
and are of a similar age. Individuals in ALSPAC who showed IBD≥12% (equivalent to the average
biological relatedness of first cousins) in relation to any individual in the clinical ADHD sample (N=2)
were removed from analyses, leaving a final sample of N=8,229 children in ALSPAC.
Sample demographics and characteristics
This sample of ALSPAC children with genetic data available after quality control (N=8,229) was
used for analyses in chapters 5 and 6. Of these children, N=4,015 (48.8%) were female. Table 2.2

47
shows the breakdown of ADHD and ASD diagnoses in the sample, as well as socio-demographic
characteristics of the children. The mean IQ in the sample was 104.8 (SD=16.4). Figure 2.2 shows
the distribution of IQ scores. There were N=86 children (1.6%) with intellectual disability (IQ<70).
Table 2.2: Characteristics & demographics of the ALSPAC sample
N %
DSM-IV ADHD or Clinical ASD diagnosis
ADHD 105 1.8
ASD 35 0.6
Both ADHD & ASD 8 0.1
Neither 5,585 97.4
Socioeconomic status
Low 40 0.6
Medium 2,845 40.6
High 4,117 58.8
House-owner No 1,581 20.9
Yes 5,987 79.1
Maternal education
GCSEs/vocational 1,859 25.1
A-level or higher 5,541 74.9
N.B. Numbers do not add up to total N=8,229 owing to missing data
Figure 2.2: Distribution of IQ in the ALSPAC sample
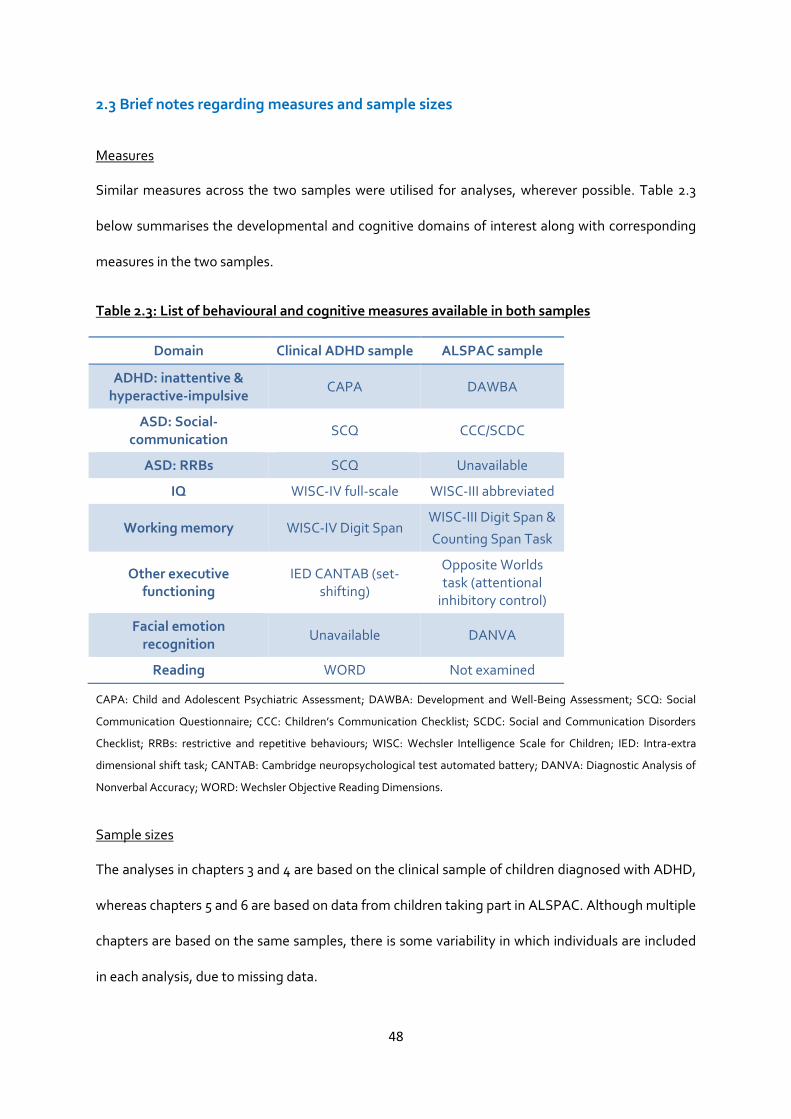
48
2.3 Brief notes regarding measures and sample sizes
Measures
Similar measures across the two samples were utilised for analyses, wherever possible. Table 2.3
below summarises the developmental and cognitive domains of interest along with corresponding
measures in the two samples.
Table 2.3: List of behavioural and cognitive measures available in both samples
Domain Clinical ADHD sample ALSPAC sample
ADHD: inattentive & hyperactive-impulsive
CAPA DAWBA
ASD: Social-communication
SCQ CCC/SCDC
ASD: RRBs SCQ Unavailable
IQ WISC-IV full-scale WISC-III abbreviated
Working memory WISC-IV Digit Span WISC-III Digit Span &
Counting Span Task
Other executive functioning
IED CANTAB (set-shifting)
Opposite Worlds task (attentional
inhibitory control)
Facial emotion recognition
Unavailable DANVA
Reading WORD Not examined
CAPA: Child and Adolescent Psychiatric Assessment; DAWBA: Development and Well-Being Assessment; SCQ: Social
Communication Questionnaire; CCC: Children’s Communication Checklist; SCDC: Social and Communication Disorders
Checklist; RRBs: restrictive and repetitive behaviours; WISC: Wechsler Intelligence Scale for Children; IED: Intra-extra
dimensional shift task; CANTAB: Cambridge neuropsychological test automated battery; DANVA: Diagnostic Analysis of
Nonverbal Accuracy; WORD: Wechsler Objective Reading Dimensions.
Sample sizes
The analyses in chapters 3 and 4 are based on the clinical sample of children diagnosed with ADHD,
whereas chapters 5 and 6 are based on data from children taking part in ALSPAC. Although multiple
chapters are based on the same samples, there is some variability in which individuals are included
in each analysis, due to missing data.

49
Chapter 3
Factor Structure of Autistic Traits in Children with ADHD
The work presented in this chapter has been published:
Martin, J., Hamshere, M. L., O’Donovan, M. C., Rutter, M., & Thapar, A. (2013). Factor structure of
autistic traits in children with ADHD. Journal of Autism and Developmental Disorders, 44(1), 204–15.
The published article has been edited for this chapter in order to include additional results
(previously available as supplementary materials) and to reduce the amount of repetition across
chapter 2 and section 3.3 in this chapter. Please note that there is some repetition of content in
section 3.2 and the thesis Introduction (chapter 1).
Please see http://link.springer.com/article/10.1007/s10803-013-1865-0 for the full published article.
3.1 Summary
ADHD and ASD often co-occur. Factor analyses of ASD traits in children with and without ASD
indicate the presence of social and restrictive-repetitive behaviour (RRB) factors. This study used
exploratory factor analyses to determine the structure of ASD traits (assessed using the Social
Communication Questionnaire) in children with ADHD. Distinct factors were observed for ‘social’
and ‘rigidity’ traits, corresponding to previous factor analyses in clinical ASD and population
samples. This indicates that the split between social-communication and RRB dimensions is
unaffected by a diagnosis of ADHD in children. Moreover, the results also suggest that there is
some overlap across hyperactive-impulsive symptoms and RRB traits in children with ADHD, which
merits further investigation.

50
3.2 Introduction
ADHD and ASD show a high rate of symptom overlap, with a substantial proportion of individuals
with one of the conditions also meeting diagnostic criteria for the other (Rommelse et al., 2010).
Although historically, diagnostic manuals have not allowed for a joint diagnosis of ADHD and ASD,
with an ASD diagnosis trumping and excluding a diagnosis of ADHD (DSM-IV & ICD-10), the
observed co-occurrence has prompted changes to these diagnostic exclusions for the DSM-5.
Overlap of the two conditions is found at the diagnostic level and at the level of symptoms below
diagnostic thresholds in referred children and in the general population (Grzadzinski et al., 2011;
Reiersen et al., 2007; Rommelse et al., 2010; Ronald et al., 2008). Moreover, given the high
heritability of both conditions (Faraone et al., 2005; Freitag, 2006), it is of note that family and twin
studies show co-heritability (Lichtenstein et al., 2010; Lundström et al., 2011; Mulligan et al., 2009a;
Nijmeijer et al., 2009; Taylor et al., 2012).
In recent years, interest has been growing in exploring the overlap of ADHD and ASD, in terms of
associated clinical comorbidities, neuropsychological deficits (e.g. executive functioning) and
shared genetic susceptibility. Given the time and cost of performing in depth interviews and
observational diagnostic assessments of ASD such as the Autism Diagnostic Interview-Revised
(ADI-R) and Autism Diagnostic Observation Schedule (ADOS) (Lord et al., 1989, 1994), many
studies have relied on questionnaires to measure autistic traits. The Social Communication
Questionnaire (SCQ; formerly known as the Autism Screening Questionnaire, ASQ) (Berument et
al., 1999; Rutter et al., 2003) is a parent-rated questionnaire assessing ASD behaviours. It is based
on the ADI-R (Lord et al., 1994) and has been found to agree well with it on a diagnostic level,
although only adequately on an item-by-item basis (Bishop & Norbury, 2002). The SCQ has been
widely used as a screening tool or quantitative measure of autistic traits in samples of children with
suspected ASD (Eaves et al., 2006), children with ADHD (Kochhar et al., 2011; Kröger et al., 2011;
Mulligan et al., 2009a) or other psychopathology (Pine et al., 2008; Towbin et al., 2005) and also in

51
the general population (Mulligan et al., 2009b). Children diagnosed with ADHD score higher on the
SCQ than their unaffected siblings or typically developing controls (Kochhar et al., 2011; Mulligan et
al., 2009a).
Like the ADI-R, the SCQ can be divided into subscales for the three DSM-IV and ICD-10 diagnostic
sub-domains of autistic symptoms: social-interaction deficits, communication problems and
restrictive-repetitive behaviours (RRBs). There is a growing body of evidence suggesting that
dividing ASD symptoms into these sub-domains is meaningful (Happé & Ronald, 2008); although
the behaviours occur together frequently, both phenotypic and genetic correlations between them
are only moderate, suggesting that the three sub-domains are to some extent clinically and
genetically separable (Ronald et al., 2006a, 2006b). Nevertheless, the sub-domains appear to
cluster more than expected by chance (Ronald et al., 2006b). In a recent population-based twin
sample, the authors tested whether different molecular genetic variants, assessed genome-wide,
predicted social and ‘non-social’ (i.e. RRB) traits, separately (Ronald et al., 2010a). The study did not
find evidence of these clinical domains being separate at a molecular genetic level, although only 1-
2 genome-wide genetic variants were found to be nominally associated with either sub-domain
(without allowing for multiple testing), and these did not replicate in an independent clinical sample
of children diagnosed with ASD. These non-significant results are arguably due to the study’s
relatively small sample size for a genome-wide association study that requires multiple testing
(ranging from N=372-436 in the high and low trait comparison groups), making it unclear whether
the same genetic variants are involved in these sub-domains. Therefore, more familial and
molecular genetic studies in larger samples are needed to clarify the extent to which these social
and RRB sub-domains are aetiologically related. Interestingly, the overlap of ADHD with ASD
symptoms has been demonstrated to occur within all three of these sub-domains, though RRBs
have been found to be less frequent than social and communication deficits in children with ADHD
(Rommelse et al., 2011).

52
Factor analyses of autistic traits in clinical ASD and community samples using a variety of ASD
measurement tools generally indicate that multiple factors account for the observed covariance
structure of ASD symptoms and traits (Happé & Ronald, 2008; Mandy & Skuse, 2008). Likely due to
differences in study design, there is little agreement in terms of the specific factors and their
composition. However, nearly all factor analytic studies derive at least one factor related to social-
communication features and a separate factor related to ‘non-social’ behaviour or RRBs (Mandy &
Skuse, 2008). To date, there has been no published factor analysis of autistic traits in a group of
children with ADHD and it is not yet known whether the presence of ADHD affects the nature of
autistic symptoms in some manner.
The main aim of this study was thus to explore the structure of autistic traits (as measured by the
SCQ) in a clinical sample of children with ADHD, to determine whether this structure was similar to
that found in samples of children with ASD and those from the general population. It was
hypothesised that social-communication traits and RRBs would be accounted for by separate, albeit
correlated, factors.
A secondary aim was to explore the relationship between ADHD symptoms and ASD traits in a
combined exploratory factor analysis. One previous study suggests that the core diagnostic criteria
of ADHD and ASD do not overlap (i.e. ADHD and ASD symptoms load on separate sets of factors) in
a general population sample of school children (Ghanizadeh, 2010). However, although deemed as
common conditions, ADHD and ASD have prevalence rates of less than 5% in general population
samples, with wide variability in reported prevalence rates in different geographic regions
(Polanczyk et al., 2007; Rutter, 2005). Therefore, it would be valuable to determine whether there is
any overlap in ADHD and ASD symptomatology in a clinical sample of children diagnosed with
ADHD (i.e. a group of children who have higher rates of individual symptom presence than the
average child in the population).

53
3.3 Method
Sample
The sample used for this analysis was the clinical sample of children with ADHD. Recruitment
procedures, general inclusion criteria and an overview of the measures used are detailed in section
2.1. For the current analyses, the sample (N=821) consisted of children with data on the measure of
autistic traits (the SCQ).
Measures
The CAPA, a semi-structured interview conducted with parents (Angold et al., 1995), was used to
assess the presence or absence of each of the 18 ADHD symptoms from the DSM-IV/ICD-10.
Parents also completed the SCQ (Berument et al., 1999; Rutter et al., 2003). The language
screening question (item 1) was omitted from analysis, leaving 39 items related to autistic traits.
These items were divided into the three sub-domains of ASD symptoms, as defined by the
diagnostic symptoms stipulated by the DSM-IV and ICD-10; there were 20 items classed as ‘social-
interaction deficits’, 10 as ‘communication deficits’, 8 as ‘restricted and repetitive behaviours
(RRBs)’ and one item (item 18) was unclassified. See Appendix 2.1 for a list of all SCQ items as well
as sub-domain classification. Full-scale IQ was assessed with the WISC-III or WISC-IV (Wechsler,
1992, 2003), using all subtests.
Factor analysis
To test the main hypothesis, an exploratory factor analysis (EFA) was performed on the 39 SCQ
items and the results were compared with a previous factor analysis of the SCQ in a sample of
children with ASD and other psychiatric problems (Berument et al., 1999). The secondary aim of the
study was addressed by adding in the 18 ADHD symptoms into the EFA model; this analysis is
henceforth referred to as the combined SCQ-ADHD analysis.
Cases with any missing data in either analysis were excluded (SCQ analysis: 97 with 1/39, 52 with
2/39 and 112 with >2/39 items missing; combined SCQ-ADHD analysis: 117 with 1/57, 55 with 2/57

54
and 115 with >2/57 items missing), leaving a complete data set of N=560 for the SCQ analysis, and
N=534 for the combined SCQ-ADHD analysis. Children included in the analyses did not differ from
those excluded (for having missing data) in terms of gender, age at assessment, family social status,
the severity of their ADHD symptoms or presence of oppositional defiant disorder, conduct disorder
or anxiety (p>0.05). They did differ in terms of IQ, with children with missing data (SCQ analysis:
mean IQ=82.4; SCQ-ADHD analysis: mean IQ=82.3) having lower IQ (SCQ analysis: t(df)=-2.0(752),
p=0.045; SCQ-ADHD analysis: t(df)=-2.3(752), p=0.019) than those with no missing items (SCQ
analysis: mean IQ=84.6; SCQ-ADHD analysis: mean IQ=84.7).
All variables were dichotomous (symptom present/absent). For each analysis, bivariate associations
were calculated as tetrachoric correlations. The tetrachoric correlation matrices were not positive
definite, so a smoothing algorithm was applied to the correlation matrix (using the R command:
tetrachoric (“data”, smooth=T)). Visual inspection of the matrices showed extremely high
correlation (tetrachoric correlation=0.95) of SCQ items 24 “when he/she was 4-5 did he/she nod
his/her head to mean yes?” and 25 “when he/she was 4-5 did he/she shake his/her head to mean
no?”, therefore item 25 was dropped from further analyses.
For each analysis, the correlation matrix was analysed using exploratory factor analysis (EFA) to find
the minimum residual (minres) solution. This solution was deemed most appropriate given that the
assumption of multivariate normality was not fulfilled due to dichotomous variables and the
tetrachoric correlation matrices being not positive definite. Choice of number of factors was based
on a combination of theory (based on previous literature) and points of inflection on the scree plots.
These methods were used in conjunction to maximise variance explained, while maintaining a
parsimonious and theory-driven approach towards conceptualising the target constructs. For
plausible alternative solutions, patterns of correlations across the factor scores were also examined
to ascertain the pattern of association across the derived measured factors. The EFA solution was
rotated using an oblique rotation (oblimin) as non-independence of the underlying factors was

55
hypothesised and observed (Matsunaga, 2010). For ease of interpretation, factor loadings below 0.2
are not shown. Factor analyses were performed in R.
Factor scores
To test whether IQ, age, gender or presence of intellectual disability (ID; IQ<70) had any effects on
the results, factor scores were calculated for each analysis. For each factor, a weighted average
score for each individual was calculated using all the loadings from the pattern matrices as weights.
Pearson correlations were calculated for each factor score with age and IQ. T-tests were used to
compare factor scores in 1) boys relative to girls and 2) children with ID relative to those without ID.
3.4 Results
ADHD sample
The following sample description is based on the N=560 children with sufficient data for the SCQ
analysis. The children were aged 5-18 years (mean=10.4, SD=3.0) and 87 (15.5%) were female. 405
(72.3%) children met criteria for the DSM-IV combined ADHD subtype, 28 (5.0%) had the
inattentive subtype, 60 (10.7%) had the hyperactive-impulsive subtype and 67 (12.0%) met criteria
for DSM-III-R ADHD. 63 (11.9%) of the children had comorbid ID (IQ<70), 234 (44.5%) had
oppositional defiant disorder, 103 (18.6%) had conduct disorder, 42 (7.8%) had anxiety and 3 (0.6%)
had depression.
The total number of ADHD symptoms ranged from 7-18 with a mean of 15.1 (SD=2.5). SCQ item
scores ranged from 0-35 (mean=12.8, SD=6.7). The prevalence of individual ADHD symptoms
ranged from 69.9%-96.6%. The prevalence of individual SCQ items ranged from 7.9%-67.3%.
SCQ analysis
The scree plot for the EFA of the SCQ items showed two points of inflection: occurring after 3 and 8
factors, explaining 43.8% and 62.2% of the variance, respectively. A 3-factor solution was chosen on
the basis of this information combined with theory (the DSM-IV & ICD-10 distinguish between three

56
sub-domains of ASD and the majority of previous factor analytic studies suggest that three factors
are meaningful (Mandy & Skuse, 2008)). Factor 1 was modestly correlated with factors 2 and 3 but
factors 2 and 3 were uncorrelated (see Table 3.1). Table 3.2 shows the pattern matrix of loadings for
the rotated solution, indicating which items load highly on each ASD DSM-IV sub-domain.
Table 3.1: Factor correlations for both EFA analyses
SCQ EFA SCQ-ADHD EFA
factor 1 – social
factor 2 – rigidity
factor 3 – non-verbal
communication
factor 1 – social
factor 2– rigidity/
hyperactivity
SCQ EFA
factor 2 – rigidity
0.43*
factor 3 – non-verbal communication
0.37* -0.05
SCQ-ADHD EFA
factor 1 – social 0.98* 0.39* 0.54*
factor 2 – rigidity/ hyperactivity
0.47* 0.97* -0.16* 0.39*
factor 3 – inattentiveness
0.13* 0.17* -0.12* 0.11* 0.24*
* Correlation is significant at the 0.01 level (2-tailed)
Factor 1 was comprised of items regarding social-interaction and communication skills and was
labelled the ‘social’ factor. Similarly to a previous factor analysis of the SCQ in children with ASD
and other psychiatric problems (Berument et al., 1999), this ‘social’ factor is comprised primarily of
a similar set of social-interaction items. Factor 2 in the current analysis was comprised of all the RRB
items as well as a few of the social and communication items and was labelled as the ‘rigidity’
factor. The majority of items comprising the ‘rigidity’ factor were all of those that constituted two
separate factors labelled ‘abnormal language’ and ‘stereotyped behaviour’ in the previous EFA of
the SCQ in children with ASD and other psychiatric problems (Berument et al., 1999). Factor 3
contained items to do with gesturing and was labelled the ‘non-verbal communication’ factor. In the
factor analysis by Berument and colleagues (1999), these items clustered with the majority of the
social-interaction items in the ‘social’ factor.

57
Table 3.2: Pattern matrix of loadings for factor analysis of SCQ items
SCQ item DSM-IV
sub-domains
Factor 1 – social
Factor 2 – rigidity
Factor 3 – non-verbal
communication
34- joins in social games (4/5) COM 0.78
37- positive response to other children (4/5) SOC 0.77
39- plays imaginative games with others (4/5) COM 0.77
36- interest in other children (4/5) SOC 0.76
27- reciprocates smiles (4/5) SOC 0.73
30- wants others to join in (4/5) SOC 0.69
29- shares things (4/5) SOC 0.67
40- plays cooperatively (4/5) SOC 0.67
38- attention without name called (4/5) SOC 0.66
33- range of facial expressions (4/5) SOC 0.63
35- pretend play (4/5) COM 0.61
0.25
31- comforts others (4/5) SOC 0.60
28- shows things to engage interest (4/5) SOC 0.57
0.30
26- looks at faces (4/5) SOC 0.45 0.28
2- talks to be friendly COM 0.30
0.23
10- appropriate facial expressions SOC 0.21
8- repeats things exactly COM
0.81
4- uses odd phrases COM
0.80
17- repetitive complicated movements RRB
0.72
13- interested in parts not whole RRB
0.72
7- invents words/phrases COM
0.68
16- unusual movements RRB
0.65
5- inappropriate questions SOC
0.61
9- has rituals RRB
0.55
11- uses other's hand as tool SOC
0.54
12- unusual interests RRB
0.54
15- unusual sensory interests RRB
0.54
6- pronoun reversal COM
0.50
14- unusually intense interests RRB
0.48
18- self-injures - 0.20 0.43
19- always carries specific object around RRB
0.37
3- can have a conversation COM 0.30 0.31 0.27
20- has friends SOC
0.22
32- uses gestures with sounds/words (4/5) SOC
0.71
24- nods head (4/5) SOC
0.67
22- points to show things (4/5) SOC 0.27
0.66
23- uses gestures (4/5) SOC
0.66
21- copies people's actions (4/5) COM 0.29
0.40
COM: Communication sub-domain; SOC: Social-interaction sub-domain; RRB: Restrictive and repetitive behaviours sub-domain. To aid
interpretation, loadings of <0.2 are not presented.

58
Combined SCQ-ADHD analysis
Next, the 18 ADHD symptoms and 38 SCQ items were analysed together. The scree plot showed
two points of inflection: occurring after 3 and 5 factors, explaining 35.3% and 44.6% of the variance,
respectively. The range of Pearson factor inter-correlation coefficients for the 3-factor solution (see
Table 3.1) was lower than that for the 5-factor solution (r=-0.08-0.46, p=0.23-p<0.001), indicating
greater coherence between the derived factors of the 3-factor solution relative to the 5-factor
solution. On the basis of this information and the ‘parsimony principle’ (Kline, 2010) a 3-factor
solution was chosen. All three factors were modestly correlated (see Table 3.1). The rotated factor
loadings are shown in Table 3.3, indicating which items load on which ASD and ADHD sub-domains
(based on DSM-IV). Factor 1 was very similar to the ‘social’ factor of the SCQ analysis, as can be
seen both by its composition and correlation coefficient of 0.98 with this factor (see Table 3.1).
Likewise, factor 2 of the combined SCQ-ADHD analysis was very similar to the ‘rigidity’ factor of the
SCQ analysis (correlation coefficient of 0.97), with the addition of the majority of the hyperactive-
impulsive ADHD symptoms. Factor 3 comprised the inattentive ADHD symptoms and one of the
hyperactive symptoms. These factors were labelled ‘social’, ‘rigidity/hyperactivity’ and
‘inattentiveness’, respectively.
It can be seen from Table 3.1 that all the factors from the SCQ analysis are significantly correlated
with those from the combined SCQ-ADHD analysis. The majority are positively correlated, with the
exception of the SCQ ‘non-verbal communication’ factor with the SCQ-ADHD
‘rigidity/hyperactivity’ and ‘inattentiveness’ factors (those comprising ADHD symptoms), which
were negatively correlated.

59
Table 3.3: Pattern matrix of loadings for factor analysis of SCQ items and ADHD symptoms
DSM-IV sub-
domains
Factor 1 – social
Factor 2 – rigidity/
hyperactivity
Factor 3 – inattentiveness
SCQ 30- wants others to join in (4/5) SOC 0.75
SCQ 39- plays imaginative games with others (4/5) COM 0.73
SCQ 34- joins in social games (4/5) COM 0.72
SCQ 27- reciprocates smiles (4/5) SOC 0.70
SCQ 28- shows things to engage interest (4/5) SOC 0.69
SCQ 35- pretend play (4/5) COM 0.69
SCQ 29- shares things (4/5) SOC 0.64
SCQ 22- points to show things (4/5) SOC 0.63
SCQ 36- interest in other children (4/5) SOC 0.62 0.25
SCQ 31- comforts others (4/5) SOC 0.62
SCQ 37- positive response to other children (4/5) SOC 0.61 0.29
SCQ 38- attention without name called (4/5) SOC 0.58 0.22
SCQ 40- plays cooperatively (4/5) SOC 0.57 0.28
SCQ 33- range of facial expressions (4/5) SOC 0.56
SCQ 26- looks at faces (4/5) SOC 0.50 0.28
SCQ 32- uses gestures with sounds/words (4/5) SOC 0.50
SCQ 21- copies people's actions (4/5) COM 0.46
SCQ 3- can have a conversation COM 0.42 0.28
SCQ 2- talks to be friendly COM 0.41
SCQ 24- nods head (4/5) SOC 0.34
SCQ 20- has friends SOC 0.30
SCQ 23- uses gestures (4/5) SOC 0.22
SCQ 10- appropriate facial expressions SOC 0.21
SCQ 13- interested in parts not whole RRB
0.74
SCQ 8- repeats things exactly COM
0.69
SCQ 17- repetitive complicated movements RRB
0.66
SCQ 4- uses odd phrases COM
0.66
SCQ 7- invents words/phrases COM
0.65
SCQ 11- uses other's hand as tool SOC
0.63
SCQ 16- unusual movements RRB
0.62
SCQ 12- unusual interests RRB
0.58
SCQ 9- has rituals RRB
0.56
SCQ 15- unusual sensory interests RRB
0.56
SCQ 18- self-injures -
0.51
ADHD IMP 4- talking excessively IMP
0.50
SCQ 5- inappropriate questions SOC
0.49
SCQ 14- unusually intense interests RRB
0.49
ADHD HYP 3- running excessively HYP
0.47
SCQ 6- pronoun reversal COM
0.41
ADHD HYP 5- often noisy HYP
0.39 0.36
ADHD HYP 4- on the go HYP
0.37

60
SCQ 19- always carries specific object around RRB
0.37
ADHD HYP 1- fidgeting HYP
0.37 0.29
ADHD IMP 1- waiting for turn IMP
0.32 0.27
ADHD IMP 2- blurting out answers IMP
0.26
ADHD IMP 3- interrupting IMP
0.23 0.23
ADHD IN 1- sustaining attention INA
0.74
ADHD IN 7- making careless mistakes INA
0.72
ADHD IN 2- following instructions INA
0.71
ADHD IN 8- forgetful INA
0.69
ADHD IN 9- organisational difficulty INA
0.65
ADHD IN 3- avoiding mental effort INA
0.62
ADHD IN 6- not listening INA
0.60
ADHD IN 4- easily distracted INA
0.55
ADHD IN 5- losing things INA
0.44
ADHD HYP 2- remaining seated HYP
0.29 0.41
COM: Communication sub-domain; SOC: Social-interaction sub-domain; RRB: Restrictive and repetitive behaviours sub-domain; IMP: Impulsive
symptoms; HYP: Hyperactive symptoms; INA: Inattentive symptoms. To aid interpretation, loadings of <0.2 are not presented.
Correlates of factor scores
Correlation results for age and IQ with the factors are displayed in Table 3.4. Age at assessment was
negatively correlated with the ‘rigidity’ factor of the SCQ analysis and the ‘rigidity/hyperactivity’ factor of
the combined SCQ-ADHD analysis and positively correlated with the ‘non-verbal communication’ factor of
the SCQ analysis. In other words, younger children showed higher rates of RRBs and hyperactive-impulsive
behaviours, whereas older children showed more of some of the social-communication ASD traits. The
factor scores from both analyses were negatively correlated with IQ (p<0.05), except for the
‘inattentiveness’ factor from the combined SCQ-ADHD analysis, which only showed a trend towards a
negative correlation (p=0.09).

61
Table 3.4: Factor score correlations with age and IQ
Factor Age IQ
SCQ EFA
factor 1 – social 0.01 -0.21**
factor 2 – rigidity -0.13** -0.12**
factor 3 – non-verbal communication 0.12** -0.13**
SCQ-ADHD EFA
factor 1 – social 0.05 -0.21**
factor 2 – rigidity/ hyperactivity -0.20** -0.10*
factor 3 – inattentiveness -0.03 -0.08
* Correlation is significant at the 0.05 level (2-tailed)
** Correlation is significant at the 0.01 level (2-tailed)
Children with ID (IQ<70) had higher factor scores for the first two factors of either analysis (p<0.05),
i.e. the ‘social’, ‘rigidity’ and ‘rigidity/hyperactivity’ factors. These results are displayed in Table 3.5.
In terms of gender, boys tended to have higher scores than girls (p<0.05) on the ‘social’ factor of the
SCQ analysis. There were no gender differences for the other factors.
Table 3.5: Association of factor scores with gender and presence of ID
Factor Gender Mean(SD) t p ID Mean(SD) t p
SCQ EFA
factor 1 – social F 0.25(0.19)
-2.18 0.03 No ID 0.28(0.22)
-3.95 3.7x10⁻⁵
M 0.30(0.23) ID 0.40(0.25)
factor 2 – rigidity F 0.40(0.22)
0.25 0.80 No ID 0.37(0.24)
-2.81 0.01 M 0.39(0.25) ID 0.46(0.27)
factor 3 – non-verbal communication
F 0.32(0.28) -0.25 0.80
No ID 0.32(0.28) -1.51 0.13
M 0.33(0.29) ID 0.38(0.32)
SCQ-ADHD EFA
factor 1 – social F 0.24(0.20)
-1.61 0.11 No ID 0.26(0.21)
-3.49 1.2x10⁻⁴ M 0.28(0.22) ID 0.37(0.23)
factor 2 – rigidity/ hyperactivity
F 0.50(0.19) -0.39 0.70
No ID 0.49(0.21) -2.44 0.01
M 0.51(0.22) ID 0.57(0.23) factor 3 – inattentiveness
F 0.89(0.18) 0.54 0.59
No ID 0.88(0.19) -1.36 0.17
M 0.88(0.19) ID 0.91(0.17)
ID: intellectual disability (IQ<70)

62
3.5 Discussion
In children with ADHD, the results of the SCQ factor analysis indicate that items corresponding to
DSM-IV social deficits and RRBs constitute mainly separate factors, with various items for DSM-IV
communication deficits clustering with one or the other factor. In comparison to a previous factor
analysis of the SCQ in children with ASD and other psychiatric problems (Berument et al., 1999), the
largest factor is comprised of social-interaction items, whereas items concerning RRBs constitute a
separate factor, which in this previous EFA were sub-divided into two separate factors labelled
‘abnormal language’ and ‘stereotyped behaviour’. Although there are differences in which specific
items are included in the different factors in the current analysis compared to the one by Berument
and colleagues (1999), the similarities are striking.
Moreover, the results suggest that the factor structure of autistic traits (measured by the SCQ) in
children with ADHD is comparable to previous reports of factor analyses of autistic measures in
children with ASD and the general population showing separate social and ‘non-social’ or RRB
factors (Happé & Ronald, 2008; Mandy & Skuse, 2008). It is important to note though, that despite
these separate clusters of items, these factors (in particular the ‘social’ and ‘rigidity’ factors) are
correlated, indicating that they are not independent of each other. Although the symptoms
reported here are not strictly at diagnostic levels, these results also support the growing body of
evidence for changing ASD diagnostic criteria from a triad (social-interaction deficits,
communication problems and RRBs) to a dyad (social-communication deficits and RRBs) of
symptom types in the DSM-5 (Frazier et al., 2012; Mandy et al., 2012).
The second analysis, which explored whether ADHD symptoms and SCQ items group together or
form separate factors, found that the two factors of items of social-communication deficits from
the SCQ factor analysis (i.e. the ‘social’ and ‘non-verbal communication’ factors) combined into a
single ‘social’ factor and the hyperactive-impulsive symptoms tended to group with RRB items in a
‘rigidity/hyperactivity’ factor, with a separate factor for inattentive ADHD symptoms. Although

63
there are minor differences in which items load more strongly on the specific factors in this analysis
compared to the analysis of the SCQ items only, the division of the ASD traits into ‘social’ and
‘rigidity’ factors appears unaffected by including ADHD symptoms in the analysis.
The observed division of the ADHD symptoms into separate factors of hyperactive-impulsive and
inattentive symptoms is well-supported in the ADHD literature (Willcutt et al., 2012). Indeed, as
with social-communication symptoms relative to RRBs (Ronald et al., 2006a, 2010a, 2006b), there is
evidence suggesting that hyperactive-impulsive and inattentive symptoms show some level of
genetic heterogeneity and specificity in addition to substantial genetic overlap (Greven et al., 2011).
It is of particular interest that the hyperactive-impulsive ADHD items clustered with the RRB items
and one can only speculate as to why this might be the case. This finding requires further
investigation and replication in other samples.
There is growing evidence that ADHD and ASD are each the extreme end of a continuum rather
than being distinct categories (Constantino & Todd, 2003; Larsson et al., 2011; Levy et al., 1997).
Given this, the division of ADHD into two dimensional scales of inattentive and hyperactive-
impulsive symptoms and of ASD into social-communication and RRB dimensions has important
implications for classification of developmental problems, investigating the aetiology of these traits
and understanding the high heritability and co-heritability of the two disorders (Faraone et al.,
2005; Freitag, 2006; Lichtenstein et al., 2010).
Although a 3-factor solution for the combined SCQ-ADHD analysis is believed to be the optimal
solution, an alternative was to choose a less parsimonious 5-factor solution (see Appendix 3.1). This
solution bears many similarities to the main analyses. The primary factor is composed of a highly
similar set of items to the SCQ ‘social’ and the SCQ-ADHD 3-factor ‘social’ factors and is very highly
correlated with these (Pearson correlation coefficients of 0.99 and 0.98, respectively). Similarly, the
second factor of the 5-factor SCQ-ADHD solution is very highly correlated with the ‘rigidity’ SCQ
factor (0.995) and the ‘rigidity/hyperactivity’ factor (0.98) of the SCQ-ADHD 3-factor analysis. The

64
third factor appears to correspond to the ‘inattentiveness’ factor of the SCQ-ADHD 3-factor analysis
(correlation=0.98). The fourth factor contains primarily hyperactive and impulsive ADHD symptoms
and the fifth factor corresponds to the ‘non-verbal communication’ factor of the SCQ analysis
(correlation=0.96). The key point about the 5-factor solution is that the ASD items come out
separately to the ADHD symptoms (i.e. it has three factors of ASD items corresponding to the SCQ
analysis and two separate factors for ADHD symptoms). Such a solution is in line with the previous
exploratory factor analysis of core ADHD and ASD diagnostic criteria in a population sample of
school children (Ghanizadeh, 2010). However, it is important to consider competing factor solutions
and further studies are needed to clarify the extent of the overlap of RRBs and hyperactive-
impulsive ADHD symptoms. It would also be worth exploring the factor structure of ADHD and ASD
symptoms in children diagnosed with ASD. One small study (N=65) has attempted to do this, and
although they found distinct factors for ASD and ADHD, they do not consider competing models
and provide no clear justification for the choice of a 2-factor solution (Ghanizadeh, 2012).
Although children with ID (IQ<70) tend to be excluded from studies of ADHD and sometimes also of
ASD, these children were included in the present analyses (N=63). Given the high association of
lower IQ and higher rates of ID in these neurodevelopmental conditions (Frazier et al., 2004; Voigt
et al., 2006), IQ is not statistically separable from neurodevelopmental problems (Dennis et al.,
2009) and the deliberate recruitment of children without ID may bias representativeness of such
samples. Indeed, analysis of factor scores in relation to IQ showed that the factor scores were
negatively correlated with IQ, indicating that children with the most severe symptom profiles were
likely to score lower on the IQ test. There is also evidence that children with ADHD and comorbid ID
do not differ in their ADHD profile to those with ADHD without ID (Ahuja et al., 2013; Antshel et al.,
2006). A complete re-analysis of the data excluding the children with ID shows no marked
differences to the pattern of observed results (see Appendices 3.2 and 3.3).

65
Given that ADHD and ASD are developmental conditions, it is not surprising that some of the factor
scores showed associations with age. There appeared to be no effect for age for the primary ‘social’
factors, whereas the ‘rigidity’ and ‘rigidity/hyperactivity’ factor scores decreased with age and the
‘non-verbal communication’ factor scores increased with age. Although it is well-established that
hyperactivity and impulsivity decrease with age (Willcutt et al., 2012), it is less clear why older
children would struggle more on the items comprising the ‘non-verbal communication’ factor,
unless this is related to parental recall of items from when the children were aged 4-5 years old.
In terms of gender, boys had higher scores than girls on the ‘social’ factor of the SCQ analysis but
boys and girls did not differ on the other factor scores. Given that there is a high ratio of boys to
girls in samples of children with ADHD and ASD, it is reasonable that boys with ADHD are more
likely to have higher ASD scores than girls, although it is unclear why this is the case only for the
social difficulties. Limiting the analysis to boys-only makes no difference to the pattern of observed
results (see Appendices 3.4 and 3.5).
The results of this study need to be considered in light of several limitations. Data on ADHD and
ASD were derived from different types of instruments. Whilst ADHD symptoms were measured
using a diagnostic interview completed with parents (Angold et al., 1995), ASD traits were
measured using a questionnaire measure (Rutter et al., 2003). Future studies will need to examine
whether the pattern of results is affected by the type of instrument used.
Although the relatively large sample size was a strength of the current study, it was not sufficiently
large enough to analyse stratified age groups. Also, parental recall of their children’s behaviour
(particularly at ages 4-5) might have been different for adolescents. The findings of this study relate
to clinic children diagnosed with ADHD and it is possible that the observed association of
hyperactive-impulsive items with RRBs might not be evident in children with lower levels of these
traits, as has been suggested by one other study (Ghanizadeh, 2010).

66
However, despite these caveats, the study contributes novel findings to the growing body of
literature exploring the overlap of ADHD and ASD. The results highlight that there are distinct
dimensions of social-communication difficulties and RRBs in children diagnosed with ADHD,
supporting such a finding in children with ASD and in the general population (Mandy & Skuse,
2008). This finding further implies that the presence or absence of ADHD does not affect the
manifestation of social-communication difficulties and RRBs in children. The results also support
the switch from a triad to a dyad of diagnostic symptom dimensions in the DSM-5 (Frazier et al.,
2012; Mandy et al., 2012). The suggestion that hyperactive-impulsive traits may be linked with RRBs
is an intriguing one and requires replication and further study, both in clinically referred children and
in the general population.

67
Chapter 4
Autistic Traits in Children with ADHD Index Cognitive and
Developmental Problems
The work presented in this chapter forms part of a published research article.
Cooper, M.*, Martin, J.*, Langley, K., Hamshere, M., & Thapar, A. (* joint 1st authors). (2014). Autistic
traits in children with ADHD index clinical and cognitive problems. European Child and Adolescent
Psychiatry, 23(1), 23–34.
Additional outcomes (i.e. clinical comorbidities) were included in the original publication; these
formed a chapter of Miriam Cooper’s PhD thesis, a co-author on the publication, and as such are not
included here. Please note there is some repetition of background information in section 4.2 that
has already been presented in section 3.2 and in chapter 1.
Please see http://link.springer.com/article/10.1007/s00787-013-0398-6 for the full published article:
4.1 Summary
Traits of ASD occur frequently in ADHD, but the significance of their presence is not fully
understood. The analysis in this chapter aimed to determine whether higher levels of autistic traits,
as measured by the Social Communication Questionnaire (SCQ), index cognitive or developmental
problems in a large clinical sample of children with ADHD (N=711). Regression analyses examined
associations of SCQ scores with core ADHD features and cognitive and developmental problems.
For outcomes showing an association with total SCQ score, secondary analyses determined levels
of differential association of the two DSM-5 ASD sub-domains (social-communication difficulties
68
and restrictive, repetitive behaviours). Results suggest that ASD traits within ADHD are associated
with more ADHD symptoms, lower IQ, more working memory deficits and presence of general
language and motor delays. The associations with cognitive and developmental problems persisted
after accounting for ADHD severity, suggesting that ASD traits independently index the severity of
these impairments in the context of ADHD. Secondary analyses indicate unique contributions of the
social-communication sub-domain to the associations with IQ and working memory. They also
show that repetitive behaviours independently predict hyperactive-impulsive symptoms and motor
delays. It would be worthwhile for clinicians to consider levels of social-communication difficulties
and repetitive behaviours in children with ADHD who do not meet diagnostic criteria for ASD, as
these appear to index higher levels of phenotypic complexity.
4.2 Introduction
ADHD and ASD are early-onset neurodevelopmental disorders, which frequently co-occur. High
rates of symptom overlap have been shown both in clinical samples (Ghaziuddin et al., 1998;
Stahlberg et al., 2004; Thede & Coolidge, 2007; Yoshida & Uchiyama, 2004) and general population
samples (Lichtenstein et al., 2010; Reiersen et al., 2008a; Ronald et al., 2008; Simonoff et al., 2008).
The two conditions also share many co-occurring impairments in a number of developmental and
cognitive domains. There is strong comorbidity of both disorders with intellectual disability (ID) and
they are associated with lower IQ (Dykens & Hodapp, 2001; Frazier et al., 2004; Matson &
Shoemaker, 2009; Voigt et al., 2006). They are also associated with reading difficulties (Dykman &
Ackerman, 1991; Jones et al., 2009; Maughan & Carroll, 2006) and motor problems, such as
developmental co-ordination disorder (Blondis, 1999; Fournier et al., 2010). Specific speech and
language problems and general language delay, core features in ASD, are frequently seen in those
with ADHD (Bruce et al., 2006; Hagberg et al., 2010). Furthermore, both disorders are associated
with deficits in executive functioning, including response inhibition, working memory and planning
abilities (Willcutt et al., 2008).

69
There has been a recent shift in thinking of ADHD and ASD as conditions that cannot be diagnosed
in one individual (DSM-IV and ICD-10) to a rising awareness of the strong relationship between
these disorders, both in terms of research and clinical practice (DSM-5). In light of this, there have
been a number of attempts to examine the phenotypic similarities between children with a primary
diagnosis of ADHD or ASD and children meeting diagnostic criteria or having a high level of traits of
both conditions (Frazier et al., 2001; Grzadzinski et al., 2011; Kochhar et al., 2011; Kröger et al.,
2011). The focus of this chapter is on the presence of elevated ASD traits in children with ADHD.
Research suggests that the profile of ADHD symptoms in affected children appears fairly similar,
regardless of the presence of ASD traits (Frazier et al., 2001; Grzadzinski et al., 2011). However,
there is some indication that children with ADHD who have higher levels of ASD traits may be more
likely to have the more severe, DSM-IV combined, subtype of ADHD (Grzadzinski et al., 2011) and
also more hyperactive-impulsive symptoms, though it is unclear whether inattentive symptoms are
higher (Kröger et al., 2011).
In terms of general cognitive ability, the presence of ASD traits in children with ADHD does not
appear to be associated with IQ (Grzadzinski et al., 2011; Kochhar et al., 2011). However, the two
studies so far excluded children with IQ<70 and therefore the full extent of impairments in IQ in
children with ADHD and co-occurring ASD traits has not been fully explored. A recent review of the
few studies examining deficits in various executive functioning (EF) sub-domains in children with
ADHD and ASD suggests that executive functioning deficits appear qualitatively similar in both
conditions, but can vary in degree of severity (Rommelse et al., 2011). However, this review also
highlights the lack of sufficient research directly comparing children with traits of both phenotypes,
relative to those with only one phenotype; studies to date are small, with inconsistencies in
methodology, inclusion criteria and the specific executive functioning sub-domains tested, making
it difficult to draw any firm conclusions. In terms of other developmental domains, there is some
evidence that ASD traits in children with ADHD are associated with higher rates of motor and

70
language problems (Mulligan et al., 2009a). Further studies are necessary to confirm these findings
and clarify the specifics of the relationship between ASD traits and cognitive and developmental
deficits in children with ADHD.
Rationale for current study
The aim of this study was to determine whether ASD traits (assessed as a continuous measure) in a
sample of children with ADHD index a more severe cognitive and developmental profile. It was
hypothesised that the presence of an increasing number of ASD symptoms in those with ADHD will
be associated with lower IQ, lower reading ability, more executive functioning problems and a
greater rate of language and motor problems. Although traditionally regarded as clustering very
strongly, the sub-domains of ASD (deficits in social-communication problems and restrictive and
repetitive behaviours) have been suggested to dissociate, both in terms of clinical presentation and
in terms of underlying genetic aetiology (Happé & Ronald, 2008). As such, for any outcomes
showing an overall association with total ASD trait scores, exploratory analyses were used to
determine whether these sub-domains of ASD symptoms show differential association (i.e. to
determine whether either sub-domain is independently associated with the outcome, over and
above the other sub-domain).
4.3 Method
Sample
This analysis used data from the clinical sample of children with ADHD, described in detail in section
2.1. Please refer back to that section for recruitment procedures, general inclusion criteria and an
overview of the measures used. Children were eligible for inclusion in the present analysis if they
had a current diagnosis of DSM-III-R or DSM-IV ADHD with complete subtype data available and
sufficient ASD trait data for analysis (N=711). There were 113 females (15.9%) in the sample and the
children were aged between 5-18 years (mean=10.3, SD=2.9).

71
Measures
Research diagnoses of ADHD and symptom counts were ascertained using the parent-rated CAPA
(Angold et al., 1995), a semi-structured interview. Symptom totals were calculated for inattentive
and hyperactive-impulsive traits (out of 9 each), as well as total ADHD traits (out of 18).
ASD traits were analysed as a continuous measure using the parent-rated Social Communication
Questionnaire (SCQ) (Berument et al., 1999; Rutter et al., 2003). Item 1 is a language screening item
and was omitted from the total score. For consistency and comparability, where parents answered
‘no’ to this item and consequently omitted the following seven questions, these children were not
included in analyses (N=20). The remaining items were summed to give a total out of 39. The scores
were examined as a continuous variable as there is evidence that autistic traits are continuously
distributed throughout the population (Constantino & Todd, 2003).
The 39 items were also divided into the two DSM-5 sub-domains of ASD symptoms, as suggested
by previous research, including the factor analyses reported in chapter 3 of this thesis (Happé &
Ronald, 2008; Mandy & Skuse, 2008; Martin et al., 2013). There were 8 items classed as ‘restricted
and repetitive behaviours (RRBs)’ and 30 items were classed as ‘social-communication deficits’. Item
18 (regarding self-harm) was unclassified as it is not a part of the diagnostic criteria for ASD. Please
refer to Appendix 2.1 for a list of all SCQ items and sub-domain classification. Totals for each sub-
domain were calculated based on these items.
To account for missing questionnaire items in calculating the total SCQ score and sub-domains, a
prorated score was calculated for children with 10% or fewer missing items, where the fraction of
endorsed items out of those completed was multiplied by the total number of items. Children with
>10% missing on either sub-domain or the total score were omitted from analyses (N=107). Group
comparisons showed that these children with excessive missing data had lower IQ (mean=81.5)
than the children included in the final sample (mean=84.3, N=711; t(df)=2.1(143.2), p=0.033),

72
although they did not differ in terms of gender, age at assessment, family socioeconomic status
(SES) or severity of their ADHD symptoms (all p>0.05).
Cognitive assessments were performed by trained psychologists. Parents were asked to withhold
stimulant medication from their child for 24 hours prior to testing. The WISC-III or WISC-IV
(Wechsler, 1992, 2003) was used to assess full-scale IQ, using all subtests. The WISC-IV Digit Span
subtest is a measure of verbal working memory and was also considered separately. The Wechsler
Objective Reading Dimensions (WORD) (Wechsler, 1993) was used to assess reading, spelling and
reading comprehension abilities in children up to the age of 12 years. The intra-extra dimensional
shift (IED) task from the Cambridge Neuropsychological Battery (CANTAB) (Cambridge Cognition,
1996) was used as a measure of executive functioning (visual discrimination, set shifting and
attentional flexibility). The measure used was whether the child had successfully completed stage 8,
the crucial stage at which the extra-dimensional shift first occurs; this variable measures ability to
shift attention to a previously irrelevant feature (known as set-shifting), akin to a change in category
in the Wisconsin Card Sorting task (WCST) (Berg, 1948) and has been found to be particularly
impaired in un-medicated children with ADHD (Kempton et al., 1999; Rhodes et al., 2005) and in
children with ASD (Hughes et al., 1994; Yerys et al., 2009a) relative to controls.
Parents were also asked general questions about their child’s speech and motor development at the
interview. Children who were not talking by age 2 and/or had had speech therapy were classed as
positive for this broad measure of language problems. Children who were not walking by 18 months
and/or were clumsy “pretty much” or “very much” were classed as positive for this broad measure of
motor problems.
Family annual income, parental employment status and parental educational attainment were
assessed by parental questionnaire. Low income was defined as annual family income <£20,000,
and low educational attainment was defined as having left school without qualifications (GCSE or
equivalent) at age 16 years. SES was classified by the occupation of the main family wage earner in

73
the family. Three SES categories were defined, with the medium and high categories merged to
give binary categories of low SES or otherwise.
Data analyses
All analyses were performed using SPSS version 18. All tests were two-tailed. Where a variable was
not normally distributed, the scores were transformed (ln x+1) to make them normally distributed,
and analyses were run on transformed scores. First, the effect of putative covariates was assessed
using univariate logistic and linear regression analyses. Next, logistic and linear regression analyses
were used to determine the associations of total SCQ score (predictor variable) with cognitive and
developmental characteristics (outcomes) of the ADHD sample. The primary model analysed
unadjusted associations between SCQ scores and outcomes in the full sample. Next, IQ, age,
gender and family SES were included as covariates to determine to what extent observed
associations were explained by other variables; children with any one of these covariates missing
(N=112) could not be included in this model. Finally, severity of ADHD symptoms was added as a
further covariate to determine whether ADHD symptom levels contributed to the observed
associations. However, IQ was not included as a covariate in the analysis of the WISC-IV Digit Span
subtest in view of this subtest being a component of full-scale IQ. Correction for multiple testing
was administered using Bonferroni; alpha was set at p=0.006 (0.05/8) for 8 tests performed (6 tests
of cognitive outcomes and 2 tests of developmental outcomes).
Exploratory analyses
As a secondary test of IQ abilities, the four WISC-IV indices were entered simultaneously into one
multivariate regression model, to determine the level of each index’s unique contribution to
explaining the variance in SCQ scores (i.e. to determine whether any of the indices are
independently associated with the outcome over and above the other indices).
For outcome variables that showed an association with overall SCQ score, secondary analyses were
performed on the two SCQ sub-domain scores (social-communication deficits and RRBs), to

74
determine whether scores on either sub-domain predicted a greater association with the outcome
variables above and beyond shared variance with the other sub-domain. For each outcome variable,
covariates (age, IQ, gender and family SES) and the two SCQ sub-domain scores were entered into
a single multivariate model to test for association with the outcomes. As these sub-domain analyses
were exploratory and secondary, the same threshold for multiple testing (p<0.006) was used when
interpreting the results.
Sensitivity analyses
Although children with ID are generally excluded from ADHD research studies, they were included
in the current sample. To determine whether their inclusion affected the pattern of results, the main
analyses were repeated without these cases (N=85).
Furthermore, the sensitivity of the observed results to the use of a continuous measure of ASD
traits was tested by dividing the sample into groups based on the screening cut-off threshold used
in the literature (Berument et al., 1999) and comparing children with total SCQ<15 (N=433) to those
with SCQ score ≥15 (N=278).
4.4 Results
Total SCQ scores and IQ scores were normally distributed and IQ ranged between 43-124
(mean=84.3, SD=14.0), which included 85 children with an IQ<70. Figure 4.1 displays the frequency
distribution of SCQ scores across the sample. Table 4.1 shows general sample characteristics,
including mean total SCQ by several key descriptive and diagnostic variables.
Covariates
Total SCQ scores were associated with lower full-scale IQ (β=-0.21, p=5.7x10⁻⁸), greater rate of low
family income [odds ratio (OR)=1.04, 95% confidence intervals (CI)=1.01-1.07, p=0.006] and low
family SES (OR=1.04, 95% CI=1.01-1.06, p=0.003). There was no association of SCQ and child’s age
at assessment (β=-0.04, p=0.31), gender (OR=1.01, 95% CI=0.98-1.04, p=0.54) or parental education

75
(OR=1.00, 95% CI=0.97-1.03, p=0.91). In terms of ADHD profile, SCQ scores were positively
associated with the number of inattentive (β=0.12, p=0.001), hyperactive-impulsive (β=0.21,
p=1.1x10-08) and total ADHD (β=0.21, p=1.4x10⁻⁸) symptoms.
Figure 4.1: Distribution of total Social Communication Questionnaire scores in the sample
Table 4.1: Sample characteristics in relation to Social Communication Questionnaire scores
Variable
N % SCQ mean(SD)
Gender Male 598 84.1 13.1(6.7)
Female 113 15.9 12.7(6.3)
Socioeconomic status
Low 332 51.5 13.7(6.7)
Medium-high 313 48.5 12.1(6.6)
Family income Low income 285 63.3 13.7(7.2)
Medium-high income 165 36.7 11.8(6.6)
Parental education
No GCSEs 128 27.1 13.0(6.9)
GCSEs or higher 345 72.9 13.1(7.0)
ADHD diagnosis subtype
DSM-IV Combined 519 73.0 13.7(6.7)
DSM-IV Inattentive 43 6.0 9.9(6.2)
DSM-IV Hyperactive-Impulsive
73 10.3 11.4(6.9)
DSM-III-R only 76 10.7 11.8(5.6)
Presence of ID
No ID (IQ≥70) 583 82.0 12.5(6.5)
ID (IQ<70) 85 12.0 15.3(7.2)
Unknown (no IQ data) 43 6.0 15.4(7.0)
Total sample
711 100 13.0(6.6)
ID: intellectual disability

76
Main analyses
Results of regression analyses of SCQ scores with cognitive and developmental outcomes are
displayed in Table 4.2. Full-scale IQ was negatively associated with SCQ score (all three models). A
multivariate regression model explored the relative contributions of the four indices of the WISC-IV
to this association. There were no unique contributions of Verbal Comprehension Index, Perceptual
Reasoning Index or Processing Speed (p>0.05). However, there was a trend towards an association
between higher SCQ scores and a lower Working Memory Index, above and beyond contributions
shared with the other three WISC-IV indices (unadjusted analysis: β=-0.14, p=0.014; adjusted for all
covariates: β=-0.17, p=0.0029). An analysis of the Digit Span subtest, a measure of working
memory, found that lower scores were significantly predicted by higher SCQ scores, a finding that
persisted after adjusting for covariates.
Successful completion of the extra-dimensional shift stage of the CANTAB IED task was not found
to be associated with SCQ scores. There was also no association of SCQ scores with WORD Basic
Reading, Spelling or Reading Comprehension, after accounting for multiple testing. Higher SCQ
scores were associated with a greater likelihood of motor problems and general language problems.
This pattern of results was consistent after co-varying for gender, age, SES, IQ and ADHD severity.

77
Table 4.2: Associations of Social Communication Questionnaire scores with cognitive and developmental outcomes
Outcome variable
Unadjusted (max N=711) Adjusted a
(max N=599) Adjusted b
(max N=599)
B (Std. Error) β OR (95% CI) p-value p-value p-value
WISC-IV full-scale IQ -0.45 (0.08) -0.21
5.7x10⁻⁸ 1.1x10⁻⁶ c 1.6x10⁻⁶ c
WISC-IV Digit Span subtest -0.07 (0.02) -0.17
8.6x10⁻⁵ 1.7x10⁻⁴ c 5.4x10⁻⁴ c
WORD Basic Reading -0.05 (0.02) -0.12
0.020 0.99 d 0.78 d
WORD Spelling e -4.47 (2.10) -0.11
0.034 0.95 d 0.68 d
WORD Reading Comprehension -0.03 (0.02) -0.07
0.17 0.18 d 0.13 d
CANTAB IED completed stage 8
1.00 (0.97-1.04) 0.76 0.33 0.43
Motor problems
1.09 (1.06-1.12) 2.6x10⁻⁹ 5.2x10⁻⁹ 6.7x10⁻⁷
Language problems
1.07 (1.04-1.10) 3.9x10⁻⁶ 7.8x10⁻⁶ 2.7x10⁻³ WISC-IV: Wechsler Intelligence Scale for Children version IV; WORD: Wechsler Objective Reading Dimensions; CANTAB IED: intra-extra dimensional shift task from the Cambridge
Neuropsychological Battery
Statistical threshold to account for multiple testing: p-value < 0.006; direction of effect across models is consistent unless otherwise stated
a Adjusted for IQ, age, gender and family socio-economic status
b Adjusted for IQ, age, gender, family socio-economic status and ADHD severity
c Not corrected for IQ
d Direction of effect opposite to that in in the unadjusted analysis
e Transformed

78
Secondary analysis of SCQ sub-domains
For each of the outcome variables showing a significant association with total SCQ score, additional
tests were performed to determine whether either of the SCQ sub-domains (social-communication
deficits or RRBs) showed an independent contribution to the observed association. Results are
shown in Table 4.3. After adjusting for covariates and accounting for multiple testing, it was found
that social-communication problems were associated with lower IQ and working memory (both in
terms of the Working Memory Index and the specific scores on the Digit Span subtest) above and
beyond variance shared with RRBs. Furthermore, RRBs independently predicted presence of motor
problems. Social-communication problems were also nominally associated with language
problems, although this result was non-significant after correcting for multiple testing.
Given that ADHD symptoms were also associated with total SCQ score, the independent
contributions of the SCQ sub-domains to these symptoms were also examined. After accounting for
age, gender, family SES and IQ, neither SCQ sub-domain showed an independent association with
inattentive traits (social-communication: β=0.08, p=0.069; RRBs: β=0.04, p=0.34). On the other
hand, RRBs were found to be independently associated with hyperactive-impulsive symptoms
(β=0.15, p=0.00054), while social-communication traits were not (β=0.07, p=0.10).
Sensitivity analyses
Excluding children with ID (N=85) did not alter the pattern of the observed results (see Table 4.4).
Similarly, splitting the sample into two groups based on SCQ score (using the threshold of ≥15;
N=433 with SCQ<15 and N=278 with SCQ≥15) gives the same pattern of results and direction of
effects as reported for the continuous analyses (see Table 4.5).

79
Table 4.3: Secondary analyses – multivariate regressions of ASD sub-domains in relation to significant outcomes
Outcome variable Sub-domain B (Std. Error) β OR (95% CI) p-value
WISC-IV full-scale IQ a S-C -0.58 (0.11) -0.22
2.9x10⁻⁷
RRBs 0.18 (0.29) 0.03 0.55
WISC-IV WMI a S-C -0.55 (0.13) -0.22
2.9x10⁻⁵
RRBs -0.07 (0.35) -0.01 0.84
WISC-IV Digit Span a S-C -0.10 (0.03) -0.19 2.3x10⁻⁴
RRBs 0.04 (0.07) 0.03 0.54
Motor problems S-C
1.04 (1.00-1.09) 0.056
RRBs 1.26 (1.12-1.41) 7.7x10⁻⁵
Language problems S-C
1.06 (1.01-1.11) 0.021
RRBs 1.05 (0.93-1.17) 0.43 Analyses adjusted for IQ, age, gender, family socio-economic status and ADHD severity.
a not corrected for IQ
Statistical threshold to account for multiple testing: p-value < 0.006
WISC-IV: Wechsler Intelligence Scale for Children version IV; WMI: Working Memory Index; S-C: Social-communication; RRBs: Restrictive and repetitive behaviours

80
Table 4.4: Associations of Social Communication Questionnaire with cognitive and developmental outcomes, excluding those with ID (N=85)
Outcome variable Unadjusted (max N=626)
Adjusted a
(max N=514) Adjusted b
(max N=514)
B (Std. Error) β OR (95% CI) p-value p-value p-value
WISC-IV full-scale IQ -0.26 (0.07) -0.15
3.2x10⁻⁴ 0.002 c 0.0022 c
WISC-IV Digit Span subtest -0.04 (0.02) -0.11
0.018 0.044 c 0.035 c
WORD Basic Reading -0.04 (0.02) -0.10
0.05 0.83 d 0.99 d
WORD Spelling e -3.46 (2.19) -0.08
0.11 0.91 d 0.84 d
WORD Reading Comprehension -0.02 (0.02) -0.05
0.32 0.32 d 0.27 d
CANTAB IED completed stage 8
0.98 (1.06-0.98) 0.23 0.32 0.23
Motor problems
1.06 (1.13-1.06) 5.7x10⁻⁸ 4.9x10⁻⁶ 8.8x10⁻⁵
Language problems
1.03 (1.10-1.03) 1.4x10⁻⁴ 7.3x10⁻³ 0.012
WISC-IV: Wechsler Intelligence Scale for Children version IV; WORD: Wechsler Objective Reading Dimensions; CANTAB IED: intra-extra dimensional shift task from the Cambridge
Neuropsychological Battery
Statistical threshold to account for multiple testing: p-value < 0.006; direction of effect across models is consistent unless otherwise stated
a Adjusted for IQ, age, gender and family socio-economic status
b Adjusted for IQ, age, gender, family socio-economic status and ADHD severity
c Not corrected for IQ
d Direction of effect opposite to that in in the unadjusted analysis
e Transformed

81
Table 4.5: Social Communication Questionnaire score as a binary predictor of cognitive and developmental outcomes
Outcome variable
Unadjusted (max N=711) Adjusted a
(max N=599) Adjusted b
(max N=599)
B (Std. Error) β OR (95% CI) p-value p-value p-value
WISC-IV full-scale IQ -5.76 (1.11) -0.20
2.6x10⁻⁷ 1.3x10⁻⁵ c 1.9x10⁻⁵ c
WISC-IV Digit Span subtest -0.92 (0.26) -0.16
3.6x10⁻⁴ 7.3x10⁻⁴ c 6.8x10⁻⁴ c
WORD Basic Reading 0.00 (0.00) -0.02
0.62 0.067 d 0.044 d
WORD Spelling e -0.10 (0.16) -0.03
0.55 0.15 d 0.091 d
WORD Reading Comprehension 0.00 (0.00) -0.01
0.79 0.025 d 0.019 d
CANTAB IED completed stage 8
0.51 (1.40-0.51) 0.51 0.84 0.72
Motor problems
1.49 (3.10-1.49) 4.3x10⁻⁵ 1.3x10⁻³ 4.5x10⁻³
Language problems
1.54 (3.29-1.54) 3.1x10⁻⁵ 2.3x10⁻³ 2.9x10⁻³
WISC-IV: Wechsler Intelligence Scale for Children version IV; WORD: Wechsler Objective Reading Dimensions; CANTAB IED: intra-extra dimensional shift task from the Cambridge
Neuropsychological Battery
Statistical threshold to account for multiple testing: p-value < 0.006; direction of effect across models is consistent unless otherwise stated
a Adjusted for IQ, age, gender and family socio-economic status
b Adjusted for IQ, age, gender, family socio-economic status and ADHD severity
c Not corrected for IQ
d Direction of effect opposite to that in in the unadjusted analysis
e Transformed

82
4.5 Discussion
The aim of the analyses in this chapter was to determine whether, in children with a diagnosis of
ADHD, ASD traits index severity of phenotype in terms of cognitive and developmental features. As
measured using the SCQ, ASD traits in this sample (mean=13.0, SD=6.6) were lower than previously
reported in children ascertained primarily in terms of a diagnosis of ASD (mean=22.3 (Berument et
al., 1999)). This is consistent with what would be expected given that this sample is comprised of
children with ADHD and those with a clinician’s diagnosis of ASD were not included. Furthermore,
this mean is higher than previously reported in typically developing children (mean=3.89, SD=2.77
(Mulligan et al., 2009a); mean=2.8, SD=2.1 (Kochhar et al., 2011)) and somewhat higher than
reported for other ADHD samples (mean=8.5, SD=6.2 (Mulligan et al., 2009a); mean=11.6, SD=5.5
(Kochhar et al., 2011)). Although not a direct comparison, the higher SCQ traits in the current
sample relative to previously reported scores in controls are consistent with the many previous
observations of high levels of comorbidity between ADHD and ASD (Ghaziuddin et al., 1998;
Lichtenstein et al., 2010; Reiersen et al., 2008a; Ronald et al., 2008; Simonoff et al., 2008; Stahlberg
et al., 2004; Thede & Coolidge, 2007; Yoshida & Uchiyama, 2004).
As predicted, the results suggest that ASD traits within children with ADHD (even when known ASD
cases are not included) are associated with a more severe phenotype in terms of several cognitive
and developmental features. Firstly, in line with previous research, higher SCQ scores predicted
greater severity of ADHD symptoms (Grzadzinski et al., 2011; Kröger et al., 2011). The results also
showed that higher SCQ scores were associated with lower cognitive ability (specifically, lower IQ
and impairments in working memory) and a greater rate of general developmental (motor and
language) problems. This pattern of results persisted even after taking into account potential
confounding effects of age at assessment, IQ (where appropriate), gender and family
socioeconomic status. Results were also not found to be driven by severity of ADHD itself. These
results lend strength to the assertion that ASD symptoms are independently associated with these

83
cognitive and developmental difficulties, rather than simply being a proxy marker of ADHD
symptom severity.
Although more working memory deficits were predicted by increasing SCQ scores, there was no
association between SCQ scores and whether children were able to successfully complete the extra-
dimensional shift component of the IED CANTAB task, a further measure of executive functioning.
Although previous studies have shown that un-medicated children with ADHD and children with
ASD perform less well on this aspect of the IED task than controls (Hughes et al., 1994; Kempton et
al., 1999; Rhodes et al., 2005; Yerys et al., 2009a), the current results suggest that ASD traits in
ADHD do not index a greater deficit in set-shifting. A previous study utilising the IED task indicates
that children with a joint diagnosis of ADHD and ASD may struggle more on this task than children
with ASD without ADHD but the study detected no differences in the performance of children with
ADHD without ASD compared to the other groups, except that they took longer to complete the
task (Sinzig et al., 2008a). Executive functioning is a broad construct and the current results suggest
that different aspects of executive functioning (e.g. working memory and set-shifting) need to be
considered separately, as they may show differential association with ASD traits in the context of
ADHD.
Although no associations were found between reading and spelling and SCQ scores, the WORD was
only assessed in children between 5-11 years old (N=375). Similarly, the CANTAB IED task was only
available for a proportion of the children (N=252), which may have reduced the power to detect
potential effects. The measures of general motor and language development were broad screening
questions indicative of developmental problems rather than detailed validated measures, which
precluded the assessment of more subtle associations of ASD symptoms with general
development.
Secondary analyses were performed to determine the relative contributions of the two SCQ sub-
domains (social-communication deficits and RRBs) to observed main associations. It was found that

84
the sub-domain of social-communication was driving the main associations of SCQ with IQ and
working memory. This finding is plausible, given that performance on a cognitive task such as the
WISC-IV, which is administered by a psychologist, requires the ability to communicate successfully
in order to understand and comply with task instructions. Associations were also observed between
the sub-domain of RRBs and hyperactive-impulsive symptoms, as well as motor problems. The
results suggest that RRBs in children with ADHD, as assessed by the SCQ, may index a more general
dysfunction of motor processes (i.e. hyperactivity, impulsivity and motor problems in the form of
late onset walking and clumsiness). These results also support the observed overlap of hyperactive-
impulsive symptoms and RRBs reported in chapter 3 of this thesis (Martin et al., 2013), although the
analyses were performed in the same sample and therefore would benefit from replication and
further exploration in other large samples of children with ADHD.
The independent associations of social-communication difficulties and RRBs with several of the
cognitive and developmental outcomes further support research which suggests that these
dimensions are distinct (Happé & Ronald, 2008). Previous research has shown that symptoms in
both sub-domains contribute to the higher SCQ scores in children with ADHD, when compared to
their unaffected siblings and typically developing controls (Mulligan et al., 2009a), although a
smaller study found that this was only the case for social-communication problems but not RRBs,
when compared with typically developing controls (Kochhar et al., 2011).
An alternative approach to investigating the effects of comorbidity between ASD and ADHD is to
assess whether a sample of children ascertained primarily in terms of a diagnosis of ASD shows
similarly elevated comorbid and cognitive problems. Studies generally find that children with
ADHD+ASD have elevated ASD symptomatology and lower IQ scores than children with ASD-only
(Gadow et al., 2006; Guttmann-Steinmetz et al., 2009, 2010; Holtmann et al., 2007; Yerys et al.,
2009b), although others do not (Frazier et al., 2001; Ghaziuddin et al., 2010). Thus it would seem

85
that, in general, ADHD problems in children with ASD also index a more severe phenotype and
cognitive problems, lending further support to the removal of the diagnostic exclusion in DSM-5.
It is not clear whether the SCQ has validity for ASD traits in ADHD in the same way that it does in
those with ASD and the general population, although that could easily also apply to assessment of
other forms of comorbid psychopathology in ADHD (e.g. conduct disorder). For instance, the item
on “complicated movements of the body” (part of the sub-domain of RRBs) may be interpreted as
referring to straightforward hyperactivity, an idea that has been proposed by others in general with
regards to parental reports of children’s behaviour (Kochhar et al., 2011; Reiersen, 2011). An analysis
of the properties of the SCQ in a sample of young people ‘at risk’ for ASD found that 25% of those
who screened false-positive for ASD went on to receive a diagnosis of ADHD or hyperkinetic
disorder (Chandler et al., 2007), but to date it has not been examined in detail as to whether the
SCQ has good discriminant validity of ASD symptoms in a population with ADHD specifically.
However, as shown in the factor analysis presented in chapter 3 of this thesis, the structure of the
SCQ is similar in children with ADHD to that found in children with ASD or in the general
population, with separate dimensions of social-communication deficits and RRBs (Martin et al.,
2013).
Given that children with ADHD and ASD show higher rates of ID, children were not excluded on the
basis of IQ so as not to lose clinically valuable information. Likely for historical reasons (Still, 1902),
children with ID have generally been excluded from ADHD research studies but not from ASD
research. It is important to note that the pattern of the results remained the same when ID cases
(N=85) were excluded, although the strength of the associations between SCQ scores with IQ and
working memory decreased below the p-value threshold for multiple testing. This suggests that
previous studies (Grzadzinski et al., 2011; Kochhar et al., 2011) may have not found an association
between lower IQ and presence of ASD traits in children with ADHD because of the exclusion of
children with IQ<70.

86
Some of the strengths of this analysis include the large sample size, assessment of ADHD using the
parent CAPA, a semi-structured interview, and a comprehensive assessment of cognition. This
analysis assessed ADHD using DSM-IV criteria that require excluding cases of ASD and therefore
children with a clinician’s diagnosis of ASD were not included. Although the continuous analysis of
SCQ scores can be viewed as a strength of the analytical approach, a limitation of the analysis is
that ASD scores were not assessed using standardised diagnostic tools such as the ADI-R (Lord et
al., 1994) or the Autism Diagnostic Observation Schedule (ADOS) (Lord et al., 1989). Other studies
of ASD traits in ADHD have excluded children over a certain threshold of ASD problems who are
then confirmed as having ASD on subsequent assessment, for example using the Parental Account
of Children’s Symptoms (Mulligan et al., 2009a). Thus, it is likely that some of the children with
particularly high SCQ scores in this sample would have a clinical diagnosis of an ASD if assessed
using standardised measures. It is worth noting that analysing the data using the SCQ as a binary
variable (i.e. dividing the children into groups based on the screening cut-off threshold used in the
literature (Berument et al., 1999)) and thus comparing children with total SCQ<15 to those with
SCQ score ≥15, gives the same pattern of results and direction of effects as reported for the
continuous analyses.
A further limitation of the analysis is that although parents were asked to withhold stimulant
medication for 24 hours prior to cognitive testing, a small proportion of parents (14.4%) reported
not following these instructions. However, this information could not be reliably used as a covariate
when examining the association of SCQ scores with the cognitive tests due to the high variability of
the types and dosages of medication the children took and, perhaps more importantly, the
variability in time of day the assessments took place (ranging from morning to evening).
Finally, a major limitation of this cross-sectional data is that without longitudinal follow-up it is not
possible to ascertain a causal direction of the observed associations between SCQ scores and the
cognitive and developmental outcomes.

87
Clinical implications and conclusions
Overall, the findings suggest that in children with ADHD, the presence of ASD traits (which are not
at a diagnostic level) indexes a more impaired phenotype, encompassing not only severity of ADHD,
but also general cognitive and working memory deficits, as well as motor and language
developmental delays. These findings corroborate and extend previous research (Grzadzinski et al.,
2011; Kröger et al., 2011; Mulligan et al., 2009a) and would benefit from subsequent replication with
other large samples. Ideally, a set of controls also assessed on all measures could be included in
future studies.
With the changes that DSM-5 have brought and ICD-11 is set to bring, clinical thinking and practice
are already moving beyond the restriction of precluding a dual diagnosis of ADHD and ASD. These
results further support this change and highlight the need for clinicians to acknowledge the strong
overlap of these neurodevelopmental traits in children. Clinicians may also need to consider levels
of social-communication difficulties and repetitive behaviours in children with ADHD who do not
meet diagnostic criteria for ASD, as these index higher levels of cognitive and developmental
problems. The presence of undiagnosed deficits in social-communication abilities may also have
implications for the effectiveness of medication and behavioural strategies aimed at ameliorating
ADHD symptoms. Addressing ASD symptoms in children with ADHD may have the potential to
improve the effect of ADHD interventions and their associated impairment.

88
Chapter 5
Genetic Risk for ADHD Contributes to Neurodevelopmental Traits in
the General Population
The work presented in this chapter has been published:
Martin, J., Hamshere, M. L., Stergiakouli, E., O’Donovan, M. C., & Thapar, A. (2014). Genetic Risk for
Attention Deficit Hyperactivity Disorder Contributes to Neurodevelopmental Traits in the General
Population. Biological Psychiatry, 76(8), 664-671.
The published article has been edited for this chapter in order to include additional results and
reduce the amount of repetition across chapter 2 and section 5.3. Please note however that this
chapter covers background information already dealt with in previous chapters.
Please see http://www.biologicalpsychiatryjournal.com/article/S0006-3223(14)00108-5/abstract for
the full published article.
5.1 Summary
ADHD can be viewed as the extreme end of traits in the general population. Epidemiological and
twin studies also suggest that ADHD frequently co-occurs with and shares genetic susceptibility
with ASD. The aims of this chapter were to determine whether a composite of common molecular
genetic variants, previously found to be associated with clinically-diagnosed ADHD, predicts ADHD
and ASD-related traits in the general population. Polygenic risk scores were calculated in the Avon
Longitudinal Study of Parents and Children (ALSPAC) population sample (N=8,229), based on a
discovery case-control genome-wide association study of childhood ADHD. Regression analyses
were used to assess whether polygenic scores predicted ADHD traits and also ASD-related
89
measures (pragmatic language abilities and social cognition) in ALSPAC. Polygenic risk scores were
also compared in males and females endorsing any (≥1) ADHD item (N=3,623). ADHD polygenic risk
scores showed a positive association with ADHD traits (hyperactive-impulsive: p=0.0039;
inattentive: p=0.037). ADHD polygenic risk was also negatively associated with pragmatic language
abilities (p=0.037), but not with social cognition (p=0.43). In children with a rating ≥1 for ADHD
traits, females had a higher polygenic risk score than males (p=0.003). These findings provide
molecular genetic evidence that risk alleles for the categorical disorder of ADHD influence
hyperactive-impulsive and attentional traits in the general population. The results further suggest
that common genetic variation that contributes to ADHD diagnosis may also influence ASD-related
traits, which at their extreme are a characteristic feature of ASD.
5.2 Introduction
ADHD is a highly heritable neurodevelopmental disorder. The disorder occurs more frequently in
males, with a male:female ratio of about 3-7:1 (Lahey et al., 1994; Polanczyk et al., 2007). Similarly
to other common disorders, the genetic architecture of ADHD is complex, with rare and common
variants involved (Stergiakouli et al., 2012). Whilst clinical diagnoses are defined categorically,
ADHD psychopathology can also be viewed dimensionally, with inattentive and hyperactive-
impulsive symptoms distributed continuously in the general population (Rodriguez et al., 2007).
Twin and epidemiological studies find that heritability estimates for dimensional ADHD are similar
across a variety of cut-off points (Larsson et al., 2011; Levy et al., 1997). This indicates that genetic
factors act throughout the full distribution of ADHD symptoms. However, the postulated
relationship between dimensional measures of ADHD in the population and clinical diagnoses has
not yet been confirmed at the level of molecular genetics.
In recent years, it has become clear that the boundaries between different neurodevelopmental and
psychiatric disorders are not clear cut, as exemplified by the observed clinical and genetic overlap
between ADHD and other disorders. Rates of co-occurrence are especially high for ADHD and ASD
(Rommelse et al., 2010). Studies of children with clinical diagnoses have found that large (>500kb),

90
rare (<1% frequency) copy number variants (CNVs) in ADHD show significant overlap with CNV loci
previously implicated in ASD (Williams et al., 2010, 2012), although a recent collaborative cross-
phenotype analysis found no clear common genetic overlap in diagnosed ADHD and ASD cases
(Smoller et al., 2013). ASD can also be viewed dimensionally (Constantino & Todd, 2003) and twin
studies find that ADHD and ASD traits share common genetic influences in the general population,
as well as at the quantitative extreme (Lichtenstein et al., 2010; Lundström et al., 2011; Polderman
et al., 2012; Reiersen et al., 2007; Ronald et al., 2010b, 2008; Taylor et al., 2012). This suggests that
genetic variants associated with ADHD diagnosis might also contribute to population variation in
ASD-related trait measures.
Previous research suggests that children clinically diagnosed with ADHD (N=452) differ from
controls (N=5,081) on the basis of a polygenic risk score, an aggregate score of thousands of
common alleles of very small effect which together index genetic risk for ADHD (Hamshere et al.,
2013a). In this chapter, I test the hypothesis that, en masse, common genetic variants that confer
risk for a clinical ADHD diagnosis are associated with ADHD traits in the general population.
Moreover, given the established clinical and genetic overlap between ADHD and ASD (Lichtenstein
et al., 2010; Reiersen et al., 2007; Ronald et al., 2008), I undertake analysis of the secondary
hypothesis that, en masse, ADHD common genetic variants are also associated with ASD-
related/social-communication traits in the general population.
5.3 Method
Target population sample – ALSPAC
This analysis used data from the Avon Longitudinal Study of Parents and Children (ALSPAC),
described in detail in section 2.2. Please refer back to that section for recruitment procedures,
general inclusion criteria and an overview of the measures used. Children were eligible for inclusion
in the present analysis if they had genome-wide data following quality control and available
phenotype data (N=5,495-5,661, depending on the measure).

91
Phenotypic measures
Data on ADHD traits were collected when participants were aged approximately 7 years and 7
months old, using the parent Development and Well-Being Assessment (DAWBA) (Goodman et al.,
2008). For each ADHD item, parents marked boxes to say whether their child showed the
behaviour; these were coded: 0 for “no”, 1 for “a little more than others” and 2 for “a lot more than
others”. A total ADHD trait score was calculated by summing these responses to give a possible
range of 0-36. Given the robust evidence that inattentive and hyperactive-impulsive ADHD traits
are separable symptom dimensions (Willcutt et al., 2012) (see also chapter 3), scores were also
calculated for these ADHD trait dimensions separately (with a possible range of 0-18 each).
Social-communication traits were assessed using the Social and Communication Disorders
Checklist (SCDC) (Skuse et al., 2005) and the pragmatic language scales of the Children’s
Communication Checklist (CCC) (Bishop, 1998). A quantitative measure of restricted, repetitive
behaviours was not available. Both the CCC and the SCDC have been shown to have good predictive
reliability for a clinical diagnosis of ASD in the ALSPAC sample (Steer et al., 2010). The SCDC
assesses social cognition and understanding, whereas the CCC pragmatic language scales measure
ability to use language in a social context.
The SCDC was assessed at the same time as the DAWBA ADHD measures. Parents were asked to
judge how much 12 descriptions applied to their child’s behaviour (see Appendix 2.3 for the list of
items). The responses were coded: 0 for “not at all true”, 1 for “sometimes true” and 2 for
“very/often true”. A total SCDC score was calculated by summing these responses (with a possible
range of 0-24).
An abridged version of the CCC was used to assess language abilities at the approximate age of 9
years and 7 months. Parents were asked to rate whether statements about their child were
“certainly true”, “somewhat true” or “not true”, which were coded as 0, 1 and 2, respectively (see
Appendix 2.4 for the list of items). The following sub-scales were summed to generate a pragmatic
language abilities score: inappropriate initiation, coherence, stereotyped conversation,

92
conversational context and conversational rapport. Sub-scale scores were based on 6-8 items each
(see Appendix 2.4 for details). The pragmatic language total score was obtained for children with
data available for each subscale. As the CCC measures language abilities, lower scores suggest
pragmatic language deficits.
Information on DSM-IV ADHD diagnoses is available based on the DAWBA at approximately age 7.
Data on ASD diagnoses are available based on clinical records, utilising a clinician’s diagnosis of
ASD (Williams et al., 2008). Scores on measures with <30% missing items were mean-imputed.
Genetic data
Quality control (QC) procedures for the sample are detailed in section 2.2 and Appendix 2.2. After
QC, genome-wide data were available for 500,527 SNPs for N=8,229 of the children in ALSPAC, of
whom N=4,213 (51.2%) were male.
Discovery clinical sample for generating ADHD polygenic risk scores
The analytic method described by the International Schizophrenia Consortium (ISC) (Purcell et al.,
2009) was used to identify ADHD risk alleles in a discovery GWAS from which polygenic risk scores
were derived in the ALSPAC individuals. A published GWAS (Stergiakouli et al., 2012) of British and
Irish clinic children with a confirmed DSM-IV research diagnosis of ADHD (N=727) and population
controls (N=5,081) was used as the primary discovery sample to define risk alleles. This clinical
sample was selected as the primary discovery sample as it is similar to the ALSPAC general
population in ethnicity and underwent similar diagnostic assessment procedures. The
ascertainment of DNA samples, QC procedures and GWAS results have been described in section
2.1 and Appendix 2.2. This discovery GWAS was based on 502,702 SNPs after QC.
Calculation of polygenic risk scores
The analysis was confined to autosomal SNPs. SNPs in relative linkage equilibrium (i.e. relatively
independent of one another) in the ALSPAC genome-wide data were selected using a sliding
window of 200 SNPs, moving it along the genome 5 SNPs at a time and dropping a SNP when the

93
pair-wise estimate of linkage disequilibrium (R2) exceeded 0.2, using the command (--indep-
pairwise 200 5 0.2) in the software PLINK (Purcell et al., 2007), giving a list of 101,200 SNPs.
Corresponding p-values, associated risk alleles and odds ratios were identified for the selected SNPs
in the GWAS discovery sample, if available. In line with previous studies (Hamshere et al., 2011,
2013a; Purcell et al., 2009; Ripke et al., 2011; Sklar et al., 2011), alleles that were more common in
cases than controls for SNPs showing evidence of association at the very relaxed threshold of p<0.5
in the discovery sample were considered risk alleles. These identified alleles were used to calculate a
polygenic risk score for each individual in ALSPAC, corresponding to the sum of the number of
score alleles (weighted by odds ratio) across the set of SNPs, using the PLINK command (--score),
with imputation of missing genotypes in PLINK (Purcell et al., 2007). The ADHD polygenic risk
scores were based on the 49,595 SNPs that were present in both sets of SNPs (i.e. in the pruned set
of 101,200 SNPs in the ALSPAC sample and in the set of 258,531 SNPs with p<0.5 in the clinical
ADHD sample). Scores were normally distributed in the ALSPAC sample (N=8,229). Polygenic risk
scores were also calculated at a variety of other p-value thresholds (p<1, p<0.4, p<0.3, p<0.2, p<0.1,
p<0.05, p<0.01) to test the sensitivity of observed results. Please see Table 5.1 for the number of
SNPs at each threshold. The polygenic risk scores were standardised using z-score transformations
(i.e. the mean of the sample was subtracted from each score and this was divided by the standard
deviation).
Table 5.1: Number of SNPs from the clinical ADHD discovery sample mapped to alleles & used
to calculate polygenic risk scores at each threshold
p-value threshold # of SNPs
p<1 96,554
p<0.5 49,595
p<0.4 40,060
p<0.3 30,542
p<0.2 20,746
p<0.1 10,687
p<0.05 5,417
p<0.01 1,193

94
Data analysis strategy
In the ALSPAC sample, children with ADHD or ASD diagnoses were compared with each other and
with the remainder of the sample on ADHD, SCDC and CCC traits, using t-tests. Females and males
were also compared. Analyses were conducted on the 8,229 ALSPAC children with full genetic data
available after all quality control.
Due to a strongly negatively-skewed distribution of the CCC pragmatic language data, variables
were transformed (ln x + 1) to make them normally distributed and linear regression analyses were
performed to test for association with ADHD polygenic risk scores. ADHD and SCDC traits were
highly positively-skewed, contained an excess of zero values and could not be transformed to
normality (see Figure 5.1 for raw variable distributions). Analysing such data using standard linear
regressions may yield biased estimates of parameters and increases Type I & II error rates (Karazsia
& van Dulmen, 2008; Zuur et al., 2009). The distribution of data was better explained by a negative
binomial than a Poisson distribution of simulated data with the same mean and N (see Figure 5.2).
Therefore, these data were analysed using zero-inflated negative binomial (ZINB) regression
models. Gender was included as a covariate in all regression models.
The ZINB model consists of two sub-models that allow for a distribution with an inflated number of
individuals with values of zero: a) logistic regression model of an unobserved dichotomous outcome
to predict who has a score=0 and who has a score>0 and b) negative binomial model of the
continuous outcome in those having a score≥0. Likelihood ratio tests were used to determine an
overall p-value for each ZINB model in comparison to a null model, which included gender but not
polygenic risk score. ZINB analyses were performed using Mplus version 7 (Muthén & Muthén,
1998).
For each association test, the amount of variance explained was calculated as the difference of
Nagelkerke pseudo-R2 in the full model, as compared with the null model. Given the non-
independence of the outcome variables, all results are interpreted using a significance threshold of
p<0.05.

95
Figure 5.1: Histograms of ADHD & social-communication traits in the ALSPAC sample
ADHD: attention deficit hyperactivity disorder; SCDC: Social and Communication Disorders Checklist; CCC: Children’s
Communication Checklist
Figure 5.2: Simulated data showing Poisson and negative binomial distributions
Simulations of an expected Poisson distribution (left) and a negative binomial distribution (right) in R, using the sample
size (N=5,661) and mean (4.9) of the total ADHD traits in the ALSPAC sample.

96
Given that previous analysis of polygenic risk scores for ADHD in a clinical sample of children with
ADHD showed that females had higher polygenic risk scores than males (Hamshere et al., 2013a), a
t-test was used to test whether polygenic risk scores in children rating positive for any (≥1) ADHD
trait in the target sample were significantly higher in females than males.
Where significant associations were observed, secondary analyses were performed to determine
whether the same associations could be detected for ADHD traits at a later time point (approximate
age 10 years and 8 months). Replication was sought using a second ADHD GWAS discovery sample,
that of the Psychiatric Genomics Consortium (PGC) (Neale et al., 2010a). This sample contained
2,064 trios, 896 cases and 2,455 control individuals from four individual studies. A total of 54 cases
(2% of the cases in this second discovery sample) overlapped with the main discovery sample but
could not be removed as only the summary statistics were available for this analysis. The polygenic
risk scores derived from this replication discovery sample were based on 47,226 SNPs.
5.4 Results
Sample phenotypic characteristics
Figure 5.3 presents descriptive statistics of the trait measures in children with no ADHD/ASD
(N=5,585), those diagnosed with ADHD (N=105), ASD (N=35) or both (N=8). Table 5.2 shows the
breakdown of the sample by diagnosis, including those with missing data. In those with data for
both measures, of the children with a diagnosis of ADHD, 7.1% also had a diagnosis of ASD and
36.4% of those with ASD also had ADHD; thus there were more children with both diagnoses than
would be expected by chance (Chi2=136.0, p=2.1x10⁻³¹).
Table 5.2: ADHD and ASD diagnoses in the sample
ASD
absent present missing Total
ADHD
absent 5,585 14 13 5,612
present 104 8 1 113
missing 2,133 21 350 2,504
Total 7,822 43 364 8,229

97
Figure 5.3: Mean z-scores of ADHD & social-communication outcomes, displayed by diagnostic
group
*Scores reversed; ADHD: attention deficit hyperactivity disorder; H-I: hyperactive-impulsive; I: inattentive; SCDC: Social
and Communication Disorders Checklist; CCC PL: Children’s Communication Checklist pragmatic language; Error bars
represent standard errors of the mean
As expected, ADHD trait levels were higher in children with a diagnosis of ASD than in those
without ADHD or ASD (hyperactive-impulsive: t(df)=13.0(5,527), p=2.9x10-38; inattentive:
t(df)=13.1(5,522), p=9.6x10-39). Children with ASD had lower levels of inattentive traits than children
with ADHD (t(df)=-3.5(128), p=0.0006) but did not differ significantly in terms of hyperactive-
impulsive traits (t(df)=-1.7(130), p=0.092).
Children with an ADHD diagnosis had significantly higher SCDC scores (t(df)=26.7(5,596), p=5.0x10-
148) and lower CCC pragmatic language scores (t(df)=-11.5(4,890), p=5.7x10⁻³⁰) than those without
ADHD or ASD, but had lower SCDC scores (t(df)=-2.5(129), p=0.016) and higher pragmatic language
ability scores (t(df)=6.2(108), p=1.2x10⁻⁸) than children with ASD. The ADHD and social-
communication outcomes were moderately correlated (see Table 5.3).

98
Table 5.3: Pearson correlation coefficients of ADHD and social-communication measures
ADHD HI ADHD I ADHD total SCDC
ADHD I 0.71
ADHD total 0.92 0.93
SCDC 0.65 0.58 0.66
CCC PL -0.51 -0.48 -0.53 -0.51
H-I: hyperactive-impulsive; I: inattentive; SCDC: Social and Communication Disorders Checklist; CCC PL: Children’s
Communication Checklist pragmatic language; All associations significant at p<0.001
As compared with males, females had lower scores for ADHD (hyperactive-impulsive: t(df)=-
12.5(5,659), p=2.7x10⁻³⁵; inattentive: t(df)=-13.1(5,654), p=1.9x10-38) and SCDC (t(df)=-9.5(5,651),
p=3.0x10⁻²¹) and higher CCC pragmatic language ability scores (t(df)=6.4(5,639), p=1.3x10⁻¹⁰).
Polygenic risk score analysis of ADHD and ASD-related/social-communication traits
Among children with any ADHD traits (≥1; N=3,623), females had a higher polygenic risk score than
males (t(df)=2.9(3,621), p=0.0033, Cohen’s d=0.098). This is not attributable to an overall population
difference on polygenic risk score by gender (t(df)=1.6(8,227), p=0.11). Gender was included as a
covariate in all further analyses.
Results of association analyses of ADHD polygenic risk scores with the ADHD and social-
communication outcomes are shown in Table 5.4. ZINB models show that ADHD polygenic risk
predicted ADHD total scores (R2=0.005, p=0.0026), hyperactive-impulsive traits (R2=0.002,
p=0.0039) and inattentive traits (R2=0.002, p=0.037). The ZINB models indicate that the association
signal comes from the zero-inflated part (part a) of the model for all ADHD outcomes.
To further explore the contribution of polygenic risk scores to ADHD trait levels, the population was
split into three arbitrary groups, based on increasing trait score: children who scored zero (N=2038),
those with low levels of ADHD (score=1-11; N=2817) and those with moderate-to-high levels of
ADHD (score≥12; N=806). ANOVA shows a significant group difference (F(df)=4.66(2), p=0.010) and
post-hoc tests revealed that children with no ADHD traits had a lower mean polygenic risk score
than those with ADHD scores of 1-11 (p=0.022) and also those with scores ≥12 (p=0.037). The
difference between the two other groups was not significant (p=0.80).
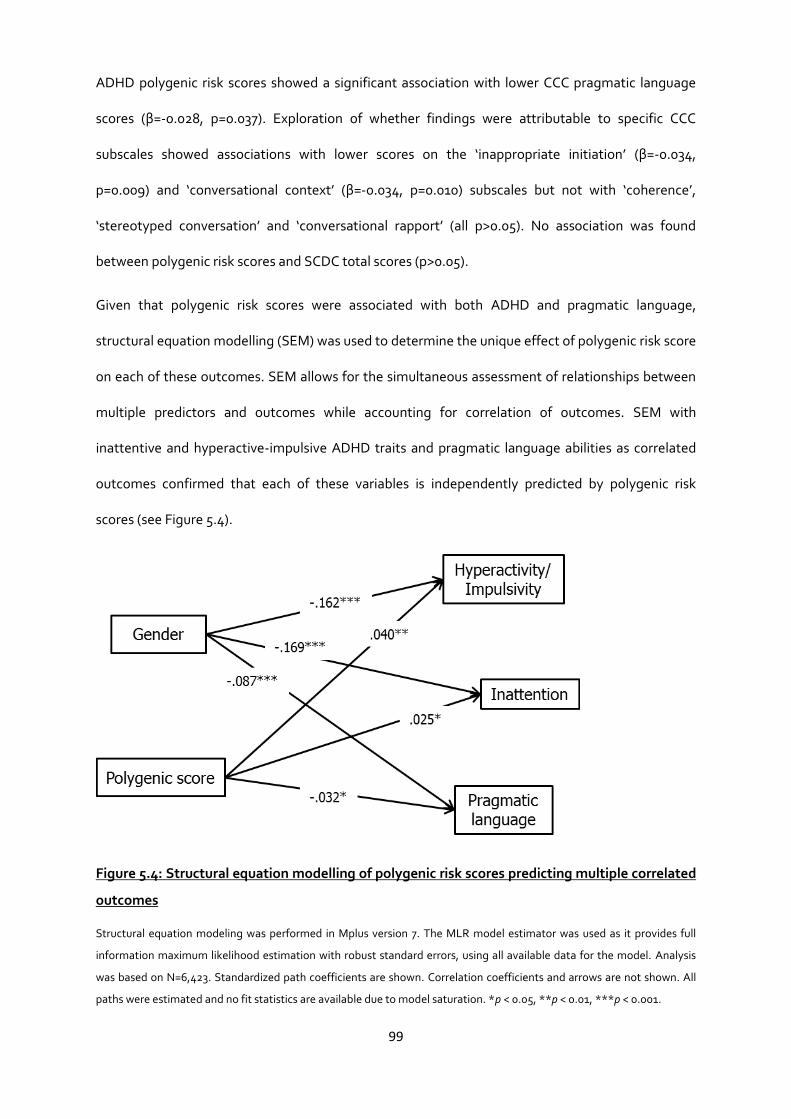
99
ADHD polygenic risk scores showed a significant association with lower CCC pragmatic language
scores (β=-0.028, p=0.037). Exploration of whether findings were attributable to specific CCC
subscales showed associations with lower scores on the ‘inappropriate initiation’ (β=-0.034,
p=0.009) and ‘conversational context’ (β=-0.034, p=0.010) subscales but not with ‘coherence’,
‘stereotyped conversation’ and ‘conversational rapport’ (all p>0.05). No association was found
between polygenic risk scores and SCDC total scores (p>0.05).
Given that polygenic risk scores were associated with both ADHD and pragmatic language,
structural equation modelling (SEM) was used to determine the unique effect of polygenic risk score
on each of these outcomes. SEM allows for the simultaneous assessment of relationships between
multiple predictors and outcomes while accounting for correlation of outcomes. SEM with
inattentive and hyperactive-impulsive ADHD traits and pragmatic language abilities as correlated
outcomes confirmed that each of these variables is independently predicted by polygenic risk
scores (see Figure 5.4).
Figure 5.4: Structural equation modelling of polygenic risk scores predicting multiple correlated
outcomes
Structural equation modeling was performed in Mplus version 7. The MLR model estimator was used as it provides full
information maximum likelihood estimation with robust standard errors, using all available data for the model. Analysis
was based on N=6,423. Standardized path coefficients are shown. Correlation coefficients and arrows are not shown. All
paths were estimated and no fit statistics are available due to model saturation. *p < 0.05, **p < 0.01, ***p < 0.001.

100
The amount of variance explained for all models was very small (R2≤0.005), although this estimate
does not reflect the true magnitude of the genetic overlap as it is highly sensitive to discovery
sample size (Purcell et al., 2009). Including the 10 EIGENSTRAT principal components as covariates
in the analyses to allow for population stratification did not affect the results (see Appendix 5.1).
Testing associations at age 10
Pearson correlation coefficients showed a strong association of ADHD traits from age 7 years to age
10 years (hyperactive-impulsive traits: N=4,757, r=0.71, inattentive traits: N=4,746, r=0.68. total
ADHD traits: N=4,751, r=0.74). The observed association between polygenic risk scores and ADHD
(at age 7 years) could also be seen at the later time point (age 10 years) for total ADHD traits
(R2=0.004, p=0.012) and hyperactive-impulsive traits (R2=0.003, p=0.039), with weak association
with inattentive traits (R2=0.002, p=0.055). See Table 5.5 for details. Among children with any
ADHD traits at age 10 (≥1; N=3,316), females had a higher polygenic risk score than males (t=2.35,
p=0.019, Cohen’s d=0.082).
Replication using second discovery sample
Polygenic risk scores based on the second discovery ADHD GWAS sample (Neale et al., 2010) were
not significantly associated with ADHD traits at age 7 (p>0.05) but did show an association at age 10
with total ADHD traits (R2=0.001, p=0.019) and hyperactive-impulsive traits (R2<0.001, p=0.018),
and a weak association with inattentive traits (R2<0.001, p=0.055); see Table 5.6. Polygenic risk
scores based on the second discovery sample also showed an association with the CCC
‘conversational context’ subscale (β=-0.031, p=0.017) but showed no association with the CCC
‘inappropriate initiation’ subscale (β=-0.006, p=0.37).
In children with ADHD trait scores≥1 at age 7, there was a trend for females to have a higher
polygenic risk score than males, calculated using this second discovery sample (t=1.80, p=0.071,
Cohen’s d=0.060). At age 10, females had significantly higher polygenic risk scores than males
(t=2.18, p=0.029, Cohen’s d=0.076).
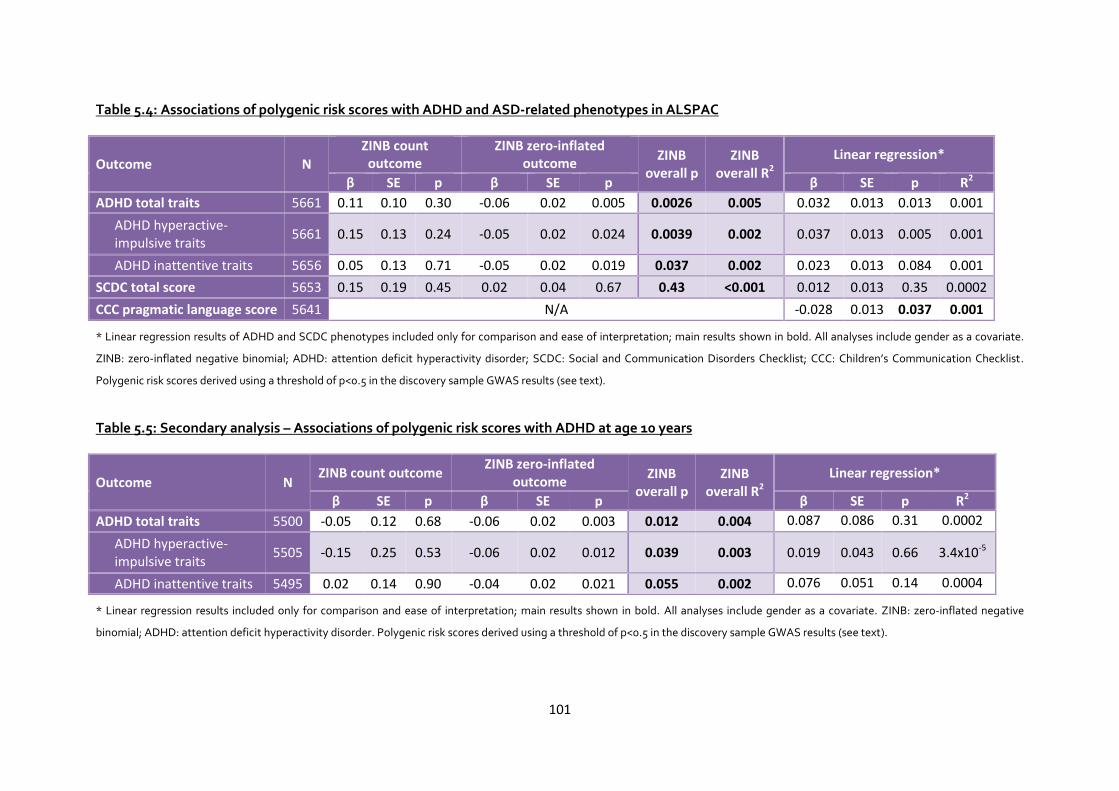
101
Table 5.4: Associations of polygenic risk scores with ADHD and ASD-related phenotypes in ALSPAC
Outcome N
ZINB count outcome
ZINB zero-inflated outcome
ZINB overall p
ZINB overall R2
Linear regression*
β SE p β SE p β SE p R2
ADHD total traits 5661 0.11 0.10 0.30 -0.06 0.02 0.005 0.0026 0.005 0.032 0.013 0.013 0.001
ADHD hyperactive-impulsive traits
5661 0.15 0.13 0.24 -0.05 0.02 0.024 0.0039 0.002 0.037 0.013 0.005 0.001
ADHD inattentive traits 5656 0.05 0.13 0.71 -0.05 0.02 0.019 0.037 0.002 0.023 0.013 0.084 0.001
SCDC total score 5653 0.15 0.19 0.45 0.02 0.04 0.67 0.43 <0.001 0.012 0.013 0.35 0.0002
CCC pragmatic language score 5641 N/A -0.028 0.013 0.037 0.001
* Linear regression results of ADHD and SCDC phenotypes included only for comparison and ease of interpretation; main results shown in bold. All analyses include gender as a covariate.
ZINB: zero-inflated negative binomial; ADHD: attention deficit hyperactivity disorder; SCDC: Social and Communication Disorders Checklist; CCC: Children’s Communication Checklist.
Polygenic risk scores derived using a threshold of p<0.5 in the discovery sample GWAS results (see text).
Table 5.5: Secondary analysis – Associations of polygenic risk scores with ADHD at age 10 years
Outcome N ZINB count outcome
ZINB zero-inflated outcome
ZINB overall p
ZINB overall R2
Linear regression*
β SE p β SE p β SE p R2
ADHD total traits 5500 -0.05 0.12 0.68 -0.06 0.02 0.003 0.012 0.004 0.087 0.086 0.31 0.0002
ADHD hyperactive-impulsive traits
5505 -0.15 0.25 0.53 -0.06 0.02 0.012 0.039 0.003 0.019 0.043 0.66 3.4x10⁻⁵
ADHD inattentive traits 5495 0.02 0.14 0.90 -0.04 0.02 0.021 0.055 0.002 0.076 0.051 0.14 0.0004
* Linear regression results included only for comparison and ease of interpretation; main results shown in bold. All analyses include gender as a covariate. ZINB: zero-inflated negative
binomial; ADHD: attention deficit hyperactivity disorder. Polygenic risk scores derived using a threshold of p<0.5 in the discovery sample GWAS results (see text).

102
Table 5.6: Replication analyses – Associations of polygenic risk scores based on second discovery sample with ADHD at both time points
Time Outcome N ZINB count outcome
ZINB zero-inflated outcome
ZINB overall p
ZINB overall
R2
Linear regression*
β SE p β SE p β SE p R2
age 7
ADHD total traits 5661 0.11 0.11 0.30 -0.02 0.02 0.338 0.20 0.001 0.023 0.13 0.052 0.001
ADHD hyperactive-impulsive traits
5661 0.05 0.10 0.58 -0.03 0.02 0.20 0.26 <0.001 0.020 0.013 0.12 0.0004
ADHD inattentive traits 5656 0.18 0.20 0.39 -0.02 0.02 0.44 0.17 <0.001 0.027 0.013 0.043 0.001
age 10
ADHD total traits 5500 0.27 0.24 0.26 -0.02 0.02 0.45 0.019 <0.001 0.26 0.087 0.003 0.002
ADHD hyperactive-impulsive traits
5505 0.30 0.39 0.44 -0.01 0.02 0.56 0.018 <0.001 0.13 0.043 0.003 0.002
ADHD inattentive traits 5495 0.29 0.33 0.38 -0.01 0.02 0.65 0.055 <0.001 0.13 0.052 0.015 0.001
* Linear regression results included only for comparison and ease of interpretation; main results shown in bold. All analyses include gender as a covariate. ZINB: zero-inflated negative
binomial; ADHD: attention deficit hyperactivity disorder. Polygenic risk scores derived using a threshold of p<0.5 in the discovery sample GWAS results (see text).

103
5.5 Discussion
As hypothesised, the analysis presented in this chapter found that ADHD polygenic risk scores,
based on common genetic variants previously found to be associated with risk of a clinical diagnosis
of ADHD (Stergiakouli et al., 2012), were also associated with ADHD traits measured at ages 7 and
10 years, in the general population. The importance of this finding is that it provides support at the
level of molecular genetics for the hypothesis that ADHD represents the extreme end of traits
present in the general population (Larsson et al., 2011; Levy et al., 1997). The results also support
the relevance of common genetic variants to ADHD (Stergiakouli et al., 2012), extending findings by
showing that they also act on non-clinical ADHD traits in a community sample.
The exploratory ANOVA results show that polygenic risk scores, which are derived from common
genetic variants relevant to clinical (i.e. severe) ADHD, predicted both low and high levels of ADHD
traits in the general population. The ZINB analysis suggested that the association signal between
polygenic risk scores and ADHD traits originates from the zero-inflated part of the model (i.e.
whether ADHD trait score was zero or non-zero). This result might be due to greater power at the
lower end of ADHD traits, as progressively fewer children have higher levels of ADHD traits.
Consistent with previous literature in clinical and general population samples (Gadow et al., 2006;
Lichtenstein et al., 2010; Lundström et al., 2011), children with a diagnosis of ADHD had more ASD-
related/social-communication problems than those without a diagnosis of ADHD or ASD, while
children with ASD had more ADHD traits than those without either diagnosis. Interestingly,
although children with ADHD had higher inattentive traits than those with ASD, levels of
hyperactive-impulsive traits in these two groups did not differ significantly. However, this could
have been due to low power as few children in ALSPAC had a clinical ASD diagnosis.
Results of the genetic analysis also suggest that risk alleles for ADHD may contribute to phenotypic
traits in the general population beyond core ADHD features. Polygenic risk scores previously found

104
to be associated with ADHD diagnosis were also nominally associated with pragmatic language
abilities in the general population, but not with social cognition traits, as indexed by SCDC scores.
Secondary exploratory analyses suggested that the association of ADHD polygenic risk scores with
pragmatic language scores was driven by scores on the ‘inappropriate initiation’ and ‘conversational
context’ subscales of the CCC. Some items in the ‘inappropriate initiation’ subscale may tap into
impulsive ADHD behaviours (in particular, the CCC item “he/she talks too much”) but items in the
‘conversational context’ subscale (e.g. “he/she can understand sarcasm” or “he/she says things
which are tactless or socially inappropriate”) have no apparent link with ADHD features. Overall, the
findings suggest that risk variants for ADHD may have pleiotropic effects on closely-related but
conceptually different neurodevelopmental traits in the general population. These findings also
support those from a twin study, which found that ADHD traits at age 8 shared genetic effects and
were most associated with ASD communication difficulties, rather than ASD social difficulties or
stereotyped behaviours (Taylor et al., 2012).
One possible advantage of the primary discovery ADHD sample used to derive risk alleles, over the
replication sample, is its similarity to the ALSPAC cohort in terms of ancestry and geography, but
nevertheless, the sample was relatively small (Stergiakouli et al., 2012). Analyses using a second,
larger ADHD sample (Neale et al., 2010a) show a partial replication of the primary analysis;
polygenic risk scores based on this sample predicted ADHD traits at age 10, though not at age 7.
Similarly, although polygenic risk scores derived from the second ADHD dataset predicted
pragmatic language problems, as assessed using the CCC ‘conversational context’ subscale, they
did not predict variation on the CCC ‘inappropriate initiation’ subscale. On the whole, these
replication results do suggest that the associations of ADHD polygenic risk scores with ADHD traits
and pragmatic language problems are robust. However, further replication is necessary to
conclusively rule out possible type I error. The results also further highlight the fact that absence of

105
clear individually associated loci in current GWAS studies of ADHD reflects inadequate power of the
GWAS samples rather than an absence of common susceptibility variants.
Although an association between ADHD polygenic risk scores and pragmatic language abilities was
found, there was no association with social cognition, as measured by the SCDC. A recent
collaborative cross-phenotype analysis suggests that common GWAS variants do not contribute to
the overlap in diagnoses of ADHD and ASD (Smoller et al., 2013). Nevertheless, twin evidence is
consistent in finding high heritability for neurodevelopmental trait measures and in showing shared
genetic influences on ADHD and ASD (Larsson et al., 2011; Levy et al., 1997; Lichtenstein et al.,
2010). Thus, it is too early to discount the contribution of common variants to the overlap of ADHD
and ASD, particularly in terms of continuously distributed traits. The current analysis points to a
possible overlap between susceptibility to clinically diagnosed ADHD and pragmatic language
difficulties at a trait level in the general population.
As expected, male children in ALSPAC had higher ADHD trait scores than females (Keen & Ward,
2004; Lichtenstein et al., 2010; Meltzer et al., 2000). However, a novel observation was that in the
group of children with any ADHD symptoms at either age, females had higher polygenic risk scores
than males. For polygenic risk scores based on the second discovery sample, there was a trend
towards similarly higher scores in females at age 7 and significantly higher scores were observed in
females at age 10 years. These results support the previous observation that in children diagnosed
with ADHD, females have higher polygenic risk scores than males (Hamshere et al., 2013a). One
limitation of the earlier study is that it was based on a clinical sample, so the gender difference may
have reflected referral bias (i.e. referred females may have, on average, had a more severe
phenotype). The present finding in an epidemiological sample argues against that, and suggests a
different liability threshold for females than males, with females requiring a more extreme load of
risk factors to manifest ADHD. This is consistent with non-molecular based studies; for example,
one study observed that siblings of females with ADHD have more ADHD symptoms than siblings
106
of males with ADHD (Rhee & Waldman, 2004). Similar findings have been reported in non-identical
twin children with ASD (Robinson et al., 2013).
A limitation of this analysis was that although the SCDC and CCC measures of social cognition and
pragmatic language are predictive of a clinical diagnosis of ASD in the sample (Steer et al., 2010),
they are not strictly measures of the specific deficits required for an ASD diagnosis. Moreover, there
was no reliable quantitative measure of restrictive and repetitive behaviours available. The finding
of an association between ADHD polygenic risk scores and pragmatic language deficits is
potentially also relevant to the new DSM-5 category of ‘Social Communication Disorder’ (Skuse,
2012).
As the ALSPAC cohort is longitudinal, the sample suffers from attrition. Previous studies have
determined that predictors of attrition include socioeconomic and pregnancy factors, as well as
presence of behavioural difficulties, including ADHD, in the child (Wolke et al., 2009). Assuming
that attrition results from the behavioural manifestation of genetic risk, resultant attrition bias is
likely to reduce the correlation between risk scores and traits. Multiple imputation methods have
been used previously for missing ALSPAC data but do not appear to alter association patterns
(Langley et al., 2012).
Due to the relatively small ADHD GWAS discovery sample sizes, power to detect susceptibility
variants is low and aggregate scores based on GWAS are likely to be based on a poor signal-to-noise
ratio (Neale et al., 2010a; Stergiakouli et al., 2012). This is a possible explanation for the relatively
small amount of phenotype variance explained by polygenic risk scores in the current study,
estimates of explained variance in this form of analysis being strongly affected by discovery sample
size. Another limitation of the current study is that a small number (N=54) of cases overlapped in
both discovery samples. Although p<0.5 is frequently used as a threshold for calculating polygenic
risk scores (Hamshere et al., 2011; Purcell et al., 2009; Ripke et al., 2011; Sklar et al., 2011), this is
largely a convention established on the basis of the optimal threshold in the early study of

107
schizophrenia which inspired the wider application of polygenic risk score analysis (Purcell et al.,
2009). As shown by modelling in that study, the optimal threshold depends on both genetic
architecture and sample size and therefore other thresholds have the potential to show greater
effects. A sensitivity analysis in the present study using a variety of p-value thresholds for
calculating polygenic risk scores demonstrated that observed effects are fairly consistent across
thresholds (see Appendix 5.2).
Conclusions
In the current study, polygenic risk previously found to be associated with clinical ADHD diagnosis
predicted inattentive and hyperactive-impulsive traits in a general population sample. The study
also indicates that common genetic variants associated with ADHD may also be associated with
pragmatic language ability in the general population, a trait measure that is distinct from the core
deficits of ADHD. The approach of testing genetic risks that contribute to dimensions that cut-
across diagnostic categories, rather than using DSM diagnoses, is in line with the Research Domain
Criteria (RDoC) framework (Insel et al., 2010), and is likely to be a valuable approach for future
neurodevelopmental and psychiatric research. As the power of GWAS increases, this method has
the potential to further explore the biological overlap of these traits.
108
Chapter 6
Neurocognitive Abilities in the General Population and Polygenic Risk
Scores for ADHD
The work presented in this chapter has recently been accepted for publication and is now in press:
Martin, J., Hamshere, M., Stergiakouli, E., O’Donovan, M. C., & Thapar, A. (2014). Neurocognitive
abilities in the general population and polygenic risk scores for attention deficit hyperactivity disorder.
Journal of Child Psychology and Psychiatry (Epub ahead of print]). doi:10.1111/jcpp.12336
The journal manuscript has been edited for this chapter in order to include additional results
(available as supplementary materials in the manuscript) and to reduce the amount of repetition
across chapter 2 and section 6.3 in this chapter. Please also note that this chapter repeats some
background information that has already been covered in previous chapters.
6.1 Summary
The genetic architecture of ADHD is complex, with rare and common variants involved. Common
genetic variants (as indexed by a polygenic risk score) associated with clinical ADHD significantly
predict ADHD and autistic-like behavioural traits in children from the general population,
suggesting that ADHD lies at the extreme of normal trait variation (as discussed in chapter 5).
ADHD and other neurodevelopmental disorders share neurocognitive difficulties in several domains
(e.g. impaired cognitive ability and executive functions). In this chapter, it was predicted that ADHD
polygenic risk scores derived from an independent clinical ADHD case-control genome-wide
association study (GWAS) will contribute to variation in neurocognitive abilities in the general
population. Children (N=6,832) from a UK population cohort, the Avon Longitudinal Study of

109
Parents and Children (ALSPAC) underwent neurocognitive testing. Parent-reported measures of
their children’s ADHD and autistic-like traits were used to construct a behavioural latent variable of
“neurodevelopmental traits”. Polygenic risk scores for ADHD were calculated for ALSPAC children
based on findings from a clinical ADHD GWAS. Structural equation modelling was used to assess
associations between ADHD polygenic risk scores and neurocognitive abilities (IQ, working
memory, inhibitory control and facial emotion recognition), as well as the latent
“neurodevelopmental trait” measure. The results confirmed that neurocognitive and
neurodevelopmental traits are correlated in children in the general population. Polygenic risk scores
for ADHD were independently associated with lower IQ (β=-0.05, p<0.001) and working memory
performance (β=-0.034, p=0.013), even after accounting for the relationship with latent
neurodevelopmental behavioural trait scores. No associations were found between polygenic risk
scores and inhibitory control or emotion recognition (p>0.05). These findings suggest that common
genetic variants relevant to clinically-diagnosed ADHD have pleiotropic effects on neurocognitive
traits as well as behavioural dimensions in the general population. This further suggests that the
well-recognised association between cognition and neurodevelopmental behavioural traits is
underpinned at a biological level.
6.2 Introduction
ADHD is a highly heritable neurodevelopmental disorder (Faraone et al., 2005). It is clear that the
genetic architecture of ADHD is complex, with common and rare variants involved (Neale et al.,
2010a; Stergiakouli et al., 2012; Williams et al., 2010; Yang et al., 2013). ADHD is strongly associated
with ASD and other neurodevelopmental disorders (Thapar et al., 2013). Twin studies also
demonstrate significant co-heritability across neurodevelopmental disorders and traits, including
ADHD and ASD (Lichtenstein et al., 2010; Ronald et al., 2008). These findings suggest that genetic
risk variants for ADHD are likely to contribute to multiple neurodevelopmental behavioural traits
and disorders. Indeed, there is an increased burden of rare copy number variants (CNVs) in ADHD,

110
which overlap more than expected by chance with regions implicated in other neurodevelopmental
conditions, such as ASD or schizophrenia (Lionel et al., 2011; Williams et al., 2010, 2012). However,
such CNVs are rare and so it is likely that other types of genetic variants also contribute to this
overlap.
There is evidence that commonly occurring genetic variants play a role in risk for ADHD. First, when
considered in aggregate (i.e. as a polygenic risk score), common risk alleles defined from a clinical
ADHD case-control genome-wide association study (GWAS) are higher in an independent set of
ADHD cases than in controls (Hamshere et al., 2013a). Second, common additive variants
collectively show moderate heritability for ADHD when estimated using the method of ‘genomic-
relationship-matrix restricted maximum likelihood’ (GREML) with genome-wide complex trait
analysis (GCTA) software (Lee et al., 2013; Yang et al., 2013).
The evidence is mixed so far in terms of possible overlap of common genetic risk variants across
ADHD and other disorders. One study found that common risk alleles relevant to schizophrenia are
enriched in ADHD cases when compared with controls (Hamshere et al., 2013b). However, two
recent cross-disorder studies from the Psychiatric Genomics Consortium, found no overlap of
common variants across clinical samples of ADHD and ASD or schizophrenia (Lee et al., 2013;
Smoller et al., 2013). Nevertheless, these analyses are inconclusive as the ADHD and ASD samples
were substantially smaller than those available for adult disorders, which did show significant
overlap of risk alleles. Furthermore, in a general population cohort, polygenic risk for ADHD, using
scores derived from a clinical discovery sample, predicted ADHD and social-
communication/autistic-like behavioural traits, as described in chapter 5 (Martin et al., 2014). On
the whole, previous studies suggest that common genetic variants may show some pleiotropic
effects on different neurodevelopmental behavioural traits, both in clinical cases and in the general
population.

111
Neurocognitive problems
Children affected by ADHD often have multiple, prominent neurocognitive difficulties. These affect
a range of domains, notably involving global cognitive ability (Frazier et al., 2004) and executive
functioning, such as response inhibition and working memory (Willcutt et al., 2008), as well as
aspects of social cognition, such as facial emotion recognition (Collin et al., 2013; Uekermann et al.,
2010). Like ADHD, these neurocognitive domains are heritable (Ando et al., 2001; Deary et al.,
2009; Rommelse et al., 2011). There is also evidence suggesting that difficulties in these domains
share familial and genetic risks with ADHD (Bidwell et al., 2007; Kuntsi et al., 2004; Schachar et al.,
2005). Moreover, difficulties in these domains are not unique to ADHD, but rather these deficits are
also strongly associated with other neurodevelopmental disorders, including ASD and
schizophrenia (Fett et al., 2011; Matson & Shoemaker, 2009; Uljarevic & Hamilton, 2012; Willcutt et
al., 2008). It is not yet known whether common genetic variants relevant to clinical ADHD also
contribute to neurocognitive abilities, typically assessed through task-based performance, in the
general population.
The aim of the current chapter was to examine whether a polygenic risk score based on case-control
GWAS findings for clinical ADHD influences general cognitive ability, executive functioning and
social cognition in children from the general population. It was hypothesised that polygenic risk
scores would predict lower neurocognitive abilities in these domains. A secondary aim was to test
whether observed associations were independent of associations between neurocognitive abilities
and neurodevelopmental behavioural traits, specifically, parent-reported ADHD and social-
communication behavioural traits in this sample, expanding on the analyses presented in chapter 5
(Martin et al., 2014).

112
6.3 Method
Target population sample – ALSPAC
This analysis used data from the Avon Longitudinal Study of Parents and Children (ALSPAC),
described in detail in section 2.2. Please refer back to that section for recruitment procedures,
general inclusion criteria and an overview of the measures used. Children were eligible for inclusion
in the present analysis if full data (phenotypic and genotypic) were available (up to N=5,641-6,832
children, depending on the outcome variables).
Neurocognitive task measures
ALSPAC families were invited to attend a “Focus” clinic when the children were aged approximately
8.5 years old, where they underwent neuropsychological testing. A short form of the WISC-III
assessment was employed to obtain an estimate of full scale IQ (Wechsler, 1992). In addition to this,
the WISC-III Digit Span task was administered to obtain a measure of verbal working memory.
Cognitive inhibitory control was assessed using the Opposite Worlds task from the Tests of
Everyday Attention for Children battery (Robertson et al., 1996). The mean time taken to complete
the control condition (Same Worlds trials) was subtracted from the mean time for the experimental
condition (Opposite Worlds trials). The resulting scores were skewed and were transformed
(1/square root of score) to be normally distributed. Facial emotion recognition was assessed using a
computerised version of the faces subtest of the Diagnostic Analysis of Nonverbal Accuracy
(DANVA) (Nowicki & Duke, 1994). The task comprised four emotion types (happy, sad, angry or
fearful) shown at high (easy condition) and low (hard condition) intensities. The total number of
errors made on the 12 low emotional intensity faces (normally distributed) was used for analysis.
In addition to these four measures (IQ, working memory, cognitive inhibitory control and facial
emotion recognition), the Counting Span Task, another measure of working memory, was
administered at the approximate age of 10.5 years. The measure used was a computer-generated
normally distributed ‘global score’, corresponding to the number of correct trials.

113
Parent-reported measures of ADHD and social-communication
Measures of ADHD and social-communication assessed at a similar time to the neurocognitive
measures were included in analyses as these were previously found to be associated with ADHD
polygenic risk scores, as described in chapter 5 (Martin et al., 2014). Total ADHD inattentive and
hyperactive-impulsive traits were calculated by summing the relevant items from the parent
Development and Well-Being Assessment (DAWBA) administered at approximately 7.5 years old
(Goodman et al., 2008). Social-communication traits were assessed using the Social and
Communication Disorders Checklist (SCDC) at the same age (Skuse et al., 2005), as well as the
pragmatic language scales of the Children’s Communication Checklist (CCC) at approximately 9.5
years (Bishop, 1998). CCC pragmatic language scores were transformed (ln x + 1) and reversed so
that higher scores meant more difficulties (to ease interpretation of the results).
Genetic data
A total of 9,912 ALSPAC children were genotyped. After quality control (QC), genome-wide data for
500,527 single nucleotide polymorphisms (SNPs) were available for N=8,229 of the children, of
whom N=4,213 (51.2%) were male. Details of QC procedures can be found in section 2.2 as well as in
Appendix 2.2.
The results of a published GWAS of British and Irish children with a diagnosis of ADHD (N=727) and
population controls (N=5,081) were utilised as the discovery sample (Stergiakouli et al., 2012). The
QC procedures, ascertainment of these samples and GWAS results have been described in section
2.1 and Appendix 2.2. This GWAS was based on 502,702 SNPs after QC. Polygenic risk scores were
calculated for each ALSPAC child using PLINK (Purcell et al., 2007), based on the results of the
above GWAS discovery sample, as described previously; see chapter 5 (Martin et al., 2014). In brief,
SNPs in approximate linkage equilibrium in the ALSPAC data were identified using PLINK, with
SNPs exceeding a threshold of R2≥0.2 excluded. As in chapter 5, the primary tests of the hypotheses
were based on risk alleles enriched (at p<0.5) in ADHD cases in the discovery GWAS. This list of risk

114
alleles and corresponding odds ratios was used to calculate a polygenic risk score for each individual
in ALSPAC, corresponding to the sum of the number of score alleles (weighted by odds ratio) across
the set of SNPs, using the PLINK command: --score. Polygenic risk scores were also calculated at a
variety of other p-value thresholds (p<1, p<0.4, p<0.3, p<0.2, p<0.1, p<0.05, p<0.01) to test the
sensitivity of observed results. The polygenic scores were standardised using z-score
transformations.
Data analysis
Pearson correlations were used to examine associations between performance on the
neurocognitive measures and parent-reported ADHD and social-communication traits. Females and
males were compared in terms of neurocognitive phenotypes, using a t-test. The neurocognitive
measures were standardised using z-score transformations. Analyses were performed using Stata
version 13.0 (StataCorp, 2013).
The main analysis was conducted in several steps. First, linear regression analyses were used to test
for associations between polygenic risk scores and each of the neurocognitive measures, after
controlling for the effect of gender.
Next, given the results of chapter 5 of this thesis showing that ADHD polygenic risk scores predict
both parent-reported ADHD and social-communication traits (Martin et al., 2014), confirmatory
factor analysis was used to derive a ‘neurodevelopmental difficulties’ latent variable. This variable
was based on parent-reported ADHD inattentive and hyperactive-impulsive traits, as well as CCC
pragmatic language and SCDC social cognition scores. Goodness of fit of the latent variable model
was assessed using the Root Mean Square Error of Approximation (RMSEA), Comparative Fit Index
(CFI) and Tucker-Lewis Index (TLI) fit statistics. Acceptable model fit was indicated by an RMSEA fit
statistic ≤0.06 and CFI and TLI statistics >0.95 (Hu & Bentler, 1999). Multiple indices were used as
this provides a more comprehensive evaluation of model fit.
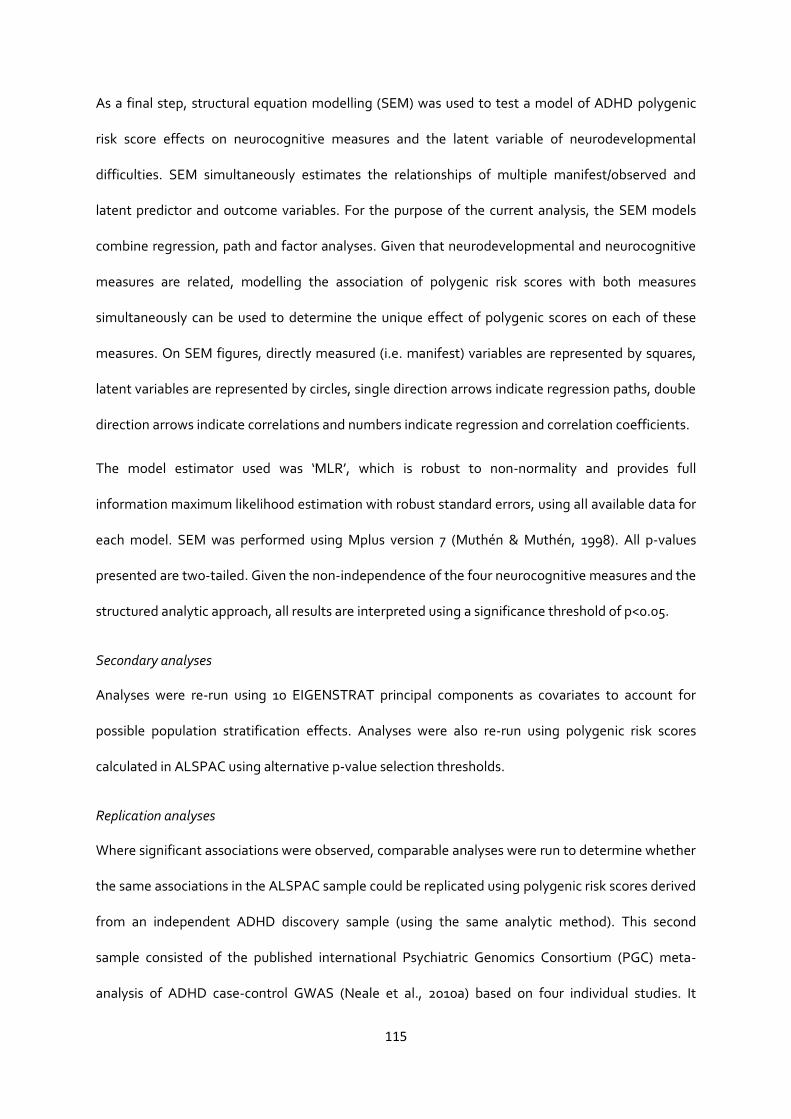
115
As a final step, structural equation modelling (SEM) was used to test a model of ADHD polygenic
risk score effects on neurocognitive measures and the latent variable of neurodevelopmental
difficulties. SEM simultaneously estimates the relationships of multiple manifest/observed and
latent predictor and outcome variables. For the purpose of the current analysis, the SEM models
combine regression, path and factor analyses. Given that neurodevelopmental and neurocognitive
measures are related, modelling the association of polygenic risk scores with both measures
simultaneously can be used to determine the unique effect of polygenic scores on each of these
measures. On SEM figures, directly measured (i.e. manifest) variables are represented by squares,
latent variables are represented by circles, single direction arrows indicate regression paths, double
direction arrows indicate correlations and numbers indicate regression and correlation coefficients.
The model estimator used was ‘MLR’, which is robust to non-normality and provides full
information maximum likelihood estimation with robust standard errors, using all available data for
each model. SEM was performed using Mplus version 7 (Muthén & Muthén, 1998). All p-values
presented are two-tailed. Given the non-independence of the four neurocognitive measures and the
structured analytic approach, all results are interpreted using a significance threshold of p<0.05.
Secondary analyses
Analyses were re-run using 10 EIGENSTRAT principal components as covariates to account for
possible population stratification effects. Analyses were also re-run using polygenic risk scores
calculated in ALSPAC using alternative p-value selection thresholds.
Replication analyses
Where significant associations were observed, comparable analyses were run to determine whether
the same associations in the ALSPAC sample could be replicated using polygenic risk scores derived
from an independent ADHD discovery sample (using the same analytic method). This second
sample consisted of the published international Psychiatric Genomics Consortium (PGC) meta-
analysis of ADHD case-control GWAS (Neale et al., 2010a) based on four individual studies. It

116
consisted of 2,064 trios, 896 cases and 2,455 control individuals and 1,206,461 SNPs after quality
control.
6.4 Results
Phenotypic relationships
Table 6.1 shows Pearson correlation coefficients for associations between each neurocognitive
measure and ADHD and social-communication trait scores. All correlations are significant
(p<0.001), although coefficients are low to modest.
Out of the 4 neurocognitive measures, males had lower working memory scores (age 8.5 years:
t(df)=-6.79(5,409), p=1.2x10⁻¹¹; age 10.5 years: t(df)=-2.30(5,271), p=0.022) and made more emotion
recognition errors (t(df)=4.46(5,105), p=8.3x10⁻⁶) than females. They did not differ from females in
terms of inhibitory control (t(df)=-1.78(5,313), p=0.075) or IQ (t(df)=0.68(5,513), p=0.50).
Table 6.1: Pearson correlation coefficients for the neurocognitive and neurodevelopmental
measures
IQ – 8.5
years
Working memory – 8.5 years
Working memory – 10.5 years
Inhibitory control – 8.5 years
Emotion recognition – 8.5 years
Working memory – 8.5 years
0.39
5,379
Working memory – 10.5 years
0.38 0.42
4,584 4,506
Inhibitory control – 8.5 years
0.21 0.11 0.17
5,236 5,133 4,446
Emotion recognition – 8.5 years
-0.16 -0.11 -0.10 -0.09
5,032 4,948 4,244 4,825
ADHD hyperactive-impulsive – 7.5 years
-0.16 -0.13 -0.09 -0.07 0.09
4,590 4,495 4,328 4,408 4,243
ADHD inattentive – 7.5 years
-0.21 -0.19 -0.16 -0.12 0.09
4,585 4,491 4,327 4,403 4,236
Social cognition – 7.5 years
-0.14 -0.11 -0.07 -0.05 0.10
4,589 4,497 4,329 4,406 4,241
Pragmatic language – 9.5 years
-0.25 -0.18 -0.15 -0.06 0.08
4,665 4,577 4,476 4,492 4,331
For each test, the Pearson coefficient is the top value and the sample N is the bottom value. All significant at p<0.001

117
Neurocognition and polygenic scores
After adjusting for gender, ADHD polygenic risk scores, derived from the primary discovery sample
(Stergiakouli et al., 2012), predicted lower IQ (N=5,515, β=-0.05, p=9.7x10⁻⁵, R2=0.0027) and lower
working memory abilities (N=5,411, β=-0.034, p=0.013, R2=0.0011). There were no associations with
inhibitory control (N=5,315, β=0.006, p=0.66) or emotion recognition (N=5,107, β=-0.004, p=0.76).
The confirmatory factor analytic/latent variable model of inattentive, hyperactive-impulsive, social-
cognitive and pragmatic language traits showed moderately good fit (see Figure 6.1). Next, SEM
was used to simultaneously model the associations between ADHD polygenic risk scores, the latent
neurodevelopmental trait variable and the neurocognitive measures (IQ, working memory,
cognitive inhibitory control and facial emotion recognition), as well as the correlations between
these measures.
Figure 6.1: Confirmatory factor analytic/latent variable model of neurodevelopmental
outcomes
ND: Neurodevelopmental; N=6,434; Goodness of fit statistics: RMSEA=0.053, CFI=0.994, TLI=0.982

118
Model diagrams for IQ, working memory, inhibitory control and facial emotion recognition are
displayed in Figures 6.2 through 6.5, respectively. Model fit was satisfactory for all models (see
figure captions). The SEM results were consistent with the linear regression analyses, with higher
ADHD polygenic risk scores predicting lower IQ (β=-0.052, p<0.001, R2=0.003) and working memory
(β=-0.034, p=0.008, R2=0.001) and no associations with inhibitory control and facial emotion
recognition (p>0.05).
ADHD polygenic risk scores also predicted lower working memory abilities assessed using a
different measure (i.e. the global score of the Counting Span Task), assessed at a later time point, at
the approximate age of 10.5 years (β=-0.042, p=0.002, R2= 0.0018). SEM with the
neurodevelopmental difficulties latent variable showed a consistent result (β=-0.042, p=0.002,
R2=0.002); see Figure 6.6.
Figure 6.2: Association between polygenic risk scores with IQ
**p<0.01, ***p<0.001; ND: Neurodevelopmental; N=6,832; RMSEA=0.053, CFI=0.974, TLI=0.952

119
Figure 6.3: Association between polygenic risk scores with working memory at age 8 years
**p<0.01, ***p<0.001; ND: Neurodevelopmental; Working memory assessed using the Digit Span test; N=6,827;
RMSEA=0.045, CFI=0.981, TLI=0.966
Figure 6.4: Association between polygenic risk scores with inhibitory control
a p<0.1, **p<0.01, ***p<0.001; ND: Neurodevelopmental; N=6,823; RMSEA=0.031, CFI=0.991, TLI=0.984
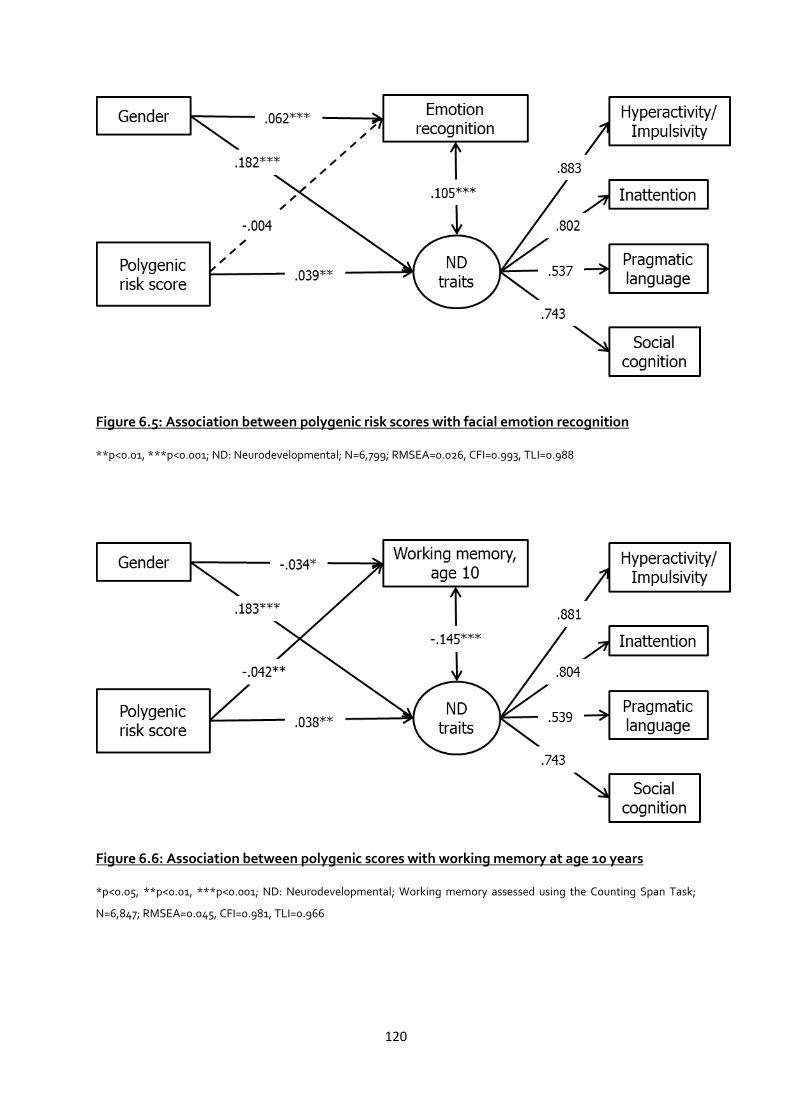
120
Figure 6.5: Association between polygenic risk scores with facial emotion recognition
**p<0.01, ***p<0.001; ND: Neurodevelopmental; N=6,799; RMSEA=0.026, CFI=0.993, TLI=0.988
Figure 6.6: Association between polygenic scores with working memory at age 10 years
*p<0.05, **p<0.01, ***p<0.001; ND: Neurodevelopmental; Working memory assessed using the Counting Span Task;
N=6,847; RMSEA=0.045, CFI=0.981, TLI=0.966

121
Secondary analyses
Given that polygenic risk scores were associated with both IQ and working memory and these
outcomes are correlated with each other, a model with both of these outcomes was examined next.
SEM including both IQ and working memory (at age 8.5 years) showed that these outcomes are
both independently predicted by ADHD polygenic risk scores (see Figure 6.7).
Figure 6.7: Associations between polygenic risk scores with IQ and working memory (age 8
years) as correlated outcomes
**p<0.01, ***p<0.001; ND: Neurodevelopmental; N=6,835; RMSEA=0.052, CFI=0.973, TLI=0.948
To test the sensitivity of the results with regards to inclusion of both ADHD and ASD traits in the
latent neurodevelopmental trait variable, analyses were re-run with ADHD inattentive and
hyperactive-impulsive traits as manifest outcome variables and omitting the measures of social-
communication. The pattern of results was the same as before (see Appendix 6.1).
To look at the effect of population stratification, additional analyses co-varied for 10 EIGENSTRAT
covariates; this did not affect the results (see Appendix 6.2). The pattern of results was consistent
across different selection thresholds for generating the polygenic risk scores (see Figure 6.8).

122
Figure 6.8: Associations of neurocognitive phenotypes with ADHD polygenic scores calculated based on the primary discovery sample, using a
variety of p-value thresholds (linear regressions)
WM: working memory; Main results are based on polygenic risk scores derived using a threshold of p<0.5 (striped bars).

123
As mentioned before, gender was entered as a covariate for all models. When analyses were instead
stratified by gender, the association between composite genetic risk scores and IQ was seen
separately for both females (β=-0.060, p=0.0011, R2=0.0038) and males (β=-0.045, p=0.023,
R2=0.0019), whereas the association with working memory at age 8 was only seen in females (β=-
0.041, p=0.031, R2=0.0017) and not males (β=-0.027, p=0.16, R2=0.0007).
Replication analyses
Polygenic risk scores derived from the published replication discovery data (Neale et al., 2010a) also
showed an association with lower IQ (β=-0.030, p=0.028, R2=0.0009) but did not show an
association with working memory at either time point (age 8: β=-0.018, p=0.18; age 10: β=-0.015,
p=0.27). Analysis using SEM showed the same pattern of results (see Figures 6.9 and 6.10, as well as
Appendix 6.3).
Figure 6.9: Association between polygenic risk scores (based on replication discovery sample)
with IQ
*p<0.05, ***p<0.001; ND: Neurodevelopmental; N=6,832; RMSEA=0.053, CFI=0.974, TLI=0.953

124
Figure 6.10: Association between polygenic risk scores (based on replication discovery sample)
with working memory
*p<0.05, ***p<0.001; ND: Neurodevelopmental; Working memory assessed using the Digit Span test; N=6,827;
RMSEA=0.045, CFI=0.982, TLI=0.967
6.5 Discussion
This study finds that common genetic risk variants which predict risk of clinical ADHD diagnosis and
which were previously found to predict parent-reported ADHD and social-communication
behavioural traits in the general population (described in chapter 5 (Martin et al., 2014)) are also
associated with lower IQ and working memory in children from the general population. ADHD
polygenic risk scores were not found to be associated with inhibitory control or facial emotion
recognition measures. The associations of ADHD polygenic risk scores with IQ and working memory
persisted even after taking into account associations with neurodevelopmental behavioural traits
(ADHD and social-communication) and were robust to sensitivity testing (across different p-value
selection thresholds for calculating the polygenic risk scores and when population covariates were
included). These results suggest that common genetic risk variants relevant to a clinical diagnosis of
ADHD may have effects on multiple neurocognitive abilities, as well as behavioural traits in the
general population.
125
The association between ADHD polygenic risk scores and working memory was also observed with
a different measure of working memory, assessed at a later time point (i.e. the Counting Span Task
at age 10 years). Polygenic risk scores based on changing the allele selection thresholds were also
consistently associated with both IQ and working memory problems at both time points.
Additionally, the observed association between ADHD polygenic risk scores and IQ was robust to
replication, using a second ADHD discovery dataset (Neale et al., 2010a). However, no association
was observed with either measure of working memory using polygenic risk scores derived from the
replication discovery data.
This inconsistency of results using the primary and replication discovery samples could theoretically
be attributable to potential differences in clinical or cognitive profiles between the two datasets
(Neale et al., 2010a; Stergiakouli et al., 2012). Alternatively, subtle differences in ancestry may have
contributed to this discrepancy; the primary discovery sample is more homogenous and ancestrally
more similar to the target ALSPAC sample than the replication sample, which was a meta-analysis
of multiple samples.
Furthermore, the effects that are observed are very small (R2≤0.0034), albeit they are comparable to
those reported in other studies using the polygenic risk score method (Anney et al., 2012; Hamshere
et al., 2013a). Effect sizes in this type of study are affected by the relatively small ADHD GWAS
discovery sample sizes, which have low power to detect susceptibility variants and thus a poor
signal-to-noise ratio, making it unlikely that the current analysis reflects the true magnitude of the
observed associations (Neale et al., 2010a; Stergiakouli et al., 2012). However, the possibility of a
false positive finding cannot be ruled out without additional replication.
As associations were observed only between ADHD polygenic risk scores and IQ and working
memory, but not inhibitory control and emotion recognition abilities, this suggests the possibility of
specific pleiotropic effects. Interestingly, in clinic children diagnosed with ADHD, increasing levels
of ASD traits are associated with lower IQ and more severe working memory difficulties, although

126
not with attentional flexibility, as described in chapter 4 (Cooper et al., 2014). The clinical study in
chapter 4 suggests that IQ and working memory problems may be a marker of additional
neurodevelopmental problems or phenotypic complexity in the context of an ADHD diagnosis. The
current analysis builds on this finding by suggesting that genetic risks for ADHD may be relevant to
lower IQ and working memory abilities in the general population, in addition to parent-reported
neurodevelopmental behavioural traits examined in chapter 5 (Martin et al., 2014). One possibility is
also that the Opposite Worlds task measure of inhibitory control and the DANVA measure of facial
emotion recognition are inadequate measures of these neurocognitive domains. This possibility is
supported by the relatively low correlation coefficients between these measures and ADHD and
ASD traits (please refer back to Table 6.1).
Although in general, the correlations between the neurocognitive abilities and ADHD and social-
communication traits were modest, the results from this general population sample are in keeping
with findings from clinical studies showing lower IQ, working memory, inhibitory control and
emotion recognition abilities in children with ADHD and other neurodevelopmental problems, such
as ASD (Frazier et al., 2004; Matson & Shoemaker, 2009; Uekermann et al., 2010; Uljarevic &
Hamilton, 2012; Willcutt et al., 2008). Furthermore, the magnitude of these results is consistent
with the known heterogeneity of neurocognitive abilities in children with ADHD; despite group
differences, when compared with controls, not all children with ADHD or other
neurodevelopmental problems experience these additional deficits (Nigg et al., 2005; Willcutt et al.,
2008).
The results also show that on a population level, there are average differences in neurocognitive
abilities between males and females, with males showing poorer working memory and emotion
recognition abilities. It is well known that neurodevelopmental problems are also more common in
males than females (Keen & Ward, 2004; Lichtenstein et al., 2010). However, the reasons for these
gender group differences are unclear. One theory suggests that males have a lower liability

127
threshold than females, which leads to them developing problems when exposed to a lower burden
of risk variants. This theory has some support in terms of clinical ADHD and ASD phenotypes
(Hamshere et al., 2013a; Rhee & Waldman, 2004; Robinson et al., 2013) but it is unknown whether it
could also explain observed gender differences in neurocognitive domains. Further work is needed
to explore the nature of these gender differences in neurocognitive abilities, particularly in the
context of neurodevelopmental problems.
Given the longitudinal nature of the ALSPAC sample and the associated non-random attrition
(Wolke et al., 2009), missing data were handled by using the ‘full information maximum likelihood’
(FIML) estimator in the SEM analyses. This approach maximised the use of all available data, in
contrast to using pairwise deletion. A sensitivity test showed that restricting the SEM analyses to
children who had complete data for each analysis, using listwise deletion, decreased the effect sizes
but otherwise did not alter the pattern of observed results (see Appendix 6.4).
One limitation of this study is that the neurocognitive tasks assessed in the ALSPAC sample around
ages 7-9 years (i.e. when the ADHD and social-communication measures were assessed), were not
specifically selected for previously showing familial effects with ADHD. Previous family and twin
studies have suggested that there are shared genetic effects between ADHD and measures of IQ,
working memory (as assessed by the WISC Digit Span test), inhibitory control (assessed using a
stop-signal reaction time task) and other cognitive measures not examined in the current study
(Bidwell et al., 2007; Kuntsi et al., 2004; Schachar et al., 2005). At present it is not known whether
some of the cognitive measures used in this study (i.e. the Opposite Worlds or DANVA tasks) share
genetic risks with ADHD.
Conclusion
Results in this general population study indicate that a polygenic score of common genetic risk,
previously found to be associated with clinical ADHD diagnosis, predicts lower general cognitive
ability and lower working memory in children in the general population. These genetic variants

128
appear to have pleiotropic effects, predicting the presence of behavioural traits and certain aspects
of neurocognitive performance in children. These results extend a growing body of literature
highlighting the importance of shared molecular genetic risk factors across multiple psychiatric and
psychological phenotypes.

129
Chapter 7
General Discussion
7.1 Summary of results
In this thesis, I first examined the presentation of ASD traits in a clinical sample of children
diagnosed with ADHD. In chapter 3, an exploratory factor analysis of ASD traits suggested that
social-communication difficulties and restrictive, repetitive behaviours (RRBs) are separate, albeit
correlated dimensions in children with ADHD. A further exploratory factor analysis of ASD and
ADHD traits in this sample indicated that there may be some overlap of hyperactive-impulsive
ADHD symptoms and RRBs, whereas separate dimensions of inattentive symptoms and social-
communication difficulties were observed. Analyses in chapter 4 showed that the severity of ASD
traits in children with ADHD is not only associated with the severity of ADHD symptoms but also
with lower cognitive and working memory abilities, as well as problems with early motor and
language abilities. Additional analyses suggested that the cognitive and working memory
difficulties were primarily associated with higher social-communication trait levels, while motor
problems and hyperactive-impulsive symptoms were primarily associated with higher levels of
RRBs. Together, the results of chapters 3 and 4 underscore the validity and importance of
considering both dimensions of ASD traits in children with ADHD, as these appear to present at
least partly independently of ADHD symptoms and may be markers of additional difficulties.
In the second half of this thesis, I aimed to determine whether common genetic risk variants
relevant to ADHD were associated with traits of ADHD and ASD as well as neurocognitive abilities
in children from the general population. The results of a case-control genome-wide association
study (GWAS) of the clinical ADHD sample used for the analyses in chapters 3 and 4 and additional
ADHD cases from collaborators (Stergiakouli et al., 2012) were used to derive a polygenic risk score
of common genetic variants relevant to ADHD in each individual in ALSPAC. Analyses in chapter 5

130
showed a significant association of ADHD polygenic risk scores with behavioural traits of
inattention, hyperactive-impulsive symptoms and social-communication difficulties at ages 7-10
years in the population sample. In chapter 6, these analyses were extended and results showed that
polygenic risk scores are also associated with task-based neurocognitive abilities (i.e. IQ and
working memory) in this same sample, even when associations with behavioural traits are taken
into account. Together, chapters 5 and 6 indicate that common genetic risk variants for ADHD show
a certain degree of pleiotropy and are relevant to both behavioural, parent-assessed
neurodevelopmental traits as well as performance-based measures of neurocognitive abilities.
7.2 Implications of the results
This thesis adds to the growing body of literature regarding the clinical and genetic overlap of
ADHD, ASD and other neurodevelopmental and cognitive domains. Firstly, the results support the
growing recognition that social-communication difficulties and RRBs are separate, albeit highly
related dimensions of symptoms (Mandy et al., 2012), which has recently prompted a change from
a triad to a dyad classification system of ASD symptoms in the DSM-5. The results build on previous
studies by suggesting that the nature of ASD traits is similar in the context of ADHD (chapter 3) to
that seen in samples of children diagnosed with ASD, as well as in the general population (Mandy &
Skuse, 2008; Shuster et al., 2014). Not only do ASD traits appear to split into these two correlated
dimensions in children with ADHD (chapter 3), but they also appear to index different additional
cognitive and developmental problems in these children (chapter 4). Thus these results also support
the removal of the exclusion for ADHD in the presence of ASD in DSM-5 and highlight that it is
important for clinicians to consider even sub-threshold social-communication problems and RRBs in
children with ADHD.
One unresolved issue raised in this thesis is the suggestion that there may be some overlap of
hyperactive-impulsive symptoms and RRBs. The exploratory factor analysis in chapter 3 supported
a factor model where these symptoms clustered together. Moreover, regression analyses in chapter

131
4 found that continuously measured hyperactive-impulsive symptoms and RRBs were significantly
associated, above and beyond the association of these traits with social-communication problems.
One possible explanation for these results stems from difficulties in measuring RRBs in children with
ADHD. For example, a few of the Social Communication Questionnaire (SCQ) items regarding RRBs
may be interpreted by parents as asking about general excessive activity, similar to some of the
hyperactive symptoms; for example the items: “Has he/she ever had any mannerisms or odd ways
of moving his/her hands or fingers, such as flapping, or moving his/her fingers in front of his/her
eyes?” or “Has he/she ever had any complicated movement of his/her whole body, such as spinning
or repeatedly bouncing up and down?”. Such methodological concerns need to be taken into
consideration for future studies examining RRBs in children with ADHD. Notably, factor analyses of
ADHD and ASD traits in community samples have not found this overlap of hyperactive-impulsive
symptoms and RRBs (Ghanizadeh, 2010; Ronald et al., 2014). However, it remains to be seen
whether these two dimensions of behaviours are particularly strongly related to one another when
considered at the extreme ends of their distributions (i.e. in clinical populations).
The focus of the second half of this thesis is on molecular genetic risk factors for ADHD in relation to
traits in the general population. Twin studies suggest that there is a high degree of genetic overlap
for ADHD and ASD traits, both at a clinical level, as well as in the full distribution of traits in the
general population (Lichtenstein et al., 2010; Reiersen et al., 2008a; Ronald et al., 2008; Taylor et
al., 2012). The results of chapter 5 support these studies at a molecular genetics level, suggesting
that common genetic risk variants relevant to ADHD diagnosis may also predispose to difficulties
with pragmatic language abilities, which at their extreme are an element of the social-
communication difficulties found in ASD. Interestingly, genetic analyses of these pragmatic
language abilities in the ALSPAC sample have estimated a significant heritability rate of about 18%
based solely on common, additive variants (St Pourcain et al., 2013). However, others have reported
no contribution of common additive variants to behavioural problems, including ADHD and ASD
traits, in a population sample of twin children (Trzaskowski et al., 2013). Further work is needed to

132
clarify the extent of the contribution of common additive variants to ADHD and ASD traits in the
population. Additional analyses are also needed to provide further evidence for the overlap of
common genetic variants for clinically-diagnosed ADHD and both clinical as well as non-clinical
levels of social-communication difficulties.
The results of chapter 5 further suggest that ADHD diagnosis is the extreme end of a continuous
distribution of traits in the population and that the underlying aetiology is related across this
distribution. This supports findings from twin studies estimating heritability rates for ADHD using
various cut-0ffs (Larsson et al., 2011; Levy et al., 1997). Several other, very recent studies have also
examined this issue in ADHD. One study found a contribution of ADHD genetic risk variants to
hyperactive-impulsive traits but not inattentive traits in a community sample (Asherson et al.,
2013). A second study (Groen-Blokhuis et al., 2014) utilised a more recent (unpublished) ADHD
GWAS meta-analysis as the discovery sample; this analysis was conducted by the Psychiatric
Genomics Consortium (PGC) and consisted of 9 ADHD samples totalling 5,621 clinical cases and
13,589 controls. This discovery GWAS was used to calculate polygenic risk scores in a Dutch
population sample of twins. Polygenic risk scores for ADHD were associated with increased levels of
attention problems as measured by the Child Behaviour Checklist and the Teacher Report Form
across ages 3-13 years (Groen-Blokhuis et al., 2014), lending further support to the findings in
chapter 5. A further recent study has shown that polygenic risk scores derived from a GWAS of
ADHD traits in the ALSPAC sample are associated with case status, as well as with increasing levels
of ADHD symptoms in children diagnosed with ADHD (Stergiakouli et al., 2014). Collectively these
studies suggest that the genetic architecture (at least in terms of common, additive variants) may
show similarities for diagnosis and traits of ADHD. However, this is not necessarily the case for
other conditions. For example, a recent study in ALSPAC using a comparable analytic approach
found that common genetic risk variants relevant to a clinical diagnosis of adult schizophrenia are
not associated with psychotic experiences in adolescence (Zammit et al., 2013). No studies have yet
assessed whether common genetic risk variants relevant to a diagnosis of ASD contribute to

133
pragmatic language abilities and other measures of ASD-like traits in general population samples. It
is also not known yet whether rare variants such as copy number variants (CNVs), which are
relevant to clinically-diagnosed ADHD and ASD (Elia et al., 2010; Glessner et al., 2009; Levy et al.,
2011; Lionel et al., 2011; Marshall et al., 2008; Pinto et al., 2010; Williams et al., 2010, 2012), also
play a role in ADHD and ASD traits in the general population.
The final results chapter of this thesis (chapter 6) extends the analyses presented in chapter 5 by
also examining polygenic risk scores for ADHD in relation to neurocognitive abilities in the general
population. The results support models where polygenic risk for ADHD is independently associated
with lower IQ, lower working memory and neurodevelopmental (ADHD and social-communication)
problems in the children. These results suggest that common, additive genetic variants contribute
to the shared genetic aetiology of behavioural ADHD and cognitive (e.g. IQ and working memory)
traits, which has been reported by family studies (Bidwell et al., 2007; Kuntsi et al., 2004). Other
researchers have also recently examined the shared genetic aetiology of cognitive problems and
psychiatric conditions using a comparable method to the one reported in this thesis (chapters 5 and
6). One study found some association of polygenic risk scores for ADHD with reaction time
variability in a clinical ADHD sample, though this was not found for another cognitive measure
(poor inhibition, as assessed by a high rate of commission errors) or in a community sample
(Asherson et al., 2013). Another study found that a polygenic risk score of common variants related
to cognitive ability was significantly lower in schizophrenia cases than in population controls (Lencz
et al., 2014), suggesting that there is overlap of common genetic variants predisposing to low
cognitive ability and schizophrenia. The results presented in this thesis thus are some of the first to
directly address the role of common, additive genetic variants in relation to behavioural
neurodevelopmental traits, as well as associated neurocognitive problems. On the whole, the
results demonstrate the validity of considering ADHD and ASD as continuously distributed
dimensions of traits both for clinical and genetic research.

134
7.3 Methodological considerations
Clinical and population samples
The data used for analyses in this thesis come from two distinct samples, which have different
strengths and limitations and can be used to address differing, albeit related research questions.
The clinical ADHD sample has the advantage of being representative of children presenting with
ADHD at child mental health services in the UK and therefore the results from analysing this sample
are relevant to clinical practice in the UK. The high prevalence of co-occurring difficulties in this
sample means that individual differences with regards to these difficulties can also be examined
with better power. A possible disadvantage of using this sample is the low level of variability in
ADHD symptoms, as all children have symptoms at diagnostic levels. On the other hand, although
the general population ALSPAC sample has a low prevalence of diagnosed ADHD and ASD, it allows
for the examination of ADHD and social-communication traits across the full distribution of these
traits and therefore includes individuals with more subtle, sub-clinical difficulties. For example, in
chapter 5, we see that polygenic risk scores for ADHD are higher even in children with low levels of
ADHD traits (score of 1-11) when compared to those with no ADHD traits. Thus both of these
samples have distinct advantages over each other when it comes to addressing questions regarding
the clinical and genetic overlap of neurodevelopmental problems.
As mentioned in section 2.3 of chapter 2, similar phenotype measures were utilised in these
samples, wherever possible. This has allowed for a certain level of consistency across these two
samples. For example, the Digit Span subtest was used to measure verbal working memory in both
samples. Although the WISC-IV was used in the clinical ADHD sample and the WISC-III was used in
ALSPAC, this measure is virtually the same across these versions of the WISC IQ test. Similarly,
ADHD symptoms were assessed in both samples using robust, standardised diagnostic instruments:
the CAPA (Angold et al., 1995) in the clinical ADHD sample and the DAWBA (Goodman et al., 2008)
in the ALSPAC sample. Both of these measures assess the same 18 DSM-IV/DSM-5 ADHD

135
symptoms in a similar manner. However, because of low prevalence of severe ADHD symptoms in
the general population sample and to increase variability, the DAWBA ADHD symptoms in ALSPAC
were coded: 0 for “no”, 1 for “a little more than others” and 2 for “a lot more than others”, with a
total score being the sum of these responses for all 18 symptoms. In contrast, in the clinical ADHD
sample, the CAPA ADHD symptoms were simply considered as ‘present at a clinical level’ or
‘absent’, with no middle score.
One other important difference in measures used was the use of the SCQ to measure ASD in the
clinical ADHD sample, whereas a similar dedicated and comprehensive assessment tool measuring
ASD was lacking in ALSPAC. However, the two measures of social-communication problems (the
SCDC (Skuse et al., 2005) and CCC (Bishop, 1998)) have been shown to have good predictive
reliability for a clinical diagnosis of ASD in the ALSPAC sample (Steer et al., 2010). Furthermore,
these measures, particularly the pragmatic language sub-scales of the CCC, showed a good amount
of variability in the ALSPAC sample, whereas more strictly measured clinical traits may have been
rarer, with insufficient power for analyses. Unfortunately, there was no available quantitative
measure of RRBs in ALSPAC, so the findings from the first half of the thesis regarding the possible
overlap of RRBs and hyperactive-impulsive traits could not be further examined in this sample. Also,
it was not possible to examine whether polygenic risk scores for ADHD were associated with RRBs
in this sample.
A final consideration with regards to the use of these two samples is that the ADHD clinical sample
is a cross-sectional sample spanning a fairly wide age range (5-18 years), whereas ALSPAC is a
longitudinal cohort sample. Thus, no conclusions can be drawn with regards to causality in the
ADHD clinical sample. Although the presence of genetic risk variants necessarily predates
measurement of childhood behavioural and cognitive traits in the ALSPAC sample, it is not possible
to determine on the basis of the findings of this thesis whether and what specific genetic risk
variants directly contribute to the manifestation of these behavioural and cognitive problems. The

136
findings are preliminary and larger genetic discovery studies are needed to shed light on the
pathway from genetic risk variants to complex behavioural and cognitive phenotypes.
The importance of IQ
One important issue raised several times in this thesis is that of the strong association between
ADHD and lower IQ (Dykens & Hodapp, 2001; Frazier et al., 2004; Voigt et al., 2006). Given the
attentional problems (such as difficulties with concentrating) that children with ADHD experience, it
is highly likely that cognitive abilities assessed using standardised IQ tests are frequently
underestimated in these children. Additionally, the presence of co-occurring social-communication
difficulties in children with ADHD may be linked with an inability to fully understand task
instructions or with a decrease in motivation to perform well. Indeed, in chapter 4 we see that
social-communication difficulties in children with ADHD are associated with lower IQ. These results
demonstrate that IQ may be more than just a measure of general cognitive ability but also an index
of attentional, communication and other difficulties.
This further suggests that the common practice of excluding children from studies based on an
arbitrary cut-off for IQ (e.g. IQ<70 or sometimes even IQ<85) may bias samples and result in
research that is not representative of typical clinical samples of children with ADHD. On the other
hand, it may be that diagnostic instruments do not adequately assess ADHD in children with
particularly low cognitive functioning abilities. One possible solution is for researchers to more
carefully take into consideration the developmental level of children when assessing ADHD and
related traits. Furthermore, a study of the clinical sample of children with ADHD analysed in this
thesis, which compared those with and without intellectual disability, suggests that the clinical
profiles of both groups of children are quite similar, except for a greater level of conduct disorder
symptoms and diagnoses in those with intellectual disability (Ahuja et al., 2013). The results
presented in this thesis additionally suggest that lower IQ is not only correlated with more ASD
137
traits but also that it is related to common genetic risk variants for ADHD, suggesting that it may be
an important marker of neurodevelopmental genetic liability.
Genetic issues
Another important issue raised by the results of this thesis is related to the genetic architecture (i.e.
the number, frequencies and effect sizes of risk variants) of ADHD and other neurodevelopmental
and cognitive phenotypes. The results of chapter 5 support previous research regarding the
dimensionality of ADHD (Larsson et al., 2011; Levy et al., 1997), by demonstrating that the set of
thousands of common genetic variants associated with clinical ADHD also play an important role at
the milder end of ADHD traits in the general population. These results also support the important
role of common genetic risk variants with low effect sizes in the aetiology of ADHD, which has been
shown by others (Hamshere et al., 2013a; Lee et al., 2013; Stergiakouli et al., 2012).
It is important to note that rare chromosomal abnormalities, large, rare CNVs and rare single
nucleotide mutations are also likely to play an important role in ADHD (Lo-Castro et al., 2011;
Williams et al., 2010, 2012; Yang et al., 2013). Indeed, it appears that the presence of a CNV in
children with ADHD is associated with a lower polygenic risk score of common variants, suggesting
that both common and rare variants contribute independently to risk of ADHD (Martin et al., under
review). The focus of the genetic analyses in this thesis has been restricted to common, additive
genetic risk variants and so rare variants were not examined.
There are several important considerations regarding the method of polygenic risk score analysis of
common variants. Firstly, as mentioned in chapters 5 and 6, the effect sizes or amounts of variance
explained by the polygenic risk scores are very low. Whilst this is likely to be at least in part due to
the low power of available ADHD GWAS for detecting true risk alleles for ADHD, the issue is more
complex. Current GWAS of ADHD have thus far not found any individual significantly-associated
SNPs (Hinney et al., 2011; Mick et al., 2010; Neale et al., 2008, 2010b; Stergiakouli et al., 2012; Yang
et al., 2013). Polygenic score analyses suggest that despite the low power, current GWAS do

138
successfully detect weakly-associated risk alleles (Hamshere et al., 2013a). However, a substantial
proportion of the SNPs meeting the p-value selection threshold (p<0.5) for inclusion in polygenic
risk score analysis are likely to be false positives, resulting in a high degree of noise in the risk
scores. General practice is to calculate polygenic risk scores at several different thresholds (Purcell
et al., 2009) to account for the trade-off of capturing true, albeit weakly-associated, genetic risk
variants versus including a high proportion of false positives, and to check the sensitivity of the
results to the selection threshold that is used. As such, the robust pattern of results observed in
chapters 5 and 6 following repeating analyses at differing p-value selection thresholds serves to
strengthen the conclusions on the basis of these results. Analyses in other psychiatric conditions
using this method demonstrate that for a low discovery sample size, predictive ability tends to be
better with larger SNP sets (i.e. using less stringent p-value thresholds), whereas lower p-value
selection thresholds are more optimal with increasing discovery sample size (Wray et al., 2014).
The Psychiatric Genomics Consortium (PGC), an international collaboration of researchers
investigating the genetic basis of psychiatric disorders, is currently engaged in genotyping and
combining ADHD case data contributed by collaborating research groups in an effort to increase
the power of ADHD genetic analyses. This international effort will thus lead to a more powerful
genetic discovery sample available for future analyses. One possible concern is that increasing the
quantity of available samples will be associated with a decrease in overall quality of the included
data and potentially will introduce factors that confound genetic effects. For example, differences
in recruitment and assessment of ADHD cases from different samples may increase heterogeneity.
Additionally, if individuals who are screened only minimally for ADHD are included in the sample,
this could weaken the power to detect genetic risk variants associated with ADHD. Also, combining
individuals with ADHD from a variety of ancestral groups needs to be mitigated through the use of a
strict quality control pipeline and adjusting for population stratification effects. Although sheer
numbers may help to boost the power to detect specific common genetic risk variants associated

139
with ADHD, there will continue to be a need to apply the findings of GWAS to smaller, well-
phenotyped samples in order to address clinically-meaningful questions (Thapar & Harold, 2014).
The benefit of increasing sample sizes can be seen for other phenotypes. In particular, it is striking
that GWAS of schizophrenia, which can in some ways be viewed as the flagship model for the
genetic analysis of psychiatric phenotypes, also started out with detecting no genome-wide
significant SNPs (Lencz et al., 2007; Sullivan et al., 2008) but have since progressed to identifying
128 SNPs significantly associated with this condition (Schizophrenia Working Group of the
Psychiatric Genomics Consortium, 2014). This suggests that increasing the sample sizes in ADHD
will follow a similar pattern. However, there is no guarantee that findings for ADHD will follow this
model or indeed that the genetic architecture of ADHD is similar to that for schizophrenia or other
psychiatric conditions. For instance, the level of phenotypic heterogeneity of schizophrenia and
ADHD may not be equivalent. Also, ADHD is much more common than schizophrenia (which has a
lifetime morbid risk of about 0.7% in the population (Saha et al., 2005)). It remains to be seen
whether significantly associated SNPs relevant to ADHD will be detected with larger sample sizes.
A second important issue regarding the method of polygenic score analysis in this thesis is
regarding the nature of the controls used for the discovery ADHD GWAS (Neale et al., 2010a;
Stergiakouli et al., 2012). The controls consisted of unscreened population samples (Stergiakouli et
al., 2012) and a combination of population samples and parent-offspring trios (Neale et al., 2010a).
Both of these approaches have limitations. As mentioned in section 1.6 of chapter 1, the addition of
parent-offspring trios to case-control GWAS of ADHD relies on the assumption that the distribution
of genetic liability for ADHD is similar in the “pseudo-controls” (i.e. the non-transmitted parental
genetic data) and the population controls. However, given the familial nature of ADHD, it is highly
likely that parents will themselves be carriers of genetic risk variants (transmitted and non-
transmitted) relevant to ADHD. Indeed, a recent report from the PGC ADHD sample confirms that
polygenic risk scores based on a large GWAS sample of self-reported ADHD cases and non-ADHD

140
controls ascertained from 23andMe (a personal genetics service in the USA) are significantly higher
in ADHD cases than in population controls, with substantially smaller and non-significant prediction
of ADHD case status when comparing polygenic scores in cases with the non-transmitted “pseudo-
control” parental genotypes (Neale, 2013). Another direct assessment of this issue in ASD families
also suggests that pseudo-controls in multiplex families show a substantial contribution of common
genetic risk variants to estimates of SNP-chip heritability for ASD, when compared to pseudo-
controls from simplex families or unaffected controls (Klei et al., 2012). Both of these studies
highlight that the non-transmitted genetic data of parents of children with ADHD and ASD appears
to contain a greater load of additive common genetic variants increasing risk for these conditions
when compared to genetic data from population controls.
Another issue related to the use of parent-offspring trio samples for genetic studies concerns the
potential recruitment bias of including genetic data from “intact” families, where both biological
parents are not only involved in the child’s life, but also willing to take part in research. Given the
social and familial impairments associated with ADHD and the frequent presence of ADHD traits in
parents of affected children, one might expect that intact families would consist of parents and
children less severely affected by ADHD when compared to single-parent or otherwise non-intact
families. Indeed, there is some suggestion in the literature that children with ADHD from non-intact
families are more likely to have the more severe DSM-IV combined subtype of ADHD and comorbid
problems, such as conduct disorder, than those from intact (i.e. parent-offspring trio) families
(Hurtig et al., 2007; West et al., 2002). In contrast, studies examining this issue in families with an
individual affected with schizophrenia have not seen such clinical differences in trios vs. non-trios
(Malhotra et al., 2002; Zammit et al., 2005). In short, studies examining the parent-offspring trio
design in ADHD suggest that the use of pseudo-controls based on non-transmitted parental DNA
could reduce observed effect sizes in genetic studies through statistical issues as well as possible
recruitment biases.

141
Although the main discovery GWAS of ADHD used for analyses in chapters 5 and 6 did not include
parent-offspring trios (Stergiakouli et al., 2012), the second discovery sample, the ADHD meta-
analysis of 4 studies, included data on 2064 parent-offspring trios (Neale et al., 2010a). This could
be a potential source of the inconsistent results observed; polygenic ADHD genetic risk scores
based on the replication discovery sample were not associated with ADHD traits at age 7 years
(chapter 5) or with working memory difficulties at two time points (chapter 6).
The use of discovery GWAS of ADHD which rely solely on a case-control design is also not without
its limitations. Population prevalence of ADHD is estimated at approximately 5% (Polanczyk et al.,
2007), suggesting that about 5% of unscreened population controls may be affected with ADHD. As
such, use of unscreened controls could decrease the power of detecting risk alleles relevant to
ADHD. Indeed, estimates suggest that if 5% of controls actually meet the definition of cases, this
would reduce power by a similar amount to reducing the overall sample size by about 10% (The
Wellcome Trust Case Control Consortium, 2007). Furthermore, ADHD is much more common in
males than in females and it is not yet clear whether using population controls with a sex-ratio of 1:1
is appropriate. These issues could have served to reduce the power of both of the genetic discovery
samples used for the analyses in chapters 5 and 6 of this thesis.
Another issue regarding the controls of the discovery GWAS is the possibility that they differed
phenotypically from the case children with ADHD beyond the presence of an ADHD diagnosis. For
example, the common genetic risk variants derived from the discovery GWAS may have also
indexed lower IQ and other phenotypic traits frequently seen in children with ADHD. A possible
alternative interpretation of the results of chapters 5 and 6 is that the polygenic risk scores
calculated in the ALSPAC sample showed association with social-communication difficulties
(chapter 5) and lower IQ and working memory (chapter 6) as a result of the discovery GWAS
capturing common genetic risk variants relevant to phenotypic traits beyond ADHD. Phenotype
information on controls was not available for IQ or other traits so it was not possible to perform a

142
GWAS co-varying for the effect of other phenotypic traits. However, the association between
ADHD and these other phenotypes (e.g. low IQ) is not well understood and in any case, the results
of this thesis do show that common genetic risk variants which are primarily associated with ADHD
clinical diagnosis may be relevant to other phenotypes beyond ADHD. Further work is needed to
examine these findings in more detail and rule out alternative interpretations of the results.
Another consideration related to the analytical method in chapters 5 and 6 is the process of
calculating polygenic risk scores in the ALSPAC children. Selection of SNPs was performed in two
steps: 1) LD-pruning (linkage disequilibrium pruning) in the target sample followed by 2) selecting
only those that fell below a p-value selection threshold. This was followed by weighting each of the
SNPs by effect size (odds ratio of the risk allele) in the discovery GWAS and summing the number of
risk alleles for each individual. There are several things to consider. Firstly, there is another
commonly-used alternative to the LD-pruning method used here, known as ‘clumping’ (Smoller et
al., 2013; Wray et al., 2014). Instead of randomly pruning out SNPs that are in high linkage-
disequilibrium with those within the 200kb sliding window (LD-pruning), clumping relies on
preferentially selecting SNPs within LD blocks which show a stronger association with the
phenotype of interest (i.e. have a lower p-value). Clumping could thus strengthen the chance of
including true positive risk SNPs in the set of SNPs used for polygenic score analysis. Using LD-
pruning on the other hand, may have served to weaken the observed results of this thesis. However,
clumping may result in the inclusion of multiple SNPs that are associated with the same causal
variant and so may also not be the optimal strategy for this method (Wray et al., 2014).
Furthermore, one recent study which compared these two methods directly, suggests that LD-
pruning is actually associated with a greater amount of variance explained than when clumping is
used (Groen-Blokhuis et al., 2014).
Another issue is the selection of the set of SNPs based on a statistical p-value cut-off. An alternative
would be to choose SNPs which are more likely to have functional significance, for example by

143
limiting the SNP set to variants which are within or near genes or going a step further and selecting
only SNPs that fall within specific biological pathways relevant to ADHD. In theory, selecting SNPs
which are more likely to be disease-relevant could improve the proportion of true risk alleles in the
set of SNPs used for calculating the risk scores. However, in practice, the small number of SNPs
selected in this way and the currently small sample sizes for ADHD discovery GWAS combined with
the lack of knowledge regarding relevant functional variants make it unlikely that such a method
would have more power than the approach used in this thesis.
As mentioned in chapters 5 and 6, a small proportion of the cases (2% of the cases in this second
discovery sample) in both discovery samples overlapped (Neale et al., 2010a; Stergiakouli et al.,
2012) and could not be removed. This means that the two discovery samples were not truly
independent and may have biased the results a little in favour of replication. However, given the
small proportion of overlapping cases, this is unlikely to have been the main driver of the observed
results.
A final issue is that the replication analyses using the second discovery GWAS (Neale et al., 2010a)
followed a slightly different method to that of the analyses based on the primary discovery GWAS
(Stergiakouli et al., 2012). Although the method used for calculating the polygenic risk scores in
ALSPAC using these two discovery datasets was virtually identical, the available data from this
second discovery sample did not contain odds ratios. Therefore, the risk alleles could not be
weighted by effect size and were all treated equally when calculating the risk scores. Using such un-
weighted risk alleles may have introduced more noise into the measure of genetic risk and reduced
the power of these replication analyses. This is a limitation of the replication analyses, which may
also account for the weaker and inconsistent results using this secondary sample.
7.4 Summary of strengths and limitations
The main strength of the analyses in this thesis is the use of the two complementary samples (the
clinical ADHD sample and the population cohort ALSPAC sample), which are both large and well-

144
phenotyped, with a number of similar clinical and cognitive measures. The main limitations of the
methods have already been discussed in detail above and in each of the results chapters. Briefly, the
main limitations are as follows. The lack of a comprehensive assessment of ASD in the clinical
ADHD sample made it impossible to fully take into account the presence of a clinical ASD diagnosis
in these children for the analyses in chapters 3 and 4. Although the SCQ (Berument et al., 1999;
Rutter et al., 2003) is a standardised screening instrument, its validity and specificity for assessing
ASD traits in a sample of children with ADHD needs to be further examined, particularly given the
potential overlap of the items regarding RRBs and hyperactive-impulsive behaviours found in
chapter 3. Another limitation of the thesis is that the use of stimulant medication was not taken into
account in the analyses of cognitive measures in chapters 4 (ADHD sample) and 6 (ALSPAC
sample). Given that timing and dosage of stimulant medication is likely to affect the performance of
children with ADHD on cognitive tasks, the lack of adequate covariates is a limitation of the
analyses. With regards to the genetic analyses in chapters 5 and 6, the main limitation is the small
discovery sample sizes, which are associated with several issues discussed in section 7.3 above.
Finally, as with all research studies, both the clinical ADHD and ALSPAC datasets contain some
missing data, with the ALSPAC sample additionally suffering from attrition with successive data
collection time points. Thus, by ages 7-10 years old, when the measures analysed in the current
thesis were collected, many of the families in the original ALSPAC cohort had dropped out of the
study (of the N=8,229 with genetic data, between N=2,576-3,122 (31.3-37.9%) have missing data for
variables at ages 7-10 years). Mean-imputation of the main phenotype variables was used to
account for partially missing data. For the SEM analyses in chapter 6, the full-information maximum
likelihood estimator was used to obtain more accurate estimates of the models. However, the
missing data is a limitation of all the analyses in this thesis, which may have served to
underestimate the observed effect sizes. Despite these limitations, the results of this thesis have
valuable implications for our understanding of the clinical and genetic overlap of ADHD with ASD
and other early developmental and cognitive difficulties.
145
7.5 Suggestions for future work
There are a number of possible closely-related analyses to those presented in this thesis, which
have the potential to further our understanding of the overlap of ADHD, ASD, and other early
developmental difficulties. First of all, examining the clinical presentation of ADHD traits in children
diagnosed with ASD, using factor analyses and in relation to comorbid problems would be a
complementary approach to the analyses in the first half of this thesis. It would also be worthwhile
to examine whether a polygenic score of common genetic risk variants relevant to ADHD is also
associated with traits of ASD and other developmental and cognitive difficulties in children with
ADHD. Such an analysis was not feasible for this thesis due to the limited power of the small sample
size of genotyped children with ADHD who also had data available for these measures (e.g. only
N=373 with SCQ and genetic data). Larger samples are necessary to determine whether common
genetic risk alleles for ADHD predispose to any other developmental problems within these
children. Furthermore, complementary analyses would involve utilising a polygenic risk score of
common variants associated with ASD and examining its effect on ADHD or ASD case status and
other traits in a clinical context as well as in relation to these traits in the general population. Also,
given the results supporting multiple dimensions in ADHD (inattentive vs. hyperactive-impulsive
symptoms) and ASD (RRBs vs. social-communication difficulties), it would be worthwhile for future
studies to examine whether polygenic risk scores based on quantitative GWAS of these dimensions
show associations with any specific early developmental traits.
Another interesting future area of research stemming from the analyses in this thesis is that of the
possible genetic aetiology of the difference in prevalence of ADHD in males and females. Results
from the analyses in chapter 5 suggest that females with ADHD traits in the general population
carry a higher burden of common genetic risk variants associated with clinically-diagnosed ADHD,
when compared with males with ADHD traits. This gender difference was previously also found in

146
the clinical ADHD sample (Hamshere et al., 2013a). Future studies should aim to replicate and
extend these findings.
Although this thesis has focused on the clinical and genetic overlap of ADHD and ASD, it is clear
from the literature that there is a very high degree of overlap across all neurodevelopmental
disorders (Dyck et al., 2011) and twin studies show that much of this overlap stems from shared
underlying genetic factors (Lichtenstein et al., 2010; Martin et al., 2006). Neurodevelopmental
disorders can be defined as a related cluster of disorders which are characterised by early childhood
onset, relative stability across the lifespan and a greater prevalence in boys than girls. A recent large
exploratory factor analysis of neurodevelopmental problems in a wide range of domains (i.e.
inattention, hyperactivity-impulsivity, learning, language, social-interaction, perception, motor
control, memory, planning, flexibility and tics) in a population-based twin sample (the Child and
Adolescent Twin Study in Sweden) suggests that there is a general genetic factor which accounts
for about a third of the phenotypic variance of these problems in the general population (Pettersson
et al., 2013). This study suggests that current classification systems (i.e. the DSM-5 and ICD-10)
attempt to partition into discrete entities a set of difficulties which are strongly aetiologically
related. Additional clinical, family and molecular genetic studies are needed to better understand
how and to what extent these early childhood disorders overlap, with a view to improving future
diagnostic classifications as well as helping to treat and manage these problems.
7.6 Conclusion
The work presented in this thesis adds to the emerging body of literature highlighting the frequent
co-occurrence of ADHD and ASD difficulties in children, as well as the genetic overlap of
developmental and cognitive phenotypes. Results show that traits of ASD measured in children
with ADHD can be split into separate clusters of social-communication difficulties and restrictive
and repetitive behaviours. Additionally, these two dimensions of traits index distinct developmental
and cognitive difficulties in children with ADHD. The results also show an association of ADHD

147
common genetic risk variants with social-communication difficulties and cognitive abilities in the
general population. These results indicate that neurodevelopmental and cognitive difficulties lie on
a continuous dimension in the population and are at least partially underpinned by shared genetic
risk factors. Future large, collaborative genetic discovery studies are needed to pinpoint specific
shared genetic risks. This research has the potential to improve the diagnosis, classification and
treatment of early developmental problems, as well as our understanding of the aetiology of these
conditions.

148
References
Abrahams, B. S., & Geschwind, D. H. (2008). Advances in autism genetics: on the threshold of a new neurobiology. Nature Reviews Genetics, 9(5), 341–355.
Agha, S. S., Zammit, S., Thapar, A., & Langley, K. (2013). Are parental ADHD problems associated with a more severe clinical presentation and greater family adversity in children with ADHD? European Child and Adolescent Psychiatry, 22(6), 369–377.
Ahuja, A., Martin, J., Langley, K., & Thapar, A. (2013). Intellectual Disability in Children with Attention Deficit Hyperactivity Disorder. Journal of Pediatrics, 163(3), 890–895.
Alberts-Corush, J., Firestone, P., & Goodman, J. T. (1986). Attention and impulsivity characteristics of the biological and adoptive parents of hyperactive and normal control children. American Journal of Orthopsychiatry, 56(3), 413–423.
Ames, C. S., & White, S. J. (2011). Brief report: Are ADHD traits dissociable from the autistic profile? Links between cognition and behaviour. Journal of Autism and Developmental Disorders, 41(3), 357–363.
Anckarsäter, H., Lundström, S., Kollberg, L., Kerekes, N., Palm, C., Carlström, E., … Lichtenstein, P. (2012). The Child and Adolescent Twin Study in Sweden (CATSS). Twin Research and Human Genetics, 14(06), 495–508.
Ando, J., Ono, Y., & Wright, M. J. (2001). Genetic structure of spatial and verbal working memory. Behavior Genetics, 31(6), 615–624.
Angold, A., & Costello, E. J. (1995). A test-retest reliability study of child-reported psychiatric symptoms and diagnoses using the Child and Adolescent Psychiatric Assessment (CAPA-C). Psychological Medicine, 25(4), 755–762.
Angold, A., Prendergast, M., Cox, A., Harrington, R., Simonoff, E., & Rutter, M. (1995). The Child and Adolescent Psychiatric Assessment (CAPA). Psychological Medicine, 25(4), 739–753.
Anney, R., Klei, L., Pinto, D., Almeida, J., Bacchelli, E., Baird, G., … Devlin, B. (2012). Individual common variants exert weak effects on risk for Autism Spectrum Disorders. Human Molecular Genetics, 21(21), 4781–4792.
Anney, R., Klei, L., Pinto, D., Regan, R., Conroy, J., Magalhaes, T. R., … Pagnamenta, A. T. (2010). A genome-wide scan for common alleles affecting risk for autism. Human Molecular Genetics, 19(20), 4072–4082.
Anokhin, A. P., Heath, A. C., & Ralano, A. (2003). Genetic influences on frontal brain function: WCST performance in twins. Neuroreport, 14(15), 1975–1978.
Antshel, K. M., Phillips, M. H., Gordon, M., Barkley, R., & Faraone, S. V. (2006). Is ADHD a valid disorder in children with intellectual delays? Clinical Psychology Review, 26(5), 555–572.

149
Asherson, P., Merwood, A., Greven, C., Plomin, R., Banaschewski, T., Neale, B. M., … Kuntsi, J. (2013). Polygenic Prediction of ADHD Diagnosis, ADHD Symptoms and Cognitive Impairments. In XXIst World Congress of Psychiatric Genetics. Boston, USA.
Bailey, A., Palferman, S., Heavey, L., & Le Couteur, A. (1998). Autism: the phenotype in relatives. Journal of Autism and Developmental Disorders, 28(5), 369–392.
Baird, G., Simonoff, E., Pickles, A., Chandler, S., Loucas, T., Meldrum, D., & Charman, T. (2006). Prevalence of disorders of the autism spectrum in a population cohort of children in South Thames: the Special Needs and Autism Project (SNAP). Lancet, 368(9531), 210–215.
Balázs, J., & Keresztény, A. (2014). Subthreshold attention deficit hyperactivity in children and adolescents: a systematic review. European Child & Adolescent Psychiatry, 23(6), 393–408.
Barkley, R. A., Fischer, M., Smallish, L., & Fletcher, K. (2006). Young adult outcome of hyperactive children:Adaptive functioning in major life activities. Journal of the American Academy of Child and Adolescent Psychiatry, 45(2), 192–202.
Baron-Cohen, S. (1989). The autistic child’s theory of mind: A case of specific developmental delay. Journal of Child Psychology and Psychiatry, 30(2), 285–297.
Baron-Cohen, S. (2000). Theory of mind and autism: A review. International Review of Research in Mental Retardation, 23, 169–184.
Ben-David, E., & Shifman, S. (2012). Networks of neuronal genes affected by common and rare variants in autism spectrum disorders. PLoS Genetics, 8(3), e1002556.
Berg, E. A. (1948). A simple objective technique for measuring flexibility in thinking. The Journal of General Psychology, 39(1), 15–22.
Bernier, R., Gerdts, J., Munson, J., Dawson, G., & Estes, A. (2011). Evidence for broader autism phenotype characteristics in parents from multiple-incidence autism families. Autism Research, 5(1), 13–20.
Berument, S. K., Rutter, M., Lord, C., Pickles, a, & Bailey, A. (1999). Autism screening questionnaire: diagnostic validity. The British Journal of Psychiatry, 175, 444–451.
Bidwell, L. C., Willcutt, E. G., DeFries, J. C., & Pennington, B. F. (2007). Testing for neuropsychological endophenotypes in siblings discordant for ADHD. Biological Psychiatry, 62(9), 991.
Biederman, J. (2005). Attention-deficit/hyperactivity disorder: a selective overview. Biological Psychiatry, 57(11), 1215–1220.
Biederman, J., Newcorn, J., & Sprich, S. (1991). Comorbidity of Attention Deficit Hyperactivity Disorder. American Journal of Psychiatry, 148(5), 564–577.
Bishop, D. V. M. (1998). Development of the Children’s Communication Checklist (CCC): A method for assessing qualitative aspects of communicative impairment in children. Journal of Child Psychology and Psychiatry, 39(6), 879–891.

150
Bishop, D. V. M., & Norbury, C. F. (2002). Exploring the borderlands of autistic disorder and specific language impairment: a study using standardised diagnostic instruments. Journal of Child Psychology and Psychiatry, 43(7), 917–929.
Bishop, D. V. M., North, T., & Donlan, C. (2008). Genetic basis of specific language impairment: Evidence from a twin study. Developmental Medicine & Child Neurology, 37(1), 56–71.
Blondis, T. A. (1999). Motor disorders and attention-deficit/hyperactivity disorder. Pediatric Clinics of North America, 46(5), 899–913.
Boyd, A., Golding, J., Macleod, J., Lawlor, D. A., Fraser, A., Henderson, J., … Davey Smith, G. (2013). Cohort Profile: the “children of the 90s”--the index offspring of the Avon Longitudinal Study of Parents and Children. International Journal of Epidemiology, 42(1), 111–27.
Bralten, J., Franke, B., Waldman, I., Rommelse, N., Hartman, C., Asherson, P., … Arias-Vásquez, A. (2013). Candidate genetic pathways for attention-deficit/hyperactivity disorder (ADHD) show association to hyperactive/impulsive symptoms in children with ADHD. Journal of the American Academy of Child and Adolescent Psychiatry, 52(11), 1204–1212.
Bruce, B., Thernlund, G., & Nettelbladt, U. (2006). ADHD and language impairment. European Child and Adolescent Psychiatry, 15(1), 52–60.
Cambridge Cognition. (1996). Cambridge neuropsychological test automated battery (CANTAB). Cambridge, UK: CeNeS Limited.
Capano, L., Minden, D., Chen, S. X., Schacher, R. J., & Ickowicz, A. (2008). Mathematical learning disorder in school-age children with attention-deficit hyperactivity disorder. Canadian Journal of Psychiatry, 53(6), 392–399.
Casey, B. J., Craddock, N., Cuthbert, B. N., Hyman, S. E., Lee, F. S., & Ressler, K. J. (2013). DSM-5 and RDoC: progress in psychiatry research? Nature Reviews Neuroscience, 14(11), 810–814.
Chandler, S., Charman, T., Baird, G., Simonoff, E., Loucas, T., Meldrum, D., … Pickles, A. (2007). Validation of the social communication questionnaire in a population cohort of children with autism spectrum disorders. Journal of the American Academy of Child and Adolescent Psychiatry, 46(10), 1324–1332.
Cheung, P. P. P., & Siu, A. M. H. (2009). A comparison of patterns of sensory processing in children with and without developmental disabilities. Research in Developmental Disabilities, 30(6), 1468–1480.
Collin, L., Bindra, J., Raju, M., Gillberg, C., & Minnis, H. (2013). Facial emotion recognition in child psychiatry: A systematic review. Research in Developmental Disabilities, 34(5), 1505–1520.
Conners, C. K., Sitarenios, G., Parker, J. D., & Epstein, J. N. (1998). Revision and restandardization of the Conners Teacher Rating Scale (CTRS-R): factor structure, reliability, and criterion validity. Journal of Abnormal Child Psychology, 26(4), 279–291.
Constantino, J. N., Lajonchere, C., Lutz, M., Gray, T., Abbacchi, A., McKenna, K., … Todd, R. D. (2006). Autistic social impairment in the siblings of children with pervasive developmental disorders. American Journal of Psychiatry, 163(2), 294–296.

151
Constantino, J. N., & Todd, R. D. (2003). Autistic traits in the general population: a twin study. Archives of General Psychiatry, 60(5), 524–530.
Cooper, M., Martin, J., Langley, K., Hamshere, M., & Thapar, A. (2014). Autistic traits in children with ADHD index clinical and cognitive problems. European Child and Adolescent Psychiatry, 23(1), 23–34.
David, A. S., Zammit, S., Lewis, G., Dalman, C., & Allebeck, P. (2008). Impairments in cognition across the spectrum of psychiatric disorders: evidence from a Swedish conscript cohort. Schizophrenia Bulletin, 34(6), 1035–41.
De Bruin, E. I., Ferdinand, R. F., Meester, S., de Nijs, P. F. A., & Verheij, F. (2007). High rates of psychiatric co-morbidity in PDD-NOS. Journal of Autism and Developmental Disorders, 37(5), 877–886.
Deary, I. J., Johnson, W., & Houlihan, L. M. (2009). Genetic foundations of human intelligence. Human Genetics, 126(1), 215–232.
Demopoulos, C., Hopkins, J., & Davis, A. (2013). A Comparison of Social Cognitive Profiles in children with Autism Spectrum Disorders and Attention-Deficit/Hyperactivity Disorder: A Matter of Quantitative but not Qualitative Difference? Journal of Autism and Developmental Disorders, 43(5), 1157–1170.
Dennis, M., Francis, D. J., Cirino, P. T., Schachar, R., Barnes, M. A., & Fletcher, J. M. (2009). Why IQ is not a covariate in cognitive studies of neurodevelopmental disorders. Journal of the International Neuropsychological Society, 15(03), 331–343.
Devlin, B., & Scherer, S. W. (2012). Genetic architecture in autism spectrum disorder. Current Opinion in Genetics & Development, 22(3), 229–37.
Doherty, J. L., & Owen, M. J. (2014). Genomic insights into the overlap between psychiatric disorders: implications for research and clinical practice. Genome Medicine, 6(4), 29.
Dudbridge, F., & Gusnanto, A. (2008). Estimation of significance thresholds for genomewide association scans. Genetic Epidemiology, 32(3), 227–34.
Dunn, W., & Bennett, D. (2002). Patterns of sensory processing in children with attention deficit hyperactivity disorder. Occupational Therapy Journal of Research, 22(1), 4–15.
DuPaul, G. (1981). Parent and teacher ratings of ADHD symptoms: Psychometric properties in a community based sample. Journal of Clinical Child Psychology, 20, 245–253.
Dyck, M. J., Piek, J. P., & Patrick, J. (2011). The validity of psychiatric diagnoses: The case of “specific”developmental disorders. Research in Developmental Disabilities, 32(6), 2704–2713.
Dykens, E. M., & Hodapp, R. M. (2001). Research in mental retardation: toward an etiologic approach. Journal of Child Psychology and Psychiatry, 42(1), 49–71.
Dykman, R. A., & Ackerman, P. T. (1991). Attention deficit disorder and specific reading disability: Separate but often overlapping disorders. Journal of Learning Disabilities, 24(2), 96–103.

152
Eaves, L. C., Wingert, H. D., Ho, H. H., & Mickelson, E. C. R. (2006). Screening for autism spectrum disorders with the social communication questionnaire. Journal of Developmental and Behavioral Pediatrics, 27(2), S95–S103.
Elia, J., Gai, X., Xie, H. M., Perin, J. C., Geiger, E., Glessner, J. T., … White, P. S. (2010). Rare structural variants found in attention-deficit hyperactivity disorder are preferentially associated with neurodevelopmental genes. Molecular Psychiatry, 15(6), 637–646.
Elia, J., Glessner, J. T., Wang, K., Takahashi, N., Shtir, C. J., Hadley, D., … Robison, R. (2012). Genome-wide copy number variation study associates metabotropic glutamate receptor gene networks with attention deficit hyperactivity disorder. Nature Genetics, 44, 78–84.
Elsabbagh, M., Divan, G., Koh, Y.-J., Kim, Y. S., Kauchali, S., Marcín, C., … Fombonne, E. (2012). Global prevalence of autism and other pervasive developmental disorders. Autism Research: Official Journal of the International Society for Autism Research, 5(3), 160–79.
Faraone, S. V. (2013). Real progress in molecular psychiatric genetics. Journal of the American Academy of Child and Adolescent Psychiatry, 52(10), 1006–8.
Faraone, S. V, Biederman, J., & Wozniak, J. (2012). Examining the comorbidity between attention deficit hyperactivity disorder and bipolar I disorder: a meta-analysis of family genetic studies. The American Journal of Psychiatry, 169(12), 1256–66.
Faraone, S. V, Perlis, R. H., Doyle, A. E., Smoller, J. W., Goralnick, J. J., Holmgren, M. A., & Sklar, P. (2005). Molecular genetics of attention-deficit/hyperactivity disorder. Biological Psychiatry, 57(11), 1313–1323.
Fein, D., Dixon, P., Paul, J., & Levin, H. (2005). Brief report: pervasive developmental disorder can evolve into ADHD: case illustrations. Journal of Autism and Developmental Disorders, 35(4), 525–534.
Fett, A.-K. J., Viechtbauer, W., Dominguez, M.-G., Penn, D. L., van Os, J., & Krabbendam, L. (2011). The relationship between neurocognition and social cognition with functional outcomes in schizophrenia: a meta-analysis. Neuroscience and Biobehavioral Reviews, 35(3), 573–88.
Fisch, G. S. (2012). Nosology and epidemiology in autism: Classification counts. American Journal of Medical Genetics Part C: Seminars in Medical Genetics, 160(2), 91–103.
Fombonne, E. (2003). Epidemiological surveys of autism and other pervasive developmental disorders: an update. Journal of Autism and Developmental Disorders, 33(4), 365–382.
Ford, T., Goodman, R., & Meltzer, H. (2003). The British Child and Adolescent Mental Health Survey 1999: the prevalence of DSM-IV disorders. Journal of the American Academy of Child and Adolescent Psychiatry, 42(10), 1203–1211.
Fournier, K. A., Hass, C. J., Naik, S. K., Lodha, N., & Cauraugh, J. H. (2010). Motor coordination in autism spectrum disorders: a synthesis and meta-analysis. Journal of Autism and Developmental Disorders, 40(10), 1227–1240.

153
Fraser, A., Macdonald-Wallis, C., Tilling, K., Boyd, A., Golding, J., Smith, G. D., … Lawlor, D. A. A. (2013). Cohort Profile: The “Children of the 90s”-the index offspring of the Avon Longitudinal Study of Parents and Children. International Journal of Epidemiology, 42(1), 97–110.
Frazier, J., Biederman, J., Bellordre, C. A., Garfield, S. B., Geller, D. A., Coffey, B. J., & Faraone, S. V. (2001). Should the diagnosis of attention/deficit hyperactivity disorder be considered in children with pervasive developmental disorder? Journal of Attention Disorders, 4(4), 203–211.
Frazier, T. W., Demaree, H. A., & Youngstrom, E. A. (2004). Meta-Analysis of Intellectual and Neuropsychological Test Performance in Attention-Deficit/Hyperactivity Disorder. Neuropsychology, 18(3), 543–555.
Frazier, T. W., Youngstrom, E. A., Speer, L., Embacher, R., Law, P., Constantino, J., … Eng, C. (2012). Validation of proposed DSM-5 criteria for autism spectrum disorder. Journal of the American Academy of Child and Adolescent Psychiatry, 51(1), 28–40 e3.
Freitag, C. M. (2006). The genetics of autistic disorders and its clinical relevance: a review of the literature. Molecular Psychiatry, 12(1), 2–22.
Gadow, K. D., DeVincent, C. J., & Pomeroy, J. (2006). ADHD symptom subtypes in children with pervasive developmental disorder. Journal of Autism and Developmental Disorders, 36(2), 271–283.
Gargaro, B. a, Rinehart, N. J., Bradshaw, J. L., Tonge, B. J., & Sheppard, D. M. (2011). Autism and ADHD: how far have we come in the comorbidity debate? Neuroscience and Biobehavioral Reviews, 35(5), 1081–1088.
Gau, S. S. F., & Shang, C. Y. (2010). Executive functions as endophenotypes in ADHD: evidence from the Cambridge Neuropsychological Test Battery (CANTAB). Journal of Child Psychology and Psychiatry, 51(7), 838–849.
Gaugler, T., Klei, L., Sanders, S. J., Bodea, C. A., Goldberg, A. P., Lee, A. B., … Buxbaum, J. D. (2014). Most genetic risk for autism resides with common variation. Nature Genetics, 46(8), 881–885.
Gershon, J. (2002). A meta-analytic review of gender differences in ADHD. Journal of Attention Disorders, 5(3), 143–154.
Geurts, H. M., Broeders, M., & Nieuwland, M. S. (2010). Thinking outside the executive functions box: Theory of mind and pragmatic abilities in attention deficit/hyperactivity disorder. European Journal of Developmental Psychology, 7(1), 135–151.
Ghanizadeh, A. (2010). Factor analysis on ADHD and autism spectrum disorder DSM-IV-derived items shows lack of overlap. European Child and Adolescent Psychiatry, 19(10), 797–798.
Ghanizadeh, A. (2012). Co-morbidity and factor analysis on attention deficit hyperactivity disorder and autism spectrum disorder DSM-IV-derived items. Journal of Research in Medical Sciences, 17(4), 368.
Ghaziuddin, M., Weidmer‐Mikhail, E., & Ghaziuddin, N. (1998). Comorbidity of Asperger syndrome: a preliminary report. Journal of Intellectual Disability Research, 42(4), 279–283.

154
Ghaziuddin, M., Welch, K., Mohiuddin, S., Lagrou, R., & Ghaziuddin, N. (2010). Utility of the Social and Communication Questionnaire in the Differentiation of Autism from ADHD. Journal of Developmental and Physical Disabilities, 22(4), 359–366.
Gilman, S. R., Iossifov, I., Levy, D., Ronemus, M., Wigler, M., & Vitkup, D. (2011). Rare de novo variants associated with autism implicate a large functional network of genes involved in formation and function of synapses. Neuron, 70(5), 898–907.
Girirajan, S., Rosenfeld, J. a, Coe, B. P., Parikh, S., Friedman, N., Ch, B., … Ball, S. (2012). Phenotypic heterogeneity of genomic disorders and rare copy-number variants. The New England Journal of Medicine, 367(14), 1321–1131.
Gizer, I. R., Ficks, C., & Waldman, I. D. (2009). Candidate gene studies of ADHD: a meta-analytic review. Human Genetics, 126(1), 51–90.
Glessner, J. T., Wang, K., Cai, G., Korvatska, O., Kim, C. E., Wood, S., … Hakonarson, H. (2009). Autism genome-wide copy number variation reveals ubiquitin and neuronal genes. Nature, 459(7246), 569–573.
Goldstein, S., & Schwebach, A. J. (2004). The comorbidity of pervasive developmental disorder and attention deficit hyperactivity disorder: results of a retrospective chart review. Journal of Autism and Developmental Disorders, 34(3), 329–339.
Goodman, R., Ford, T., Richards, H., Gatward, R., & Meltzer, H. (2008). The Development and Well-Being Assessment: Description and Initial Validation of an Integrated Assessment of Child and Adolescent Psychopathology. Journal of Child Psychology and Psychiatry, 41(5), 645–655.
Greven, C. U., Rijsdijk, F. V, & Plomin, R. (2011). A twin study of ADHD symptoms in early adolescence: hyperactivity-impulsivity and inattentiveness show substantial genetic overlap but also genetic specificity. Journal of Abnormal Child Psychology, 39(2), 265–275.
Groen-Blokhuis, M. M., Middeldorp, C. M., Kan, K.-J., Abdellaoui, A., Beijsterveldt, C. E. M. van, Ehli, E. A., … Boomsma, D. I. (2014). Attention Deficit Hyperactivity Disorder polygenic risk scores predict Attention Problems in a population-based sample of children. Journal of the American Academy of Child & Adolescent Psychiatry.
Grzadzinski, R., Di Martino, A., Brady, E., Mairena, M. A., O’Neale, M., Petkova, E., … Castellanos, F. X. (2011). Examining autistic traits in children with ADHD: does the autism spectrum extend to ADHD? Journal of Autism and Developmental Disorders, 41(9), 1178–1191.
Guilmatre, A., Dubourg, C., Mosca, A.-L. L., Legallic, S., Goldenberg, A., Drouin-Garraud, V., … Campion, D. (2009). Recurrent rearrangements in synaptic and neurodevelopmental genes and shared biologic pathways in schizophrenia, autism, and mental retardation. Archives of General Psychiatry, 66(9), 947.
Guttmann-Steinmetz, S., Gadow, K. D., & DeVincent, C. J. (2009). Oppositional defiant and conduct disorder behaviors in boys with autism spectrum disorder with and without attention-deficit hyperactivity disorder versus several comparison samples. Journal of Autism and Developmental Disorders, 39(7), 976–985.

155
Guttmann-Steinmetz, S., Gadow, K. D., DeVincent, C. J., & Crowell, J. (2010). Anxiety symptoms in boys with autism spectrum disorder, attention-deficit hyperactivity disorder, or chronic multiple tic disorder and community controls. Journal of Autism and Developmental Disorders, 40(8), 1006–1016.
Hagberg, B. S., Miniscalco, C., & Gillberg, C. (2010). Clinic attenders with autism or attention-deficit/hyperactivity disorder: cognitive profile at school age and its relationship to preschool indicators of language delay. Research in Developmental Disabilities, 31(1), 1–8.
Hamshere, M. L., Langley, K., Martin, J., Agha, S. S., Stergiakouli, E., Anney, R. J., … Thapar, A. (2013a). High loading of polygenic risk for ADHD in children with comorbid aggression. American Journal of Psychiatry, 170(8), 909–916.
Hamshere, M. L., O’Donovan, M. C., Jones, I. R., Jones, L., Kirov, G., Green, E. K., … Craddock, N. (2011). Polygenic dissection of the bipolar phenotype. The British Journal of Psychiatry, 198(4), 284–288.
Hamshere, M. L., Stergiakouli, E., Langley, K., Martin, J., Holmans, P., Kent, L., … Craddock, N. (2013b). A shared polygenic contribution between childhood ADHD and adult schizophrenia. The British Journal of Psychiatry, 203(2), 107–11.
Happé, F., & Ronald, A. (2008). The “fractionable autism triad”: A review of evidence from behavioural, genetic, cognitive and neural research. Neuropsychology Review, 18(4), 287–304.
Harms, M. B., Martin, A., & Wallace, G. L. (2010). Facial emotion recognition in autism spectrum disorders: A review of behavioral and neuroimaging studies. Neuropsychology Review, 20(3), 290–322.
Hill, J. C., & Schoener, E. P. (1996). Age-dependent decline of attention deficit hyperactivity disorder. The American Journal of Psychiatry, 153(9), 1143–1146.
Hinney, A., Scherag, A., Jarick, I., Albayrak, Ö., Pütter, C., Pechlivanis, S., … Hebebrand, J. (2011). Genome-wide association study in German patients with attention deficit/hyperactivity disorder. American Journal of Medical Genetics. Part B: Neuropsychiatric Genetics, 156B(8), 888–97.
Hoekstra, R. A., Happé, F., Baron‐Cohen, S., & Ronald, A. (2010). Limited genetic covariance between autistic traits and intelligence: findings from a longitudinal twin study. American Journal of Medical Genetics Part B: Neuropsychiatric Genetics, 153(5), 994–1007.
Holmes, J., Lawson, D., Langley, K., Fitzpatrick, H., Trumper, A., Pay, H., … Thapar, A. (2004). The Child Attention-Deficit Hyperactivity Disorder Teacher Telephone Interview (CHATTI): reliability and validity. The British Journal of Psychiatry, 184, 74–78.
Holtmann, M., Bölte, S., & Poustka, F. (2007). Attention deficit hyperactivity disorder symptoms in pervasive developmental disorders: association with autistic behavior domains and coexisting psychopathology. Psychopathology, 40(3), 172–177.
Hong, S.-B., Dwyer, D., Kim, J.-W., Park, E.-J., Shin, M.-S., Kim, B.-N., … Cho, S.-C. (2014). Subthreshold attention-deficit/hyperactivity disorder is associated with functional

156
impairments across domains: a comprehensive analysis in a large-scale community study. European Child & Adolescent Psychiatry, 23(8), 627–636.
Hu, L., & Bentler, P. M. (1999). Cutoff criteria for fit indexes in covariance structure analysis: Conventional criteria versus new alternatives. Structural Equation Modeling: A Multidisciplinary Journal, 6(1), 1–55.
Hughes, C., Russell, J., & Robbins, T. W. (1994). Evidence for executive dysfunction in autism. Neuropsychologia, 32(4), 477–492.
Hurtig, T., Ebeling, H., Taanila, A., Miettunen, J., Smalley, S., McGough, J., … Moilanen, I. (2007). ADHD and comorbid disorders in relation to family environment and symptom severity. European Child & Adolescent Psychiatry, 16(6), 362–9.
Insel, T. R., Cuthbert, B. N., Garvey, M. A., Heinssen, R. K., Pine, D. S., Quinn, K. J., … Wang, P. S. (2010). Research domain criteria (RDoC): toward a new classification framework for research on mental disorders. American Journal of Psychiatry, 167(7), 748–751.
Iossifov, I., Ronemus, M., Levy, D., Wang, Z., Hakker, I., Rosenbaum, J., … Leotta, A. (2012). De novo gene disruptions in children on the autistic spectrum. Neuron, 74(2), 285–299.
Johnson, M. H. (2012). Executive function and developmental disorders: the flip side of the coin. Trends in Cognitive Sciences, 16(9), 454–457.
Jones, C. R. G., Happé, F., Golden, H., Marsden, A. J. S., Tregay, J., Simonoff, E., … Charman, T. (2009). Reading and arithmetic in adolescents with autism spectrum disorders: Peaks and dips in attainment. Neuropsychology, 23(6), 718–728.
Karazsia, B. T., & van Dulmen, M. H. M. (2008). Regression models for count data: Illustrations using longitudinal predictors of childhood injury. Journal of Pediatric Psychology, 33(10), 1076–1084.
Keen, D., & Ward, S. (2004). Autistic spectrum disorder. Autism, 8(1), 39–48.
Kempton, S., Vance, A., Maruff, P., Luk, E., Costin, J., & Pantelis, C. (1999). Executive function and attention deficit hyperactivity disorder: stimulant medication and better executive function performance in children. Psychological Medicine, 29(3), 527–538.
Kern, J. K., Trivedi, M. H., Grannemann, B. D., Garver, C. R., Johnson, D. G., Andrews, A. A., … Schroeder, J. L. (2007). Sensory correlations in autism. Autism, 11(2), 123–134.
Klei, L., Sanders, S. J., Murtha, M. T., Hus, V., Lowe, J. K., Willsey, A. J., … Devlin, B. (2012). Common genetic variants, acting additively, are a major source of risk for autism. Molecular Autism, 3(1), 9.
Kline, R. B. (2010). Principles and practice of structural equation modeling. New York: Guilford press.
Kochhar, P., Batty, M. J., Liddle, E. B., Groom, M. J., Scerif, G., Liddle, P. F., & Hollis, C. P. (2011). Autistic spectrum disorder traits in children with attention deficit hyperactivity disorder. Child: Care, Health and Development, 37(1), 103–110.
157
Kothari, R., Solmi, F., Treasure, J., & Micali, N. (2013). The neuropsychological profile of children at high risk of developing an eating disorder. Psychological Medicine, 43(7), 1543–54.
Kotte, A., Joshi, G., Fried, R., Uchida, M., Spencer, A., Woodworth, K. Y., … Biederman, J. (2013). Autistic Traits in Children With and Without ADHD. Pediatrics, 132(3), e612–e622.
Kröger, A., Hänig, S., Seitz, C., Palmason, H., Meyer, J., & Freitag, C. M. (2011). Risk factors of autistic symptoms in children with ADHD. European Child and Adolescent Psychiatry, 20(11-12), 561–570.
Kuntsi, J., Eley, T. C., Taylor, A., Hughes, C., Asherson, P., Caspi, A., & Moffitt, T. E. (2004). Co-occurrence of ADHD and low IQ has genetic origins. American Journal of Medical Genetics Part B: Neuropsychiatric Genetics, 124(1), 41–47.
Kuntsi, J., Rogers, H., Swinard, G., Börger, N., van der Meere, J., Rijsdijk, F., & Asherson, P. (2006). Reaction time, inhibition, working memory and “delay aversion” performance: genetic influences and their interpretation. Psychological Medicine, 36(11), 1613–24.
Kuntsi, J., Wood, A. C., Van Der Meere, J., & Asherson, P. (2009). Why cognitive performance in ADHD may not reveal true potential: findings from a large population-based sample. Journal of the International Neuropsychological Society, 15(4), 570–9.
Lahey, B. B., Applegate, B., McBurnett, K., & Biederman, J. (1994). DMS-IV field trials for attention deficit hyperactivity disorder in children and adolescents. The American Journal of Psychiatry, 151(11), 1673–1685.
Lahey, B. B., Pelham, W. E., Loney, J., Lee, S. S., & Willcutt, E. (2005). Instability of the DSM-IV subtypes of ADHD from preschool through elementary school. Archives of General Psychiatry, 62(8), 896.
Langley, K., Fowler, T., Ford, T., Thapar, A. A. K., van den Bree, M., Harold, G., … O’Donovan, M. C. (2010). Adolescent clinical outcomes for young people with attention-deficit hyperactivity disorder. The British Journal of Psychiatry, 196(3), 235–240.
Langley, K., Heron, J., Smith, G. D., & Thapar, A. (2012). Maternal and Paternal Smoking During Pregnancy and Risk of ADHD Symptoms in Offspring: Testing for Intrauterine Effects. American Journal of Epidemiology, 176(3), 261–268.
Larson, K., Russ, S. A., Kahn, R. S., & Halfon, N. (2011). Patterns of comorbidity, functioning, and service use for US children with ADHD, 2007. Pediatrics, 127(3), 462–470.
Larsson, H., Anckarsater, H., Råstam, M., Chang, Z., & Lichtenstein, P. (2011). Childhood attention-deficit hyperactivity disorder as an extreme of a continuous trait: a quantitative genetic study of 8,500 twin pairs. Journal of Child Psychology and Psychiatry, 53(1), 73–80.
Larsson, H., Lichtenstein, P., & Larsson, J. O. (2006). Genetic contributions to the development of ADHD subtypes from childhood to adolescence. Journal of the American Academy of Child and Adolescent Psychiatry, 45(8), 973–981.

158
Lee, S. H., Ripke, S., Neale, B. M., Faraone, S. V, Purcell, S. M., Perlis, R. H., … Zöllner, S. (2013). Genetic relationship between five psychiatric disorders estimated from genome-wide SNPs. Nature Genetics, 45(9), 984–94.
Lencz, T., Knowles, E., Davies, G., Guha, S., Liewald, D. C., Starr, J. M., … Malhotra, A. K. (2014). Molecular genetic evidence for overlap between general cognitive ability and risk for schizophrenia: a report from the Cognitive Genomics consorTium (COGENT). Molecular Psychiatry, 19(2), 168–74.
Lencz, T., Morgan, T. V, Athanasiou, M., Dain, B., Reed, C. R., Kane, J. M., … Malhotra, A. K. (2007). Converging evidence for a pseudoautosomal cytokine receptor gene locus in schizophrenia. Molecular Psychiatry, 12(6), 572–80.
Levy, D., Ronemus, M., Yamrom, B., Lee, Y., Leotta, A., Kendall, J., … Ye, K. (2011). Rare de novo and transmitted copy-number variation in autistic spectrum disorders. Neuron, 70(5), 886–897.
Levy, F., Hay, D. A., Bennett, K. S., & McStephen, M. (2005). Gender differences in ADHD subtype comorbidity. Journal of the American Academy of Child and Adolescent Psychiatry, 44(4), 368–376.
Levy, F., Hay, D. A., McStephen, M., Wood, C., & Waldman, I. (1997). Attention-deficit hyperactivity disorder: a category or a continuum? Genetic analysis of a large-scale twin study. Journal of the American Academy of Child and Adolescent Psychiatry, 36(6), 737–744.
Lichtenstein, P., Carlström, E., Råstam, M., Gillberg, C., & Anckarsäter, H. (2010). The genetics of autism spectrum disorders and related neuropsychiatric disorders in childhood. American Journal of Psychiatry, 167(11), 1357–1363.
Lingam, R., Golding, J., Jongmans, M. J., Hunt, L. P., Ellis, M., & Emond, A. (2010). The association between developmental coordination disorder and other developmental traits. Pediatrics, 126(5), e1109–e1118.
Lionel, A. C., Crosbie, J., Barbosa, N., Goodale, T., Thiruvahindrapuram, B., Rickaby, J., … Wang, Z. (2011). Rare Copy Number Variation Discovery and Cross-Disorder Comparisons Identify Risk Genes for ADHD. Science Translational Medicine, 3(95), 95ra75.
Lo-Castro, A., D’Agati, E., & Curatolo, P. (2011). ADHD and genetic syndromes. Brain & Development, 33(6), 456–61.
Lord, C., Rutter, M., Goode, S., Heemsbergen, J., Jordan, H., Mawhood, L., & Schopler, E. (1989). Autism diagnostic observation schedule: a standardized observation of communicative and social behavior. Journal of Autism and Developmental Disorders, 19(2), 185–212.
Lord, C., Rutter, M., & Le Couteur, A. (1994). Autism Diagnostic Interview-Revised: a revised version of a diagnostic interview for caregivers of individuals with possible pervasive developmental disorders. Journal of Autism and Developmental Disorders, 24(5), 659–685.
Luke, B., & Keith, L. G. (1992). The contribution of singletons, twins and triplets to low birth weight, infant mortality and handicap in the United States. The Journal of Reproductive Medicine, 37(8), 661–6.

159
Lundström, S., Chang, Z., Kerekes, N., Gumpert, C. H., Råstam, M., Gillberg, C., … Anckarsäter, H. (2011). Autistic-like traits and their association with mental health problems in two nationwide twin cohorts of children and adults. Psychological Medicine, 41(11), 2423–2433.
Lundström, S., Chang, Z., Råstam, M., Gillberg, C., Larsson, H., Anckarsäter, H., … Lundstrom, S. (2012). Autism spectrum disorders and autisticlike traits: Similar etiology in the extreme end and the normal variation. Archives of General Psychiatry, 69(1), 46–52.
Ma, D., Salyakina, D., Jaworski, J. M., Konidari, I., Whitehead, P. L., Andersen, A. N., … Cukier, H. N. (2009). A genome-wide association study of autism reveals a common novel risk locus at 5p14. 1. Annals of Human Genetics, 73(3), 263–273.
Malhotra, A. K., Bates, J. A., Jaeger, J., Petrides, G., Robinson, D. G., Bilder, R. M., & Nassauer, K. W. (2002). No evidence for phenotypic variation between probands in case-control versus family-based association studies of schizophrenia. American Journal of Medical Genetics, 114(5), 509–11.
Mandy, W. P., Charman, T., & Skuse, D. H. (2012). Testing the construct validity of proposed criteria for DSM-5 autism spectrum disorder. Journal of the American Academy of Child and Adolescent Psychiatry, 51(1), 41–50.
Mandy, W. P., & Skuse, D. H. (2008). Research Review: What is the association between the social‐communication element of autism and repetitive interests, behaviours and activities? Journal of Child Psychology and Psychiatry, 49(8), 795–808.
Mangeot, S. D., Miller, L. J., McIntosh, D. N., McGrath-Clarke, J., Simon, J., Hagerman, R. J., … McGrath‐Clarke, J. (2001). Sensory modulation dysfunction in children with attention-deficit/hyperactivity disorder. Developmental Medicine & Child Neurology, 43(6), 399–406.
Mannuzza, S., Klein, R. G., Bessler, A., & Malloy, P. (1993). Adult outcome of hyperactive boys: educational achievement, occupational rank, and psychiatric status. Archives of General Psychiatry, 50(7), 565–576.
Mannuzza, S., Klein, R. G., Bessler, A., Malloy, P., & LaPadula, M. (1998). Adult psychiatric status of hyperactive boys grown up. American Journal of Psychiatry, 155(4), 493–498.
Marshall, C. R., Noor, A., Vincent, J. B., Lionel, A. C., Feuk, L., Skaug, J., … Ren, Y. (2008). Structural variation of chromosomes in autism spectrum disorder. The American Journal of Human Genetics, 82(2), 477–488.
Martin, J., Hamshere, M. L., O’Donovan, M. C., Rutter, M., & Thapar, A. (2013). Factor structure of autistic traits in children with ADHD. Journal of Autism and Developmental Disorders, 44(1), 204–15.
Martin, J., Hamshere, M. L., Stergiakouli, E., O’Donovan, M. C., & Thapar, A. (2014). Genetic Risk for Attention Deficit Hyperactivity Disorder Contributes to Neurodevelopmental Traits in the General Population. Biological Psychiatry.
Martin, J., O’Donovan, M. C., Thapar, A., Langley, K., & Williams, N. (n.d.). The relationship between common and rare genetic variants in ADHD.

160
Martin, N. C., Piek, J. P., & Hay, D. (2006). DCD and ADHD: a genetic study of their shared aetiology. Human Movement Science, 25(1), 110–24.
Matson, J. L., & Shoemaker, M. (2009). Intellectual disability and its relationship to autism spectrum disorders. Research in Developmental Disabilities, 30(6), 1107–1114.
Matsunaga, M. (2010). How to Factor-Analyze Your Data Right: Do’s, Don’ts, and How-To’s. International Journal of Psychological Research, 3(1), 97–110.
Maughan, B., & Carroll, J. (2006). Literacy and mental disorders. Current Opinion in Psychiatry, 19(4), 350–354.
Mayes, S. D., & Calhoun, S. L. (2006). Frequency of reading, math, and writing disabilities in children with clinical disorders. Learning and Individual Differences, 16(2), 145–157.
McLoughlin, G., Ronald, A., Kuntsi, J., Asherson, P., & Plomin, R. (2007). Genetic support for the dual nature of attention deficit hyperactivity disorder: substantial genetic overlap between the inattentive and hyperactive-impulsive components. Journal of Abnormal Child Psychology, 35(6), 999–1008.
Meltzer, H., Gatward, R., Goodman, R., Ford, T., & Melzer, H. (2000). Mental health of children and adolescents in Great Britain. The Stationery Office, 15(1-2), 185–7.
Mick, E., Todorov, A., Smalley, S., Hu, X., Loo, S., Todd, R. D., … Faraone, S. V. (2010). Family-based genome-wide association scan of attention-deficit/hyperactivity disorder. Journal of the American Academy of Child and Adolescent Psychiatry, 49(9), 898–905.e3.
Mukaddes, N. M., & Fateh, R. (2010). High rates of psychiatric co-morbidity in individuals with Asperger’s disorder. World Journal of Biological Psychiatry, 11(2), 486–492.
Mulligan, A., Anney, R. J., O’Regan, M., Chen, W., Butler, L., Fitzgerald, M., … Gill, M. (2009a). Autism symptoms in Attention-Deficit/Hyperactivity Disorder: a familial trait which correlates with conduct, oppositional defiant, language and motor disorders. Journal of Autism and Developmental Disorders, 39(2), 197–209.
Mulligan, A., Richardson, T., Anney, R. J. L., & Gill, M. (2009b). The Social Communication Questionnaire in a sample of the general population of school-going children. Irish Journal of Medical Science, 178(2), 193–199.
Musser, E. D., Hawkey, E., Kachan-Liu, S. S., Lees, P., Roullet, J.-B., Goddard, K., … Nigg, J. T. (2014). Shared familial transmission of autism spectrum and attention-deficit/hyperactivity disorders. Journal of Child Psychology and Psychiatry, and Allied Disciplines, 55(7), 819–827.
Muthén, L. K., & Muthén, B. O. (1998). Mplus user’s guide: The comprehensive modeling program for applied researchers. Los Angeles: Muthen & Muthen.
Neale, B. M. (2013). New data about the genetics of attention deficit hyperactivity disorder. In XXIst World Congress of Psychiatric Genetics. Boston, USA.
161
Neale, B. M., Kou, Y., Liu, L., Ma’ayan, A., Samocha, K. E., Sabo, A., … Cook Jr., E. H. (2012). Patterns and rates of exonic de novo mutations in autism spectrum disorders. Nature, 485(7397), 242–245.
Neale, B. M., Lasky-Su, J., Anney, R., Franke, B., Zhou, K., Maller, J., … Faraone, S. V. (2008). Genome-wide association scan of attention deficit hyperactivity disorder. American Journal of Medical Genetics (Neuropsychiatric Genetics), 147B(8), 1337–1344.
Neale, B. M., Medland, S. E., Ripke, S., Asherson, P., Franke, B., Lesch, K.-P. P., … Schafer, H. (2010a). Meta-analysis of genome-wide association studies of attention-deficit/hyperactivity disorder. Journal of the American Academy of Child and Adolescent Psychiatry, 49(9), 884–897.
Neale, B. M., Medland, S., Ripke, S., Anney, R. J. L., Asherson, P., Buitelaar, J., … Schäfer, H. (2010b). Case-control genome-wide association study of attention-deficit/hyperactivity disorder. Journal of the American Academy of Child and Adolescent Psychiatry, 49(9), 906–920.
Nigg, J. T., Willcutt, E. G., Doyle, A. E., & Sonuga-Barke, E. J. S. (2005). Causal heterogeneity in attention-deficit/hyperactivity disorder: do we need neuropsychologically impaired subtypes? Biological Psychiatry, 57(11), 1224–1230.
Nijmeijer, J. S., Hoekstra, P. J., Minderaa, R. B., Buitelaar, J. K., Altink, M. E., Buschgens, C. J. M., … Hartman, C. A. (2009). PDD symptoms in ADHD, an independent familial trait? Journal of Abnormal Child Psychology, 37(3), 443–453.
Nishiyama, T., Taniai, H., Miyachi, T., Ozaki, K., Tomita, M., & Sumi, S. (2009). Genetic correlation between autistic traits and IQ in a population-based sample of twins with autism spectrum disorders (ASDs). Journal of Human Genetics, 54(1), 56–61.
Norbury, C. F. (2014). Practitioner Review: Social (pragmatic) communication disorder conceptualization, evidence and clinical implications. Journal of Child Psychology and Psychiatry, and Allied Disciplines, 55(3), 204–216.
Nowicki, S., & Duke, M. P. (1994). Individual differences in the nonverbal communication of affect: The Diagnostic Analysis of Nonverbal Accuracy Scale. Journal of Nonverbal Behavior, 18(1), 9–35.
O’Roak, B. J., Vives, L., Girirajan, S., Karakoc, E., Krumm, N., Coe, B. P., … Eichler, E. E. (2012). Sporadic autism exomes reveal a highly interconnected protein network of de novo mutations. Nature, 485(7397), 246–250.
Oerlemans, A. M., Hartman, C. A., De Bruijn, Y. G. E., Van Steijn, D. J., Franke, B., Buitelaar, J. K., & Rommelse, N. N. J. (2014). Simplex and Multiplex Stratification in ASD and ADHD Families: A Promising Approach for Identifying Overlapping and Unique Underpinnings of ASD and ADHD? Journal of Autism and Developmental Disorders.
Office of National Statistics. (2001). Infant feeding survery, 2000. London: The Stationary Office.
Pettersson, E., Anckarsäter, H., Gillberg, C., & Lichtenstein, P. (2013). Different neurodevelopmental symptoms have a common genetic etiology. Journal of Child Psychology and Psychiatry, and Allied Disciplines, 54(12), 1356–1365.
162
Pickles, A., Starr, E., Kazak, S., Bolton, P., Papanikolaou, K., Bailey, A., … Rutter, M. (2000). Variable expression of the autism broader phenotype: findings from extended pedigrees. Journal of Child Psychology and Psychiatry, 41(4), 491–502.
Pine, D. S., Guyer, A. E., Goldwin, M., Towbin, K. A., & Leibenluft, E. (2008). Autism spectrum disorder scale scores in pediatric mood and anxiety disorders. Journal of the American Academy of Child and Adolescent Psychiatry, 47(6), 652–661.
Pinto, D., Pagnamenta, A. T., Klei, L., Anney, R., Merico, D., Regan, R., … Betancur, C. (2010). Functional impact of global rare copy number variation in autism spectrum disorders. Nature, 466(7304), 368–72.
Poelmans, G., Pauls, D. L., Buitelaar, J. K., & Franke, B. (2011). Integrated genome-wide association study findings: identification of a neurodevelopmental network for attention deficit hyperactivity disorder. American Journal of Psychiatry, 168(4), 365–377.
Poirier, M., Martin, J. S., Gaigg, S. B., & Bowler, D. M. (2011). Short-term memory in autism spectrum disorder. Journal of Abnormal Psychology, 120(1), 247–252.
Polanczyk, G., de Lima, M. S., Horta, B. L., Biederman, J., & Rohde, L. A. (2007). The worldwide prevalence of ADHD: a systematic review and metaregression analysis. American Journal of Psychiatry, 164(6), 942.
Polanczyk, G. V, Willcutt, E. G., Salum, G. A., Kieling, C., & Rohde, L. A. (2014). ADHD prevalence estimates across three decades: an updated systematic review and meta-regression analysis. International Journal of Epidemiology, 43(2), 434–442.
Polderman, T. J. C., Hoekstra, R. A., Vinkhuyzen, A. A. E., Sullivan, P. F., van der Sluis, S., & Posthuma, D. (2012). Attentional switching forms a genetic link between attention problems and autistic traits in adults. Psychological Medicine, 43(9), 1985–1996.
Posserud, M., Lundervold, A. J., & Gillberg, C. (2006). Autistic features in a total population of 7-9 year old children assessed by the ASSQ (Autism Spectrum Screening Questionnaire). Journal of Child Psychology and Psychiatry, 47(2), 167–175.
Purcell, S., Neale, B., Todd-Brown, K., Thomas, L., Ferreira, M. A., Bender, D., … Sham, P. C. (2007). PLINK: a tool set for whole-genome association and population-based linkage analyses. American Journal of Human Genetics, 81(3), 559–575.
Purcell, S., Wray, N. R., Stone, J. L., Visscher, P. M., O’Donovan, M. C., Sullivan, P. F., … Consortium, S. (2009). Common polygenic variation contributes to risk of schizophrenia and bipolar disorder. Nature, 460(7256), 748–752.
Reiersen, A. M. (2011). Links Between Autism Spectrum Disorder and ADHD Symptom Trajectories: Important Findings and Unanswered Questions. Journal of the American Academy of Child and Adolescent Psychiatry, 50(9), 857–859.
Reiersen, A. M., Constantino, J. N., Grimmer, M., Martin, N. G., & Todd, R. D. (2008a). Evidence for shared genetic influences on self-reported ADHD and autistic symptoms in young adult Australian twins. Twin Research and Human Genetics, 11(6), 579–585.

163
Reiersen, A. M., Constantino, J. N., & Todd, R. D. (2008b). Co-occurrence of motor problems and autistic symptoms in attention-deficit/hyperactivity disorder. Journal of the American Academy of Child and Adolescent Psychiatry, 47(6), 662–72.
Reiersen, A. M., Constantino, J. N., Volk, H. E., & Todd, R. D. (2007). Autistic traits in a population based ADHD twin sample. Journal of Child Psychology and Psychiatry, 48(5), 464–472.
Rhee, S. H., & Waldman, I. D. (2004). Etiology of sex differences in the prevalence of ADHD: An examination of inattention and hyperactivity–impulsivity. American Journal of Medical Genetics Part B: Neuropsychiatric Genetics, 127(1), 60–64.
Rhodes, S. M., Coghill, D. R., & Matthews, K. (2005). Neuropsychological functioning in stimulant-naive boys with hyperkinetic disorder. Psychological Medicine, 35(08), 1109–1120.
Ripke, S., Sanders, A. R., Kendler, K. S., Levinson, D. F., Sklar, P., Holmans, P. A., … Gejman, P. V. (2011). Genome-wide association study identifies five new schizophrenia loci. Nature Genetics, 43(10), 969–976.
Roberts, B. A., Martel, M. M., & Nigg, J. T. (2013). Are There Executive Dysfunction Subtypes Within ADHD? Journal of Attention Disorders.
Robertson, I. H., Ward, T., Ridgeway, V., & Nimmo-Smith, I. (1996). The structure of normal human attention: The Test of Everyday Attention. Journal of the International Neuropsychological Society, 2, 525–534.
Robinson, E. B., Koenen, K. C., McCormick, M. C., Munir, K., Hallett, V., Happé, F., … Ronald, A. (2011). Evidence that autistic traits show the same etiology in the general population and at the quantitative extremes (5%, 2.5%, and 1%). Archives of General Psychiatry, 68(11), 1113–21.
Robinson, E. B., Lichtenstein, P., Anckarsäter, H., Happé, F., & Ronald, A. (2013). Examining and interpreting the female protective effect against autistic behavior. Proceedings of the National Academy of Sciences, 110(13), 5258–62.
Rodriguez, A., Järvelin, M.-R., Obel, C., Taanila, A., Miettunen, J., Moilanen, I., … Kotimaa, A. J. (2007). Do inattention and hyperactivity symptoms equal scholastic impairment? Evidence from three European cohorts. BMC Public Health, 7(1), 327.
Rommelse, N. N. J., Altink, M. E., Fliers, E. A., Martin, N. C., Buschgens, C. J. M., Hartman, C. A., … Oosterlaan, J. (2009). Comorbid problems in ADHD: degree of association, shared endophenotypes, and formation of distinct subtypes. Implications for a future DSM. Journal of Abnormal Child Psychology, 37(6), 793–804.
Rommelse, N. N. J., Franke, B., Geurts, H. M., Hartman, C. A., & Buitelaar, J. K. (2010). Shared heritability of attention-deficit/hyperactivity disorder and autism spectrum disorder. European Child and Adolescent Psychiatry, 19(3), 281–295.
Rommelse, N. N. J., Geurts, H. M., Franke, B., Buitelaar, J. K., & Hartman, C. A. (2011). A review on cognitive and brain endophenotypes that may be common in autism spectrum disorder and attention-deficit/hyperactivity disorder and facilitate the search for pleiotropic genes. Neuroscience and Biobehavioral Reviews, 35(6), 1363–1396.
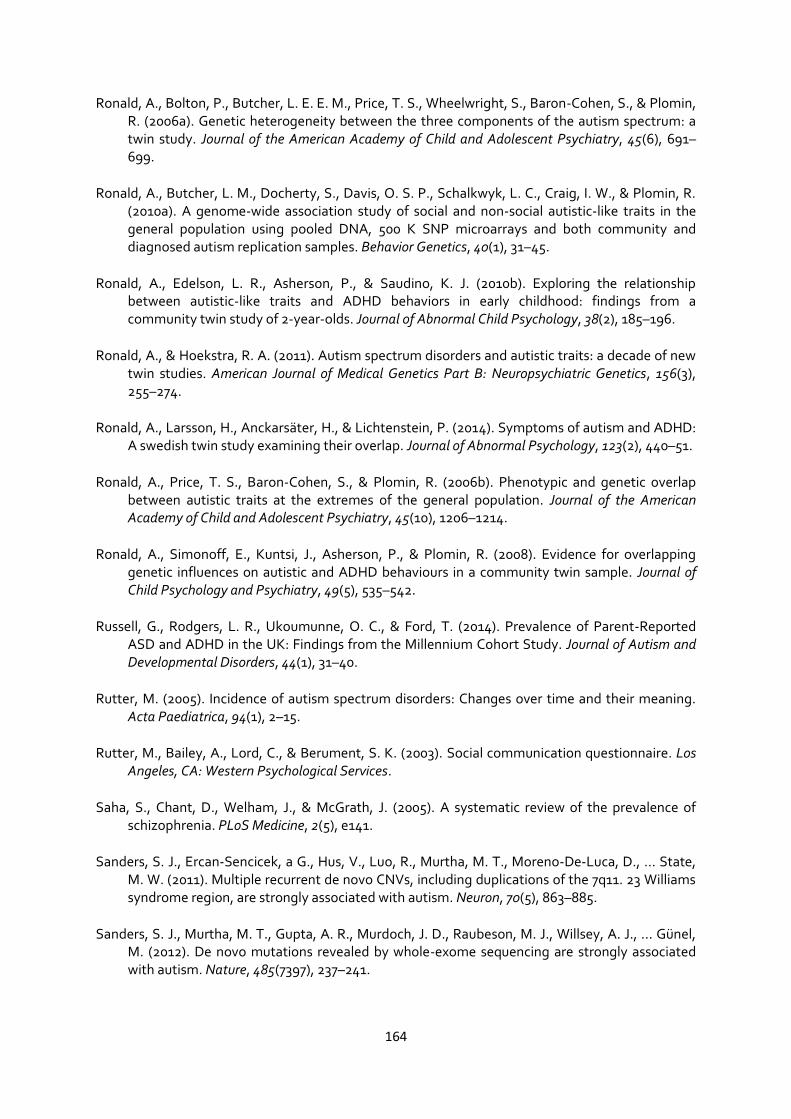
164
Ronald, A., Bolton, P., Butcher, L. E. E. M., Price, T. S., Wheelwright, S., Baron-Cohen, S., & Plomin, R. (2006a). Genetic heterogeneity between the three components of the autism spectrum: a twin study. Journal of the American Academy of Child and Adolescent Psychiatry, 45(6), 691–699.
Ronald, A., Butcher, L. M., Docherty, S., Davis, O. S. P., Schalkwyk, L. C., Craig, I. W., & Plomin, R. (2010a). A genome-wide association study of social and non-social autistic-like traits in the general population using pooled DNA, 500 K SNP microarrays and both community and diagnosed autism replication samples. Behavior Genetics, 40(1), 31–45.
Ronald, A., Edelson, L. R., Asherson, P., & Saudino, K. J. (2010b). Exploring the relationship between autistic-like traits and ADHD behaviors in early childhood: findings from a community twin study of 2-year-olds. Journal of Abnormal Child Psychology, 38(2), 185–196.
Ronald, A., & Hoekstra, R. A. (2011). Autism spectrum disorders and autistic traits: a decade of new twin studies. American Journal of Medical Genetics Part B: Neuropsychiatric Genetics, 156(3), 255–274.
Ronald, A., Larsson, H., Anckarsäter, H., & Lichtenstein, P. (2014). Symptoms of autism and ADHD: A swedish twin study examining their overlap. Journal of Abnormal Psychology, 123(2), 440–51.
Ronald, A., Price, T. S., Baron-Cohen, S., & Plomin, R. (2006b). Phenotypic and genetic overlap between autistic traits at the extremes of the general population. Journal of the American Academy of Child and Adolescent Psychiatry, 45(10), 1206–1214.
Ronald, A., Simonoff, E., Kuntsi, J., Asherson, P., & Plomin, R. (2008). Evidence for overlapping genetic influences on autistic and ADHD behaviours in a community twin sample. Journal of Child Psychology and Psychiatry, 49(5), 535–542.
Russell, G., Rodgers, L. R., Ukoumunne, O. C., & Ford, T. (2014). Prevalence of Parent-Reported ASD and ADHD in the UK: Findings from the Millennium Cohort Study. Journal of Autism and Developmental Disorders, 44(1), 31–40.
Rutter, M. (2005). Incidence of autism spectrum disorders: Changes over time and their meaning. Acta Paediatrica, 94(1), 2–15.
Rutter, M., Bailey, A., Lord, C., & Berument, S. K. (2003). Social communication questionnaire. Los Angeles, CA: Western Psychological Services.
Saha, S., Chant, D., Welham, J., & McGrath, J. (2005). A systematic review of the prevalence of schizophrenia. PLoS Medicine, 2(5), e141.
Sanders, S. J., Ercan-Sencicek, a G., Hus, V., Luo, R., Murtha, M. T., Moreno-De-Luca, D., … State, M. W. (2011). Multiple recurrent de novo CNVs, including duplications of the 7q11. 23 Williams syndrome region, are strongly associated with autism. Neuron, 70(5), 863–885.
Sanders, S. J., Murtha, M. T., Gupta, A. R., Murdoch, J. D., Raubeson, M. J., Willsey, A. J., … Günel, M. (2012). De novo mutations revealed by whole-exome sequencing are strongly associated with autism. Nature, 485(7397), 237–241.

165
Schachar, R. J., Crosbie, J., Barr, C. L., Ornstein, T. J., Kennedy, J., Malone, M., … Pathare, T. (2005). Inhibition of motor responses in siblings concordant and discordant for attention deficit hyperactivity disorder. The American Journal of Psychiatry, 162(6), 1076–82.
Schizophrenia Working Group of the Psychiatric Genomics Consortium. (2014). Biological insights from 108 schizophrenia-associated genetic loci. Nature, 511(7510), 421–427.
Sebat, J., Lakshmi, B., Malhotra, D., Troge, J., Lese-Martin, C., Walsh, T., … Kendall, J. (2007). Strong association of de novo copy number mutations with autism. Science, 316(5823), 445–449.
Shuster, J., Perry, A., Bebko, J., & Toplak, M. E. (2014). Review of factor analytic studies examining symptoms of autism spectrum disorders. Journal of Autism and Developmental Disorders, 44(1), 90–110.
Simonoff, E., Pickles, A., Charman, T., Chandler, S., Loucas, T., & Baird, G. (2008). Psychiatric disorders in children with autism spectrum disorders: prevalence, comorbidity, and associated factors in a population-derived sample. Journal of the American Academy of Child and Adolescent Psychiatry, 47(8), 921–929.
Sinzig, J., Morsch, D., Bruning, N., Schmidt, M. H., & Lehmkuhl, G. (2008a). Inhibition, flexibility, working memory and planning in autism spectrum disorders with and without comorbid ADHD-symptoms. Child and Adolescent Psychiatry and Mental Health, 2(1), 4.
Sinzig, J., Morsch, D., & Lehmkuhl, G. (2008b). Do hyperactivity, impulsivity and inattention have an impact on the ability of facial affect recognition in children with autism and ADHD? European Child and Adolescent Psychiatry, 17(2), 63–72.
Sklar, P., Ripke, S., Scott, L. J., Andreassen, O. A., Cichon, S., Craddock, N., … Purcell, S. M. (2011). Large-scale genome-wide association analysis of bipolar disorder identifies a new susceptibility locus near ODZ4. Nature Genetics, 43(10), 977–983.
Skuse, D. H. (2012). DSM-5’s conceptualization of autistic disorders. Journal of the American Academy of Child and Adolescent Psychiatry, 51(4), 344–346.
Skuse, D. H., Mandy, W. P. L., & Scourfield, J. (2005). Measuring autistic traits: heritability, reliability and validity of the Social and Communication Disorders Checklist. The British Journal of Psychiatry, 187(6), 568–572.
Smoller, J. W., Craddock, N., Kendler, K., Lee, P. H., Neale, B. M., Nurnberger, J. I., … Consortium, P. G. (2013). Identification of risk loci with shared effects on five major psychiatric disorders: a genome-wide analysis. Lancet, 381(9875), 1371–1379.
Sprich, S., Biederman, J., Crawford, M. H., Mundy, E., & Faraone, S. V. (2000). Adoptive and biological families of children and adolescents with ADHD. Journal of the American Academy of Child and Adolescent Psychiatry, 39(11), 1432–1437.
St Pourcain, B., Mandy, W. P., Heron, J., Golding, J., Davey Smith, G., & Skuse, D. H. (2011). Links between co-occurring social-communication and hyperactive-inattentive trait trajectories. Journal of the American Academy of Child and Adolescent Psychiatry, 50(9), 892–902.

166
St Pourcain, B., Skuse, D. H., Mandy, W. P., Wang, K., Hakonarson, H., Timpson, N. J., … Smith, G. D. (2014). Variability in the common genetic architecture of social-communication spectrum phenotypes during childhood and adolescence. Molecular Autism, 5(1), 18.
St Pourcain, B., Whitehouse, A. J. O., Ang, W. Q., Warrington, N. M., Glessner, J. T., Wang, K., … Smith, G. D. (2013). Common variation contributes to the genetic architecture of social communication traits. Molecular Autism, 4(1), 34.
Stahlberg, O., Soderstrom, H., Rastam, M., & Gillberg, C. (2004). Bipolar disorder, schizophrenia, and other psychotic disorders in adults with childhood onset AD/HD and/or autism spectrum disorders. Journal of Neural Transmission, 111(7), 891–902.
StataCorp. (2013). Stata Statistical Software. College Station, TX: StataCorp LP.
Steer, C. D., Golding, J., & Bolton, P. F. (2010). Traits contributing to the autistic spectrum. PLoS ONE, 5(9), e12633.
Stergiakouli, E., Hamshere, M., Holmans, P., Langley, K., Zaharieva, I., Hawi, Z., … Thapar, A. (2012). Investigating the contribution of common genetic variants to the risk and pathogenesis of ADHD. American Journal of Psychiatry, 169(2), 186–194.
Stergiakouli, E., Martin, J., Hamshere, M. L., Langley, K., Evans, D. M., St Pourcain, B., … Davey Smith, G. (2014). Shared Genetic Influences between Attention-Deficit Hyperactivity Disorder Traits in the General Population and Clinical Diagnosis in an Independent Sample. In XXIInd World Congress of Psychiatric Genetics. Copenhagen, Denmark.
Still, G. F. (1902). Some abnormal psychical conditions in children. Lancet, 1(1008), 1077–1082.
Sullivan, P. F., Lin, D., Tzeng, J. Y., van den Oord, E., Perkins, D., Stroup, T. S., … Zou, F. (2008). Genomewide association for schizophrenia in the CATIE study: results of stage 1. Molecular Psychiatry, 13(6), 570–584.
Sullivan, P. F., Magnusson, C., Reichenberg, A., Boman, M., Dalman, C., Davidson, M., … Lichtenstein, P. (2012). Family history of schizophrenia and bipolar disorder as risk factors for autism. Archives of General Psychiatry, 69(11), 1099–1103.
Szatmari, P., MacLean, J. E., Jones, M. B., Bryson, S. E., Zwaigenbaum, L., Bartolucci, G., … Tuff, L. (2000). The familial aggregation of the lesser variant in biological and nonbiological relatives of PDD probands: a family history study. Journal of Child Psychology and Psychiatry, 41(05), 579–586.
Talkowski, M. E., Rosenfeld, J. A., Blumenthal, I., Pillalamarri, V., Chiang, C., Heilbut, A., … Lindgren, A. M. (2012). Sequencing chromosomal abnormalities reveals neurodevelopmental loci that confer risk across diagnostic boundaries. Cell, 149(3), 525–537.
Taylor, M. J., Charman, T., Robinson, E. B., Plomin, R., Happé, F., Asherson, P., & Ronald, A. (2012). Developmental associations between traits of autism spectrum disorder and attention deficit hyperactivity disorder: a genetically informative, longitudinal twin study. Psychological Medicine, 43(8), 1735–1746.

167
Thapar, A., Cooper, M., Eyre, O., & Langley, K. (2013). What have we learnt about the causes of ADHD? Journal of Child Psychology and Psychiatry, and Allied Disciplines, 54(1), 3–16.
Thapar, A., & Harold, G. (2014). Editorial Perspective: Why is there such a mismatch between traditional heritability estimates and molecular genetic findings for behavioural traits? Journal of Child Psychology and Psychiatry, and Allied Disciplines, 55(10), 1088–1091.
The Wellcome Trust Case Control Consortium. (2007). Genome-wide association study of 14,000 cases of seven common diseases and 3,000 shared controls. Nature, 447(7145), 661–678.
Thede, L. L., & Coolidge, F. L. (2007). Psychological and neurobehavioral comparisons of children with Asperger’s disorder versus high-functioning autism. Journal of Autism and Developmental Disorders, 37(5), 847–854.
Towbin, K. E., Pradella, A., Gorrindo, T., Pine, D. S., & Leibenluft, E. (2005). Autism spectrum traits in children with mood and anxiety disorders. Journal of Child and Adolescent Psychopharmacology, 15(3), 452–464.
Trzaskowski, M., Dale, P., & Plomin, R. (2013). No Genetic Influence for Childhood Behavior Problems From DNA Analysis. Journal of the American Academy of Child & Adolescent Psychiatry, 52(10), 1048–1056.e3.
Tye, C., Mercure, E., Ashwood, K. L., Azadi, B., Asherson, P., Johnson, M. H., … McLoughlin, G. (2013). Neurophysiological responses to faces and gaze direction differentiate children with ASD, ADHD and ASD+ADHD. Developmental Cognitive Neuroscience, 5, 71–85.
Uekermann, J., Kraemer, M., Abdel-Hamid, M., Schimmelmann, B. G., Hebebrand, J., Daum, I., … Kis, B. (2010). Social cognition in attention-deficit hyperactivity disorder (ADHD). Neuroscience and Biobehavioral Reviews, 34(5), 734–743.
Uljarevic, M., & Hamilton, A. (2012). Recognition of emotions in autism: a formal meta-analysis. Journal of Autism and Developmental Disorders, 43(7), 1–10.
Van Steensel, F. J. a, Bögels, S. M., & de Bruin, E. I. (2013). Psychiatric comorbidity in children with Autism Spectrum Disorders: a comparison with children with ADHD. Journal of Child and Family Studies, 22(3), 1–9.
Visser, S., Bitsko, R., Danielson, M., Perou, R., & Blumberg, S. (2010). Increasing Prevalence of Parent-reported Attentiondeficit/ Hyperactivity Disorder Among Children - United States, 2003 and 2007. Morbidity & Mortality Weekly Report, 59(44), 1439–1443.
Voigt, R. G., Barbaresi, W. J., Colligan, R. C., Weaver, A. L., & Katusic, S. K. (2006). Developmental dissociation, deviance, and delay: occurrence of attention deficit hyperactivity disorder in individuals with and without borderline to mild intellectual disability. Developmental Medicine & Child Neurology, 48(10), 831–835.
Wang, K., Zhang, H., Ma, D., Bucan, M., Glessner, J. T., Abrahams, B. S., … Sleiman, P. M. A. (2009). Common genetic variants on 5p14. 1 associate with autism spectrum disorders. Nature, 459(7246), 528–533.

168
Wechsler, D. (1992). Wechsler Intelligence Scale for Children. 3rd Edition. The Psychological Association.
Wechsler, D. (1993). Wechsler objective reading dimensions. London: The Psychological Corporation.
Wechsler, D. (2003). Wechsler Intelligence Scale for Children - Fourth Edition (WISC-IV) administration and scoring manual. San Antonio, Tx: The Psychological Association.
Weiss, L. A. (2009). Autism genetics: emerging data from genome-wide copy-number and single nucleotide polymorphism scans. Expert Review of Molecular Diagnostics, 9(8), 795–803.
Weiss, L. A., Arking, D. E., Daly, M. J., Chakravarti, A., Brune, C. W., West, K., … West, A. B. (2009). A genome-wide linkage and association scan reveals novel loci for autism. Nature, 461(7265), 802–808.
West, A., Langley, K., Hamshere, M. L., Kent, L., Craddock, N., Owen, M. J., … Thapar, A. (2002). Evidence to suggest biased phenotypes in children with Attention Deficit Hyperactivity Disorder from completely ascertained trios. Molecular Psychiatry, 7(9), 962–6.
Willcutt, E. G. (2012). The prevalence of DSM-IV attention-deficit/hyperactivity disorder: a meta-analytic review. Neurotherapeutics: The Journal of the American Society for Experimental NeuroTherapeutics, 9(3), 490–9.
Willcutt, E. G., Nigg, J. T., Pennington, B. F., Solanto, M. V, Rohde, L. A., Tannock, R., … Lahey, B. B. (2012). Validity of DSM-IV attention deficit/hyperactivity disorder symptom dimensions and subtypes. Journal of Abnormal Psychology, 121(4), 991–1010.
Willcutt, E. G., Sonuga-Barke, E., Nigg, J., & Sergeant, J. (2008). Recent developments in neuropsychological models of childhood psychiatric disorders. In T. Banaschewski & L. . Rhode (Eds.), Biological Child Psychiatry: Recent Trends and Developments (pp. 195–226). Basel, Switzerland: Karger.
Williams, E., Thomas, K., Sidebotham, H., & Emond, A. (2008). Prevalence and characteristics of autistic spectrum disorders in the ALSPAC cohort. Developmental Medicine & Child Neurology, 50(9), 672–677.
Williams, N. M., Franke, B., Mick, E., Anney, R. J. L., Freitag, C. M., Gill, M., … Holmans, P. (2012). Genome-wide analysis of copy number variants in attention deficit hyperactivity disorder: the role of rare variants and duplications at 15q13. 3. American Journal of Psychiatry, 169(2), 195–204.
Williams, N. M., Zaharieva, I., Martin, A., Langley, K., Mantripragada, K., Fossdal, R., … Thapar, A. (2010). Rare chromosomal deletions and duplications in attention-deficit hyperactivity disorder: a genome-wide analysis. Lancet, 376(9750), 1401–1408.
Wolke, D., Waylen, A., Samara, M., Steer, C., Goodman, R., Ford, T., & Lamberts, K. (2009). Selective drop-out in longitudinal studies and non-biased prediction of behaviour disorders. The British Journal of Psychiatry, 195(3), 249–256.

169
Wray, N. R., Lee, S. H., Mehta, D., Vinkhuyzen, A. A. E., Dudbridge, F., & Middeldorp, C. M. (2014). Research Review: Polygenic methods and their application to psychiatric traits. Journal of Child Psychology and Psychiatry, 55(10), 1068–1087.
Yang, J., Lee, S. H., Goddard, M. E., & Visscher, P. M. (2011). GCTA: a tool for genome-wide complex trait analysis. American Journal of Human Genetics, 88(1), 76–82.
Yang, L., Neale, B. M., Liu, L., Lee, S. H., Wray, N. R., Ji, N., … Hu, X. (2013). Polygenic transmission and complex neuro developmental network for attention deficit hyperactivity disorder: Genome-wide association study of both common and rare variants. American Journal of Medical Genetics Part B: Neuropsychiatric Genetics, 162B(5), 419–430.
Yerys, B. E., Wallace, G. L., Harrison, B., Celano, M. J., Giedd, J. N., & Kenworthy, L. E. (2009a). Set-shifting in children with autism spectrum disorders. Autism, 13(5), 523–538.
Yerys, B. E., Wallace, G. L., Sokoloff, J. L., Shook, D. A., James, J. D., & Kenworthy, L. (2009b). Attention deficit/hyperactivity disorder symptoms moderate cognition and behavior in children with autism spectrum disorders. Autism Research, 2(6), 322–333.
Yochman, A., Parush, S., & Ornoy, A. (2004). Responses of preschool children with and without ADHD to sensory events in daily life. The American Journal of Occupational Therapy, 58(3), 294–302.
Yoshida, Y., & Uchiyama, T. (2004). The clinical necessity for assessing attention deficit/hyperactivity disorder (AD/HD) symptoms in children with high-functioning pervasive developmental disorder (PDD). European Child and Adolescent Psychiatry, 13(5), 307–314.
Yoshimasu, K., Barbaresi, W. J., Colligan, R. C., Voigt, R. G., Killian, J. M., Weaver, A. L., & Katusic, S. K. (2012). Childhood ADHD is strongly associated with a broad range of psychiatric disorders during adolescence: a population-based birth cohort study. Journal of Child Psychology and Psychiatry, 53(10), 1036–1043.
Zammit, S., Hamshere, M., Dwyer, S., Georgiva, L., Timpson, N., Moskvina, V., … Donovan, M. C. O. (2013). A Population-Based Study of Genetic Variation and Psychotic Experiences in Adolescents. Schizophrenia Bulletin.
Zammit, S., Lewis, G., Thapar, A., Owen, R., Jones, G., Jones, S., … Owen, M. J. (2005). Phenotypic variation between parent-offspring trios and non-trios in genetic studies of schizophrenia. Journal of Psychiatric Research, 40(7), 622–626.
Zhou, K., Dempfle, A., Arcos Burgos, M., Bakker, S. C., Banaschewski, T., Biederman, J., … Ebstein, R. P. (2008). Meta analysis of genome wide linkage scans of attention deficit hyperactivity disorder. American Journal of Medical Genetics Part B: Neuropsychiatric Genetics, 147(8), 1392–1398.
Zuur, A. F., Ieno, E. N., Walker, N. J., Saveliev, A. A., & Smith, G. M. (2009). Zero-truncated and zero-inflated models for count data. In Mixed effects models and extensions in ecology with R (pp. 261–293). Springer.

170
Appendices
Appendix 2.1: The Social Communication Questionnaire
This table has been removed by the author for copyright reasons.
Appendix 2.2: Quality control procedures for genetic data
Clinical ADHD sample
Individual and SNP quality control assessment was performed in PLINK by Dr Evie Stergiakouli. 800
control individuals were excluded according to WTCCC‐Phase 2 recommendations. Cases and
controls were excluded if they had a call rate lower than 99% or extreme (low or high)
heterozygosity. Where there was evidence of relatedness (proportion of identity by descent (IBD) of
more than 6%, corresponding to a genetic relationship of half first cousins or closer), one individual
from each related pair was excluded. Principal component analysis was performed using
EIGENSTRAT after merging the data with unrelated European, Asian and Yoruban samples from
the HapMap project. After plotting the first two principal components, cases were excluded if they
did not cluster with the European samples. Also, individual SNPs were excluded if they had a call
rate less than 99%, had a minor allele frequency less than 1%, deviated from Hardy-Weinberg
equilibrium at p<1×10⁻⁵, or had more than 1% discordant genotypes between the Illumina 550K and
the Illumina Human 1.2M BeadChip arrays.
ALSPAC sample
Individuals were excluded from analysis on the basis of having incorrect gender assignments;
minimal or excessive heterozygosity (<0.320 and >0.345 for the Sanger data and <0.310 and >0.330
for the LabCorp data); disproportionate levels of individual missingness (>3%); evidence of cryptic
relatedness (>10% identity by descent (IBD)) and being of non-European ancestry (as detected by a
multidimensional scaling analysis seeded with HapMap 2 individuals; EIGENSTRAT analysis

171
revealed no obvious population stratification and genome-wide analyses with other phenotypes
indicate a low genomic inflation factor, lambda (λ)). SNPs with a minor allele frequency of <1% and
call rate of <95% were removed. Furthermore, only SNPs which passed an exact test of Hardy-
Weinberg equilibrium (p >5 × 10⁻⁷) were considered for further use.
Appendix 2.3: The Social and Communication Disorders Checklist
This table has been removed by the author for copyright reasons.
Appendix 2.4: The Children’s Communication Checklist – pragmatic language subscales
This table has been removed by the author for copyright reasons.

172
Appendix 3.1: Pattern matrix of loadings for factor analysis of SCQ items and ADHD symptoms:
5-factor solution
Factor 1 Factor 2 Factor 3 Factor 4 Factor 5
SCQ 36 0.78
SCQ 37 0.76
SCQ 39 0.76
SCQ 27 0.73
SCQ 34 0.70
SCQ 30 0.67
0.25 SCQ 40 0.64
SCQ 38 0.64
SCQ 35 0.61
0.23
SCQ 31 0.60
SCQ 29 0.60
SCQ 33 0.60
SCQ 28 0.47
0.47 SCQ 26 0.46 0.27
SCQ 2 0.37
SCQ 21 0.32
0.32
SCQ 3 0.31 0.25
0.27 SCQ 20 0.23 0.22
SCQ 10 0.22
SCQ 8
0.73
SCQ 4
0.73
SCQ 17
0.73
SCQ 7
0.69
SCQ 13
0.69
SCQ 16
0.64
SCQ 12
0.62
SCQ 5
0.60
SCQ 11
0.57
SCQ 9
0.53
SCQ 15
0.52
SCQ 6
0.47
SCQ 14
0.46
SCQ 19
0.40
SCQ 18 0.22 0.35
0.23
ADHD IN 07
0.78
ADHD IN 02
0.75
ADHD IN 08
0.73
ADHD IN 01
0.69
ADHD IN 09
0.68
ADHD IN 03
0.59
ADHD IN 04
0.23 0.57
ADHD IN 06
0.55
ADHD IN 05
0.47
ADHD HYP 04
0.83 0.20
ADHD HYP 03
0.76
ADHD HYP 02
0.20 0.75
ADHD HYP 01
0.61
ADHD HYP 05
0.21 0.60
ADHD IMP 01 0.29
0.47
ADHD IMP 04
0.34
0.43
ADHD IMP 02
0.35

173
SCQ 32
0.73 SCQ 22 0.28
0.67
SCQ 23
0.61 SCQ 24
0.52
ADHD IMP 03
0.20
SCQ: Social Communication Questionnaire; IMP: Impulsive symptoms; HYP: Hyperactive symptoms; INA: Inattentive
symptoms. To aid interpretation, loadings of <0.2 are not presented.
Appendix 3.2: Pattern matrix of loadings for factor analysis of SCQ items; Children with ID
excluded
SCQ item Factor 1 –
social Factor 2 –
rigidity
Factor 3 – non-verbal
communication
SCQ 39 0.79
SCQ 34 0.78
SCQ 36 0.76
SCQ 37 0.73
SCQ 30 0.73
SCQ 29 0.72
SCQ 40 0.68
SCQ 27 0.67
SCQ 35 0.64
SCQ 38 0.64
SCQ 31 0.59
SCQ 28 0.57
0.33 SCQ 33 0.54
SCQ 26 0.44 0.30
SCQ 2 0.31
0.22
SCQ 20 0.24
SCQ 10
SCQ 8
0.83
SCQ 4
0.80 0.22 SCQ 17
0.71
SCQ 13
0.71
SCQ 7
0.68
SCQ 16
0.65
SCQ 5
0.60
SCQ 15
0.57
SCQ 9
0.53
SCQ 6
0.50
SCQ 12
0.50
SCQ 11
0.49
SCQ 14
0.46
SCQ 18
0.41
SCQ 3 0.21 0.38 0.31 SCQ 19
0.36
SCQ 32
0.72
SCQ 24
0.66 SCQ 22 0.29
0.66
SCQ 23
0.63 SCQ 21 0.34
0.36
N=497; SCQ: Social Communication Questionnaire. To aid interpretation, loadings of <0.2 are not presented.
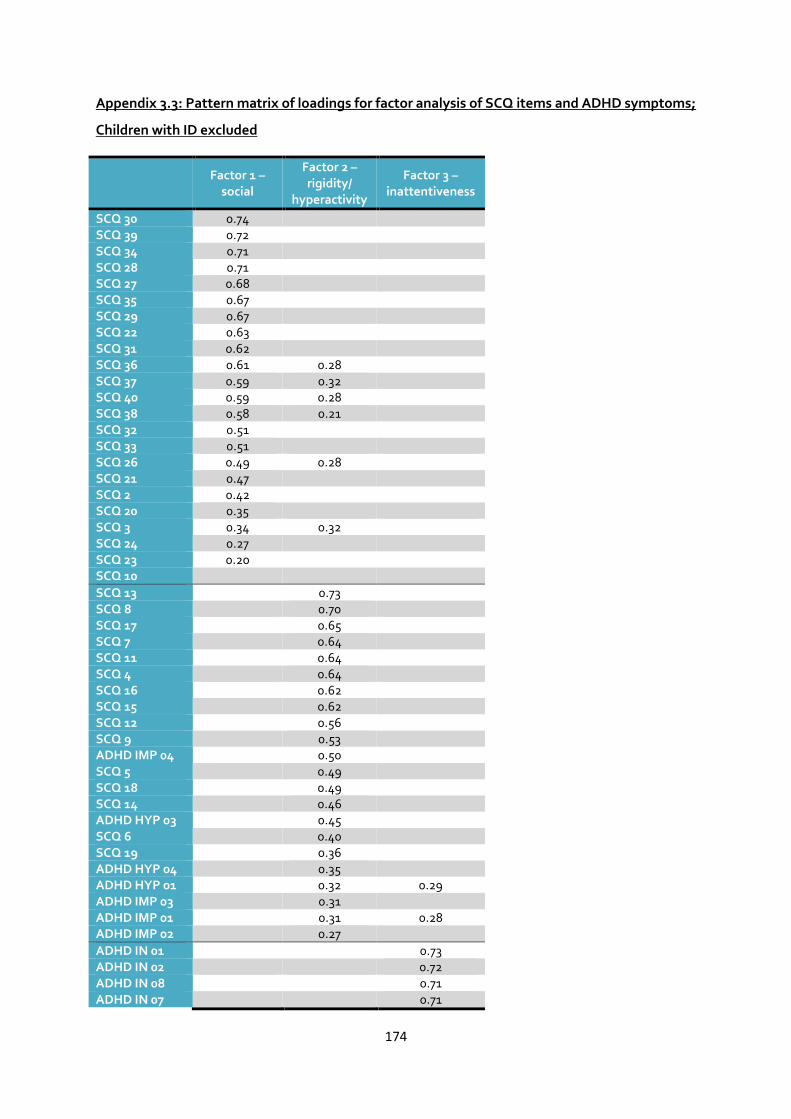
174
Appendix 3.3: Pattern matrix of loadings for factor analysis of SCQ items and ADHD symptoms;
Children with ID excluded
Factor 1 –
social
Factor 2 – rigidity/
hyperactivity
Factor 3 – inattentiveness
SCQ 30 0.74
SCQ 39 0.72
SCQ 34 0.71
SCQ 28 0.71
SCQ 27 0.68
SCQ 35 0.67
SCQ 29 0.67
SCQ 22 0.63
SCQ 31 0.62
SCQ 36 0.61 0.28
SCQ 37 0.59 0.32
SCQ 40 0.59 0.28
SCQ 38 0.58 0.21
SCQ 32 0.51
SCQ 33 0.51
SCQ 26 0.49 0.28
SCQ 21 0.47
SCQ 2 0.42
SCQ 20 0.35
SCQ 3 0.34 0.32
SCQ 24 0.27
SCQ 23 0.20
SCQ 10
SCQ 13
0.73
SCQ 8
0.70
SCQ 17
0.65
SCQ 7
0.64
SCQ 11
0.64
SCQ 4
0.64
SCQ 16
0.62
SCQ 15
0.62
SCQ 12
0.56
SCQ 9
0.53
ADHD IMP 04
0.50
SCQ 5
0.49
SCQ 18
0.49
SCQ 14
0.46
ADHD HYP 03
0.45
SCQ 6
0.40
SCQ 19
0.36
ADHD HYP 04
0.35
ADHD HYP 01
0.32 0.29 ADHD IMP 03
0.31
ADHD IMP 01
0.31 0.28
ADHD IMP 02
0.27
ADHD IN 01
0.73 ADHD IN 02
0.72
ADHD IN 08
0.71 ADHD IN 07
0.71

175
ADHD IN 09
0.64 ADHD IN 03
0.63
ADHD IN 06
0.59 ADHD IN 04
0.55
ADHD IN 05
0.45 ADHD HYP 02
0.25 0.42
ADHD HYP 05
0.35 0.38
N=478; SCQ: Social Communication Questionnaire; IMP: Impulsive symptoms; HYP: Hyperactive symptoms; INA:
Inattentive symptoms. To aid interpretation, loadings of <0.2 are not presented.
Appendix 3.4: Pattern matrix of loadings for factor analysis of SCQ items; Females excluded
SCQ item Factor 1 –
social Factor 2 –
rigidity
Factor 3 – non-verbal
communication
SCQ 39 0.81
SCQ 36 0.81
SCQ 37 0.80
SCQ 34 0.76
SCQ 40 0.72
SCQ 27 0.71
SCQ 33 0.68
SCQ 38 0.67
SCQ 30 0.65
0.21 SCQ 35 0.63
0.29
SCQ 29 0.63
SCQ 31 0.53
0.21 SCQ 28 0.53
0.35
SCQ 26 0.41 0.30 0.21 SCQ 2 0.38
SCQ 3 0.36 0.23
SCQ 20 0.25
SCQ 10 0.20
SCQ 8
0.82
SCQ 4
0.79
SCQ 13
0.78
SCQ 17
0.75
SCQ 7
0.66
SCQ 16
0.64
SCQ 5
0.62
SCQ 9
0.58
SCQ 12
0.57
SCQ 15
0.57
SCQ 11
0.55
SCQ 14
0.52
SCQ 6
0.48
SCQ 18
0.43
SCQ 19
0.34
SCQ 32
0.72
SCQ 22 0.24
0.69 SCQ 24
0.68
SCQ 23
0.66 SCQ 21 0.27
0.41
N=472; SCQ: Social Communication Questionnaire. To aid interpretation, loadings of <0.2 are not presented.

176
Appendix 3.5: Pattern matrix of loadings for factor analysis of SCQ items and ADHD symptoms;
Females excluded
Factor 1 –
social Factor 2 – rigidity/
hyperactivity Factor 3 –
inattentiveness
SCQ 39 0.74
SCQ 30 0.72
SCQ 34 0.72
SCQ 27 0.72
SCQ 35 0.71
SCQ 28 0.67
SCQ 36 0.66 0.30
SCQ 29 0.64
SCQ 22 0.62
SCQ 38 0.61 0.20
SCQ 37 0.60 0.31
SCQ 40 0.60 0.24
SCQ 31 0.60
SCQ 33 0.56
SCQ 26 0.51 0.25
SCQ 32 0.45
SCQ 21 0.45
SCQ 3 0.42 0.25
SCQ 2 0.41
SCQ 24 0.34
SCQ 20 0.33
SCQ 10 0.22
SCQ 13
0.75
SCQ 8
0.67
SCQ 17
0.65
SCQ 7
0.65
SCQ 11
0.64
SCQ 4
0.64
SCQ 12
0.62
SCQ 16
0.61
SCQ 15
0.58
SCQ 9
0.57
SCQ 5
0.53
SCQ 18
0.52
SCQ 14
0.51
ADHD IMP 04
0.48
ADHD HYP 03
0.43
SCQ 6
0.43
ADHD HYP 05
0.39 0.33 ADHD HYP 01
0.37 0.28
ADHD HYP 04
0.35
ADHD IMP 01
0.35
ADHD IMP 03
0.34
SCQ 19
0.34
ADHD IMP 02
0.28
SCQ 23
ADHD IN 01
0.75 ADHD IN 02
0.71
ADHD IN 07
0.68 ADHD IN 09
0.67

177
ADHD IN 08
0.67 ADHD IN 03
0.64
ADHD IN 04
0.58 ADHD IN 06
0.56
ADHD IN 05
0.48 ADHD HYP 02
0.35 0.41
N=450; SCQ: Social Communication Questionnaire; IMP: Impulsive symptoms; HYP: Hyperactive symptoms; INA:
Inattentive symptoms. To aid interpretation, loadings of <0.2 are not presented.

178
Appendix 5.1: Associations of polygenic score with ADHD and ASD-related phenotypes in ALSPAC
Outcome N
ZINB count outcome
ZINB zero-inflated outcome
ZINB overall
p
ZINB overall R2
Linear regression*
β SE p β SE p β SE p R2
ADHD total traits 5661 0.12 0.10 0.25 -0.06 0.02 0.006 0.0024 0.004 0.033 0.013 0.012 0.001
ADHD hyperactive-impulsive traits
5661 0.16 0.12 0.19 -0.05 0.02 0.031 0.0034 0.002 0.037 0.013 0.005 0.0006
ADHD inattentive traits 5656 0.07 0.13 0.58 -0.04 0.02 0.025 0.037 0.003 0.023 0.013 0.075 0.001
SCDC total score 5653 0.13 0.14 0.36 0.02 0.04 0.66 0.42 <0.001 0.012 0.013 0.36 0.0001
CCC pragmatic language score
5641 N/A -0.028 0.013 0.038 0.0008
All analyses using gender and all 10 principal components from EIGENSTRAT analyses as covariates. * Linear regression results of ADHD and SCDC phenotypes included only for ease of
interpretation. ADHD, attention-deficit/hyperactivity disorder; ALSPAC, Avon Longitudinal Study of Parents and Children; ASD, autism spectrum disorder; CCC, Children’s Communication
Checklist; SCDC, Social and Communication Disorders Checklist; GWAS, genome-wide association study; ZINB, zero-inflated negative binomial. Polygenic scores derived using a threshold
of p<0.5 in the discovery sample GWAS results.

179
Appendix 5.2: Associations of ADHD and ASD-related phenotypes with ADHD polygenic scores calculated based on the primary discovery sample,
using a variety of p-value thresholds (linear regressions)
ADHD T: attention deficit hyperactivity disorder total traits; SCDC: Social and Communication Disorders Checklist; CCC PL: Children’s Communication Checklist pragmatic language score.
Main results are based on polygenic scores derived using a threshold of p<0.5 (striped bars).

180
Appendix 6.1: Associations between polygenic risk scores with ADHD traits and neurocognitive
measures as correlated outcomes
Figure 6.1a
Figure 6.1b

181
Figure 6.1c
Figure 6.1d
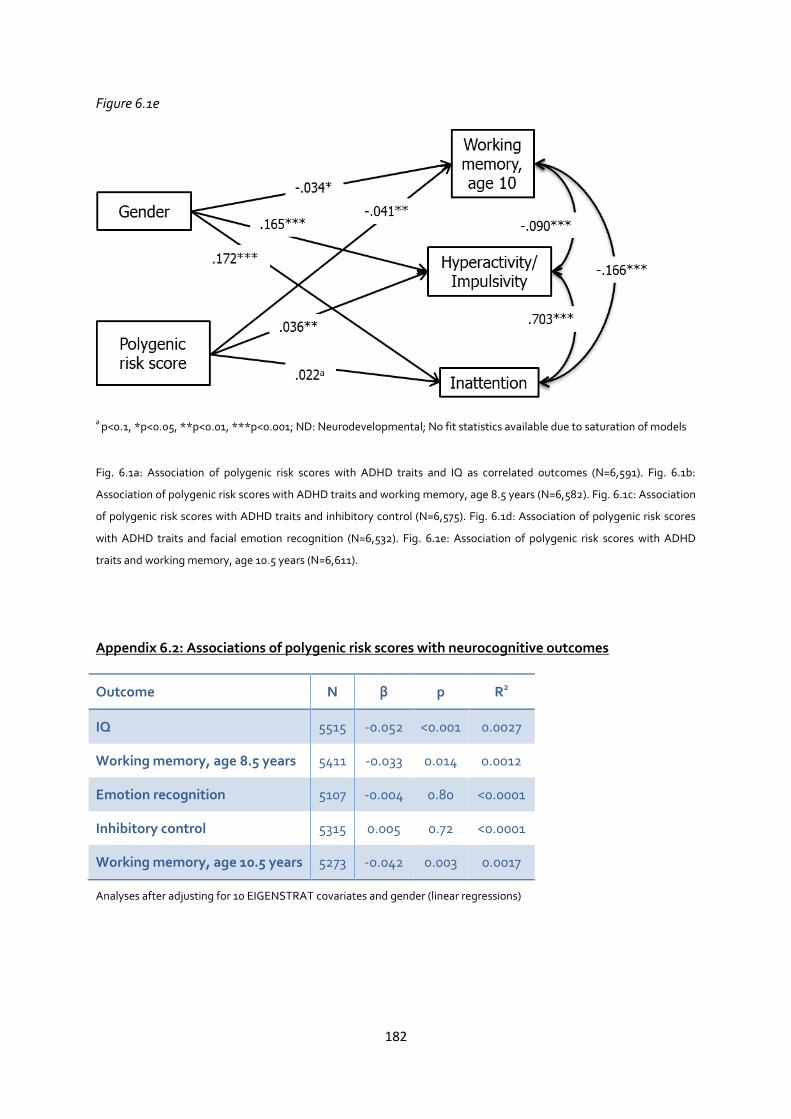
182
Figure 6.1e
a p<0.1, *p<0.05, **p<0.01, ***p<0.001; ND: Neurodevelopmental; No fit statistics available due to saturation of models
Fig. 6.1a: Association of polygenic risk scores with ADHD traits and IQ as correlated outcomes (N=6,591). Fig. 6.1b:
Association of polygenic risk scores with ADHD traits and working memory, age 8.5 years (N=6,582). Fig. 6.1c: Association
of polygenic risk scores with ADHD traits and inhibitory control (N=6,575). Fig. 6.1d: Association of polygenic risk scores
with ADHD traits and facial emotion recognition (N=6,532). Fig. 6.1e: Association of polygenic risk scores with ADHD
traits and working memory, age 10.5 years (N=6,611).
Appendix 6.2: Associations of polygenic risk scores with neurocognitive outcomes
Outcome N β p R2
IQ 5515 -0.052 <0.001 0.0027
Working memory, age 8.5 years 5411 -0.033 0.014 0.0012
Emotion recognition 5107 -0.004 0.80 <0.0001
Inhibitory control 5315 0.005 0.72 <0.0001
Working memory, age 10.5 years 5273 -0.042 0.003 0.0017
Analyses after adjusting for 10 EIGENSTRAT covariates and gender (linear regressions)
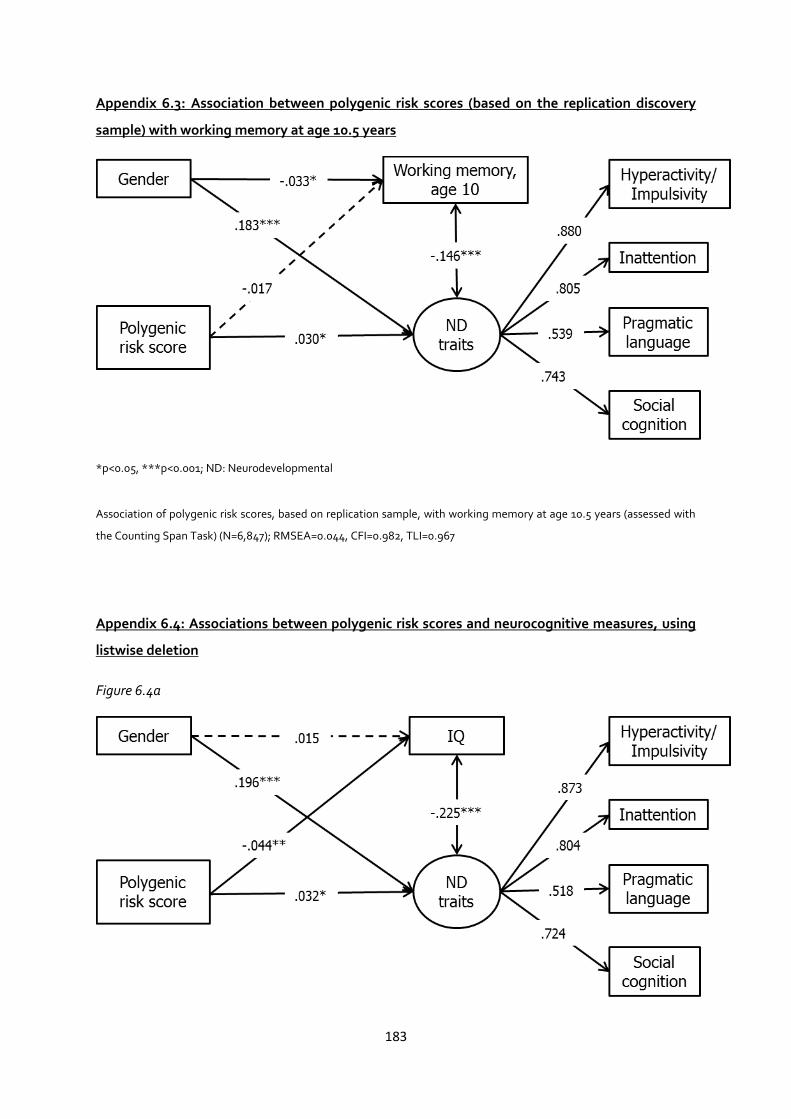
183
Appendix 6.3: Association between polygenic risk scores (based on the replication discovery
sample) with working memory at age 10.5 years
*p<0.05, ***p<0.001; ND: Neurodevelopmental
Association of polygenic risk scores, based on replication sample, with working memory at age 10.5 years (assessed with
the Counting Span Task) (N=6,847); RMSEA=0.044, CFI=0.982, TLI=0.967
Appendix 6.4: Associations between polygenic risk scores and neurocognitive measures, using
listwise deletion
Figure 6.4a

184
Figure 6.4b
Figure 6.4c
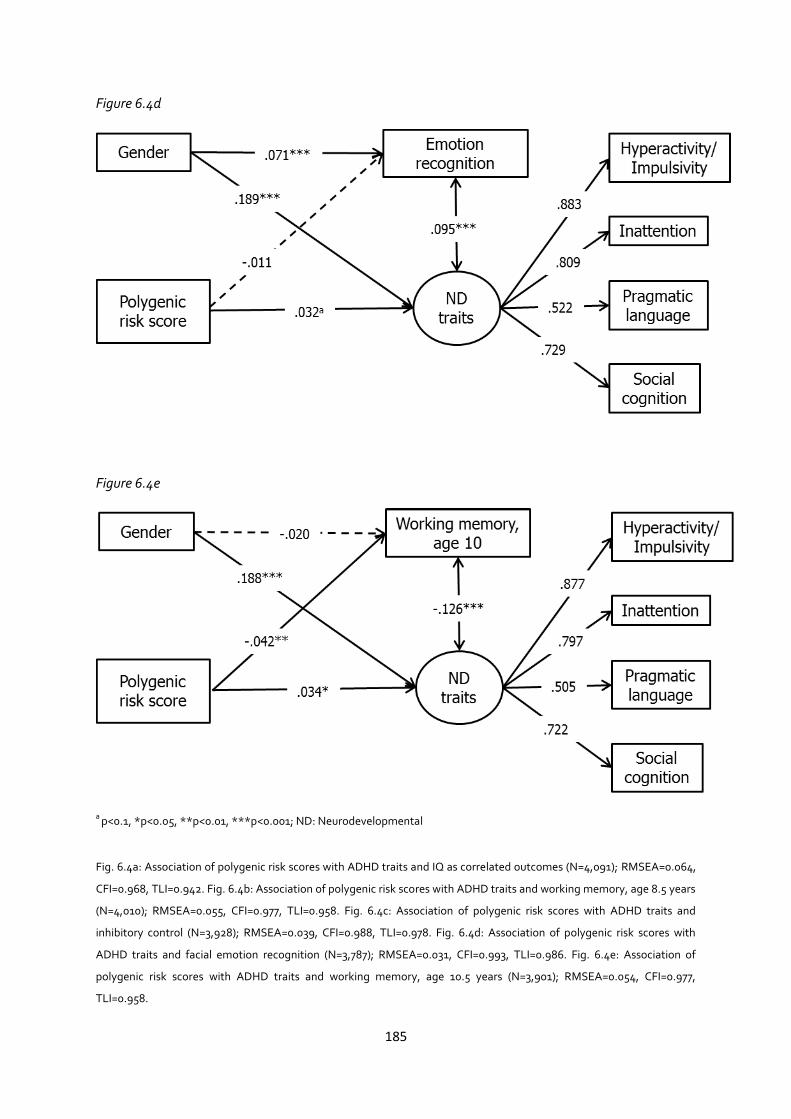
185
Figure 6.4d
Figure 6.4e
a p<0.1, *p<0.05, **p<0.01, ***p<0.001; ND: Neurodevelopmental
Fig. 6.4a: Association of polygenic risk scores with ADHD traits and IQ as correlated outcomes (N=4,091); RMSEA=0.064,
CFI=0.968, TLI=0.942. Fig. 6.4b: Association of polygenic risk scores with ADHD traits and working memory, age 8.5 years
(N=4,010); RMSEA=0.055, CFI=0.977, TLI=0.958. Fig. 6.4c: Association of polygenic risk scores with ADHD traits and
inhibitory control (N=3,928); RMSEA=0.039, CFI=0.988, TLI=0.978. Fig. 6.4d: Association of polygenic risk scores with
ADHD traits and facial emotion recognition (N=3,787); RMSEA=0.031, CFI=0.993, TLI=0.986. Fig. 6.4e: Association of
polygenic risk scores with ADHD traits and working memory, age 10.5 years (N=3,901); RMSEA=0.054, CFI=0.977,
TLI=0.958.


![ACCOUNTANCY EXAMINING BOARD[193A]](https://static.fdokumen.com/doc/165x107/6323acc9be5419ea700eb5e1/accountancy-examining-board193a.jpg)