Evolving pest complexes and IPM strategies for cotton in the ...
24
Scott Stewart and my colleagues Evolving pest complexes and IPM strategies for cotton in the Midsouth and Southeast Lygus lineolaris
-
Upload
khangminh22 -
Category
Documents
-
view
3 -
download
0
Transcript of Evolving pest complexes and IPM strategies for cotton in the ...

Scott Stewart and my colleagues
Evolving pest complexes and IPM strategies for cotton in the Midsouth and Southeast
Lygus lineolaris

IPM – Some Factors Causing Shifts
Technological advances Boll weevil eradication, Bt cotton, New insecticides
Insecticide resistance, cancellation or regulation
Changes in production systems
Tillage, planting dates, variety maturity, crop ratios, non-crop ratios such as CRP, etc.
Perception and knowledge - increased “appreciation” for potential impact of emerged pests
Cotton Insect Losses, 1991 – 2011 (Mike Williams) http://www.entomology.msstate.edu/resources/tips/cotton-losses/data/

Boll Weevil Eradication Insecticide Applications by Growers
Number per Acre
0
1
2
3
4
5
6
1990 1995 2000 2005 2010
TN MS GA

Adoption of GMO Technologies, USA
% of Acres Source: Fernandez-Cornejo, USDA ERS
0 10 20 30 40 50 60 70 80 90
100
HT Soybean
HT Cotton
Bt Cotton Bt Corn
HT Corn
But higher adoption in Midsouth and Southeast

Bt Cotton (WideStrike) vs. Non-Bt
G. Lorenz (University of Arkansas)

0
1
2
3
4
5
6
1990 1995 2000 2005 2010
TN MS GA
The Heliothine Decline Insecticide Applications
Number per Acre
BT 1
BT 2
1996
2003

Yield Loss Caused by Arthropod Pests
0
5
10
15
20
25
30
1990 1995 2000 2005 2010
TN MS GA
% Loss
More stability (and yields have increased)

0
1
2
3
4
5
6
1990 1995 2000 2005 2010
TN MS GA
The Plant Bug Incline Insecticide Applications
Number per Acre
Lygus lineolaris
0
0.5
1
1.5
2
1990 1995 2000 2005 2010
TN MS GA
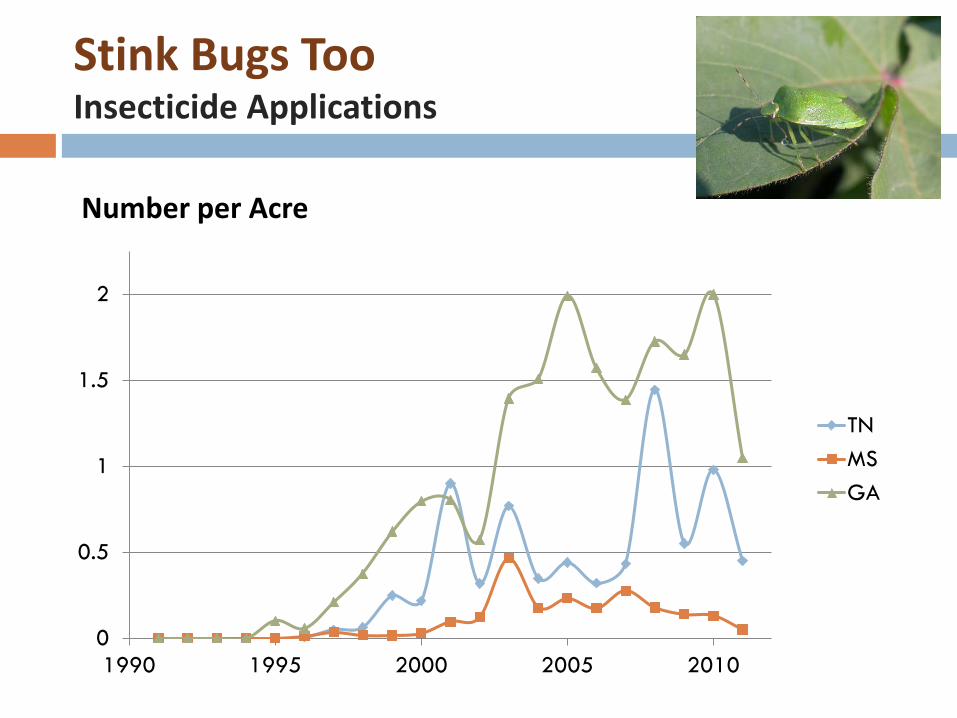
Stink Bugs Too Insecticide Applications
Number per Acre

0
1
2
3
4
5
6
1990 1995 2000 2005 2010
TN MS GA
Plant Bugs and Stink Bugs Insecticide Applications
Number per Acre
Hemipteran pests filling the void

0
2
4
6
8
10
12
14
1990 1995 2000 2005 2010
TN MS GA
Total Insecticide Applications All Pests
Number per Acre
Majority targeting hemipteran pests

Hemiptera … potential impacts on yield Tarnished plant bug and stink bugs
5 applications for complex of plant bugs and stink bugs (2010)
1778 Lbs
776 Lbs
0
200
400
600
800
1000
1200
1400
1600
1800
Foliar Insecticides Not Treated
Lint Yield / Acre
$1244
$543
0
250
500
750
1000
1250
Foliar Insecticides Not Treated
Gross Crop Value ($/Acre)

What’s the Solution?
Core of IPM Program will rely on insecticides Must use in the best possible way
Increased resistance to existing insecticides Great need for new modes of action
Diamond (novaluron), Transform (sulfoxaflor)
Early planting and early maturing cotton varieties (B. Adams, et al.) Other cultural controls also have some value
Biological control and host plant resistance have mostly been a bust Transgenic cotton with resistance to Lygus ???

Tarnished Plant Bug Insecticide Resistance Orthene and Bidrin, Midsouthern states (J. Gore, MSU)
50
55
60
65
70
75
80
85
90
95
100
1993 1994 1995 1996 1997 1998 1999 2000 2001 2002 2003 2004 2005 2006 2007
Max
imum
Per
cent
Con
trol
Data from 123 tests from Arthropod Management Tests, 1994-2008
And generally higher rates

Size matters … Size matters … Size matters … Size matters
Tarnished Plant Bug (Tennessee, 2010)
0
5
10
15
20
25
30
5 DAT1 6 DAT2 (11 DAT1)
Not Treated Centric (2 oz)
Num
bers
/ 5
Row
Ft
40% Control
80% Control
Even a decent treatment can “fail”
Num
bers
/ 1
0 Ro
w F
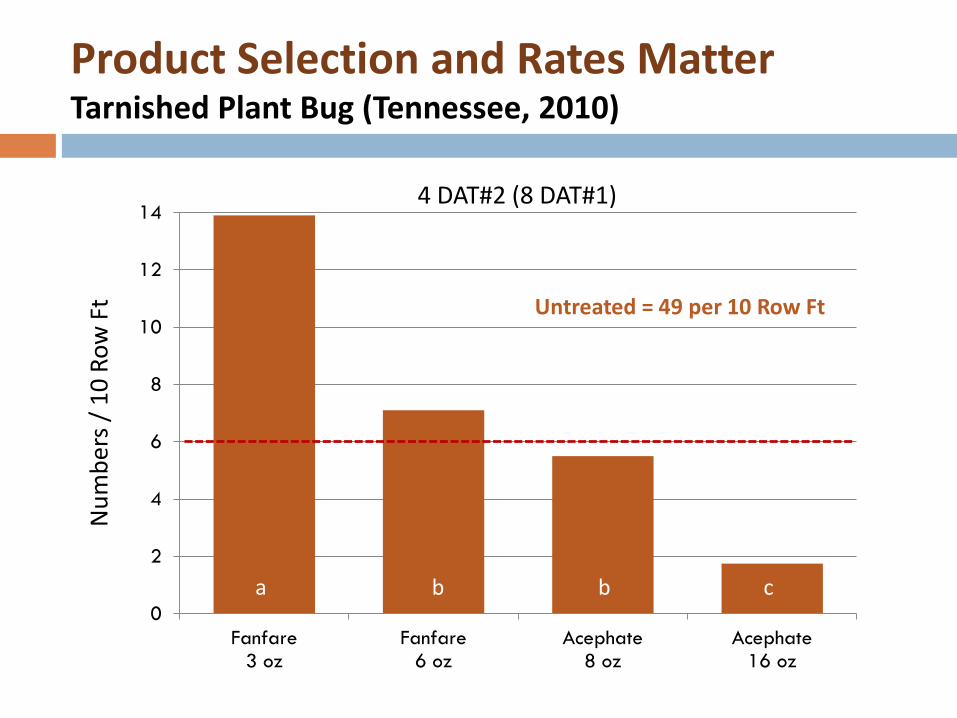
t Product Selection and Rates Matter Tarnished Plant Bug (Tennessee, 2010)
0
2
4
6
8
10
12
14
Fanfare 3 oz
Fanfare 6 oz
Acephate 8 oz
Acephate 16 oz
4 DAT#2 (8 DAT#1)
Untreated = 49 per 10 Row Ft
a a b b c c

2010 Regional TPB Efficacy Trials Tarnished Plant Bug, Averaged Across 7 Locations
0
5
10
15
20
25
Num
bers
/ 1
0 Ro
w F
t
a b bc bcd cd cde cde def def ef f f
5-10 DAT2
Some geographical variation

New Chemistries and Rotation Tarnished plant bugs + a few stink bugs and CEW (TN, 2012)
750 800 850 900 950
1000 1050 1100 1150 1200 1250
Lint Yield (LB/Acre)
Transform (1.5 oz) Diamond (9 oz) Endigo ZC (5 oz)
2 Applications
1 Application
1st Insecticide P = 0.003
2nd Insecticide P = 0.0053
Interaction
P = 0.8073
A A A A A A
a a a a a Bb

Spray Intervals vs. High Pest Pressure Tarnished Plant Bug (Jeff Gore, MSU)
Nym
phs
/ 6
Row
Fee
t 23
8
0
20
40
60
80
100
0
5
10
15
20
25
Pre-Test Counts Percent Control
4 Days 5 Days 6 Days 7 DaysPr
e-tr
eatm
ent
Percent
No. of TPB 4 DAT with Orthene
Re-treatment interval
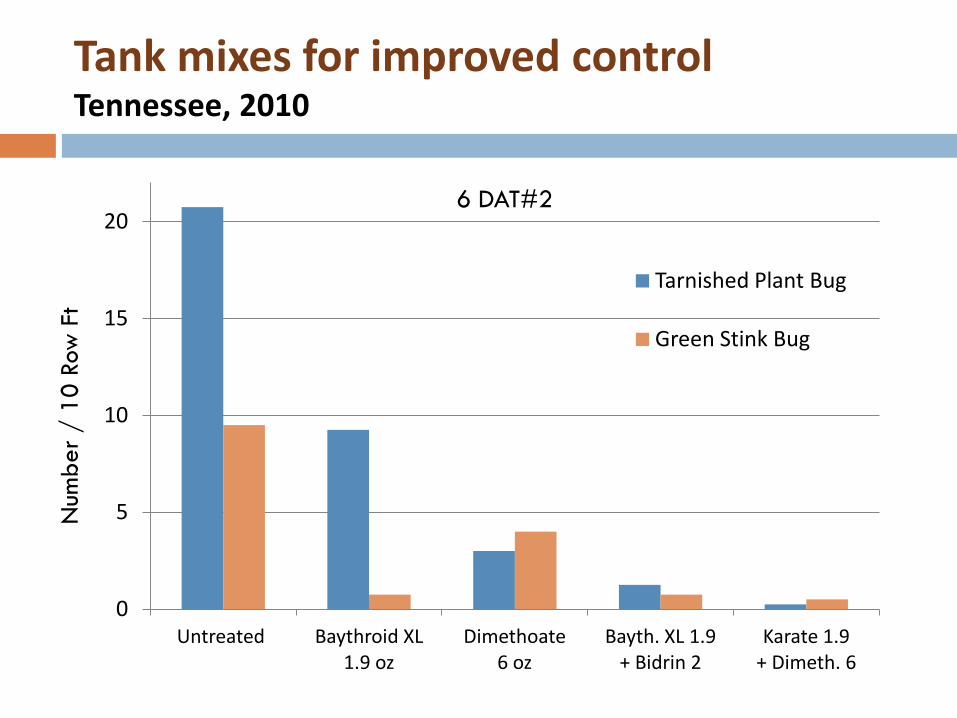
Tank mixes for improved control Tennessee, 2010
0
5
10
15
20
Untreated Baythroid XL 1.9 oz
Dimethoate 6 oz
Bayth. XL 1.9 + Bidrin 2
Karate 1.9 + Dimeth. 6
Tarnished Plant Bug
Green Stink Bug
Num
ber
/ 10
Row
Ft
6 DAT#2

New insecticides will often require a tank mix or rotation strategy
0
5
10
15
20
25
30
35
5 DA-B 8 DA-C
Tarnished plant bugs per 10 Row Feet Tennessee (2012)
BC b
C b
BC b
A a
B b
A a
LSD (P < 0.05)

Tank mixes for a broader spectrum Tennessee (2012)
0
2
4
6
8
10
12
Total Number of Stink Bugs on Drop Cloth Samples
LSD (P < 0.05)
a
ab
b b
b
a

Why tank and pre-mixes are used … Tennessee (2012)
600
700
800
900
1000
1100
1200
Lint Yield (LB/Acre)
LSD (P < 0.05)
cd
abc a
bcd
ab
d

Cotton’s Future in the Midsouth
The continued decline of lepidopteran pests? Next generation Bt cottons and Bt corns
Bt soybean are being considered
The tarnished plant bug will remain the key pest of cotton Are we on the pesticide treadmill because of Lygus? Secondary outbreaks of spider mites, aphids, etc.
Neonicotinoid resistant aphids
Shift away from cotton in the Midsouth