Evolution of Nucleosome Positioning and Gene Regulation in ...
111
Evolution of Nucleosome Positioning and Gene Regulation in Yeasts: a Genomic and Computational Approach by Alexander Minchev Tsankov B.S. Electrical and Computer Engineering, B.A. Plan II Honors Program University of Texas at Austin, 2003 M.S. Electrical Engineering and Computer Science Massachusetts Institute of Technology, 2005 SUBMITTED TO THE DEPARTMENT OF ELECTRICAL ENGINEERING AND COMPUTER SCIENCE IN PARTIAL FULFILLMENT OF THE REQUIREMENTS FOR THE DEGREE OF DOCTORATE OF PHILOSOPHY AT THE MASSACHUSETTS INSTITUTE OF TECHNOLOGY OCT 3 5 2""' SEPTEMBER 2010 8 © 2010 Massachusetts Institute of Technology. All rights reserved. Signature of Author: .... ......... Department ot Electrical Engineering and Computer Science June 30, 2010 Certified by: .Aviv Regev Assistant P essor, Massachusetts Institutte of Technology Thesis Supervisor C ertified by: .. . .......... ............. - Oliver Rando Assistant Professor, University of Massachusetts Medical School Thesis Supervisor A ccepted by: ... .. .. ... .. .. .. . ... .. ... Terry Orlando Professor of Electrical Engineering and Computer Science Chairman, Department Committee on Graduate Students
-
Upload
khangminh22 -
Category
Documents
-
view
0 -
download
0
Transcript of Evolution of Nucleosome Positioning and Gene Regulation in ...

Evolution of Nucleosome Positioning and Gene Regulation in
Yeasts: a Genomic and Computational Approach
by
Alexander Minchev Tsankov
B.S. Electrical and Computer Engineering, B.A. Plan II Honors Program
University of Texas at Austin, 2003
M.S. Electrical Engineering and Computer Science
Massachusetts Institute of Technology, 2005
SUBMITTED TO THE DEPARTMENT OF ELECTRICAL ENGINEERING
AND COMPUTER SCIENCE IN PARTIAL FULFILLMENT OF THE
REQUIREMENTS FOR THE DEGREE OF
DOCTORATE OF PHILOSOPHYAT THE
MASSACHUSETTS INSTITUTE OF TECHNOLOGY OCT 3 5 2""'
SEPTEMBER 2010 8
© 2010 Massachusetts Institute of Technology. All rights reserved.
Signature of Author: .... .........Department ot Electrical Engineering and Computer Science
June 30, 2010
Certified by: .Aviv Regev
Assistant P essor, Massachusetts Institutte of TechnologyThesis Supervisor
C ertified by: .. . .......... ............. -Oliver Rando
Assistant Professor, University of Massachusetts Medical SchoolThesis Supervisor
A ccepted by: ... .. .. ... .. .. .. . ... .. ...Terry Orlando
Professor of Electrical Engineering and Computer ScienceChairman, Department Committee on Graduate Students


Evolution of Nucleosome Positioning and GeneRegulation in Yeasts: a Genomic and Computational
Approach
by
Alexander Minchev Tsankov
Submitted to the Department of Electrical Engineering and Computer Science onAugust 6, 2010 in Partial Fulfillment of the Requirements for the Degree of
Doctor of Philosophy in Electrical Engineering and Computer Science
ABSTRACT
Chromatin organization plays a major role in gene regulation and can affect thefunction and evolution of new transcriptional programs. Here, we present thefirst multi-species comparative genomic analysis of the relationship betweenchromatin organization and gene expression by measuring mRNA abundance andnucleosome positions genome-wide in 13 Ascomycota yeast species.
Our work introduces a host of new computational tools for studying chromatinstructure, function, and evolution. We improved on existing methods fordetecting nucleosome positions and developed a new approach for identifyingnucleosome-free regions (NFRs) and characterizing chromatin organization atgene promoters. We used a general statistical approach for studying theevolution of chromatin and gene regulation at a functional level. We alsointroduced a new technique for discovering the DNA binding motifs of trans-acting General Regulatory Factors (GRFs) and developed a new technique forquantifying the relative contribution of intrinsic sequence, GRFs, andtranscription to establishing NFRs. And finally, we built a computationalframework to quantify the evolutionary interplay between nucleosome positions,transcription factor binding sites, and gene expression.

Through our analysis, we found large conservation of global and functionalchromatin organization. Chromatin organization has also substantially divergedin both global quantitative features and in functional groups of genes. We findthat global usage of intrinsic anti-nucleosomal sequences such as PolyA variesover this phylogeny, and uncover that PolyG tracts also intrinsically repelnucleosomes. The specific sequences bound by GRFs are also highly plastic; weexperimentally validate an evolutionary handover from Cbfl in pre-WGD yeaststo Rebi in post-WGD yeast. We also identify five mechanisms that couplechromatin organization to evolution of gene regulation, including (i)compensatory evolution of alternative modifiers associated with conservedchromatin organization; (ii) a gradual transition from constitutive to trans-regulated NFRs; (iii) a loss of intrinsic anti-nucleosomal sequencesaccompanying changes in chromatin organization and gene expression, (iv) re-positioning of motifs from NFRs to nucleosome-occluded regions; and (v) theexpanded use of NFRs by paralogous activator-repressor pairs. Our multi-speciesdataset and general computational framework provide a foundation for futurestudies on how chromatin structure changes over time and in evolution.
Thesis Supervisor: Aviv Regev
Title: Assistant Professor, Massachusetts Institutte of Technology
Thesis Supervisor: Oliver Rando
Title: Assistant Professor, University of Massachusetts Medical School

Acknowledgement s
The fruition of this project would not have been possible without the help of
many people during my years as a graduate student. I first want to express my
gratitude towards my co-advisor's Oliver Rando and Aviv Regev. Thank you
Ollie for welcoming me into your lab at a time when I had just an idea for a
project and very little lab experience. I really appreciate your contagious
enthusiasm for science and your unfiltered, friendly advice at all times. Thank
you Aviv for taking a chance on me and for your scientific guidance and loyal
support during both happy times and tough moments at MIT. I also want to
thank everyone in the Rando lab (John, Amanda, Marta, Ozlem, Jeremy, Lucas,Ben and others) for helping me learn laboratory science despite the broken glass
and melted plastic. And finally, I want to acknowledge everyone in the Regev
lab (Illan, Moran, Or, Michelle, Jason, Dawn, Amanda, Courtney, Jenna, Jay,Ana, Tal, Ido, Alon, Jimmy, and others) for both scientific and life advice.
I also want to acknowledge my friends, whose support kept me sane
through this long journey. Thank you Shadi, Emanuel, Shahriar, Kayvan, Jean-
Paul, Mike, Borjan, Amir, Pablo, Hischam, Ricardo, Zahi, Holly, Karti, Lisa,Anderson, Jonathan, Ben, Ilan, Adam, Mark, and Evgeny for some of the most
fun years in my life. I want to thank everyone on my soccer team, the
Unbelievables, for some incredible memories as we dominated MIT intramurals.
I also want to acknowledge the members of AEPi for always being reliable friends
and enthusiastic about life.
And finally, I want to thank my family. Thank you el Jefe for making the
effort to seamlessly integrate into our family. Thanks Kake for your
understanding and advice-you often know me better than I know myself.
Thank you Fetzi for being a great role model and a friend, and Sparti for your
undying love and care, even during my less mature years. And thank you Rosi-
Mina for being so pure and cute.

Table of Contents
Chapter 1. Introduction 13
Chapter 2. Experimental System 19
2.1. Strains and Growth Conditions 19
2.2. Measuring Genome-wide Nucleosome Positions 20
2.3. Measuring Absolute Expression Level for all Genes 23
2.3.1. RNA and Genomic DNA Preparation 242.3.2. Microarray Probe Design, Hybridization, and Data Normalization 25
Chapter 3. Inferring Nucleosome Positions and NFRs 26
3.1. Nucleosome Data Processing and Normalization 27
3.2. Detection of Nucleosome Positions 28
3.2.1. Methodology 283.2.2. Computational Contribution 29
3.3. Inferring 5' and 3' NFRs 30
3.3.1. Methodology 303.3.2. Computational Contribution 313.3.3. Performance Evaluation 32
3.4. Defining of Global Chromatin Features 34
3.5. Evolution of Global Chromatin Organization 36
3.5.1. Conservation of Global Qualitative Features 363.5.2. Divergence of Global Quantitative Features 37
Chapter 4. Statistical Framework for Functional Evolution 41
4.1. Methodology and K-S Statistic 42
4.2. Computational Contribution 43
4.3. Regulatory Evolution of Functional Gene Sets 45
4.3.1. Conserved Dichotomy of 'Stress' and 'Growth' Chromatin Organization 47
4.3.2. Coordinated Divergence in Chromatin Structure and Gene Expression 49

Chapter 5. Discovery of Novel Nucleosome Positioning Sequences 51
5.1. 7-mer analysis of Nucleosome Positioning Sequences 52
5.2. Evolution of Intrinsic Anti-Nucleosomal Sequences 55
5.2.1. Methodology 56
5.2.2. Computational Contributions 57
5.2.3. Divergence in Use of Intrinsic Anti-nucleosomal Sequences 58
5.3. Evolution of Trans-acting Chromatin Regulators 60
5.3.1. Methodology 61
5.3.2. Computational Contribution 62
5.3.3. In-trans Chromatin Regulators have Diverged 62
Chapter 6. Contributions of Main Determinants to ChromatinOrganization 75
6.1. Methodology 76
6.1.1. Motif Affinity Scores in NFRs 76
6.1.2. Robust Lowess Smoothing 77
6.1.3. Computational Contribution 79
6.2. Contribution of each Determinant to NFR Occupancy 80
6.2.1. Gene Expression Level 80
6.2.2. Intrinsic Anti-nucleosomal Sequences 82
6.2.3. Trans-acting Chromatin Regulators 84
6.3. Functional Preference for Different Determinants 85
6.3.1. Divergent GRFs Maintain Conserved Chromatin Organization 85
6.3.2. Shift from Programmed to Trans-regulated NFRs 87
6.3.3. Changes in GRFs Contribute to Divergence in Chromatin Organization 88
Chapter 7. TF Binding Sites, NFRs, and Gene Expression 90
7.1. Methodology 90
7.1.1. Promoter TF Motif Scanning 90
7.1.2. Motif GO Enrichments 91
7.1.3. Global Motif Analysis 91
7.2. Repositioning of TF Sites Relative to NFRs Links to Phenotypic Change 92
7.3. Duplication of TF Genes Increases Regulatory Capacity of Sites in NFRs 96
Chapter 8. Conclusions 99
8.1. Studying Evolution to Understand Chromatin Organization 99

8.2. Studying Chromatin to Understand the Evolution of Gene Regulation 101
8.2.1. Evolution of Gene Regulation: the Case of Respiro-Fermentation 103
8.3. Computational Framework for Studying Evolution and Chromatin 104
8.4. Future Prospects 105

List of Figures
Figure 1-1: Phylogeny of species and 3 determinants of NFRs. ....................... 14
Figure 2-1: Isolation of mononucleosomal DNA from 12 species......................22
Figure 3-1: Chromatin organization at a typical gene.......................................27
Figure 3-2: Alignment of nucleosome occupancy data by ATG and NFR. ...... 31
Figure 3-3: Spearman correlation matrix of all chromatin features..................35
Figure 3-4: 5' promoter alignment of nucleosome data for 12 species. ............. 37
Figure 3-5: Variation in global chromatin organization between species. ............ 38
Figure 3-6: Two scenarios for changes in NFR-ATG distance. ........................ 39
Figure 4-1: Strategy for associating chromatin features with gene sets............42
Figure 4-2: Functional conservation and divergence at gene sets......................46
Figure 4-3: Functional conservation and variation in chromatin structure.....48
Figure 5-1: Nucleosome positioning sequences are highly evolvable.................53
Figure 5-2: Evolution of anti-nucleosomal Poly(dA:dT) tracts........................57
Figure 5-3: Overview of GRF motif finding algorithm.....................................60
Figure 5-4: Evolution of GRF motifs associated with nucleosome depletion........63
Figure 5-5: Effect of deleting Cbfl on intrinsic anti-nucleosomal sequences. ....... 66
Figure 5-6: Two putative GRF motifs in Y 1ipolytica.....................................69
Figure 5-7: Sap1 acts as GRF in S. pom be. .................................................... 70
Figure 5-8: GRF usage has diverged. .............................................................. 72
Figure 6-1: Global contributions of 3 determinants to NFR depth..................78
Figure 6-2: Relationship between RNA level and chromatin structure............81
Figure 6-3: Evolution of anti-nucleosomal programming at gene sets..............86
Figure 7-1: Evoluionary re-positioning of TF motif sites relative to NFRs.....94
Figure 7-2: Evolution of TF activity at NFR-localized binding sites...............97

Figure 8-1: Overview of role of chromatin on regulatory evolution....................102

List of Tables
Table 3-1: Definitions of Chromatin Organization Features. ......................... 35

12

Chapter 1. Introduction
Deciphering the meaning of DNA and how the genetic code is regulated within
the cell is vital for understanding human diseases as well as the evolution of
different organisms. Genes are segments of DNA on chromosomes that encode a
unique product with a specific cellular function. During transcription, a gene is
copied (or expressed) to a more mobile molecular string of information, known as
RNA. Transcription is regulated by a group of proteins known as transcription
factors (TFs), which bind to the promoter of a gene (region of DNA near the
start of the gene) to enhance or suppress how frequently that gene's DNA is
copied to RNA. For many genes, their RNA products are mere messengers of the
DNA code, or mRNA. The mRNA transports the DNA's information outside of
the nucleus where it is translated into proteins, another even more functional
string of amino acid molecules. The repertoire of RNAs and proteins expressed
from "on" genes in each cell allows for the myriad of functions necessary for cell
survival and, on a larger scale, the many different cell types found in complex
organisms.
DNA in eukaryotes (nucleus-containing organisms) is assembled into a
macromolecular complex, called chromatin. The basic unit of chromatin is the
nucleosome, which consists of 147 base pairs wrapped around an octamer of
histone proteins. Nucleosomes modulate gene regulation by affecting the ability
of other proteins (such as TFs) to access DNA, which can impact gene activation
and repression [1]. In particular, many genes have nucleosome-depleted
"Nucleosome Free Regions" (NFRs) in their proximal promoters, providing access
to sequence specific transcription factors and to the basal transcription machinery

12-5]. Three major determinants have been proposed to impact nucleosome
depletion at NFRs (Figure 1-1B-D): (1) active transcription by RNA polymerase
II results in eviction of the -1 nucleosome [6, 7]; (2) Intrinsic 'anti-nucleosomal'
DNA sequences such as Poly(dA:dT) bind histones with low affinity, and can
'program' NFRs constitutively [8-12]; and (3) trans-acting proteins can move
nucleosomes away from their thermodynamically-preferred locations [13, 14].
B
C
NFR
Figure 1-1: Phylogeny of species and 3 determinants of NFRs. (A) The tree aboverepresents the philogenetic relationship between the 13 Ascomycota yeast speciesstudied in this work. Yellow star represend the Whole Genome Duplication(WGD) event. (B-D) Three major determinants of NFR occupancy, including (B)RNA Polymerase II and the transcriptional machinery, (C) intrinsic anti-nucleosomal sequences such as PolyAs, and (D) in trans chromatin regulatorssuch as Reb1.
Regulatory differences affecting gene expression can play a major role in
species evolution [15], and can help elucidate the functional mechanisms that
control gene regulation [16, 17]. For example, several studies have shown that
the variable wing pigmentation patterns in fruit flies have evolved due to gain
and loss of TF DNA-binding sites at promoters of pigmentation genes [18, 19].
Although other specific examples of regulatory divergence are known in bacteria
....................... :, _ ...................................... ... .... ...... ..... - ........ .... ............. ................. ........................ .......... ..... ............................... .............. ................... ........................ .. .............. ........ ........ ......

[20], fungi [21-24], flies [25], and mammals [26], a general understanding of the
evolution of gene regulation is still lacking. The recent availability of many
sequenced genomes and accessibility of genomic profiling approaches open the
way for genome-wide comparisons of gene regulation across multiple species.
Among eukaryotes, the Ascomycota yeasts (Figure 1-1A), which span over
300 million years of evolution, are particularly suitable for studying evolution of
gene regulation. This is due to the genetic tractability of yeasts, the wealth of
knowledge about the model organism Saccharomyces cerevisiae, the large number
of sequenced genomes, and the diversity of yeast lifestyles [17]. Moreover, a
whole genome duplication event occurred in this phylogeny [27] (WGD, Figure
1-1A), which lead to several phenotypic differences. Most notably, pre-WGD
species produce energy using respiration through an oxygen-dependent (aerobic)
enzymatic process called oxidative phosphorylation that takes place in the
mitochondrion. In contrast, post-WGD species became respiro-fermentative,
where they retained the ability to respire but often prefer to produce energy
using an oxygen-independent (anaerobic) process called fermentation [28].
Recent studies in yeast suggest a broad role for chromatin organization in
regulatory evolution. Most regulatory divergence between closely related S.
cerevisiae strains is associated with divergence in unlinked (trans) chromatin
remodelers [29, 30]. Conversely, many transcriptional differences between S.
cerevisiae and S. paradoxus (Last Common Ancestor (LCA) ~2 Million years ago
(Mya)) are due to linked cis polymorphisms predicted to affect nucleosome
occupancy [31, 32]. Furthermore, a recent study suggested that changes in the
regulation of mitochondrial ribosomal protein (mRP) genes between the distant
species C. albicans and S. cerevisiae (LCA ~ 200 MYa) were associated with a
change in nucleosome organization [33, 34]. In particular, the higher expression
of mitochondrial genes in respiratory C. albicans is accompanied by enrichment
for the PolyA-like "RGE" binding site in the mRP gene promoters [33]. These cis

elements appear to 'program' the constitutive presence of wider, more open NFRs
at these genes [34] in C. albicans, but are absent from the promoters of mRPs in
the fermentative S. cerevisiae. Finally, a recent study [35] compared genome-
wide nucleosome positioning in S. cerevisiae and S. pornbe (LCA ~ 300M - 1
BYa), finding changes in global nucleosome spacing and in the apparent
sequences that intrinsically contribute to nucleosome positioning in vivo.
While these examples are intriguing, they are limited in their phylogenetic
coverage (a pair of species) and their functional scope (one regulon). Thus, we
understand little about the evolutionary interplay between gene expression,
regulatory sequence elements, and chromatin organization. How does chromatin
organization change over evolutionary time scales? Are the mechanisms
underlying chromatin packaging of functional gene modules conserved? If not,
how do they evolve and what is the role of different factors in this divergence?
Are changes in chromatin organization related to changes in gene regulation?
Can evolutionary changes shed light on the distinct mechanisms that help
establish chromatin organization?
Here, we present the first multi-species experimental and computational
study of chromatin organization across a eukaryotic phylogeny. We measured
genome-wide nucleosome locations and mRNA abundance in 13 Ascomycota
yeast species, spanning over 250 million years of evolution (Figure 1-1). In
Chapter 2, we discuss the choice of our experimental system and the
experimental details of the data collection process. In Chapter 3, we develop a
methodology for studying the evolution of global chromatin organization, by
normalizing the chromatin data, detecting nucleosome positions, finding NFRs,
and characterizing the chromatin organization at all gene promoters. Chapter 4
introduces a general statistical framework for understanding how chromatin
organization has evolved functionally, or between sets of related genes. In
Chapter 5, we develop new methods for studying how intrinsic and trans-

regulated nucleosome positioning sequences have diverged in our phylogeny. We
then use robust Lowess fitting to quantify the relative contribution of the three
major determinants of chromatin organization (Chapter 6), and study these
contributions at a global and functional level. And finally, in Chapter 7 we
study the interplay between transcription factor binding sites, nucleosome
organization, and gene expression.
Our approach has several limitations that are worth noting. As most
works in genomics, including disease association studies, the newly discovered
biological connections are often based on correlation and not causation. For
example, we find that divergence in chromatin structure is accompanied by
change in the underlying determinants that are known to affect it, such as gene
expression, intrinsic sequences, and trans-acting chromatin regulators. However,
with the exception of several experimental validations, we do not directly show
that divergence in chromatin is a causal result of the change in these underlying
determinants.
Nonetheless, our genome-wide study has several strengths that you could
not attain by any other means. It allows us to obtain a general, integrative
picture of evolutionary regulation. This panoramic view of the possible modes of
evolutionary change in gene regulation presents us with a whole host of new
hypotheses. Future experiments based on these discoveries can elucidate the
causal relationships between chromatin structure and the underlying mechanisms
that establish it. Here, we present several validation experiments for hypothesis
related to Cbf1, Sap1 and PolyGs. Moreover, evolutionary studies are often
correlation-driven, as the evolutionary path to current species is of course not
accessible to direct experiment. Therefore, sometimes correlation is the best we
can do.
Our analysis uncovers several major biological principles that govern the
evolutionary and functional relationship between chromatin organization and

gene regulation in this phylogeny: (1) While qualitative features of chromatin
organization are conserved in all species, quantitative features such as nucleosome
packing, NFR length, and NFR to ATG distance have substantially diverged
(Section 3.4); (2) Promoter chromatin organization and gene expression levels of
'growth' and 'stress' genes follow distinct patterns, and this dichotomy is
conserved in all species (Section 4.3.1); (3) Evolutionary divergence in gene
expression is often accompanied by transition of chromatin organization from a
'growth' to a 'stress' pattern (Section 4.3.2); (4) Similar to PolyAs, PolyGs also
act as intrinsic antinucleosomal sequences on a global level, and their usage
varies greatly between species (Section 5.2.3); (5) The specific DNA-binding
sequences and identity of trans-acting factors that recruit nucleosome remodelers
are also highly plastic (Section 5.3.3); (6) Changes in transcription levels,
gain/loss of anti-nucleosomal sequences and gain/loss of binding sites for 'general
regulatory factors' (GRFs) all accompany divergence of chromatin organization,
often in a complementary manner (Section 6.2); (7) The loss of anti-nucleosomal
sequences and parallel gain of binding sites for GRFs drive shifts from intrinsic to
trans-regulated chromatin organization (Section 6.3.2). (8) Regulatory divergence
can also occur by re-positioning of binding sites relative to nucleosome positions,
or by expanding the use of accessible sites by paralogous transcription factors
(Chapter 7). These mechanisms played a role in the evolution of respiro-
fermentation, as well as in the evolution of regulation of other key regulons at
different phylogenetic points, including mating, meiosis, RNA polymerase
subunits, proteasomal and splicing genes. Together, they uncover novel insights
into the general roles for chromatin in regulating genomic access and in the
evolution of regulatory programs, and provide a rich resource for future
investigation.

Chapter 2. Experimental System
To understand the effect of chromatin organization on gene regulation in our 13
Ascomycota species (Section 2.1) [36], we first mapped nucleosome positions
genome-wide by Illumina sequencing of mononucleosomal DNA [7, 9, 37] isolated
from mid-log cultures (Section 2.2). In order to compare our nucleosome data to
transcriptional output, we also used species-specific microarrays to measure
mRNA abundance in all species (Section 2.3) in the same mid-log cultures used
for nucleosome mapping.
2.1. Strains and Growth Conditions
We chose species to provide good phylogenetic coverage of the Ascomycota
yeasts. We included the well-studied model organisms Saccharomyces cerevisiae
and Schizosaccharomyces pombe, and the independently evolved human
pathogens Candida glabrata and Candida albicans. We chose six pre- and seven
post-WGD species, in order to have similar number of sample points before and
after the WGD event. We also sampled densely around a whole genome
duplication (WGD) event, providing us with both major genomic divergence as
well as a major metabolic shift to use as reference phenotypes. And finally, the
large evolutionary distance (over 300 million years) of our phylogeny allowed us
to gain a more complete picture of how nucleosome positions evolve. Specifically,
we used the following strains (all with sequenced genomes) in the study:
Saccharomyces cerevisiae, BY4741, Saccharomyces cerevisiae, Sigma1278b L5366,

Saccharomyces paradoxus, NRRL Y-17217, Saccharomyces mikatae, IFO1815,
Saccharomyces bayanus, NRRL Y-11845, Candida glabrata, CLIB 138,
Saccharomyces castelii, NRRL Y-12630, Kluyveromyces lactis, CLIB 209,
Kluyveromyces waltii, NCYC 2644, Saccharomyces kluyveryii, NRRL 12651,
Debaryomyces hansenii, NCYC 2572, Candida albicans, SC 5314, Yarrowia
lipolytica, CLIB 89, and Schizosaccharomyces pombe, 972h-.
To compare the evolution of nucleosome positions for different yeasts, it
was important to choose growth conditions that induce a similar response in all
species. To minimize condition- and stress-related differences, we grew all species
in the same rich medium, where the growth rate of each species was at least
~80% of its maximal measured rate in any of over 40 tested media formulations.
Our in-house medium adds back essential amino acids and nucleotides to
nutrient-rich medium containing yeast extract, peptone and glucose, to mitigate
stress responses in species that are auxotrophs for certain compounds. The recipe
for the medium is the following: Yeast extract (1.5%), Peptone (1%), Dextrose
(2%), SC Amino Acid mix (Sunrise Science) 2 grams per liter, Adenine 100
mg/L, Tryptophan 100 mg/L, Uracil 100 mg/L.
2.2. Measuring Genome-wide NucleosomePositions
The technique for mapping nucleosome positions genome-wide was first developed
for S. cerevisiae in Oliver Rando's lab [11], which we adapted to our 13 different
species. Briefly, we grew cells to mid-log phase, crosslinked all protein complexes
attached to the DNA, and then used micrococcal nuclease (MNase) in order to
digest all DNA not wrapped by the crosslinked nuclesomes. We then isolate the
DNA protected by single nucleosomes (by reverse-crosslinking and gel

purification) and sequence one of the two DNA fragment ends (single-end
sequencing). Comparison of the sequenced reads against a reference genome
allows us to map the genomic locations of all nucleosomes in each species. We
decided to sequence our DNA samples instead of using microarrays because it has
become the more cost effective option for obtaining high-resolution measurement
of nuclesome occupancy.
Specifically, overnight cultures for each species were grown in 450ml of
media at 220 RPM in a New Brunswick Scientific air-shaker at 30'C until
reaching mid log-phase (OD600 = 0.5, WPA biowave CO 8000 Density Meter).
Nucleosomes are then crosslinked to the DNA by treating the yeast with 2%
formaldehyde for 30 minutes. Cells are collected by centrifugation, washed in
water, and spheroplasted in order to remove the yeast's outer cell wall. Aliquots
of the spheroplasted cells are then added to different concentrations of
micrococcal nuclease (MNase) in order to digest the linker DNA. The remaining
nucleosomal DNA is then isolated from the octamer of histone proteins by
treatment with Proteinase K. The DNA is further purified by phenol-chloroform
extraction, ethanol precipitation, and RNase treatment to remove RNA.
Mononucleosomes were size-selected on a gel and purified using BioRad Freeze-N-
Squeeze tubes followed by phenol-chloroform extraction.
Isolating nucleosomal DNA requires slight modifications to the protocol for
each yeast species. The key parameters are the amount of cells collected (as
measured by the optical density or OD), the MNase concentration, and the
amount of time required to spheroplast cells. We chose to keep the OD constant
at 0.5, since this OD was in mid-log phase of the growth curve measured for all
species. Cells were spheroplasted with zymolase between 30-40 minutes for
different species, depending on how much time was necessary to fully remove
each species' cell wall. MNase digestion levels for all samples were uniformly
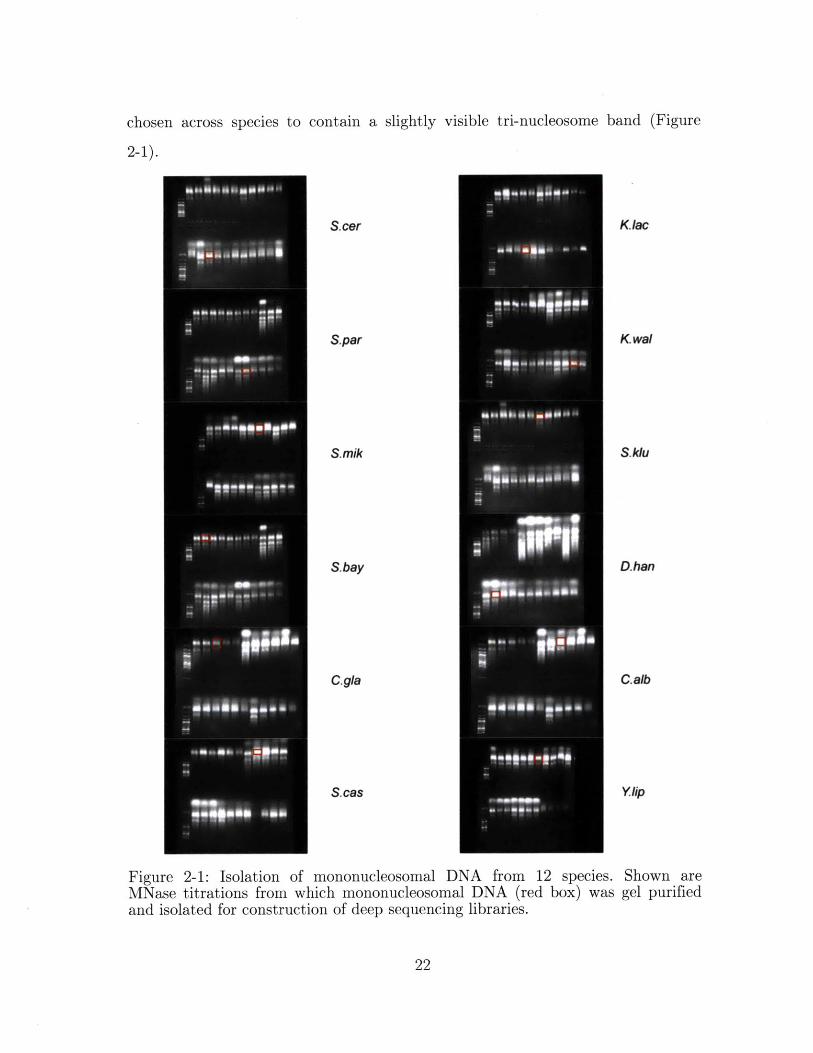
chosen across species to contain a slightly visible tri-nucleosome band (Figure
2-1).
S.cer K.Iac
S.par K.wal
S.mik S.klu
S.bay D.han
C.gla Calb
S.cas Ylip
Figure 2-1: Isolation of mononucleosomal DNA from 12 species. Shown areMNase titrations from which mononucleosomal DNA (red box) was gel purifiedand isolated for construction of deep sequencing libraries.
...............

Selected mononucleosomal DNA was prepared for sequencing using the
standard Illumina instructions. Briefly, DNA was phosphorylated and end-
repaired. The blunt, phosphorylated ends were then treated with Klenow
fragment (exo minus) and dATP to yield a protruding 3'-end 'A' base. This is
followed by ligation of the DNA ends with Illumina's adapters, which have a
single 'T' base overhang at their 3' end. After adapter ligation, DNA was PCR
amplified with Illumina primers for 19 cycles and library fragments of about 300
bp (insert plus adaptor and PCR primer sequences) were band isolated from an
agarose gel using BioRad Freeze-N-Squeeze tubes followed by ethanol
precipitation. Libraries were sequenced on an Illumina 1G Analyzer to generate
36bp reads. For each species, we obtained over 1 million uniquely mapped reads,
which corresponds to 1Ox coverage or better per genomic nucleosome.
2.3. Measuring Absolute Expression Level forall Genes
To study the effect of nucleosome positions on gene regulation at the level of
transcription in all species, we measured the absolute expression level of all genes
using custom-designed (Agilent) microarrays with species-specific probes. A
common technique for measuring absolute expression level genome-wide is to use
two-color microarrays, where one channel is total RNA and the reference channel
is genomic DNA. The genomic DNA channel normalizes for the melting
temperature differences between probes and for other cross-hybridization effects
on specific probe sequences. It is important to note that total RNA is correlated
to a gene's transcriptional rate but not directly related, since mRNA molecules
degrade at different rates. The following two sections explain the experimental

details of RNA and genomic DNA isolation, and microarray design and
hybridization.
2.3.1. RNA and Genomic DNA Preparation
We isolated and labeled RNA by a standard procedures and DNA by a modified
prototcol. Specifically, overnight cultures for each species were grown in 450ml of
media as described for measuring nucleosome positions. Before formaldehyde
fixation of nucleosomes, 50 ml of the culture were transferred to a 50 ml conical
and spun down immediately. The isolated cell pellets were then placed in liquid
nitrogen, stored at -80'C, and were later archived in RNAlater for future RNA
extraction. Total RNA was isolated using the RNeasy Midi or Mini Kits
(Qiagen) according to the provided instructions for mechanical lysis. Samples
were quality controlled with the RNA 6000 Nano 11 kit for the Bioanalyzer 2100
(Agilent). Genomic DNA was isolated using Genomic-tip 500/G (Qiagen) using
the provided protocol for yeast. DNA samples were sheared using Covaris
sonicator to 500-1000 bp fragments, as verified using DNA 7500 and DNA 12000
kit for the Bioanalyzer 2100 (Agilent). Independently sheared samples labeled
with different fluorescent dyes were highly correlated (R>.97 in each of 4
independent hybridizations), indicating that the shearing procedure is
reproducible and unbiased. Total RNA samples were labeled with Cy3 (cyanine
fluorescent dyes) and genomic DNA samples were labeled with Cy5 using a
modification of the protocol developed by Joe Derisi (UCSF) and Rosetta
Inpharmatics (Kirkland, WA) that can be obtained at www.microarrays.org.

2.3.2. Microarray Probe Design, Hybridization, and Data
Normalization
Cy3-labeled RNA samples were mixed with a reference Cy5 labeled genomic
DNA sample and hybridized on two-color Agilent 55- or 60-mer oligo-arrays. We
used the 4x44K format for the S. cerevisiae strains (Agilent commercial array; 4-5
probes per target gene) or a custom 8x15 K format for all other species (2 probes
per target gene, designed using eArray software, Agilent). After hybridization
and washing per Agilent's instructions, arrays were scanned using an Agilent
scanner and analyzed with Agilent's feature extraction software version 10.5.1.1.
For each probe intensity, I,, the median signal intensities were background
subtracted for both channels and combined by taking the log2 of their ratio, as
follows:
I'CY -BYI =B CYY3 cy3. (2.1)
p 2Cy 5 -Bcy5
To estimate the absolute expression values for each gene, we took the median of
the log2 ratios across all probes. The experiments were highly reproducible; most
biological replicates correlated at R = 0.99 and replicates with R < 0.95 were
removed. For each species, we obtained at least three biological replicates that
passed this reproducibility threshold. Different biological replicates were
combined using quantile normalization that takes the median of the rank values
to estimate the absolute expression level per gene per species.

Chapter 3. Inferring NucleosomePositions and NFRs
In this chapter, we introduce the computational methodology we developed to
quantitatively compare the chromatin structure at genes within and between
species. The canonical chromatin organization at a typical gene in S. cerevisiae
(Figure 3-1) contains a dip in nucleosome occupancy, called the 'Nucleosome Free
Region' (NFR), in their upstream promoter (5'NFR) and following their stop
codon (3'NFR). These regions are known to be important for binding of
transcription factors and for gene activation or repression [3, 11, 38]. We term
the nucleosomes at the 5' and 3' border of the 5'NFR as the +1 and -1
nucleosome, respectively (Figure 3-1), and the nucleosome at the 5' border of the
3'NFR as the +N nucleosome.
To identify these chromatin features in the promoters of each gene, we
first aligned nucleosome reads to each reference genome (Section 3.1). We then
normalized each experiment for sequencing depth and MNase digestion level
(Section 3.1 and 3.2.1). We then built a method for inferring nucleosome
positions (Section 3.2) from the normalized data, which is based on previous work
[37, 38]. Finally, we developed a new computational technique for detecting the
5' and 3' NFRs at each gene (Section 3.3), and evaluated its performance. We
then use these computational tools to quantify a number of features of chromatin
organization at each gene, and explore how these features have evolved on a
global level between species (Section 3.4).

EA Nuc~1 occupancy
B Nuc+1 occupancy
C Distance 5'NFR-ATG
D 5' NFR width
E CDS spacing
D F NFR occupancy
A B ATG etc
C
F0 counts
Nuc-1 Nuc+ 1 ATG
Figure 3-1: Chromatin organization at a typical gene. Shown is a schematic of agene (green box), its promoter (black line) and associated nucleosomes (yellow),along with nucleosome sequencing data (dark blue curve), and several definitionsof chromatin features.
3.1. Nucleosome Data Processing andNormalization
We used BLAT [39] to map single-end sequenced reads from each experiment to
the corresponding reference genome, keeping only reads that mapped to a unique
location and allowing for up to 4 mismatches. Each uniquely mapped read was
then extended to a length of 100bp. To generate a genomic nucleosome
occupancy landscape, we summed all extended reads covering each base pair.
We then masked all repetitive regions along each track, defining repetitive
regions as locations in the genome that cannot be uniquely defined by the length
of a read (36 bp). We also masked all regions of nucleosome occupancy greater
than 10 times the median occupancy, to remove outlier effects that occur in
. .... ... ..................... .............. . .. ... .. ............................... . .. ... ......... ............ .... .. ...... ... M ....... ....... - -- -. .. . ......... . .... ..................

places such as the rDNA locus. To normalize for sequencing depth for each
genomic nucleosome track, we divided the occupancy at each location by the
mean nucleosome occupancy per base pair. These normalized maps were used to
generate the average nucleosome occupancy plots (Figure 3-1, Figure 3-4, and
Figure 4-1).
3.2. Detection of Nucleosome Positions
3.2.1. Methodology
To infer the location of nucleosomes from the data, we used a Parzen window
approach similar to that previously described [37, 38]. Our modified approach
uses 3 parameters-the average DNA fragment length, the standard deviation of
the Parzen window, and the maximum allowable overlap between nucleosomes.
To estimate the mean DNA fragment length in each experiment, we shifted reads
from one strand and then correlated them with the reads of the opposite strand.
We summed all read occurrences per base pair on the forward strand to generate
vector x of length N and all read occurances on the reverse strand to generate
vector y of length N and estimated their cross-correlation, R,,(m), for positive
shifts m as follows:
N-m-1
In(m) x,+myn. (3.1)N-rm n-
For each species, we observed a peak in the cross-correlation at a shift between
127 and 153 bp, which we used to estimate the mean DNA fragment length t DNA
per experiment:

fDNA= argmax[R (m)]. (3.2)
We chose a standard deviation of the Parzen window of 30bp for all species, since
it closely matched the observed standard deviation around the cross-correlation
peak of each experiment. Finally, we set the maximum allowable overlap
between nucleosomes to 20bp. We then shifted all read start locations by half of
the mean DNA fragment length, 2DNA /2, in the direction towards the dyad of the
nucleosome they represent (ie. forward reads are shifted to the right and reverse
strand reads to the left). For each read i, our approach places a Gaussian
distribution with a standard deviation a of 30bp at the read's shifted location x,.
Summing all individual curves for all genomic positions x leads to a smoothed
probability landscape k(x) of nucleosome occupancy
1 N I X-Xi2
1(x) - 1 exp - U2, (3.3)Na i= 2ir 22
where N represents the total number of reads. We calculated each probability
landscape per chromosome. We next identify all peaks along the landscape,
which represent nucleosome centers. The method then places nucleosomes along
the genome in the order of decreasing peak heights (greedy approach) and
iteratively masks out these regions to prevent more than 20bp overlap between
nucleosomes.
3.2.2. Computational Contribution
Our approach improves on previous methods [37, 38] based on Parzen likelihood
estimation using a Gaussian Kernel. The distribution of forward and reverse
read clusters closely approaches a Gaussian shape, justifying the Gaussian
assumption. Previous methods depend on various parameters set by the user,
such as the allowable window between corresponding forward and reverse read

clusters. Our modified approach removes these restrictions and depends only on
3 parameters, which we estimate directly from the data. Hence, our approach
generalizes to experiments done by different labs for different species. One of the
parameters is the mean DNA fragment length, which normalizes for different
MNase digestion levels between experiments. Moreover, our method improves on
previous methods by allowing for nucleosome detection using information from
only one strand.
3.3. Inferring 5' and 3' NFRs
3.3.1. Methodology
We informally define 5' and 3' Nucleosome Free Regions (NFRs) as the linker
DNA of "significant length" closest to the 5' and 3' end of each gene, respectively.
It is difficult automatically detect NFRs based on this informal definition because
NFRs are rarely completely free of nucleosomal reads due to experimental noise
and variability in nucleosome positions within a population of cells. As a result
no such method exists today.
To automatically find NFRs, we first created a nucleosome call landscape
for each genome, normalized for sequencing depth in the same manner as the
nucleosome occupancy maps (above). NFR boundaries were often obscured by
very low occupancy nucleosome calls. We therefore removed all nucleosome calls
with occupancy less than 40% of the average nucleosome occupancy from the
map. We searched for 5' or 3' NFRs within 1000 bases upstream/downstream of
the 5' or 3' end of each gene, truncated when neighboring ORFs overlapped this
region. We then defined an NFR as the linker DNA longer than 60bp closest to
the 5' or 3' end of each gene. If no linker longer than 60bp was found in this
search, we defined the NFR as the first linker from the 5' or 3' end.

3.3.2. Computational Contribution
To our knowledge, this is the first published method for finding 5' NFRs. As
mentioned before, this is an important computational problem as the NFR region
is very important for gene regulation. Besides its application in our work, our.
method could be useful for other biological problems, such as finding change in
regulatory regions due to environmental stimuli. It can also be used in motif
analysis for substantially reducing the search space either for learning new motifs
or for scoring known ones.
A S. cerevisiae (ATG-aligned) B C glabrata (ATG-aligned)
1.6! 1.6,
1.4- 1.4-
1.2 1.2
z z0.8 0.8!
0.6 0.6-
0.4 0.404 - 60 -406 0 200 0 200 460 600 800 1000 04 -800 -60 -400 -200 0 200 400 600 800 100Distance from ATG (bp) Distance from ATG (bp)
C S. cerevisiae (NFR-aligned) D CGglabrata (NFR-aligned)1.8 1.8
1.6 1.6
1.4 1.4
1.2 1.2
o
08 0.8Z z
0.6 0.6
0.4 0.4
02 0.2
80 0 -W -400 -200 0 200 400 600 1000 -800 -600 -400 -200 0 200 400 600 800 1000Distance from 5'NFR start (bp) Distance from 5' NFR start (bp)
Figure 3-2: Alignment of nucleosome occupancy data by ATG and NFR. Thenormalized nucleosome occupancy at all S. cerevisiae (A,C) and C. glabrata(B,D) genes is averaged and displayed relative to the translational start siteATG) and the 5'NFR and the +1 nucleosome boundary. (A-B) We observe a
substantial difference in the ATG aligned profiles (blue curve) between S.
... ........ ..... .......... ....... FAMMMIRAP.
cerevisiae (A) and C. glabrata (B), a species that has more variable 5'NFR-ATGdistances. (C-D) In contrast, alignment by the 5'NFR and the +1 nucleosomeboundary produces very similar waveforms between the two species.
Moreover, identifying the 5'NFR is important when comparing between
different species. Since 5'NFR-ATG distances vary substantially between species,
an analysis of nucleosome organization that relies on alignment by ATG can be
highly misleading. For example, the average nucleosome organization of C.
glabrata and S. castelli look similar when aligned by the +1 nucleosome but very
different when aligned by ATG (Figure 3-2). A previous study [34] defines a
Promoter Nucleosome Depleted Region (PNDR) score as mean nucleosome
occupancy of the most depleted 100-bp region within 200 bp upstream of the
ATG. Since some species have longer 5'NFR-ATG distances we reasoned that
the NFR of some genes might not be contained within a 200 bp window (e.g.,
only a third of C. glabrata NFRs are contained within 200 bp, while 90% are
contained within 500bp). To avoid such pitfalls and analyze nucleosome
organization consistently in all species we aligned the data by the +1 nucleosome,
which is consistent with alignment by transcription start site (TSS).
3.3.3. Performance Evaluation
Our method for finding 5'NFRs was highly predictive of transcription start sites
(TSSs) in S. cerevisiae [40]. The NFR boundary closest to the 5' end of the gene
was able to predict 84% of TSSs within 50 bp. This serves as strong biological
validation for the accuracy of our approach. Moreover, 9% of TSSs could not be
accurately predicted because they lie within long NFRs of highly expressed genes,
but not near the +1 nucleosome and 5'NFR boundary. Since highly expressed
genes evict their +1 nucleosome, we can no longer use the 5'NFR boundary to
find the TSSs at these genes. Another 5% of TSSs lie inside nucleosomes and
were enriched for genes that are known to require nucleosome remodeling to
initiate transcription; hence, these TSSs are also not indicative of the accuracy of
our NFR calling method. In total, only 87% of TSSs can be predicted using
5'NFRs and we can accurately predict 84% of all TSSs, which corresponds to an
error rate between 1-3%.
We also compared 5'NFR calls between biological replicates as an
independent way of measuring the error rate of our method. We obtained
sufficient sequencing reads for two biological replicates in only 2 species. We
found that between two biological replicates in S. cerevisiae, the 5'NFR and +1
nucleosome boundary was within 50 bp for over 96% of genes. Moreover, for two
replicates in C. glabrata, the 5'NFR and +1 nucleosome boundary was within 50
bp for about 98% of genes. This error rate of 2-4% between replicates was very
similar to the error rate observed when comparing 5'NFRs to valid TSSs.
Our method was also robust to parameter changes. Varying the linker
lengths between 50bp and 70bp and occupancy thresholds between 30% and 50%
did not change the 5'NFR calls for over 90% of genes. The accuracy for
predicting TSSs dropped by no more than 3% for any combination of these
parameter settings. Moreover, the accuracy of 5'NFR calls and TSSs
predications was also not affected by changes in the nucleosome detection
parameters. Changes of the standard deviation a-=30 to 20bp or 40bp and of
the maximum allowable overlap of 20bp between adjacent nucleosomes to 10bp
or 30bp did not affect the accuracy of TSSs predictions by more than 2%.
Finally, our biological conclusions discussed in subsequent Chapters were
very robust to different parameter settings of the 5'NFR or nucleosome postion
detection algorithms. Also, repetition of our analysis with biological replicates or
sub-sampling of the data to control for sequencing depth did not affect our
results. The trends in global chromatin organization differences (next section)
remained the same and the correlation coefficient R between different samples

and parameter settings in the functional chromatin organization (Chapter 4) was
around .95 for all combinations.
3.4. Defining of Global Chromatin Features
To quantitatively compare chromatin structure between species, we first called
nucleosome positions, identified 5' and 3' NFRs, and then measured a number of
nonredundant features that describe the chromatin organization at each gene.
We exhaustively measured 56 chromatin features at each gene for each species,
representing various potential aspects of chromatin organization. Since some of
these may be highly dependent, we used Spearman rank correlation analysis to
measure the redundance between these features (Figure 3-3). Indeed, more than
half of the features were very dependent. For example, the median spacing
between the first 2, 4, or 6 adjacent nucleosomes in the coding region of genes are
highly correlated. For economy of thought, the rest of the analysis will focus on
a subset of nonredundant (distinct) features.
We focused on 22 features that quantify the chromatin organization at
each gene (Table 3-1). We measured the NFR occupancy as the number of
nucleosome reads per NFR base pair (NFRs with low occupancy are deeper/more
prominent), and define the occupancy of the -1, +1, and +N nucleosome in the
same way. To quantify how well-positioned a nucleosome is in a population of
cells, we compute nucleosome fuzziness as the standard deviation of read
distributions contributing to a given nucleosome. Finally, we measure the
relative organization of the features. For example, we measure the distance
between the border of the +1 nucleosome and 5' NFR to the start codon (D5'NFR-
A TG), the width of the -1 nucleosome, the +1 nucleosome, and the 5'NFR, and the
spacing of coding region nucleosomes, defined as the median distance between the
centers of adjacent nucleosomes in a gene.

Snfr~eg
trunus1Fuzzy
mkiFuzzy@-
pluWaang~yewn1
plus1Spnwn5I
plusNSpngn0Ap
PkNSpaang 5
plSpuzzDown5
plusN~uzzy
plusNFuzzyplunNFuzy-plusNFuzzyow
plusN 1SpaangDown1plusN 1SpaangDown3plu-N 18psangDown5pklus1dinplun1Avg0ocuplus10cupplus10cWupplus10apDownpls1_to_5.nf0cununus1.Po_5 nrOcup
mans1cupmnus10~cupDownmWAInCuspup
arrten ,plujqt_3 nfrcupplusN 1_pt_.nrOcup
-1 0 1
Correlation
Figure 3-3: Spearman correlation matrix of all chromatin features. After callingnucleosomes from S. cerevisiae data, 56 chromatin features were measured at allgene promoters. Shown is the correlation matrix between all features in S.cerevisiae. The distinct features subsequently used in this study are highlightedin red.
Table 3-1: Definitions of Chromatin Organization Features.
Chromatin Feature Definition5'NFR-ATG distance Distance between ATG and the NFR boundary
closest to the ATG (D5'NFR-ATG)
NFR length Linker length between +1 and -1 nucleosomesNFR occupancy Mean normalized nucleosome occupancy over length
of NFR
CDS nucleosome spacing Median spacing between 4 adjacent nucleosomes(+1 through +4)
Nucleosome occupancy Normalized number of forward and reverse readsNucleosome width Forward read peak to reverse read peak distanceNucleosome fuzziness Weighted average of forward and reverse read
cluster standard deviations
. ... ........... :: ...................................

3.5. Evolution of Global ChromatinOrganization
We first studied each feature globally, or averaged across all genes in a genome
(this section), and will later study features functionally, or averaged across all
genes that are functionally related (Chapter 4).
3.5.1. Conservation of Global Qualitative Features
Several qualitative chromatin features have previously been identified in all
eukaryotes studied [2], and these were conserved across all 12 species (Figure
3-4). These included an abundant 5'NFR, a common 3'NFR, a well-positioned +1
nucleosome, and increasing nucleosome fuzziness over the body of genes (Figure
3-4). The similar nucleosome profiles of all 12 species are consistent with the
theory of statistical positioning of nucleosomes [11, 41, 42], which proposes that
NFRs act as nucleosome repelling boundaries that are bordered by a well-
positioned the +1 nucleosome and increasingly more fuzzily (statistically)
positioned nucleosomes over the coding region of the gene.

c S.cerevisiae S.paradoxus S.mikatae S.bayanus
0. 5 05 05
-100 -500 0 500 1000 1000 -500 0 500 1000 -1000 -500 0 500 1000 -1000 -500 0 500 1000Distance frorm NFR Diosace from NFR Distanrce from NFR Distance from NFR
C.glabrata 2 S.castellii 2 KIactis 2 K.walti
05 05 05 0,5
.1000 .500 0 500 1000O -1000 .500 0 500 1000 _1oso .oW 0 sDO 1000 -1000 .5W 0 Sos 10ssDistance from NFR Distance from NFR Di5ta0c0 from NFR Distance from NFR
S.kluyveri D.hansenii 2 C.albicans 2 Ylipolytica
-1000 -500 0 500 1000O -1000 -500 0 500 1000 1000 -500 0 500 1000 -1000 .500 0 500 1000Distance from NFR Distance from NFR Distance from NFR Distance from NFR
Figure 3-4: 5' promoter alignment of nucleosome data for 12 species. Sequencingreads were extended to a length of 100 bp. Data for all annotated genes wasextracted and aligned by the +1 nucleosome, and average profiles over all genesare shown for each species. Similarly, we also aligned data by the +Nnucleosome to study the chromatin organization at 3' NFR (data not shown).
3.5.2. Divergence of Global Quantitative Features
Quantitative global features were often variable between species (Figure 3-5 and
Figure 3-6). Our measurements recapitulated previous predictions or bulk assays
in the few cases where these were available, thus validating our dataset and
analytical methods. For example, nucleosome spacing in coding regions was
variable between species (Figure 3-5A,B), consistent with observed nucleosome
laddering on gels [43, 44]. This leads to variation in the specific coding sequences
exposed in linker DNA, and could affect patterns of sequence variation [45-47]
and higher-order packaging into the 30nm fiber [48].
.......................... - - , -- , - - - _ _ : ' , a _ . .. ...- - I 4EM.- - : - : Z Zftuzm _:::::z :: :: - :: : : : : :::: : ; : I " .. . , , .. ...... ..

-500 0 500 1000Distance from NFR
16120
12
U- .
40 4
2O 0
$5 M O M 382
I .S. kluyverii
C. glabrata
Distance 5'NFR to ATG (bp)
Figure 3-5: Variation in global chromatin organization between species. (A)Spacing between adjacent nucleosomes in coding regions has diverged. Shownare the median nucleosome-to-nucleosome distances over coding regions, medianover all genes in each species. Values are arranged from low to high rather thanby phylogeny to emphasize the range of variability. Species names are colored bytheir relation to the WGD event. (B) Spacing differences between twoKluyveromyces species. Shown are 5' NFR-aligned averaged data for K. lactis
(red) and K. waltii (blue), showing differences in coding region spacing. (C)Global variation in NFR to ATG distance (D5'NFR-ATG)- Shown are mediandistances from the 5' NFR to start codon for all genes in each species, sortedfrom low to high values. (D) Distribution of NFR to ATG distances (D5'NFR-ATG)
in S. kluyverii (blue) and C. glabrata (red).
92
1.61
10.5-1000
J A J AAAAJ

S.cerevisiae TSS
F+ATG
C>NFR
NFR-ATG distance(-5' UTR)
BD.hanseni ATG
Shorter NFR-ATG distance
C D
Shorter 5' UTR? Moved TSS position relative to +1?
Figure 3-6: Two scenarios for changes in NFR-ATG distance. (A) Canonicalpromoter architecture in S. cerevisiae - transcriptional start site (TSS) istypically found at ~13bp 3' to the upstream border of the +1 nucleosome. (B)5'NFR to ATG distance (D5'NFR-ATG) varies in other species without annotatedTSSs. For example, NFR-ATG distance is shorter in D. hansenji than in S.cerevisiae (Figure 3-5C). Depending on the location of the TSS, this result isconsistent with two possibilities (or any admixture thereof): (C), TSSs arelocated 13 nt into the +1 nucleosome, and 5' UTRs are globally shorter, or (D),5' UTRs are the same length and the TSS is situated within the NFR.
The distance between the NFR and a gene's start codon (Figure 3-5C,D
and Figure 3-6) is also variable between species, consistent with prior
computational predictions [49]. Depending on the location of the TSS, this result
is consistent with two possibilities (or any admixture thereof): (1), TSSs are
located 13 bp into the +1 nucleosome, and 5' UTRs are globally shorter, or (2),
5' UTRs are the same length and the TSS is situated within the NFR. Several
lines of evidence support the latter possibility (Figure 3-6D), including the
conservation of 5'UTR length distribution in a small number of measured cases in
.............. ...... ..... ................ . . ........ . .. .............. ..... .. . ...... .. .... .......... - - . ....... .............. .. .. . ... . ........... . . .. .

S. cerevisiae and C. albicans [49], the known variation in TATA-TSS distances
between S. pombe and S. cerevisiae [50], and the known variation between yeast,
fly, and humans in TSS location relative to the +1 nucleosome [14, 38, 51, 52].
Thus, it is likely that TSS location relative to the +1 nucleosome varies
substantially between Ascomycota species. This would affect TSS-exposure rates
and pre-initiation complex geometry, and has unknown consequences for basic
gene regulatory mechanisms [4, 53].
Moreover, the median NFR width was highly variable between species,
ranging from 109 to 155 nucleotides. This is linked to the variation in the length
of intrinsic anti-nucleosomal sequences between species (Section 5.2.3). Shorter
NFRs may constrain regulatory information into more compact promoters.

Chapter 4. Statistical Frameworkfor Functional Evolution
We next explored possible functional implications of chromatin organization in
specific sets of genes with related function. Prior studies in S. cerevisiae and C.
albicans have shown that in both species "growth" genes, defined by their co-
expression with cytoplasmic ribosomal proteins (cRPs), have a more open
chromatin organization on average [34]. Conversely, "stress" genes, whose
expression is anti-correlated to that of growth genes, have a more closed
chromatin organization in both species.
To assess the generality of this observation, we developed a general
statistical framework for studying the functional evolution of gene regulation.
For S. cerevisiae we gathered functional gene sets from several sources: KEGG
[54], GO categories [55], MIPS [56], and BioCyc [57], as previously described [36].
For all other species, we projected these genes sets based on gene orthologies [36]
using the ortholog mapping at www.broad.mit.ed11/regev/orthogroups. For a
given gene set in each species, we tested whether the constituent genes tended to
have high or low values for each chromatin features relative to the background of
that feature's overall distribution in that species (Figure 4-1). This chapter
discusses the methodology we used based on the Kolmogorov-Smirnov (K-S)
statistic (Section 4.1), the advantages of this approach to previous methods
(Section 4.2), and the biological insight gained from our analysis (Section 4.3).

A B Low occupancy2 ('deep')
2 All genes 10-C
- Ribosomnal .0CL C"
0 01 P value
0
0 Eo o3
0 00c High occupancy
Distance from NFR 5' NFR occupancy in S. cerevisiae ('shallow')
Figure 4-1: Strategy for associating chromatin features with gene sets. (A) Shownis the +1 nucleosome aligned nucleosome data for all genes (gray) and ribosomalprotein genes (blue) in S. cerevisiae, demonstrating that ribosomal protein genesare associated with wider NFRs. (B) Cumulative distribution plot of NFRoccupancy in all genes (gray) vs. ribosomal protein genes (blue). Y-axis showsfraction of promoters with NFR occupancy below a given value, with NFRoccupancy values on the x-axis. Wide separation between curves (black verticalline) is captured by a significant K-S statistic, indicating that ribosomal geneshave significantly low occupancy, or 'deep' NFRs. K-S P values are converted tocolor scale (right panel): blue - significantly low feature values; yellow -significantly high feature values.
4.1. Methodology and K-S Statistic
To quantify the enrichment for a given feature within a functional category we
used the two-sample Kolmogorov-Smirnov (K-S) test. For each K-S test, we
defined our two sample sets as genes within a given functional group and all
other genes in the genome. For each chromatin feature, the K-S test quantifies
the distance between the distributions of the two sets with n, and n2 members.
The K-S statistic KK-s is defined as the maximum absolute difference between the
cumulative distribution functions (CDFs) of the two samples. We estimated the
P value, PK-3, for the statistical significance of this difference as follows:
.. .... .... ............ .... . ..... ......... ....... .... .................. ........... . . . ... . ......

21 -le -2i 2
x2 (4.1)PK-S 1i -1 222
K K S (4.2)S= nn2KK-S*
nf + n2
For further analysis, we converted P values to K-S scores, SK-S, where
SK-S =±1ogO(PK-S) (4.3)
is positive or negative if the difference realizing the statistic KK-s is positive or
negative, respectively. To account for multiple hypotheses testing, we only
considered PK-S as significant if it was below the P value threshold for a False
Discovery Rate of 5% [58]. In the following chapters, this functional enrichment
analysis will also be applied to absolute expression levels, Poly(dA:dT) strength
in NFRs, and trans factor motif affinity scores in NFRs. Moreover, the K-S test
allowed for identification of TFs as activators and repressors across species, by
comparing downstream expression of binding sites located in NFRs versus sites
located in nucleosomes (Section 7.1.3).
4.2. Computational Contribution
Previous work on functional evolution introduced several methods for linking
functional differences to divergent phenotypes. Man and Pilpel [59] measured
translational efficiency for a number of Ascomycota species and found a number
of links between divergence in phenotype and translational efficiency. They
created a translational efficiency matrix of gene-orthologs versus species and used
the Friedman test, which is a non-parametric extension of ANOVA, to look for a
species-effect in translational efficiency. They found such an effect at
mitochondrial ribosome and splicing genes, which matched the known phenotype.

Field et al. [34] linked divergence in gene expression in the mitochondrial
ribosome genes to divergence in 'openness' of chromatin.
Our statistical framework for studying functional evolution presents
several improvements over previous work. As discussed in Section 3.3.2, the
analysis in [34] was done by comparing chromatin organization relative to the
translation start site (ATG) and does not account for the differences in 5'NFR-
ATG distances between species. Our method takes into account divergence in
global chromatin organization, which allows for a more precise and thorough
comparison. Moreover, our analysis is more general as it can test for the
functional enrichment of any feature (chromatin property, gene expression, PolyA
abundance) in the same manner.
Our approach also provides advantages to the Friedman test used by Man
and Pilpel [59], because it does not base the analysis only on genes present in a
gene-orthology matrix. Since many genes do not have clear orthology relations
for all species, the matrix in [59] consists of less than half (2800) of the S.
cerevisiae genes. As more species are included in an evolutionary study, the
number of genes with orthology relationships for all species will further decrease.
Moreover, genes that have clear orthology for the entire phylogeny are enriched
for being housekeeping genes and depleted of stress response genes [36], which
means that the sample of genes left in the gene-orthology matrix is likely
functionally biased.
Our approach test the functional enrichment for each gene set against the
entire population of genes per species, which has three main advantages. First, it
tests the tendency of each gene set against the background distribution of all
genes, which precludes the functional bias introduced by gene-orthology matrices.
Second, it normalizes for distribution differences between species. Since the K-S
test is non-parametric, the background distribution can take on any shape. And
third, our method scales with increasing number of species because it does not

exclude orthologs from a projected gene set in species A if species B lacks an
orthology relationship with S. cerevisiae.
We also clustered genes for all chromatin features (both absolute and Z
scores), and looked for GO enrichments within the resulting clusters. We found
that fewer significant trends emerge, which include mostly nonspecific GO
annotations such as "cellular process". Hence, our supervised approach of using
functional groups to guide the enrichment analysis uncovers more biological
insights. This was also observed for translational efficiency in [59]. This is
presumably because one does not need to find the right correspondence between
number of clusters that partition the data and number of GO categories.
4.3. Regulatory Evolution of Functional GeneSets
We applied this method in each species to thousands of functional gene sets to
test for enrichment of each of 13 distinct chromatin parameters. This provides a
comprehensive overview of promoter chromatin organization for each functional
gene set across the 12 species (Figure 4-2, middle panels, Figure 4-3). In order to
compare chromatin changes to gene expression levels, we also calculated the
enrichment of the genes in each gene set for high or low mRNA expression in
each species (Figure 4-2, left panels).

A Expression NFR occupancy
B
C
-i -EI
G
H
Low H0 Deep Shallow Depleted Enrichd
mRNA melabosn
Ribosome biogenesi
Toxi response srs eeTransporter
s G tessne
Gkuconsog~enesia GIYlycoys
RNAVmPOMtNucea pore
TCA cycleProson Vsr*WArnio add bisynlm
Ox pOMATP syrituse
Nuclear pore
Mitochondrial ribosomes
Cyloekeleon
Splicing factors
Figure 4-2: Functional conservation and divergence at gene sets. Shown are theK-S scores for expression level (red - high expression, green - low expression, leftpanel), NFR occupancy (yellow/blue, middle panel), and Poly(dA:dT) tracts inNFRs (purple - high Poly(dA:dT) strength enrichment; dark blue - low strengthenrichment, right panel) for gene sets (rows) with distinct phylogenetic patternsacross the 12 species (columns; species names are color coded by WGD). KSscores at saturation are 10-" (Expression, A-C), 10-5 (occupancy and PolyA, A-C), 10-1 (Expression, D-E), 10-2 (occupancy and PolyA D-E). For F-H, allgenesets are normalized to an average row value of zero (ie. centered to showrelative changes), and p-value saturation values are 10- (expression) and 102(occupancy, PolyA). Also shown are cartoons (right) reflecting the chromatinorganization inferred from the test, and relevant phylogenetic events. (A)Conserved deep NFRs in growth genes, associated with high expression andstrong Poly(dA:dT) tracts; (B) Conserved occupied NFRs in stress genes,associated with low expression and weak Poly(dA:dT) tracts; (C) Conserveddeep NFRs in proteasome genes associated with high expression but not withPoly(dA:dT) tracts; (D) Conserved occupied NFRs in glycolysis genes despitehigh expression; (E) Deep NFRs and high expression at nuclear pore genesassociated with Poly(dA:dT) tracts only in a subset of species; (F) Divergence
Larg ritosome
Prolesome
Translaion
Small nbso
RNA Polymse I
Nuclear npo
Poth yA/RG
Growth genes
... ..................... ...... ................. . ... .........
Poly(dA-dT) strength
from deep to occupied NFRs following the WGD at mitochondrial protein genes,associated with reduction in expression and in Poly(dA:dT) tracts; (G)Divergence from occupied to deep NFRs following the WGD in cytoskeletalgenes, despite little change in expression or Poly(dA:dT) tracts; (H) Divergencefrom deep to occupied NFRs in splicing after the divergence of Y lipolyticaassociated with reduction in expression and in Poly(dA:dT) tracts.
4.3.1. Conserved Dichotomy of 'Stress' and 'Growth'
Chromatin Organization
We confirm a strong dichotomy in the promoter chromatin architecture of most
'stress' and 'growth' genes in S. cerevisiae [7, 38, 60-62] and C. albicans [34], and
find that it is conserved across all 12 species (Figure 4-2A,B and Figure 4-3).
Promoters of 'growth' genes (e.g., ribosomal, proteasomal and nuclear pore
proteins, Figure 4-2A,C,E) exhibit long and deep (low occupancy) 5'NFRs.
Conversely, those of 'stress' genes (e.g., toxin-response genes, integral membrane
proteins, Figure 4-2B) exhibit a more variable chromatin architecture, with
shallower (higher occupancy) and narrower 5'NFRs. A host of additional
chromatin features are also distinct between the two functional groups (Figure
4-3). Thus, the separation of the 'growth' and 'stress' axes is a hallmark of
Ascomycota gene regulation [16, 17] and imposes strong constraints at various
different levels of chromatin organization. There are, however, several exceptions
to this rule. Most notably, several key 'growth' genes (including glycolysis genes
and endoplasmic reticulum genes) are highly expressed yet do not exhibit deep
NFRs in any species (Figure 4-2D).

A
Miochondnal rtosomal genes
HMghl-eootreseed genes (growth) Short NFR-ATG dtance,wideoMFR, localized +1/4i nucleosome. fight COS spacing
Poorly-expressed genes; (asess), Log NR-ATG dunoeuWielow NFR. fuzy +V- 1 nucleosonies wide COS spacing
Long 5 UTRs Kinam, sexual reproducton metabosn ofbenzoat. iotitot phosphte. nictiermide
B
ox pho a- ATP synthesis
Miohnnlnbosome
< 10-5 (low values) <10-5 (high values)
KS p-value
Figure 4-3: Functional conservation and variation in chromatin structure. (A)Global overview of chromatin behavior within functional gene sets. K-S scoreswere calculated for 8 parameters for 4774 gene sets in each species as in Figure4-1. Only gene sets with over 10 members in 10 or more of species are shown(1159 genesets, including "transcriptional modules" and genes annotated based onexpression changes in deletion strains [36], both excluded from Figure 4-2). Genesets were clustered by their K-S scores and visualized as in Figure 4-2. Selectedclusters of gene sets are marked on the right. Note that stress-related gene setstend to become less enriched for various chromatin and expression features atincreasing phylogenetic distance from S. cerevisiae, likely due to the rapidgain/loss of these genes over this phylogenetic distance [36]. Importantly, genesin distant species associated with orthogroups lacking an S. cerevisiae member
.. ... ....................... ................................ .......
4;4e _'..X /

tend to be poorly expressed and exhibit stress-related chromatin characteristics
(not shown), indicating that these genes likely play species-specific stress-relatedroles. (B) Gene sets associated with increase in NFR occupancy in post-WGDspecies were identified, and are shown as in panel A.
We identify a range of additional conserved patterns of chromatin
architecture associated with other specific functions, which were not previously
reported. For example, a number of gene sets (e.g. reproduction, cell wall,
inositol phosphate, benzoate, and nicotinamide metabolism genes) have conserved
long 5'NFR to ATG distances (Figure 4-3), but have few other hallmarks of
stress genes, and are expressed at average levels. In S. cerevisiae, these genes
have long 5' untranslated regions (5'UTRs) [40], suggesting that relatively long
5'UTRs are conserved at their orthologs in all 12 species. This may indicate a
conserved role for translational control in the regulation of these functions [63].
4.3.2. Coordinated Divergence in Chromatin Structure and
Gene Expression
On this backdrop of conservation, we find that coordinated changes have
occurred in chromatin organization of specific functional gene sets, consistent
with major phenotypic changes. Most notably, respiration and mitochondrial
genes have switched from a 'growth'-like chromatin pattern in pre-WGD species
(where they are highly expressed) to a more 'stress'-like pattern post-WGD
(Figure 4-2F and Figure 4-3). We confirm the previously-reported change
between S. cerevisiae and C. albicans for genes involved in respiratory
metabolism [34]. We further extend these results across the full phylogenetic
scope and to several other gene sets of related function (Figure 4-2F and Figure
4-3). This change corresponds to a major change in lifestyle from respiration to
respiro-fermentation after the WGD [28, 33, 34, 64]. We also discover the
converse evolutionary pattern (Figure 4-2G)-a number of gene sets involved in

cytoskeletal organization are packaged into deeper NFRs in post-WGD species
than in pre-WGD species. Surprisingly, the expression level of these genes has
not substantially changed with this transition.
Changes in chromain organization have also occurred at other
phylogenetic points of phenotypic evolution, suggesting a general evolutionary
mechanism. For example, we discovered that in Yarrowia lipolytica spliceosome
genes are associated with long and deep NFRs, but in all other species they are
enriched for short and shallow NFRs (Figure 4-2H, middle panel). This switch
from deep to shallow NFRs is accompanied by a decrease in expression of these
genes (Figure 4-2H, left panel), and is consistent with the much larger number of
introns in Yarrowia lipolytica genes [65], and with the loss of introns and
reduction of splicing in the subsequently diverged species.

Chapter 5. Discovery of NovelNucleosome PositioningSequences
Understanding the underlying rules that govern nucleosome positioning in living
cells presents a great challenge. Nucleosome positions are partially encoded by
the intrinsic DNA sequences [8-12], primarily those that repel nucleosome
formation such as Poly(dA:dT) tracts. In addition, trans-acting proteins can
remodel ("move") nucleosomes at different loci [13, 14]. Our current
understanding of nucleosome positioning sequences is largely based on
observations in the model organism S. cerevisiae. We hypothesized that the
inherent sequence variation and divergence in protein composition between
different species can give us a deeper, more complete insight into how
nucleosomes are positioned in vivo.
Looking across evolution allowed us to uncover new intrinsic and trans-
regulated sequences that organize chromatin, which we validate experimentally.
We first quantified the nucleosome positioning potential of all possible 5-mer, 6-
mer, and 7-mer DNA sequences. Section 5.1 discusses the method and initial
biological discoveries that resulted from this analysis. Our findings motivated us
to develop more elaborate algorithms for characterizing intrinsic anti-nucleosomal
sequences (Section 5.2) and for discovering DNA-binding motifs for trans-acting
chromatin regulators (Section 5.3). In these two sections, we discuss the
methodology, our computational contribution, and the biological findings and

experimental validation of the analysis. We find that Poly(dC:dG) elements act
as intrinsic anti-nucleosomal sequences globally, in a manner similar to the well-
studied Poly(dA:dT) tracts (Section 5.2.3). We also mechanistically show that
the transcription factor Cbfl can globally reposition nucleosomes in C. albicans,
but not in S. cerevisiae (Section 5.3.3.1). These and other novel nucleosome
positioning sequences play an important and evolvable role across a number of
yeast species (Section 5.3.3).
5.1. 7-mer analysis of Nucleosome PositioningSequences
In order to investigate the sequence characteristics underlying nucleosome
depletion at various promoters, we first calculated the extent of nucleosome
depletion over all possible 7-mer sequences in the genome of each species (Figure
5-1A). We estimated the nucleosome depletion of each 7-mer using both our in
vivo nucleosome maps for all species and in vitro nucleosome maps for S.
cerevisiae and C. albicans, as measured by an in vitro assembly method that uses
only purified nucleosomes and genomic DNA [9, 34]. If sequences repelled
nucleosomes both in vitro and in vivo, we hypothesized they would act globally
as intrinsic anti-nucleosomal sequence. Moreover, if sequences were significantly
more (or less) depleted in vivo than in vitro, this would provide evidence for
remodeling of nucleosomes by a trans-acting protein.

ASpecies
I
B
Y.p-specfic
A7. /AT-rich
PolyA or G length (nt)8 I 10 11 12 13 14 15 16 17 18 19 20
Cbf1/Reb1 (below)
CGCGCGN
40c
EC 300
200
100
AAAAAAA
GGGGGGG
CCGWTACGGGTAA
CACbTGfCAGO CbflCACGTG
* nterewic
CD
gM. ' 0l'
0E
4 5 6 7
1 4L
PolyG length (nt)
8 9 10 11 12 13 14 15 16 17
N--S-bayanus
.glabrataS.castelli
.albicans
YlpolyticsC-elegns
(A40
*U 30C4
9200
10.Ez
C alb .
#K wal
100 120 140
Median NFR width (bp)
Figure 5-1: Nucleosome positioning sequences are highly evolvable. (A) Thematrix illustrates the depletion score for all nucleosome depleted 7-mer sequences(rows) across all species in this study (rows), where purple represents strongnucleosome depletion (legend on left). (B) Zoom in from panel A showing the
.........................................................

nucleosome depletion of intrinsic anti-nucleosomal A7 and G7 sequences. (C)Zoom in from panel A on the evolutionary handoff between Reb1 and Cbf1 trans-regulated nucleosome positioning sequences. (D) PolyG elements (no mismatches)are nucleosome depleted in vivo in a number of yeast species and nematode C.elegans. Depletion increases with length. (E) PolyG elements with 0 (GO), 1(G1), 2 (G2), and 4 (G4) mismatches are also nucleosome depleted in vitro, asshown by assembly of nucleosomes and C. albicans genomic DNA. Moreover,PolyGs depletion increases with length at a steeper slope than PolyA elementswith 0 (AO), or 4(A4) mismatches. (F) Abundance of PolyG tracts of strength> 4 (x-axis) is highest in intergenic regions, and in species where G7 nuclesomedepletion is strongest. (G) Abundance of intrinsic anti-nucleosomal sequences ofstrength > 2 (y-axis in thousands) correlates with global chromatinorganization of NFR width (x-axis measures the median NFR width over all genepromoters).
We performed the N-mer analysis for N=5, 6, 7, and 8. We first log2-
transformed the normalized nucleosome occupancy data (Section 3.1), subtracted
the mean and divided by the standard deviation. The distribution of the
transformed nucleosome occupancy data for each species is approximately normal
with zero mean and unit variance. We also repeated the same procedure for
processing published in vitro data [9]. This ensured that each species' chromatin
map is normalized for differences in sequencing depth and MNase digestion level.
For each N-mer, we define the in vivo depletion score as the mean -log2
normalized nucleosome occupancy across all instances of that N-mer and all
instances of its reverse complement. We also defined the depletion score relative
to in vitro as power 2 of the difference between the in vivo depletion scores in
each species and the in vitro depletion scores in S. cerevisiae DNA (also repeated
for in vitro data from C. albicans DNA [34]). We repeated the analyses for N-
mers found only in coding regions and only in upstream promoter regions. Here
we focus on the analysis of 7-mers over the entire genome, as it proved to be
most insightful.
We found that most 7-mer sequences were similarly depleted of
nucleosomes between all species. As expected, 7-mers that are AT rich were
highly depleted of nucleosomes in vivo in all species, although the level of

depletion varied between species (Figure 5-1A, red bar). Such intrinsic anti-
nucleosomal sequences were also highly depleted of nucleosomes in vitro in S.
cerevisiae and C. albicans [9, 341.
We also identified a number of 7-mers that were nucleosome-depleted in a
subset of these species but were not particularly nucleosome-depleted in S.
cerevisiae, both in vivo and in vitro. For example, GC-rich sequences such as
GGGGGGG (G7) were significantly depleted of nucleosomes in vivo in only a
subset of species, but not in S. cerevisiae (Figure 5-1A,B). Interestingly, classic
studies on the HIS3 promoter showed that Poly(dC:dG) can substitute for
Poly(dA:dT) as an anti-nucleosomal sequence [8, 66], suggesting that PolyGs
may play a global role as novel intrinsic anti-nucleosomal sequence in some
species. Supporting this hypothesis, we found that G7 is nucleosome-depleted in
the in vitro nucleosome reconstitutions reported using genomic DNA from C.
albicans, demonstrating that nucleosome depletion over G7 can occur in the
absence of any trans-acting binding proteins (Figure 5-1B).
5.2. Evolution of Intrinsic Anti-NucleosomalSequences
To further characterize the intrinsic effects of PolyGs and PolyAs on a global
scale, we estimated the average extent of nucleosome depletion over Poly(dC:dG)
and Poly(dA:dT) elements of different length and homopolymeric mismatches
using the in vitro nucleosome map in C. albicans. Our method is similar to the
approach in [48] with several modifications and improvements. The next two
sections describe the methodology and then highlight the computational
contributions and improvements made to previous work.

5.2.1. Methodology
For each species' genome, we annotated all PolyA or PolyT tracts of length L of
5bp or more. We define the depletion score for a tract of length L as the mean of
the -log2 normalized nucleosome occupancy across all instances of that length.
This was calculated both using in vitro data from S. cerevisiae [9] and the in vivo
data from each species. For long Poly(dA:dT) tracts with very few occurrences
in a given genome we noticed a larger variation in the depletion score, likely due
to small sample size. To mitigate this problem, we fit a line for depletion scores
versus L using a weighted linear least squares fit with weights proportional to the
number of occurrences for tracts of length L. We then used the line as an
estimate for long tracts with fewer than 100 occurrences in a given genome. We
iterated this procedure for all maximal Poly(dA:dT) tracts with k allowed
mismatches, k = 1,....,20. The depletion score increases linearly with L for tracts
with different k, confirming that a linear fit is appropriate (Figure 5-2A).
To aggregate all non-overlapping Poly(dA:dT) tracts within a given
genome, we first discretized the strengths for each L. We define the fold
depletion score of all tracts of length L as power 2 of the depletion score. We
then quantized all Poly(dA:dT) tract fold depletion scores to the highest fold
depletion level exceeding 2, 4, 8, 16, and 32. For example, a tract with a
depletion score of 3.5 is 2 =11.3-fold depleted in nucleosomes relative to average,
and would be assigned a fold depletion score of 8. We next iterated over all
Poly(dA:dT) tracts with mismatches k = 0,....,20, replacing overlapping tracts
only if the tract with more mismatches had a higher quantized fold depletion
score. To annotate Poly(dC:dG) tracts, we used the same approach as above but
now treating consecutive sequences of Cs and Gs as homopolymeric tracts and
other, interrupting nucleotides as mismatches.

Length of PolyA (0 mismatches)
5 5 6 7 8 9 10 11 12
B LeInt o P(Kapoay) ( m
0~~~c t Sow(grna) 00
0
-D Sbay 1 11 11
-Kwal
CD Cab 4
AvrgeNR nth(p
B Length of PolyA (2 mismatches) D-C 8 9 10 11 12 13 14 15 16 17
A0 ~80000
570000
0 4)_U ~3000a, C 20000
-6 0 100 110 120 130 140 150 W6
Average NFR length (ft)
Figure 5-2: Evolution of anti-nucleosomal Poly(dA:dT) tracts. (AB) Shown areplots of nucleosome depletion (log 2 ,y axis) vs length of Poly(dA:dT) tract (x axis)for Poly(dA:dT) tracts with no mi'smatches (A) or 2 mismatches (B). (C) Speciesdiffer in the number of antinucleosomal. Poly(dA:dT) tracts. Shown are thenumber of anti-nucleosomal Poly(dA:dT) tracts with a strength score >= 4 ineach species. (D) Median NFR width (per species) is correlated (r = 0.77) withnumber of anti-nucleosomal Poly(dA:dT) tracts in each genome. Shown are thenumber of anti-nucleosomal Poly(dA:dT) tracts with a strength score >= 2 ineach species' genome vs. that species average NFR length.
5.2.2. Computational Contributions
Our method was similar to the approach in [61], except for the following
modifications. First, we used in vitro data from C. albicans [34], instead of in
vivo data from S. cerevisiae. The in vitro data allows us to more accurate
........................ ... ... ....... .. . ..... .. ...........
estimate the intrinsic nucleosome repelling strength of PolyA elements. Also,
using data from C. albicans allows us to discover the intrinsic anti-nucleosomal
properties of Poly(dC:dG) tracts. Such tracts are very rare in the S. cerevisiae
genome and have escaped attention in the literature. Second, we calculated
nucleosome depletion in the log domain. This is advantageous because depletion
scales linearly with length L of Poly(dA:dT) tract in the log domain, which was
not previously observed. Third, the log-linear scaling allows us to estimate the in
vitro depletion of rare homopolymers, which have too few instances in the
genome to estimate accurately. To do this, we fit a line for depletion scores
versus L using a weighted linear least squares fit with weights proportional to the
number of occurrences for tracts of length L.
5.2.3. Divergence in Use of Intrinsic Anti-nucleosomalSequences
Our modified methodology enabled us to study the intrinsic anti-nucleosomal
properties of PolyGs on a global level, which was not previously possible. As is
known for PolyAs, we found that PolyGs reside predominantly in intergenic
regions and become more depleted of nucleosomes in vitro as they increased in
length (Figure 5-1F,E). This is true for both homopolymeric tracts and PolyG
elements with mismatches. Interestingly, PolyG elements decreased in
nucleosome occupancy at a steeper slope than PolyAs (Figure 5-1E), suggesting
that they repel nucleosomes more efficiently in vitro.
PolyG elements were also highly depleted of nucleosomes in vivo in a
number of species in addition to C. albicans. Using the same method, we
identified Poly(dC:dG) elements in other species and measured their in vivo
nucleosome depletion. We observed that PolyGs of various lengths were
significantly depleted of nucleosomes in both human pathogens C. albicans and

C. glabrata (Figure 5-1D), as well as in the yeasts S. castelli, S. bayanus, and Y.
lipolytica. Moreover, Poly(dC:dG) tracts became more depleted of nucleosomes
with increasing length in the nematode C. elegans, showing that PolyGs acts as a
global anti-nucleosomal sequence in metazoans as well as fungi.
To explain the variability in nucleosome depletion of PolyG elements
between different species, we tested whether the genomic abundance of
Poly(dC:dG) tracts can provide further insight. For each species' genome, we
counted all non-overlapping PolyG elements that had an in vitro strength of 4 or
more, as measured using in vitro data from C. albicans DNA (Section 5.2.1). We
found that species with significant in vivo depletion at 7-mer GGGGGGG were
also the species with the most occurrences of strong PolyG elements in their
genomes (Figure 5-1F). For example, S. cerevisiae has 10 fold fewer PolyG
elements than C. albicans, which explains why the global role of PolyGs as an
intrinsic anti-nucleosomal sequence has not been previously reported. Similarly,
we observed larger in vivo depletion of A7 elements in genomes that contain
more Poly(dA:dT) tracts (Figure 5-2B).
The abundance of Poly(dA:dT) tracts can affect the global chromatin
properties of a species' genome, such as NFR width. As studied in S. cerevisiae,
anti-nucleosomal sequences such as PolyAs play a major role in establishing
NFRs. We find that the abundance of PolyA and PolyG sequences at promoters
is correlated with the median NFR widths in the species (Figure 5-1G), where
species with fewer intrinsic anti-nucleosomal sequences, such a Debaryomyces
hansenii, are characterized by shorter NFRs. In the case of D. hansenii, a
halophile typically found in high-salt environments, the loss of PolyAs might be
related to the increased flexibility of DNA in high salt and resulting loss of
effectiveness of intrinsic "stiff' sequences such as PolyAs in excluding
nucleosomes. Thus, major aspects of chromatin architecture can be plastic over
evolutionary timescales.

5.3. Evolution of Trans-acting ChromatinRegulators
We next wanted to use evolution to gain further insight into trans-regulated
sequences that can reposition nucleosomes. We hypothesized that the chromatin
maps in different species can reveal variation in the cis-regulatory elements
bound by 'General Regulatory Factors' (GRFs) that recruit chromatin
remodelers [13, 67, 68]. To identify such cis-elements, we searched for 7-mer
sequences that are depleted of nucleosomes in vivo but not in vitro [9]. Such
sequences lie below the diagonal of in vivo versus in vitro depletion scores (Figure
5-4A).
We devised a method (Section 5.3.1) that integrates 7-mers in order to
find the consensus DNA-binding motifs for GRFs (Figure 5-3). To our
knowledge, there is no other technique for GRF motif discovery in the literature
(Section 5.3.2). We then use this methodology to study the evolution of GRFs
(Section 5.3.3).
Clustering Alignment fold PSSMdepletion REBI
CGGGTAA --CGGGTAA- 3
CCGGGTA -CCGGGTA-- 3 LGCCGGGT GCCGGGT--- 2
GGGTAAC ---GGGTAAC 2
CGCGCGA --CGCGCGA 3
CCCGCGC CCCGCGC-- 2 RSC3/30CCGCGCG -CCGCGCG- 3CGCGCGC CGCGCGC-- 3 ja
CGCGCGT --CGCGCGT 3
CGGCGCG -CGGCGCG- 3
CGACGCG -CGACGCG- 3 - -
Figure 5-3: Overview of GRF motif finding algorithm. In vivo depleted sequencesin each genome are clustered based on similarity, aligned, and combined into a
..... ........ ........................... ........ ....................... ...... .... .... ....... ............. 1- 11 .... ....... .......... .... .............

PSSM. Shown are the results for S. cerevisiae, where the algorithm outputs theknown PSSMs of chromatin regulators Reb1 and Rsc3/30.
5.3.1. Methodology
To discover motifs, we ranked all 7-mers by their mean in vivo depletion score
relative to in vitro. We then used the top 15 7-mers in each species as input to
our algorithm. To construct PSSMs, we first calculated a similarity matrix
between all possible pairs of these 7-mers. The similarity was measured using the
dot product of the best possible ungapped alignment between two 7-mers,
allowing for reverse complements. We defined the similarity between two 7-mers
A and j as:
S(1,)= M - -L, (5.1)4
where L is the length of the alignment and M is the number of matches. To
group similar 7-mers, the similarity was then converted to a distance by
subtracting S(X,j) from the self-similarity, S(i-,1), as follows:
d(2,j)= S(2,')- S(.,j). (5.2)
The distances between all 7-mers were then clustered using single-linkage
hierarchical clustering. Single-linkage allows for grouping of 7-mers with the
same number of alignment mismatches without increasing the cluster similarity
distance. For all species, we grouped subtrees of 7-mers into clusters by allowing
for at most 1 alignment error or mismatch between the two most similar 7-mers
in a cluster. Clusters of less than 3 elements were removed from consideration.
We then performed progressive multiple alignment for all 7-mers within
each cluster. We used the NUC44 scoring matrix and computed the average
score for two matched residues (S.). Opening gaps within 7-mers was not
allowed. Gaps flanking the 7-mers were penalized as Sm/,13, as it produced a good

tradeoff for penalizing mismatches between 2 residues versus 1 residue and a
terminal gap.
To form PSSMs, letters in each position of the alignment were summed,
weighted by their depletion score relative to in vitro. Therefore, 7-mers with a
higher depletion score contributed more to the PSSM. To prevent overfitting, we
inserted pseudocounts of .5 for each entry in the PSSM, equivalent to adding an
extra, non-informational 7-mer with a depletion score relative to in vitro of 2.
5.3.2. Computational Contribution
Previous methods for finding motifs of transcription factors used co-expression,
conservation or binding (ChIP-chip, ChIP-seq, protein binding arrays)
information [69, 70]. This is the first method for specifically finding motifs of
GRFs, and requires genomic sequence and genome-wide nucleosome data.
Moreover, finding motifs using this approach implies the sites' function as a
binding site for a trans-acting chromatin factor, even when the chromatin factor
is unknown. This biological insight cannot be gained by conservation or binding
data alone. The limitation of this approach is that it does not directly link the
cis-regulatory sequence to a specific protein. Nonetheless, in the next section we
show that in many cases the specific protein can be inferred by searching the
literature and follow-up experiments.
5.3.3. In-trans Chromatin Regulators have Diverged
Our methodology identified in vivo-specific depletion over 7-mers consistent with
the binding sites for known S. cerevisiae GRFs such as Reb1 [71, 72] (Figure
5-4A, orange) and the Rsc3/30 components of the RSC ATP-dependent
chromatin remodeling complex [13, 71, 72] (Figure 5-4A, green), validating our
approach. We also found a number of sequence motifs that were nucleosome-

depleted in vivo in some species, but not in S. cerevisiae, such as the CACGTGA
motif that serves as the binding site for Cbf1 in S. cerevisiae and C. albicans [69,
71-731 (Figure 5-4A, blue). This suggests that Cbfl functions as a GRF in some
species, but may have lost this function in S. cerevisiae.
AAAAAAA,AT-rich
(cCCCGI A)
GGGGGG
0.6
CI0.210
i(CACGTG)
In vitro nucleosome depletion (Kaplan)
2 1
Cbfige"-*
CI
C
Distance from Cbf1 motif
Wr nudeosome depletion2 1
Cbf
3Calbicans
C
cc
C
Distance from Cbfl motif
Figure 5-4: Evolution of GRF motifs associatedIdentification of putative GRF sites. Nucleosome
with nucleosome depletion. (A)depletion scores were calculated
" "* (CACTGA)
El .M-
S.cerevisiae
. ...... ..... - -- . ............................

over all 7-mers from in vitro reconstitution data [9], and from our in vivo data forall species. Scatter plot shows the in vitro depletion score (x axis) vs. themaximal 7-mer nucleosome depletion score observed in vivo in any of the 12species (y axis). Motifs corresponding to select known binding sites are indicated.(B-F) Cbfl acts as a GRF in C. albicans but not in S. cerevisiae. (B) Cbf1 knownbinding site CACGTGA is nucleosome depleted in vivo in C. albicans, but not invitro. Moreover, Cbfl site is not significantly nucleosome depleted in S.cerevisiae in vitro, or in vivo in rich and ethanol medium. (C) Cbf1 sitesCACGTGA and ACGTGAC are the only 7-mers that are significantly morenucleosome occupied upon deletion of Cbf1 in C. albicans. (D) This is not thecase for these 2 and any other 7-mers upon deletion of Cbfl in control species S.cerevisiae. (E-F) Moreover, average nucleosome data centered at all CACGTGACbf1 motif instances (located at position 0 on the x-axis) is significantly morenucleosome occupied upon deletion of Cbf1 versus wildtype in C. albicans (E),but not in S. cerevisiae (F).
5.3.3.1. Cbf1 acts as a GRF in C. albicans but not S. cerevisiae
To test this hypothesis, we first checked if the depletion score of the Cbf1
binding site depends on the sensory state of the cell and the activity of the
transcription factor. In S. cerevisiae, we found that the binding site CACGTGA
is similarly depleted of nucleosomes in ethanol medium, where Cbfl activates
respiration genes, and in glucose medium (Figure 5-4B). Moreover, the higher
than average nucleosome occupancy of Cbfl sites in the in vitro C. albicans data
shows that the in vivo depletion of Cbf1 is not due to coincident positioning of
Cbf1 sites near intrinsic anti-nucleosomal sequences (Figure 5-4B).
To experimentally validate that Cbfl serves as a GRF in C. albicans but
not in S. cerevisiae, we measured nucleosome positions (as described in Section
2.2) using strains that lack the transcription factor Cbfl in the two species.
Following deletion of Cbfl in C. albicans, only two 7-mers become significantly
occluded by nucleosomes-CACGTGA and ACGTGAC, which both correspond
to Cbf1's experimentally validated binding site (Figure 5-4C). In the control
species S. cerevisiae, no 7-mers (including the two above) are significantly
affected upon deletion of Cbfl (Figure 5-4D). Moreover, averaging the
nucleosome occupancy at all 766 intergenic CACGTGA occurrences shows that

deletion of Cbfl significantly increased the nearby nucleosome occupancy and
reduces the phasing between adjacent nucleosome peaks (Figure 5-4E) in C.
albicans, but not in S. cerevisiae (Figure 5-4F). This shows that Cbfl functions
as a GRF on a global level in C. albicans through its binding site CACGTGA
but has lost this global function in S. cerevisiae.
In C. albicans, the in vivo role of Cbf1 in recruiting nucleosome remodelers
counteracts the effect of intrinsic anti-nucleosomal sequences such as PolyGs.
We observed that GC-rich 7-mers become significantly depleted of nucleosomes
when Cbf1 is removed (Figure 5-4C). Furthermore, on average, nucleosome
occupancy at 1343 intergenic PolyGs of strength > 2 is remarkably lower in the
strain lacking Cbfl (Figure 5-5A) than in WT strains. Moreover, the nucleosome
occupancy at PolyGs decreases as the length of the tracts increases in the mutant
strain, and it is stronger than both the in vivo and in vitro nucleosome depletion
measured at the same Poly(dC:dG) elements in the WT strains (Figure 5-5B).
Deletion of Cbfl also makes PolyA elements more nucleosome depleted than their
wildtype in vivo and in vitro estimates in C. albicans (Figure 5-5C). However,
this is not the case in S. cerevisieae (Figure 5-5E).
To assess the transcriptional response of the strains lacking Cbf1, we used
species-specific microarrays to measure the relative abundance of RNA collected
from the same mutant and wildtype cultures as used for the nucleosome
mapping. In C. albicans, we found that deletion of Cbfl represses most processes
related to cell growth, -including mitochondrion, ribosome, and TCA cycle related
proteins (p-value < 10'). This is consistent with the slow growth phenotype of
the Cbfl mutant strain and with Cbf1's established role in regulation of
ribosomal genes. The proteosome and mRNA processing protein complexes were
the only significantly upregulated functional groups of genes, which may be

needed for precluding errant transcription and translation due to improper
formation of NFRs.
PolyG length (nt)
4 5 6 7 8 9 10 11
Cbf1 mo tf
+1 nuc
bo e C.albicans
PolyA length (nt)
4 5 6 7 8 9 1011 12131415161718
-In vitro WT- In vivo WT
- In vivo cbffD
C.albicans
PolyA length (nt)4 5 6 7 8 9 10 11 12 13 14 15 16
0
CL.2
-0.5
*-2 -
-2.5E
-3.5
4.
-4.5
-In vito-In vivo Wr-in vivo cbHfD
S. cerevisiae (BY)
Figure 5-5: Effect of deleting Cbf1 on intrinsic anti-nucleosomal sequences. (A)Average nucleosome data centered on all PolyG elements of strength of 2 or
Distance from PolyG0
A
O
0
-0.8
E
z-1.6
0-0.5
-1
-1.5-2
-2.5
-3-3.5
-4.
-4.5
-5
.... .. .. .... ......... ........
1 i i i i i i i i i i i i 1
i i i i i i i i i i i :

greater (located at position 0 on the x-axis) is more nucleosome depleted in Cbf1-delete versus wildtype strains in C. albicans. (B) PolyGs of different lengths inC. albicans are least nucleosome depleted in vivo, more so in vitro, and evenmore so in vivo upon deletion of Cbf1. (C,E) Moreover, PolyAs of differentlength are more depleted of nucleosomes in Cbfl-delete versus wildtype strain inC. albicans (C), but in in S. cerevisiae (E). (D) Left image shows the NFRaffinity score for Cbfl motifs at all C. albicans genes (rows), where purplerepresents a strong affinity score. Matrix on the right shows the difference innucleosome occupancy between Cbfl-delete and wildtype C. albicans strains(yellow--more occupied in Cbfl-delete, blue-more occupied in WT) relative tothe NFR/+1 nucleosome boundary (at center of x-axis). Rows are all genes,ranked by amount of nucleosome occupancy difference.
We next wanted to study the effect of deleting Cbfl in C. albicans at the
level of individual genes. Ranking all genes by the difference in nucleosome
occupancy between mutant and wildtype strains, we observed that NFRs with
Cbf1 sites were amongst the most occluded with nucleosomes (K-S p-value < 10-
2, Figure 5-5D). Genes with Cbfl sites in their promoters have a slightly lower
expression level than those without Cbfl sites (K-S p-value = .0202). Moreover,
genes that contained strong Poly(dC:dG) tracts in their NFRs were amongst the
most depleted with nucleosomes (K-S p-value < 10-', Figure 5-5D) and were also
more up-regulated than genes without strong PolyG elements in their promoters
(K-S p-value < 10-').
Deletion of Cbfl in the two species has drastically different effects on
global chromatin organization. In both species, we found that approximately
20% of NFRs were significantly repositioned between the wildtype and mutant
strains (Experimental Procedure). However in C. albicans, NFRs that changed
in position between mutant and wildtype were on average 47% longer and 28%
more nucleosome depleted in the mutant strain. In contrast, in S. cerevisiae
NFRs that changed position between mutant and wildtype were 31% shorter and
11% less depleted upon Cbf1 deletion. These global effects highlight the
possibility for different global functions of Cbfl in the two species; in S.
cerevisiae, Cbf1 acts as a transcription factor that enhances NFR formation,
whereas in C. albicans Cbfl recruits nucleosome remodelers that use energy to
occlude anti-nucleosomal sequences such as PolyAs and PolyGs.
5.3.3.2. Sapi acts as a 'GRF' in Schizosaccharomyces pombe
In addition to uncovering the role of the CACGTG Cbf1 motif as a GRF site for
pre-WGD species, we also identified numerous 7-mers, which did not obviously
correspond to known TF binding sites (Figure 5-1A). For instance, a large group
of related 7-mers were nucleosome-depleted specifically in Y. lipolytica but not in
other species (Figure 5-lA). Using these 7-mers as inputs, our GRF finding
algorithm found two distinct PSSMs for anti-nucleosomal motifs in Ylipolytica
(Figure 5-6A,B). Moreover, when looking at the position of these factors' DNA
binding sites relative to chromatin organization, we found a significant
enrichment for presence in NFRs (Figure 5-6C,D). When we compared these two
PSSMs to known TF binding motifs in S. cerevisiae, we found a correspondence
to the motifs for TFs Phdl and Tbfl (Figure 5-6A,B). Thus, we propose that
TFs Phdl and Tbf1 act as GRFs in Y. lipolytica, although we cannot rule out
the possibility that another unknown protein has evolved to bind this motif.
Using our GRF motif discovery algorithm, we also found a handful of other
species-specific PSSMs. These motifs appear to capture sites for currently
uncharacterized factors, as we have not been able to determine the relevant TF
that binds to the C.albicans specific CACGAC motif.

Y.Iipolytica PHD1-like GRF Ylpolytica TBF1-like GRF
IT AT CA tA'cS. cerevisiae PHD1 motif S. cerevisias TBF1 motif
a.' __ _ ~A CCC AA
C D2 OD
2. Y.lipolytica PHD1-ike GRF Ylipolytica TBF1 -like GRF
CL 60
20
40
C E
10 10z 12
Dist to 5'NFR D to 5'NFR
Figure 5-6: Two putative GRF motifs in Y. lipolytica. (A-B) The GRF motiffinding algorithm predicts two motifs are similar to know S. cerevisiae motifs fortranscription factors (A) PHD1 and (B) TBF1. (C-D) Identifying the location ofthe newly discovered motifs shows that they are positioned preferentially inNFRs. Red-abundance of GRF motifs relative to NFR/+1 nuclesome boundary(position 0 on the x-axis). Blue-average nucleosome occupancy data (aligned byNFRs) at promoters of all genes with relevant motif sites.
Most interestingly, we noted that the anti-nucleosomal sequences
identified from S. pombe strongly resemble the motif for the essential factor
Sap1, which is involved in mating type switching and chromosome stability. We
also found that Sap1 binding sites are significantly enriched within NFRs (Figure
5-7A). Moreover, the Sap1 motif contains the 5-mer CGTTA, which was
recently identified as the most discrimitive feature in an N-score algorithm for
predicting nucleosome occupancy in S pombe in vivo [35]. Since the GRF Abf1
in S. cerevisiae is linked to mating type silencing and genomic replication, we
.................................

hypothesized that Sap1 plays an analogous role in nucleosome eviction in S.
pombe.
A B1.6 50 Distance from Sap1 motif
SAP1
SSmpombe
0 ... d.Okr A.0 S.pombe
-1000 -500 0Dist to 5'NFR
Figure 5-7: Sap1 acts as GRF in S. pombe. (A) Sap1 motif instances are locatedprimarily in NFR of genes (see Figure 5-6C,D caption). (B) In S. pombe, averagenucleosome data centered at all Sap1 motif instances (located at position 0 on thex-axis) is significantly more nucleosome occupied in Sap1ts mutant strain underrestrictive temperatures (red) than in wildtype strain strain (blue).
To confirm Sap1's role as a GRF in S. pombe, temperature sensitive
strains of Sap1 (Sapits) were created and shifted to the restrictive temperature.
Genome-wide nucleosome mapping was performed in both WT and restrictive
temperature conditions as previously described. Confirming our predictions,
Sap1 binding sites were extensively nucleosome-depleted in wild-type S. pombe,
but gained nucleosome occupancy in the absence of Sap1 function (Figure 5-7B).
This was not an artifact of overall nuclease digestion, as promoters without Sap1
sites were unchanged. We thus conclude that Sap1 acts to evict or exclude
nucleosomes, and is a GRF in S. pombe. This gives a mechanistic explanation for
the species-specific nucleosome positioning sequence reported in S. pombe [351.
Moreover, the Sap1 and Cbfl validation experiments confirm that our motif
discovery algorithm can find novel, biologically meaningful GRF motifs.
-WtSwpits

5.3.3.3. Evolutionary Transition in Anti-nucleosomal Sequence Usage
Comparing the repertoires of anti-nucleosomal sequences across all species reveals
several evolutionary insights. First, the divergence of anti-nucleosomal sequences
generally increases with phylogenetic distance (Figure 5-1A). The extent of
nucleosome depletion for all 7-mers is well conserved between closely related
species, such as S. cerevisiae and S. mikatae (~2-5 Mya, Figure 5-8A). In
contrast, a subset of trans-regulated sequences exhibited dramatically different
nucleosome occupancy when comparing S. cerevisiae to the more distant K. lactis
or K. waltii (Figure 5-8B and Figure 5-1A) - Rsc3/30-like motifs were much less
depleted of nucleosomes in K. lactis and K. waltii, where the Rsc3/30 ortholog
appears to be lost [74], whereas the Cbfl-like motif was dramatically nucleosome-
depleted in these species but not S. cerevisiae.
Second, the Rsc3/30-like binding sites were highly variable across
species, suggesting evolution of Rsc3/30 proteins and their binding site
specificity. In most species, certain 7-mers (CGCGCGC, CGCGAAA) had
strong nucleosome depletion scores (Figure 5-8C and Figure 5-1A). However, in
S. castellii and the Candida clade, there was a large expansion of CGCG-
containing 7-mers that were widely depleted (Figure 5-1A). The gradual changes
in the specific Rsc3/30 CGCG-containing motifs suggest co-evolution of this GRF
and its binding site, as previously observed for transcription factors [17, 21].
Third, we observe changes in the relative balance between nucleosome-
depletion via GRFs and constitutively programmed depletion via Poly(dA:dT)
sequences, suggesting a global mode of compensatory evolution. Most notably,
A7/T7 is less nucleosome-depleted at D. hansenii promoters than at promoters of
any other species, whereas Cbf1-like and Rsc3/30-like sites are strongly
nucleosome-depleted in D. hansenji (Figure 5-8C and Figure 5-1B). As
previously noted, the fewer, less depleted Poly(dA:dT) stretches in D. hansenji

(Figure 5-2) may be an adaptation to the high salt concentrations of this species'
ecological niche. We hypothesize that the expansion in use of the Cbf1 and
Rsc3/30 GRFs may have arisen through evolution to compensate for the lower
abundance of PolyAs in this species' genome.
Rsc3/30-like motifs
Cbf1-like motifs
Nucleosome depletion (Scer)Nucleosome depletion (S.cer)
C Q)
Species
" Cbf1 (CACGTG)* Reb1 (CGGGTAA)
II .-
C U
0.
S
Figure 5-8: GRF usage has diverged. (A) In vivo nucleosome depletion of each 6-mer in S. cerevisiae is plotted against that in S. mikatae. Few differences areobserved as points largely lie along the diagonal. (B) As in A, but for S.cerevisiae vs. K. lactis. CGCG-containing Rsc3/30-like motifs (green) are morenucleosome-depleted in S. cerevisiae than in K. lactis, whereas the Cbf1 motifCACGTG and related motifs (blue) are more nucleosome-depleted in K. lactis
.......... ... .

than in S. cerevisiae. (C) Nucleosome depletion score for five major anti-nucleosomal 7mers across 13 in vivo datasets and 2 in vitro datasets [9, 34]. (D)Evolutionary transition from the GRF Cbf1 to the GRF Reb1 through aredundant intermediate. Shown are the nucleosome depletion scores for the Cbfl(blue) and Rebi (orange) sites for the in vivo data from the 12 species (purplespecies-pre-WGD, red species-post-WGD), and for two published in vitroreconstitution datasets (blue) in S. cerevisiae (left) [9] and C. albicans [34](right). Bottom - phylogenetic tree marked with inferred events including theancestral role of Cbf1 (blue bar), the gain of Rebi (orange bar) and the loss ofCbf1's and Reb1's role as GRFs (lightning bolts).
Finally, the dominant use of different GRF sites often transitions
gradually within the phylogeny. Most notably, we find that use of Reb1 and
Cbf1 sequences is anti-correlated (Figure 5-8D and Figure 5-iC) across species:
most post-WGD species are characterized by nucleosome depletion over Reb1
sites, whereas most pre-WGD species are characterized by nucleosome depletion
over Cbfl sites (Figure 5-8D and Figure 5-iC). This complemenary phylogenetic
pattern suggests an evolutionary scenario where Cbfl was a major ancestral
GRF, Reb1 and Abf1 emerged as a GRF before the WGD, and gradually 'took
over' Cbf1's global functionality. We observe some overlap in usage of Reb1 and
Cbf1 as GRFs in C. glabrata and K. lactis, suggesting the presence of an ancestor
around the WGD event that acted as a 'redundant' intermediate, where both
GRF systems were functional. Similar evolutionary patterns were previously
observed for transcription factors [17, 23, 73, 75], and this is the first
demonstration of such a 'mediated replacement' for GRFs.
Together, our results show that the existence of essential transcription
factors that play widespread roles in nucleosome eviction is conserved across 1
billion years of evolution, but that the identity of these general regulatory factors
is highly plastic over evolution. These results help explain recent reports of
apparent evolution of "sequence rules" for chromatin structure [35], as some of the
most important sequence rules learned from in vivo data from S. pombe
correspond to partial Sap1 binding sites, which we show here acts as a GRF. The

changes in GRF identity raise questions regarding the evolutionary pressures (or
lack thereof) that affect GRF identity. Our results point towards extensive
plasticity in chromatin regulation by sequence-specific factors, and should help
guide future work on the interplay between genomic sequence and chromatin
structure.

Chapter 6. Contributions of Main
Determinants to Chromatin
Organization
Although several established mechanisms affect chromatin organization at the
promoter of a gene, the relative contribution of each is still unknown. Three
main determinants have been implicated in establishing NFRs in S. cerevisiae [2]:
(1) the expression level of the gene, as RNA polymerase recruitment affects NFR
width; (2) the presence of intrinsic anti-nucleosomal sequences such as
Poly(dA:dT) tracts in the gene's promoter; and (3) the binding of chromatin
remodelers that actively evict or move nucleosomes.
In this chapter, we first develop a computational method for assessing the
relative contribution of these three major determinants and then discuss the
method's computational novelty (Section 6.1). We then apply the method to
quantify the global effect of the three major determinants on nucleosome
depletion at NFRs and to study how this has evolved across our phylogeny
(Section 6.2). Finally, we study the preference for either intrinsic or trans-
regulated nucleosome positioning signals at promoters of functionally related
genes (Section 6.3), and find that these preferences are often functionally
conserved, but can also gradually change through evolution.

6.1. Methodology
To quantify the global contribution of the three major determinants on NFR
occupancy, we used robust Lowess smoothing, as described next in Section 6.1.2.
We assess the contribution of transcriptional activity by absolute RNA
expression (Section 2.3.2). We estimate the contribution of intrinsic anti-
nucleosomal sequence by summing the strengths of all Poly(dA:dT) elements in
NFRs (Section 5.2.1), since it explains the vast majority of the intrinsic sequence
information and generalizes to all species in an unbiased manner. Other models
of intrinsic sequence contribution {9, 61] yielded very similar results (data not
shown). We quantify the contribution of chromatin modifiers based on the Abf1
and Reb1 motif affinity scores in NFRs. This is a conservative estimate, since we
only considered the two most established GRFs. In the next section (Section
6.1.1), we introduce motif affinity scoring in NFRs.
6.1.1. Motif Affinity Scores in NFRs
We represent each motif of length L by a position specific scoring matrix (PSSM)
P, or the probability distribution P(S,,..., SL) of that motif occurring over any
sequence S,...SL. This is a standard approximation to a factors binding energy
for sequence S,...SL. We also learned the Ot-order Markov background
probability distribution B(S,,..., SL) for each sequence S,...SL, set to the frequency
of the four nucleotides in the promoter regions of a given species. We calculate
A(P,S), a motif's affinity score for an NFR sequence S, by summing the
contributions of P(S,,..., SL)/B(S,..., SL) over all allowable positions k in S as
follows:

A(P,S) = I P(Sk''...''Sk+L 1* * - JL P(Sk+l1i (6.1)kB(Sk,,...,Sk L) j=1 b(Sk+j_)
Here, b(Sk j) is the background probability of the nucleotide Sk-ji of sequence S,
and p(Sk -,j) is the probability for nucleotide Sk jI in position j of the motif's
PSSM. For the results in this study, we combined the contributions of both
forward and reverse strands of each NFR. Also, normalizing the affinity by the
length of each NFR sequence did not affect our results significantly.
6.1.2. Robust Lowess Smoothing
To quantify the global contribution of the three determinants to NFR occupancy,
we use robust Lowess smoothing. We smoothed the scatter data of the strength
of each determinant versus NFR occupancy at all promoters using a Lowess
linear fit and a smoothing window set to 10% of the span of expression level
values (Figure 6-1A-D). We assigned zero weight to outliers, defined as data
more than six standard deviations from the mean.
To compute the percent of variance explained by the robust Lowess fit,
the nucleosome occupancy of each NFR was assigned a "fitted" value F from the
robust Lowess fitting line based on each of the 3 determinants. Then the
variance of the residuals, R 2= Var(F - Z), is compared to the variance of the
22original data, UD 2= Var(Z). The percent of variance explained is defined as:
100 1 -R (6.2)
To find the percent variance explained by all determinants we first fit NFR
occupancy versus one determinant, then iteratively take the residual, and fit it
against the next determinant. In Figure 6-1E, we first fit expression, then fit the
successive residual versus Poly(dA:dT) tracts, and then fit the residual versus

Abf1 and Reb1 motif affinity scores. Changing the order of the successive fits did
not significantly reduce the total percent variance explained. We also used
robust Lowess smoothing to subtract the effect of expression on observed
chromatin features. K-S functional enrichments for the Lowess subtracted
chromatin features were calculated as described in Section 4.1.
A BA7
-v. . .*S.cerevisiae
4
C.albicans
. -
4J
mRNA level
" PolyA score M PolyA + mRNA
* mRNA level E PolyA/mRNA/Abf
0 Abf1 + Rebi
i/Reb1
6 ' 1 is5 20 2-5-
4
PolyA score
(UOC
Figure 6-1: Global contributions of 3 determinants to NFR depth. (A-D) Gene-by-gene comparisons of NFR depth to mRNA levels or Poly(dA:dT) signal.
30 35
. .. . ............... w .............. .......... 'fr.. . ............ t4nna - jj:: . . ........................ ... ........... .............. .... ........ .. .... .. .. .. ..... ......... ...................... - - .... .. ................ .. .. .... .. ...........
-4-
IIIIJ vur.

Shown are plots of NFR depth (Y axis) vs mRNA level (A,C) or Poly(dA:dT)score at the NFR (B,D) for each gene (blue dot) in the S. cerevisiae (A,B) or C.albicans (C,D) genome. Also shown is a 50-gene running window average for eachpanel (red). (E) Variation in NFR depth explained by each determinant andtheir combination. Shown are the % variation in NFR depth (bars, y axis)explained in each species by each determinant alone (dark blue - polyA, red -mRNA expression; green - binding sites for Abfl and Reb1 in the NFR) and twocombinations (purple - polyA and mRNA expression; light blue - polyA, mRNA,and the GRF sites).
6.1.3. Computational Contribution
The relative contribution of these 3 determinants on nucleosome organization is a
subject of debate. Some studies argue that intrinsic sequences play a dominant
role in positioning nucleosomes ('nucleosome code'), showing that sequence
predictions of nucleosome occupancy correlate with in vivo measurements at
R=.75 [9]. Other works argue against a nucleosome code by pointing out that
the in vivo pattern of statistical positioning (the well positioned +1 nucleosome
and downstream nucleosome phasing) is not observed in in vitro nucleosome
reconstitutions on genomic DNA [121. They also show that the in vivo pattern is
linked to transcriptional initiation. Our approach was to focus on NFRs, which
act as nucleosome-excluding barriers and lead to statistical positioning of
nucleosomes on both sides. By focusing on nucleosome depletion at NFR barriers,
this is the first analysis that has quantified the relative contribution of all three
major proposed determinants. Moreover, it allows us to observe this relationship
in 12 other yeasts. The use of robust Lowess fitting was approapriate due to the
nonlinear relationships between these 3 determinants and NFR occupancy, and
allows for measuring the percent variance explained individually and successively.

6.2. Contribution of each Determinant toNFR Occupancy
We applied our methodology to study the evolution of chromatin organization
due to each of the three determinants. We first study the contribution of each
determinant to global NFR occupancy and then explore the functional role of
each determinant through evolution and its effect on species divergence.
6.2.1. Gene Expression Level
Globally, expression level alone explains between 1.7% and 13.1% of the variation
in NFR occupancy in each of the 12 species (Figure 6-1A,C,E). In some cases,
variation in chromatin organization in a gene set, both within and between
species, correlates with gene expression level. Within each species, many highly
expressed 'growth' genes (e.g., RP genes) are packaged with wide and deep
NFRs, while many poorly-expressed stress genes have shorter, occupied NFRs
(Figure 4-2A,B, Figure 4-3). Between species, evolutionary shifts from high to
low expression levels were sometimes accompanied by corresponding changes in
chromatin organization (e.g. mitochondrial RP and splicing genes, Figure
4-2G,H).
Transcription levels alone, however, are insufficient to solely explain the
NFR occupancy measured across the 12 species. When we use Lowess
subtraction to correct for the relationship between mRNA level and each
chromatin feature, the enrichments of most gene sets for high or low values of
chromatin features were maintained (Figure 6-2). Within species, the discrepancy
is prominent in some of the gene sets, (e.g. glycolysis, gluconeogenesis) that are
highly expressed in all species but do not exhibit the expected deep NFRs (Figure
4-2D). Between species, cytoskeleton and nuclease-related gene sets have shifted

from shallow to deep NFRs at the WGD, often without a concomittant change in
expression levels (Figure 4-2G). The failure of transcript levels to fully explain
NFR width and depth is consistent with recent experimental results in S.
cerevisiae, where the distinctive chromatin organization of growth and stress
genes was largely maintained even after genetically-inactivating RNA Pol II [7].
NFR occupancy +1 occupancy CDS spacingRaw Corrected Raw Corrected Raw Corrected
Figure 6-2: Relationship between RNA level and chromatin structure. For allprojected gene sets (rows, y-axis) in all species (columns, x-axis), the extent ofvariation in a given chromatin parameter which is explained by RNA abundance
. .................................. :: ........... ........ ........................................................ .... ... ..... .. ............

was calculated. The fitted LOWESS curve was then used to correct for the effectof transcription on chromatin packaging, and KS enrichments were recalculatedas before. Shown are KS enrichments, as in Figure 4-3, for gene sets calculatedbefore ('Raw') and after ('Corrected') LOWESS-correction. NFR occupancyenrichments are not strongly influenced by RNA levels, whereas the +1nucleosome occupancy and CDS nucleosome spacing enrichments were moresubstantially explained by RNA abundance measures.
6.2.2. Intrinsic Anti-nucleosomal Sequences
We next tested an alternative hypothesis that chromatin organization at the
NFR is determined by intrinsic anti-nucleosomal sequences with low affinity for
the histone octamer, such as Poly(dA:dT) tracts [8-10, 12, 66, 76]. We estimated
the average extent of nucleosome depletion over a variety of Poly(dA:dT)
elements for each species (Figure 5-2). We then tested if functional gene sets in
each species were enriched or depleted for strongly anti-nucleosomal sequences in
their NFRs. Finally, we compared this pattern to their chromatin organization
(Figure 4-2, right vs. middle panels).
Globally, intrinsic anti-nucleosomal sequences explain 8.6-25.7% of the
variation in NFR occupancy within a given species (Figure 6-1). When
combining expression levels and sequence information together, these can explain
13-29% of the global variation in nucleosome organization in the 12 species
(Figure 6-1E). Similar results are obtained when considering other measures of
intrinsic anti-nucleosomal sequences, such as those based on computational
models [9, 61] derived from in vitro data (data not shown).
In some cases, the variation in chromatin organization within and between
species is associated with variation in intrinsic 'anti-nucleosomal' Poly(dA:dT)
tracts. Within each species, Poly(dA:dT) sequences are enriched upstream of
many highly-expressed, nucleosome-depleted, 'growth' gene sets, consistent with
previous observations in S. cerevisiae [61, 62]. Between species, we found that
gain and loss of polyA sequences is associated with changes in chromatin

organization at several gene sets and phylogenetic points, suggesting that this is a
common evolutionary mechanism used more than once in this phylogeny. We
confirmed a prior observation [34] that the change in chromatin organization at
mitochondrial ribosomal protein (mRP) genes in post-WGD respiro-fermentative
species is accompanied by the loss of PolyA-like sequences from these promoters
(Figure 4-2F). In addition, we found that the deeper and wider NFRs at splicing
genes in Y. lipolytica are associated with greater length and number of PolyA
sequences at these genes (Figure 4-2H). Conversely, the relatively shallow NFRs
of gluconeogenesis genes observed in S. castellii are associated with concomitant
depletion of polyA sequences in this species (Figure 4-2D).
Anti-nucleosomal sequences and expression patterns, however, are
insufficient to fully explain either conservation or divergence in chromatin
organization across species. This is the case globally, as previously stated, and
also within functional groups of genes. For example, proteasomal genes are
highly expressed and have deep NFRs conserved in all species, but are not
associated with intrinsic anti-nucleosomal sequences (Figure 4-2C). Furthermore,
RNA Polymerase II subunits, RNA export, and nuclear pore genes are highly
expressed with deep NFRs conserved in most species, but are only enriched for
intrinsically anti-nucleosomal sequences in a subset of species (Figure 4-2E).
Conversely, peroxisome genes are highly-expressed in D. hansenii, C. albicans,
and Y. lipolytica, where they are packaged with long (but not deep) NFRs,
despite no enrichment for Poly(dA:dT) tracts (Section 6.3.3). In these and other
cases, even when we consider expression levels, much of the depletion in NFRs
remained unexplained (Figure 6-1, Figure 6-2).

6.2.3. Trans-acting Chromatin Regulators
We therefore wished to explore the role that the third mechanism - nucleosome
eviction by chromatin remodelers - plays across the 12 species. We first assessed
the potential contribution of chromatin remodelers to chromatin organization
based on the presence in NFRs of the known binding sites for the two best-
studied S. cerevisiae GRFs: Abf1 and Reb1 (Figure 6-1E). Together, the two
motifs explain 1.2-15.1% of the observed variation in nucleosome organization in
the 12 species. Furthermore, Abf1 and Reb1 can explain up to 12.6% of the
residual variation after accounting for the contribution of expression levels and
intrinsic sequences (Successive Lowess, Figure 6-1E, difference between last 2
bars). Thus, GRFs can play an important role in explaining global chromatin
organization.
Notably, the Abf1 and Reb1 sites explain little of the variation in D.
hansenii, C. albicans, and Y. lipolytica - the species from the two clades most
distant from S. cerevisiae. In particular, the Abf1 binding site explains less than
1% of the variation in each of these species, consistent with the absence of the
Abf1 ortholog from their genome, and validating the specificity of our approach.
Furthermore, although the Reb1 ortholog is present in each of these species, its
contribution is substantially reduced (compared to e.g. S. kluyveri). In species D.
hansenji, C. albicans, and Y. lipolytica, we found a number of putative binding
sites for GRFs (Section 5.3.3.2). These factors likely have replaced the role of
Reb1 and Abf1 and can better explain the contribution of trans-acting chromatin
regulators on NFR occupancy in these species.

6.3. Functional Preference for DifferentDeterminants
We next explored if intrinsic or trans-regulated nucleosome positioning sequences
are important for the observed chromatin organization in functional gene sets
across species. To test this hypothesis, we assessed the enrichments of intrinsic
sequences and GRF motifs in the NFRs of each gene set across the 13 species.
We find that functional groups of genes often have a preference for either
intrinsic or trans-regulated nucleosome positioning sequences at promoters. This
preference is conserved in proteasome genes and other functional groups, but can
also gradually shift from one mode to another, as with RNA polymerase genes.
6.3.1. Divergent GRFs Maintain Conserved Chromatin
Organization
In some cases, GRF motifs (but not Poly(dA:dT) tracts) were enriched in a gene
set across multiple species, strongly indicating a conserved mechnanism. For
example, the Abf1 site is enriched in RNA polymerase genes across the clade
spanning S. cerevisiae and S. kluyverii (Figure 6-3D). However, since the
spectrum of GRFs is species-specific (Figure 5-8), we found no gene set associated
with the same GRF site across the entire phylogeny.

KS p-vuhm apmeian
KS p-vae NFR stats
KS p-vaue A8GFR nwcthnw
Expr 10-10NFR acupency 1 -NFR width 104
PotyA 104
Splicing
Mitochondrion
Nucleolus
RNA Polymerase
Proteasome
POIyAASF1CBF1RESI
ExprNFR ocupppancyNFR widthPcdyAABFIRSCPHOTEFI
ExprNFR o=pancyNFR width
NFR oci4pwwcyNFR widthPotyAABF1REBIRSCPoyGC*"CACGAC)
1010
104
104
10-2010-15
10-8
10-4
10-4
10.10
IFR width
DoIyG
Proteasome genes
RRoIS.cer
cAc
CwalbRli
Caib
H
RNA polymerase genes
PobyA
S.cer to S.mik
AMI~
S.bay to S.klu
D.han to Y.lip
Peroxisome genes
S.cer to S.klu
D s
PolyC/Rsc POIYGitsc
D.han to Y.Iip
Peroxisome, Peroxisome biogenesis
Figure 6-3: Evolution of anti-nucleosomal programming at gene sets. (A-F)Enrichment of Poly(dA:dT) tracts (A8) or motifs for various GRFs wascalculated for the indicated gene sets. Enrichments are shown for high (red) orlow (green) expression levels, high (yellow) or low (blue) 5'NFR occupancy orlength, and enrichment (pink) or depletion (blue) of PolyA or GRF motifs for
.. .. .... ... . .. I . ...... ..... ....................... ......... .... .. .

each gene set. KS P value saturation levels are indicated to the right of eachpanel. (G-I) Schematics of the evolution of usage of GRF and intrinsic anti-nucleosomal sites in proteasome genes (G), RNA polymerase genes (H), andperoxisome genes (I). Yellow ovals - nucleosomes, blue box - coding sequence;arrow - promoter, polyA - intrinsic anti-nucleosomal sequences; Abfl, Rsc, Reb1,CACGAC (C.albicans-specific GRF site) - enriched GRF motifs. Thephylogenetic tree is shown on the right, with the relevant clades in colorsmatching to the highlighted species. Bar - gain of functional site; lightning bolt -loss of functional site.
Instead, we found a number of cases where gene sets have conserved
chromatin architectures, but are associated with distinct GRF sites in different
species, consistent with changes in the global GRF repertoire. This is most
notable in proteasome genes, which are uniformly associated with wide/deep
NFRs but are depleted of Poly(dA:dT) tracts (Figure 4-2C). The establishment
of NFRs in these genes has likely transitioned from a mechanism dependent on
the CACGAC sequence in the Candida clade to an Abfl-dependent mechanism in
later lineages, with additional contribution from Reb1, Rsc3/30, and PolyG sites,
as these GRFs gained dominance in specific species and clades (Figure 6-3D,G).
Although the specific GRF mechanism underlying NFRs in proteasome genes has
diverged, the establishment of NFRs by a GRF-regulated (rather than
polyA/constitutive) mechanism is conserved in all species. The utility of
regulated NFRs at proteasome genes may be related to their unusual
transcriptional regulation: these are among the few highly expressed "growth"
genes that are also upregulated (rather than down regulated) during stress
responses [77].
6.3.2. Shift from Programmed to Trans-regulated NFRs
Could promoters evolve from having constitutively programmed NFRs to
regulated ones? To test this, we searched for gene sets where chromatin
organization is conserved, while the underlying anti-nucleosomal sequences have
diverged in a phylogenetically coherent pattern. We found that genes encoding

RNA polymerase subunits exhibit deep NFRs across most of the phylogeny
(Figure 6-3D). These genes' promoters are associated with Poly(dA:dT) tracts in
Y. lipolytica and the species of the Candida clade, with both Poly(dA:dT) and
the site for the Abfl GRF in species from S. kluyveri to S. bayanus, and only
with Abf1 in the clade spanning S. mikatae, S. paradoxus and S. cerevisiae
(Figure 6-3D,H). Similar behavior is seen at a number of other genesets, such as
those encoding nuclear pore components (data not shown). This profile suggests
an evolutionary scenario where the ancestral mechanism relied on Poly(dA:dT).
With the emergence of Abf1 in the last common ancestor of the pre- and post-
WGD species [36], it gained additional control of the NFRs in this gene set,
alongside Poly(dA:dT) tracts. Then, after the divergence of S. bayanus,
Poly(dA:dT) tracts were lost from the genes' promoters, leading to a complete
switch from a constitutively programmed to a regulated NFRs. This
compensatory evolution is consistent with patterns observed for TF binding sites
in functional regulons [17, 75] and with the global transitions in GRFs and
polyAs as described above.
6.3.3. Changes in GRFs Contribute to Divergence inChromatin Organization
In some cases, the gain or loss of binding sites for GRFs can contribute to
divergence in chromatin organization, coupled to phenotypic changes. Most
notably, peroxisomal genes are associated with wider NFRs in Y. lipolytica, C.
albicans, and D. hansenii, and shorter NFRs in subsequently divergent species
(Figure 6-3F,I), but are not associated with intrinsic anti-nucleosomal
Poly(dA:dT) tracts in any of the species. Instead, we find that these genes'
promoters are enriched for Poly(dC:dG) elements and Rsc3/30-like sites in Y
lipolytica, C. albicans, and D. hansenii, but not in other species. This suggests

an evolutionary scenario where either a Rsc-like motif or PolyG-based
nucleosome depletion was the ancestral mechanism controlling peroxisomal genes,
and was subsequently lost in the last common ancestor of the clade spanning S.
kluyverii and S. cerevisiae. This scenario is consistent with the higher expression
of peroxisomal genes in Y. lipolytica (where peroxisomes are particularly central
for carbon metabolism) and C. albicans (where peroxisomes play a key role in
virulence).

Chapter 7. TF Binding Sites,NFRs, and Gene Expression
In this Chapter, we study the interplay between transcription factor (TF)
binding sites, nucleosome free regions (NFRs), and gene expression. For all 13
species, we developed a computational method for identifying the genomic
locations of TF sites (Section 7.1.1), testing their functional enrichment in
promoters of related genes (Section 7.1.2), their position relative to NFRs
(Section 7.1.3), and their role as activators or repressors (Section 7.1.3). Using
our approach, we find that repositioning of TF binding sites relative to chromatin
can accompany phenotypic changes, for example at mating genes in C. glabrata
(Section 7.2). We also found that a number of motifs that act as activators in
pre-WGD species have evolved to have a dual activator and repressor role in
post-WGD species (Section 7.3) through gene duplication and divergence of
paralogs.
7.1. Methodology
7.1.1. Promoter TF Motif Scanning
Promoter sequences for each gene were defined as 1000 bases upstream, truncated
when neighboring ORFs overlapped with this region. We collected a library of
Position Weight Matrices (PWMs) for several hundred S. cerevisiae DNA-binding
proteins as previously defined [69, 71, 72, 78]. Motif targets were identified via

the TestMOTIF software program [79] using a 3rd-order Markov background
model estimated from the entire set of promoters per genome.
We considered all motif instances with P value < 0.05 as significant.
Since a few motifs had thousands of instances for this cutoff, we also limited the
number of promoters with significant sites to the top 1000. The upper bound
was chosen to exceed the maximal number of promoters bound (866, P value <
0.05) by any transcription factor in S. cerevisiae, as measured by ChIP-chip [69].
For all subsequent motif analysis, we used the above criterion to define two sets
of sites: (1) all significant sites within allowed promoters; and (2) the best sites
per allowed promoters.
7.1.2. Motif GO Enrichments
To estimate the probability that k or more elements intersect subsets of n and m
members at random in a superset of size N (or the P value for overlap of k, PHG)
we summed over the right tail of a hypergeometric distribution:
min(n,m) n - 1 1PHG ~ ) ' (7.1)
1=k
n
Using the hypergeometric P values, we estimated the significance of k overlaps
between n genes with sites in their upstream promoter and m genes within a GO
category, for a species with N genes.
7.1.3. Global Motif Analysis
All motif instances were binned into five regions (+1 nucleosome, 5'NFR, -1
nucleosome, -2 nucleosome, and NFR2 (the linker between -1 and -2
nucleosomes) if their centers overlapped with the defined regions. In addition,

sites were also split into two categories: Linkers (5'NFR and NFR2) and Nucs
(+1, -1, and -2 nucleosomes). We assigned the expression level of each gene to
each site in the upstream promoter of that gene. We used a two-sample K-S test
(as described in Section 4.1) to quantify the difference in expression levels
between sites in Linkers versus Nucs bins.
To quantify the preference of a motif's binding sites for NFRs, we
compared the mean log2 normalized nucleosome occupancy at all sites (x) against
the mean log2 normalized nucleosome occupancy over the corresponding
promoters (y). To estimate the significance of the difference of the two vectors
(x-y), we used the paired Wilcoxon signed rank test that assigns a P value for
rejecting the null hypothesis that x-y comes from a continuous, symmetric
distribution with a zero median.
7.2. Repositioning of TF Sites Relative toNFRs Links to Phenotypic Change
The interplay between chromatin organization and TF binding sites can play an
important role in regulatory divergence. Nucleosomes are generally inhibitory to
transcription factor (TF) binding [1], and in S. cerevisiae most functional TF
binding motifs are found in NFRs [11]. Precise positioning of TF binding sites
relative to nucleosomes has regulatory consequences such as changing signaling
thresholds [80] or logic gating [81]. We therefore hypothesized that an
evolutionary change in the location of TF-binding motifs relative to the
nucleosomes in a gene's promoter can lead to regulatory divergence between
species.
To test this hypothesis, we examined the location of known TF binding
motifs (from S. cerevisiae - [69, 71, 72, 78]) relative to nucleosome positions in all

species (Section 7.1.3). As expected in S. cerevisiae (Figure 7-1A,B), up to 90%
of the binding sites for growth-related TFs are localized to NFRs (e.g. REBI,
ABF1, RAP1, and FHL1), whereas as few as 25% of sites for stress-related TFs
are at NFRs (e.g., HSF1, YAP6, HAP2/3/5, GZF3, and CRZ1). Thus, sequences
that are mostly occluded by nucleosomes tend to be the binding sites for inactive
TFs, and we can use chromatin information to infer TF activity under our
growth conditions in each species. We therefore calculated for each motif the
fraction of its instances located in NFRs in all species (Figure 7-1C).
The NFR positioning of many key motifs is strongly conserved. For
example, sites for growth-related factors such as SWI4/6 and GCN4 were
similarly NFR-exposed in all species in this phylogeny. Notably, this
conservation is observed despite the fact that many motifs, which were
experimentally defined for S. cerevisiae proteins, were globally less NFR-localized
in distantly related species (Figure 7-1C). This can be attributed in some cases
to divergence of binding site preferences of the cognate TFs, and in other cases to
the absence of the TF's ortholog from the genome (Figure 7-1C, white).
Nevertheless, many motifs showed robust positioning in NFRs.
Conversely, the motifs for key TFs associated with regulation of
respiration and carbohydrate metabolism have repositioned relative to NFRs at
the WGD, consistent with regulatory divergence in these functions (Figure 7-1D).
For example, the sites for the HAP2/3/4/5 complex (a regulator of respiration
genes) and for YAP6 (a regulator of oxidative functions) have re-positioned from
NFRs to nucleosome-occluded positions post-WGD, consistent with the reduction
in expression of respirative genes. In contrast, the sites for the carbon catabolite
repressor MIG2 and for the glucose-responsive transcription factor RGT1 have
repositioned from nucleosomes into NFRs in post-WGD species, consistent with
these factors' role in establishing a fermentative strategy through gene repression.

B % in NFR (S. ce) -r- --
MATAI
30 CRZ1
TSOK2
10* STE12DAL2
0 MSN2
STP4
PHD1
20 FL
YAP7
GC 100 XBP1
SN72
% in NFR
STE12
- Nucleosofms (Secw)
2 Nucloome (C-gfa)
|STE 12 motifs (S cos)
I STE12 mates(C git)
1 2
-1000 -500 0Dist to 5'NFR
Pheromone response genes
UME6
S.castelli
-1000 -500 0Dist to 5'NFR
Figure 7-1: Evoluionary re-positioning of TF motif sites relative to NFRs. (A)Motif site location relative to chromatin features in S. cerevisiae. Shown are
2HAP2/35
ERPH1
YAP3WS
STE12MET31
CRZ1. TEC1
GCN4
LOAE6m CM, YAPe
- CBFI
RAPISWI4, MBP1ABFI
. REBIFKH12
- MIG23
4f~E i A h 0QiD
RTG3
AME
DAL80
SPT23
GZF3
MET31
YAP
HAP2M
CIN5
HACI
SNT2
CAD1
BASI
HAP1
RGT1
M
STB2
CHA4
GSMI
.................. ::::::..::::::::::::::::::::::::::::::::::::: . ........... .. ............... ..... . ...... .
-4 st 9

distributions of locations of the indicated TF binding sites (red), relative to theaveraged chromatin profile for genes bearing instances of these sites (blue) in S.cerevisiae. (B) Fraction of TF binding sites located in the NFR in S. cerevisiaewas calculated for 435 motifs, and TFs are arranged from NFR-depleted (top) toNFR-enriched (bottom). Red arrows point to TFs displayed in (A). (C) Locationof TF binding sites relative to NFRs in all 12 species. Blue, NFR depleted;yellow, NFR enriched. Since the fraction of sites in NFRs varies with averageNFR width and phylogenetic distance from S. cerevisiae, the fraction of motifinstances located in NFR for each species was normalized by each species' meanand standard deviation. White is used for S. cerevisiae motifs for TFs whoseorthologs are absent from a given species. (D) Motif repositioning at the WGD.Shown are the most significantly repositioned motifs between pre- and post-WGDspecies (t-test) from NFRs to nucleosomes (top) and vice versa (bottom). Star--WGD. Blue, NFR depleted; yellow, NFR enriched; values were first normalizedas in panel A, and then each row was mean-normalized for visual emphasis. (E,F)Repositioning of TF binding sites relative to NFRs in C. glabrata meiosis andmating genes. (E) Top panel: Fraction of STE12 sites in NFRs genome-wide(blue) or at pheromone-response genes (red) for species where STE12 motifinstances are enriched upstream of this gene set (P < 10- , Hypergeometric test).Bottom panel: Nucleosome data and STE12 sites location shown as in (A) forpheromone response genes in S. castellii and C. glabrata. (F) Distributions oflocations of the UME6 binding site (red), relative to the averaged chromatinprofile for genes bearing instances of these sites (blue) in S. castelii and C.glabrata.
Motif re-positioning has also occurred at other phylogenetic points and
gene sets, suggesting that this is a general regulatory and evolutionary
mechanism (Figure 7-1E,F). For example, the mating-related STE12 motif is
significantly enriched upstream of reproduction and mating-related genes in
species from S. cerevisiae to S. kluyverii, including C. glabrata. Although STE12
sites are found in NFRs at mating genes for most of these species, they are
largely nucleosome-occluded in C. glabrata (Figure 7-1E), an organism which has
never been observed to mate [82]. We speculate that occlusion of STE12 sites
under nucleosomes may contribute to this species' reluctance to mate, but the
continued enrichment of STE12 upstream of mating genes and the retention of
many meiosis-related genes [361 in C. glabrata suggests that it may still be
capable of mating under special conditions. We therefore predict that conditions
(environmental or perhaps genetic) that either mobilize or destabilize the
nucleosomes covering STE12 sites at pheromone-response genes might enable
mating in this species. Similarly, motifs for UME6, a major regulator of meiosis
genes in S. cerevisiae [83] are globally NFR-positioned in all species except C.
glabrata (Figure 7-1F), despite the fact that UME6 sites are enriched upstream
of orthologs of meiosis-related genes in C. glabrata. Thus, the relative re-
positioning of NFRs and TF binding sites may help explain the molecular
underpinnings of dramatic changes in regulatory and phenotypic evolution.
7.3. Duplication of TF Genes IncreasesRegulatory Capacity of Sites in NFRs
We next asked whether chromatin information could be used to infer the
regulatory effect of exposed transcription factor binding sites from the expression
level of their target genes. Exposed TF binding sites are expected to have very
different regulatory consequences depending on whether or not the TF is active,
and whether it acts as an activator or a repressor. To this end, we calculated the
expression level of all downstream genes where a given TF motif was located
within nucleosomes vs. those in which the motif was located within promoter
linkers (largely the NFR, Figure 7-2A). We reasoned that an NFR-positioned
site for an active positive regulator would be associated with a higher expression
of the target genes. Conversely, an NFR-positioned site for an active negative
regulator will be associated with a lower expression of the target genes.
Consistent with our expectation, in S. cerevisiae, transcriptional activators known
to be active in mid-log phase, such as RPN4 or PBF1, were associated with
higher expression levels at genes carrying an accessible, linker-positioned motif.
In contrast, NFR-positioned motifs for transcriptional repressors known to be
active in mid-log (e.g., MIGI, SUMI, NRG1, DIG1, STB1/2, or RIM101, Figure
7-2A) were associated with lower downstream gene expression. Thus, we devised

a novel approach to predict whether a given motif is associated with an activator
or repressor in vivo in the growth condition tested.
A S cer expression levelfor genes with motif in: Expression level of genes
with motifs in nucleosomesExpression level of genes
with motifs in linkers
Nuc Linker
RPH1RIM101RDRIIME1NHP6AFKHIADR1UME6SUM1MIG1
GIS1/RPHI
Ej CBF1RPN4RAPi
IVSFPI
-1 (repressed) I (actve)
Expression level (log2)
Figure 7-2: Evolution of TF activity at NFR-localized binding sites. (A)Nucleosome positions can be used to infer the positive or negative role of TFs intranscriptional control in S. cerevisiae. Average expression (mRNA abundance) of
GIS1/RPH1
.... .. ... ........ ... . ... .. .......... ........
Cc CD Q.. -V Z 'Ca 0 -0 ca CAO C- CA 8 u

all genes with a given motif instance located in promoter nucleosomes (left) orNFRs (right). TFs are ordered by expression difference between NFR andnucleosomal binding sites, revealing transcriptional activators (bottom) andrepressors (top) known to be active in these growth conditions. (B) Chromatininformation reveals repressors associated with post-WGD nutrient control. Foreach species (columns) and each motif (rows), shown are mean expression levelsof genes with the motif in nucleosomes (left matrix) or in linkers (right matrix .Shown are only the 138 motfis with increased activity in pre-WGD species acorrelation of over 0.5 to the vector (0,0,0,0,0,0,1,1,1,1,1,1)]. A small number ofmotifs were associated with higher activity in post-WGD species (unpublisheddata). Yellow star, WGD. (C) A model of increased regulatory capacity. Pre-WGD, only an single (activator-like) TF was present (GIS1/ RPH1, bottom).Post-WGD (star), two paralogous TFs with the same sequence specificity arepresent in the genome (GIS1, RPH1, top), one is an activator (red), and theother a repressor (green).
When we extended this analysis to all 12 species, we found substantial
divergence in the regulatory logic of the same NFR-positioned motif, most
notably at the WGD (Figure 7-2B). We found a host of motifs which, when
present in NFRs, were associated with differences in RNA expression levels
between pre- and post-WGD species. Many of those (~100) appeared to shift
from activator-like behavior in pre-WGD species (higher target expression when
in NFR) to repressor-like behavior in post-WGD species (lower target expression
when in NFR). These included sites for a surprisingly large number of TFs
involved in repression of metabolic genes in S. cerevisiae, including MIGI, GISI,
RGT1, and GAL80. Interestingly, several of these genes are found in a single
copy in pre-WGD species but were retained as duplicates [36] with similar DNA-
binding specificity following the WGD (e.g. GIS1/RPH1, RGT1/EDS1, Figure
7-2B,C). This suggests that widespread usage of competing activator/repressor
pairs in S. cerevisiae may have been facilitated by the generation of such TF
pairs at the WGD. Such duplication of trans-factors can serve as an alternative
evolutionary mode to expand and evolve regulatory capacity [84] even when
NFRs and motif positioning may be conserved.

Chapter 8. Conclusions
In this study we used a comparative functional genomics approach to study the
evolutionary interplay between chromatin organization, gene expression, and
regulatory sequence elements. We aimed to achieve two main goals: (A) to use
evolution and comparative genomics in order to understand the determinants of
chromatin organization (Section 8.1); and (B) to use chromatin information to
gain insight into the evolution of gene regulation (Section 8.2). In the process,
we improved on existing methods and developed new computational techniques
for studying chromatin organization and evolution of gene regulation (Section
8.3).
8.1. Studying Evolution to UnderstandChromatin Organization
What establishes the nucleosomal organization of a genome? While it has been
argued that intrinsic DNA sequence can almost fully explain nucleosome
organization [9], recent analysis of in vitro reconstitution data showed that that
the major intrinsic contributor to nucleosome positioning in budding yeast is the
antinucleosomal behavior of Poly(dA:dT) and related sequences [9, 12, 85].
Conversely, recent reports indicate that in S. pombe Poly(dA:dT) plays only a
minor role in nucleosome exclusion in vivo [35], indicating that even the best-
understood sequence contributor to chromatin organization plays variable roles in
chromatin structure in different species.

Our analysis provides several lines of evidence that expression levels,
intrinsic anti-nucleosomal sequences, and binding sites for GRFs that may recruit
chromatin modifiers all play a role in establishing promoter chromatin
architecture, and that the balance between these three contributors changes in
evolution and between functional groups of genes. (1) We show that a sequence-
based model based on in vitro depletion alone [9] can only account for 8.6-25.7%
of variance in NFR depth within any of the 12 species, including S. cerevisiae
(10.6%). Similarly, expression levels alone can only account for 1.7-13.1% of the
variation in each species. Even when combining both the expression and intrinsic
models we can only explain 13-29% of the variation within any single species. (2)
Although changes in intrinsic sequences and expression levels can explain changes
in chromatin across species for some gene sets (e.g. mRPs or splicing genes -
Figure 8-1A,B), they are insufficient to explain conserved chromatin behavior
across the phylogeny (e.g. RNA Polymerase subunit genes, Figure 8-1D), nor do
they explain changes in chromatin organization across species in other groups of
genes (e.g. peroxisome genes, Figure 6-31,F). Thus, these two determinants
(alone or in combination) are insufficient to explain both intra- and inter-species
variation. (3) In contrast, by comparing our in vivo data in each species to two
in vitro datasets [9, 34], we find in each species a host of sequences that exhibit
significantly greater nucleosome depletion in vivo than in vitro. Many of these
correspond to binding sites for known GRFs that play an active role in
nucleosome eviction in S. cerevisiae [2, 13, 67, 711, whereas others represent novel
candidate GRF sequences (Figure 5-1A and Figure 8-1C). (4) The relative
contribution to nucleosome organization from GRFs, intrinsic sequences and
expression levels varies between different genes sets (in all species). For example,
we show that intrinsic anti-nucleosomal sequences are enriched at NFRs in
cytoplasmic RPs (in all species -Figure 4-2A), whereas GRFs fulfill this role in
proteasome genes (in all species - Figure 6-3G,D). (5) We also show that the
100

relative contribution of one mechanism vs. another can change in evolution
(across species), both globally (as in the halophile D. hansenii, that relies more on
GRFs) and in specific gene sets (as in the RNA polymerase gene module that
shifted from intrinsic to regulated NFRs - Figure 8-iD). (6) Globally, even when
we consider only the binding sites for the two best-characterized GRFs from S.
cerevisiae (Abf1 and Reb1), GRFs alone can explain 5.2-15.1% of the variation in
nucleosome organization (in species where their orthologs are present), and 3.7-
12.6% of the residual variation after considering the contribution from expression
and Poly(dA:dT). Taken together, this analysis points to a complex interplay
between the different factors that control nucleosome positions, allows us to
assess their contributions, and recognizes the plastic and evolvable nature of all
the determinants.
8.2. Studying Chromatin to Understand theEvolution of Gene Regulation
Our study also discovers an intricate and intimate relationship between
conservation and divergence of chromatin organization and evolution of gene
regulation. At one extreme, we found a broad functional dichotomy in chromatin
organization between 'growth' and 'stress' genes, which is largely conserved. At
the other extreme, we found that chromatin organization has diverged at a major
evolutionary scale, as has happened for the evolution of respiro-fermentation, and
at other points of phylogenetic and phenotypic divergence.
101

Opening/dosing of genesetpromoters at WGD
B CLineage-specific opening/dosing
of geneset promotersEvolution of GeneralRegulatory Factors
Poly/RGPolyA/RGE
K.lac to Y.lip D.han to Klac, C.gla
S.cer to S.cas S.cer to C.alb S cer to K lacMitochondrial ribosomal genes Splicing genes
Handover of NFR determinants Coverage/exposure of TF motifs Lineage-specificcoverage/exposure of TF motifs
D.han to Ylip PA UMEgaA" YAP6 Most species
Sbay to l Klac to Y.lip
A PoeyA UME6C.gla
S.cer to S.mik S.cer to S.casRNA Polymerase genes
Lineage and geneset-specificcoverage/exposure of TF motifs
STE12 C.gla
STE12Most species
Mating genes
Generation of competing activator/repressor pairs
GI H1I
RPH1/GIS1 RPH1/GIS1
Figure 8-1: Overview of role of chromatin on regulatory evolution. Examples forthe five key evolutionary modes discovered in the study. (A,B) Transition from"open" to "closed" NFRs associated with reduction in expression and loss ofintrinsic anti-nucleosomal Poly(dA:dT) tracts in mitochondrial protein genes (atWGD) and splicing genes (after divergence of Y. Jipolytica). (C) Global shift inusage of GRFs, resulting in a gradual transition from a Cbfl-dominatedmechanism to a Reb1-dominated mechanism, through a redundant intermediate.(D) Compensatory evolution results in switch from constitutively programmed
102
..................

NFRs to GRF-regulated NFRs in RNA polymerase genes. (E-G) Re-positioningof motifs from NFRs to nucleosomes in oxidative functions following the WGD(E), and in meiosis and mating functions in C. glabrata (F,G). (H) Increasedregulatory capacity at conserved NFRs and binding sites, through the duplicationof trans-factors at the WGD.
We found five major mechanisms by which chromatin organization can be
associated with divergence of gene expression. Each of these was 'used' more
than once in the phylogeny, and is associated with more than one phenotypic or
regulatory change, including the changes described in carbon metabolism, mating,
meiosis, and splicing genes. These include (1) gain or loss of intrinsic (PolyA)
sequences can open or close NFRs (Figure 8-1A,B) [34]; (2) conserved NFRs can
be controlled by different GRF determinants, through compensatory evolution
(Figure 6-3G); (3) NFRs can shift between constitutive and regulated
determinants by compensatory ('balanced') gain/loss of intrinsic anti-nucleosomal
sequences and GRF binding sites (Figure 8-1D); (4) motifs can re-position
relative to NFRs to change transcriptional output (Figure 8-1E-G); and (5)
duplication and divergence of trans-factors can expand the regulatory behavior of
conserved NFRs and binding sites (Figure 8-1H).
8.2.1. Evolution of Gene Regulation: the Case of Respiro-
Fermentation
The evolution of the respiro-fermentative lifestyle following the WGD required a
major reprogramming of the yeast transcriptional network and involved all of the
mechanisms we describe. The shift thus included loss of intrinsic Poly(dA:dT)
anti-nucleosomal sequences in some functional modules (e.g. mitochondrial RP
genes), and the loss or switch of putative GRF sequences in others (e.g.
oxidation-reduction genes). Furthermore, sites for certain respiratory TFs (e.g.
HAP2/3/5, YAP1/3/6) have re-positioned out of NFRs, and those for glucose
repression TFs have re-positioned into NFRs (e.g. RGT1, MIGI). In yet other
103

cases, the WGD has resulted in the retention of paralogous activator-repressor
pairs that control several modules in carbohydrate metabolism. Notably, each of
these mechanisms has acted also at other phylogenetic points, suggesting that
they point to general principles, and emphasizing the utility of the WGD as a
model to study regulatory evolution.
8.3. Computational Framework for StudyingEvolution and Chromatin
Our work provides a general computational framework for the study of chromatin
organization, function and evolution. We developed a modified method for
detecting nucleosome positions by reducing the number of parameters in a
previous algorithm to three and by using the data to estimate these parameters
(Section 3.2.1). This improvement normalizes for differences in MNase digestion
level that can arise between experiments done by different labs for different
species. After inferring nucleosome positions, we developed a new method for
identifying 5'NFRs (Section 3.3.1). This allowed us to identify the most critical
regions for gene regulation across our phylogeny, and has broad applicability in
studying how chromatin organization changes with time, in evolution and in
response to environmental stimuli.
Detecting nucleosomes and NFRs allowed us to characterize a number of
features that describe the chromatin organization at each gene's promoter. We
first explored how these features have evolved on a global manner and then
developed a method to study the evolution of gene regulation functionally
(Section 4.1). Our approach relies on sets of functionally related genes to guide
the analysis in a supervised manner, and uses the K-S statistic to identify
significant trends.
104

We also developed new methods for characterizing sequences that position
nucleosomes. We improved on previous approaches for annotating Poly(dA:dT)
sequences, and extended these techniques to study the global role of Poly(dC:dG)
as intrinsic nucleosome repelling sequences (Section 5.2.1). Moreover, we
developed a new method for discovering DNA-binding motifs of trans-regulated
factors that affect chromatin organization (Section 5.3.1). Follow-up experiments
validated the biological accuracy of our approach. Furthermore, we introduced a
method for quantifying the relative contribution of the 3 major determinants on
nucleosome depletion at NFRs, using robust Lowess smoothing (Section 6.1).
And finally, we developed a quantitative framework for studying the
interplay between transcription factor binding sites, chromatin organization, and
gene expression (Section 7.1). Across our phylogeny, we identified TF binding
sites, their role in regulation of functional groups of genes, their position relative
to NFRs, and their role as activator or repressor. We identified a number of
significant biological trends using the two-sample K-S test and paired Wilcoxen
signed rank test.
8.4. Future Prospects
Future experimental studies can shed light on the mechanisms that underlie
many of our evolutionary observations. For example, we propose that increased
instability of C. glabrata nucleosomes can provide access to Ste12 sites and allow
for this species to mate. Moreover, expanding this work to other species can
provide useful insight. For example, K. polysporus is a species that rapidly
diverged from other post-WGD species following the WGD event. It would be
interesting to explore how its regulatory programs compare with pre- and post-
WGD species, as it provides an intermediary sample point.
105

In addition to introducing a host of analytical approaches for studying
chromatin structure and evolution, our work includes a comprehensive genomics
resource, http //www.broadinstitiite.or-/rege -/evolfiingi/. Future studies can
use our published data and methods to develop more detailed models of the
relationship between sequence elements, trans-factors, and gene expression, as
well as on the evolution of regulatory systems. Finally, our comprehensive study
in the emerging field of comparative functional genomics demonstrates how to
combine the power of functional assays with extensive phylogenetic scope, to
shed light both on mechanistic and evolutionary principles.
106

Bibliography
1. Kornberg, R.D. and Y. Lorch, Twenty-five years of the nucleosome,fundamental particle of the eukaryote chromosome. Cell, 1999. 98(3): p.285-94.
2. Radman-Livaja, M. and O.J. Rando, Nucleosome positioning: How is itestablished, and why does it matter? Dev Biol, 2009.
3. Rando, O.J. and H.Y. Chang, Genome-wide views of chromatin structure.Annu Rev Biochem, 2009. 78: p. 245-71.
4. Jiang, C. and B.F. Pugh, Nucleosome positioning and gene regulation:advances through genomics. Nat Rev Genet, 2009. 10(3): p. 161-72.
5. Li, B., M. Carey, and J.L. Workman, The role of chromatin duringtranscription. Cell, 2007. 128(4): p. 707-19.
6. Venters, B.J. and B.F. Pugh, A canonical promoter organization of thetranscription machinery and its regulators in the Saccharomyces genome.Genome Res, 2009. 19(3): p. 360-71.
7. Weiner, A., et al., High-resolution nucleosome mapping revealstranscription-dependent promoter packaging. Genome Res, 2009.
8. Drew, H.R. and A.A. Travers, DNA bending and its relation tonucleosome positioning. J Mol Biol, 1985. 186(4): p. 773-90.
9. Kaplan, N., et al., The DNA-encoded nucleosome organization of aeukaryotic genome. Nature, 2008.
10. Sekinger, E.A., Z. Moqtaderi, and K. Struhl, Intrinsic histone-DNAinteractions and low nucleosome density are important for preferentialaccessibility of promoter regions in yeast. Mol Cell, 2005. 18(6): p. 735-48.
11. Yuan, G.C., et al., Genome-scale identification of nucleosome positions inS. cerevisiae. Science, 2005. 309(5734): p. 626-30.
12. Zhang, Y., et al., Intrinsic histone-DNA interactions are not the majordeterminant of nucleosome positions in vivo. Nat Struct Mol Biol, 2009.16(8): p. 847-52.
13. Clapier, C.R. and B.R. Cairns, The biology of chromatin remodelingcomplexes. Annu Rev Biochem, 2009. 78: p. 273-304.
14. Whitehouse, I., et al., Chromatin remodelling at promoters suppressesantisense transcription. Nature, 2007. 450(7172): p. 1031-5.
15. King, M.C. and A.C. Wilson, Evolution at two levels in humans andchimpanzees. Science, 1975. 188(4184): p. 107-16.
107

16. Thompson, D.A. and A. Regev, Fungal regulatory evolution: cis and transin the balance. FEBS Lett, 2009.
17. Wohlbach, D.J., et al., From elements to modules: regulatory evolution inAscomycota fungi. Curr Opin Genet Dev, 2009. 19(6): p. 571-8.
18. Jeong, S., A. Rokas, and S.B. Carroll, Regulation of body pigmentation bythe Abdominal-B Hox protein and its gain and loss in Drosophilaevolution. Cell, 2006. 125(7): p. 1387-99.
19. Gompel, N., et al., Chance caught on the wing: cis-regulatory evolutionand the origin of pigment patterns in Drosophila. Nature, 2005. 433(7025):p. 481-7.
20. McAdams, H.H., B. Srinivasan, and A.P. Arkin, The evolution of geneticregulatory systems in bacteria. Nat Rev Genet, 2004. 5(3): p. 169-78.
21. Gasch, A.P., et al., Conservation and evolution of cis-regulatory systemsin ascomycete fungi. PLoS Biol, 2004. 2(12): p. e398.
22. Tirosh, I., et al., A genetic signature of interspecies variations in geneexpression. Nat Genet, 2006. 38(7): p. 830-4.
23. Tuch, B.B., et al., The evolution of combinatorial gene regulation in fungi.PLoS Biol, 2008. 6(2): p. e38.
24. Lavoie, H., et al., Evolutionary tinkering with conserved components of atranscriptional regulatory network. PLoS Biol, 2010. 8(3): p. e1000329.
25. Prud'homme, B., N. Gompel, and S.B. Carroll, Emerging principles ofregulatory evolution. Proc Natl Acad Sci U S A, 2007. 104 Suppl 1: p.8605-12.
26. Khaitovich, P., et al., Evolution of primate gene expression. Nat RevGenet, 2006. 7(9): p. 693-702.
27. Kellis, M., B.W. Birren, and E.S. Lander, Proof and evolutionary analysisof ancient genome duplication in the yeast Saccharomyces cerevisiae.Nature, 2004. 428(6983): p. 617-24.
28. Conant, G.C. and K.H. Wolfe, Increased glycolytic flux as an outcome ofwhole-genome duplication in yeast. Mol Syst Biol, 2007. 3: p. 129.
29. Brem, R.B., et al., Genetic dissection of transcriptional regulation inbudding yeast. Science, 2002. 296(5568): p. 752-5.
30. Lee, S.I., et al., Identifying regulatory mechanisms using individualvariation reveals key role for chromatin modification. Proc Natl Acad SciU S A, 2006. 103(38): p. 14062-7.
31. Tirosh, I., et al., A yeast hybrid provides insight into the evolution of geneexpression regulation. Science, 2009. 324(5927): p. 659-62.
32. Tirosh, I., et al., On the relation between promoter divergence and geneexpression evolution. Mol Syst Biol, 2008. 4: p. 159.
33. Ihmels, J., et al., Rewiring of the yeast transcriptional network throughthe evolution of motif usage. Science, 2005. 309(5736): p. 938-40.
34. Field, Y., et al., Gene expression divergence in yeast is coupled toevolution of DNA-encoded nucleosome organization. Nat Genet, 2009.41(4): p. 438-45.
108

35. Lantermann, A.B., et al., Schizosaccharomyces pombe genome-widenucleosome mapping reveals positioning mechanisms distinct from those ofSaccharomyces cerevisiae. Nat Struct Mol Biol, 2010. 17(2): p. 251-7.
36. Wapinski, I., et al., Natural history and evolutionary principles of geneduplication in fungi. Nature, 2007. 449(7158): p. 54-61.
37. Shivaswamy, S., et al., Dynamic remodeling of individual nucleosomesacross a eukaryotic genome in response to transcriptional perturbation.PLoS Biol, 2008. 6(3): p. e65.
38. Albert, I., et al., Translational and rotational settings of H2A.Znucleosomes across the Saccharomyces cerevisiae genome. Nature, 2007.446(7135): p. 572-6.
39. Kent, W.J., BLAT--the BLAST-like alignment tool. Genome Res, 2002.12(4): p. 656-64.
40. Xu, Z., et al., Bidirectional promoters generate pervasive transcription inyeast. Nature, 2009. 457(7232): p. 1033-7.
41. Kornberg, R.D. and L. Stryer, Statistical distributions of nucleosomes:nonrandom locations by a stochastic mechanism. Nucleic Acids Res, 1988.16(14A): p. 6677-90.
42. Mavrich, T.N., et al., A barrier nucleosome model for statisticalpositioning of nucleosomes throughout the yeast genome. Genome Res,2008. 18(7): p. 1073-83.
43. Heus, J.J., et al., The nucleosome repeat length of Kluyveromyces lactis is16 bp longer than that of Saccharomyces cerevisiae. Nucleic Acids Res,1993. 21(9): p. 2247-8.
44. Van Holde, K.E., Chromatin. Springer series in molecular biology. 1989,New York: Springer-Verlag. xii, 497 p.
45. Sasaki, S., et al., Chromatin-associated periodicity in genetic variationdownstream of transcriptional start sites. Science, 2009. 323(5912): p. 401-4.
46. Warnecke, T., N.N. Batada, and L.D. Hurst, The impact of thenucleosome code on protein-coding sequence evolution in yeast. PLoSGenet, 2008. 4(11): p. e1000250.
47. Washietl, S., R. Machne, and N. Goldman, Evolutionary footprints ofnucleosome positions in yeast. Trends Genet, 2008. 24(12): p. 583-7.
48. Routh, A., S. Sandin, and D. Rhodes, Nucleosome repeat length and linkerhistone stoichiometry determine chromatin fiber structure. Proc Natl AcadSci U S A, 2008. 105(26): p. 8872-7.
49. Tirosh, I., J. Berman, and N. Barkai, The pattern and evolution of yeastpromoter bendability. Trends Genet, 2007. 23(7): p. 318-21.
50. Li, Y., et al., RNA polymerase H1 initiation factor interactions andtranscription start site selection. Science, 1994. 263(5148): p. 805-7.
51. Mavrich, T.N., et al., Nucleosome organization in the Drosophila genome.Nature, 2008. 453(7193): p. 358-62.
52. Schones, D.E., et al., Dynamic reulation of nucleosome positioning in thehuman genome. Cell, 2008. 132(5: p. 887-98.
109

53. Fuda, N.J., M.B. Ardehali, and J.T. Lis, Defining mechanisms thatregulate RNA polymerase II transcription in vivo. Nature, 2009.461(7261): p. 186-92.
54. Ogata, H., et al., KEGG: Kyoto Encyclopedia of Genes and Genomes.Nucleic Acids Res, 1999. 27(1): p. 29-34.
55. Harris, M.A., et al., The Gene Ontology (GO) database and informaticsresource. Nucleic Acids Res, 2004. 32(Database issue): p. D258-61.
56. Mewes, H.W., et al., MIPS: a database for genomes and protein sequences.Nucleic Acids Res, 2002. 30(1): p. 31-4.
57. Karp, P.D., et al., Expansion of the BioCyc collection of pathway/genomedatabases to 160 genomes. Nucleic Acids Res, 2005. 33(19): p. 6083-9.
58. Benjamini, Y. and Y. Hochberg, Controlling the false discover rate: apractical and powerful approach to multiple testing. J. Royal Stat. Soc. B,1995. 57: p. 289-300.
59. Man, 0. and Y. Pilpel, Differential translation efficiency of orthologousgenes is involved in phenotypic divergence of yeast species. Nat Genet,2007. 39(3): p. 415-21.
60. Choi, J.K. and Y.J. Kim, Intrinsic variability of gene expression encodedin nucleosome positioning sequences. Nat Genet, 2009. 41(4): p. 498-503.
61. Field, Y., et al., Distinct modes of regulation by chromatin encodedthrough nucleosome positioning signals. PLoS Comput Biol, 2008. 4(11): p.e1000216.
62. Tirosh, I. and N. Barkai, Two strategies for gene regulation by promoternucleosomes. Genome Res, 2008. 18(7): p. 1084-91.
63. MacKay, V.L., et al., Gene expression analyzed by high-resolution statearray analysis and quantitative proteomics: response of yeast to matingpheromone. Mol Cell Proteomics, 2004. 3(5): p. 478-89.
64. Kurtzman, C.P. and J.W. Fell, The yeasts : a taxonomic study. 4th ed.2000, Amsterdam ; New York: Elsevier. xviii, 1055 p.
65. Marck, C., et al., The RNA polymerase IHl-dependent family of genes inhemiascomycetes: comparative RNomics, decoding strategies transcriptionand evolutionary implications. Nucleic Acids Res, 2006. 34(6): p. 1816-35.
66. Jyer, V. and K. Struhl, Poly(dA:dT), a ubiquitous promoter element thatstimulates transcription via its intrinsic DNA structure. Embo J, 1995.14(11): p. 2570-9.
67. Hartley, P.D. and H.D. Madhani, Mechanisms that specify promoternucleosome location and identity. Cell, 2009. 137(3): p. 445-58.
68. Yarragudi, A., L.W. Parfrey, and R.H. Morse, Genome-wide analysis oftranscriptional dependence and probable target sites for Abf1 and Rap1 inSaccharomyces cerevisiae. Nucleic Acids Res, 2007. 35(1): p. 193-202.
69. Harbison, C.T., et al., Transcriptional regulatory code of a eukaryoticgenome. Nature, 2004. 431(7004): p. 99-104.
70. Kellis, M., et al., Sequencing and comparison of yeast species to identifygenes and regulatory elements. Nature, 2003. 423(6937): p. 241-54.
110

71. Badis, G., et al., A library of yeast transcription factor motifs reveals awidespread function for Rsc3 in targeting nucleosome exclusion atpromoters. Mol Cell, 2008. 32(6): p. 878-87.
72. Zhu, C., et al., High-resolution DNA-binding specificity analysis of yeasttranscription factors. Genome Res, 2009. 19(4): p. 556-66.
73. Hogues, H., et al., Transcription factor substitution during the evolution offungal ribosome regulation. Mol Cell, 2008. 29(5): p. 552-62.
74. Byrne, K.P. and K.H. Wolfe, Visualizing syntenic relationships among thehemiascomycetes with the Yeast Gene Order Browser. Nucleic Acids Res,2006. 34(Database issue): p. D452-5.
75. Tanay, A., A. Regev, and R. Shamir, Conservation and evolvability inregulatory networks: the evolution of ribosomal regulation in yeast. ProcNatl Acad Sci U S A, 2005. 102(20): p. 7203-8.
76. Kunkel, G.R. and H.G. Martinson, Nucleosomes will not form on double-stranded RNa or over poly(dA).poly(d T) tracts in recombinant DNA.Nucleic Acids Res, 1981. 9(24): p. 6869-88.
77. Gasch, A.P., et al., Genomic expression programs in the response of yeastcells to environmental changes. Mol Biol Cell, 2000. 11(12): p. 4241-57.
78. MacIsaac, K.D., et al., An improved map of conserved regulatory sites forSaccharomyces cerevisiae. BMC Bioinformatics, 2006. 7: p. 113.
79. Barash, Y., et al., CIS: compound importance sampling method forprotein-DNA binding site p-value estimation. Bioinformatics, 2005. 21(5):p. 596-600.
80. Lam, F.H., D.J. Steger, and E.K. O'Shea, Chromatin decouples promoterthreshold from dynamic range. Nature, 2008. 453(7192): p. 246-50.
81. Lomvardas, S. and D. Thanos, Modifying gene expression programs byaltering core promoter chromatin architecture. Cell, 2002. 110(2): p. 261-71.
82. Muller, H., et al., The asexual yeast Candida glabrata maintains distinct aand alpha haploid mating types. Eukaryot Cell, 2008. 7(5): p. 848-58.
83. Williams, R.M., et al., The Ume6 regulon coordinates metabolic andmeiotic gene expression in yeast. Proc Natl Acad Sci U S A, 2002. 99(21):p. 13431-6.
84. Wapinski, I., et al., Gene duplication and the evolution of ribosomalprotein gene regulation in yeast. Proc Natl Acad Sci U S A, 2010. 107(12):p. 5505-10.
85. Tillo, D. and T.R. Hughes, G+C content dominates intrinsic nucleosomeoccupancy. BMC Bioinformatics, 2009. 10: p. 442.
111