Predictors of pulmonary complications after bariatric surgery
Upload
independentCategory
view
2download
0
Evidence of Increased Inflammation and Microcirculatory Abnormalities in Patients with Type 1 Diabetes and Their Role in Microvascular Complications
1Sridevi Devaraj, PhD, 1Anthony T. Cheung,PhD, 1,2Ishwarlal Jialal, MD, PhD, 2Steven C. Griffen, MD, 3Danh Nguyen, PhD, 2Nicole Glaser, MD, and 2Thomas Aoki, MD
Laboratory for Atherosclerosis and Metabolic Research, Departments of Pathology1 and
Internal Medicine2 and Biostatistics3, UCDavis Medical Center, Sacramento CA
Running Title: Inflammation, Complications and Type 1 diabetes
Address for Correspondence: S.Devaraj, PhD
Associate Professor of Pathology UCDavis Medical Center, Sacramento CA 95817
Email:[email protected]
Received for publication 7 June 2007 and accepted in revised form 4 August 2007.
Diabetes Publish Ahead of Print, published online September 5, 2007
Copyright American Diabetes Association, Inc., 2007
Inflammation, Complications and Type 1 diabetes
Abstract: Background and Objectives: Type I diabetes (T1DM) is associated with increased microvascular complications and inflammation. The monocyte-macrophage is a pivotal cell in atherogenesis. There are scanty data on non-invasive measures of microvascular abnormalities and inflammation in T1DM with microvascular complications. Thus, we examined systemic and cellular biomarkers of inflammation in patients with T1DM with (T1DM-MV) and without microvascular complications (T1DM) compared to matched controls (C) and determined the microcirculatory abnormalities in T1DM and T1DM-MV using computer assisted intravital microscopy (CAIM). Research Design and Methods: Fasting blood, 24 hr urine and CAIM measurements were obtained from T1DM and T1DM-MV and matched controls (C). Results: CRP, E-selectin, nitrotyrosine, monocyte superoxide, cytokines were elevated in T1DM and T1DM-MV compared to C (p<0.01). Severity index, as assessed by CAIM, was significantly increased in T1DM and T1DM-MV compared to C (p<0.001). There was a significant increase in CRP, nitrotyrosine, VCAM and monocyte superoxide anion release, IL-1 release in T1DM-MV compared to T1DM (P<0.05). T1DM-MV had significantly increased CAIM severity index and microalbumin:creatinine ratio compared to T1DM (p<0.05). Furthermore, pp38MAPK, pp65 and pERK activity were significantly increased in monocytes from T1DM and T1DM-MV compared to C and pp38MAPK and pp65 activity were significantly increased in T1DM-MV compared to T1DM (p<0.01). Conclusions: T1DM-MV have increased inflammation compared to T1DM. CAIM provides an effective biomarker of microvascular complications since it is significantly elevated in T1DM-MV compared to T1DM and can be monitored following therapies targeted at improving inflammation and/or microvascular complications of T1DM. Grant Support: NIH K24AT00596, NIH R21DK69801, NIH UL1 RR024146
2
Inflammation, Complications and Type 1 diabetes
Introduction: Coronary artery disease is the main cause of death in Type 1 diabetes (T1DM). T1DM is associated with an increased risk of vascular complications and T1DM patients with proteinuria and /or retinopathy have a significantly increased risk of fatal coronary artery disease (1) . Most studies have indicated that this excess risk for macrovascular complications cannot be explained solely by conventional risk factors such as dyslipidemia, hypertension and smoking. Therefore, the diabetic state, per se, confers an increased propensity to accelerated atherogenesis. However, the precise mechanisms remain to be elucidated. Inflammation is pivotal in atherosclerosis (2). The monocyte-macrophage, a crucial cell in atherogenesis, is readily accessible for study. We and others have previously shown that monocytes from T2DM with and without complications exhibit increased proatherogenic activity compared to matched controls (3-5). Recently, we demonstrated that T1DM exhibits increased inflammation as evidenced by increased plasma CRP levels and increased monocyte pro-atherogenic activity (6). However, there is scanty data on biomarkers of monocyte function and inflammation in T1DM with microvascular complications and on non-invasive measures of microvascular abnormalities. Thus, the main objective was to assess monocyte function and associated biomarkers of inflammation in T1DM without and with microvascular complications compared to matched controls and to examine microvascular abnormalities using the technique of computer assisted intravital microscopy (CAIM) (7-9). Subjects and Methods: Type I diabetic patients (onset < 20years and on insulin therapy since diagnosis) present age ≥ 15 years with duration of diabetes ≥ 1year (to avoid the autoimmune component of the disease) were recruited without restriction to gender, race, or socioeconomic status by the endocrinologists, S. Griffen, T.Aoki and N. Glaser at UCDavis Medical
Center through fliers and advertisements in the local newspaper. None of the patients were on glucophage and/or the thiazolidenediones. Female subjects were studied in the follicular phase of the menstrual cycle. Postmenopausal women on estrogen replacement therapy were excluded, since estrogen decreases LDL oxidation, preserves endothelial function, reduces levels of soluble CAMs and raises CRP (10,11). Exclusion criteria were: mean HbA1c over the last year >10% , inflammatory disorders e.g. rheumatoid arthritis; macrovascular complications such as strokes, myocardial infarction etc., abnormal liver, renal or thyroid function; malabsorption; steroid therapy, anti-inflammatory drugs except aspirin (81mg/day) as recommended by the ADA, since this dose is not anti-inflammatory (12), use of antioxidant supplements in the past 3-6 months; pregnancy, smoking, abnormal complete blood count and alcohol consumption > 1 oz/day; consumption of N-3 PUFA capsules (>1g/day) since N-3 PUFA have a significant anti-inflammatory effect on cytokines and adhesion molecules etc. (13), and chronic high intensity exercisers, since intense exercise can stimulate cytokine release (14). None of the subjects were on lipid lowering drugs. Microvascular complications were defined as retinopathy, nephropathy and neuropathy and determined in T1DM patients . Presence of retinopathy was diagnosed by Ophthalmology by fundal photography and grading as defined by the Early Treatment Diabetic Retinopathy Study (ETDRS), performed by trained technicians who were blinded, also, fluorescein angiography was performed in some patients with proliferative retinopathy. Average ETDRS score in T1DM was 12 and in T1DM-MV 42. Nephropathy status was determined on consistent results from atleast 2 timed urine specimens and confirmed using 24 hour urine. Microalbuminuria was defined as microalbumin:creatinine ratio of > 30-300ug/mg creatinine and overt nephropathy was defined as albumin excretion rate of > 300 ug/mg creatinine. For assessment of
3
Inflammation, Complications and Type 1 diabetes
neuropathy, participants were questioned on sensory, motor and autonomic symptoms such as numbness, hypersensitivity to touch, burning , aching or stabbing pain in hands or feet and the standard neurological examination included evaluation of reflex activity, sensation to light touch (cotton wool), pain (pinprick) , vibration (tuning fork) and proprioception. Neuropathy was defined as presence of 2 or more of either symptoms, sensory and/or motor signs, absent tendon reflexes. Following history and physical examination, baseline EKG’s, ankle-brachial indices by Doppler studies were undertaken on the T1DM patients to rule out macrovascular disease. Informed consent was obtained from the participants. Study Design: T1DM patients without microvascular disease (n=54), T1DM with microvascular complications (n=48) and age (within 10 years), ethnicity and gender matched controls were studied (n=54). Fasting blood (90mL) was obtained to assess monocyte function and other biomarkers of inflammation. A complete blood cell count, plasma lipid and lipoprotein profile, creatinine, liver function tests, blood glucose, glycated hemoglobin, TSH and urinary microalbumin were assayed in the Clinical Pathology Laboratory using standard laboratory techniques. Computer assisted intravital microscopy: Each experimental subject was seated and requested to relax for atleast 10 minutes. Subject was cautioned not to rub the eyes. If there was any eye irritation, 2 drops of non-medicated opthalmic saline was pplied and excessive saline blotted by a tissue at the corner of the eye. Subject again relaxed before videotaping with the subject’s forehead and chin resting on a head chin rest and elbows resting steadily on the bench. The microcirculation of the bulbar conjunctiva was videotaped using CAIM in each experimental subject using a charge-coupled device (CCD) video camera (COHU Model CCD-6415-3000) as described previously (7-
9). A fiber-optics light source (Fiber-Lite Model 3100) with a Kodak #58 Wratten (anti-red) filter was focused on the peri-limbal vessels of the bulbar conjunctiva for epi-illumination. The perilimbal region of the bulbar conjunctiva was videotaped. Each subject was seated and asked to relax for at least five minutes and then asked to rest his/her head on a chin-forehead restrain securely mounted to a desk. The height of the CAIM system was adjusted to align horizontally with the peri-limbal region of the eye. Once in focus, the conjunctival vessels appear as sharp black lines and tubes on-screen. A 15-minute videotape sequence was made of each experimental subject in at least five different fields. The videotapes on the conjunctival microcirculation in all experimental subjects were coded and blindly analyzed in order to maintain objectivity during data analysis. All coded video sequences were studied in their entirety to identify morphometric microvascular abnormalities in the conjunctival microcirculation, with the identity of the patients and their medical records blinded to the investigators. Normally, five or more video sequences (with at least one video sequence from each of the five different fields videotaped) from each patient and control subject were selected. A well-resolved video frame from each video sequence was captured for detailed analysis. A few vessels of interest were selected for detailed analysis using in-house developed imaging software VASCAN, VASVEL and public domain software, SCION (7-9). A Severity Index (SI) was then computed from the 15 different microvascular abnormalities found, some of which include % presence of abnormal wide vessel diameter, vessel distribution, vessel morphometry, vessel (flow) sludging, boxcar flow pattern - same as trickled flow, microaneurysms, blood flow velocity, and whole blood viscosity. The advantages of this technique that it is non-invasive and rapid. In addition, it has been previously validated (7-9) and has an intra-assay coefficient of variation of < 5% and an inter-assay coefficient of variation of 12%.
4
Inflammation, Complications and Type 1 diabetes
Circulating biomarkers of inflammation that were assessed include high sensitive C-reactive protein, plasma soluble cell adhesion molecules (sVCAM,sICAM, sE-selectin), and nitrotyrosine. Parameters of monocyte function that were assessed include superoxide anion, interleukin (IL)-1β, IL-6, IL-8, IL-10 and tumor necrosis factor-α release, adhesion to human aortic endothelium. Soluble CAMs: Plasma soluble ICAM-1, VCAM-1, E-selectin were measured by ELISA using reagents from R&D Biosystems as reported previously (3). CRP: Plasma high sensitive-CRP levels were measured by an ultra-sensitive assay (4). Nitrotyrosine: Plasma nitrotyrosine levels were measured by ELISA using reagents from Oxis. The inter and intra-assay coefficient of variation of all these ELISA assays was < 10% Monocyte Isolation: Mononuclear cells were isolated from fasting heparinized blood (90ml) by Ficoll Hypaque gradient (3). Monocytes were isolated by magnetic cell sorting using the depletion technique (Miltenyi Biotech). Using this technique in our laboratory, we have shown that at least 88% of cells are CD14 positive by flow cytometry. Isolated monocytes were activated using lipopolysaccharide (10 µg/mL for O2
- measurements and 1µg/mL for cytokine and chemokine release as obtained from our preliminary studies) and the following functions were studied: O2
- release, release of cytokines, adhesion to HAEC. Superoxide anion: O2
- generation in resting and LPS-activated monocytes were measured as the superoxide dismutase-inhibitable reduction of acetylated ferricytochrome C as described previously (3). Cytokines and Chemokines: The release of the cytokines IL-1β, IL-6, IL-10 and TNF-α and the chemokine IL-8 were measured in the supernatants of resting and LPS-activated monocytes following a 24 hr incubation at 37ºC using BDFACS Array (3). Monocyte adhesion: Adhesion of human monocytes to confluent monolayers of HAEC (obtained from Clonetics) were carried out by
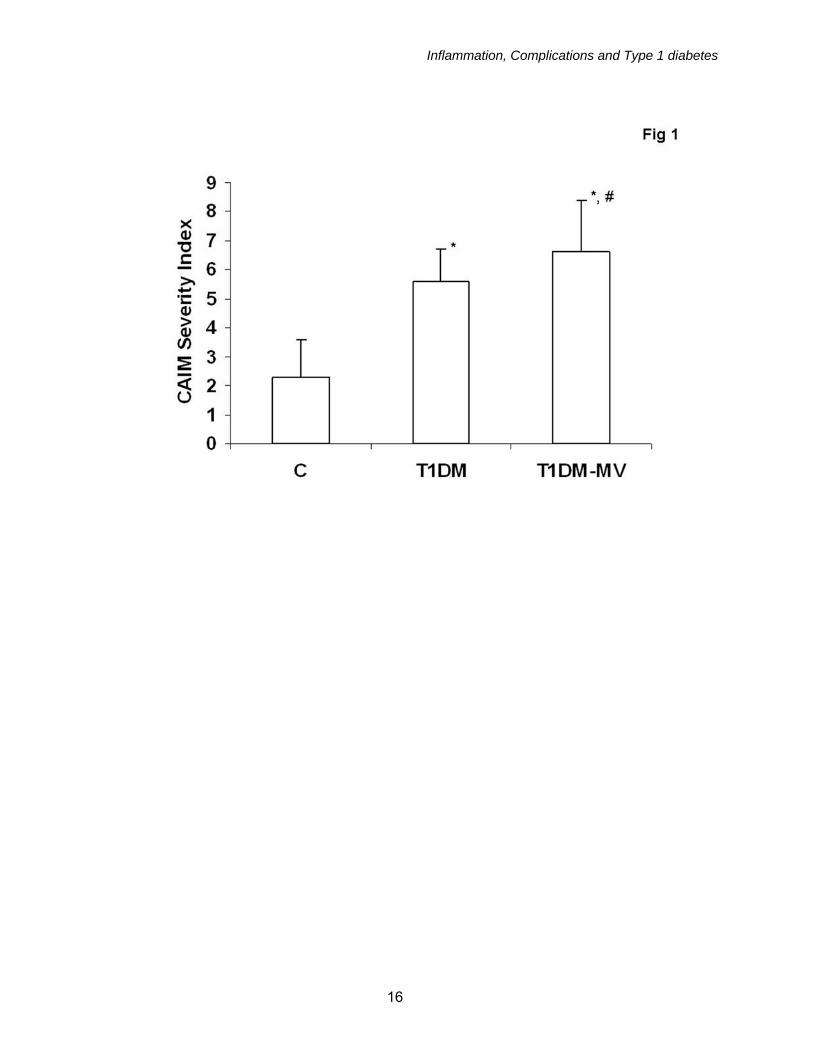
a fluorescence method as described previously (3). Cell signaling studies: Monocyte lysates and nuclear extracts were prepared as described previously (15) and phosphorylated and total p38MAPK, ERK and JNK activity in the lysates and NFKb p65 activity in the nuclear extracts were assessed using reagents from Biorad using the Bioplex multiplex phosphoprotein detection assays following manufacturer’s instructions. The intra-assay CVs of the assays were <14%. Results were confirmed by Western blotting using specific antibodies to the targeted phosphoproteins. Statistical Analyses: Following one-way ANOVA, parametric data were analyzed using paired t-tests and nonparametric tests (Wilcoxon signed rank) were implemented because of skewed distribution of data in some of the variables. The level of significance was set at P<0.05. Spearman’s rank/Pearson correlation was performed to examine associations between parameters tested. Results: Baseline subject characteristics are provided in Table 1. While T1DM-MV subjects were significantly older than T1DM and C subjects, there were no significant differences in body mass index, systolic/diastolic pressure, duration of diabetes, lipid profile, fasting glucose, HbA1C among the T1DM and T1DM-MV groups (Table 1). Furthermore, 30% of T1DM-MV had evidence of diabetic retinopathy, 66% of the T1DM-MV patients had evidence of incipient nephropathy, as evidenced by microalbuminuria and 21% had diabetic neuropathy. As expected, urine microalbumin:creatinine ratio was significantly elevated in T1DM-MV compared to T1DM and C (p<0.001). Furthermore, the severity index as assessed by CAIM was elevated in both T1DM and T1DM-MV groups compared to C with the increase being significantly higher in T1DM-MV group compared to T1DM alone (p<0.01) (Fig 1). In addition, among the microvascular abnormalities, there was significantly greater vessel sludging, abnormal blood flow pattern (box-car phenomenon) and blood flow velocity was
5
Inflammation, Complications and Type 1 diabetes
increased in T1DM-MV compared to T1DM, indicative of a more pronounced microvascular abnormality in these patients. Among the circulating biomarkers of inflammation, age-adjusted hsCRP levels were significantly increased in plasma of T1DM and T1DM-MV compared to C and also significantly increased in T1DM-MV compared to T1DM (35% increase, p<0.01) (Table 2). Also E-selectin levels were significantly increased in both T1DM and T1DM-MV groups compared to C, with no significant differences between the 2 T1DM groups (Table 2). sVCAM levels were significantly higher in T1DM-MV group compared to T1DM and C and plasma nitrotyrosine levels were significantly increased in both T1DM and T1DM-MV groups compared to C and the increase in the T1DM-MV group was significantly higher than T1DM (Fig 2). With regards to cellular biomarkers of inflammation, i.e.,monocyte pro-atherogenic activity, in the resting state, T1DM and T1DM-MV monocytes secreted significantly increased O2
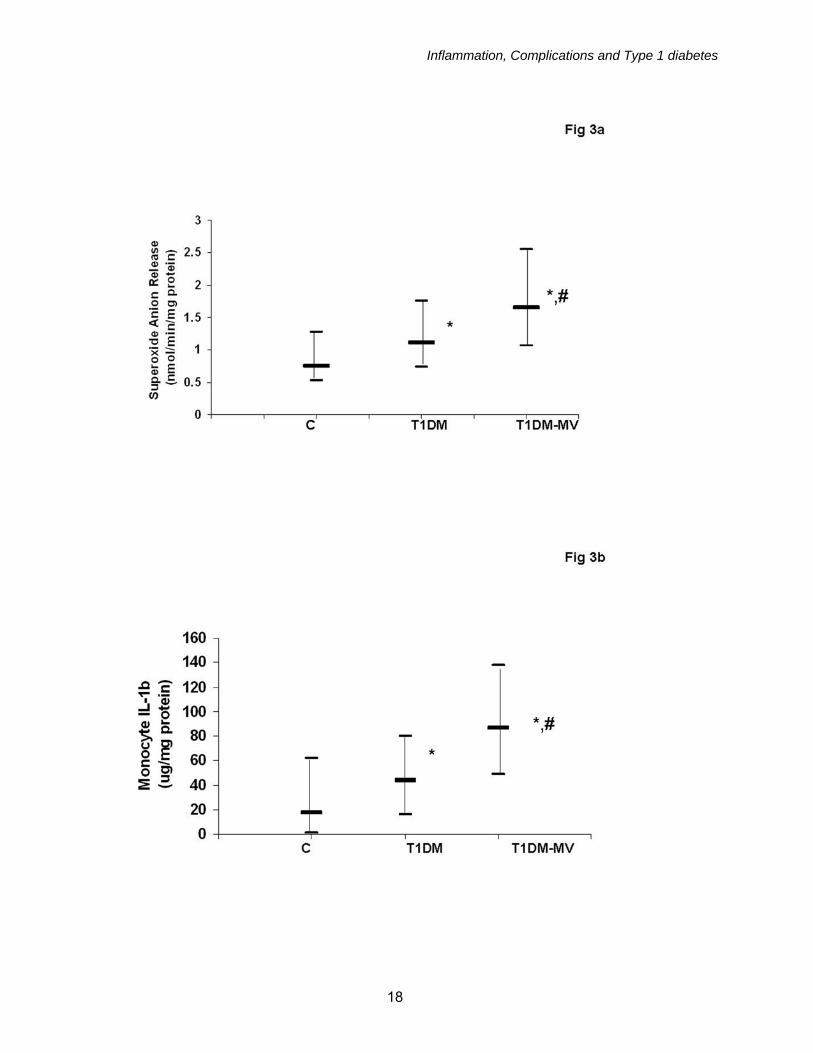
- compared to C (data not shown). Following LPS activation, T1DM-MV monocytes secreted significantly increased levels of O2
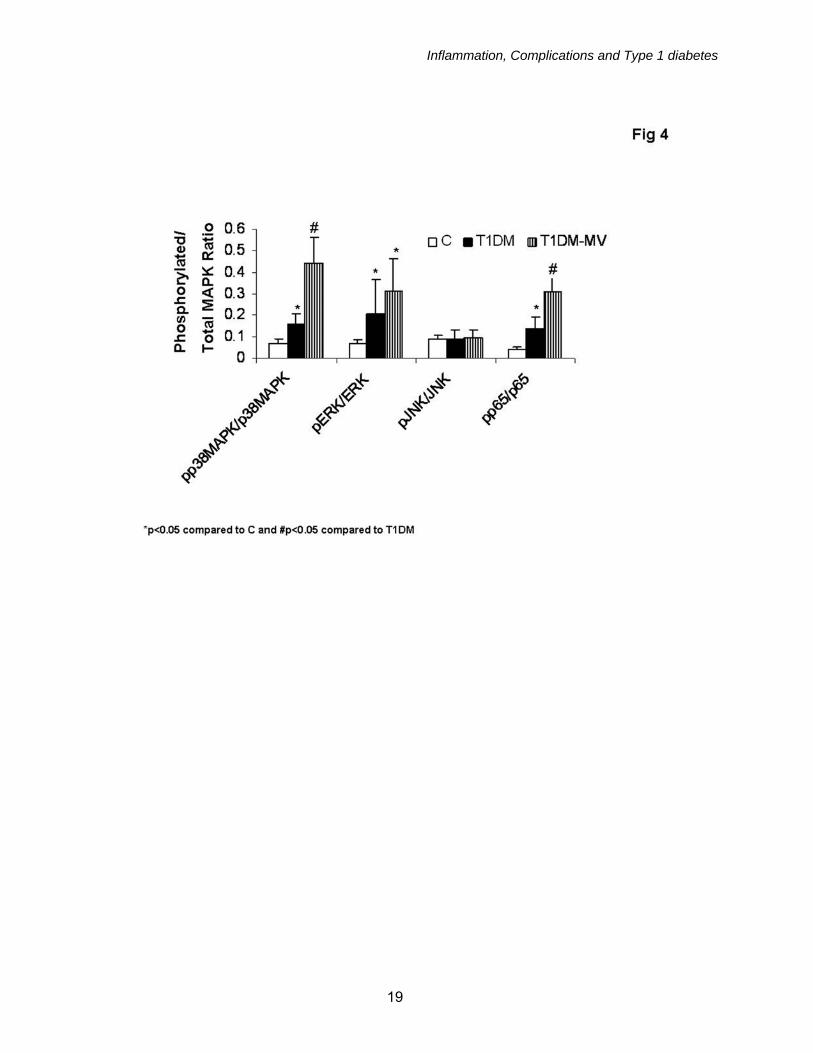
- compared with T1DM and C (Table 3, Fig 3a). Monocytic release of IL-1, IL-6 and TNF-α were significantly increased in T1DM and T1DM-MV compared to C in both the resting (data not shown) and LPS-activated state (Table 3). In addition, monocyte release of IL-1b was significantly increased in T1DM-MV compared to T1DM and C groups ( Fig 3b). Monocyte adhesion to endothelium was also significantly increased in both T1DM and T1DM-MV groups compared to C, with no significant differences between the 2 diabetic groups (Table 3). To gain mechanistic insights into differences observed between biomarkers of inflammation in T1DM, we examined phosphorylation of the MAPK, p38MAPK, pERK and pJNK activities in the lysates of monocytes and NFKb activity in nuclear
extracts of monocytes from C, T1DM and T1DM-MV groups. pERK/ERK ratio, pp38MAPK/p38MAPK and pp65/total p65 ratio were significantly increased in both T1DM and T1DM-MV groups compared to C with no significant differences in JNK activity. Also, pp65 and pp38MAPK activity were significantly increased in T1DM-MV compared to T1DM (Fig 4). Correlation: There was a significant positive association between Severity index as assessed by CAIM and IL-1b levels (r=0.35, p=0.03). Furthermore, increased pp38MAPK and pp65 activity in T1DM-MV was significantly associated with increased IL-1b levels (r=0.36, p=0.04 and r=0.43, p=0.03 respectively). Discussion: Inflammation and oxidative stress are pivotal in atherosclerosis (16). T1DM is associated with increased cardiovascular morbidity and mortality (1). We have previously reported increased hsCRP and monocyte pro-atherogenic activity in T1DM patients with macrovascular complications compared to controls. While macrovascular complications are the major cause of morbidity and mortality in T2DM, in T1DM, the risk associated with microvascular complications is enormous (1). However , there is a paucity of data examining both biomarkers of oxidative stress, inflammation and monocyte function in patients with T1DM with and without microvascular complications compared to age, gender, BMI and race matched controls and testing a non-invasive marker, CAIM. In the present study, we provide novel evidence that T1DM-MV have significantly higher nitrotyrosine levels, CRP and increased monocyte superoxide anion, IL-1b compared to T1DM and controls. Furthermore, we document for the first time that CAIM is an effective, non-invasive biomarker of complications in T1DM. Schalkwijk et al (17) reported elevated CRP levels in T1DM patients without macrovascular disease compared to controls. Furthermore, in accordance with the present
6
Inflammation, Complications and Type 1 diabetes
study, they showed that CRP was higher in T1DM patients with microalbuminuria(18). In the EURODIAB study, levels of CRP, plasma IL-6, TNF and VCAM and E-selectin were significantly higher in T1DM subjects with versus without macrovascular complications (19). Also, Targher et al (20) reported increased CRP levels in T1DM patients without complications, but failed to study T1DM-MV. The Finnish Diabetic Nephropathy study also revealed increased CRP levels in T1DM patients with nephropathy (21). In the present study, we report increased levels of CRP in North American T1DM-MV compared to both T1DM and C. With regard to monocyte cytokines, studies in T1DM patients with duration of diabetes >1year have not yielded consistent results. Kulseng et al (22) have reported increased mononuclear cell TNF secretion in T1DM. Jain et al showed that hyperketonemic T1DM subjects had increased levels of plasma IL-6 (23). It should be emphasized that in all these previous studies examining cytokine release from T1DM, the sample size has been relatively small (n ≤ 20). We also previously reported that monocyte IL-1b levels following activation of monocytes were significantly increased in T1DM compared to C (6). In this study, we go further to demonstrate that there is accentuation of the pro-inflammatory state in T1DM-MV as evidenced by a significant increase in IL-1b levels compared to T1DM and matched controls. This is especially important since increased IL-1b levels have previously been shown to be involved in the rat model to be associated with increased diabetic retinopathy (24). Increasing evidence supports the role of plasma levels of cell adhesion molecules (CAM), sICAM-1, sVCAM-1, E-selectin, as emerging biomarkers of atherosclerosis (25). In T1DM patients, different laboratories demonstrate different results (26-29). We showed previously that sICAM, sE-selectin levels are significantly increased in T1DM without macrovascular complications. In the present study, we further demonstrate
pronounced increases in sVCAM in T1DM-MV compared to T1DM and C. T1DM are prone to increased oxidant stress. A decrease in total free radical trapping capacity of serum has been reported in T1DM as well as increased TBARS and increased serum superoxide levels (30-32). Additionally marked increase in DNA and protein oxidation has been observed in T1DM (33,34). Also, nitrotyrosine, a marker of protein oxidation, has previously been shown to be increased in T2DM compared to controls (35). We have previously reported increased plasma nitrotyrosine levels in T1DM and also that monocytes from T1DM patients exhibit increased superoxide anion levels compared to those of matched controls (6). There is another small report of increased nitrotyrosine levels in T1DM (36), however those without and with microvascular complications were not studied. In the present study, we provide evidence that T1DM-MV have accentuated oxidative stress compared to T1DM and controls as evidenced by significantly increased nitrotyrosine levels and increased monocytic superoxide anion release. In addition, we report a significant association between CAIM severity index and nitrotyrosine levels. It is possible that the increased oxidative stress in T1DM-MV is mediated via the mitochondrial electron transport chain (UCP-1), activation of phagocyte NADPH oxidase or glycoxidation via AGE-receptor interactions and these mechanisms will be explored in future studies. In an attempt to tease out molecular pathways that could explain the increased oxidative stress and inflammation in T1DM-MV compared to T1DM and C, we explored activation of NFKb as well as MAPK. Only p38MAPK and ERK activity were increased in T1DM. While JNK activation appears to be crucial in pancreatic beta cell dysfunction, it does not appear to be activated in monocytes of T1DM patients. Previously, Hoffman et al (37) showed increased NFKb mononuclear activity in T1DM, however those with complications were not assessed. In addition,
7
Inflammation, Complications and Type 1 diabetes
p38MAPK activity is increased in diabetic nephropathy. We have previously shown that high glucose activates monocyte IL-1b via upregulation of p38MAPK and NFKb activity in vitro (38). In addition, Aljada et al (39) have shown that glucose activates mononuclear NFKb activity . In the present study, increased IL-1b levels in T1DM-MV was associated with increased in vivo activity of both p38 MAPK and NFKb. IL-1beta has previously been demonstrated to accelerate apoptosis of retinal capillary cells via activation of NF-kappaB, and the process is exacerbated in high glucose conditions (40). Furthermore, in macrophages isolated from db/db mice, Li et al (41) have shown increased activation of pro-inflammatory cytokines and NFKb transcriptional activation. Our data lend support to the role of increased NFKb activation in T1DM-MV resulting in increased IL-1b levels, which in turn could contribute to increased microvascular complications. Schram et al (19) reported their cross-sectional analyses of the EURODIAB study and showed that a combined inflammatory Z-score (CRP, TNF and IL-6) was associated with retinopathy, albuminuria and cardiovascular disease in their T1DM population. Here we provide novel data that CRP, IL-1b, nitrotyrosine and monocyte superoxide are significantly increased in T1DM-MV compared to C. A non-invasive biomarker of complications, the severity score as assessed by CAIM is significantly increased in T1DM-MV compared to T1DM and C, indicative of significantly increased
microvascular abnormalities in this group. Microvascular abnormalities are associated with and causative of the development of end-stage organ complications in diabetes. The easy, noninvasive accessibility of the conjunctival vessels and the ability to identify and locate the same vessels repeatedly for longitudinal evaluations emphasize the usefulness of this real-time technology in the evaluation of microvascular abnormalities in T1DM. The increased CAIM-SI in T1DM-MV demonstrates the utility of this rapid, non-invasive marker in assessing microvascular abnormalities. Furthermore, this is the first study to report a strong correlation of CAIM with a biomarker of inflammation, IL-1b, that is significantly elevated in T1DM-MV compared to T1DM. In addition, we report a strong association of urinary microalbumin with nitrotyrosine. It is possible that increased systemic and cellular inflammation contribute to increased microvascular complications of T2DM as well, this will be examined in future studies. Future studies will also examine the effect of pharmacological intervention ( such as with low dose statins) on oxidative stress and inflammation in T1DM-MV and examining the defined biomarkers of IL-1b, nitrotyrosine, CRP, monocyte superoxide anion in conjunction with microalbumin:creatinine ratio and CAIM-SI, in an attempt to reverse/retard progression of complications in T1DM. Acknowledgements: Eric Miguelino for assistance with subject recruitment, Jason Rockwood, Danielle Greenfield for technical assistance and NIH DK 69801 and NIH K24 AT 00596.
8
Inflammation, Complications and Type 1 diabetes
References: 1. Libby P, Nathan DM, Abraham K, Brunzell JD, Fradkin JE, Haffner SM, Hsueh W, Rewers M, Roberts BT, Savage PJ, Skarlatos S, Wassef M, Rabadan-Diehl C: National Heart, Lung, and Blood Institute; National Institute of Diabetes and Digestive and Kidney Diseases Working Group on Cardiovascular Complications of Type 1 Diabetes Mellitus. Report of the National Heart, Lung, and Blood Institute-National Institute of Diabetes and Digestive and Kidney Diseases Working Group on Cardiovascular Complications of Type 1 Diabetes Mellitus. Circulation 111:3489-3493, 2005. 2. Libby P. Inflammation in atherosclerosis. Nature 420(6917):868-74, 2002. 3. Devaraj S, Jialal I:Low-density lipoprotein postsecretory modification, monocyte function, and circulating adhesion molecules in type 2 diabetic patients with and without macrovascular complications: the effect of alpha-tocopherol supplementation. Circulation 102:191-196, 2000. 4. Devaraj S, Jialal I: Alpha tocopherol supplementation decreases serum C-reactive protein and monocyte interleukin-6 levels in normal volunteers and type 2 diabetic patients. Free Radic Biol Med 29:790-792, 2000. 5. Cipolletta C, Ryan KE, Hanna EV, Trimble ER:Activation of peripheral blood CD14+ monocytes occurs in diabetes. Diabetes 54:2779-2786, 2005. 6. Devaraj S, Glaser N, Griffen S, Wang-Polagruto J, Miguelino E, Jialal :Increased monocytic activity and biomarkers of inflammation in patients with type 1 diabetes. Diabetes 55(3):774-9, 2006. 7. Cheung AT, Chen PC, Larkin EC, Duong PL, Ramanujam S, Tablin F, Wun T. Microvascular abnormalities in sickle cell disease: a computer-assisted intravital microscopy study. Blood 99(11):3999-4005, 2002. 8. Cheung AT, Price AR, Duong PL, Ramanujam S, Gut J, Larkin EC, Chen PC, Wilson DM. Microvascular abnormalities in pediatric diabetic patients. Microvasc Res 63(3):252-8, 2001. 9. Cheung AT, Perez RV, Chen PC. Improvements in diabetic microangiopathy after successful simultaneous pancreas-kidney transplantation: a computer-assisted intravital microscopy study on the conjunctival microcirculation. Transplantation 68(7):927-32, 1999. 10. Koh KK, Bui MN, Mincemoyer R, Cannon RO 3rd:Effects of hormone therapy on inflammatory cell adhesion molecules in postmenopausal healthy women. Am J Cardiol. 80:1505-1507, 1997. 11. Frohlich M, Muhlberger N, Hanke H, Imhof A, Doring A, Pepys MB, Koenig W: Markers of inflammation in women on different hormone replacement therapies. Ann Med 35:353-361, 2003. 12. Feldman M, Jialal I, Devaraj S, Cryer B: Effects of low-dose aspirin on serum C-reactive protein and thromboxane B2 concentrations: a placebo-controlled study using a highly sensitive C-reactive protein assay. J Am Coll Cardiol 37:2036-2041, 2001. 13. Yaqoob P, Calder PC: N-3 polyunsaturated fatty acids and inflammation in the arterial wall. Eur J Med Res 8:337-354, 2003. 14. Cannon JG, Meydani SN, Fielding RA, Fiatarone MA, Meydani M, Farhangmehr M, Orencole SF, Blumberg JB, Evans WJ: Acute phase response in exercise. II. Associations between vitamin E, cytokines, and muscle proteolysis. Am J Physiol 260:R1235-R1240, 1991. 15. Devaraj S, Venugopal SK, Singh U, Jialal I. Hyperglycemia induces monocytic release of interleukin-6 via induction of protein kinase c-{alpha} and -{beta}. Diabetes 54(1):85-91, 2005. 16. Libby P:Vascular biology of atherosclerosis: overview and state of the art. Am J Cardiol 91:3A-6A, 2003. 17. Schalkwijk CG, Poland DC, van Dijk W, Kok A, Emeis JJ, Drager AM, Doni A, van Hinsbergh VW, Stehouwer CD: Plasma concentration of C-reactive protein is increased in type I
9
Inflammation, Complications and Type 1 diabetes
diabetic patients without clinical macroangiopathy and correlates with markers of endothelial dysfunction: evidence for chronic inflammation. Diabetologia 42(3):351-7, 1999. 18. Schalkwijk CG, Ter Wee PM, Stehouwer CD: Plasma levels of AGE peptides in type 1 diabetic patients are associated with serum creatinine and not with albumin excretion rate: possible role of AGE peptide-associated endothelial dysfunction. Ann N Y Acad Sci 1043:662-670;2005. 19. Schram MT, Chaturvedi N, Schalkwijk C, Giorgino F, Ebeling P, Fuller JH, Stehouwer CD, The Eurodiab Prospective Complications Study Group: Vascular risk factors and markers of endothelial function as determinants of inflammatory markers in Type 1 diabetes. Diabates Care 26(7):2165-2173, 2003. 20. Targher G, Bertolini l, Zoppini G, Zenari l, Falezza G: Increased plasma markers of inflammation and endothelial dysfunction and their association with microvascular complications in Type 1 diabetic patients without clinically manifest macroangiopathy. Diabetic Medicine 22:999-1004, 2005. 21. Saraheimo M, Teppo AM, Forsblom C, Fagerudd J, Groop PH. Diabetic nephropathy is associated with low-grade inflammation in Type 1 diabetic patients. Diabetologia. 46(10):1402-7, 2003. 22. Kulseng B, Skjak-Braek G, Folling I, Espevik T: TNF production from peripheral blood mononuclear cells in diabetic patients after stimulation with alginate and lipopolysaccharide. Scand J Immunol 43:335-340, 1996. 23. Jain SK, Kannan K, Lim G, Matthews-Greer J, McVie R, Bocchini JA Jr: Elevated blood interleukin-6 levels in hyperketonemic type 1 diabetic patients and secretion by acetoacetate-treated cultured U937 monocytes. Diabetes Care 26:2139-2143, 2003. 24. Kowluru RA, Odenbach S. Role of interleukin-1beta in the pathogenesis of diabetic retinopathy. Br J Ophthalmol88(10):1343-7, 2004. 25. Hwang SJ, Ballantyne CM, Sharrett AR, Smith LC, Davis CE, Gotto AM Jr, Boerwinkle E.:Circulating adhesion molecules VCAM-1, ICAM-1, and E-selectin in carotid atherosclerosis and incident coronary heart disease cases: the Atherosclerosis Risk In Communities (ARIC) study. Circulation 96:4219-25, 1997. 26. Fasching P, Veitl M, Rohac M, Streli C, Schneider B, Waldhausl W, Wagner OF: Elevated concentrations of circulating adhesion molecules and their association with microvascular complications in insulin-dependent diabetes mellitus. J Clin Endocrinol Metab 81:4313-7, 1996. 27. Cominacini L, Fratta Pasini A, Garbin U, Davoli A, De Santis A, Campagnola M, Rigoni A, Zenti MG, Moghetti P, Lo Cascio V: Elevated levels of soluble E-selectin in patients with IDDM and NIDDM: relation to metabolic control. Diabetologia 38:1122-1124, 1995. 28. Roep BO, Heidenthal E, de Vries RR, Kolb H, Martin S: Soluble forms of intercellular adhesion molecule-1 in insulin-dependent diabetes mellitus. Lancet 343:1590-1593, 1994. 29. Mysliwiec J, Kretowski A, Kinalski M, Kinalska I. CD11a expression and soluble ICAM-1 levels in peripheral blood in high-risk and overt type 1 diabetes subjects. Immunol Lett. 70:69-72, 1999. 30. Haskins K, Bradley B, Powers K, Fadok V, Flores S, Ling X, Pugazhenthi S, Reusch J, Kench J: Oxidative stress in type 1 diabetes. Ann N Y Acad Sci. 1005:43-54;2003. 31. Laaksonen DE, Atalay M, Niskanen L, Uusitupa M, Hanninen O, Sen CK: Increased resting and exercise-induced oxidative stress in young IDDM men. Diabetes Care 19:569-574, 1996. 32. Arai K, Iizuka S, Tada Y, Oikawa K, Taniguchi N: Increase in the glucosylated form of erythrocyte Cu-Zn-superoxide dismutase in diabetes and close association of the nonenzymatic glucosylation with the enzyme activity. Biochim Biophys Acta. 924:292-296, 1987.
10
Inflammation, Complications and Type 1 diabetes
33. Martin-Gallan P, Carrascosa A, Gussinye M, Dominguez C: Biomarkers of diabetes-associated oxidative stress and antioxidant status in young diabetic patients with or without subclinical complications. Free Radic Biol Med.34:1563-74, 2003. 34. Dandona P, Thusu K, Cook S, Snyder B, Makowski J, Armstrong D, Nicotera T: Oxidative damage to DNA in diabetes mellitus. Lancet. 347:444-5, 1996. 35. Ceriello A, Mercuri F, Quagliaro L, Assaloni R, Motz E, Tonutti L, Taboga C: Detection of nitrotyrosine in the diabetic plasma: evidence of oxidative stress. Diabetologia. 44:834-8, 2001. 36. Hoeldtke RD. Nitrosative stress in early Type 1 diabetes. David H. P. Streeten Memorial Lecture.Clin Auton Res. ;13(6):406-21, 2003. 37. Hofmann MA, Schiekofer S, Isermann B, Kanitz M, Henkels M, Joswig M, Treusch A, Morcos M, Weiss T, Borcea V, Abdel Khalek AK, Amiral J, Tritschler H, Ritz E, Wahl P, Ziegler R, Bierhaus A, Nawroth PP. Peripheral blood mononuclear cells isolated from patients with diabetic nephropathy show increased activation of the oxidative-stress sensitive transcription factor NF-kappaB. Diabetologia.;42(2):222-32, 1999. 38. Dasu MR, Devaraj S, Jialal I. High Glucose induces IL-1 {beta} expression in human monocytes: Mechanistic insights. Am J Physiol Endocrinol Metab. 2007 [Epub ahead of print]. 39. Aljada A, Friedman J, Ghanim H, Mohanty P, Hofmeyer D, Chaudhuri A, Dandona P. Glucose ingestion induces an increase in intranuclear nuclear factor kappaB, a fall in cellular inhibitor kappaB, and an increase in tumor necrosis factor alpha messenger RNA by mononuclear cells in healthy human subjects.Metabolism 55(9):1177-85, 2006. 40. Kowluru RA, Odenbach S. Role of interleukin-1beta in the development of retinopathy in rats: effect of antioxidants. Invest Ophthalmol Vis Sci.;45(11):4161-6, 2004. 41. Li SL, Reddy MA, Cai Q, Meng L, Yuan H, Lanting L, Natarajan R. Enhanced proatherogenic responses in macrophages and vascular smooth muscle cells derived from diabetic db/db mice. Diabetes ;55(9):2611-9, 2006.
11
Inflammation, Complications and Type 1 diabetes
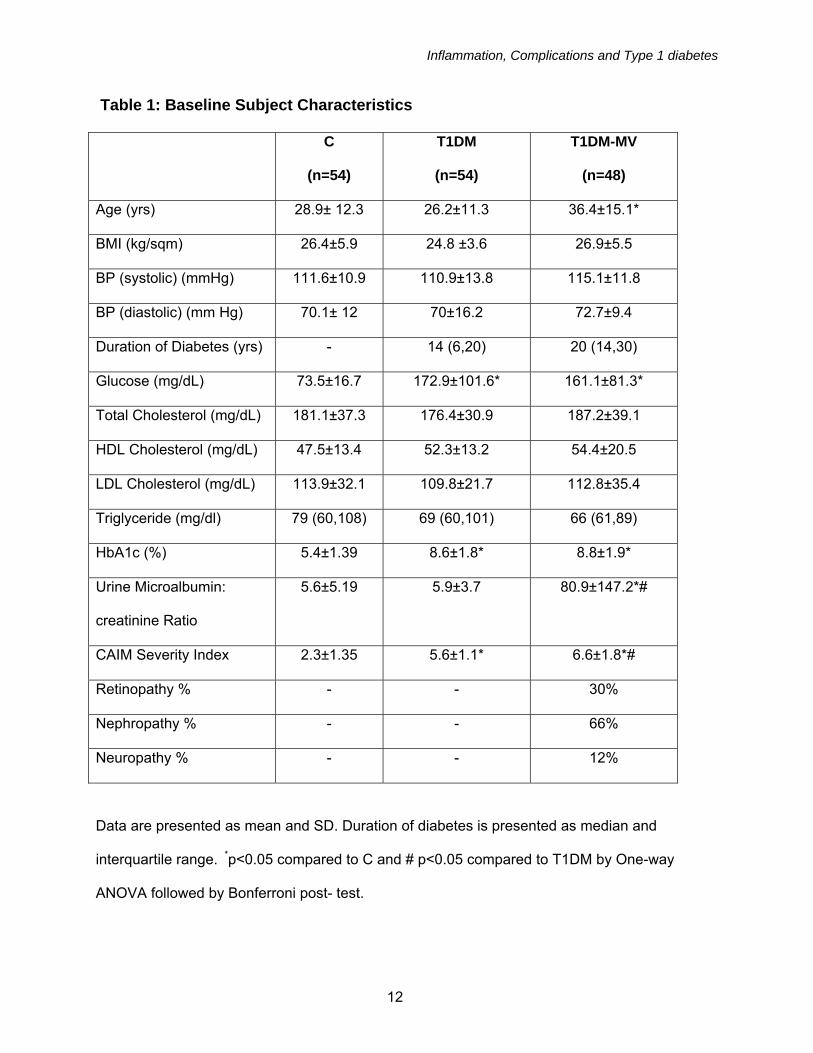
Table 1: Baseline Subject Characteristics
C
(n=54)
T1DM
(n=54)
T1DM-MV
(n=48)
Age (yrs) 28.9± 12.3 26.2±11.3 36.4±15.1*
BMI (kg/sqm) 26.4±5.9 24.8 ±3.6 26.9±5.5
BP (systolic) (mmHg) 111.6±10.9 110.9±13.8 115.1±11.8
BP (diastolic) (mm Hg) 70.1± 12 70±16.2 72.7±9.4
Duration of Diabetes (yrs) - 14 (6,20) 20 (14,30)
Glucose (mg/dL) 73.5±16.7 172.9±101.6* 161.1±81.3*
Total Cholesterol (mg/dL) 181.1±37.3 176.4±30.9 187.2±39.1
HDL Cholesterol (mg/dL) 47.5±13.4 52.3±13.2 54.4±20.5
LDL Cholesterol (mg/dL) 113.9±32.1 109.8±21.7 112.8±35.4
Triglyceride (mg/dl) 79 (60,108) 69 (60,101) 66 (61,89)
HbA1c (%) 5.4±1.39 8.6±1.8* 8.8±1.9*
Urine Microalbumin:
creatinine Ratio
5.6±5.19 5.9±3.7 80.9±147.2*#
CAIM Severity Index 2.3±1.35 5.6±1.1* 6.6±1.8*#
Retinopathy % - - 30%
Nephropathy % - - 66%
Neuropathy % - - 12%
Data are presented as mean and SD. Duration of diabetes is presented as median and
interquartile range. *p<0.05 compared to C and # p<0.05 compared to T1DM by One-way
ANOVA followed by Bonferroni post- test.
12
Inflammation, Complications and Type 1 diabetes
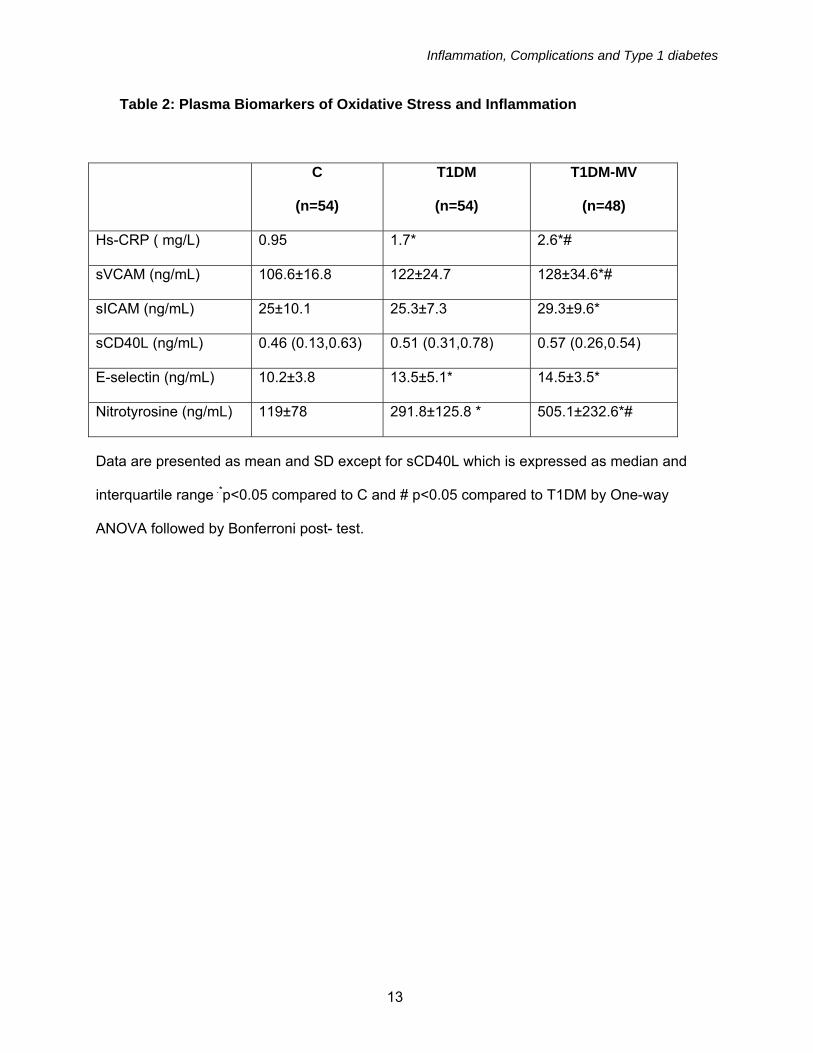
Table 2: Plasma Biomarkers of Oxidative Stress and Inflammation
C
(n=54)
T1DM
(n=54)
T1DM-MV
(n=48)
Hs-CRP ( mg/L) 0.95 1.7* 2.6*#
sVCAM (ng/mL) 106.6±16.8 122±24.7 128±34.6*#
sICAM (ng/mL) 25±10.1 25.3±7.3 29.3±9.6*
sCD40L (ng/mL) 0.46 (0.13,0.63) 0.51 (0.31,0.78) 0.57 (0.26,0.54)
E-selectin (ng/mL) 10.2±3.8 13.5±5.1* 14.5±3.5*
Nitrotyrosine (ng/mL) 119±78 291.8±125.8 * 505.1±232.6*#
Data are presented as mean and SD except for sCD40L which is expressed as median and
interquartile range .*p<0.05 compared to C and # p<0.05 compared to T1DM by One-way
ANOVA followed by Bonferroni post- test.
13
Inflammation, Complications and Type 1 diabetes
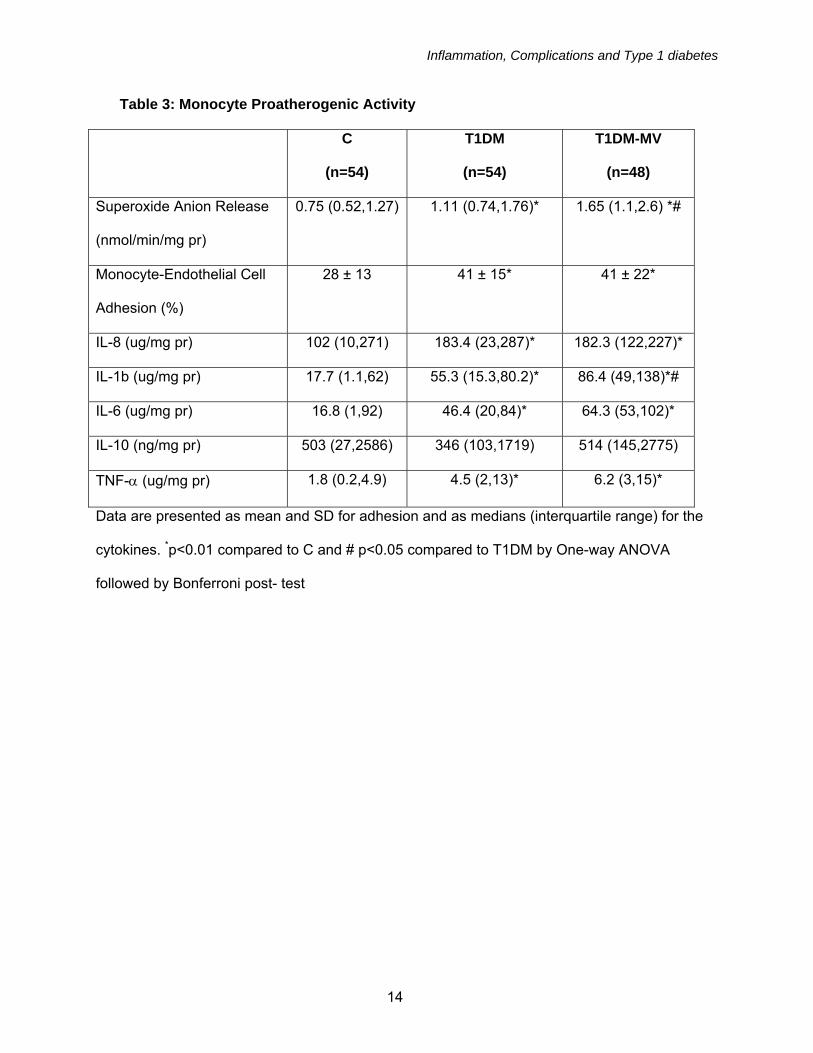
Table 3: Monocyte Proatherogenic Activity
C
(n=54)
T1DM
(n=54)
T1DM-MV
(n=48)
Superoxide Anion Release
(nmol/min/mg pr)
0.75 (0.52,1.27) 1.11 (0.74,1.76)* 1.65 (1.1,2.6) *#
Monocyte-Endothelial Cell
Adhesion (%)
28 ± 13 41 ± 15* 41 ± 22*
IL-8 (ug/mg pr) 102 (10,271) 183.4 (23,287)* 182.3 (122,227)*
IL-1b (ug/mg pr) 17.7 (1.1,62) 55.3 (15.3,80.2)* 86.4 (49,138)*#
IL-6 (ug/mg pr) 16.8 (1,92) 46.4 (20,84)* 64.3 (53,102)*
IL-10 (ng/mg pr) 503 (27,2586) 346 (103,1719) 514 (145,2775)
TNF-α (ug/mg pr) 1.8 (0.2,4.9) 4.5 (2,13)* 6.2 (3,15)*
Data are presented as mean and SD for adhesion and as medians (interquartile range) for the
cytokines. *p<0.01 compared to C and # p<0.05 compared to T1DM by One-way ANOVA
followed by Bonferroni post- test
14

Inflammation, Complications and Type 1 diabetes
Figure Legends: Figure 1: Increased Microvascular Abnormalities in T1DM-MV compared to T1DM and C: Severity Index was computed from computer asssisted intravital microscopy (CAIM) measurements of the bulbar conjunctiva from C, T1DM and T1DM-MV as described in Methods. *p<0.001 by one way ANOVA compared to C and #p<0.05 compared to T1DM. Figure 2: Nitrotyrosine Levels in C, T1DM and T-DM-MV: Levels of plasma nitrotyrosine were assessed in T1DM-MV, T1DM patients and matched controls as decribed in Methods, *p<0.001 by one way ANOVA compared to C and #p<0.05 compared to T1DM. Figure 3: Monocyte Proatherogenic Activity in T1DM-MV compared to T1DM and C: Monocytes were isolated from fasting heparinized blood and superoxide anion release (Fig 3a) interleukin-1b release (Fig 3b) was measured in LPS-activated monocytes from C, T1DM and T1DM-MV as described in Methods. *p<0.01 by one way ANOVA compared to C and #p<0.05 compared to T1DM. Figure 4: Activation of MAPK in Monocytes of T1DM: Monocyte lysates were prepared and activity of phospho to total p38MAPK, ERK and JNK were measured in C, T1DM and T1DM-MV as described in Methods. Also, nuclear extracts of monocytes from these 3 groups were prepared and pp65 activity to total p65 was assessed as decribed in Methods. *p<0.01 by one way ANOVA compared to C and #p<0.05 compared to T1DM.
15
Inflammation, Complications and Type 1 diabetes
16

Inflammation, Complications and Type 1 diabetes
17
Inflammation, Complications and Type 1 diabetes
18
Inflammation, Complications and Type 1 diabetes
19
Copyright © 2022 FDOKUMEN