Evidence for thyroid endocrine disruption in wild fish in San Francisco Bay, California, USA....
13
Aquatic Toxicology 96 (2010) 203–215 Contents lists available at ScienceDirect Aquatic Toxicology journal homepage: www.elsevier.com/locate/aquatox Evidence for thyroid endocrine disruption in wild fish in San Francisco Bay, California, USA. Relationships to contaminant exposures Navdeep K. Brar a , Claire Waggoner a , Jesus A. Reyes b , Russell Fairey c , Kevin M. Kelley a,∗ a Environmental Endocrinology Laboratory, Department of Biological Sciences, California State University, Long Beach, Long Beach, CA 90840, USA b Pacific Coast Environmental Conservancy, Taft, CA 93268, USA c Marine Pollution Studies Laboratory, Moss Landing Marine Laboratories, Moss Landing, CA 95039, USA article info Article history: Received 8 July 2009 Received in revised form 2 October 2009 Accepted 28 October 2009 Keywords: Thyroid Endocrine disruption Thyroxine Aquatic contaminant Fish PCB abstract It is well documented that many coastal and estuarine environments adjacent to developed and industri- alized urban centers, such as the San Francisco Bay Area, are significantly contaminated by anthropogenic chemicals. However, it is not well understood to what extent existing contaminants, many with con- tinuing inflows into the environment, may impact exposed wildlife. This study provided an initial characterization of thyroid endocrine-related effects and their relationship to accumulated contami- nants in two indigenous fish species sampled from different San Franicsco Bay Area study sites. Plasma concentrations of thyroxine (T4) were significantly reduced in fish sampled from highly impacted loca- tions such as Oakland Inner Harbor and San Leandro Bay as compared with fish from other locations representing relatively lower human impact, including Bodega Bay, Redwood City and a remote site on Santa Catalina Island. Triiodothyronine (T3) levels also varied significantly by location, with differ- ing T3/T4 ratios in fish from some locations suggestive of altered peripheral deiodinase activity. The changes in thyroid endocrine parameters were significantly correlated with hepatic concentrations of certain environmental contaminants. A large number of polychlorinated biphenyl (PCB) congeners, both co-planar (dioxin-like) and non-co-planar, exhibited significant inverse correlations with T4 levels in the fish, while in contrast, T3 and T3/T4 ratio were positively correlated with PCB exposures. The pos- itive correlation between T3/T4 ratio and PCBs supports the hypothesis that environmental PCBs may alter T4 deiodination or turnover, actions of PCBs reported in laboratory experiments. Some relation- ships between chlorinated pesticides including DDT and chlordanes, but fewer relationships with PAHs, were also observed. Together, these findings indicate that the thyroid endocrine system is exhibiting alterations associated with different aquatic environments in the San Francisco Bay Area, which are significantly related to current-day exposures of the fish to contaminant chemicals such as PCBs. © 2009 Elsevier B.V. All rights reserved. 1. Introduction In aquatic environments adjacent to large urban centers, such as in the San Francisco Bay Area, a wide variety of chemical contami- nants are typically present, yet their phenotypic effects in resident fish and other wildlife are not well understood. Selected chemicals which can be present in such environments may have thyroid- disrupting effects in fish, as indicated from laboratory experiments. Since thyroid hormones have critical roles in development and physiological homeostasis, disruption of the thyroid system can present a threat to health in wild fish populations. However, studies are lacking that evaluate, within a real ecosystem, the connections ∗ Corresponding author. Tel.: +1 562 985 4294; fax: +1 562 985 8878. E-mail address: [email protected] (K.M. Kelley). URL: http://www.csulb.edu/depts/endo (K.M. Kelley). between altered endocrine phenotype and environmental contam- inant exposures. Thyroid hormones are produced upon activation of the neu- roendocrine hypothalamo-pituitary-thyroid (HPT) axis (reviews by Eales, 2006; Blanton and Specker, 2007; Zoeller et al., 2007). Under hypothalamic control, the pituitary secretes thyroid-stimulating hormone (TSH) which proceeds to the thyroid gland to activate synthesis of thyroxine (T4; 3,5,3 ,5 -tetraiodo-l-thyronine) and triiodothyronine (T3; 3,5,3 -triiodo-l-thyroinine). T4 generally rep- resents >95% of the thyroid hormone output and it is typically present in higher quantities than T3 in the blood circulation, with the higher T4 concentrations serving as a pool of prohormone that can be converted into T3 by 5 -iodothyronine deiodinases in tar- get tissues (Eales, 2006; Zoeller et al., 2007). Thyroid hormones are essential for early development in fishes, including larval–juvenile transitions and induction of metamorphosis in flatfish (Inui et al., 1995; Power et al., 2001; Yamano, 2005; Shiao and Wang, 2006; 0166-445X/$ – see front matter © 2009 Elsevier B.V. All rights reserved. doi:10.1016/j.aquatox.2009.10.023
-
Upload
independent -
Category
Documents
-
view
0 -
download
0
Transcript of Evidence for thyroid endocrine disruption in wild fish in San Francisco Bay, California, USA....
EC
Na
b
c
a
ARRA
KTETAFP
1
infiwdSppa
0d
Aquatic Toxicology 96 (2010) 203–215
Contents lists available at ScienceDirect
Aquatic Toxicology
journa l homepage: www.e lsev ier .com/ locate /aquatox
vidence for thyroid endocrine disruption in wild fish in San Francisco Bay,alifornia, USA. Relationships to contaminant exposures
avdeep K. Brara, Claire Waggonera, Jesus A. Reyesb, Russell Faireyc, Kevin M. Kelleya,∗
Environmental Endocrinology Laboratory, Department of Biological Sciences, California State University, Long Beach, Long Beach, CA 90840, USAPacific Coast Environmental Conservancy, Taft, CA 93268, USAMarine Pollution Studies Laboratory, Moss Landing Marine Laboratories, Moss Landing, CA 95039, USA
r t i c l e i n f o
rticle history:eceived 8 July 2009eceived in revised form 2 October 2009ccepted 28 October 2009
eywords:hyroidndocrine disruptionhyroxinequatic contaminantishCB
a b s t r a c t
It is well documented that many coastal and estuarine environments adjacent to developed and industri-alized urban centers, such as the San Francisco Bay Area, are significantly contaminated by anthropogenicchemicals. However, it is not well understood to what extent existing contaminants, many with con-tinuing inflows into the environment, may impact exposed wildlife. This study provided an initialcharacterization of thyroid endocrine-related effects and their relationship to accumulated contami-nants in two indigenous fish species sampled from different San Franicsco Bay Area study sites. Plasmaconcentrations of thyroxine (T4) were significantly reduced in fish sampled from highly impacted loca-tions such as Oakland Inner Harbor and San Leandro Bay as compared with fish from other locationsrepresenting relatively lower human impact, including Bodega Bay, Redwood City and a remote siteon Santa Catalina Island. Triiodothyronine (T3) levels also varied significantly by location, with differ-ing T3/T4 ratios in fish from some locations suggestive of altered peripheral deiodinase activity. Thechanges in thyroid endocrine parameters were significantly correlated with hepatic concentrations ofcertain environmental contaminants. A large number of polychlorinated biphenyl (PCB) congeners, bothco-planar (dioxin-like) and non-co-planar, exhibited significant inverse correlations with T4 levels in
the fish, while in contrast, T3 and T3/T4 ratio were positively correlated with PCB exposures. The pos-itive correlation between T3/T4 ratio and PCBs supports the hypothesis that environmental PCBs mayalter T4 deiodination or turnover, actions of PCBs reported in laboratory experiments. Some relation-ships between chlorinated pesticides including DDT and chlordanes, but fewer relationships with PAHs,were also observed. Together, these findings indicate that the thyroid endocrine system is exhibitingalterations associated with different aquatic environments in the San Francisco Bay Area, which arerrent
significantly related to cu. Introduction
In aquatic environments adjacent to large urban centers, such asn the San Francisco Bay Area, a wide variety of chemical contami-ants are typically present, yet their phenotypic effects in residentsh and other wildlife are not well understood. Selected chemicalshich can be present in such environments may have thyroid-isrupting effects in fish, as indicated from laboratory experiments.
ince thyroid hormones have critical roles in development andhysiological homeostasis, disruption of the thyroid system canresent a threat to health in wild fish populations. However, studiesre lacking that evaluate, within a real ecosystem, the connections∗ Corresponding author. Tel.: +1 562 985 4294; fax: +1 562 985 8878.E-mail address: [email protected] (K.M. Kelley).URL: http://www.csulb.edu/depts/endo (K.M. Kelley).
166-445X/$ – see front matter © 2009 Elsevier B.V. All rights reserved.oi:10.1016/j.aquatox.2009.10.023
-day exposures of the fish to contaminant chemicals such as PCBs.© 2009 Elsevier B.V. All rights reserved.
between altered endocrine phenotype and environmental contam-inant exposures.
Thyroid hormones are produced upon activation of the neu-roendocrine hypothalamo-pituitary-thyroid (HPT) axis (reviews byEales, 2006; Blanton and Specker, 2007; Zoeller et al., 2007). Underhypothalamic control, the pituitary secretes thyroid-stimulatinghormone (TSH) which proceeds to the thyroid gland to activatesynthesis of thyroxine (T4; 3,5,3′,5′-tetraiodo-l-thyronine) andtriiodothyronine (T3; 3,5,3′-triiodo-l-thyroinine). T4 generally rep-resents >95% of the thyroid hormone output and it is typicallypresent in higher quantities than T3 in the blood circulation, withthe higher T4 concentrations serving as a pool of prohormone that
′
can be converted into T3 by 5 -iodothyronine deiodinases in tar-get tissues (Eales, 2006; Zoeller et al., 2007). Thyroid hormones areessential for early development in fishes, including larval–juveniletransitions and induction of metamorphosis in flatfish (Inui et al.,1995; Power et al., 2001; Yamano, 2005; Shiao and Wang, 2006;
2 Toxico
Baq1fetP
aceosoeS(cawaStw
oWm( tm)C3(p(wCp
cpMacccaba2st(wi52Itp2fes
a
04 N.K. Brar et al. / Aquatic
lanton and Specker, 2007; Klaren et al., 2008). Thyroid hormonesre also deposited into the yolk of fish eggs, and used during subse-uent embryonic development (Kobuke et al., 1987; Leatherland,989). In juvenile and adult life, they are necessary (permissive)or normal somatic growth and have a number of effects on growthndocrine genes, such as pituitary growth hormone (GH), GH recep-ors, and insulin-like growth factor-I (IGF-I; Power et al., 2001;lohman et al., 2002; Schmid et al., 2003).
Given the multi-component neuroendocrine HPT axis, therere a large number of potential target genes or proteins thatan be altered by endocrine-disrupting chemicals (EDCs). Suchffects may range from agonistic to antagonistic actions of EDCsn target tissue receptors, to alterations in thyroid hormoneynthetic pathways, deiodinase functions in peripheral tissues,r carrying proteins in the blood (Brown et al., 2004a; Boast al., 2006; LeRoy et al., 2006; Zoeller, 2007; Crofton, 2008;oldin et al., 2008). Polychlorinated biphenyls (PCBs), dioxin2,3,7,8-tetrachlorodibenzo-p-dioxin; TCDD), chlorinated pesti-ides, polybrominated diphenyl ethers (PBDEs), and metals suchs mercury, have all been implicated as thyroid-disruptive agentshen tested experimentally in fish (Adams et al., 2000; Brown et
l., 2004a,b; Boas et al., 2006; Kahn et al., 2002; LeRoy et al., 2006;oldin et al., 2008). However, current knowledge is limited mostlyo laboratory testing of a small subset of chemicals that are foundithin human-impacted environments.
The San Francisco Bay appears on the “Section 303(d) list”f impaired water bodies, as required by the federal Cleanater Act. The California State Water Board compiled theost recent 303(d) list in 2006, approved by the US EPA in 2007
http://www.waterboards.ca.gov/sanfranciscobay/TMDL/303dlist.hontaminants in San Francisco Bay and its major tributaries on this03(d) list include polyaromatic hydrocarbons (PAHs), pesticidesdieldrin, chlordanes, and DDTs), additional chlorinated com-ounds such as PCBs, TCDD, furan compounds, and trace elementsHg and Se). Total maximum daily loads (TMDLs), required ofater bodies on the 303(d) list, have been developed for PCBs, Hg,u and Ni (adopted in 2008) or are currently in development (foresticides, TCDD, others).
Contaminants such as PCBs and pesticides accumulate to highoncentrations at the top of the food web and therefore mayose a health risk to piscivorous and other wildlife. The Regionalonitoring Program for Water Quality in the San Francisco Estu-
ry (RMP; http://www.sfei.org/rmp) has monitored contaminantoncentrations in sport fish every three years since 1997. Dataollected by the RMP series and in other studies indicate thatontaminant concentrations in the San Francisco Bay ecosystemre sufficiently elevated to cause concern for adverse effects oniota (Fairey et al., 1997; Davis et al., 2004, 2007; Greenfield etl., 2005; Oros et al., 2005, 2007; San Francisco Estuary Institute,008). In the 2003 and 2006 RMP fish contamination surveys,everal fish species were demonstrated to have tissue concentra-ions of total PCBs (sum of congeners) of 100–200 ng/g wet weightww) or higher, as compared with a screening value of 10 ng/gw (PCB TMDL of the San Francisco Bay Regional Water Qual-
ty Control Board). Given sediment PCB concentrations between.7 and 8.7 ppb in recent years (San Francisco Estuary Institute,008), substantial bioaccumulation into fish tissues is indicated.
n addition to PCBs, several other contaminants are present in fishissues at concentrations above thresholds of concern, includingesticides, Hg, dioxin, and PBDEs (Fairey et al., 1997; Davis et al.,004; Greenfield et al., 2005; Oros et al., 2005, 2007). The potential
or endocrine disruptive effects and other phenotypic/physiologicalffects due to exposure to these contaminants are not well under-tood.In California and elsewhere, water quality objectives and man-gement of coastal and estuarine environments have been based
logy 96 (2010) 203–215
.
largely upon contaminant concentrations, with little additionalinformation on biological effects in resident wildlife. This studytherefore pursued establishing linkages between contaminantexposures and effects in a critical endocrine system, as a first steptoward understanding phenotypic impacts of existing contami-nants. We evaluated the hypothesis that current-day exposuresto environmental contaminants in San Francisco Bay Area aquatichabitats can be related to indices of thyroid endocrine status in res-ident wild fish. In addition, it was of interest to determine whetherdifferences in thyroid status could be differentiated among studysites that represented differing signatures of contaminant chemi-cals.
2. Materials and methods
2.1. Study fish
The target fish species included shiner surfperch (Cymatogasteraggregata) and Pacific staghorn sculpin (Leptocottus armatus), bothindigenous to San Francisco Bay. The shiner surfperch has receivedcontinuing monitoring for tissue contaminant levels by the RMPsince 1997 (http://www.SFEI.org/rmp). Pacific staghorn sculpinis typically captured at the same locations as the surfperch andexhibits strong site fidelity during its first year, remaining mostlyalong the Bay margins and in association with bottom sediments(Jones, 1962). Sculpin feed on sediment invertebrates includingpolychaetes, mollusks, and amphipods (Jones, 1962; Fitch andLavenberg, 1975) and accumulate environmental contaminantssuch as PCBs, DDTs and Hg (Davis et al., 2004). Because of thesecharacteristics, young-of-the-year sculpin were chosen as an addi-tional potential biosentinel species.
2.2. Fish sampling locations and sample collection
In conjunction with field efforts in August 2006 for the RMPfish contamination studies (http://www.sfei.org/rmp; Hunt et al.,2008), a subset of the captured surfperch and sculpin were madeavailable for tissue sampling for use in a pilot study. WithinSan Francisco Bay, fish were collected from the following loca-tions (latitude and longitude values in parentheses): RedwoodCity (RED; 37.51, −122.20); San Pablo Bay (SPB; 37.96, −122.47),Berkeley waterfront (BER; 37.89, −122.32), and Oakland InnerHarbor (OAK; 37.78, −122.25) (Fig. 1). Tomales Bay (TOB; 38.14,−122.87) was chosen as a potential far-field reference loca-tion.
Based upon the results of the 2006 pilot, in which significantdifferences in endocrine status in both species were observedbetween study sites (described in Section 3), a second, expandedstudy was carried out in August 2007 using the same and addi-tional study locations (Fig. 1). In addition to RED, SPB, OAK, andTOB, fish were also caught and sampled from Richmond Harbor(RCH; 37.91, −122.35), Richmond Lauritzen Channel (RLC; 37.92,−122.36), San Leandro Bay (SLB; 37.74, −122.21), San Franciscowaterfront (SFW; 37.77, −122.38), and San Francisco’s Hunter’sPoint (HPT; 37.72, −122.36). These additional sites were chosen onthe basis of their expected different signatures of environmentalchemicals. RLC is an EPA superfund site characterized by DDTcontamination derived from former pesticide formulation busi-nesses (http://www.epa.gov/region09/superfund/index.html);RCH serves as a nearby site but which is more proximal
to the central SF Bay waters and also has a large urbanmarina. SLB (Daum et al., 2000) and HPT (EPA superfund site;http://www.epa.gov/region09/superfund/index.html) exhibitelevated environmental PCB levels. In addition to the above siteswithin San Francisco Bay, fish were also collected at far-field sites
N.K. Brar et al. / Aquatic Toxico
Fig. 1. San Francisco Bay Area study locations. RED = Redwood City; HPT = Hunter’sPoint in San Francisco; SFW = San Francisco waterfront; SPB = San Pablo Bay;RCH = Richmond Harbor; RLC = Richmond Lauritzen Channel; BER = Berkeley water-fTCL
iaI
2
cslou0nriuwIssp2
2
idTtup
ront; OAK = Oakland Inner Harbor; SLB = San Leandro Bay; BDB = Bodega Bay;OB = Tomales Bay. In addition, a far-field site on the Pacific Ocean side of Santaatalina Island (not in map) was used to sample a population of shiner surfperch.atitudes and longitudes for each site are provided (Section 2).
ncluding TOB (as above), Bodega Bay (BDB; 38.32, −123.05), andt a remote location on the Pacific Ocean side of Santa Catalinasland (CAT; 33.38, −118.47).
.3. Field methods
Fish were captured using an otter trawl pulled behind a smallraft. Blood was collected from the caudal vein using a heparinizedyringe with a 22 g needle, centrifuged for 3 min at 3000 rpm to pel-et the cells, and plasma was removed. Plasma samples were frozenn dry ice until transport to the laboratory and then stored at −80 ◦Cntil hormone assays (described below). Standard body lengths (to.1 cm) were measured for each individual; body weights couldot be measured due to equipment failure in the field. Livers wereemoved whole, placed into clean foil envelopes, frozen on dryce until transport to the laboratory, and then stored at −80 ◦Cntil chemical analysis (described below). Sex of individual fishas assigned based upon gross anatomy of the internal gonads.
n both years, 9–25 surfperch and 9–23 sculpin were captured andampled per study location, with the following exceptions: TOB (0urfperch and 5 sculpin in 2006; 6 sculpin in 2007), BDB (2 surf-erch in 2007), HPT (0 surfperch in 2007), and CAT (0 sculpin in007).
.4. Plasma hormone analyses
T4 and T3 concentrations in plasma were measured by enzymemmunoassay (EIA) using reagents from Immunometrics, Ltd. (Lon-
on, UK) and Fisher Scientific (Tustin, CA). Standard curves for4 or T3 (concentrations between 5 and 250 ng/ml) were usedo calculate ng/ml concentrations from the unknown samplessing SigmaPlot 8.0 software (SYSTAT Software Inc.). EIAs werereviously validated for the fish plasma and exhibit intra-assaylogy 96 (2010) 203–215 205
and inter-assay coefficients of variation of 2.9% and 4.1%, respec-tively (Brar, 2009). In addition to individual ng/ml values for T4and T3, ratios of T3/T4 concentrations were calculated for eachindividual as an indicator of peripheral conversion of T4 to T3 (5′-deiodination).
2.5. Hepatic tissue extractions and chemical analyses
Livers were measured for PCBs, pesticides, and PAHsusing EPA method 8270Cm (http://www.crgmarinelabs.com,http://www.IIRMES.org). Liver samples were weighed to thenearest 0.1 g wet weight, and extracted for organic constituentsusing a pressurized fluid microwave extraction method. Sampleswere added to 25 ml methylene chloride:acetone (3:1) at 25 ◦C ina solvent-rinsed Teflon pressurized extraction vessel, placed intoa microwave carousel apparatus (CEM Corporation; Matthews,NC), heated to 100 ◦C for 15 min, and then held at 100 ◦C for anadditional 15 min during carousel rotation. After cooling to 25 ◦C,the solvent was decanted into collection flasks over sodium sulfateto separate any water from the extract. The extraction process wasrepeated for a total of 3 extractions. Extracts were then evaporatedto less than 1 ml using a Rotavapor® apparatus (Büchi LaboratoryEquipment, Inc., Flawil, Switzerland), 4 ml n-hexane added, andevaporated again to 500 �l to eliminate any residual methylenechloride and acetone. This was followed by column cleaning ofthe extract, with the eluate subsequently evaporated to 1 ml andtransferred into a 2 ml GC/MS vial.
Contaminant concentrations in each sample were then mea-sured by gas chromatography/mass spectrometry (GC/MS) usingan Agilent 6890N GC system with a DB-5 60 m gas chromatogra-phy column coupled to an Agilent 5973 Mass Selective Detector(Agilent Technologies, Santa Clara, CA). Liver tissue extractionsand GC/MS methods were subjected to QA/QC procedures accord-ing to EPA guidelines. Accuracy of GC/MS data was assessed byadditional analyses of matrix spikes, surrogate spikes, certifiedreference materials, positive controls, and/or laboratory controlmaterials on a minimum frequency of 1 per batch, with the typ-ical batch size consisting of 10–15 samples. Recovery surrogateswere spiked into every extraction vessel prior to solvent addi-tion. We required that 95% of the target compounds greater than10 times the minimum detectable limit (MDL) be within thespecified acceptance limits (relative percent difference of 0–30%).The acceptance ranges were determined from a minimum detec-tion limit (MDL) study. Concentrations for each compound werecalculated as ng compound per gram wet weight (ng/g ww).Values for total PCBs, total DDTs, total chlordanes, and totalPAHs were also calculated, by adding together the concentrationsof all individual detected congeners. A total of fifty fish wereselected for hepatic contaminant analyses, as described in Section3.
2.6. Statistical analyses
Hormone parameters included ng/ml T4 and T3 concentrationsand T3/T4 ratio; hepatic chemical concentrations were expressedin ng/g ww. All statistical tests and graphical representationswere carried out using SigmaStat version 3.5 and SigmaPlot 8.0software (SYSTAT, Inc., Chicago, IL). Mean ± SE values for the dif-ferent parameters were calculated for each study location andanalyzed using one-way analysis of variance (ANOVA) followedby ad hoc multiple comparisons tests. For the hormone parame-
ters, values were first log transformed, followed by ANOVA andthe Holm–Sidek ad hoc test. Relationships between parameters(e.g., hormone concentration vs. hepatic contaminant concentra-tion) were evaluated using Pearson’s correlation analysis to obtaincorrelation coefficients (R). In all statistical analyses, differences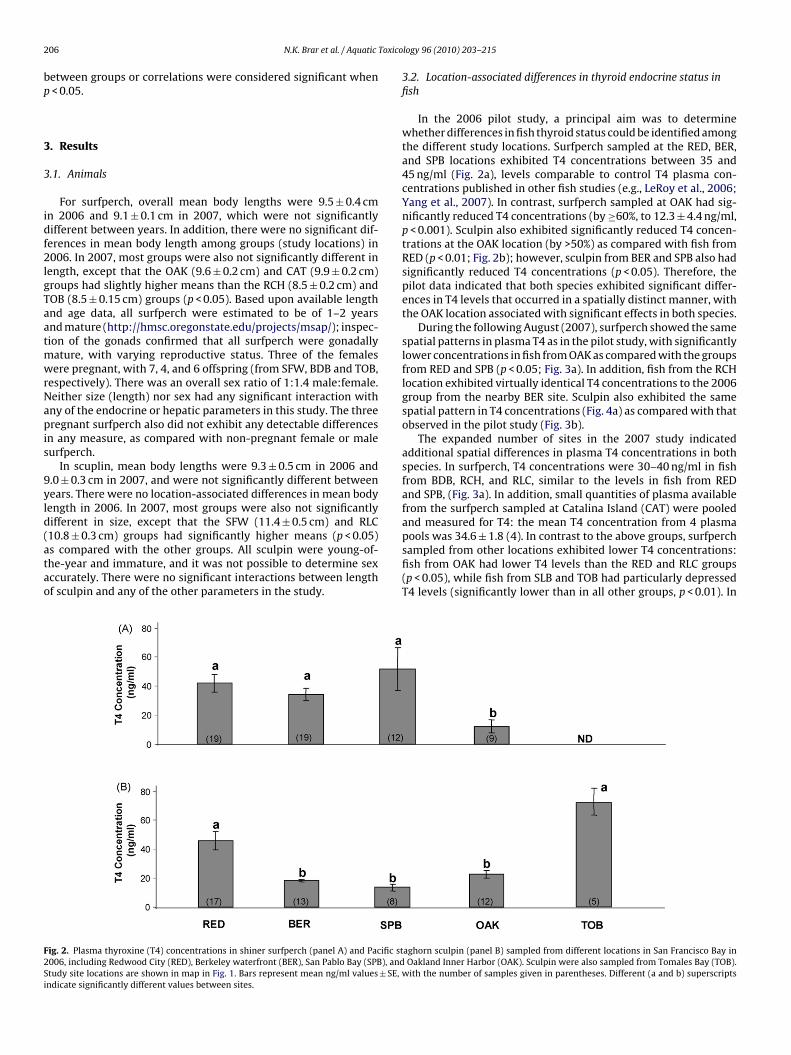
2 Toxico
bp
3
3
idf2lgTaatmwrNapis
9yld(atao
F2Si
06 N.K. Brar et al. / Aquatic
etween groups or correlations were considered significant when< 0.05.
. Results
.1. Animals
For surfperch, overall mean body lengths were 9.5 ± 0.4 cmn 2006 and 9.1 ± 0.1 cm in 2007, which were not significantlyifferent between years. In addition, there were no significant dif-erences in mean body length among groups (study locations) in006. In 2007, most groups were also not significantly different in
ength, except that the OAK (9.6 ± 0.2 cm) and CAT (9.9 ± 0.2 cm)roups had slightly higher means than the RCH (8.5 ± 0.2 cm) andOB (8.5 ± 0.15 cm) groups (p < 0.05). Based upon available lengthnd age data, all surfperch were estimated to be of 1–2 yearsnd mature (http://hmsc.oregonstate.edu/projects/msap/); inspec-ion of the gonads confirmed that all surfperch were gonadally
ature, with varying reproductive status. Three of the femalesere pregnant, with 7, 4, and 6 offspring (from SFW, BDB and TOB,
espectively). There was an overall sex ratio of 1:1.4 male:female.either size (length) nor sex had any significant interaction withny of the endocrine or hepatic parameters in this study. The threeregnant surfperch also did not exhibit any detectable differences
n any measure, as compared with non-pregnant female or maleurfperch.
In scuplin, mean body lengths were 9.3 ± 0.5 cm in 2006 and.0 ± 0.3 cm in 2007, and were not significantly different betweenears. There were no location-associated differences in mean bodyength in 2006. In 2007, most groups were also not significantlyifferent in size, except that the SFW (11.4 ± 0.5 cm) and RLC
10.8 ± 0.3 cm) groups had significantly higher means (p < 0.05)s compared with the other groups. All sculpin were young-of-he-year and immature, and it was not possible to determine sexccurately. There were no significant interactions between lengthf sculpin and any of the other parameters in the study.ig. 2. Plasma thyroxine (T4) concentrations in shiner surfperch (panel A) and Pacific st006, including Redwood City (RED), Berkeley waterfront (BER), San Pablo Bay (SPB), andtudy site locations are shown in map in Fig. 1. Bars represent mean ng/ml values ± SE,ndicate significantly different values between sites.
logy 96 (2010) 203–215
3.2. Location-associated differences in thyroid endocrine status infish
In the 2006 pilot study, a principal aim was to determinewhether differences in fish thyroid status could be identified amongthe different study locations. Surfperch sampled at the RED, BER,and SPB locations exhibited T4 concentrations between 35 and45 ng/ml (Fig. 2a), levels comparable to control T4 plasma con-centrations published in other fish studies (e.g., LeRoy et al., 2006;Yang et al., 2007). In contrast, surfperch sampled at OAK had sig-nificantly reduced T4 concentrations (by ≥60%, to 12.3 ± 4.4 ng/ml,p < 0.001). Sculpin also exhibited significantly reduced T4 concen-trations at the OAK location (by >50%) as compared with fish fromRED (p < 0.01; Fig. 2b); however, sculpin from BER and SPB also hadsignificantly reduced T4 concentrations (p < 0.05). Therefore, thepilot data indicated that both species exhibited significant differ-ences in T4 levels that occurred in a spatially distinct manner, withthe OAK location associated with significant effects in both species.
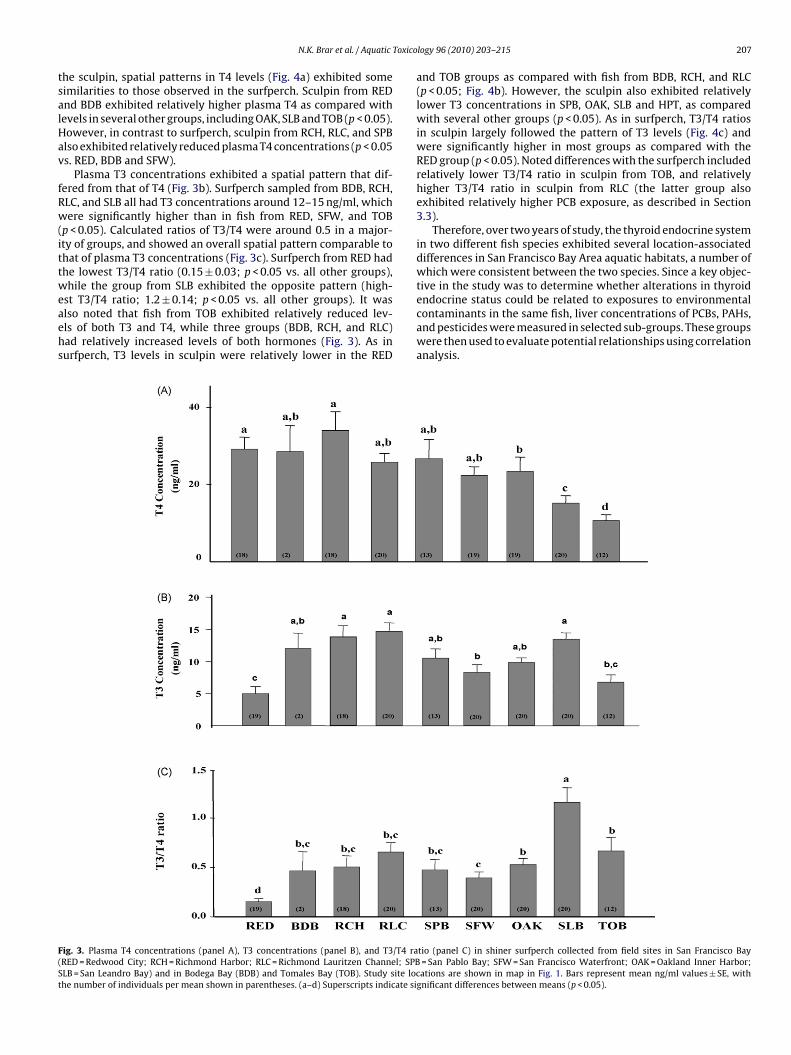
During the following August (2007), surfperch showed the samespatial patterns in plasma T4 as in the pilot study, with significantlylower concentrations in fish from OAK as compared with the groupsfrom RED and SPB (p < 0.05; Fig. 3a). In addition, fish from the RCHlocation exhibited virtually identical T4 concentrations to the 2006group from the nearby BER site. Sculpin also exhibited the samespatial pattern in T4 concentrations (Fig. 4a) as compared with thatobserved in the pilot study (Fig. 3b).
The expanded number of sites in the 2007 study indicatedadditional spatial differences in plasma T4 concentrations in bothspecies. In surfperch, T4 concentrations were 30–40 ng/ml in fishfrom BDB, RCH, and RLC, similar to the levels in fish from REDand SPB, (Fig. 3a). In addition, small quantities of plasma availablefrom the surfperch sampled at Catalina Island (CAT) were pooledand measured for T4: the mean T4 concentration from 4 plasma
pools was 34.6 ± 1.8 (4). In contrast to the above groups, surfperchsampled from other locations exhibited lower T4 concentrations:fish from OAK had lower T4 levels than the RED and RLC groups(p < 0.05), while fish from SLB and TOB had particularly depressedT4 levels (significantly lower than in all other groups, p < 0.01). Inaghorn sculpin (panel B) sampled from different locations in San Francisco Bay inOakland Inner Harbor (OAK). Sculpin were also sampled from Tomales Bay (TOB).
with the number of samples given in parentheses. Different (a and b) superscripts
Toxico
tsalHav
fRw(ittweaehs
F(St
N.K. Brar et al. / Aquatic
he sculpin, spatial patterns in T4 levels (Fig. 4a) exhibited someimilarities to those observed in the surfperch. Sculpin from REDnd BDB exhibited relatively higher plasma T4 as compared withevels in several other groups, including OAK, SLB and TOB (p < 0.05).owever, in contrast to surfperch, sculpin from RCH, RLC, and SPBlso exhibited relatively reduced plasma T4 concentrations (p < 0.05s. RED, BDB and SFW).
Plasma T3 concentrations exhibited a spatial pattern that dif-ered from that of T4 (Fig. 3b). Surfperch sampled from BDB, RCH,LC, and SLB all had T3 concentrations around 12–15 ng/ml, whichere significantly higher than in fish from RED, SFW, and TOB
p < 0.05). Calculated ratios of T3/T4 were around 0.5 in a major-ty of groups, and showed an overall spatial pattern comparable tohat of plasma T3 concentrations (Fig. 3c). Surfperch from RED hadhe lowest T3/T4 ratio (0.15 ± 0.03; p < 0.05 vs. all other groups),hile the group from SLB exhibited the opposite pattern (high-
st T3/T4 ratio; 1.2 ± 0.14; p < 0.05 vs. all other groups). It waslso noted that fish from TOB exhibited relatively reduced lev-ls of both T3 and T4, while three groups (BDB, RCH, and RLC)ad relatively increased levels of both hormones (Fig. 3). As inurfperch, T3 levels in sculpin were relatively lower in the RED
ig. 3. Plasma T4 concentrations (panel A), T3 concentrations (panel B), and T3/T4 raRED = Redwood City; RCH = Richmond Harbor; RLC = Richmond Lauritzen Channel; SPBLB = San Leandro Bay) and in Bodega Bay (BDB) and Tomales Bay (TOB). Study site loche number of individuals per mean shown in parentheses. (a–d) Superscripts indicate si
logy 96 (2010) 203–215 207
and TOB groups as compared with fish from BDB, RCH, and RLC(p < 0.05; Fig. 4b). However, the sculpin also exhibited relativelylower T3 concentrations in SPB, OAK, SLB and HPT, as comparedwith several other groups (p < 0.05). As in surfperch, T3/T4 ratiosin sculpin largely followed the pattern of T3 levels (Fig. 4c) andwere significantly higher in most groups as compared with theRED group (p < 0.05). Noted differences with the surfperch includedrelatively lower T3/T4 ratio in sculpin from TOB, and relativelyhigher T3/T4 ratio in sculpin from RLC (the latter group alsoexhibited relatively higher PCB exposure, as described in Section3.3).
Therefore, over two years of study, the thyroid endocrine systemin two different fish species exhibited several location-associateddifferences in San Francisco Bay Area aquatic habitats, a number ofwhich were consistent between the two species. Since a key objec-tive in the study was to determine whether alterations in thyroid
endocrine status could be related to exposures to environmentalcontaminants in the same fish, liver concentrations of PCBs, PAHs,and pesticides were measured in selected sub-groups. These groupswere then used to evaluate potential relationships using correlationanalysis.tio (panel C) in shiner surfperch collected from field sites in San Francisco Bay= San Pablo Bay; SFW = San Francisco Waterfront; OAK = Oakland Inner Harbor;ations are shown in map in Fig. 1. Bars represent mean ng/ml values ± SE, with
gnificant differences between means (p < 0.05).

2 Toxico
3
stssblaoatReieafptih
FBSv
08 N.K. Brar et al. / Aquatic
.3. Hepatic contaminant concentrations in fish
Preliminary studies using liver samples from the 2006 pilottudy demonstrated that a large number of contaminants, in allhree targeted classes (PCBs, pesticides, PAHs), were detectable iningle fish livers of both species. The rationale for selecting the 2007tudy sites in which fish liver contaminant measurements woulde undertaken was based upon obtaining groups of fish that were
ikely to be exposed to distinct environmental chemical signatures,s well as emerging data on the endocrine status for thyroxine andther hormones in fish residing at different study sites. Given thebove factors, cost considerations of GC/MS analysis, and represen-ation of both species at such study sites, the RED, OAK, SLB, andLC groups were chosen for these analyses. As stated earlier (refer-nces cited in Section 2.2), RLC is a DDT-contaminated site and SLBs a PCB-contaminated site, while OAK was already known to havendocrine effects in the fish, as compared with less or no observ-ble effects in fish from RED. In addition to these groups, livers from
our surfperch from CAT were also analyzed; although the pooledlasma samples meant that these samples could not be included inhe correlation analyses, this group provided a measure of contam-nant exposures in fish from a location subjected to very minimaluman influence.ig. 4. Plasma T4 concentrations (panel A), T3 concentrations (panel B), and T3/T4 ratiay (RED = Redwood City; RCH = Richmond Harbor; RLC = Richmond Lauritzen Channel; SLB = San Leandro Bay; HPT = Hunters Point) and in Bodega Bay (BDB) and Tomales Bay (alues ± SE, with the number of individuals per mean shown in parentheses. (a–d) Super
logy 96 (2010) 203–215
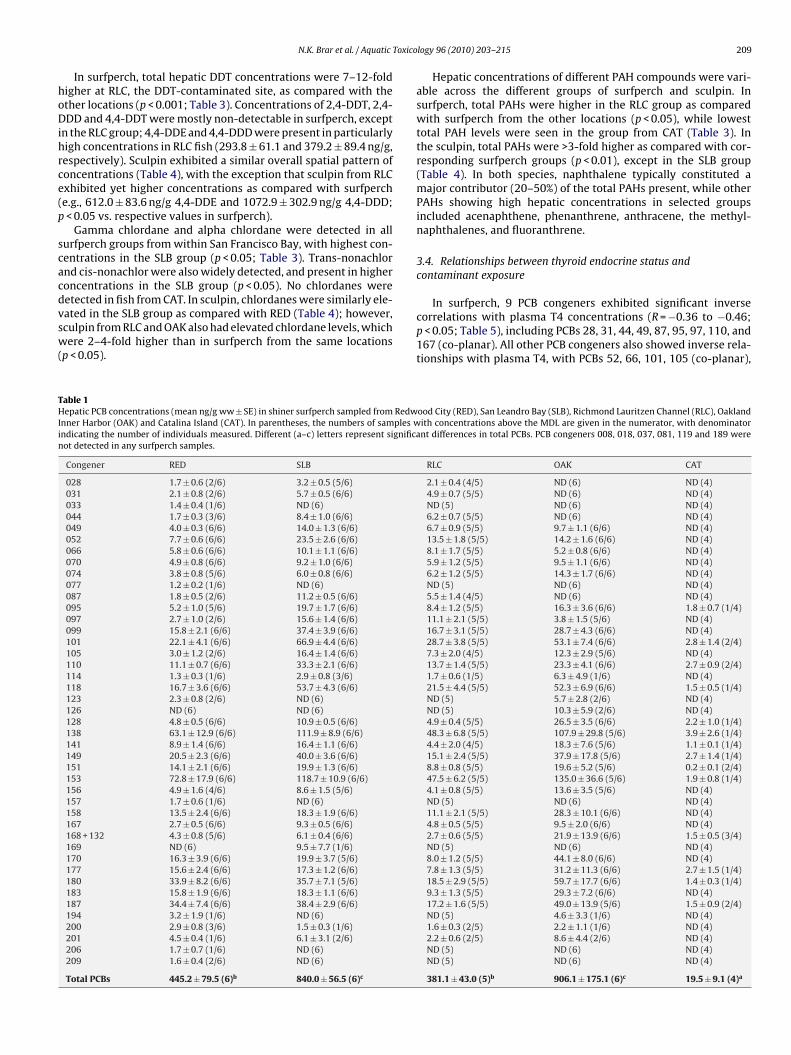
Among 49 measured PCB congeners, 43 were detected overallbetween both species (Tables 1 and 2). In surfperch, 26 PCB con-geners were present in liver at >10 ng/g in one or more of the groups,while 16 congeners were >20 ng/g in one or more of the groups(Table 1). Of the 12 dioxin-like co-planar PCBs (Safe, 1994), onlyPCB 118 was present in concentrations >20 ng/g in one or more ofthe groups, while three (PCBs 105, 126, and 156) were ≥10 ng/g inone or more of the groups. All detected PCB congeners were gen-erally present at ≥2-fold higher concentrations in the OAK and SLBgroups as compared with surfperch from RED and RLC, while inthe fish from CAT, hepatic PCBs were very low (total PCBs were<20 ng/g). Overall, the highest congener concentrations measuredwere for PCB 153 and PCB 138 (both >100 ng/g), followed by PCBs101, 118, 180, 187, 149, and 170, most of which were >40 ng/g infish from OAK and SLB. In sculpin, on the other hand, a greater num-ber of PCB congeners (32) were present at >10 ng/g in one or moregroups, and 25 PCBs were >20 ng/g in one or more groups (Table 2).As in surfperch, sculpin had highest hepatic concentrations of PCB
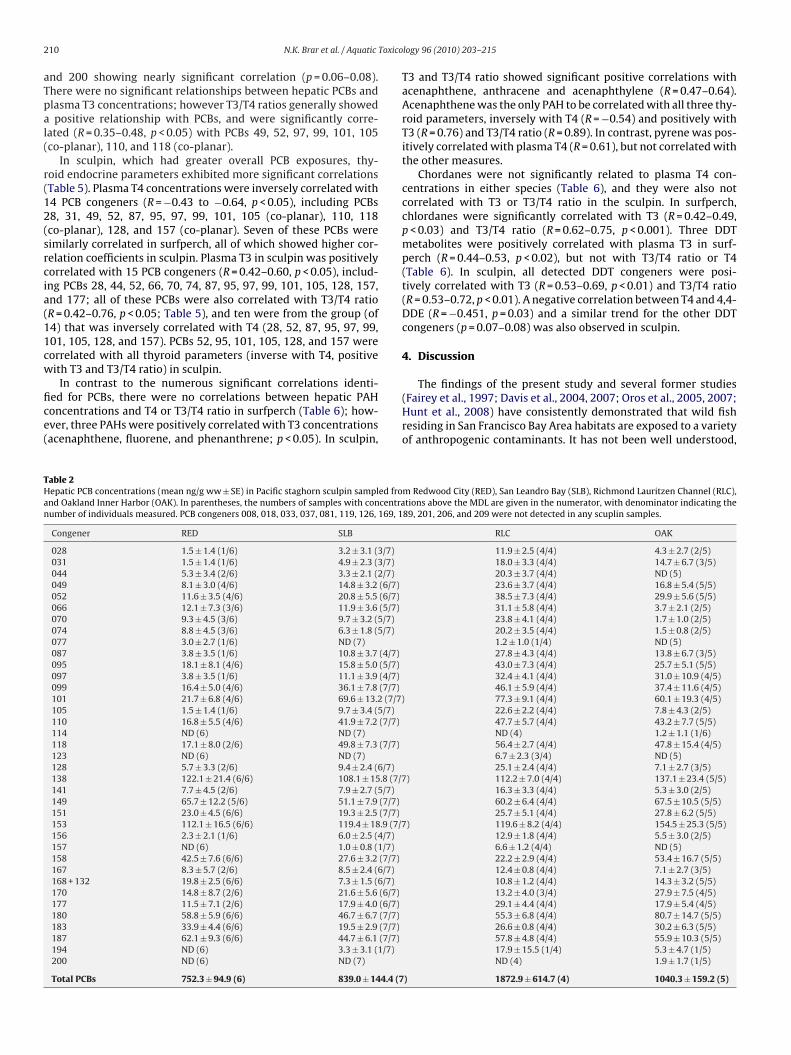
153 and PCB 138 (both >100 ng/g), while PCBs 101, 118 (co-planar),180, 187, 149, 158 and 170 were >40 ng/g in groups from all sites.Total PCBs were higher in sculpin as compared with surfperch atRED and RLC (p < 0.05), but at similar levels between species in SLBand OAK.o (panel C) in Pacific staghorn sculpin collected from field sites in San FranciscoPB = San Pablo Bay; SFW = San Francisco Waterfront; OAK = Oakland Inner Harbor;TOB). Study site locations are shown in map in Fig. 1. Bars represent mean ng/ml
scripts indicate significant differences between means (p < 0.05).
Toxico
hoDihrce(p
scacdvsw(
THIin
N.K. Brar et al. / Aquatic
In surfperch, total hepatic DDT concentrations were 7–12-foldigher at RLC, the DDT-contaminated site, as compared with thether locations (p < 0.001; Table 3). Concentrations of 2,4-DDT, 2,4-DD and 4,4-DDT were mostly non-detectable in surfperch, except
n the RLC group; 4,4-DDE and 4,4-DDD were present in particularlyigh concentrations in RLC fish (293.8 ± 61.1 and 379.2 ± 89.4 ng/g,espectively). Sculpin exhibited a similar overall spatial pattern ofoncentrations (Table 4), with the exception that sculpin from RLCxhibited yet higher concentrations as compared with surfperche.g., 612.0 ± 83.6 ng/g 4,4-DDE and 1072.9 ± 302.9 ng/g 4,4-DDD;< 0.05 vs. respective values in surfperch).
Gamma chlordane and alpha chlordane were detected in allurfperch groups from within San Francisco Bay, with highest con-entrations in the SLB group (p < 0.05; Table 3). Trans-nonachlornd cis-nonachlor were also widely detected, and present in higheroncentrations in the SLB group (p < 0.05). No chlordanes were
etected in fish from CAT. In sculpin, chlordanes were similarly ele-ated in the SLB group as compared with RED (Table 4); however,culpin from RLC and OAK also had elevated chlordane levels, whichere 2–4-fold higher than in surfperch from the same locationsp < 0.05).
able 1epatic PCB concentrations (mean ng/g ww ± SE) in shiner surfperch sampled from Redw
nner Harbor (OAK) and Catalina Island (CAT). In parentheses, the numbers of samples wndicating the number of individuals measured. Different (a–c) letters represent significaot detected in any surfperch samples.
Congener RED SLB
028 1.7 ± 0.6 (2/6) 3.2 ± 0.5 (5/6)031 2.1 ± 0.8 (2/6) 5.7 ± 0.5 (6/6)033 1.4 ± 0.4 (1/6) ND (6)044 1.7 ± 0.3 (3/6) 8.4 ± 1.0 (6/6)049 4.0 ± 0.3 (6/6) 14.0 ± 1.3 (6/6)052 7.7 ± 0.6 (6/6) 23.5 ± 2.6 (6/6)066 5.8 ± 0.6 (6/6) 10.1 ± 1.1 (6/6)070 4.9 ± 0.8 (6/6) 9.2 ± 1.0 (6/6)074 3.8 ± 0.8 (5/6) 6.0 ± 0.8 (6/6)077 1.2 ± 0.2 (1/6) ND (6)087 1.8 ± 0.5 (2/6) 11.2 ± 0.5 (6/6)095 5.2 ± 1.0 (5/6) 19.7 ± 1.7 (6/6)097 2.7 ± 1.0 (2/6) 15.6 ± 1.4 (6/6)099 15.8 ± 2.1 (6/6) 37.4 ± 3.9 (6/6)101 22.1 ± 4.1 (6/6) 66.9 ± 4.4 (6/6)105 3.0 ± 1.2 (2/6) 16.4 ± 1.4 (6/6)110 11.1 ± 0.7 (6/6) 33.3 ± 2.1 (6/6)114 1.3 ± 0.3 (1/6) 2.9 ± 0.8 (3/6)118 16.7 ± 3.6 (6/6) 53.7 ± 4.3 (6/6)123 2.3 ± 0.8 (2/6) ND (6)126 ND (6) ND (6)128 4.8 ± 0.5 (6/6) 10.9 ± 0.5 (6/6)138 63.1 ± 12.9 (6/6) 111.9 ± 8.9 (6/6)141 8.9 ± 1.4 (6/6) 16.4 ± 1.1 (6/6)149 20.5 ± 2.3 (6/6) 40.0 ± 3.6 (6/6)151 14.1 ± 2.1 (6/6) 19.9 ± 1.3 (6/6)153 72.8 ± 17.9 (6/6) 118.7 ± 10.9 (6/6)156 4.9 ± 1.6 (4/6) 8.6 ± 1.5 (5/6)157 1.7 ± 0.6 (1/6) ND (6)158 13.5 ± 2.4 (6/6) 18.3 ± 1.9 (6/6)167 2.7 ± 0.5 (6/6) 9.3 ± 0.5 (6/6)168 + 132 4.3 ± 0.8 (5/6) 6.1 ± 0.4 (6/6)169 ND (6) 9.5 ± 7.7 (1/6)170 16.3 ± 3.9 (6/6) 19.9 ± 3.7 (5/6)177 15.6 ± 2.4 (6/6) 17.3 ± 1.2 (6/6)180 33.9 ± 8.2 (6/6) 35.7 ± 7.1 (5/6)183 15.8 ± 1.9 (6/6) 18.3 ± 1.1 (6/6)187 34.4 ± 7.4 (6/6) 38.4 ± 2.9 (6/6)194 3.2 ± 1.9 (1/6) ND (6)200 2.9 ± 0.8 (3/6) 1.5 ± 0.3 (1/6)201 4.5 ± 0.4 (1/6) 6.1 ± 3.1 (2/6)206 1.7 ± 0.7 (1/6) ND (6)209 1.6 ± 0.4 (2/6) ND (6)
Total PCBs 445.2 ± 79.5 (6)b 840.0 ± 56.5 (6)c
logy 96 (2010) 203–215 209
Hepatic concentrations of different PAH compounds were vari-able across the different groups of surfperch and sculpin. Insurfperch, total PAHs were higher in the RLC group as comparedwith surfperch from the other locations (p < 0.05), while lowesttotal PAH levels were seen in the group from CAT (Table 3). Inthe sculpin, total PAHs were >3-fold higher as compared with cor-responding surfperch groups (p < 0.01), except in the SLB group(Table 4). In both species, naphthalene typically constituted amajor contributor (20–50%) of the total PAHs present, while otherPAHs showing high hepatic concentrations in selected groupsincluded acenaphthene, phenanthrene, anthracene, the methyl-naphthalenes, and fluoranthrene.
3.4. Relationships between thyroid endocrine status andcontaminant exposure
In surfperch, 9 PCB congeners exhibited significant inversecorrelations with plasma T4 concentrations (R = −0.36 to −0.46;p < 0.05; Table 5), including PCBs 28, 31, 44, 49, 87, 95, 97, 110, and167 (co-planar). All other PCB congeners also showed inverse rela-tionships with plasma T4, with PCBs 52, 66, 101, 105 (co-planar),
ood City (RED), San Leandro Bay (SLB), Richmond Lauritzen Channel (RLC), Oaklandith concentrations above the MDL are given in the numerator, with denominatornt differences in total PCBs. PCB congeners 008, 018, 037, 081, 119 and 189 were
RLC OAK CAT
2.1 ± 0.4 (4/5) ND (6) ND (4)4.9 ± 0.7 (5/5) ND (6) ND (4)ND (5) ND (6) ND (4)6.2 ± 0.7 (5/5) ND (6) ND (4)6.7 ± 0.9 (5/5) 9.7 ± 1.1 (6/6) ND (4)13.5 ± 1.8 (5/5) 14.2 ± 1.6 (6/6) ND (4)8.1 ± 1.7 (5/5) 5.2 ± 0.8 (6/6) ND (4)5.9 ± 1.2 (5/5) 9.5 ± 1.1 (6/6) ND (4)6.2 ± 1.2 (5/5) 14.3 ± 1.7 (6/6) ND (4)ND (5) ND (6) ND (4)5.5 ± 1.4 (4/5) ND (6) ND (4)8.4 ± 1.2 (5/5) 16.3 ± 3.6 (6/6) 1.8 ± 0.7 (1/4)11.1 ± 2.1 (5/5) 3.8 ± 1.5 (5/6) ND (4)16.7 ± 3.1 (5/5) 28.7 ± 4.3 (6/6) ND (4)28.7 ± 3.8 (5/5) 53.1 ± 7.4 (6/6) 2.8 ± 1.4 (2/4)7.3 ± 2.0 (4/5) 12.3 ± 2.9 (5/6) ND (4)13.7 ± 1.4 (5/5) 23.3 ± 4.1 (6/6) 2.7 ± 0.9 (2/4)1.7 ± 0.6 (1/5) 6.3 ± 4.9 (1/6) ND (4)21.5 ± 4.4 (5/5) 52.3 ± 6.9 (6/6) 1.5 ± 0.5 (1/4)ND (5) 5.7 ± 2.8 (2/6) ND (4)ND (5) 10.3 ± 5.9 (2/6) ND (4)4.9 ± 0.4 (5/5) 26.5 ± 3.5 (6/6) 2.2 ± 1.0 (1/4)48.3 ± 6.8 (5/5) 107.9 ± 29.8 (5/6) 3.9 ± 2.6 (1/4)4.4 ± 2.0 (4/5) 18.3 ± 7.6 (5/6) 1.1 ± 0.1 (1/4)15.1 ± 2.4 (5/5) 37.9 ± 17.8 (5/6) 2.7 ± 1.4 (1/4)8.8 ± 0.8 (5/5) 19.6 ± 5.2 (5/6) 0.2 ± 0.1 (2/4)47.5 ± 6.2 (5/5) 135.0 ± 36.6 (5/6) 1.9 ± 0.8 (1/4)4.1 ± 0.8 (5/5) 13.6 ± 3.5 (5/6) ND (4)ND (5) ND (6) ND (4)11.1 ± 2.1 (5/5) 28.3 ± 10.1 (6/6) ND (4)4.8 ± 0.5 (5/5) 9.5 ± 2.0 (6/6) ND (4)2.7 ± 0.6 (5/5) 21.9 ± 13.9 (6/6) 1.5 ± 0.5 (3/4)ND (5) ND (6) ND (4)8.0 ± 1.2 (5/5) 44.1 ± 8.0 (6/6) ND (4)7.8 ± 1.3 (5/5) 31.2 ± 11.3 (6/6) 2.7 ± 1.5 (1/4)18.5 ± 2.9 (5/5) 59.7 ± 17.7 (6/6) 1.4 ± 0.3 (1/4)9.3 ± 1.3 (5/5) 29.3 ± 7.2 (6/6) ND (4)17.2 ± 1.6 (5/5) 49.0 ± 13.9 (5/6) 1.5 ± 0.9 (2/4)ND (5) 4.6 ± 3.3 (1/6) ND (4)1.6 ± 0.3 (2/5) 2.2 ± 1.1 (1/6) ND (4)2.2 ± 0.6 (2/5) 8.6 ± 4.4 (2/6) ND (4)ND (5) ND (6) ND (4)ND (5) ND (6) ND (4)
381.1 ± 43.0 (5)b 906.1 ± 175.1 (6)c 19.5 ± 9.1 (4)a
2 Toxico
aTpal(
r(12(srcia(11cw
fice(
THan
10 N.K. Brar et al. / Aquatic
nd 200 showing nearly significant correlation (p = 0.06–0.08).here were no significant relationships between hepatic PCBs andlasma T3 concentrations; however T3/T4 ratios generally showedpositive relationship with PCBs, and were significantly corre-
ated (R = 0.35–0.48, p < 0.05) with PCBs 49, 52, 97, 99, 101, 105co-planar), 110, and 118 (co-planar).
In sculpin, which had greater overall PCB exposures, thy-oid endocrine parameters exhibited more significant correlationsTable 5). Plasma T4 concentrations were inversely correlated with4 PCB congeners (R = −0.43 to −0.64, p < 0.05), including PCBs8, 31, 49, 52, 87, 95, 97, 99, 101, 105 (co-planar), 110, 118co-planar), 128, and 157 (co-planar). Seven of these PCBs wereimilarly correlated in surfperch, all of which showed higher cor-elation coefficients in sculpin. Plasma T3 in sculpin was positivelyorrelated with 15 PCB congeners (R = 0.42–0.60, p < 0.05), includ-ng PCBs 28, 44, 52, 66, 70, 74, 87, 95, 97, 99, 101, 105, 128, 157,nd 177; all of these PCBs were also correlated with T3/T4 ratioR = 0.42–0.76, p < 0.05; Table 5), and ten were from the group (of4) that was inversely correlated with T4 (28, 52, 87, 95, 97, 99,01, 105, 128, and 157). PCBs 52, 95, 101, 105, 128, and 157 wereorrelated with all thyroid parameters (inverse with T4, positiveith T3 and T3/T4 ratio) in sculpin.
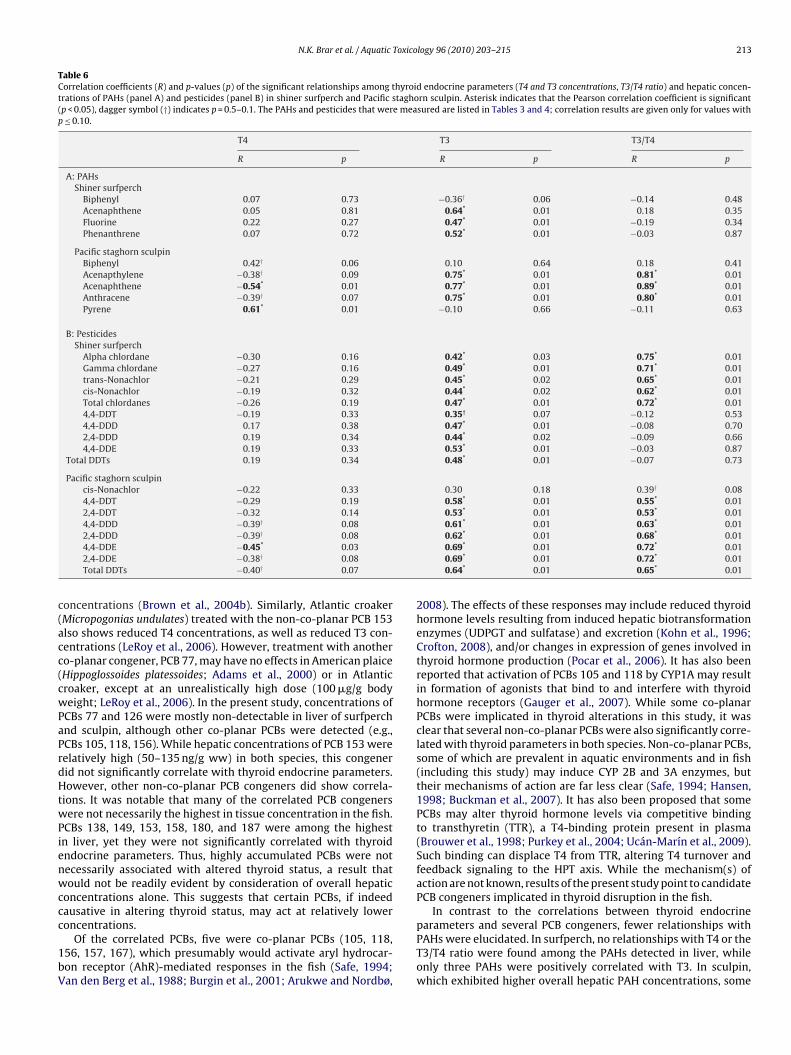
In contrast to the numerous significant correlations identi-ed for PCBs, there were no correlations between hepatic PAHoncentrations and T4 or T3/T4 ratio in surfperch (Table 6); how-ver, three PAHs were positively correlated with T3 concentrationsacenaphthene, fluorene, and phenanthrene; p < 0.05). In sculpin,
able 2epatic PCB concentrations (mean ng/g ww ± SE) in Pacific staghorn sculpin sampled frond Oakland Inner Harbor (OAK). In parentheses, the numbers of samples with concentraumber of individuals measured. PCB congeners 008, 018, 033, 037, 081, 119, 126, 169, 1
Congener RED SLB
028 1.5 ± 1.4 (1/6) 3.2 ± 3.1 (3/7)031 1.5 ± 1.4 (1/6) 4.9 ± 2.3 (3/7)044 5.3 ± 3.4 (2/6) 3.3 ± 2.1 (2/7)049 8.1 ± 3.0 (4/6) 14.8 ± 3.2 (6/7)052 11.6 ± 3.5 (4/6) 20.8 ± 5.5 (6/7)066 12.1 ± 7.3 (3/6) 11.9 ± 3.6 (5/7)070 9.3 ± 4.5 (3/6) 9.7 ± 3.2 (5/7)074 8.8 ± 4.5 (3/6) 6.3 ± 1.8 (5/7)077 3.0 ± 2.7 (1/6) ND (7)087 3.8 ± 3.5 (1/6) 10.8 ± 3.7 (4/7)095 18.1 ± 8.1 (4/6) 15.8 ± 5.0 (5/7)097 3.8 ± 3.5 (1/6) 11.1 ± 3.9 (4/7)099 16.4 ± 5.0 (4/6) 36.1 ± 7.8 (7/7)101 21.7 ± 6.8 (4/6) 69.6 ± 13.2 (7/7)105 1.5 ± 1.4 (1/6) 9.7 ± 3.4 (5/7)110 16.8 ± 5.5 (4/6) 41.9 ± 7.2 (7/7)114 ND (6) ND (7)118 17.1 ± 8.0 (2/6) 49.8 ± 7.3 (7/7)123 ND (6) ND (7)128 5.7 ± 3.3 (2/6) 9.4 ± 2.4 (6/7)138 122.1 ± 21.4 (6/6) 108.1 ± 15.8 (7/7141 7.7 ± 4.5 (2/6) 7.9 ± 2.7 (5/7)149 65.7 ± 12.2 (5/6) 51.1 ± 7.9 (7/7)151 23.0 ± 4.5 (6/6) 19.3 ± 2.5 (7/7)153 112.1 ± 16.5 (6/6) 119.4 ± 18.9 (7/7156 2.3 ± 2.1 (1/6) 6.0 ± 2.5 (4/7)157 ND (6) 1.0 ± 0.8 (1/7)158 42.5 ± 7.6 (6/6) 27.6 ± 3.2 (7/7)167 8.3 ± 5.7 (2/6) 8.5 ± 2.4 (6/7)168 + 132 19.8 ± 2.5 (6/6) 7.3 ± 1.5 (6/7)170 14.8 ± 8.7 (2/6) 21.6 ± 5.6 (6/7)177 11.5 ± 7.1 (2/6) 17.9 ± 4.0 (6/7)180 58.8 ± 5.9 (6/6) 46.7 ± 6.7 (7/7)183 33.9 ± 4.4 (6/6) 19.5 ± 2.9 (7/7)187 62.1 ± 9.3 (6/6) 44.7 ± 6.1 (7/7)194 ND (6) 3.3 ± 3.1 (1/7)200 ND (6) ND (7)
Total PCBs 752.3 ± 94.9 (6) 839.0 ± 144.4 (7
logy 96 (2010) 203–215
T3 and T3/T4 ratio showed significant positive correlations withacenaphthene, anthracene and acenaphthylene (R = 0.47–0.64).Acenaphthene was the only PAH to be correlated with all three thy-roid parameters, inversely with T4 (R = −0.54) and positively withT3 (R = 0.76) and T3/T4 ratio (R = 0.89). In contrast, pyrene was pos-itively correlated with plasma T4 (R = 0.61), but not correlated withthe other measures.
Chordanes were not significantly related to plasma T4 con-centrations in either species (Table 6), and they were also notcorrelated with T3 or T3/T4 ratio in the sculpin. In surfperch,chlordanes were significantly correlated with T3 (R = 0.42–0.49,p < 0.03) and T3/T4 ratio (R = 0.62–0.75, p < 0.001). Three DDTmetabolites were positively correlated with plasma T3 in surf-perch (R = 0.44–0.53, p < 0.02), but not with T3/T4 ratio or T4(Table 6). In sculpin, all detected DDT congeners were posi-tively correlated with T3 (R = 0.53–0.69, p < 0.01) and T3/T4 ratio(R = 0.53–0.72, p < 0.01). A negative correlation between T4 and 4,4-DDE (R = −0.451, p = 0.03) and a similar trend for the other DDTcongeners (p = 0.07–0.08) was also observed in sculpin.
4. Discussion
The findings of the present study and several former studies(Fairey et al., 1997; Davis et al., 2004, 2007; Oros et al., 2005, 2007;Hunt et al., 2008) have consistently demonstrated that wild fishresiding in San Francisco Bay Area habitats are exposed to a varietyof anthropogenic contaminants. It has not been well understood,
m Redwood City (RED), San Leandro Bay (SLB), Richmond Lauritzen Channel (RLC),tions above the MDL are given in the numerator, with denominator indicating the89, 201, 206, and 209 were not detected in any scuplin samples.
RLC OAK
11.9 ± 2.5 (4/4) 4.3 ± 2.7 (2/5)18.0 ± 3.3 (4/4) 14.7 ± 6.7 (3/5)20.3 ± 3.7 (4/4) ND (5)23.6 ± 3.7 (4/4) 16.8 ± 5.4 (5/5)38.5 ± 7.3 (4/4) 29.9 ± 5.6 (5/5)31.1 ± 5.8 (4/4) 3.7 ± 2.1 (2/5)23.8 ± 4.1 (4/4) 1.7 ± 1.0 (2/5)20.2 ± 3.5 (4/4) 1.5 ± 0.8 (2/5)1.2 ± 1.0 (1/4) ND (5)27.8 ± 4.3 (4/4) 13.8 ± 6.7 (3/5)43.0 ± 7.3 (4/4) 25.7 ± 5.1 (5/5)32.4 ± 4.1 (4/4) 31.0 ± 10.9 (4/5)46.1 ± 5.9 (4/4) 37.4 ± 11.6 (4/5)77.3 ± 9.1 (4/4) 60.1 ± 19.3 (4/5)22.6 ± 2.2 (4/4) 7.8 ± 4.3 (2/5)47.7 ± 5.7 (4/4) 43.2 ± 7.7 (5/5)ND (4) 1.2 ± 1.1 (1/6)56.4 ± 2.7 (4/4) 47.8 ± 15.4 (4/5)6.7 ± 2.3 (3/4) ND (5)25.1 ± 2.4 (4/4) 7.1 ± 2.7 (3/5)
) 112.2 ± 7.0 (4/4) 137.1 ± 23.4 (5/5)16.3 ± 3.3 (4/4) 5.3 ± 3.0 (2/5)60.2 ± 6.4 (4/4) 67.5 ± 10.5 (5/5)25.7 ± 5.1 (4/4) 27.8 ± 6.2 (5/5)
) 119.6 ± 8.2 (4/4) 154.5 ± 25.3 (5/5)12.9 ± 1.8 (4/4) 5.5 ± 3.0 (2/5)6.6 ± 1.2 (4/4) ND (5)22.2 ± 2.9 (4/4) 53.4 ± 16.7 (5/5)12.4 ± 0.8 (4/4) 7.1 ± 2.7 (3/5)10.8 ± 1.2 (4/4) 14.3 ± 3.2 (5/5)13.2 ± 4.0 (3/4) 27.9 ± 7.5 (4/5)29.1 ± 4.4 (4/4) 17.9 ± 5.4 (4/5)55.3 ± 6.8 (4/4) 80.7 ± 14.7 (5/5)26.6 ± 0.8 (4/4) 30.2 ± 6.3 (5/5)57.8 ± 4.8 (4/4) 55.9 ± 10.3 (5/5)17.9 ± 15.5 (1/4) 5.3 ± 4.7 (1/5)ND (4) 1.9 ± 1.7 (1/5)
) 1872.9 ± 614.7 (4) 1040.3 ± 159.2 (5)

N.K. Brar et al. / Aquatic Toxicology 96 (2010) 203–215 211
Table 3Hepatic concentrations of pesticides and PAHs (mean ng/g ww ± SE) in shiner surfperch sampled from Redwood City (RED), San Leandro Bay (SLB), Richmond LauritzenChannel (RLC), Oakland Inner Harbor (OAK), and Santa Catalina Island (CAT). In parentheses, the numbers of samples with concentrations above the MDL are given in thenumerator, with denominator indicating the number of individuals measured. Different (a–c) letters represent significant differences in total chlordanes, total DDTs, ortotal PAHs. The following chemicals were not detected in any surfperch samples: 4,4′-DDT, aldrin, BHC-�, -�, -�, and -�, DCPA (dacthal), dicofol, dieldrin, endosulfan-Iand -II, endrin, endrin aldehyde, endrin ketone, heptachlor, heptachlor epoxide, methoxychlor, mirex, oxychlordane, perthane, 1-methylphenanthrene, benz[a]anthracene,benzo[a]pyrene, benzo[e]pyrene, benzo[g,h,i]perylene, chrysene, dibenz[a,h]anthracene, dibenzothiophene, fluoranthene, indeno[1,2,3-c,d]pyrene, perylene.
RED SLB RLC OAK CAT
PesticidesGamma chlordane 3.0 ± 0.41 (3/6) 12.3 ± 1.4 (6/6) 4.8 ± 1.4 (4/5) 6.0 ± 0.8 (6/6) ND (4)Alpha chlordane 8.7 ± 2.6 (4/6) 24.1 ± 2.6 (6/6) 7.4 ± 1.8 (4/5) 11.4 ± 1.7 (6/6) ND (4)trans-Nonachlor 10.8 ± 3.8 (4/6) 25.4 ± 2.2 (6/6) 6.8 ± 1.9 (4/5) 14.7 ± 3.3 (6/6) ND (4)cis-Nonachlor 8.0 ± 2.8 (4/6) 18.2 ± 0.7 (6/6) 4.6 ± 1.2 (4/5) 9.6 ± 2.2 (5/6) ND (4)Endosulfan sulfate ND (6) ND (6) ND (5) ND (6) ND (4)4,4-DDE 58.9 ± 14.1 (6/6) 80.7 ± 5.3 (6/6) 293.8 ± 61.1 (5/5) 81.5 ± 20.9 (6/6) 16.4 ± 5.2 (4/4)4,4-DDD 8.8 ± 4.2 (3/6) 35.8 ± 4.0 (6/6) 379.3 ± 89.4 (5/5) 28.1 ± 4.3 (6/6) ND (4)2,4-DDT ND (6) ND (6) 7.9 ± 3.5 (1/5) 0.81 ± 0.7 (1/6) ND (4)2,4-DDD ND (6) 3.1 ± 2.8 (1/6) 84.4 ± 20.6 (5/5) ND (6) ND (4)4,4-DDT ND (6) ND (6) 47.8 ± 18.0 (4/5) ND (6) ND (4)Total chlordanes 30.6 ± 9.9 (6)a,b 79.9 ± 5.4 (6)c 23.6 ± 6.3 (6)a 41.8 ± 5.6 (6)b ND (4)Total DDTs 67.7 ± 18.1 (6)b 119.6 ± 10.5 (6)b 813.1 ± 192.6 (6)c 110.4 ± 23.9 (6)b 16.4 ± 5.2 (4)b
PAHsNaphthalene 141.5 ± 38.9 (6/6) 111.0 ± 13.0 (6/6) 67.7 ± 11.7 (5/5) 13.8 ± 4.7 (4/6) 20.0 ± 10.0 (2/4)2-Methylnaphthalene 34.6 ± 7.0 (6/6) 42.7 ± 6.4 (6/6) 38.9 ± 2.8 (5/5) 17.3 ± 3.4 (6/6) 8.82 ± 3.8 (3/4)1-Methylnaphthalene 40.3 ± 8.7 (6/6) 32.7 ± 4.8 (6/6) 28.1 ± 2.9 (5/5) 17.2 ± 3.9 (6/6) 10.1 ± 1.9 (4/4)2,6-Dimethylnaphthalene ND (6) ND (6) 2.5 ± 2.2 (1/5) ND (6) 2.96 ± 1.7 (1/4)2,3,5-Trimethylnaphthlene biphenyl 19.5 ± 17.8 (1/6) 7.4 ± 5.8 (1/6) ND (5) 11.4 ± 3.2 (4/6) 2.57 ± 0.98 (2/4)Acenaphthylene ND (6) ND (6) 7.2 ± 3.2 (3/5) ND (6) ND (4)Acenaphthene 7.2 ± 3.6 (2/6) 36.5 ± 8.9 (5/6) 97.5 ± 14.7 (5/5) ND (6) ND (4)Flurorene ND (6) ND (6) 42.5 ± 5.2 (5/5) 10.1 ± 3.3 (5/6) ND (4)Phenanthrene ND (6) 15.9 ± 9.5 (2/6) 88.0 ± 2.7 (5/5) 28.7 ± 9.8 (6/6) 2.29 ± 1.1 (1/5)Anthracene ND (6) 1.2 ± 1.1 (1/6) 20.2 ± 2.2 (5/5) 13.4 ± 2.2 (6/6) 2.87 ± 0.88 (4/4)Fluoranthene ND (6) ND (6) ND (5) 50.5 ± 5.8 (6/6) 0.89 ± 0.10 (1/4)Pyrene ND (6) ND (6) ND (5) 12.9 ± 4.6 (6/6) 2.2 ± 1.1 (2/4)Benzo[b]fluoranthene ND (6) ND (6) ND (5) 6.3 ± 4.8 (1/6) ND (4)Benzo[k]fluoranthene ND (6) ND (6) ND (5) 9.9 ± 9.1 (1/6) ND (4)Total PAHs 242.4 ± 64.7 (6)b 246.4 ± 19.1 (6)b 392.6 ± 11.1 (5)c 191.6 ± 33.7 (5)b 28.6 ± 16.7 (4)a
Table 4Hepatic concentrations of pesticides and PAHs (mean ng/g ww ± SE) in Pacific staghorn sculpin sampled from Redwood City (RED), San Leandro Bay (SLB), RichmondLauritzen Channel (RLC), and Oakland Inner Harbor (OAK). In parentheses, the numbers of samples with concentrations above the MDL are given in the numerator, withdenominator indicating the number of individuals measured. Different (a–c) letters represent significant differences in total chlordanes, total DDTs, or total PAHs. The followingchemicals were not detected in any sculpin samples: aldrin, BHC-�, -�, -�, and -�, DCPA (dacthal), dicofol, dieldrin, endosulfan-I and -II, endrin, endrin aldehyde, endrinketone, heptachlor, heptachlor epoxide, methoxychlor, mirex, oxychlordane, perthane, 1-methylphenanthrene, benz[a]anthracene, benzo[a]pyrene, benzo[b]fluoranthene,benzo[k]fluoranthene benzo[e]pyrene, benzo[g,h,i]perylene, chrysene, dibenz[a,h]anthracene, dibenzothiophene, fluorene, indeno[1,2,3-c,d]pyrene, perylene.
RED SLB RLC OAK
PesticidesGamma chlordane 9.3 ± 4.5 (3/6) 18.0 ± 5.7 (4/7) 16.2 ± 2.8 (4/4) 13.6 ± 7.6 (3/5)Alpha chlordane 12.6 ± 5.2 (3/6) 29.9 ± 8.7 (4/7) 24.2 ± 3.4 (4/4) 20.3 ± 9.7 (3/5)trans-Nonachlor 17.0 ± 8.3 (3/6) 30.1 ± 8.3 (5/7) 18.3 ± 2.7 (4/4) 32.3 ± 14.6 (4/5)cis-Nonachlor 16.0 ± 6.8 (3/6) 21.1 ± 4.6 (5/7) 28.9 ± 7.1 (4/4) 19.0 ± 6.5 (4/5)Endosulfan sulfate ND (6) ND (7) ND (5) 101.8 ± 91.1 (1/5) (509.2)4,4-DDE 42.9 ± 15.9 (4/6) 88.0 ± 21.4 (5/7) 612.0 ± 83.6 (4/4) 86.1 ± 22.6 (4/5)4,4-DDD ND (6) 47.9 ± 12.6 (5/7) 1072.9 ± 302.9 (4/4) 29.2 ± 11.2 (3/5)2,4-DDT ND (6) ND (6) 49.1 ± 18.8 (4/4) 0.80 ± 0.6 (1/5)2,4-DDD ND (6) 3.2 ± 2.9 (1/7) 104.0 ± 29.6 (4/4) ND (5)4,4-DDT ND (6) ND (7) 88.8 ± 39.0 (4/4) ND (5)2,4-DDE ND (6) ND (7) 18.5 ± 4.7 (4/4) ND (5)Total chlordanes 54.9 ± 23.5 (3/6)a 99.2 ± 26.9 (5/7)b 87.7 ± 15.7 (4)b 85.2 ± 38.0 (4/5)b
Total DDTs 42.9 ± 42.9 (4/6)a 139.0 ± 34.3 (5/7)b 1945.4 ± 471.8 (4)c 217.1 ± 101.8 (4/5)b
PAHsNaphthalene 193.0 ± 29.9 (6/6) 167.6 ± 30.5 (7/7) 135.6 ± 31.1 (4/4) 377.8 ± 177.6 (5/5)2-Methylnaphthalene 34.6 ± 18.5 (6/6) 69.7 ± 9.2 (7/7) 85.6 ± 11.1 (4/4) 164.2 ± 69.2 (5/5)1-Methylnaphthalene 95.7 ± 11.1 (6/6) 53.6 ± 13.8 (6/7) 48.3 ± 9.2 (4/4) 99.3 ± 48.9 (5/5)2,6-Dimethylnaphthalene ND (6) ND (7) 15.1 ± 8.3 (2/4) ND (5)2,3,5-Trimethylnaphthlene 147.9 ± 135.1 (1/6) (888.0) ND (7) ND (4) ND (5)Biphenyl 63.9 ± 10.1 (6/6) 7.4 ± 5.8 (1/6) 49.9 ± 13.4 (4/4) ND (5)Acenaphthylene 4.5 ± 2.9 (2/6) ND (6) 54.6 ± 12.2 (4/4) ND (6)Acenaphthene 6.9 ± 4.3 (2/6) 27.1 ± 9.0 (4/7) 128.6 ± 24.5 (4/4) 27.9 ± 12.0 (3/5)Flurorene 25.4 ± 18.4 (2/5) ND (6) 56.8 ± 7.9 (4/4) 12.4 ± 11.1 (1/5)Phenanthrene 106.3 ± 26.8 (6/6) 30.2 ± 13.9 (3/7) 61.9 ± 6.8 (4/4) 17.4 ± 15.6 (1/5)Anthracene 15.6 ± 12.8 (2/6) 6.1 ± 3.8 (2/7) 156.7 ± 37.3 (4/4) ND (5)Fluoranthene 81.7 ± 16.6 (6/6) 12.0 ± 11.1 (1/7) 75.6 ± 12.2 (4/4) ND (5)Pyrene 94.7 ± 15.6 (6/6) ND (6) 33.9 ± 2.7 (4/4) ND (5)Total PAHs 1009.1 ± 172.1 (6)b 366.3 ± 48.3 (7)a 902.6 ± 141.0 (4)b 698.9 ± 279.7 (5)b

212 N.K. Brar et al. / Aquatic Toxicology 96 (2010) 203–215
Table 5Correlation coefficients (R) and p-values of the relationships among hepatic concentrations of PCB congeners (identified in center column) and thyroid endocrine parameters(T4 and T3 concentrations, T3/T4 ratio) in shiner surfperch (left) and Pacific staghorn sculpin (right). Asterisk indicates that the Pearson correlation coefficient is significant(p < 0.05); dagger symbol (†) indicates p = 0.5–0.1.
Shiner surfperch PCB congeners Pacific staghorn sculpin
T4 T3 T3/T4 T4 T3 T3/T4.
R p R p R p R p R P R p
−0.37* 0.04 −0.14 0.46 0.23 0.22 028 −0.44* 0.04 0.42* 0.05 0.54* 0.01−0.39* 0.03 −0.09 0.61 0.25 0.17 031 −0.50* 0.02 0.22 0.33 0.39† 0.08−0.43* 0.02 −0.06 0.73 0.33† 0.07 044 −0.40† 0.07 0.59* 0.01 0.67* 0.01−0.37* 0.04 −0.11 0.56 0.39* 0.03 049 −0.62* 0.01 0.27 0.22 0.42* 0.05−0.32† 0.08 −0.06 0.77 0.41* 0.02 052 −0.64* 0.01 0.46* 0.03 0.59* 0.01−0.34† 0.06 −0.20 0.27 0.17 0.36 066 −0.35 0.12 0.46* 0.03 0.53* 0.01−0.27 0.14 −0.23 0.22 0.17 0.36 070 −0.37† 0.09 0.55* 0.01 0.58* 0.01−0.05 0.78 −0.25 0.18 −0.05 0.77 074 −0.30 0.18 0.48* 0.02 0.51* 0.02−0.46* 0.01 −011 0.58 0.33† 0.07 087 −0.50* 0.02 0.56* 0.01 0.59* 0.01−0.41* 0.02 −0.22 0.25 0.30† 0.10 095 −0.51* 0.02 0.48* 0.02 0.59* 0.01−0.45* 0.01 0.01 0.95 0.35* 0.05 097 −0.45* 0.03 0.44* 0.04 0.44* 0.04−0.23 0.22 −0.01 0.98 0.41* 0.02 099 −0.42* 0.05 0.42* 0.05 0.48* 0.02−0.32† 0.08 0.03 0.86 0.48* 0.01 101 −0.50* 0.02 0.45* 0.03 0.49* 0.02−0.32† 0.08 0.07 0.73 0.42* 0.02 105 −0.50* 0.02 0.55* 0.01 0.66* 0.01−0.44* 0.02 −0.06 0.76 0.47* 0.01 110 −0.56* 0.01 0.35 0.11 0.41† 0.06−0.22 0.24 0.05 0.80 0.41* 0.02 118 −0.50* 0.02 0.41† 0.06 0.41† 0.06−0.17 0.35 −0.29 0.120 0.02 0.91 128 −0.47* 0.03 0.60* 0.01 0.69* 0.01−0.13 0.47 0.06 0.74 0.32† 0.08 138 0.01 0.97 −0.01 0.97 0.01 0.96−0.17 0.36 −0.04 0.85 0.27 0.15 141 −0.28 0.21 0.33 0.13 0.45* 0.04−0.26 0.16 −0.08 0.68 0.29 0.12 149 −0.16 0.47 0.13 0.58 0.12 0.60−0.08 0.65 −0.06 0.77 0.22 0.23 151 −0.11 0.62 0.08 0.71 0.13 0.56−0.06 0.76 0.03 0.87 0.24 0.20 153 −0.16 0.48 −0.01 0.98 0.06 0.78−0.13 0.48 0.05 0.79 0.15 0.43 156 −0.40† 0.06 0.41† 0.06 0.49* 0.02−0.30 0.11 −0.30 0.11 −0.001 0.96 157 −0.51* 0.02 0.55* 0.01 0.76* 0.01−0.13 0.48 −0.13 0.49 0.04 0.86 158 0.02 0.92 −0.37† 0.09 −0.29 0.20−0.43* 0.02 0.03 0.87 0.37 0.04 167 −0.19 0.41 0.23 0.29 0.23 0.31−0.18 0.35 −0.09 0.63 0.01 0.96 168 + 132 0.34 0.13 −0.19 0.39 −0.19 0.39
0.14 0.46 0.04 0.81 0.05 0.80 170 −0.08 0.73 0.19 0.39 0.03 0.89−0.11 0.54 −0.12 0.52 0.04 0.81 177 −0.36† 0.11 0.50* 0.02 0.43* 0.04−0.01 0.96 −0.05 0.80 0.07 0.70 180 −0.07 0.75 −0.08 0.73 −0.05 0.82−0.07 0.70 −0.15 0.42 0.06 0.76 183 0.24 0.28 −0.10 0.67 −0.09 0.69−0.06 0.77 −0.10 0.61 0.10 0.60 187 −0.09 0.69 −0.05 0.82 −0.01 0.98−0.13 0.49 −0.20 0.29 −0.11 0.57 194 −0.19 0.40 0.28 0.21 0.21 0.35
200Total
hbcrs
Tprfi(sT(tRtbidt
TTsoR
−0.36† 0.06 0.07 0.71 −0.25 0.18−0.25 0.17 −0.09 0.63 0.25 0.18
owever, the extent to which such contaminant exposures maye related to phenotypic effects. This study provided an initialharacterization of potential endocrine-related effects and theirelationship to accumulated contaminants in two indigenous fishpecies from this region.
Dependent upon the environmental location studied, plasma4 concentrations exhibited significant differences in both surf-erch and sculpin. In surfperch residing in RED, BDB, RCH, and theemote site at CAT, T4 concentrations were comparable to othersh species under control conditions as reported in the literaturee.g., LeRoy et al., 2006; Yang et al., 2007). In contrast, surfperchampled from OAK, SLB, and TOB exhibited significantly reduced4. In sculpin, a similar spatial pattern of differences was observedhigher T4 at RED and BDB, lower T4 at OAK, SLB and TOB). However,he sculpin exhibited additional site-associated reductions in T4 atCH, RLC, and SPB, suggesting this species may be more sensitiveo environmental effects as compared with surfperch. Nonetheless,oth species exhibited several consistent spatial differences in T4,
ncluding some over two years of study (e.g., reduced T4 at OAK). Asiscussed further below, differences in T4 were significantly relatedo environmental contaminant exposures.
Both species also exhibited significant differences in T3 and
3/T4 ratio across the different study locations. Relatively low3 and T3/T4 ratio were observed at some locations (e.g., bothpecies at RED, sculpin at TOB), while relatively values werebserved at other locations (e.g., surfperch at SLB, sculpin atLC). Such differences in T3 and T3/T4 ratio may point toND ND ND ND ND NDPCBs −0.39† 0.072 0.80* 0.01 0.81* 0.01
environment-related alterations in the peripheral conversion of T4into T3.
In all vertebrates including fish, the bulk of plasma T3 con-centrations are derived from peripheral conversions of T4 by5′-deiodinases (Eales et al., 1999; Plohman et al., 2002; Eales, 2006;Zoeller et al., 2007). PCBs, pesticides and other chemicals may alter5′-deiodinase activity in fish, which can lead to increased T3 andreduced T4 (Adams et al., 2000; Brown et al., 2004a; Coimbra etal., 2005; Picard-Aitken et al., 2007). At RLC, sculpin had the high-est PCB exposures (total PCBs >1870 ng/g) and the highest T3/T4ratio. In surfperch at SLB, high T3/T4 ratio was associated withhigher levels of a distinct profile of hepatic PCB congeners (severallower chlorinated PCBs) as compared with surfperch from OAK.In addition, significant correlations between T3/T4 ratio and PCBs,as well as some other chemicals, was observed in both species.We therefore hypothesize that certain locations in the San Fran-cisco Bay Area may be associated with contaminant effects onperipheral deiodination of T4 in fish. In future studies, it will beworthwhile to measure fish deiodinase activities in specific envi-ronmental locations (e.g., those identified with high T3/T4 ratio infish) and evaluate relationships with exposures to specific contam-inants. Deiodination measures have been recommended in a suite
of assays to screen for thyroid disruption in fish (Eales et al., 1999).Laboratory-based studies are increasingly demonstrating directeffects of selected contaminant compounds on thyroid endocrineparameters in fish. In lake trout (Salvelinus namaycush), chronicexposure to co-planar (dioxin-like) PCB 126 reduces plasma T4
N.K. Brar et al. / Aquatic Toxicology 96 (2010) 203–215 213
Table 6Correlation coefficients (R) and p-values (p) of the significant relationships among thyroid endocrine parameters (T4 and T3 concentrations, T3/T4 ratio) and hepatic concen-trations of PAHs (panel A) and pesticides (panel B) in shiner surfperch and Pacific staghorn sculpin. Asterisk indicates that the Pearson correlation coefficient is significant(p < 0.05), dagger symbol (†) indicates p = 0.5–0.1. The PAHs and pesticides that were measured are listed in Tables 3 and 4; correlation results are given only for values withp ≤ 0.10.
T4 T3 T3/T4
R p R p R p
A: PAHsShiner surfperch
Biphenyl 0.07 0.73 −0.36† 0.06 −0.14 0.48Acenaphthene 0.05 0.81 0.64* 0.01 0.18 0.35Fluorine 0.22 0.27 0.47* 0.01 −0.19 0.34Phenanthrene 0.07 0.72 0.52* 0.01 −0.03 0.87
Pacific staghorn sculpinBiphenyl 0.42† 0.06 0.10 0.64 0.18 0.41Acenapthylene −0.38† 0.09 0.75* 0.01 0.81* 0.01Acenaphthene −0.54* 0.01 0.77* 0.01 0.89* 0.01Anthracene −0.39† 0.07 0.75* 0.01 0.80* 0.01Pyrene 0.61* 0.01 −0.10 0.66 −0.11 0.63
B: PesticidesShiner surfperch
Alpha chlordane −0.30 0.16 0.42* 0.03 0.75* 0.01Gamma chlordane −0.27 0.16 0.49* 0.01 0.71* 0.01trans-Nonachlor −0.21 0.29 0.45* 0.02 0.65* 0.01cis-Nonachlor −0.19 0.32 0.44* 0.02 0.62* 0.01Total chlordanes −0.26 0.19 0.47* 0.01 0.72* 0.014,4-DDT −0.19 0.33 0.35† 0.07 −0.12 0.534,4-DDD 0.17 0.38 0.47* 0.01 −0.08 0.702,4-DDD 0.19 0.34 0.44* 0.02 −0.09 0.664,4-DDE 0.19 0.33 0.53* 0.01 −0.03 0.87
Total DDTs 0.19 0.34 0.48* 0.01 −0.07 0.73
Pacific staghorn sculpincis-Nonachlor −0.22 0.33 0.30 0.18 0.39† 0.084,4-DDT −0.29 0.19 0.58* 0.01 0.55* 0.012,4-DDT −0.32 0.14 0.53* 0.01 0.53* 0.014,4-DDD −0.39† 0.08 0.61* 0.01 0.63* 0.01
† * *
c(acc(cwPaPrdHtwPienwccc
1bV
2,4-DDD −0.39 0.084,4-DDE −0.45* 0.032,4-DDE −0.38† 0.08Total DDTs −0.40† 0.07
oncentrations (Brown et al., 2004b). Similarly, Atlantic croakerMicropogonias undulates) treated with the non-co-planar PCB 153lso shows reduced T4 concentrations, as well as reduced T3 con-entrations (LeRoy et al., 2006). However, treatment with anothero-planar congener, PCB 77, may have no effects in American plaiceHippoglossoides platessoides; Adams et al., 2000) or in Atlanticroaker, except at an unrealistically high dose (100 �g/g bodyeight; LeRoy et al., 2006). In the present study, concentrations of
CBs 77 and 126 were mostly non-detectable in liver of surfperchnd sculpin, although other co-planar PCBs were detected (e.g.,CBs 105, 118, 156). While hepatic concentrations of PCB 153 wereelatively high (50–135 ng/g ww) in both species, this congenerid not significantly correlate with thyroid endocrine parameters.owever, other non-co-planar PCB congeners did show correla-
ions. It was notable that many of the correlated PCB congenersere not necessarily the highest in tissue concentration in the fish.
CBs 138, 149, 153, 158, 180, and 187 were among the highestn liver, yet they were not significantly correlated with thyroidndocrine parameters. Thus, highly accumulated PCBs were notecessarily associated with altered thyroid status, a result thatould not be readily evident by consideration of overall hepatic
oncentrations alone. This suggests that certain PCBs, if indeedausative in altering thyroid status, may act at relatively lower
oncentrations.Of the correlated PCBs, five were co-planar PCBs (105, 118,56, 157, 167), which presumably would activate aryl hydrocar-on receptor (AhR)-mediated responses in the fish (Safe, 1994;an den Berg et al., 1988; Burgin et al., 2001; Arukwe and Nordbø,
0.62 0.01 0.68 0.010.69* 0.01 0.72* 0.010.69* 0.01 0.72* 0.010.64* 0.01 0.65* 0.01
2008). The effects of these responses may include reduced thyroidhormone levels resulting from induced hepatic biotransformationenzymes (UDPGT and sulfatase) and excretion (Kohn et al., 1996;Crofton, 2008), and/or changes in expression of genes involved inthyroid hormone production (Pocar et al., 2006). It has also beenreported that activation of PCBs 105 and 118 by CYP1A may resultin formation of agonists that bind to and interfere with thyroidhormone receptors (Gauger et al., 2007). While some co-planarPCBs were implicated in thyroid alterations in this study, it wasclear that several non-co-planar PCBs were also significantly corre-lated with thyroid parameters in both species. Non-co-planar PCBs,some of which are prevalent in aquatic environments and in fish(including this study) may induce CYP 2B and 3A enzymes, buttheir mechanisms of action are far less clear (Safe, 1994; Hansen,1998; Buckman et al., 2007). It has also been proposed that somePCBs may alter thyroid hormone levels via competitive bindingto transthyretin (TTR), a T4-binding protein present in plasma(Brouwer et al., 1998; Purkey et al., 2004; Ucán-Marín et al., 2009).Such binding can displace T4 from TTR, altering T4 turnover andfeedback signaling to the HPT axis. While the mechanism(s) ofaction are not known, results of the present study point to candidatePCB congeners implicated in thyroid disruption in the fish.
In contrast to the correlations between thyroid endocrine
parameters and several PCB congeners, fewer relationships withPAHs were elucidated. In surfperch, no relationships with T4 or theT3/T4 ratio were found among the PAHs detected in liver, whileonly three PAHs were positively correlated with T3. In sculpin,which exhibited higher overall hepatic PAH concentrations, some
2 Toxico
abcetadsaihwTsnamcrpm(arebbti
ltccATstmwhmamaiSctn
5
ttSarobnabCm
14 N.K. Brar et al. / Aquatic
dditional correlations emerged. Increasing PAH exposures woulde expected to activate AhR-mediated pathways which, as dis-ussed earlier, may possibly lead to thyroid endocrine systemffects (Teles et al., 2005). However, the present study also iden-ified several relationships between chlorinated pesticides andltered thyroid parameters in both species. In surfperch, the chlor-anes were positively correlated with T3 and T3/T4 ratio andhowed an inverse (non-significant) trend with T4 levels. In sculpin,similar pattern of response was evident, although low variation
n hepatic chlordane concentrations across the groups appears toave resulted in a lack of significance. DDT and DDT metabolitesere positively correlated with T3 in both species, and in sculpin,
3/T4 ratio (positive) and T4 levels (inverse) also showed severalignificant correlations. The potential mechanisms by which chlori-ated pesticides may exert effects on the thyroid endocrine systemre not understood. Recent mammalian research suggests that DDTetabolites may interfere with TSH receptors on thyroid follicular
ells (Rossi et al., 2007; Picchietti et al., 2009), while an older studyeported that DDTs decreased iodine uptake leading to reduced T4roduction by the thyroid gland (Goldman, 1981). DDT and DDTetabolites may also be associated with thyroid disruption in fish
Brown et al., 2004a,b; Boas et al., 2006; Schnitzler et al., 2008). Inddition, a potential for DDT estrogenic actions in disrupting thy-oid endocrine function may be suggested by some studies in whichstrogenic compounds have been observed to interfere with TTRinding to T4 (e.g., Morgado et al., 2009). Given the relationshipsetween chlorinated pesticides and thyroid parameters implied byhis study, their potential mechanisms of action in the fish are ofnterest in future studies.
The results for TOB, a rural location with a small human popu-ation, were initially surprising, as it was expected that fish fromhis location would show thyroid hormone concentrations moreomparable to those in fish from CAT and BDB. In both species, con-entrations of T4 and T3 were at or near the lowest levels measured.lthough hepatic contaminants were not measured in fish fromOB, most of the organic contaminants considered in the presenttudy would not be expected to be present at elevated levels, withhe possible exception of PAHs derived from recreational and com-
ercial boating and/or local human activities. However, previousork has demonstrated that environmental mercury, derived fromistoric mining activities in the TOB watershed, is high and accu-ulates in tissues of resident fish including surfperch (Gassel et
l., 2004). Mercury and methyl-mercury, in addition to some otheretals (e.g., cadmium), have been reported to decrease plasma T4
nd T3, possibly via direct thyroid cell effects, as well as by interfer-ng with deiodinase activity (Eales et al., 1999; Brown et al., 2004a;oldin et al., 2008). Future study of the relationship between metalontamination and thyroid endocrine function may be prompted byhese findings, possibly comparing fish populations from TOB andearby BDB, given their disparate thyroid endocrine phenotypics.
. Conclusion
In conclusion, this study identified significant alterations inhe thyroid endocrine system of two fish species in associa-ion with different environments in the San Francisco Bay Area.everal of the alterations were consistent between the speciess well as between two years of study. Differing patterns ofesponse in thyroid endocrine parameters suggested more thanne underlying mechanism of effect. Exposure to PCBs appears toe at least one possible cause of the thyroidal alterations, given
umerous correlations with hepatic PCB concentrations. Both AhR-nd non-AhR-mediated responses to PCBs were implicated, sinceoth co-planar and non-co-planar PCBs were significantly related.hlorinated pesticides, and possibly certain PAHs (acting via AhR-ediated mechanisms?), were also implicated in thyroid endocrinelogy 96 (2010) 203–215
alterations in the fish. We conclude that certain aquatic environ-ments in the San Francisco Bay Area are associated with significantalterations in fish thyroid endocrine status, which can be signifi-cantly related to current-day exposures to contaminant chemicalssuch as PCBs.
Conflict of interest
The authors declare that no conflict of interest exists that wouldprejudice the impartiality of this scientific work.
Acknowledgments
This work was supported by the Regional Monitoring Programfor Water Quality in the San Francisco Estuary, through the Expo-sure and Effects Pilot Studies (EEPS) Workgroup at the San FranciscoEstuary Institute (http://www.SFEI.org/rmp) and the Pacific CoastEnvironmental Conservancy (http://www.PCEConservancy.org).We thank the following persons for their valued contributions tothe work described in this report: Rich Gossett (CRG Laborato-ries, Torrance, CA) and A. Zed Mason (California State UniversityLong Beach) for their advice on the GC/MS; Meg Sedlak, Jay Davisand the EEPS Workgroup (San Francisco Estuary Institute, Oakland,CA) for advice on experimental design, and the following per-sons for assistance in the field work: Andrew Hamilton (CaliforniaState University Long Beach), Marco Sigala (Moss Landing MarineLaboratories), Seth Hanley and Mike Owen (Northern Arizona Uni-versity), Erich Dellinger (Huntington Beach, CA) and Connor Park(San Carlos, CA). We also thank Mario Espinoza and Rachel Poston(California State University Long Beach) for their help in generatingoriginal maps of the study locations.
References
Arukwe, A., Nordbø, B., 2008. Hepatic biotransformation response in Atlantic salmonexposed to retinoic acids and 3,3′ ,4,4′-tetrachlorobiphenyl (PCB congener 77).Comp. Biochem. Physiol. C: Toxicol. Pharmacol. 147, 470–482.
Adams, B.A., Cyr, D.G., Eales, J.G., 2000. Thyroid hormone deiodination in tissuesof American plaice, Hippoglossoides platessoides: characterization and short-term responses to polychlorinated biphenyls (PCBs) 77 and 126 (2000). Comp.Biochem. Physiol. C: Toxicol. Pharmacol. 127, 367–378.
Blanton, M.L., Specker, J.L., 2007. The hypothalamic–pituitary–thyroid (HPT) axis infish and its role in fish development and reproduction. Crit. Rev. Toxicol. 37,97–115.
Boas, M., Feldt-Rasmussen, U., Skakkebaek, N.E., Main, K.M., 2006. Environmentalchemicals and thyroid function. Eur. J. Endocrinol. 154, 599–611.
Brar, N.K., 2009. Evidence of thyroid endocrine disruption in shiner perch (Cymato-gaster aggregata) residing in San Francisco Bay. Master’s Thesis. California StateUniversity, Long Beach.
Brouwer, A., Morse, D.C., Lans, M.C., Schuur, A.G., Murk, A.J., Klasson-Wehler,E., Bergman, A., Visser, T.J., 1998. Interactions of persistent environmentalorganohalogens with the thyroid hormone system: mechanisms and possibleconsequences for animal and human health. Toxicol. Ind. Health 14, 59–84.
Brown, S.B., Adams, B.A., Cyr, D.G., Eales, G.J., 2004a. Contaminant effects on theteleost fish thyroid. Environ. Toxicol. Chem. 23, 1680–1701.
Brown, S.B., Evans, R.E., Vandenbyllardt, L., Finnson, K.W., Palace, V.P., Kane, A.S.,Yarenchewski, A.Y., Muir, D.C.G., 2004b. Altered thyroid status in lake trout(Salvelinus namaycush) exposed to co-planar 3,3′ ,4,4′ ,5-pentachlorobiphenyl.Aquat. Toxicol. 67, 75–85.
Buckman, A.H., Fish, A.T., Parrott, J.L., Soloman, K.R., Brown, S.B., 2007. PCBs candiminish the influence of temperature on thyroid indices in rainbow trout(Oncorhynchus mykiss). Aquat. Toxicol. 84, 366–378.
Burgin, D.E., Diliberto, J.J., Derr-Yellin, E.C., Kannan, N., Kodavanti, P.R.S., Birnbaum,L.S., 2001. Differential effects of two lots of Arochlor 1254 on enzyme induc-tion, thyroid hormones, and oxidative stress. Environ. Health Perspect. 109,1163–1168.
Coimbra, A.M., Reis-Henriques, M.A., Darras, V.M., 2005. Circulating thyroid hor-mone levels and iodothyronine deiodinase activities in Nile tilapia (Oreochromisniloticus) following dietary exposure to Endosulfan and Arochlor 1254. Comp.
Biochem. Physiol. C: Toxicol. Pharmacol. 141, 8–14.Crofton, K.M., 2008. Thyroid disrupting chemicals: mechanisms and mixtures. Int. J.Androl. 31, 209–223.
Daum, T., Lowe, S., Toia, R., Bartow, G., Fairey, R., Anderson, J., Jones, J., 2000. SedimentContamination in San Leandro Bay, CA. San Francisco Estuary Institute, p. 62http://www.sfei.org.
Toxico
D
D
E
E
F
F
G
G
G
G
H
H
I
J
K
K
K
K
L
L
M
O
O
P
large yellow croaker, Pseudosciaena crocea (Richardson). Gen. Comp. Endocrinol.
N.K. Brar et al. / Aquatic
avis, J.A., Hetzel, G., Oram, J.J., McKee, L.J., 2007. Polychlorinated biphenyls (PCBs)in San Francisco Bay. Environ. Res. 105, 67–86.
avis, J.A., Ross, J., Fairey, R., Roberts, C., Ichikawa, G., Negrey, J., Crane, D., 2004. Cis-net Technical Report: Contaminant Accumulation in Forage Fish. RMP TechnicalReport SFEI Contribution #413, SFEI, Oakland, CA (http://www.sfei.org).
ales, J.G., 2006. Modes of action and physiological effects of thyroid hormones infish. In: Reinecke, M., Zaccone, G., Kapoor, B.G. (Eds.), Fish Endocrinology, vol. 2.Science Publishers, Plymouth, UK, pp. 767–808.
ales, J.G., Brown, S.B., Cyr, D.G., Adams, B.A., Finnson, K.W., 1999. Deiodination asan index of chemical disruption of thyroid hormone homeostasis and thyroidalstatus in fish. In: Henshel, D.S., Black, M.C., Harrass, M.C. (Eds.), EnvironmentalToxicology and Environmental Assessment: Standardization of Biomarkers forEndocrine Disruption and Environmental Assessment. Am. Soc. Test. Mater. 8,pp. 136–164.
airey, R., Taberski, K., Lamerdin, S., Johnson, E., Clark, R.P., Downing, J.W., Newman,J., Petreas, M., 1997. Organochlorines and other environmental contaminants inmuscle tissues of sport fish collected from San Francisco Bay. Mar. Pollut. Bull.34, 1058–1071.
itch, J.E., Lavenberg, R.J., 1975. Tidepool and nearshore fishes of California. In: Cal-ifornia Natural History Guides: 38. Univ. California Press, Berkeley, 156 pp.
assel, M., Roberts, S., Brodberg, R., 2004. Tomales Bay Health Advi-sory: Results from the Coastal Fish Contamination Program. OEHHA(http://oehha.ca.gov/fish/pdf/tomalesbayexec.pdf).
auger, K.J., Giera, S., Sharlin, D.S., Bansal, R., Iannacone, E., Zooler, R.T., 2007. Poly-chlorinated biphenyls 105 and 118 form thyroid hormone receptor agonistsafter cytochrome P4501A1 activation in rat pituitary GH3 cells. Environ. HealthPerspect. 115, 1623–1630.
reenfield, B.K., Davis, J.A., Fairey, R., Roberts, C., Crane, D., Ichikawa, G., 2005. Sea-sonal, interannual, and long-term variation in sport fish contamination, SanFrancisco Bay. Sci. Total. Environ. 336, 25–43.
oldman, M., 1981. The effect of a single dose of DDT on thyroid function in malerats. Arch. Int. Pharmacodyn. Ther. 252, 327–334.
ansen, L.G., 1998. Stepping backward to improve assessment of PCB congenertoxicities. Environ. Health Perspect. 106 (Suppl.), 171–189.
unt, J., Davis, J., Greenfield, B., Melwani, A., Fairey, R., Sigala, M., Crane, D., Regal-ado, K., Bonnema, A., 2008. Contaminant Concentrations in Sportfish from SanFrancisco Bay-2006. SFEI Contribution #554. San Francisco Estuary Institute.
nui, Y., Yamano, K., Miwa, S., 1995. The role of thyroid hormone in tissue develop-ment in metamorphosing flounder. Aquaculture 135, 87–98.
ones, A.C., 1962. The biology of the euryhaline fish Leptocottus armatua armatusGirard (Cottidae). Univ. Calif. Publ. Zool. 67, 321–367.
ahn, M.A., Lichtensteiger, C.A., Faroon, O., Mumtaz, M., Schaffer, D.J., Hansen, L.G.,2002. The hypothalamo-pituitary-thryoid (HPT) axis: a target of nonpersistentortho-substituted PCB congeners. Toxicol. Sci. 65, 52–61.
laren, P.H.M., Wunderink, Y.S., Yúfera, M., Mancera, J.M., Flik, G., 2008. The thyroidgland and thyroid hormones in Senegalese sole (Solea senegalensis) during earlydevelopment and metamorphosis. Gen. Comp. Endocrinol. 155, 686–694.
obuke, L., Specker, J.L., Bern, H.A., 1987. Thyroxine content of eggs and larvae ofcoho salmon, Oncorhynchus kisutch. J. Exp. Zool. 242, 89–94.
ohn, M.C., Sewall, C.H., Lucier, G.W., Portier, C.J., 1996. A mechanistic model ofeffects of dioxin on thyroid hormones in the rat. Toxicol. Appl. Pharmacol. 136,29–48.
eatherland, J.F., 1989. Thyroid hormone content of eggs and early developmentalstages of five Oncorhynchus species. Can. J. Fish. Aquat. Sci 46, 2140–2145.
eRoy, K.D., Thomas, P., Khan, I.A., 2006. Thyroid hormone status of Atlantic croakerexposed to Aroclor 1254 and selected PCB congeners. Comp. Biochem. Physiol.Part C 144, 263–271.
orgado, I., Campinho, M.A., Costa, R., Jacinto, R., Power, D.M., 2009. Disruption ofthe thyroid system by diethylstilbestrol and ioxynil in the sea bream (Sparusauratus). Aquat. Toxicol. 92, 271–280.
ros, D.R., Hoover, D., Rodigari, F., Crane, D., Sericano, J., 2005. Levels and distributionof polybrominated diphenyl ethers in water, surface sediments, and bivalves
from the San Francisco Estuary. Environ. Sci. Technol. 39, 33–41.ros, D.R., Ross, J.R.M., Spies, R.B., Mumley, T., 2007. Polycyclic aromatic hydrocarbon(PAH) contamination in San Francisco Bay: a 10-year retrospective of monitoringin an urbanized estuary. Environ. Res. 105, 101–118.
icard-Aitken, M., Fournier, H., Pariseau, R., Marcogliese, D.J., Cyr, D.G., 2007. Thyroiddisruption in walleye (Sander vitreus) exposed to environmental contaminants:
logy 96 (2010) 203–215 215
cloning and use of iodothyronine deiodinases as molecular biomarkers. Aquat.Toxicol. 83, 200–211.
Picchietti, S., Belardinelli M., Taddei, A.R., Fausto, A.M., Pellegrino, M., Maggio,R., Rossi, M., Giorgi, F., 2009. Thyroid disruptor 1,1,1-trichloro-2,2-bis(p-chlorophenyl)ethane (DDT) prevents internalization of TSH receptor. Cell TissueRes. (Epub Ahead of Print).
Plohman, J.C., Dick, T.A., Eales, J.G., 2002. Thyroid of lake sturgeon, Acipenser ful-vescens. II. Deiodination properties, distribution, and effects of diet, growth,and a T3 challenge. Gen. Comp. Endocrinol. 125, 56–66.
Pocar, P., Klonisch, T., Brandsch, C., Eder, K., Frohlich, C., Hoang-Vu, C., Homback-Klonisch, S., 2006. AhR-agonist-induced transcriptional changes of genesinvolved in thyroid function in primary porcine thyrocytes. Toxicol. Sci. 89,408–414.
Power, D.M., Llewellyn, L., Faustino, M., Nowell, M.A., Bjornsson, B.T., Einarsdot-tir, L.E., Canario, A.V.M., Sweeney, G.E., 2001. Thyroid hormones in growth anddevelopment of fish. Comp. Biochem. Physiol. 130, 447–459.
Purkey, H.E., Palanathan, S.K., Kent, K.C., Smith, C., Safe, S.H., Sacchettini, J.C.,Kelly, J.W., 2004. Hydroxylated polychlorinated biphenyls selectively bindtransthyretin in blood and inhibit amyloidogenesis: rationalizing rat PCB toxic-ity. Chem. Biol. 11, 1719–1728.
Rossi, M., Dimida, A., Dell’anno, M.T., Trincavelli, M.L., Agretti, P., Giorgi, F., Corsini,G.U., Pinchera, A., Vitti, P., Tonacchera, M., Maggio, R., 2007. The thyroid disruptor1,1,1-trichloro-2,2-bis(p-chlorophenyl)-ethane appears to be an uncompeti-tive inverse agonist for the thyrotropin receptor. J. Pharmacol. Exp. Ther. 320,465–474.
Safe, S.H., 1994. Polychlorinated biphenyls (PCBs): environmental impact, biochemi-cal and toxic responses, and implications for risk management. Crit. Rev. Toxicol.24, 87–149.
San Francisco Estuary Institute (SFEI), 2008. The Pulse of the Estuary: Monitoringand Managing Water Quality in the San Francisco Estuary. SFEI Contribution559. San Francisco Estuary Institute, Oakland, CA (http://www.SFEI.org).
Schmid, A.C., Lutz, I., Kloas, W., Reinecke, M., 2003. Thyroid hormone stimulates hep-atic IGF-I mRNA expression in a bony fish, the tilapia Oreochromis mossambicus,in vitro and in vivo. Gen. Comp. Endocrinol. 130, 129–134.
Shiao, J.-C., Wang, P.-P., 2006. Thyroid hormones are necessary for the metamor-phosis of tarpon, Megalops cyprinoides leptocephalii. J. Exp. Mar. Biol. Ecol. 331,121–132.
Schnitzler, J.G., Koutrakis, E., Siebert, U., Thomé, J.P., Das, K., 2008. Effects of persistentorganic pollutants on the thyroid function of the European sea bass (Dicentrar-chus labrax) from the Aegean sea, is it an endocrine disruption? Mar. Pollut. Bull.56, 1755–1764.
Soldin, O.P, O’Mara, D.M., Aschner, A., 2008. Thyroid hormones and methylmercurytoxicity. Biol. Trace Elem. Res. 126, 1–12.
Teles, M., Oliveira, M., Pacheco, M., Santos, M.A., 2005. Endocrine and metabolicchanges in Anguilla anguilla L. following exposure to beta-naphthoflavone—amicrosomal enzyme inducer. Environ. Intl. 31, 99–104.
Ucán-Marín, F., Arukwe, A., Mortensen, A., Gabrielsen, G.W., Fox, G.A., Letcher, R.J.,2009. Recombinant transthyretin purification and competitive binding withorganohalogen compounds in to gull species (Larus argentatus and Larus hyper-boreus). Toxicol. Sci. 107, 440–450.
Van den Berg, E.H., Birnbaum, L., Bosveld, A.T.C., Brunstrom, B., Cook, P.,Feeley, M., Giesy, J.P., Hanberg, A., Hasegawa, R., Kennedy, S.W., Kubiak,T., Larsen, J.C., Van Leeuween, F.X., Leim, A.K., Nolt, C., Peterson, R.E.,Pollinger, L., Safe, S., Schlenk, D., Tillitt, D., Tysklund, M., Younes, M.,Waern, F., Zacharewski, T., 1988. Toxic equivalency factors (TEFs) for PCBs,PCDDs, PCDFs for humans and wildlife. Environ. Health Persp. 106, 775–792.
Yamano, K., 2005. The role of thyroid hormone in fish development with referenceto aquaculture. JARQ 39, 161–168.
Yang, X., Xie, J., Wu, T., Yue, G., Chen, J., Zhao, R., 2007. Hepatic and muscle expressionof thyroid hormone receptors in association with body and muscle growth in
151, 163–171.Zoeller, R.T., 2007. Environmental chemicals impacting the thyroid: targets and
consequences. Thyroid 17, 811–817.Zoeller, R.T., Tan, S.W., Tyl, R.W., 2007. General background on the hypothalamo-
pituitary-thryoid (HPT) axis. Crit. Rev. Toxicol. 37, 11–53.