Evidence for a major QTL associated with host response to porcine reproductive and respiratory...
16
J. C. M. Dekkers N. Boddicker, E. H. Waide, R. R. R. Rowland, J. K. Lunney, D. J. Garrick, J. M. Reecy and Respiratory Syndrome Virus challenge Evidence for a major QTL associated with host response to Porcine Reproductive and doi: 10.2527/jas.2011-4464 originally published online December 28, 2011 2012, 90:1733-1746. J ANIM SCI http://jas.fass.org/content/90/6/1733 the World Wide Web at: The online version of this article, along with updated information and services, is located on www.asas.org at Iowa State University Serials Acquitistion Dept on June 18, 2012 jas.fass.org Downloaded from
-
Upload
independent -
Category
Documents
-
view
0 -
download
0
Transcript of Evidence for a major QTL associated with host response to porcine reproductive and respiratory...

J. C. M. DekkersN. Boddicker, E. H. Waide, R. R. R. Rowland, J. K. Lunney, D. J. Garrick, J. M. Reecy and
Respiratory Syndrome Virus challengeEvidence for a major QTL associated with host response to Porcine Reproductive and
doi: 10.2527/jas.2011-4464 originally published online December 28, 20112012, 90:1733-1746.J ANIM SCI
http://jas.fass.org/content/90/6/1733the World Wide Web at:
The online version of this article, along with updated information and services, is located on
www.asas.org
at Iowa State University Serials Acquitistion Dept on June 18, 2012jas.fass.orgDownloaded from

1733
Evidence for a major QTL associated with host response to Porcine Reproductive and Respiratory Syndrome Virus challenge1
N. Boddicker,* E. H. Waide,* R. R. R. Rowland,† J. K. Lunney,‡ D. J. Garrick*,# J. M. Reecy,* and J. C. M. Dekkers*2
*Department of Animal Science, Iowa State University, Ames 50011; †College of Veterinary Medicine, Kansas State University, Manhattan 66506; ‡United State Department of Agriculture, Agricultural Research Services,
Beltsville Agricultural Research Center, Beltsville, MD 20705; and #Institute of Veterinary, Animal and Biomedical Sciences, Massey University, Palmerston North, New Zealand
1This project was supported by the USDA NIFA PRRS CAP Award 2008-55620-19132, the National Pork Board, and the NRSP-8 Swine Genome and Bioinformatics Coordination projects, and the PRRS Host Genetics Consortium consisting of USDA ARS, Kansas State University, Iowa State University, Michigan State University, Washington State University, Purdue University, University of Nebraska-Lincoln, PIC/Genus,Newsham Choice Genetics, Fast Genetics, Genetiporc, Inc., Genesus, Inc., PigGen Canada, Inc., IDEXX Laboratories and Tetracore, Inc. The authors acknowledge technical assis-tance from Juan Pedro Steibel for the algorithm to compute area under the curve; Max Rothschild for assistance with genotyp-
ing, Nader Deeb for assistance with data and analysis; Eric Fritz for database management; Anna Wolc and Dinesh Thekkoot for statistical assistance; the lab of Bob Rowland, specifically Becky Eaves, Maureen Kerrigan, Ben Trible, Jessica Otradovec, Brooke Bloomberg, Aubree Gottlob, Laura O’Brien, and Ranjini Chand for animal care and sample collection; and the lab of Joan Lunney, specifically Samuel Abrams and Amber Tietgens for preparation of all genomic DNA samples for SNP genotyping.
2Corresponding author:: [email protected] July 10, 2011.Accepted December 19, 2011.
© 2012 American Society of Animal Science. All rights reserved. J. Anim. Sci. 2012.90:1733–1746 doi:10.2527/jas2011-4464
Key words: genetic parameters, genomic regions, porcine, reproductive and respiratory syndrome, swine
ABSTRACT: Porcine reproductive and respiratory syndrome (PRRS) causes decreased reproductive per-formance in breeding animals and increased respiratory problems in growing animals, which result in signifi-cant economic losses in the swine industry. Vaccination has generally not been effective in the prevention of PRRS, partially because of the rapid mutation rate and evolution of the virus. The objective of the cur-rent study was to discover the genetic basis of host resistance or susceptibility to the PRRS virus through a genome-wide association study using data from the PRRS Host Genetics Consortium PRRS-CAP project. Three groups of approximately 190 commercial cross-bred pigs from 1 breeding company were infected with PRRS virus between 18 and 28 d of age. Blood samples and BW were collected up to 42 d post infection (DPI). Pigs were genotyped with the Illumina Porcine 60k Beadchip. Whole-genome analysis focused on viremia at each day blood was collected and BW gains from 0 to 21 DPI (WG21) or 42 DPI (WG42). Viral load (VL) was quantified as area under the curve from 0 to 21 DPI. Heritabilities for WG42 and VL were moderate at 0.30 and litter accounted for an additional 14% of phenotyp-ic variation. Genomic regions associated with VL were
found on chromosomes 4 and X and on 1, 4, 7, and 17 for WG42. The 1-Mb region identified on chromosome 4 influenced both WG and VL, exhibited strong link-age disequilibrium, and explained 15.7% of the genetic variance for VL and 11.2% for WG42. Despite a genetic correlation of −0.46 between VL and WG42, genomic EBV for this region were favorably and nearly perfectly correlated. The favorable allele for the most significant SNP in this region had a frequency of 0.16 and esti-mated allele substitution effects were significant (P < 0.01) for each group when the SNP was fitted as a fixed covariate in a model that included random polygenic effects with overall estimates of −4.1 units for VL (phe-notypic SD = 6.9) and 2.0 kg (phenotypic SD = 3 kg) for WG42. Candidate genes in this region on SSC4 include the interferon induced guanylate-binding protein gene family. In conclusion, host response to experimental PRRS virus challenge has a strong genetic component, and a QTL on chromosome 4 explains a substantial proportion of the genetic variance in the studied popu-lation. These results could have a major impact in the swine industry by enabling marker-assisted selection to reduce the impact of PRRS but need to be validated in additional populations.
at Iowa State University Serials Acquitistion Dept on June 18, 2012jas.fass.orgDownloaded from

Boddicker et al.1734
INTRODUCTION
Porcine reproductive and respiratory syndrome (PRRS) is caused by a single-stranded RNA virus of the genus Arterivirus (Wensvoort et al. 1991; Benfield et al., 1992) and is currently the most economically important disease for the United States swine industry (Neumann et al., 2005). Porcine reproductive and respiratory syndrome causes reproductive problems in breeding animals and re-spiratory problems and reduced performance in growing animals. Vaccination for protection against PRRS virus (PRRSV) has generally been unsuccessful, primarily be-cause of the high degree of antigenic and genetic drift in viral structural and non-structural viral proteins and the ca-pacity of the virus to subvert early innate immune responses (Fang et al., 2007; Mateu and Diaz, 2008; Kinman et al., 2009). Methods other than vaccination must be explored to aid in this pandemic; one possibility is genetic improvement of the host (Lewis et al., 2007). Early work investigating a host genetic component to resistance to PRRS revealed significantly more gross lung lesions in PRRS-infected Hampshire pigs than in Duroc and Meishan pigs (Halbur et al., 1998). Petry et al. (2005) found that a Large White/Landrace synthetic line had reduced rectal temperatures and decreased viremia when infected with PRRSV compared with a Hampshire/Duroc synthetic line. Petry et al. (2007) found that, pre-infection, PRRS resistant pigs exhibited greater concentrations of serum interleukin-8.
Estimates of heritability of PRRS resistance are scarce, but estimates for number born alive, number stillborn, and number of mummies in sows infected with PRRSV ranged from 0.12 to 0.15 (Lewis et al., 2009b). The PRRS Host Genetics Consortium was established to investigate the genetic basis of host response to PRRSV infection in ex-perimentally infected commercial crossbred pigs (Lunney et al., 2011). The objective of the current study was to use data from the first 3 infection trials from this consortium to estimate genetic parameters and to conduct a genome-wide association study (GWAS) to discover the genetic basis of host response to the PRRSV.
MATERIALS AND METHODS
The Kansas State University Institutional Animal Care and Use Committee approved all experimental pro-tocols for this study.
Study Design
A general overview of the design, data collection and molecular techniques for the PRRS host genetic consor-tium trials is in Lunney et al. (2011). Briefly, for the data used in this study, 3 groups of approximately 190 com-mercial crossbred barrows from 1 genetic source were
transported at weaning (11 to 21 d of age) to Kansas State University and subjected to a PRRS challenge in 3 sepa-rate infection trials. The pigs were from 2 high health farms that were free of PRRSV, Mycoplasma hyopneu-moniae, and swine influenza virus. Pigs from trials 1 and 2 came from 1 farm, and pigs from trial 3 came from the other farm. Upon arrival, pigs were randomly placed into pens of 10 to 15 pigs. After a 7-d acclimation period, pigs now between 18 and 28 d of age (d 0), were experimen-tally infected intramuscularly and intranasally with 105 tis-sue culture infectious dose50 of NVSL 97-7985, a highly virulent PRRSV isolate (Fang et al., 2007). Blood samples were collected at −6, 0, 4, 7, 11, 14, 21, 28, 35, and 42 d post infection (DPI). Body weight was collected at 0, 7, 14, 21, 28, 35, and 42 DPI. Pigs were euthanized at 42 DPI.
Viremia was measured using a semi-quantitative TaqMan PCR assay for PRRSV RNA. The PCR was per-formed as a routine diagnostic test by personnel of the Kansas Veterinary Diagnostic Laboratory (KSVDL). Briefly, total RNA was isolated from serum using a MagMAX-96 Viral RNA Isolation Kit (Applied Biosystems, Foster City, CA) in accordance with the manufacturer’s instructions. The PCR master mixes were obtained from the AgPath ID NA & EU PRRSV kit (Applied Biosystems) and assays were set up as a 1-step reverse transcriptase (RT)-PCR reac-tion, according to kit instructions. The RT-PCR reactions were carried out on a QST 7500 Real-Time PCR System (Applied Biosystems) in a 96-well format according to the manufacturer’s recommendations. For the construction of a standard curve, dilutions of a template RNA, supplied in the Applied Biosystems RT-PCR kit, were prepared and as-sayed along with the samples. The assay results were re-ported as the Log10 of PRRSV RNA copies per reaction relative to the standard curve. Note that resulting values do not directly quantify the absolute amount of virus in the sample, but, by comparing to the standard curves based on template RNA run on the same plate, the values do re-flect quantitative differences in viremia between samples, which were needed for the purposes of this study. Because of the sensitivity of PCR, values that were less than 10 units before log-transformation were assumed to have neg-ligible amounts of virus in the serum relative to the stan-dard and were given a value of 1, corresponding to a log-transformed value of 0. For DNA isolation, ear tissue was collected pre-infection or at sacrifice. Genomic DNA was prepared with Qiagen DNeasy Blood and Tissue Kit from 20 mg ear tissue after overnight digestion at 56°C with pro-teinase K. Quantity of DNA was evaluated by a NanoDrop Spectrophotometer and quality was assured by sizing on agarose gels. Arrayed DNA samples were sent to GeneSeek Inc. (Lincoln, NE) for genotyping with Illumina’s Porcine SNP60 BeadChip (San Diego, CA).
In total, data for 570 pigs infected with PRRSV, pri-marily from Landrace by Large White crosses (n = 565)
at Iowa State University Serials Acquitistion Dept on June 18, 2012jas.fass.orgDownloaded from

GWAS for PRRS response 1735
were evaluated; the 5 piglets from other crosses were ex-cluded from analyses. The 565 pigs included in analyses came from 208 litters and 30 sires. Pigs per litter ranged from 1 to 6 and pigs per sire from 3 to 93. A total of 48 pigs died before 42 DPI. Dead pigs were necropsied and gross and microscopic pathology was performed by a board-certified pathologist. The major reason for mortal-ity was from PRRS-associated disease.
Phenotypic Traits
Traits evaluated in this study included RT-PCR based serum viremia levels up to and including 21 DPI and 3 mea-sures of BW gain (WG). Viremia past 21 DPI was not ana-lyzed because the viremia levels rebounded past 21 DPI in approximately 33% of the pigs (Figure 1). The estimate of heritability for rebound, as a 0/1 trait, was low (0.03), sug-gesting that rebound was related to the virus or environment rather than genetics of the host. Viral load (VL) was quanti-
Figure 1. Raw phenotypic data of n~190 pigs infected with porcine reproductive and respiratory syndrome virus from trial 2 of BW (A) and log-trans-formed viremia (B) over 42 d post infection. Graphs for trials 1 and 3 were similar.
at Iowa State University Serials Acquitistion Dept on June 18, 2012jas.fass.orgDownloaded from

Boddicker et al.1736
fied as area under the curve for log-transformed viremia for 0, 4, 7, 11, 14, and 21 DPI. Viral load was calculated for each animal that had viremia records on d 0 and at least 5 other days. The algorithm to compute VL fitted a smooth curve over the 21 d and summed the area in increments of 0.01 units. Edits removed 34 animals from the analysis, in-cluding 22 that died before 21 DPI, 8 with missing viremia records at 0 DPI, 1 that was not genotyped, and 3 that had missing dam-parity information. Animals that died before 21 DPI were removed from the analyses, rather than relying on extrapolation to 21 DPI to estimate VL. Total WG was calculated as BW at d 42 minus BW at d 0 (WG42), BW gain from 0 to 21 DPI (WG21), and BW gain from 21 to 42 DPI. For the WG21 analysis, 22 animals that died before 21 DPI were excluded, and 44 animals that died before 42 DPI were excluded for WG42 and for WG from 21 to 42 DPI. All WG analyses exclude the 3 animals that had miss-ing parity information and 1 that was not genotyped. The number of individuals available for each trait after edits is in Table 1.
Statistical Analyses
Heritabilities and maternal effects were estimated on the basis of 3 generation-pedigree relationships, using a single-trait animal model in ASREML (Gilmour et al., 2006), with the interaction of trial and parity of dam as a fixed factor and pen within trial, animal and litter as ran-dom factors. Piglets were born from parities ranging from 1 to 6. Parities 3 through 6 were combined into one parity class. Pair-wise genetic correlations between traits were es-timated using bivariate animal models with the same fixed and random factors as used in the single-trait models.
Genome-wide Association Study
Associations of SNP genotypes with phenotypes were analyzed by fitting all SNP simultaneously using Bayesian genomic selection methods (Habier et al., 2011),
as implemented in the 3.04 version of the software GenSel (Fernando and Garrick, 2009). After removal of monomor-phic SNP, 56,118 SNP remained. Genotypes were coded 0/1/2. Any missing genotype at a locus was replaced with the trial specific mean genotype for that SNP. The follow-ing mixed model was used to determine associations of SNP with phenotypes:
where y = vector of phenotypic observations, X = incidence matrix relating fixed factors to phenotypes, b = vector of fixed factors of pen within trial and the interaction of trial and parity class, zi = vector of the genotype covariate for SNP i (coded 0, 1, 2, or average for missing genotypes), αi = allele substitution effect for SNP i, and δi = indicator for whether SNP i was included (δi = 1) or excluded (δi = 0) in the model for a given iteration of the Monte Carlo Markov Chain. The prior probability of δi = 0 was set equal to p = 0.99. The Bayesian model was implemented using methods Bayes-B and Bayes-C (Habier et al. 2011). These methods differ in the assumed distribution for the variance of non-0 allele substitution effects; Bayes-C assumes that non-zero SNP effects are from a single distribution, whereas Bayes-B assumes that each SNP has its own variance. Both meth-ods combine prior information with the data, but Bayes-B is more dependent on the prior than Bayes-C because the vari-ance for each locus must be estimated from the information for that locus alone, whereas Bayes-C estimates a single variance for all non-zero SNP effects from the joint analy-sis of all SNP. Method Bayes-B is preferred if SNP with both large and small effects are present, although estimates from the 2 methods are expected to converge as the number of animals available for analysis increases. Total genomic EBV (GEBV) were computed by summing the product of the genotype covariate and the estimate of the SNP effect across all evaluated SNP for each individual. Genomic re-gions associated with traits were identified using windows
Table 1. Means and estimates (±SE) of heritability and variance components (proportions of phenotypic variance) for viremia and BW gain after infectionTrait1 n Mean SD Heritability Litter Pen(trial) ResidualViremia 4 DPI2 561 5.9 0.55 0.16 ± 0.13 0.17 ± 0.07 0.03 ± 0.02 0.63 ± 0.10Viremia 7 DPI2 554 6.4 0.38 0.02 ± 0.09 0.31 ± 0.06 0.06 ± 0.03 0.61 ± 0.07Viremia 11 DPI2 547 6.1 0.45 0.28 ± 0.17 0.23 ± 0.08 0.03 ± 0.02 0.46 ± 0.12Viremia 14 DPI2 545 5.5 0.74 0.26 ± 0.16 0.21 ± 0.08 0.02 ± 0.02 0.52 ± 0.12Viremia 21 DPI2 494 3.8 1.14 0.09 ± 0.12 0.03 ± 0.06 0.00 ± 0.00 0.88 ± 0.09VL 531 103 10 0.31 ± 0.18 0.14 ± 0.08 0.01 ± 0.02 0.54 ± 0.13WG21, kg 539 4.6 2.25 0.30 ± 0.11 0.00 ± 0.00 0.05 ± 0.03 0.65 ± 0.11WG42, kg 517 13.4 4.48 0.30 ± 0.18 0.14 ± 0.08 0.00 ± 0.00 0.56 ± 0.13
1 DPI = day post infection, WG21 = BW gain from 0 DPI to 21 DPI, WG42 = BW gain from 0 DPI to 42 DPI, and VL = viral load calculated as area under the curve of log-transformed viremia between 0 and 21 DPI.
2 Log10 Templates/Reaction.
at Iowa State University Serials Acquitistion Dept on June 18, 2012jas.fass.orgDownloaded from

GWAS for PRRS response 1737
of 5 consecutive SNP based on build 10 of the swine ge-nome (http://www.ncbi.nlm.nih.gov/genome/guide/pig/, accessed March 24, 2012). For each individual animal and each 5-SNP window, the posterior means of the relevant SNP effects were multiplied by their corresponding geno-type covariates and then summed to compute the window GEBV of each individual. The variance of these window GEBV across individuals, expressed as a proportion of the variance of the total GEBV across individuals, was used to identify genomic regions that were most strongly associated with phenotype.
Version 3.04 of the GenSel software does not allow additional independent random effects such as litter to be fitted. Thus, to evaluate the potential impact of litter effects on SNP associations, 2 additional analyses were conducted in which 1) phenotypes were preadjusted for estimates of litter effects obtained from the ASREML analyses described previously, and 2) litter was included as an additional fixed factor.
Further Analysis of Specific SNP
Specific SNP identified in the genome-wide analyses as contributing the largest fraction of GEBV variance were further evaluated by including the SNP genotype as a fixed factor in the ASREML analyses described previously. The SNP genotype was either included as a covariate, to esti-mate allele substitution effects, or as a class variable, to sep-arately estimate additive and dominance effects. To evaluate the consistency of SNP effects across trials, SNP genotype by trial was included as a fixed factor in these analyses. The associations of specific SNP identified in the Bayesian analyses were re-analyzed using several approaches for es-timating the variance explained by the SNP: 1) the variance in whole-genome GEBV explained by the SNP, 2) 2pq
�
α^
2, where
�
α^
is the posterior mean of the estimated allele sub-stitution effect for the SNP, and 3) the reduction in genetic variance when including the most significant SNP as a fixed factor in the ASREML analysis of phenotypes. Haplotypes
for all animals for a specific region were determined using PHASE (Stephens et al., 2001).
RESULTS
Phenotypic Data and Correlations
Individual BW and log-transformed viremia over time are presented in Figure 1 for trial 2; results for trials 1 and 3 were similar. Raw means and SD of traits are in Table 1. On average, BW and its variance increased with time (Figure 1A). The observed variation in BW after in-fection was greater than typically observed for uninfected pigs. The raw mean and SD of BW at 42 DPI across the 3 trials were 20.2 and 5.0 kg, giving a CV of 25%, whereas uninfected littermates (n = 551) raised at the breeding company that provided the pigs had a BW mean and SD at about 70 d of age of 29.2 and 3.8 kg, resulting in a CV of only 13%.
Viremia had increased by 4 DPI for all pigs, with peak viremia by 11 DPI (Figure 1B). After 11 DPI, viremia declined for most animals and by 21 DPI, some animals had cleared the circulating virus, some still had declining viremia levels, while others exhibited natural rebound of the PRRSV. Because of the large variation in viremia af-ter 21 DPI, which was confounded by rebound, analyses focused on viremia up to 21 DPI.
The interaction of trial and parity was significant for both traits (P < 0.01), so the effects of parity were signifi-cant but not consistent across trials. Specifically, pigs from parity 1 sows had greater WG and less VL in trials 1 and 2, compared with pigs from parity 2 and 3 sows, but less WG and greater VL in trial 3. Pigs from parity 1 sows gained 13.3, 16.3, and 11.2 kg for trials 1, 2, and 3, and pigs from parity 3 sows gained 12.2, 14.3, and 13.8 kg to 42 DPI. For VL, pigs from parity 1 sows had 96, 100, and 111 units for trials 1, 2, and 3 compared with 99, 104, and 107 units for pigs from parity 3.
Table 2. Estimates of phenotypic (above diagonal) and genetic (below diagonal) correlations based on bivariate analyses of viremia and BW gain following infectionTrait1 4 DPI 7 DPI 11 DPI 14 DPI 21 DPI VL WG21, kg WG42, kgViremia 4 DPI2 - 0.43 ± 0.03 0.06 ± 0.04 0.01 ± 0.04 0.02 ± 0.05 0.34 ± 0.04 −0.15 ± 0.04 −0.13 ± 0.04Viremia 7 DPI2 −0.58 ± 3.4 - 0.04 ± 0.04 0.19 ± 0.04 0.05 ± 0.05 0.38 ± 0.04 −0.21 ± 0.04 −0.19 ± 0.04Viremia 11 DPI2 −0.02 ± 0.52 0.68 ± 1.6 - 0.62 ± 0.03 0.29 ± 0.04 0.59 ± 0.03 −0.09 ± 0.04 −0.17 ± 0.04Viremia 14 DPI2 0.10 ± 0.53 0.85 ± 1.4 0.90 ± 1.3 - 0.42 ± 0.04 0.60 ± 0.03 −0.34 ± 0.04 −0.36 ± 0.04Viremia 21 DPI2 0.08 ± 0.70 0.81 ± 3.2 0.99 ± 0.35 0.94 ± 0.52 - 0.56 ± 0.03 −0.24 ± 0.04 −0.28 ± 0.04VL 0.23 ± 0.47 0.27 ± 1.6 0.98 ± 0.08 0.95 ± 0.08 0.99 ± 0.11 - −0.22 ± 0.04 −0.25 ± 0.04WG21, kg −0.99 ± 0.89 −0.22 ± 1.1 −0.44 ± 0.38 −0.42 ± 0.37 −0.40 ± 0.64 −0.54 ± 0.32 - 0.78 ± 0.02WG42, kg −0.26 ± 0.51 −0.07 ± 1.5 −0.51 ± 0.35 −0.54 ± 0.33 −0.19 ± 0.76 −0.46 ± 0.35 0.99 ± 0.06 -
1 DPI = day post infection, WG21 = BW gain from 0 to 21 DPI, WG42 = BW gain from 0 to 42 DPI, and VL = viral load calculated as area under the curve of log-transformed viremia between 0 and 21 DPI.
2 Log10 Templates/Reaction.
at Iowa State University Serials Acquitistion Dept on June 18, 2012jas.fass.orgDownloaded from
Boddicker et al.1738
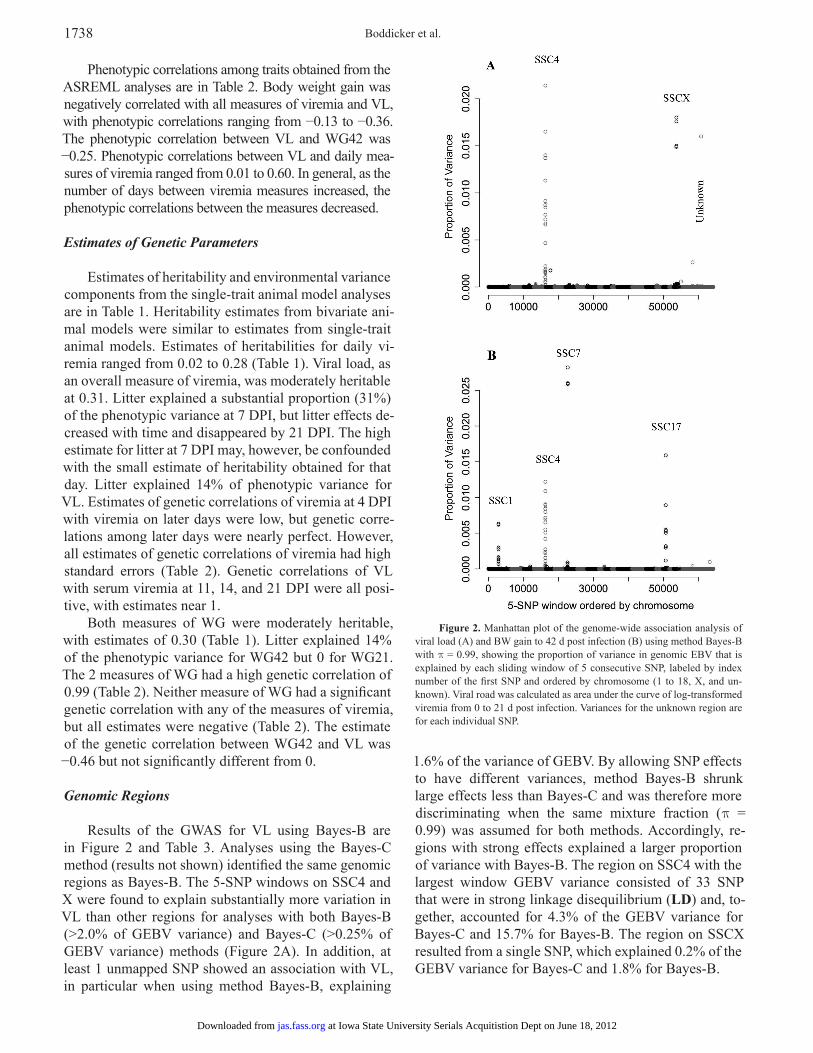
Phenotypic correlations among traits obtained from the ASREML analyses are in Table 2. Body weight gain was negatively correlated with all measures of viremia and VL, with phenotypic correlations ranging from −0.13 to −0.36. The phenotypic correlation between VL and WG42 was −0.25. Phenotypic correlations between VL and daily mea-sures of viremia ranged from 0.01 to 0.60. In general, as the number of days between viremia measures increased, the phenotypic correlations between the measures decreased.
Estimates of Genetic Parameters
Estimates of heritability and environmental variance components from the single-trait animal model analyses are in Table 1. Heritability estimates from bivariate ani-mal models were similar to estimates from single-trait animal models. Estimates of heritabilities for daily vi-remia ranged from 0.02 to 0.28 (Table 1). Viral load, as an overall measure of viremia, was moderately heritable at 0.31. Litter explained a substantial proportion (31%) of the phenotypic variance at 7 DPI, but litter effects de-creased with time and disappeared by 21 DPI. The high estimate for litter at 7 DPI may, however, be confounded with the small estimate of heritability obtained for that day. Litter explained 14% of phenotypic variance for VL. Estimates of genetic correlations of viremia at 4 DPI with viremia on later days were low, but genetic corre-lations among later days were nearly perfect. However, all estimates of genetic correlations of viremia had high standard errors (Table 2). Genetic correlations of VL with serum viremia at 11, 14, and 21 DPI were all posi-tive, with estimates near 1.
Both measures of WG were moderately heritable, with estimates of 0.30 (Table 1). Litter explained 14% of the phenotypic variance for WG42 but 0 for WG21. The 2 measures of WG had a high genetic correlation of 0.99 (Table 2). Neither measure of WG had a significant genetic correlation with any of the measures of viremia, but all estimates were negative (Table 2). The estimate of the genetic correlation between WG42 and VL was −0.46 but not significantly different from 0.
Genomic Regions
Results of the GWAS for VL using Bayes-B are in Figure 2 and Table 3. Analyses using the Bayes-C method (results not shown) identified the same genomic regions as Bayes-B. The 5-SNP windows on SSC4 and X were found to explain substantially more variation in VL than other regions for analyses with both Bayes-B (>2.0% of GEBV variance) and Bayes-C (>0.25% of GEBV variance) methods (Figure 2A). In addition, at least 1 unmapped SNP showed an association with VL, in particular when using method Bayes-B, explaining
1.6% of the variance of GEBV. By allowing SNP effects to have different variances, method Bayes-B shrunk large effects less than Bayes-C and was therefore more discriminating when the same mixture fraction (p = 0.99) was assumed for both methods. Accordingly, re-gions with strong effects explained a larger proportion of variance with Bayes-B. The region on SSC4 with the largest window GEBV variance consisted of 33 SNP that were in strong linkage disequilibrium (LD) and, to-gether, accounted for 4.3% of the GEBV variance for Bayes-C and 15.7% for Bayes-B. The region on SSCX resulted from a single SNP, which explained 0.2% of the GEBV variance for Bayes-C and 1.8% for Bayes-B.
Figure 2. Manhattan plot of the genome-wide association analysis of viral load (A) and BW gain to 42 d post infection (B) using method Bayes-B with p = 0.99, showing the proportion of variance in genomic EBV that is explained by each sliding window of 5 consecutive SNP, labeled by index number of the first SNP and ordered by chromosome (1 to 18, X, and un-known). Viral road was calculated as area under the curve of log-transformed viremia from 0 to 21 d post infection. Variances for the unknown region are for each individual SNP.
at Iowa State University Serials Acquitistion Dept on June 18, 2012jas.fass.orgDownloaded from

GWAS for PRRS response 1739
Viral load is a summary statistic quantified as area under the curve of log-transformed viremia at 0, 4, 7, 11, 14, and 21 DPI. Therefore, the regions identified for VL must result from associations with viremia on individual days. The region on SSC4 for VL was apparent for all days on which viremia was measured. Using Bayes-B, the proportion of the GEBV variance explained by the 33-SNP region was greatest at 11 and 14 DPI, with es-timates of 9.8 and 4.5%, respectively (Table 4). The correlations among the 33-SNP GEBV for viremia at 4, 7, 11, 14, 21 DPI, and with the GEBV for VL were all positive and nearly perfect (r > 0.99, results not shown). However, the covariance with the GEBV for VL was greatest for viremia at 11 and 14 DPI (Table 4), indicat-ing that viremia on these days is primarily responsible for the observed effect of this 33-SNP window on VL. The association on SSCX with VL was also found for viremia on d 4, 7, 11, 14, and 21 (results not shown), but the proportion of the GEBV variance explained by the 5-SNP region was greatest at 14 and 21 DPI, with a Bayes-B estimate of 0.02% for both DPI.
All piglets used in this study were barrows; there-fore, effects on the X chromosome could only come from the dam. When litter was included as a fixed factor in the GenSel analysis, the effects of all regions were reduced for all traits; however, the effect of the region on the X chromosome for VL was reduced the greatest (results not shown). For example, the peak proportion of GEBV variance for VL was reduced nearly 10-fold when phenotypes were pre-adjusted for estimated dam effects from the ASREML analysis and nearly 100-fold when dam was fitted as a fixed factor.
Results of the GWAS for WG42 are in Figure 2B and Table 3. Using both methods Bayes-B and -C, re-gions on SSC 1, 4, 7, and 17 were found to be associated with WG42. These same regions were also associated with WG21, with the exception of SSC17 (results not
shown). A region on SSC16 was associated with WG21 but not with WG42. The region on SSC4 was the same as that identified for VL, and the proportion of GEBV variance explained by the 33-SNP window was 11.2% and 1.7% for Bayes-B and -C, respectively.
Detailed Analysis of the Region on SSC4
The region on SSC4 that was associated with VL and WG42 consisted of 33 consecutive SNP that spanned 1 Mb of DNA based on build 10. The SNP in this re-gion were in very strong LD; 6 SNP (MARC0056249, WUR10000125, ALGA0029524, ASGA0023344, ASGA0023349, and ALGA0029538) were in perfect LD (r2 = 1), and each of these explained 99.3% of the variance of the GEBV for the 33-SNP region. Figure 3 presents a scatter plot of the 33-SNP window GEBV from Bayes-B for VL against those for WG42 (similar results for WG21, data not shown) grouped by genotype for 1 of these 6 SNP, WUR10000125. When fitting all SNP simultaneously, as in the Bayesian analyses, the ef-fects in this region were distributed across all SNP in the region. The grouping of window GEBV by genotype for SNP WUR10000125, however, shows that most of the effects from this region were captured by this SNP. To further quantify this, the window GEBV were regressed on the genotype covariate for this SNP (0/1/2). Results showed that SNP WUR10000125 captured 99.4% of the variation in the window GEBV for VL and 99.3% of the variation for WG42. Figure 3 also shows that the GEBV for VL and WG for this region were nearly perfectly
Table 3. Percentage of genetic variance explained by chromosomal regions that are associated with viral load and BW gain to 42 d post infection (DPI) determined on the basis of method Bayes-B
Trait SSC 1st Marker Last Marker
Number of
Markers
% of total
genetic variance
Viral load1 4 ALGA0029502 MARC0040196 33 15.7X ASGA0081159 ASGA0081159 1 1.8
BW gain2 1 ALGA0005548 INRA0003832 18 2.14 ALGA0029502 MARC0040196 33 11.27 MARC0082535 MARC0082535 1 2.617 ALGA0094184 ASGA0076123 8 1.0
1 Viral load calculated as area under the curve of log-transformed viremia between 0 and 21 DPI.
2 BW gain to 42 DPI.
Table 4. Variance of genomic EBV (GEBV; based on method Bayes-B) for the whole genome (60k SNP) and for the 33-SNP region on chromosome 4 for viremia fol-lowing infection, along with the percentage of GEBV variance accounted for by the 33-SNP region and the covariance between GEBV for viremia on each day with GEBV for viral load for the whole genome and the 33-SNP window
Trait1
Variance of GEBV for trait explained by
33-SNP window
Covariance of 33-SNP GEBV for trait
with GEBV for VL
Variance
% of 60k GEBV
variance Covariance
% of 60k GEBV
covarianceViremia 4 DPI2 0.00081 1.12 0.05 10.5Viremia 7 DPI2 0.00014 0.74 0.02 7.9Viremia 11 DPI2 0.00691 9.79 0.15 15.5Viremia 14 DPI2 0.00623 4.48 0.13 10.0Viremia 21 DPI2 0.00011 0.15 0.02 2.2VL 3.12 15.7 - -
1 DPI = day post infection and VL = viral load calculated as area under the curve of log-transformed viremia between 0 and 21 DPI.
2 Log10 Templates/Reaction.
at Iowa State University Serials Acquitistion Dept on June 18, 2012jas.fass.orgDownloaded from

Boddicker et al.1740
correlated (r = −0.9995). Using the Illumina A/B calling nomenclature for SNP WUR10000125, the homozygous BB genotype is desirable and the homozygous AA geno-type is undesirable. The frequencies of the desirable BB genotype and of allele B were reduced, at 2.7 and 16.1%.
To further investigate the effect of this region, SNP WUR10000125 was fitted as a fixed factor in the pre-viously described ASREML analyses of phenotype. The allele substitution effect was highly significant in these analyses for both VL (P < 0.0001) and WG42 (P < 0.0001). For comparison to the estimates from the Bayesian analyses, allele substitution effects for this SNP were also estimated by analyzing the whole-ge-nome GEBV obtained from the Bayes-B and Bayes-C analyses using the same model in ASREML. The analy-sis of GEBV from Bayes-B resulted in a very similar allele substitution effect estimate for VL, compared with the analysis of phenotype (−4.12 vs. −4.10) but a slightly smaller estimate for WG42 (1.82 vs. 2.00 kg).
Inclusion of SNP genotype as a fixed class effect re-sulted in highly significant P-values of <0.0001 for both VL and WG42. The significant class effect reflected dif-ferences between genotypes AA and AB, with genotype BB not significantly (P > 0.67) different from the AB genotype. Results showed some indication of domi-nance (Figure 4), but this needs further investigation, as the number of individuals with genotype BB was small. Inclusion of the SNP as a fixed factor reduced the esti-mate of heritability substantially, from 0.31 to 0.24 for VL and from 0.30 to 0.18 for WG, and the variance com-ponent for litter expressed as a proportion of phenotypic variance remained at 14% for both traits.
The effect of SNP genotype was also included as an interaction with trial to investigate the consistency
of estimates across trials. The interaction was not sig-nificant for either trait (P > 0.52), and estimates of allele substitution and genotype effects were consistent across trials for both VL and WG (Figure 4). In all 3 trials, pigs with the AA genotype had significantly (P < 0.0001) less WG and greater VL than pigs of the AB genotype. Least square means for the BB genotype were more variable because of small numbers.
The effect of SNP WUR10000125 was also quanti-fied for WG21 and for WG from 21 DPI to 42 DPI to evaluate whether the effect on WG42 originated from growth up to or beyond 21 DPI or from both periods. The allele substitution effect was highly significant for both traits (P < 0.0001), with estimates of 1.0 kg for WG21 and 1.4 kg for WG from 21 DPI to 42 DPI.
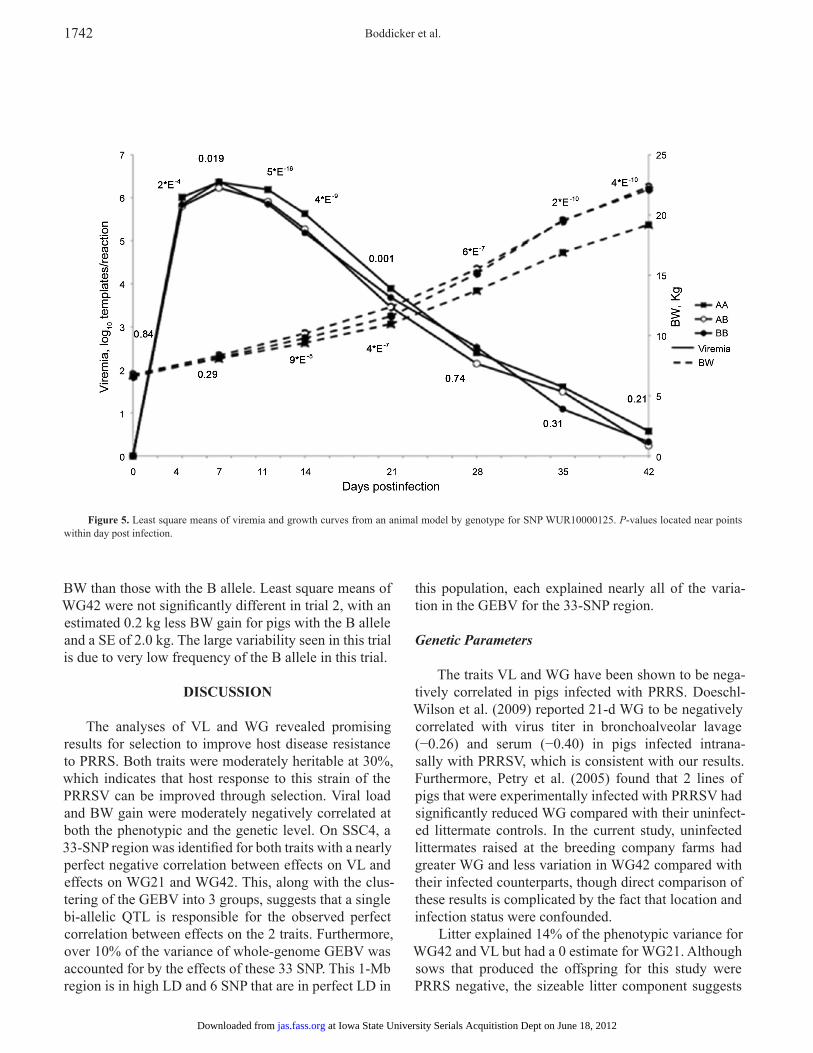
Daily viremia levels and BW were analyzed by geno-type for SNP WUR10000125 to investigate the impact of the 33-SNP region on viremia and growth curves. Figure 5 shows the resulting LS means by genotype with their associated P-values. The effect of the SNP was significant at P < 0.05 for 4, 7, 11, 14, and 21 DPI, with P-values <5 ´ 10−16 and <4 ́ 10−9 at 11 and 14 DPI, respectively. On the basis of LS means, the AB and BB genotypes were more similar at 11 and 14 DPI, with a possible dominance effect. Thus, much of the effect of the SNP in VL was driven by viremia at 11 and 14 DPI. Furthermore, SNP genotype was not significant (P > 0.21) after 21 DPI when rebound was occurring. For WG, there was no difference in BW between the 3 genotype classes through 7 DPI (P > 0.29). Starting at 14 DPI, the SNP was significant (P < 9 ´ 10−5) and the AB genotype diverged from the AA geno-type, with the difference increasing throughout the trial. The P-value of the SNP for BW at 42 DPI was highly sig-nificant at 2 ´ 10−10. On the basis of small numbers, pigs
Figure 3. Scatter plot of genomic estimated breeding values from method Bayes-B for the 33-SNP window on SSC4 for BW gain from 0 to 42 d post infec-tion and viral load, calculated as area under the curve of log-transformed viremia from 0 to 21 d post infection. Pigs grouped by genotype at SNP WUR10000125.
at Iowa State University Serials Acquitistion Dept on June 18, 2012jas.fass.orgDownloaded from

GWAS for PRRS response 1741
with the BB genotype had similar BW to the AB genotype at 28 DPI and beyond.
Haplotypes for all animals for the 33 SNP region were determined using the software program PHASE (Stephens et al., 2001). Using all 33 SNP as a haplo-type block, 34 different haplotypes were identified in this population. Of the 34 haplotypes, 13 accounted for approximately 95% of observations and 12 of the 14 in-dividuals with the BB genotype for SNP WUR10000125 were homozygous for the same haplotype. The other 2 individuals had heterozygous haplotypes, with 1 indi-vidual having 1 copy of the common haplotype and 1 haplotype that differed from it at 7 SNP. The other indi-vidual had 1 haplotype that differed from the common haplotype at 7 SNP and the other at 8 SNP.
Detailed Analysis of the Region on SSCX
The single SNP on SSCX (ASGA0081159) that was associated with VL and WG was also fitted as a fixed factor in the previously described ASREML analyses of phenotype. There were no heterozygous genotypes at this locus because all individuals were barrows. Estimates of
genotype effects and allele substitution effects for this SNP on VL and WG42 are in Figure 4. Inclusion of the SNP genotype resulted in a P-value <0.0001 for VL. The region on SSCX did not show strong associations with WG42 using methods Bayes-B or Bayes-C (Figure 2B), but the ASREML analysis showed a significant associa-tion of the SNP with WG42 (P < 0.002). These differenc-es between methods may be the result of the low minor al-lele frequency of this SNP (0.13) or partial LD of the QTL with other SNP. Estimates of heritability were reduced with the inclusion of SNP ASGA0081159 as a fixed factor, from 0.31 to 0.24 for VL and from 0.30 to 0.22 for WG42. The variance component for litter was reduced from 0.14 to 0.10 for VL but was unaffected for WG42.
Estimates of genotype effects for SNP ASGA0081159 were consistent across trials for VL (Figure 9B); pigs with the A allele had significantly greater VL than pigs with the B allele for each trial, although the numbers of individuals with the favorable B allele were very small in trials 1 and 2. The SNP genotype effects for WG42 were consistent and favorably correlated with the effects on VL in trials 1 and 3. Across the 3 trials, and in trials 1 and 3, pigs with the A allele gained significantly less
Figure 4. Estimates of allele substitution effects (across top) and least square means by genotype for SNP WUR10000125 (Panels A and B) and SNP ASGA0081159 (Panels C and D) across and within each of 3 trials for viral load (Panels A and C), calculated as area under the curve of log-transformed viremia from 0 to 21 d post infection and BW gain from 0 to 42 d post infection (Panels B and D). Within a trial, columns with different letters are significantly different at P < 0.05.
at Iowa State University Serials Acquitistion Dept on June 18, 2012jas.fass.orgDownloaded from
Boddicker et al.1742
BW than those with the B allele. Least square means of WG42 were not significantly different in trial 2, with an estimated 0.2 kg less BW gain for pigs with the B allele and a SE of 2.0 kg. The large variability seen in this trial is due to very low frequency of the B allele in this trial.
DISCUSSION
The analyses of VL and WG revealed promising results for selection to improve host disease resistance to PRRS. Both traits were moderately heritable at 30%, which indicates that host response to this strain of the PRRSV can be improved through selection. Viral load and BW gain were moderately negatively correlated at both the phenotypic and the genetic level. On SSC4, a 33-SNP region was identified for both traits with a nearly perfect negative correlation between effects on VL and effects on WG21 and WG42. This, along with the clus-tering of the GEBV into 3 groups, suggests that a single bi-allelic QTL is responsible for the observed perfect correlation between effects on the 2 traits. Furthermore, over 10% of the variance of whole-genome GEBV was accounted for by the effects of these 33 SNP. This 1-Mb region is in high LD and 6 SNP that are in perfect LD in
this population, each explained nearly all of the varia-tion in the GEBV for the 33-SNP region.
Genetic Parameters
The traits VL and WG have been shown to be nega-tively correlated in pigs infected with PRRS. Doeschl-Wilson et al. (2009) reported 21-d WG to be negatively correlated with virus titer in bronchoalveolar lavage (−0.26) and serum (−0.40) in pigs infected intrana-sally with PRRSV, which is consistent with our results. Furthermore, Petry et al. (2005) found that 2 lines of pigs that were experimentally infected with PRRSV had significantly reduced WG compared with their uninfect-ed littermate controls. In the current study, uninfected littermates raised at the breeding company farms had greater WG and less variation in WG42 compared with their infected counterparts, though direct comparison of these results is complicated by the fact that location and infection status were confounded.
Litter explained 14% of the phenotypic variance for WG42 and VL but had a 0 estimate for WG21. Although sows that produced the offspring for this study were PRRS negative, the sizeable litter component suggests
Figure 5. Least square means of viremia and growth curves from an animal model by genotype for SNP WUR10000125. P-values located near points within day post infection.
at Iowa State University Serials Acquitistion Dept on June 18, 2012jas.fass.orgDownloaded from

GWAS for PRRS response 1743
that the dam provided a maternal component that affect-ed the ability of her offspring to respond to the PRRSV. Because of sample size, the effects of litter could not be partitioned into genetic and environmental components.
Both measures of WG and VL showed a significant trial by parity interaction. Lewis et al. (2009a) found that, under PRRS infection in the field, sows of later parities had more pigs born alive, fewer mummified and stillborn piglets and an increase in number weaned compared with pigs born in early parities. Although not directly compa-rable, Lewis et al. (2009a) and the current study found significant parity effects with respect to PRRS. In the cur-rent study, first parity pigs had reduced VL compared with pigs of parities 2 and 3 for trials 1 and 2, but in trial 3, first parity pigs had increased VL compared with pigs of pari-ties 2 and 3. This inconsistency of parity effects between trials may be due to farm effects, as trial 3 pigs were from a different farm than pigs from trials 1 and 2.
In general, heritability of disease resistance in live-stock is low (e.g., Salmonella resistance as measured by survival time in broilers at 0.06; Janss and Bolder, 2000), bovine respiratory disease in beef cattle at 0.08 (Snowder et al., 2006), and PRRS resistance in swine at 0.10 (Lewis et al., 2009b; Lunney and Chen, 2010). However, in a study that evaluated performance traits of sows during non-diseased and PRRS-diseased states, heritability of to-tal weaned increased from 0.02 during the non-diseased state to 0.15 during the diseased state (Lewis et al., 2009b). In the current study, heritability estimates were moder-ately high (0.3) for WG21, WG42, VL, and day specific viremia, with the exception of 7 and 21 DPI, which were both lowly heritable, but SE were substantial.
Genetic correlations between viremia on specific days revealed at most weak correlations, but the SE for most estimates were large. Weak genetic correlations suggest that genomic regions associated with different days may change as the disease progresses. These results coincide with the genomic analysis of day specific viremia, which showed inconsistent genomic regions across time (results not shown). However, genetic correlations between VL and viremia at 11, 14, and 21 DPI were nearly 1.
Genomic Regions
With the development of high-density SNP chips for numerous species, GWAS has increasingly been used to identify genomic regions and QTL associated with quan-titative traits in livestock. As reviewed by Goddard and Hayes (2009), QTL have been identified through the use of GWAS for various traits in many livestock spe-cies, such as milk production in dairy cattle and mortal-ity and disease resistance in chickens. Only 1 other study has reported associations between SNP and PRRS resis-tance. Lewis et al. (2009c) identified 6 significant SNP
from a 7-k SNP chip that were associated with the sow performance traits of total born alive, total born dead, and total mummies; however, the location of these SNP was not reported. Data reported by Lewis et al. (2009c) were from a database that contained 5 years of produc-tion traits from a multi-line multiplication herd. Pigs were naturally exposed to PRRSV in the field, and the PRRS diseased and non-diseased states of the herd were deter-mined on the basis of phenotypic records. Our findings are the first regarding genomic regions associated with PRRS resistance or susceptibility in growing pigs. In the current study, genomic regions for WG42 were identified on SSC 1, 4, 7, and 17. Sanchez et al. (2006) identified QTL for ADG in uninfected animals on SSC 1, 2, 4, and 7 using microsatellite markers; however, none of these QTL overlapped with the regions on SSC 1, 4, or 7 found in the current study. Nezer et al. (2002) used microsatellites and identified a QTL for ADG on SSC7, but again, this was not in the region associated with WG in the current study. One explanation for this lack of similarity between genomic regions is that previous studies were conducted with healthy animals. Other possible explanations include different methods of QTL detection, times when growth was quantified, and use of different breeds.
The GEBV for the 33-SNP region on SSC4 were nearly perfectly correlated for all traits. Furthermore, the covariance between the GEBV for daily viremia and VL was highest at 11 and 14 DPI, which shows that much of the effect of the 33-SNP region on VL is primarily driven by variation on those 2 d. Therefore, the effect of the QTL or gene responsible for the associations ob-served for the region on SSC4 with viremia and VL does not appear to change through 21 DPI. However, the ef-fect of this region disappears after 21 DPI, likely be-cause of the increase in effects associated with the virus (rebound) and other environmental factors, rather than host genetics. The QTL responsible for VL is also likely the QTL responsible for WG, as the GEBV for WG21 and WG42 were perfectly correlated at 1, although the presence of 2 separate QTL in this high LD region can-not be excluded. This region was also significant for the analyses of growth up to 21 DPI and WG from 21 to 42 DPI. Therefore, the effects of this QTL on growth do not appear to change over time.
Maternal effects were identified as an important source of variation in the ASREML analyses of VL and WG. Ideally, litter would be fitted as a random effect in the Bayes-B model to account for this in the GWAS. However, the 3.04 version of the GenSel software does not allow independent random effects such as litter to be fitted. Robustness of the Bayes-B results to litter ef-fects was checked by pre-adjusting phenotypes for the effect of litter or by fitting litter as a fixed factor in the analysis. Both these approaches reduced the variance
at Iowa State University Serials Acquitistion Dept on June 18, 2012jas.fass.orgDownloaded from
Boddicker et al.1744
explained by regions across the genome, in particular on the X chromosome, as expected, but did not change the location of the regions showing associations.
A Major QTL on SSC4
A region with major effects on VL and WG was identified on SSC4. The effects of SNP WUR10000125 in the 33-SNP region on SSC4 for VL and WG were large and consistent across trials, with effects of 0.66 and 0.59 phenotypic SD for WG42 and VL, respectively. With allele substitution effects over 0.5 phenotypic SD for both VL and WG, this places this QTL among the larger effects identified in swine (Hayes and Goddard, 2001). The across trial results suggested that the identified QTL may be acting in a dominant manner, as the AB and BB genotypes were not significantly different but power to detect this latter difference was small because of the low frequency of the BB genotype. There was a clear differ-ence between animals with genotype AA and AB for WG and VL. Within trial, dominance was less evident because of the small number of animals with the BB genotype group. However, in each trial, animals with genotype AA had greater VL and less WG compared with animals with the genotype BB. Therefore, the A allele is undesirable with respect to PRRS, but further research is required to evaluate its effects on other economically important traits, including response to other strains of PRRSV and re-sponse to other diseases. When SNP WUR10000125 was fitted as a fixed factor in ASREML, heritability decreased for VL and WG, but variance due to litter remained at 14% for both traits. This indicates that the effects of this SNP are associated with a direct genetic effect on the in-dividual and are not due to litter effects that are environ-mental from the viewpoint of the challenged barrow. The presence of the BB genotype also indicates that this SNP segregates in both parental breeds, but further work is re-quired to determine if the paternal and maternal associa-tions are consistent.
Estimates of the additive effects of SNP WUR10000125 obtained from the ASREML analysis of GEBV from Bayes-C were smaller than estimates ob-tained from analysis of GEBV obtained from Bayes-B, which were in turn smaller than estimates obtained from ASREML analysis of phenotype, at least for WG42. The Bayesian methods fit SNP effects as random, which re-sults in estimates being shrunk towards 0. The extent of the regression depends on the amount of data, the vari-ance ratios, and the mixture fraction (p). The extent of regression of large effects is less for Bayes-B because it assumes SNP specific variances, which are larger for large effects, in contrast to Bayes-C, which assumes homogeneous variance across all SNP included in the model. Shrinkage is dependent upon sample size; there-
fore, as sample size increases, estimates of SNP effects are expected to converge for Bayes-B and -C.
The associations found for the 33-SNP region on SSC4 were re-evaluated using several approaches for estimating the variance explained by 1 of the SNP in this region, WUR10000125, that was in high LD with other SNP in the region and explained the largest proportion of variance of window GEBV for this region: 1) the variance of whole-genome GEBV explained by the SNP, 2) 2pq
�
α^
2, where
�
α^
is the posterior mean of the esti-mated a l l e l e substitution effect for the SNP, and 3) the reduction in genetic variance when including the SNP as a fixed factor in the ASREML analysis. For VL, the estimates of variance explained by this SNP with these 3 approaches were 3.1, 4.5, and 4.3; for WG42, they were 3.0, 1.1, and 2.4. Thus, within a trait, esti-mates of the contribution of the region to observed vari-ation were fairly similar for the 3 approaches.
All P-values reported for the SNP effects were ob-tained by including the SNP as a fixed effect in ASREML because significance tests were not readily available for the Bayesian model analyses. For the SNP on SSC4, P-values were highly significant (P < 1 ´ 10−11).
Candidate Genes for the QTL on SSC4 and SSCX
The interferon induced guanylate-binding protein family genes are potential candidates within the 33-SNP region on SSC4 based on a mapview of the pig genome (http://www.ncbi.nlm.nih.gov/mapview). When an ani-mal is infected with a pathogen, a class of cytokines, called interferons, is released as part of an immune re-sponse to induce protein expression such as guanylate binding protein. The importance of cytokines in PRRS responses has been reported by numerous labs (Miller et al., 2004; Lunney et al., 2010; Thanawongnuwech et al., 2010). Human guanylate binding proteins have been re-ported to inhibit replication of both vesicular stomatitis and encephalomyocarditis viruses (Anderson et al., 1999). Furthermore, Itsui et al. (2009) found that guanylate bind-ing protein-1 inhibited replication of the hepatitis C virus.
Determining the causative mutation solely through the analyses reported here is prohibited by the strong LD in the 33-SNP region on SSC4. Sequencing family members within each genotype group could possibly reveal new SNP to add to the analyses; however, these SNP would more than likely also be in high LD with the current SNP. The LD in this region must be broken to discriminate the causative mutation.
The carbohydrate sulfotransferase gene (CHST7) was identified within 90 kb from the significant SNP ASGA0081159 on SSCX, based on the Sus scrofa ge-nome browser (http://useast.ensembl.org/Sus_scrofa/;
at Iowa State University Serials Acquitistion Dept on June 18, 2012jas.fass.orgDownloaded from

GWAS for PRRS response 1745
assessed March 25, 2012). Sulfated polysaccharides have been shown to exhibit antiviral properties, includ-ing inhibition of viral particle attachment to target host cells and cell-to-cell spread of the virus (Nyberg et al., 2004). Located within 1 Mb from SNP ASGA0081159, several additional candidate genes were found, includ-ing CFP, TIMP1, and ARAF. Complement factor pro-perdin (CFP) has been shown to be involved in initia-tion of the alternative pathway of the immune system (Spitzer et al., 2007). Tissue inhibitor of metalloprotein-ases 1, TIMP1, may affect immune cell activity as an an-tiapoptotic peptidase (Boggio et al., 2010). ARAF, v-raf murine sarcoma 3611 viral oncogene homologue, has also been shown to inhibit apoptosis (Rauch et al., 2010).
Conclusions
Body weight gain and viremia after experimental PRRSV challenge of piglets were moderately heritable. Therefore, genetic selection to reduce the impact of in-fection with this specific strain of PRRSV is possible. The 2 traits had moderately negative phenotypic and ge-netic correlations, although the latter had a greater SE. Regions on SSC4 and SSCX had strong effects on both WG and VL and accounted for a large proportion of the variation in whole genome GEBV, indicating that these regions contain major QTL or genes affecting response to PRRSV. One possible candidate gene family for the SSC4 region is the interferon induced guanylate-binding proteins. On SSCX, the CHST7 gene is within the re-gion of interest. Both of these genes have been shown to have antiviral properties. These results are promising, but further research is needed in different populations and with different strains of PRRSV. If these regions are validated in other populations and for other strains of PRRSV, breeders and producers will be able to geno-type their animals for this region and implement marker-assisted selection for host response to PRRS infection into their breeding program.
LITERATURE CITED
Anderson, S. L., J. M. Carton, J. Lou, L. Xing, and B. Y. Rubin. 1999. Interferon-induced guanylate binding protein-1 (GBP-1) medi-ates an antiviral effect against vesicular stomatitis virus and en-cephalomyocarditis virus. Virology 256:8–14.
Barrett, J. C., B. Fry, J. Maller, and M. J. Daly. 2005. Haploview: Analysis and visualization of LD and haplotype maps. Bioinformatics 21:263–265.
Benfield, D. A., E. A. Nelson, J. E. Collins, L. Harris, S. M. Goyal, D. Robison, W. T. Christianson, R. B. Morrison, D. Gorcyca, and D. Chladek. 1992. Characterization of swine infertility and respiratory syndrome (SIRS) virus (Isolate ATCC VR-2332). J. Vet. Diagn. Invest. 4:127–133.
Boggio, E., M. Indelicato, E. Orilleri, R. Mesturini, M. C. Mazzarino, M. F. Campagnoli, U. Ramenghi, U. Dianzani, and A. Chiocchetti. 2010. Role of tissue inhibitor of metalloprotein-ases-1 in the development of autoimmune lymphoproliferation. Haematologica 95:1897–1904.
Doeschl-Wilson, A. B., I. Kyriazakis, A. Vincent, M. F. Rothschild, E. Thacker, and L. Galina-Pantoja. 2009. Clinical and patholog-ical responses of pigs from two genetically diverse commercial lines to porcine reproductive and respiratory syndrome virus infection. J. Anim. Sci. 87:1638–1647.
Fang Y. P., W. Schneider, K. S. Zhang, E. A. Faaberg, Nelson, and R. R. R. Rowland. 2007. Diversity and evolution of a newly emerged North American Type 1 porcine arterivirus: Analysis of isolates collected between 1999 and 2004. Archiv. Virol. 152:1009–1017.
Fernando, R. and D. Garrick. 2009. User manual for a portfolio of genomic selection related analyses. Second Edition. Iowa State University. Accessed Apr. 19, 2012. http://bigs.ansci.iastate.edu/bigsgui/help.html.
Gilmour, R. A., B. J. Gogel, B. R. Cullis, and R. Thompson. 2006. ASReml User Guide Release 2.0. VSN International Ltd, Hemel Hempstead, UK.
Goddard, M. E. and B. J. Hayes. 2009. Mapping genes for complex traits in domestic animals and their use in breeding programmes. Nature Review. Genetics 10:381–391.
Habier, D., R. L. Fernando, K. Kizilkaya, and D. J. Garrick. 2011. Extension of the Bayesian alphabet for genomic selection. BMC Bioinformatics 12:186.
Halbur, P. G., M. F. Rothschild, B. J. Thacker, X. J. Meng, P. S. Paul, and J. D. Bruna. 1998. Differences in susceptibility of Duroc, Hampshire, and Meishan pigs to infection with a high virulence strain (VR2385) of porcine reproductive and respiratory syn-drome virus (PRRSV). J. Anim. Breed. Genet. 115:181–189.
Hayes B. and M. E. Goddard. 2001. The distribution of the effects of genes affecting quantitative traits in livestock. Genet. Sel. Evol. 33:209–229.
Itsui, Y., N. Sakamoto, S. Kakinuma, M. Nakagawa, Y. Sekine-Osajima, M. Tasaka-Fujita, Y. Nishimura-Sakurai, G. Suda, Y. Karakama, K. Mishima, M. Yamamoto, T. Watanabe, M. Ueyama, Y. Funaoka, S. Azuma, and M. Watanabe. 2009. Antiviral effects of the interferon-induced protein guanylate binding protein 1 and its interaction with the Hepatitis C Virus NS5B Protein. Hepatology 50:1727–1737.
Janss, L. L. G. and N. M. Bolder. 2000. Heritabilities of and genetic relationships between salmonella resistance traits in broilers. J. Anim. Sci. 78:2287–2291.
Kimman, T. G., L. A. Cornelissen, R. J. Moormann, J. M. Rebel, and N. Stockhofe-Zurwieden. 2009. Challenges for porcine repro-ductive and respiratory syndrome virus (PRRSV) vaccinology. Vaccine 27:3704–18.
Lewis, C. R. G., T. Ait-Ali, M. Clapperton, A. Archibald, and S. C. Bishop. 2007. Genetic perspectives on host responses to porcine reproductive and respiratory syndrome (PRRS). Viral Immunol. 20:343–357.
Lewis, C. R. G., M. Torremorell, and S. C. Bishop. 2009a. Effects of porcine reproductive and respiratory syndrome virus infection on the performance of commercial sows and gilts of different parities and genetic lines. J. Swine Health Prod. 17:140–147.
Lewis, C. R., M. Torremorell, L. Galina-Pantoja, and S. C. Bishop. 2009b. Genetic parameters for performance traits in commer-cial sows estimated before and after an outbreak of porcine re-productive and respiratory syndrome. J. Anim. Sci. 87:876–884.
at Iowa State University Serials Acquitistion Dept on June 18, 2012jas.fass.orgDownloaded from

Boddicker et al.1746
Lewis, C. R. G., M. Torremorell, L. Galina-Pantoja, N. Deeb, M. A. Mellencamp, A. L. Archibald, and S. Bishop. 2009c. A genome-wide association analysis identifying SNPS for PRRS tolerance on a commercial pig farm. Proc. Assoc. Advmt. Anim. Breed. Genet 18:187–190.
Lunney, J. K., and H. Chen. 2010. Genetic control of porcine repro-ductive and respiratory syndrome virus responses. Virus Res. 154:161–169.
Lunney, J. K., E. R. Fritz, J. M. Reecy, D. Kuhar, E. Prucnal, R. Molina, J. Christopher-Hennings, J. Zimmerman, and R. R. R. Rowland. 2010. Interleukin-8, interleukin-1b and interferon-g levels are linked to PRRS virus clearance. Viral Immunol. 23:127–134.
Lunney, J. K., J. P. Steibel, J. Reecy, M. Rothschild, M. Kerrigan, B. Trible, and R. R. R. Rowland. 2011. Probing genetic control of swine responses to PRRSV infection: Current Progress of the PRRS Host Genetics Consortium. Intl. Symposium on Animal Genomics for Animal Health, Paris. BMC Proceedings: 5(Suppl 4):S30.
Mateu, E. and I. Diaz. 2008. The challenge of PRRS immunology. Vet. J. 177: 345–351.
Miller, L. C., W. W. Laegreid, J. L. Bono, C. G. Chitko-McKown, and J. M. Fox. 2004. Interferon type I response in porcine re-productive and respiratory syndrome virus-infected MARC-145 cells. Arch. Virol. 149:2453–2463.
Neumann, E. J., J. B. Kliebenstein, C. D. Johnson, J. W. Mabry, E. J. Bush, A. H. Seitzinger, A. L. Green, and J. J. Zimmerman. 2005. Assessment of the economic impact of porcine reproductive and respiratory syndrome on swine production in the United States. J. Am. Vet. Med. Assoc. 227:385–392.
Nezer, C., L. Moreau, D. Wagenaar, and M. Georges. 2002. Results of a whole genome scan targeting QTL for growth and carcass triats in a Pietrain X Large White intercross. Genet. Sel. Evol. 34:371–387.
Nyberg, K., M. Ekblad, T. Bergstrom, C. Freeman, C. R. Parish, V. Ferro, and E. Trybala. 2004. The low molecular weight hepa-rin sulfate-mimetic, PI-88, inhibits cell-to-cell spread of herpes simplex virus. Antiviral Res. 63:15–24.
Petry, D. B., J. W. Holl, J. S. Weber, A. R. Doster, F. A. Osorio, and R. K. Johnson. 2005. Biological responses to porcine respiratory and reproductive syndrome virus in pigs of two genetic popula-tions. J. Anim. Sci. 83:1494–1502.
Petry D. B., J. Lunney, P. Boyd, D. Kuhar, E. Blankenship, and R. K. Johnson. 2007. Differential immunity in pigs with high and low responses to porcine reproductive and respiratory syndrome vi-rus infection. J. Anim. Sci. 85:2075–2092.
Rauch, J., E. O’Neill, B. Mack, C. Matthias, M. Munz, W. Kolch, and O. Gires. 2010. Heterogeneous nuclear ribonucleoprotein h blocks MST2-mediated apoptosis in cancer cells by regulating transcription. Cancer Res. 70:1679–1688.
Sanchez, M. P., J. Riquet, N. Iannuccelli, J. Gogue, Y. Billon, O. Demeure, J. C. Caritez, G. Burgaud, K. Feve, M. Bonnet, C. Pery, H. Lagant, P. Le Roy, J. P. Bidanel, and D. Milan. 2006. Effects of quantitative trait loci on chromosomes 1, 2, 4, and 7 on growth, carcass, and meat quality traits in backcross Meishan ´ Large White pigs. J. Anim. Sci. 84:526–537.
Snowder, G. D., L. D. Van Vleck, L. V. Cundiff, and G. L. Bennett. 2006. Bovine respiratory disease in feedlot cattle: environmen-tal, genetic, and economic factors. J. Anim. Sci. 84:1999–2008.
Spitzer, D., L. M. Mitchell, J. P. Atkinson, and D. E. Hourcade. 2007. Properdin can initiate complement activation by binding spe-cific target surfaces and providing a platform for de novo con-vertase assembly. J. Immunol. 179:2600–2608.
Stephens, M., N. J. Smith, and P. Donnelly. 2001. A new statistical method for haplotype reconstruction from population data. Am. J. Hum. Genet. 68:978–989.
Thanawongnuwech, R. and S. Suradhat. 2010. Taming PRRSV: Revisiting the control strategies and vaccine design. Virus Res. 154: 133–40.
Wensvoort G., C. Terpstra, J. M. Pol, E. A. ter Laak, M. Bloemrad, E. P. deKluyer, C. Kragten, L. van Buiten, A. den Besten, F. Wagenaar, J. M. Broekhuijsen, P. L. J. M. Moonen, T. Zetstra, E. A. de Boer, H. J. Tibben, M. F. de Jong, P. van’t Veld, G. J. R. Groenland, J. A. van Gennep, M. T. H. Voets, J. H. M. Verheijden, and J. Braamskamp. 1991. Mystery swine disease in the Netherlands: the isolation of Lelystad virus. Vet. Quart. 13:121–130.
at Iowa State University Serials Acquitistion Dept on June 18, 2012jas.fass.orgDownloaded from

Referenceshttp://jas.fass.org/content/90/6/1733#BIBLThis article cites 33 articles, 12 of which you can access for free at:
at Iowa State University Serials Acquitistion Dept on June 18, 2012jas.fass.orgDownloaded from