Evidence for a Direct Link between Glutathione Biosynthesis and Stress Defense Gene Expression in...
15
Evidence for a Direct Link between Glutathione Biosynthesis and Stress Defense Gene Expression in Arabidopsis W Louise Ball, a Gian-Paolo Accotto, b Ulrike Bechtold, c Gary Creissen, a Dietmar Funck, d Ana Jimenez, e Baldeep Kular, a Nicola Leyland, a Jaime Mejia-Carranza, a Helen Reynolds, a Stanislaw Karpinski, d and Philip M. Mullineaux c,1 a Department of Disease and Stress Biology, John Innes Centre, Colney, Norwich, NR4 7UH, United Kingdom b Istituto di Virologia Vegetale, Strada delle Cacce, 73, 10135 Torino, Italy c Department of Biological Sciences, University of Essex, Wivenhoe Park, Colchester, CO4 3SQ, United Kingdom d Department of Botany, Stockholm University, Stockholm SE-106 91, Sweden e Centro de Edafologia y Biologı ´a Aplicada del Segura, Consejo Superior de Investigaciones Cientificas, Campus de Espinardo, 30100 Murcia, Spain The mutant regulator of APX2 1-1 (rax1-1) was identified in Arabidopsis thaliana that constitutively expressed normally photooxidative stress-inducible ASCORBATE PEROXIDASE2 (APX2) and had $50% lowered foliar glutathione levels. Map- ping revealed that rax1-1 is an allele of g-GLUTAMYLCYSTEINE SYNTHETASE 1 (GSH1), which encodes chloroplastic g-glutamylcysteine synthetase, the controlling step of glutathione biosynthesis. By comparison of rax1-1 with the GSH1 mutant cadmium hypersensitive 2, the expression of 32 stress-responsive genes was shown to be responsive to changed glutathione metabolism. Under photo-oxidative stress conditions, the expression of a wider set of defense-related genes was altered in the mutants. In wild-type plants, glutathione metabolism may play a key role in determining the degree of expression of defense genes controlled by several signaling pathways both before and during stress. This control may reflect the physiological state of the plant at the time of the onset of an environmental challenge and suggests that changes in glutathione metabolism may be one means of integrating the function of several signaling pathways. INTRODUCTION Plants exposed to environmental stress show diminished photosynthetic metabolism and increased photoreduction of molecular oxygen (O 2 ), photorespiration, and dissipation of excitation energy at photosystem II (Asada, 1999; Ort and Baker, 2002). Although these processes are protective, they lead to increased formation of reactive oxygen species (ROS), such as superoxide anion (O 2 .ÿ ), singlet O 2 , and hydrogen peroxide (H 2 O 2 ; Asada, 1999). The prevention of oxidative stress is achieved by a network of low molecular weight antioxidants, enzymes that keep them reduced, and ROS-scavenging en- zymes (Karpinski et al., 1997; Asada, 1999). The accumulation of ROS also activates defense gene expression as part of pro- tective responses to both biotic and abiotic stimuli (Karpinski et al., 1999; Grant and Loake, 2000; Fryer et al., 2003; op den Camp et al., 2003). Transcript profiling studies, in some cases using transgenic plants altered in expression of antioxidant enzymes, indicate that coordinated regulation of a network of defense and antioxidant systems occurs (Willekens et al., 1997; Rossel et al., 2002; Pneuli et al., 2003). A key component of the antioxidant network is the thiol glutathione, which is synthesized from its constituent amino acids, L-Glu, L-Cys, and Gly, in an ATP-dependent two-step pathway catalyzed by the enzymes g-glutamylcysteine synthe- tase ([g-ECS]; EC 6.3.2.2) and glutathione synthetase (EC 6.3.2.3), respectively (Noctor et al., 2002). To date, two genes, one coding for plastidial g-ECS (GSH1) and one putative cyto- solic glutathione synthetase (GSH2), have been identified in Arabidopsis thaliana and many other plant species (May and Leaver, 1993;; Rawlins et al., 1995; Cobbett et al., 1998; Noctor et al., 2002). Overexpression or inhibition of GSH1 expression causes Arabidopsis to have enhanced or depressed levels of glutathione, respectively (Cobbett et al., 1998; Xiang and Oliver, 1998; Vernoux et al., 2000). In keeping with studies on g-ECS from other organisms, the plant enzyme is considered to be a key regulatory step in glutathione biosynthesis and may be con- trolled at the level of enzyme activity, synthesis of protein and mRNA (Xiang and Oliver, 1998; Noctor et al., 2002). Glutathione, primarily in its reduced form (GSH), is present at concentrations of 2 to 3 mM in various plant tissues (Creissen et al., 1999; Meyer and Fricker, 2002; Noctor et al., 2002). Because glutathione is a major cellular antioxidant, it is regarded as a determinant of cellular redox state and may indirectly have an influence on many fundamental cellular processes (Cooper et al., 2002; Noctor et al., 2002; Schafer and Buettner, 2001). Glutathione can engage in thiol-disulphide exchange reactions 1 To whom correspondence should be addressed. E-mail mullin@ essex.ac.uk; fax 44-1603-873598. The author responsible for distribution of materials integral to the findings presented in this article in accordance with the policy described in the Instructions for Authors (www.plantcell.org) is: Philip M. Mullineaux ([email protected]). W Online version contains Web-only data. Article, publication date, and citation information can be found at www.plantcell.org/cgi/doi/10.1105/tpc.104.022608. The Plant Cell, Vol. 16, 2448–2462, September 2004, www.plantcell.org ª 2004 American Society of Plant Biologists
-
Upload
independent -
Category
Documents
-
view
5 -
download
0
Transcript of Evidence for a Direct Link between Glutathione Biosynthesis and Stress Defense Gene Expression in...
Evidence for a Direct Link between Glutathione Biosynthesisand Stress Defense Gene Expression in Arabidopsis W
Louise Ball,a Gian-Paolo Accotto,b Ulrike Bechtold,c Gary Creissen,a Dietmar Funck,d Ana Jimenez,e
Baldeep Kular,a Nicola Leyland,a Jaime Mejia-Carranza,a Helen Reynolds,a Stanislaw Karpinski,d
and Philip M. Mullineauxc,1
a Department of Disease and Stress Biology, John Innes Centre, Colney, Norwich, NR4 7UH, United Kingdomb Istituto di Virologia Vegetale, Strada delle Cacce, 73, 10135 Torino, Italyc Department of Biological Sciences, University of Essex, Wivenhoe Park, Colchester, CO4 3SQ, United KingdomdDepartment of Botany, Stockholm University, Stockholm SE-106 91, Swedene Centro de Edafologia y Biologıa Aplicada del Segura, Consejo Superior de Investigaciones Cientificas,
Campus de Espinardo, 30100 Murcia, Spain
The mutant regulator of APX2 1-1 (rax1-1) was identified in Arabidopsis thaliana that constitutively expressed normally
photooxidative stress-inducible ASCORBATE PEROXIDASE2 (APX2) and had $50% lowered foliar glutathione levels. Map-
ping revealed that rax1-1 is an allele of g-GLUTAMYLCYSTEINE SYNTHETASE 1 (GSH1), which encodes chloroplastic
g-glutamylcysteine synthetase, the controlling step of glutathione biosynthesis. By comparison of rax1-1 with the GSH1
mutant cadmium hypersensitive 2, the expression of 32 stress-responsive genes was shown to be responsive to changed
glutathione metabolism. Under photo-oxidative stress conditions, the expression of a wider set of defense-related genes
was altered in the mutants. In wild-type plants, glutathione metabolism may play a key role in determining the degree of
expression of defense genes controlled by several signaling pathways both before and during stress. This control may
reflect the physiological state of the plant at the time of the onset of an environmental challenge and suggests that changes
in glutathione metabolism may be one means of integrating the function of several signaling pathways.
INTRODUCTION
Plants exposed to environmental stress show diminished
photosynthetic metabolism and increased photoreduction of
molecular oxygen (O2), photorespiration, and dissipation of
excitation energy at photosystem II (Asada, 1999; Ort and Baker,
2002). Although these processes are protective, they lead to
increased formation of reactive oxygen species (ROS), such as
superoxide anion (O2.�), singlet O2, and hydrogen peroxide
(H2O2; Asada, 1999). The prevention of oxidative stress is
achieved by a network of low molecular weight antioxidants,
enzymes that keep them reduced, and ROS-scavenging en-
zymes (Karpinski et al., 1997; Asada, 1999). The accumulation of
ROS also activates defense gene expression as part of pro-
tective responses to both biotic and abiotic stimuli (Karpinski
et al., 1999; Grant and Loake, 2000; Fryer et al., 2003; op den
Camp et al., 2003). Transcript profiling studies, in some cases
using transgenic plants altered in expression of antioxidant
enzymes, indicate that coordinated regulation of a network of
defense and antioxidant systems occurs (Willekens et al., 1997;
Rossel et al., 2002; Pneuli et al., 2003).
A key component of the antioxidant network is the thiol
glutathione, which is synthesized from its constituent amino
acids, L-Glu, L-Cys, and Gly, in an ATP-dependent two-step
pathway catalyzed by the enzymes g-glutamylcysteine synthe-
tase ([g-ECS]; EC 6.3.2.2) and glutathione synthetase (EC
6.3.2.3), respectively (Noctor et al., 2002). To date, two genes,
one coding for plastidial g-ECS (GSH1) and one putative cyto-
solic glutathione synthetase (GSH2), have been identified in
Arabidopsis thaliana and many other plant species (May and
Leaver, 1993;; Rawlins et al., 1995; Cobbett et al., 1998; Noctor
et al., 2002). Overexpression or inhibition of GSH1 expression
causes Arabidopsis to have enhanced or depressed levels of
glutathione, respectively (Cobbett et al., 1998; Xiang and Oliver,
1998; Vernoux et al., 2000). In keeping with studies on g-ECS
fromother organisms, the plant enzyme is considered to be a key
regulatory step in glutathione biosynthesis and may be con-
trolled at the level of enzyme activity, synthesis of protein and
mRNA (Xiang and Oliver, 1998; Noctor et al., 2002).
Glutathione, primarily in its reduced form (GSH), is present at
concentrations of 2 to 3 mM in various plant tissues (Creissen
et al., 1999; Meyer and Fricker, 2002; Noctor et al., 2002).
Because glutathione is a major cellular antioxidant, it is regarded
as a determinant of cellular redox state and may indirectly have
an influence on many fundamental cellular processes (Cooper
et al., 2002; Noctor et al., 2002; Schafer and Buettner, 2001).
Glutathione can engage in thiol-disulphide exchange reactions
1 To whom correspondence should be addressed. E-mail [email protected]; fax 44-1603-873598.The author responsible for distribution of materials integral to thefindings presented in this article in accordance with the policy describedin the Instructions for Authors (www.plantcell.org) is: Philip M.Mullineaux ([email protected]).WOnline version contains Web-only data.Article, publication date, and citation information can be found atwww.plantcell.org/cgi/doi/10.1105/tpc.104.022608.
The Plant Cell, Vol. 16, 2448–2462, September 2004, www.plantcell.orgª 2004 American Society of Plant Biologists

that may be a key process in linking the regulation of gene
expression to the redox state of cells or specific subcellular
compartments (Schafer and Buettner, 2001; Noctor et al., 2002).
In plants, the number of regulatory processes that are known to
be potentially influenced by the levels or redox state of cellular
glutathione pools is small. The regulation of plastid gene expres-
sion by the redox state of the glutathione pool provide the best
studied examples to date. These include the translation of rbcL
mRNA, the processing of specific plastid-encoded transcripts,
and the modulation of RNA polymerase by a redox-sensitive
protein kinase (Irihimovitch and Shapira, 2000; Pfannschmidt,
2003). Not many examples exist that have indicated the possi-
bility of glutathione redox-mediated control of nuclear-located
defense gene expression. Glutathione may activate the regula-
tory proteins NPR1 and possibly protein phosphatase 2C (ABI2),
important in salicylic acid (SA) and abscisic acid (ABA) signaling,
respectively (Meinhard et al., 2002; Mou et al., 2003). Earlier
studies in which glutathione was fed to cells or leaves has been
shown to both induce and suppress expression of a range of
defense genes (Wingsle and Karpinski, 1996; Karpinski et al.,
1997, 2000; Wingate et al., 1988; Loyall et al., 2000). However,
given the many aspects of cellular metabolism that glutathione is
engaged in (Noctor et al., 2002), such feeding data do not
constitute evidence for a direct role in the regulation of antiox-
idant defense genes.
Under nonstress conditions, ASCORBATE PEROXIDASE2
(APX2), which encodes a component of the antioxidant network,
is expressed at extremely low levels. However, when leaves are
subjected to excess light or wounding that induces photo-
oxidative stress, the expression of the gene is rapidly induced
in bundle sheath tissue (Karpinski et al., 1997, 1999; Fryer et al.,
2003; Chang et al., 2004). In this study, it is shown that themutant
regulator of APX2 1-1 (rax1-1), which expresses APX2 in the
absence of excess light or wounding stress, is a lesion in GSH1.
Thus, a direct link was established between expression of an
antioxidant defense gene under steady state (nonstressed con-
ditions) and glutathione. Further analysis of gene expression
showed that only stress defense genes were affected by gluta-
thione, ruling out wider effects of this mutation on cellular
metabolism. Comparison of expression profiles under high light
stress and wounding in rax1-1 and cadmium hypersensitive 2-1
(cad2-1, another mutant in GSH1; Cobbett et al., 1998) revealed
unexpected differences despite similar gluthathione levels. From
these data, it is deduced that both glutathione metabolism and
levels can be considered to influence the poising of cellular
defences before their induction as well as the actual response to
an external stress.
RESULTS
Isolation and Initial Characterization of Mutants
Expressing APX2 under Nonstress Conditions
An Arabidopsis (Columbia-0 [Col-0]) line transformed with an
excess light stress-inducibleAPX2 promoter-LUCIFERASE gene
fusion (APX2LUC; Karpinski et al., 1999) was chemically muta-
genized and used to screen for APX2 expression in the absence
of excess light stress (see Methods). After screening, two
mutants were identified that had a stable, heritable luciferase-
positive phenotype (example in Figure 1A). Themutant lineswere
visually indistinguishable from wild-type plants at all stages of
their life cycle under both long (18-h photoperiod) and short (8-h
photoperiod) day conditions. All data presented here are from
selfed progeny of the fifth backcrossed generation. We have
assigned only a single allele number to the mutants and refer
to them in this article as rax1-1. This is because subsequent
sequencing of the mutant loci revealed that the lesion was the
same in both mutants (see below).
Level and Distribution of APX2 Expression in rax1-1
In contrast with wild-type plants under nonstress conditions,
rax1-1plants had detectable levels ofAPX2 expression, although
this was always less than the levels detected in excess light
stressed wild-type plants (Figures 1B and 2A). Based on in vitro
determinations of luciferase activity, rax1-1 had two orders of
magnitude greater luciferase activity than the basal activity in
nonstressed wild-type plants (Col-0/APX2LUC ¼ 167 6 21
counts per second [cps] mg protein�1 [6SE; n ¼ 43] versus
Col-0/rax1-1/APX2LUC¼ 38,6766 4354 cpsmgprotein�1 [6SE;
n ¼ 37]). However, the expression of APX2LUC in the mutant
under low light conditions was only 7% that of excess light-
stressed wild-type plants (Col-0/APX2LUC þ excess light ¼55,1576 6 123,298 cps mg protein�1 [6SE; n ¼ 6]).
In long day–grown nonstressed rax1-1 plants, APX2LUC
expression was first detected in vivo in the apical region of
soil-grown plants at 10 d after germination (Figure 1A, panel 10d).
This was followed by a continued increase in detectable lucifer-
ase activity in the petioles, midribs, leaf veins, and apex up to the
maximum number of nine fully expanded leaves (up to 28 d;
Figure 1A, panels 16d and 17d). During these times, expression
of APX2LUC was not subject to a diurnal rhythm in either short
day– or long day–grown plants (data not shown). However,
luciferase activity was never detected over the whole of the
vascular tissue in any leaf under nonstress conditions, and some
leaves failed to express detectable activity (Figure 1A). There-
after, luciferase activity declined such that it could not be imaged
in senescing leaves, although luciferase activity was observed at
the axis between cauline leaves and the stem of flower bolts in
plants from 28 d onward (bolts >6 cm in length; Figure 1A, panel
32d). APX2LUC activity in rax1-1 was never detected in roots,
flowers, siliques, seeds, young plants (more than six true leaves),
and cotyledons (data not shown). In situ hybridizations on
transverse sections of rax1-1 leaves showed expression of the
gene to be limited to the vasculature (see Supplemental Figure
1S online), identical to the expression pattern of APX2 in excess
light-stressed wild-type plants (Fryer et al., 2003).
Depressed Glutathione Levels in rax1-1
Under nonstress conditions, there was no effect of rax1-1 on the
foliar levels of H2O2, lipid peroxidation products, and the levels or
redox state of ascorbate and photosynthetic electron transport
(data not shown). However, rax1-1 had 20 to 50% of the foliar
level of glutathione compared with wild-type plants over a range
APX2 Expression and Glutathione 2449

Figure 1. Constitutive APX2 Expression in rax1-1, a Lesion in GSH1.
(A) Typical false color image from a CCD camera of luciferase activity in a long day/low light–grown, 17-d-old wild-type APX2LUC Arabidopsis rosette
before and after exposure to a 10-fold excess light stress for 45 min (LL 17d and EL 17d, respectively) and in long day–grown APX2LUC/rax1-1 plants at
10, 16, 17, and 32 d after germination. The background image of rosettes was taken when the plants were first placed under the camera, and the
luciferase image was taken, after 3 min in the dark, for one minute with an aperture setting of 1.8.
(B) PCR-based detection of APX2 transcript under nonstress conditions in rax1-1. Rapid amplification of cDNA 39ends (39RACE) PCR-amplified APX2
and APX1 cDNA, equivalent to 3 mg of total RNA, was separated by agarose gel electrophoresis, blotted, and hybridized to 32P-labeled gene-specific
probes. In the lane with wild-type excess light (EL) APX2-specific PCR products 100-fold less volume was loaded as for the low light (LL) samples from
wild-type or rax1-1 plants. The RNA was pooled from three separate plants harvested on two occasions (n ¼ 6). Detection of APX1 was used here as
a control for the PCR.
(C) Alignment of the derived amino acid sequences of g-ECS residues 229 to 312 from Arabidopsis (1) with that from trypanosome (2) and eight other
plant species (3 to 10). This region includes the putative catalytic domain as defined by Leuder and Phillips (1996). The alignment between Arabidopsis
and trypanosome with conserved residues in bold is from the same article. The asterisks indicate where the trypanosome sequence shows no
homology with those from rat, yeast, and nematode. The rax1-1 (R229K) mutation is shown as well as cad2-1 (deletion P238, K239; Cobbett et al., 1998)
and rml1-1 (D259N; Vernoux et al., 2000). The plant g-ECS sequences are from Indian mustard (3; Y10848), Medicago truncatula (4; AF041340), pea
(Pisum sativum) (5; AF128455), dwarf bean (Phaseolus vulgaris) (6; AF128454), rice (Oryza sativa) (7; AJ508916), maize (Zea mays) (8; AJ302783), tomato
(Lycopersicon esculentum) (9; AF017983), and onion (Allium cepa) (10; AF401621).

of plant ages, irrespective of the photoperiod (Table 1). There
was no effect on glutathione redox states at any of the stages of
vegetative growth (data not shown). By contrast, foliar levels of
Cys and g-glutamylcysteine (g-EC) were similar in rax1-1 and
wild-type plants (Table 1). The levels of glutathione in rax1-1were
similar to that reported for cad2-1. However, in contrast with
rax1-1 and wild-type plants, g-EC was not detectable, and Cys
levels were 37 to 70% higher in cad2-1 (Table 1). As in cad2-1
(Cobbett et al., 1998), g-ECS activity was lower in rax1-1
compared with wild-type plants (rax1-1: 3.3 nmols g-EC formed
min�1 g fwt�1 [SD6 0.3; n¼ 3], Col-0/APX2LUC 13.7 nmols g-EC
formed min�1 g fwt�1 [SD 6 2.5; n ¼ 3])
Mapping and Identification of the rax1-1 Locus
The rax1-1 phenotype segregated as a single recessive Mende-
lian trait when crossed with Col-0 (observed, 327 wild type, 73
rax1-1 phenotype; expected, 325 wild type, 75 rax1-1 pheno-
type, n¼ 400, x2¼ 0.066, based on cosegregation of a recessive
rax1-1 locus and a APX2LUC dominant transgene [13:3]). Map-
ping of the rax1-1 mutation using 48 F2 progeny displaying the
mutant phenotype showed it was on chromosome 4 located
between the FCA6 locus and BAC clone F28M11. This interval
also harbors GSH1 (At4g23100). Because rax1-1 plants had
lower levels of glutathione and g-ECS activity, similar to cad2-1
(Table 1), we reasoned that rax1-1 could also be a GSH1
mutation. Therefore, the genes and cDNAs encodingGSH1 from
bothmutant types were sequenced. For bothmutant types at the
time considered to be different alleles of the same locus,
sequencing revealed a point mutation (G to A) at coordinate
12,105,389 of the chromosome 4 sequence (The Arabidopsis
Information Resource [TAIR], www.arabidopsis.org, November
2003). This coordinate is equivalent to coordinate 2883 of the
sequence published by Cobbett et al. (1998) (EMBL: AF068299).
This mutation was in exon 6 of GSH1 and resulted in an Arg
(R229) to Lys (K) change in the g-ECS sequence (Figure 1C). This
Arg residue is conserved in the putative g-ECS sequences from
eight plant species (Figure 1C). In addition to the point mutation
at coordinate 12,105,389, one of the mutant types had an
additional point mutation (A to G) at coordinate 12,105,405. This
second mutation produced no change in the sequence of g-ECS
(data not shown) but provided confirmation that both mutants
arose independently from the screening butwere the same allele.
To confirm that rax1-1was aGSH1mutant allele, crosseswere
done with cad2-1 plants and also a transgenic line expressing
a GSH1 cDNA under the control of the Cauliflower mosaic virus
35Spromoter (Xiang et al., 2001). The rax1-1 and cad2-1mutants
failed to complement one another because glutathione levels
were not restored to wild-type levels in F1 progeny arising from
a cad2-13 rax1-1 cross (Table 2). Equally, the rax1-1 phenotype
was abolished in homozygous rax1-1 individuals also harboring
the 35S:GSH1 cDNA fusion in that glutathione levels were
restored to wild-type levels (Table 2), and this was associated
with a loss of luciferase activity from APX2LUC (data not shown).
Therefore, we concluded that the lesion in GSH1 is the cause for
the rax1-1 phenotype.
Expression of Genes and Enzymes of the Antioxidant
Network in rax1-1 and cad2-1
In contrast with nonstressed rax1-1 plants (Figures 1A and 1B),
APX2 expression was not detected in nonstressed cad2-1 plants
(Figure2A). Inasurveyof theexpressionof25antioxidantdefense
genes in nonstressed rax1-1 plants, four additional genes with
increased transcript levelswere found (APX1,FSD1,DHAR1, and
Table 1. Thiol Determinations in the Wild Type (Col-0/APX2LUC),
rax1-1, and cad2-1
Thiol Wild Type rax1-1 cad2-1
Glutathione 263 6 88 (n ¼ 11) 85 6 14 (n ¼ 21) 73 6 10 (n ¼ 12)
g-EC 2.8 6 0.4 (n ¼ 6) 2.9 6 0.5 (n ¼ 6) n.d. (n ¼ 12)
Cys 60 6 10 (n ¼ 9) 48 6 9 (n ¼ 20) 82 6 5 (n ¼ 4)
Glutathione
(leaf)
345 6 58 (n ¼ 3) 88 6 45 (n ¼ 6) 85 6 39 (n ¼ 3)
Glutathione
(petiole)
278 6 40 (n ¼ 3) 70 6 15 (n ¼ 6) 93 6 50 (n ¼ 3)
Glutathione
10 dpg LD
282 6 28 (n ¼ 6) 87 6 52 (n ¼ 6) –
Glutathione
14 dpg LD
281 6 21 (n ¼ 6) 119 6 18 (n ¼ 6) –
Glutathione
18 dpg LD
256 6 48 (n ¼ 6) 60 6 10 (n ¼ 6) –
Glutathione
20 dpg LD
377 6 79 (n ¼ 6) 68 6 20 (n ¼ 6) –
Levels of various thiols were determined in 5-week-old plants grown in
short day (8-h photoperiod) conditions. Glutathione refers to total
glutathione content (i.e., GSH þ GSSG). Plants kept under long day
conditions (LD) were at the same developmental stages (dpg is days
postgermination) as those shown in Figure 1A. All foliar thiol contents
are calculated in nmols g fresh weight�1. The assays were conducted on
acid extracts of leaves by derivitization with monobromobimane and
separation of fluorescent thiol conjugates by reverse-phase HPLC (see
Methods). n.d., not detected; –, not determined.
Table 2. Complementation Analysis of rax1-1 with cad2-1 and
35S-GSH1
Genotype (Col-0) Glutathione (nmols g fwt�1) n
cad2-1:rax1-1:APX2LUC 145 6 6 (118) 10
rax1-1:APX2LUC 123 6 14 (100) 7
cad2-1 103 6 10 (84) 3
APX2LUC 246 6 44 (200) 6
35S:GSH1:APX2LUC 378 6 19 (307) 3
35S:GSH1:rax1-1:APX2LUC 247 6 9 (201) 6
Total glutathione content in leaves from F1 progeny arising from a cross
between cad2-1 and rax1-1 parents compared with the wild type (Col-0/
APX2LUC) and the rax1-1 and cad2-1 parents. Glutathione was
determined as in Table 1. The numbers in parentheses are the values
relative to rax1-1/APX2LUC. The presence of both the rax1-1 and cad2-1
mutation in each selected hybridwas confirmed as correct by sequencing
of the PCR-amplified GSH1 gene over both mutations (see Figure 1 and
Methods). Similarly, thepresenceof the35S-GSH1 transgene (Xiangetal.,
2001) was confirmed by PCR between the Cauliflower mosaic virus 35S
promoter and the GSH1 coding sequence.
APX2 Expression and Glutathione 2451
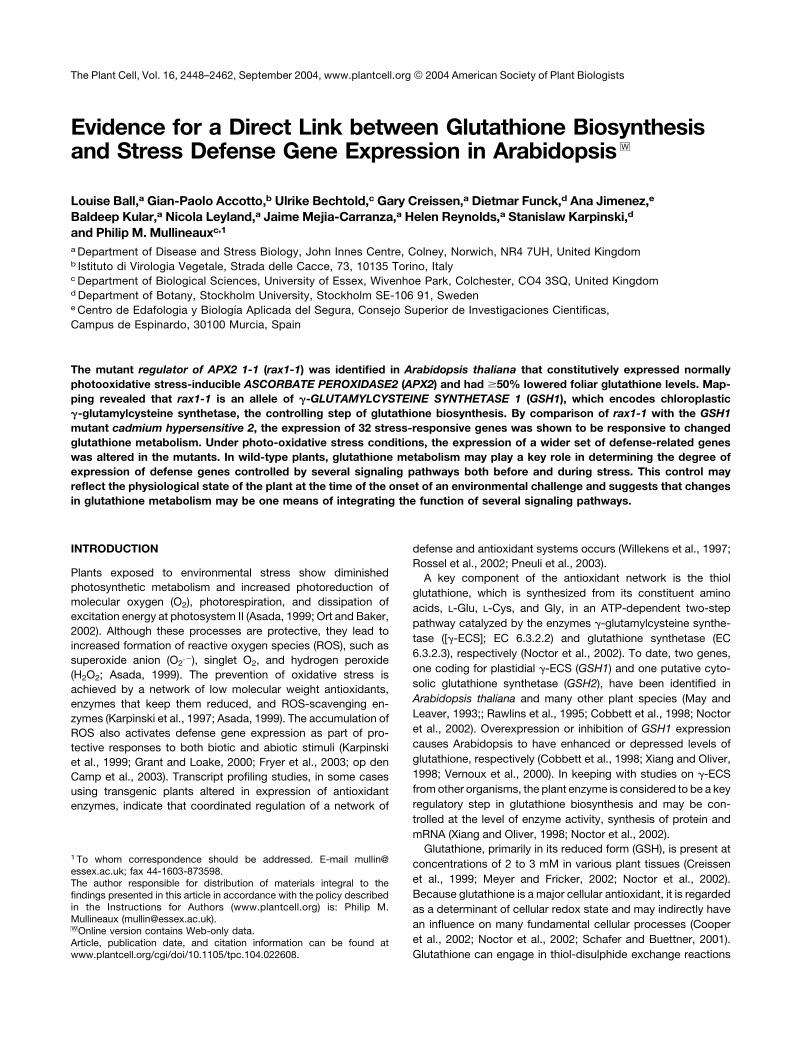
MDAR1) whereas one, CSD1, had reduced transcript levels (see
Supplemental Figure 2S online). This initial comparison was
extended to determine if the levels of these five transcripts were
altered in nonstressed cad2-1 as well as rax1-1 (Figure 2B).
Transcript levelsofbothAPX1andDHAR1wereelevated in rax1-1
but not cad2-1 comparedwithwild-type plants, whereas those of
FSD1,CSD2, andMDAR1were altered in cad2-1 in the sameway
as in rax1-1 (Figure 2B; seeSupplemental Figure 2Sonline). Inter-
estingly, these five rax1-1 affected genes, like APX2, responded
in the same way in exposed and systemic leaves of partially
excess light-stressed wild-type rosettes (Figure 2C). Of the 19
genes whose transcript levels were not affected in rax1-1 under
nonstressed conditions, most were not induced in their expres-
sion by excess light stress, the only exceptions being those
encoded by CAT2 andGPX7 (Figure 2C).
To determine if the observed transcript changes resulted in
changes in the activities of ROS-scavenging enzymes, the
activities of Fe- and Cu/Zn- amd Mn-superoxide dismutase
(SOD) isoforms,monodehydroascorbate reductase (MDAR), and
cytosolic ascorbate peroxidase ([APX]; Figure 3) were deter-
mined in the nonstressed mutant and wild-type plants. Whereas
total SOD activity was not significantly changed in rax1-1 and
cad2-1 compared with wild-type plants, the proportion of Fe-
SOD activity was increased from 27% of the total in wild-type
plants to;45% in both mutants (Figure 3A; P < 0.01). Similarly,
Cu/Zn SODactivity was a lower proportion of total activity in both
mutants (40%; P < 0.01 for rax1-1 and P < 0.05 for cad2-1)
compared with wild-type plants (60%). Total MDAR activity was
elevated above the wild-type level in both mutants (Figure 3B),
whereas an increase in the activity of cytosolic APX was
observed only in rax1-1, but not cad2-1, compared with the wild
type (Figure 3C). These data on enzyme activities broadly agreed
with the observed changes in transcript levels.
Impact on the Arabidopsis Transcriptome of rax1-1
and cad2-1
To determine if the effects of the GSH1 mutations in rax1-1 and
cad2-1 under nonstressed conditions were limited to genes
associated with defense against oxidative stress, analysis of the
levels of transcripts encoded by;8500 Arabidopsis genes was
performed using microarrays (Zhu and Wang, 2000). A stringent
analysis of the data (see Methods) cut the number of genes
whose expression could be compared with wild-type plants
down to 3743 and 3734 for rax1-1 and cad2-1, respectively.
Pairwise comparisons between these reduced data sets from
wild-type plants were conducted in turn with those from cad2-1
and rax1-1. Only genes that showed more than twofold differ-
ences in signal intensities between mutants and the wild type
were classified as differentially expressed and analyzed further.
Figure 2. Comparison of Antioxidant Defense Gene Expression in rax1-1
and cad2-1.
(A) PCR-based detection of APX2 transcript under nonstress conditions
in rax1-1 and cad2-1. 39RACE PCR-amplified APX2 and APX1 cDNAs
were detected by autoradiography as in the legend of Figure 1B. The
wild-type control (EL WT) is from 10-fold excess light (EL) stressed
plants, and loading of the APX2-specific product was 1% that of the
volume loaded for the mutants. The APX1 is shown here as a PCR control
for all cDNA samples. Each sample is pooled from six plants. LL, low
light.
(B) Steady state levels of transcripts of antioxidant defense genes in
nonstressed wild type, cad2-1, and rax1-1. RNA gel blots loaded with
20 mg of total RNA were hybridized to specific probes and washed at
high stringency, and imageswere developed using a phosphoimager (see
Methods). The RNA preparations of rax1-1 and cad2-1 were the same as
those in (A). The numbers below each row are values of signal relative to
the wild type from this experiment, calculated from densitometer read-
ings derived from the digitized images (Fryer et al., 2003). The band
below each group is actin mRNA used as a loading control (see
Methods).
(C) rax1-1–responsive gene expression in excess light–exposed and
systemic leaves. Steady state levels of transcripts encoded by antiox-
idant defense genes in the wild type (n ¼ 3) partially exposed to excess
light (15-fold). RNA was prepared from directly exposed leaves (EL) and
nonexposed leaves that responded systemically to this stress (S;
Karpinski et al., 1999), compared with low light nonstressed controls
(LL). The amounts of RNA used and the processing of the blots was as
in (B).
2452 The Plant Cell

We reasoned that genes whose expression was affected by
a depressed level of foliar glutathione would be affected in the
same way in rax1-1 and cad2-1, and these were observed
(At1g65400, At4g02330, At2g05380, At4g39640, At4g21830,
At2g24850, At5g24780, At5g24770, At2g14610, At3g57260,
At2g43570, At2g48110, and At4g35580; Table 3). More surpris-
ingly, two further groups could be discerned: seven geneswhose
expression was only altered in rax1-1 (At2g40300, At5g01600,
At2g29580, At3g51860, At2g32880, At5g66400, and At2g46680;
Table 3) and 206 geneswith altered transcript level only in cad2-1
(see Supplemental Table 1S online). The transcript levels of five
of the genes listed in Table 3 were analyzed by a quantitative RT-
PCR (qRT-PCR) procedure. This showed that the patterns of
expression of these genes in themutants versus wild-type plants
was the same as observed in the microarray experiment,
although the absolute values differed between the two methods
(Table 3, numbers in parentheses).
A randomized sample of genes from both mutant data sets
compared with the wild type confirmed that the difference in
numbers between the pairwise comparisons was not because of
the intrinsic variation in the experiment (see Methods). It should
be noted that all of the genes encoding components of the
antioxidant network fell outside the microarray analysis either
because their levels of expression were too low to score or the
changes were less than twofold.
Expression of APX2 and Other Defense Genes in rax1-1
and cad2-1 Leaves Subjected to Stress
When rax1-1 plants were subjected to excess light stress or
wounding, induction of APX2 transcript was much more pro-
nounced than in control plants (Figures 4A and 4B). qRT-PCR
confirmed that APX2 expression after excess light stress was
twofold to threefold higher in rax1-1 compared with wild-type
plants and also in cad2-1 plants (Figure 5B). For cad2-1, this was
despite the unaffected very low level of this transcript in low light
conditions (Figure 2A). Furthermore, APX2 transcript levels in
rax1-1, after a 1-h exposure to fivefold excess light stress, were
still detectable 1 h after the stress, when levels in the wild-type
plants had returned to below the level of detection (Figure 5A).
As with the rax1-1–induced antioxidant defense genes (Figure
2C), the mRNA levels of the five genes selected from the
microarray experiment (Table 3) were all elevated in excess
light-stressed wild-type plants (Figure 5A). To ensure that qRT-
PCR andRNA gel blots produced comparable results,CSD2 and
FSD1 transcript levels were included in the qRT-PCR assay
(Figures 2C and 5A). When mRNA levels for the selected genes
were compared from mutants and the wild type exposed to
excess light, all the genes showed altered expression patterns in
the mutants although no common pattern of responses was
apparent (Figure 5B). The expression of six genes that had been
identified as excess light stress responsive (U. Bechtold, C.
Gapper, and P.M.Mullineaux, unpublished data) but did not have
altered levels in the nonstressed rax1-1 (Figure 5A) were as-
sessed for their expression in excess light-stressed mutants
compared with wild-type plants (Figure 2B). These showed
altered transcript levels in the mutants compared with the wild
Figure 3. Antioxidant Enzyme Activities Are Altered in Nonstressed
rax1-1 and cad2-1 Plants.
Enzyme activities in cell-free extracts of leaves pooled from six plants,
combined from two separate analyses. The assays were performed
according to Jimenez et al. (1997).
(A) Mn-, Cu/Zn-, and Fe-SOD.
(B) MDAR.
(C) APX.
APX2 Expression and Glutathione 2453

type, but as with the rax1-1/cad 2-1–responsive group from low
light plants, no common pattern was observed.
Whole Plant Responses to Excess Light Stress
and Bacterial Infection
The exposure of rax1-1 or cad2-1 plants to excess light did not
produce any difference, when compared with parental plants, in
any chlorophyll a fluorescence parameter used to measure
different aspects of the efficiency of photosynthetic electron
transport (see Supplemental Figure 3S online). Active photosyn-
thetic electron transport is required for APX2 expression in
excess light-stressed wild-type plants, but this was not the
reason for the elevated APX2 expression in excess light stressed
rax1-1 plants (Karpinski et al., 1997, 1999; Fryer et al., 2003).
Whereas H2O2 levels increased in excess light-stressed plants,
the mutants showed no differences compared with the wild type
(data not shown). Similarly, the pattern of change in both
glutathione redox state and levels in response to excess light
was not different from thewild type, although themutants always
had lowered glutathione levels (data not shown). The decreased
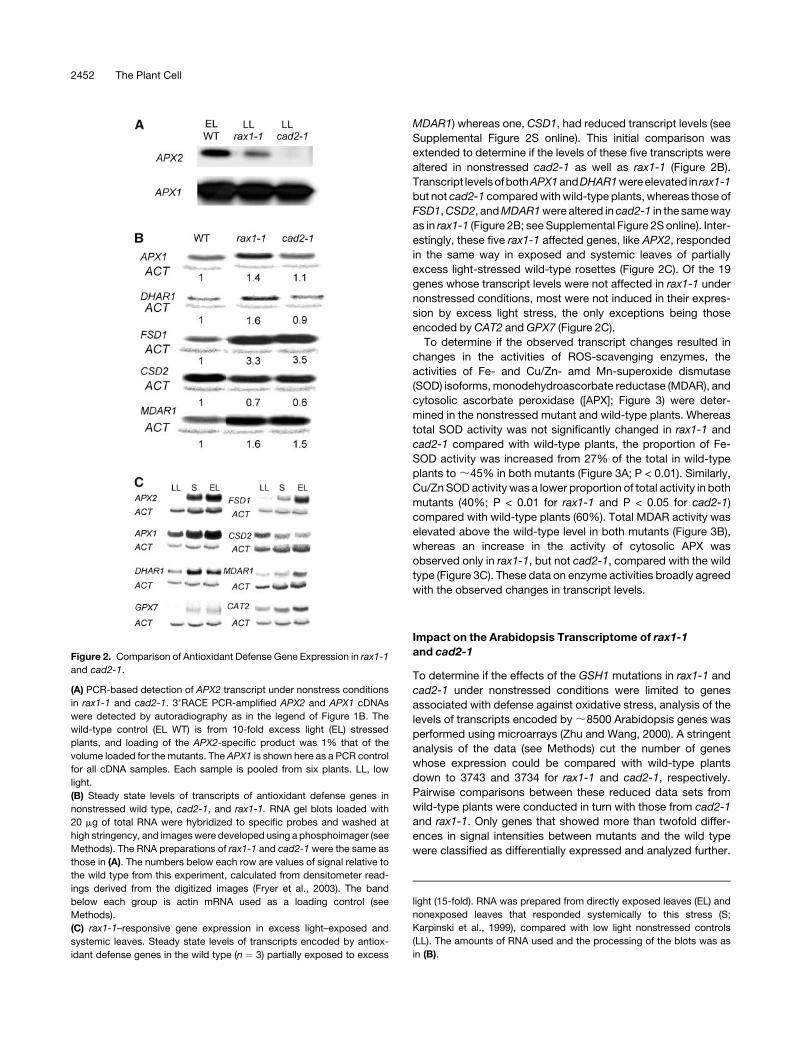
levels of transcripts involved in resistance to pathogens (Table 3)
promptedus to test if the response to infectionwascompromised
in the mutants. Both rax1-1 and cad2-1 showed weaker re-
sistance to avirulent Pseudomonas syringae infection (Figure 6).
DISCUSSION
A lowered level of glutathione and/or its redox state have been
noted in diverse plant species in response to long-term exposure
to a range of abiotic stresses (Rauser et al., 1991; De Vos
et al., 1992; Walker and McKersie, 1993; Chaumont et al.,
1995; Kampfenkel et al., 1995; Iturbe-Ormataexe et al., 1998;
Bruggemann et al., 1999;Hernandez et al., 2000;Nikiforova et al.,
2003). These lowered glutathione levels were accompanied
by changes in many components of the antioxidant/ROS-
scavenging network. Thus, despite the emphasis often given to
Table 3. Transcript Levels of Genes Whose Expression, When Compared with Nonstressed Wild-Type Plants, Was Affected in Nonstressed rax1-1
Alone or in Both rax1-1 and cad2-1
Affymetrix Probe Set Locus Name
Signal in rax1-1/Signal
in Wild Type t Test
Signal in cad2-1/Signal
in Wild Type t Test
Higher Transcript Levels in rax1-1
16031_at At5g01600 3.44 0.113 0.95 0.375
18933_at At2g40300 2.15 (4.6) 0.097 1.08 (1.1) 0.153
15115_f_at At2g05380 2.65 0.010 2.52 0.000
19577_at At1g65400 2.36 0.001 3.15 0.024
19267_s_at At4g02330 2.33 0.010 3.25 0.059
13255_i_at At4g39640 2.16 0.045 3.17 0.023
Lower Transcript Levels in rax1-1
12521_at At3g51860 0.28 0.036 0.74 0.189
16038_s_at At5g66400 0.28 (0.45) 0.171 1.42 (1.85) 0.349
19646_at At2g46680 0.36 0.104 1.41 0.208
12212_at At3g52070 0.46 0.133 n.d. –
15750_at At2g03980 0.46 0.016 0.52 0.017
19213_at At2g29580 0.48 0.010 1.08 0.278
19901_at At2g32880 0.48 0.039 1.05 0.373
13706_at At2g18700 0.48 0.091 0.51 0.099
18969_g_at At5g57550 0.49 0.046 0.55 0.076
13146_s_at At4g35750 0.50 0.070 0.58 0.086
12622_at At1g23100 0.50 0.114 n.d. –
17840_at At2g43570 0.35 (0.82) 0.106 0.38 (0.18) 0.115
19675_at At4g35580 0.40 0.198 0.39 0.195
13212_s_at At3g57260 0.43 (0.18) 0.093 0.44 (0.08) 0.094
17008_at At2g24850 0.44 0.028 0.21 0.017
14635_s_at At2g14610 0.44 0.088 0.45 0.093
15141_s_at At5g24770 0.45 0.076 0.29 0.052
15125_f_at At5g24780 0.47 0.058 0.20 0.030
18224_s_at At4g21830 0.50 (0.8) 0.141 n.d. (0.3) –
12244_s_at At2g48110 0.50 0.177 0.48 0.167
The data were obtained from microarray experiments using a total of three independent preparations of RNA per line prepared from plants grown in
controlled environment conditions (see Methods). Locus identifiers in bold indicate genes with altered expression only in rax1-1. The numbers in
parentheses are the same comparisons conducted using a qRT-PCR procedure for that gene with two replicate RNA preparations independent of
those used for the microarray experiments. n.d., not detected; –, not determined.
2454 The Plant Cell

glutathione (May et al., 1996; Allan and Fluhr, 1997; Noctor et al.,
2002), there is no compelling evidence from these comparative
studies that glutathione or any other single antioxidant could play
a unique role in the regulation of antioxidant defenses. The
isolation of rax1-1 by screening for APX2 expression under
normal growth conditions and demonstrating that it is a lesion in
GSH1 with reduced glutathione levels is an important observa-
tion. The way this mutant was identified provides direct evidence
that glutathione metabolism and the expression of other com-
ponents of plant antioxidant defenses are tightly linked.
The increased oxidation or lowered levels of cellular glutathi-
one pools caused by different environmental conditions may
constitute a signal that is mimicked by the permanently lowered
levels of glutathione in rax1-1 and cad2-1 (Table 1). This is
because the glutathione redox couple (2GSH 4 GSSG þ 2Hþ),
unlike those of other antioxidants, is such that its redox potential
can be determined by the concentration of GSH as well as the
GSH/GSSG ratio (Schafer and Buettner, 2001; Pfannschmidt,
2003). This means that the GSH concentration alone can have an
influence on cellular redox state and possibly influence redox-
sensitive regulators (Schafer and Buettner, 2001; Noctor et al.,
2002). This concept is sometimes referred to as redox tone
(Cooper et al., 2002). Therefore, we reasoned that the level of
glutathione common to cad2-1 and rax1-1 might permit identi-
fication of genes sensitive to cellular redox state. This was the
case for the transcript levels and enzyme activity of three (out of
25) antioxidant defense genes surveyed (those encoding Fe- and
Cu/Zn-SOD and MDAR; Figures 2 and 3) and a further 16 genes
(out of 3743) from a microarray analysis (Table 3).
Surprisingly, the lowered level of glutathione per se did not
provide an explanation for all of our observations. It was possible
to identify genes whose transcript levels were specifically
affected in rax1-1 or cad2-1 (Figure 2, Table 3; see Supplemental
Table 1S online). The expression of 10 genes, including three
Figure 5. Excess Light Stress Responses of APX2 and Other Stress-
Responsive Genes in Wild-Type and Mutant Plants.
(A) Transcript levels of stress defense genes in light-stressed (fivefold
excess light for 45 minutes) wild-type plants relative to those in low light.
Genes with altered expression in nonstressed rax1-1 and cad2-1 (Table
3) are shown. These are compared with light stress–responsive genes
(underlined) whose transcripts were not affected in the mutants under
nonstress conditions. All measurements were made using qRT-PCR (see
Methods) using three determinations from each of two separate experi-
ments (n¼ 6). The mean threshold cycle (Ct) values used to calculate the
log ratio of excess light (EL)/low light (LL) transcript levels had standard
deviations from the mean for each cDNA no greater than 610%. The
locus identifiers for the genes are given in Supplemental Table 2S online.
(B) Transcript levels of stress defense genes after fivefold excess light
exposure for 45 min in cad2-1 and rax1-1 relative to the wild type. The
same genes were assayed by qRT-PCR as in (A) in two separate sets of
determinations. The mean threshold cycle (Ct) values used to calculate
the log ratio of mutant/wild-type transcript levels had standard deviations
from the mean for each cDNA no greater than 65%.
Figure 4. Induction of APX2 in Stressed rax1-1 Plants.
(A) Autoradiograph of RNA gel blot of APX2 transcript levels in two pools
(n ¼ 3 for each pool) of rax1-1 and wild-type plants after exposure to
a fivefold excess light stress for 1 h (1h EL). The same number of excess-
light stressed plants were left for another 1 h under ambient light
conditions before harvesting (1h EL þ 1h LL). Actin mRNA (ACT) is used
here as a loading control. The protocols for producing the RNA gel blot
autoradiographs were as described in the legend of Figure 2B.
(B) Induction of APX2 expression in wounded wild-type and rax1-1
plants. Autoradiograph of APX2 cDNA amplified by 39RACE PCR (see
Methods), blotted, and hybridized to a gene-specific probe. Under the
same conditions, APX3 transcript was constant in all samples (data not
shown). Samples were taken before wounding (0 h) and then at 1 and 2 h
after wounding. RNA was pooled from three wounded leaves from six
plants.
APX2 Expression and Glutathione 2455
antioxidant genes,most notablyAPX2 itself, but alsoDHAR1 and
APX1, were affected in rax1-1 but not in cad2-1 (Figure 2, Table
3). The rax1-1 mutant had near wild-type levels of g-EC, Cys
(Table 1), Ser, Gly, and Glu (Ball, 2001), thus ruling out the levels
of these compounds as possible additional effectors of expres-
sion of this group of genes. The discrepancy between rax1-1 and
cad2-1 in the levels of thiol intermediates (Table 1) suggests that
some other aspect of glutathione biosynthesis, besides its level,
may be contributing to the regulation of defense gene expression
in these plants. The distinct cad2-1 group of genes did not permit
further analysis of this problem because the mutant had too
many variables, such as elevated Cys levels, undetectable levels
of g-EC (Table 1), and possibly perturbed amino acid metabolism.
root meristemless 1 (rml1) is a mutant allele of GSH1 (Figure 1C)
that has ;5% of wild-type glutathione levels and is severely
defective in root growth (Vernoux et al., 2000). However, transgenic
lines harboring antisense GSH1 display a similar reduced level of
glutathione to rml1 and yet do not have such a severe phenotype
(Xiang et al., 2001), perhaps reflecting subtle effects of altered
glutathione metabolism on gene expression.
The differences in stress defense gene expression profiles
between rax1-1 and cad2-1 may also suggest that the different
lesions could have affected regulatory as well as catalytic
functions of g-ECS. Inspection of the position of the lesions in
the GSH1 mutants adds some support to this notion. Both the
cad2-1 and rml1-1 lesions lie within a putative catalytic domain of
g-ECS, as defined by a block of distant homology to trypano-
some g-ECS (Figure 1C; Leuder and Phillips, 1996). By contrast,
the rax1-1 lesion lies outside this domain (Figure 1C), which may
suggest that the effect of this mutation may be on a function not
directly associated with the catalytic function of the enzyme. It
should be noted that g-ECS from plants shows a high degree of
sequence conservation over the full length of the mature poly-
peptide (Noctor et al., 2002), which suggests that functions apart
from the catalytic activity might be important in this enzyme.
Further evidence that glutathione biosynthesis, or the action of
specific regions of GSH1, may influence stress protective gene
expression in subtle ways comes from the results of our screen of
M2 plants equivalent to 17,000M1 individuals. If a perturbation in
ROS homeostasis was solely responsible for enhanced APX2
expression, then it would have been expected to have recovered
mutants that had diminished levels of other foliar antioxidants
(e.g., similar to vtc-1 and npq1-2; Conklin et al., 1996; Niyogi
et al., 1998). Furthermore, if depressed glutathione levels alone
were the main influence on APX2 expression, we would have
expected to, but did not recover, a wider range of GSH1 mutant
alleles (for example, equivalent to cad2-1). In support of these
conclusions, neither vtc1-1, npq1-2, or cad2-1 under nonstress
conditions showed detectable APX2 expression (Figure 2A; Ball,
2001). In addition, rax1-1 did not show any increase in total foliar
H2O2 levels or increases specifically in vascular tissue that would
have explained the increased expression of APX2 (see Results;
Fryer et al., 2003).
Under Nonstress Conditions, Glutathione Metabolism
Affects a Group of Genes Functionally Clustered
around Stress Defense
All of the known genes that showed altered expression in the
microarray comparison between nonstessed rax1-1 and the wild
type have been reported in the literature to be also responsive to
stress, important as host factors in disease, or implicated in
stress defenses in plants (Table 4; 24/26). Two more genes
(At2g29580 and At4g35750) have homologs that have been
implicated in stress responses in animal cells (Table 4). Interest-
ingly, 8 of the 17 genes with depressed levels of transcripts in
rax1-1 compared with the wild type (Table 3) have been shown to
be altered in their expression by either ABA (three; Table 4), SA
(two; Table 4), or jasmonic acid ([JA]; three; Table 4). In the more
extensive cad2-1 specific group, a preliminary inspection of the
annotation suggests that a high proportion of the affected genes
may encode defense-related functions (see Supplemental Table
2S online). JA has been shown to influence glutathione metab-
olism by elevating transcript levels of g-ECS, glutathione syn-
thetase, and glutathione reductase (Xiang and Oliver, 1998). SA
treatment of leaves leads to an increase in glutathione levels
often ahead of induction of defense gene expression. This may
influence the redox state of NPR1, a glutathione-sensitive regu-
latory protein in the SA signaling pathway in Arabidopsis (Mou
et al., 2003). Confirmation of this observation comes from the
increased growth of avirulent P. syringae in rax1-1 and cad2-1
Figure 6. Growth of Avirulent Bacteria in rax1-1 and cad2-1 Plants.
In two experiments on separate batches of plants, avirulent P. syringae
pv tomato DC3000avrRpm1 was vacuum infiltrated into whole rosettes
at day 0 (0 d postinoculation [dpi]). Note that two different inoculation
densities were used in experiments 1 and 2. Bacteria were recovered
from leaves 0 and 2 d (dpi) later and the increase in colony-forming units
(cfu) per cm2 determined. The data shown are mean values (6SE, n ¼ 3).
2456 The Plant Cell

plants, indicating that lowered glutathione levels are weakening
these plants’ defense capability (Figure 6). Thus, glutathione
levels or its redox state does impact on stress defenses at the
whole plant level.
The Influence of Glutathione during Photooxidative Stress
In wild-type plants, APX2 expression was only detected after
excess light stress or, to a smaller degree, after wounding (Figure
4; Karpinski et al., 1997; Chang et al., 2004). In rax1-1, increased
induction of APX2 expression over that of wild-type plants was
observed in response to excess light and wounding (Figures 4
and 5B) and in cad2-1 after excess light stress (Figure 5B). Redox
changes in photosynthetic electron transport and accumulation
of H2O2 in vascular tissue have been identified as prerequisites
for APX2 induction in wild-type plants (Karpinski et al., 1999;
Fryer et al., 2003). However, neither in mesophyll nor vascular
tissue of light stressed rax1-1 and cad2-1 plants were these
Table 4. The rax1-1 and cad2-1/rax1-1–Affected Genes All Encode Stress Defense-Related Functions
Locus Name Annotation Stress Response or Function Reference
At2g40300 Putative ferritin Induced by high light, ozone,
Fe-induced oxidative
stress, and nitric oxide
Murgia et al. (2001), (2002)
At5g01600 Ferritin 1 precursor Induced by high light, ozone,
Fe-induced oxidative
stress, and nitric oxide
Murgia et al. (2001), (2002)
At1g65400 Putative lectin Chitin induced Zhang et al. (2002)
At4g02330 Putative pectinesterase Cell wall protein interacts with
viral movement proteins
Chen et al. (2000)
At4g39640 Putative g-glutamyltransferase Glutathione catabolism Storozhenko et al. (2002)
At2g29580 RNA recognition motif–containing RNA
binding protein
RNA stabilization during
heat shock
Gallouzi et al. (2001)
At2g03980 Putative Gly-Asp-Ser-Leu family-motif
lipase/hydrolase; pFAM domain
Lipid breakdown response to
pathogens and wounding
Schaller (2001)
At5g57550 Xyloglucan endotransglycosylase Induced by touch, darkness,
cold, heat, and brassinosteroids
Iliev et al. (2002)
At4g35750 Putative E1B 19K/Bcl2
interactor Nip2
Regulator of apoptosis/cell death Han et al. (1998); Hoeberichts
and Woltering (2003)
At2g18700 Putative trehalose-6-phosphate
synthase
Trehalose synthesis for tolerance
to drought, stress, and cold
Wingler (2002); Jang et al. (2003)
At2g46680 Homeodomain transcription
factor ATHB-7
Induced by drought and ABA Soderman et al. (1996)
At1g23100 10-kD chaperonin Subunit of HSP60, induced by
heat shock
Koumoto et al. (1996)
At3g51860 CAX1 Ca2þ/Hþ antiporter Calcium signaling, stress
adaptation
Hirschi (1999)
At5g66400 Dehydrin RAB18-like protein Induced by drought and ABA Welin et al. (1994)
At2g24850 Putative tyrosine aminotransferase Tocopherol biosynthesis.
Induced by JA, wounding,
high light, UV, and
oxidative stress
Lopukhina et al. (2001); Sandorf
and Hollander-Czytko (2002)
At5g24780 Vegetative storage protein 1 Induced by wounding, herbivory,
and JA
Berger et al. (2002);
Utsugi et al. (1998)
At5g24770 Vegetative storage protein 2 Induced by wounding, herbivory,
copper, ozone, senescence,
and JA
Utsugi et al. (1998);
Berger et al. (2002);
Mira et al. (2002)
At2g14610 PR-1–like protein Induced in hypersensitive response,
pathogen infection, and by SA
Rogers and Ausubel (1997);
Cameron et al. (1999)
At3g57260 Glucan endo-1,3-b-glucosidase Induced in hypersensitive response and
pathogen infection. Downregulated
by ABA
Rezzonico et al. (1998)
At2g43570 Class IV chitinase Induced by pathogens and SA de A Gerhardt et al. (1997);
Park et al. (2003)
At4g35580 NAM/CUC2-like protein Petunia NAM and Arabidopsis ATAF1,
ATAF2, and CUC2 domain transcription
factor. Induced by fungal infection and
wounding
Collinge and Boller (2001);
Duval et al. (2002)
APX2 Expression and Glutathione 2457

parameters observed to differ from those of wild-type plants (see
Supplemental Figure 3S online) nor was the pattern of change in
glutathione levels different between mutants and the wild type
subjected to excess light stress (data not shown). These data
indicate that the mutants were no more affected by photooxida-
tive stress at the whole plant level than Col-0; therefore, other
signals must be the cause for enhanced APX2 expression. The
expression of a further 12 stress-associated genes was skewed
in excess light stressed mutants compared with the wild type
(Figure 5B). These included six genes influenced by rax1-1 and
cad2-1 under ambient conditions and six that were not. These
data suggest that both the levels and biosynthesis of glutathione
act in several different ways to influence stress defense mech-
anisms according to the physiological state of the plant.
Conclusion
Glutathione levels and its biosynthesis can profoundly affect the
poising of stress defenses in plants, and this is achieved without
any direct impact on cellular ROS levels. The direct interaction of
glutathione org-ECSwith oneormore regulatory proteinsmaybe
how this control is achieved. In bacteria, yeast, animal, and plant
cells, at least two mechanisms have been described by which
glutathione can modulate the activity of signaling proteins in-
dependently ofROS levels. Thereare the so-called thiol switches,
in which glutathione changes the redox state of thiol-groups of
proteins that act as redox cofactors, altering either the activity or
redox state of regulatory proteins, and secondly by S-glutathio-
lation of regulatory proteins with direct conjugation of glutathione
to target Cys residues (Klatt and Lamas, 2000; Cooper et al.,
2002; Delaunay et al., 2002; Mou et al., 2003; Paget and Buttner,
2003).
METHODS
Plant Material, Growth Conditions, and Stress Treatments
Arabidopsis thaliana plants were grown in controlled environment con-
ditions under short and long days (8-h and 16-h photoperiods, respec-
tively) as previously described (Bechtold et al., 2004). The APX2LUC
transformant (Col-0) has been described previously (Karpinski et al.,
1999). The 35S-GSH1 transgenic Arabidopsis line and cad2-1 were kind
gifts from D.J. Oliver, Iowa State University, and C. Cobbett, University of
Melbourne, Australia, respectively.
Plants were subjected to either complete or partial exposure to 5- to
15-fold excess light orwounding, as describedpreviously (Karpinski et al.,
1997, 1999; Chang et al., 2004). Vacuum infiltration of whole rosettes with
avirulent Pseudomonas syringae pv tomato DC3000avrRpm1 was per-
formed as described by Muskett et al. (2002).
Mutagenesis, Screening, and Mapping of rax1-1
APX2LUC seed were mutagenized in batches of 10,000 using 0.5% (v/v)
ethyl methanesulfonate for 8 h. Ethyl methanesulfonate–treated seed had
a germination frequency of 70%. Mutagenesis efficiency was confirmed
in M1 plants by analyzing the frequency of chlorophyll deficiency in
developing embryos from100 siliques harvested fromplants of each seed
batch at 10 to 12 d postanthesis. M2 seeds were collected from indepen-
dent pools of 500 M1 plants. M2 plants (500) from each pool were grown
for 16 d under long day conditions, sprayed with 1 mM D (-)- luciferin
(Karpinski et al., 1999), and assayed for their luciferase activity in 12-well
microtitre dishes using a Victor Multilabel Counter 1420 workstation
(Wallac, Finland). Plants were scored positive if one of the six
readings was >100 cps (background was 30 to 40 cps). Positive plants
(120) were repotted and grown for seed production. A repeat assay was
done on 12 M3 progeny from each positive M2 rosette. Only phenotyp-
ically normal plants were kept to confirm the phenotype in the M3
generation. Inheritance of the phenotype was determined by following
segregation after two subsequent backcrosses. The only two mutants
from a total of 65 pools of M1 plants with a stably heritable, recessive
phenotype were backcrossed to Col-0 a further three more times.
For the mapping of rax1, the strategy described by Jander et al. (2002)
was adopted. DNA from 48 F2 progeny from a cross between themutants
and Arabidopsis Landsberg erecta that showed the luciferase positive,
low glutathione phenotypes, were analyzed for the segregation of poly-
morphisms using custom-designed fluorescently tagged INDEL markers
separated on an ABI 3700 capillary sequencer (Applied Biosystems,
Foster City, CA). Identification ofGSH1 on themap used information from
TAIR (www.arabidopsis.org). Amplification and sequence determination
of GSH1 and its full-length cDNA, from both versions of the rax1-1
mutation, was conducted using specific primers derived from the wild-
type sequence. The John Innes Centre Genome Laboratory (www.
jicgenomelab.co.uk) conducted both the sequencing and the map-
ping. The presence of both the rax1-1 and cad2-1mutations in individual
plants was confirmed by sequencing PCR products obtained with the
following primer pair: 59-ACCAACTATCTACGG-39 and 59-CATACCA-
GAGTTATAAGGTGGG-39 (59 at 2572 and 3386 in EMBL accession
number AF068299).
Imaging and Measurement of Luciferase Activity
and H2O2 Accumulation
The imaging and in vitro determination of luciferase activity was as
described previously (Karpinski et al., 1999; Chang et al., 2004). The
visual detection of H2O2 was performed as described by Fryer et al.
(2002). Total foliar H2O2 was determined as described by Creissen et al.
(1999), except that 100 mg of Arabidopsis leaf tissue per 1 mL of
extraction medium was used.
Preparation of RNA and RNA Gel Blots
Total RNA was isolated from leaves as described previously (Bechtold
et al., 2004; Chang et al., 2004). A minimum of three RNA preparations
each from a separate plant was made per time point. Preparation of RNA
gel blots and the probes for APX1 (At1g07890.1), APX2 (At3g09640.1),
andAPX3 (At4g35000.1) have been described previously (Karpinski et al.,
1997). Other probes used in the RNA gel blots or DNA gel blots were from
ESTs obtained from the ABRC (Cleveland, OH). The inserts were
amplified by PCR using universal and reverse primers. These ESTs used
are as follows: APX4 (At1g77490.1, AA042529), APX5 (At4g08390.1,
T41685), CAT1 (At1g70630.1, T43867), CAT2 (At4g35090, T41566),
CAT3 (At1g20620.1, N38125), CSD1 (At1g08830.1, T42186), CSD2
(At2g28190.1, H36758), CSD3 (At5g18100.1, T88473), DHAR1
(At1g19570.1, H37392), DHAR2 (At1g75270, N37468), DHAR3
(At5g16710.1, H37601), FSD1 (At4g25100.2, AA042744), FSD2
(At5g51100.1, Y12641), GOR1 (At3g54660.1, D89620), GOR2
(At3g24170.1, U37697), GPX1 (At2g925080, AJ000469), GPX7
(At4g31875.1, NL049607), GSH1 (At4g23100.1, R84030), GSH2
(At5g27380.1, T43120), MDAR1 (At1g63940.2, T04550), MDAR2
(At5g03630.1, R64883), and MSD1 (At3g10920.1, T20828). The pea
(Pisum sativum)ACTIN probe used to checkRNA loadingswas recovered
by PCR from a full-length cDNA inserted the plasmid pBluescript SKþ(X67666) using T3 and T7 primers.
2458 The Plant Cell

PCR Procedures for Analysis of RNA
The blotting and probing of 39RACE products (Frohman et al., 1988) was
used to analyze APX2 and APX1 expression as previously described
(Bechtold et al., 2004; Chang et al., 2004). qRT-PCRwas performed using
a cybergreen fluorescence-based assay kit (DyNAmo SBYRGreen qPCR
kit; Finnzymes Oy, Espoo, Finland) according to the manufacturer’s
instructions. The PCR reactions and calculation were performed on an
Opticon 2 real-time PCR machine using the manufacturer’s software
(Genetics Research Instrumentation, Braintree, UK). All mRNA levels
were calculated from threshold cycle values and as relative to controls
and normalized with respect to actin transcript levels according to Gruber
et al. (2001). The primers used in qRT-PCR are given in Supplemental
Table 2S online.
Microarray Analysis
Nine Affymetrix 8K GeneChips (Affymetrix, Santa Clara, CA; Zhu and
Wang, 2000) were hybridized with target cRNA prepared from each of
three independent RNA preparations for mutants and wild-type control.
The plants were grown in a randomized block design mixing up plants for
each of cad2-1, rax1-1, and the wild type (Col-0/APX2LUC). Each RNA
preparation was pooled from eight 5-week-old short day–grown plants.
RNAquality was assessed by running 1mL of eachRNAsample onAgilent
RNA6000nano LabChips (Agilent Technology 2100 Bioanalyzer version
A.01.20 SI211; Agilent Technologies, Palo Alto, CA). Affymetrix
GeneChip array expression profiling was performed at the John Innes
Centre Genome Lab, http://www.jicgenomelab.co.uk. All protocols used
can be found in the Affymetrix Expression Analysis Technical Manual II
(Affymetrix Manual II; http://www.affymetrix.com/support/technical/
manuals.affx). After reading, the initial microarray data files were analyzed
using Affymetrix software Microarray Suite (version 5.0). This included
calculation of absolute values and normalization of the datawith respect to
internal standards. The data were then imported into Microsoft Excel, and
threepairwisecomparisonswereperformedofcad2-1versus thewild type,
rax1-1 versus the wild type, and a comparison of two randomly mixed
samples. According to the detection call given to each probe set in each
experiment (P, present; M, marginal; A, absent), the six data sets were
classified and those having 6 P; 5 P þ 1 M; 4 P þ 2 M; 5 P þ 1 A were
accepted; all the others were discarded. The probe sets were sorted
according to the differences in expression, and genes with less than
a twofold difference were rejected. For each retained probe set, average
signal in mutant, average signal in the wild type, fold change, and t test
values were determined. The randomized test produced a list of 41
upregulated and four downregulated genes. The best t test values resulting
from the randomized test were between 10 and 1000 times larger than
those obtained in the mutant versus the wild type analyses. The identifi-
cation of genes corresponding to the probe sets was performed using
identifiers downloaded as a text file (affy8k-2002-12-23.txt) from the TAIR
Web site (www.arabidopsis.org). Further analysis of the data used the
following Web-based resources: The National Center for Biotechnology
Information (http://www.ncbi.nlm.nih.gov/), The Institute for Genomic
Research (www.tigr.org), the Affymetrix Web site, including Netaff-X tools
(www.affymetrix.com), the Salk Institute Genomic Analysis Laboratory
(http://signal.salk.edu/dgenome.html), and theGeneOntologyConsortium
(www.geneontology.org/index.shtml).
Thiol Determinations
The determination of glutathione, g-EC, and Cys contents as both
oxidized and reduced forms was performed as previously described
(Creissen et al., 1999; Bechtold et al., 2004).
Enzyme Assays
SOD, MDAR, and APX activity determinations were performed on
Arabidopsis cell-free leaf extracts using the protocols of Jimenez et al.
(1997). The activity of g-ECS was determined in cell-free foliar extracts of
Arabidopsis, prepared from 100mg of leaf material per 1mL of extraction
buffer, essentially as described by Creissen et al. (1999). All data were
calculated on a fresh weight basis.
ACKNOWLEDGMENTS
L.B. and N.L. gratefully acknowledge the support of research student-
ships from the Biotechnology and Biological Sciences Research
Council. J.M.-C. gratefully acknowledges the support of a research
studentship from the Mexican government. The Core Strategic Grant
awarded to the John Innes Centre from the Biotechnology and Bi-
ological Sciences Research Council supported this work. S.K. and D.F.
acknowledge the financial support from the Department of Botany at
Stockholm University, the Swedish Research Councils, from Carl
Tryggers Foundation and the Swedish Council for International Co-
operation in Research and Higher Education, and from Wallenberg
Consortium North.
Received March 15, 2004; accepted May 29, 2004.
REFERENCES
Allan, A.C., and Fluhr, R. (1997). Two distinct sources of elicited
reactive oxygen species in tobacco epidermal cells. Plant Cell 9,
1559–1572.
Asada, K. (1999). The water-water cycle in chloroplasts: Scavenging of
active oxygen species and dissipation of excess photons. Annu. Rev.
Plant Physiol. Mol. Biol. 50, 601–639.
Ball, L. (2001). Identification of Arabidopsis Mutants with Altered
ASCORBATE PEROXIDASE II Gene Expression. PhD dissertation
(Norwich, UK: University of East Anglia).
Bechtold, U., Murphy, D.J., and Mullineaux, P.M. (2004). Arabidopsis
peptide methionine sulfoxide reductase2 prevents cellular oxidative
damage in long nights. Plant Cell 16, 908–919.
Berger, S., Mitchell-Olds, T., and Stotz, H.U. (2002). Local and
differential control of vegetative storage protein expression in re-
sponse to herbivore damage in Arabidopsis thaliana. Physiol. Plant
114, 85–91.
Bruggemann, W., Beyel, V., Brodka, M., Poth, H., Weil, M., and
Stockhaus, J. (1999). Antioxidants and antioxidative enzymes in wild-
type and transgenic Lycopersicon genotypes of different chilling
tolerance. J. Plant Physiol. 140, 145–154.
Cameron, R.K., Paiva, N.L., Lamb, C.J., and Dixon, R.A. (1999).
Accumulation of salicylic acid and PR-1 gene transcripts in relation to
the systemic acquired resistance (SAR) response induced by Pseu-
domonas syringae pv. tomato in Arabidopsis. Physiol. Mol. Plant
Pathol. 55, 121–130.
Chang, C.C.-C., Ball, L., Fryer, M.J., Baker, N.R., Karpinski, S., and
Mullineaux, P.M. (2004). Induction of ASCORBATE PEROXIDASE 2
expression in wounded Arabidopsis leaves does not involve known
wound-signalling pathways but is associated with changes in photo-
synthesis. Plant J. 38, 499–511.
Chaumont, M., Morot-Gaudry, J.F., and Foyer, C.H. (1995). Effects of
photoinhibitory treatment on CO2 assimilation, D1 protein, ascorbate,
APX2 Expression and Glutathione 2459
glutathione and xanthophyll contents and the electron transport rate
in vine leaves. Plant Cell Environ. 18, 1358–1366.
Chen, M.-H., Sheng, J., Hind, G., Handa, A.K., and Citovsky, V.
(2000). Interaction between tobacco mosaic virus movement protein
and host cell pectin methylesterases is required for viral cell-to-cell
movement. EMBO J. 19, 913–920.
Cobbett, C.S., May, M.J., Howden, R., and Rolls, B. (1998). The
glutathione deficient, cadmium-sensitive mutant, cad2-1 of Arabidop-
sis thaliana is deficient in g-glutamylcysteine synthetase. Plant J. 16,
73–78.
Collinge, M., and Boller, T. (2001). Differential induction of two
potato genes, Stprx2 and StNAC, in response to infection by
Phytopthora infestans and to wounding. Plant Mol. Biol. 46,
521–529.
Conklin, P.L., Williams, E.H., and Last, R.L. (1996). Environmental
stress sensitivity of an ascorbic acid-deficient Arabidopsis mutant.
Proc. Natl. Acad. Sci. USA 93, 9970–9974.
Cooper, C.E., Patel, R.P., Brookes, P.S., and Darley-Usmar, V.M.
(2002). Nanotransducers in cellular redox signaling: Modification of
thiols by reactive oxygen and nitrogen species. Trends Biochem. Sci.
27, 489–492.
Creissen, G., Firmin, J., Fryer, M., Kular, B., Leyland, N., Reynolds,
H., Pastori, G., Wellburn, F., Baker, N., Wellburn, A., and
Mullineaux, P. (1999). Elevated glutathione biosynthetic capacity
in the chloroplasts of transgenic tobacco plants paradoxically causes
increased oxidative stress. Plant Cell 11, 1277–1292.
Delaunay, A., Pflieger, D., Barrault, M.-B., Vinh, J., and Toledano,
M.B. (2002). A thiol peroxidase is an H2O2 receptor and a redox-
transducer in gene activation. Cell 111, 471–481.
De Vos, R.H.C., Vonk, M.J., Vooijs, R., and Schat, H. (1992).
Glutathione depletion due to copper-induced phytochelatin synthesis
causes oxidative stress in Silene cucubalus. Plant Physiol. 98,
853–858.
Duval, M., Hsieh, T.-F., Kim, S.Y., and Thomas, T.L. (2002). Molecular
characterization of AtNAM: A member of the Arabidopsis NAC domain
superfamily. Plant Mol. Biol. 50, 237–248.
Frohman, M.A., Dush, M.K., and Martin, G.R. (1988). Rapid production
of full-length cDNAs from rare transcripts: Amplification using a single
gene specific oligonucleotide primer. Proc. Natl. Acad. Sci. USA 85,
8998–9002.
Fryer, M.J., Ball, L., Oxborough, K., Karpinski, S., Mullineaux, P.M.,
and Baker, N.R. (2003). Control of Ascorbate Peroxidase 2 expres-
sion by hydrogen peroxide and leaf water status during excess light
stress reveals a functional organisation of Arabidopsis leaves. Plant J.
33, 691–705.
Fryer, M.J., Oxborough, K., Mullineaux, P.M., and Baker, N.R. (2002).
Imaging photo-oxidative stress responses in leaves. J. Exp. Bot. 53,
1249–1254.
Gallouzi, I.-E., Brennan, C.M., and Steitz, J.A. (2001). Protein ligands
mediate the CRM1-dependent export of HuR in response to heat
shock. RNA 7, 1348–1361.
de A Gerhardt, L.B., Sachetto-Martins, G., Contarini, M.G.,
Sandroni, M., de P Ferreira, R., de Lima, V.M., Cordeiro, M.C.,
de Oliveira, D.E., and Margis-Pinheiro, M. (1997). Arabidopsis
thaliana class IV chitinase is early induced during the interaction with
Xanthomonas campestris. FEBS Lett. 419, 69–75.
Grant, J.J., and Loake, G.J. (2000). Role of reactive oxygen intermedi-
ates and cognate redox signaling in disease resistance. Plant Physiol.
124, 21–29.
Gruber, F., Falkner, F.G., Dorner, F., and Hammerlee, T. (2001).
Quantitation of viral DNA by real-time PCR applying duplex amplifi-
cation, internal standardization, and two-color fluorescence detec-
tion. Appl. Environ. Microbiol. 67, 2837–2839.
Han, J., Modha, D., and White, E. (1998). Interaction of E1B 19K with
Bax is required to block Bax-induced loss of mitochondrial membrane
potential and apoptosis. Oncogene 17, 2993–3005.
Hernandez, J.A., Jimenez, A., Mullineaux, P., and Sevilla, F. (2000).
Tolerance of pea (Pisum sativum L.) to long-term salt stress is
associated with induction of antioxidant defenses. Plant Cell Environ.
23, 853–862.
Hirschi, K.D. (1999). Expression of Arabidopsis CAX1 in tobacco:
Altered calcium homeostasis and increased stress sensitivity. Plant
Cell 11, 2113–2122.
Hoeberichts, F.A., and Woltering, E.J. (2003). Multiple mediators
of plant programmed cell death: Interplay of conserved cell
death mechanisms and plant-specific regulators. Bioessays 25,
47–57.
Iliev, E.A., Xu, W., Polisensky, D.H., Oh, M.-H., Torisky, R.S., Clouse,
S.D., and Braam, J. (2002). Transcriptional and postranscriptional
regulation of Arabidopsis TCH4 expression by diverse stimuli. Roles
of cis regions and brassinosteroids. Plant Physiol. 130, 770–783.
Irihimovitch, V., and Shapira, M. (2000). Glutathione redox potential
modulated by reactive oxygen species regulates translation of
Rubisco large subunit in the chloroplast. J. Biol. Chem. 275, 16289–
16295.
Iturbe-Ormataexe, I., Escuredo, P.R., Arresse-Igor, C., and Becana,
M. (1998). Oxidative damage in pea plants exposed to water deficit or
paraquat. Plant Physiol. 116, 173–181.
Jander, G., Norris, S.R., Rounsley, S.D., Bush, D.F., Levin, I.M.,
and Last, R.L. (2002). Arabidopsis map-based cloning in the post-
genomic era. Plant Physiol. 129, 440–450.
Jang, I.-C., Oh, S.-J., Seo, J.-S., Choi, W.-B., Chong, S.-I., Kim,
C.-H., Kim, Y.S., Seo, H.-S., Choi, Y.D., Nahm, B.H., and Kim,
J.-K. (2003). Expression of a bifunctional fusion of the Escherichia
coli genes for trehalose-6-phosphate synthase and trehalose-6-phos-
phate phosphatase in transgenic rice plants increases trehalose
accumulation and abiotic stress tolerance with stunting growth. Plant
Physiol. 131, 516–524.
Jimenez, A., Hernandez, J.A., del Rio, J.A., and Sevilla, F. (1997).
Evidence for the presence of the ascorbate-glutathione cycle in
mitochondria and peroxisomes of pea leaves. Plant Physiol. 114,
275–284.
Kampfenkel, K., Van Montagu, M., and Inze, D. (1995). Effects of iron
excess on Nicotiana plumbaginifolia plants. Plant Physiol. 107,
725–735.
Karpinska, B., Wingsle, G., and Karpinski, S. (2000). Antago-
nistic effects of hydrogen peroxide and glutathione on accli-
mation to excess excitation energy in Arabidopsis. IUBMB Life 50,
21–26.
Karpinski, S., Escobar, C., Karpinska, B., Creissen, G.,
and Mullineaux, P.M. (1997). Photosynthetic electron transport
regulates the expression of cytosolic ascorbate peroxidase
genes in Arabidopsis during excess light stress. Plant Cell 9,
627–640.
Karpinski, S., Reynolds, H., Karpinska, B., Wingsle, G., Creissen, G.,
and Mullineaux, P. (1999). Systemic signaling and acclimation in
response to excess excitation energy in Arabidopsis. Science 284,
654–657.
Klatt, P., and Lamas, S. (2000). Regulation of protein function by
S-glutathiolation in response to oxidative and nitrosative stress.
Eur. J. Biochem. 267, 4928–4944.
Koumoto, Y., Tsugeki, R., Shimada, T., Mori, H., Kondo, M., Hara-
Nishimura, I., and Nishimura, M. (1996). Isolation and character-
ization of a cDNA encoding mitochondrial chaperonin 10 from
Arabidopsis thaliana by functional complementation of an Escherichia
coli groES mutant. Plant J. 10, 1119–1125.
2460 The Plant Cell
Leuder, D.V., and Phillips, M.A. (1996). Characterization of
Trypanosoma brucei g-glutamylcysteine synthetase, an essential
enzyme in the biosynthesis of trypanothione (diglutathionylspermi-
dine). J. Biol. Chem. 271, 17485–17490.
Lopukhina, A., Dettenberg, M., Weiler, E.W., and Hollander-Czytko,
H. (2001). Cloning and characterization of a coronatine-regulated
tyrosine aminotransferase from Arabidopsis. Plant Physiol. 126, 1678–
1687.
Loyall, L., Uchida, K., Braun, S., Furuya, M., and Frohnmeyer, H.
(2000). Glutathione and a UV light-induced glutathione-S-transferase
are involved in signaling to chalcone synthase in cell cultures. Plant
Cell 12, 1939–1950.
May, M.J., Hammond-Kosack, K.E., and Jones, J.D.G. (1996). In-
volvement of reactive oxygen species, glutathione metabolism, and
lipid peroxidation in the Cf-gene-dependent defense response of
tomato cotyledons induced by race-specific elicitors of Cladosporium
fulvum. Plant Physiol. 110, 1367–1379.
Meinhard, M., Rodriguez, P.L., and Grill, E. (2002). The sensitivity of
ABI2 to hydrogen peroxide links the abscisic acid-response regulator
to redox signalling. Planta 214, 775–782.
Meyer, A.J., and Fricker, M.D. (2002). Control of demand-driven
biosynthesis of glutathione in green Arabidopsis suspension culture
cells. Plant Physiol. 130, 1927–1937.
Mira, H., Martinez, N., and Penarrubia, L. (2002). Expression of
a vegetative-storage-protein gene from Arabidopsis is regulated by
copper, senescence and ozone. Planta 214, 939–946.
Mou, Z., Fan, W., and Dong, X. (2003). Inducers of plant systemic
acquired resistance regulate NPR1 function through redox changes.
Cell 113, 935–944.
Murgia, I., Briat, J.F., Tarantino, D., and Soave, C. (2001). Plant ferritin
acumulates in response to photoinhibition but its ectopic overexpres-
sion does not protect against photoinhibition. Plant Physiol. Biochem.
39, 797–805.
Murgia, I., Delledonne, M., and Soave, C. (2002). Nitric oxide mediates
iron-induced ferritin accumulation in Arabidopsis. Plant J. 30, 521–528.
Muskett, P.R., Kahn, K., Austin, M.J., Moisan, L.J., Sadandom, A.,
Shirasu, K., Jones, J.D.G., and Parker, J.E. (2002). Arabidopsis
RAR1 exerts rate-limiting control of R gene-mediated defenses
against multiple pathogens. Plant Cell 14, 979–992.
Nikiforova, V., Freitag, J., Kempa, S., Adamik, M., Hesse, H., and
Hoefgen, R. (2003). Transcriptome analysis of sulfur depletion in
Arabidopsis thaliana: Interlacing of biosynthetic pathways provides
response specificity. Plant J. 33, 633–650.
Niyogi, K.K., Grossman, A.R., and Bjorkman, O. (1998). Arabidopsis
mutants define a central role for the xanthophyll cycle in the regulation
of photosynthetic energy conversion. Plant Cell 10, 1121–1134.
Noctor, G., Gornez, L., Vanacker, H., and Foyer, C.H. (2002).
Interactions between biosynthesis, compartmentation and transport
in the control of glutathione homeostasis and signaling. J. Exp. Bot.
53, 1283–1304.
op den Camp, R.G.L., Przbyla, D., Ochsenbein, C., Laloi, C., Kim, C.,
Danon, A., Wagner, D., Hideg, E., Gobel, C., Feussner, I., Nater,
M., and Apel, K. (2003). Rapid induction of distinct stress responses
after the release of singlet oxygen in Arabidopsis. Plant Cell 15, 2320–
2332.
Ort, D.R., and Baker, N.R. (2002). A photoprotective role for O2 as an
alternative electron sink in photosynthesis. Curr. Opin. Plant Biol. 5,
193–198.
Paget, M.S.B., and Buttner, M.J. (2003). Thiol-based regulatory
switches. Annu. Rev. Genet. 37, 91–121.
Park, Y.-S., Min, H.-J., Ryang, S.-H., Oh, K.-J., Cha, J.-S., Kim, H.Y.,
and Cho, T.-J. (2003). Characterization of salicylic acid-induced
genes in Chinese cabbage. Plant Cell Rep. 21, 1027–1034.
Pfannschmidt, T. (2003). Chloroplast redox signals: How photosynthe-
sis controls its own genes. Trends Plant Sci. 8, 33–41.
Pneuli, L., Liang, H., Rozenberg, M., and Mittler, R. (2003). Growth
suppression, altered stomatal responses, and augmented induction of
heat shock proteins in cytosolic ascorbate peroxidase (Apx1)-
deficient Arabidopsis plants. Plant J. 34, 187–203.
Rauser, W.E., Schupp, R., and Rennenberg, H. (1991). Cysteine,
g-glutamylcysteine, and glutathione levels in maize seedlings: Dis-
tribution and translocation in normal and cadmium-exposed plants.
Plant Physiol. 97, 128–138.
Rawlins, M.R., Leaver, C.J., and May, M.J. (1995). Characterisation of
a cDNA encoding Arabidopsis glutathione synthetase. FEBS Lett. 376,
81–86.
Rezzonico, E., Flury, N., Meins, F., and Beffa, R. (1998). Transcrip-
tional down-regulation by abscisic acid of pathogenesis-related
B-1,3-glucanase genes in tobacco cell cultures. Plant Physiol. 117,
585–592.
Rogers, E.E., and Ausubel, F.M. (1997). Arabidopsis enhanced disease
susceptibility mutants exhibit enhanced susceptibility to several
bacterial pathogens and alterations in PR-1 gene expression. Plant
Cell 9, 305–316.
Rossel, J.B., Wilson, I.M., and Pogson, B.J. (2002). Global changes in
gene expression in response to high light in Arabidopsis. Plant
Physiol. 130, 1109–1120.
Sandorf, I., and Hollander-Czytko, H. (2002). Jasmonate is involved in
the induction of tyrosine aminotransferase and tocopherol biosynthe-
sis in Arabidopsis thaliana. Planta 216, 173–179.
Schafer, F.Q., and Buettner, G.R. (2001). Redox environment of the
cell as viewed through the redox state of the glutathione disulfide/
glutathione couple. Free Rad. Biol. Med. 30, 1191–1212.
Schaller, F. (2001). Enzymes of the biosynthesis of octadecanoid-
derived signalling molecules. J. Exp. Bot. 52, 11–23.
Soderman, E., Mattsson, J., and Engstrom, P. (1996). The Arabidop-
sis homeobox gene ATHB-7 is induced by water deficit and abscisic
acid. Plant J. 10, 375–381.
Storozhenko, S., Belles-Boix, E., Babiychuk, E., Herouart, D., Davey,
M.W., Slooten, L., Van Montagu, M., Inze, D., and Kushnir, S.
(2002). g-Glutamyl transpeptidase in transgenic tobacco plants.
Cellular localization, processing and biochemical properties. Plant
Physiol. 128, 1109–1119.
Utsugi, S., Sakamoto, W., Murata, M., and Motoyoshi, F. (1998).
Arabidopsis thaliana vegetative storage protein (VSP) genes: Gene or-
ganization and tissue-specific expression. PlantMol. Biol. 38, 565–576.
Vernoux, T., Wilson, R.C., Seeley, K.A., Reicheld, J.P., Muroy, S.,
Brown, S., Maughan, S.C., Cobbett, C.S., Van Montagu, M., Inze,
D., May, M.J., and Sung, Z.R. (2000). The ROOT MERISTEMLESS/
CADMIUM SENSITIVE 2 gene defines a glutathione dependent
pathway involved in initiation and maintenance of cell division during
postembryonic root development. Plant Cell 12, 97–110.
Walker, M.A., and McKersie, B.D. (1993). Role of the ascorbate-
glutathione antioxidant system in chilling resistance in tomato. J. Plant
Physiol. 141, 234–239.
Welin, B.V., Olson, A., Nylander, M., and Palva, E.T. (1994). Charac-
terization and differential expression of DHN/LEA/RAB-like genes
during cold-acclimation and drought stress in Arabidopsis thaliana.
Plant Mol. Biol. 26, 131–144.
Willekens, H., Chamnongpol, S., Davey, M., Schraudner, M.,
Langebartels, C., Van Montagu, M., Inze, D., and Van Camp,
W. (1997). Catalase is a sink for H2O2 and is indispensable for stress
defence in C3 plants. EMBO J. 16, 4806–4816.
Wingate, V.M.P., Lawton, M.A., and Lamb, C.J. (1988). Glutathione
causes a massive and selective induction of plant defense genes.
Plant Physiol. 87, 206–210.
APX2 Expression and Glutathione 2461

Wingler, A. (2002). The function of trehalose biosynthesis in plants.
Phytochemistry 60, 437–440.
Wingsle, G., and Karpinski, S. (1996). Differential redox regula-
tion of glutathione reductase and Cu/Zn superoxide dismutase
gene expression in Pinus sylvestris L. needles. Planta 198,
151–157.
Xiang, C., and Oliver, D.J. (1998). Glutathione metabolic genes co-
ordinately respond to heavy metals and jasmonic acid in Arabidopsis.
Plant Cell 10, 1539–1550.
Xiang, C., Werner, B.L., Christensen, E.M., and Oliver, D.J. (2001).
The biological functions of glutathione revisited in Arabidopsis trans-
genic plants with altered glutathione levels. Plant Physiol. 126,
564–574.
Zhang, B., Ramonell, K., Somerville, S., and Stacey, G. (2002).
Characterization of early, chitin-induced gene expression in Arabi-
dopsis. Mol. Plant-Microbe Interact. 15, 963–970.
Zhu, T., and Wang, X. (2000). Large-scale profiling of the Arabidopsis
transcriptome. Plant Physiol. 124, 1472–1476.
2462 The Plant Cell