Event-related fMRI analysis of the cerebral circuit for number comparison
7
Brain Imaging NeuroReport 0959-4965 # Lippincott Williams & Wilkins Event-related fMRI analysis of the cerebral circuit for number comparison Philippe Pinel, Gurvan Le Clec’H, Pierre-Francois van de Moortele, 1 Lionel Naccache, Denis Le Bihan 1 and Stanislas Dehaene CA INSERM U.334, and 1 Service Hospitalier Frederic Joliot, CEA/DSV, 4 place du Ge ´ne ´ ral Leclerc, 91401 Orsay, France CA Corresponding Author CEREBRAL activity during number comparison was studied with functional magnetic resonance imaging using an event-related design. We identified an extended network of task-related areas that showed a phasic activation following each trial, including anterior cin- gulate, bilateral sensorimotor areas, inferior occipito- temporal cortices, posterior parietal cortices, inferior and dorsolateral prefrontal cortices, and thalami. We then tested which of these areas were affected by number notation, numerical distance and response side, three variables that specifically target processes of visual identification, quantity manipulation and motor re- sponse in a serial-stage model of the number compari- son task. Our results confirm the role of the right fusiform gyrus in digit identification processes, and of the inferior parietal lobule in the internal manipulation of numerical quantities. NeuroReport 10:1473–1479 # 1999 Lippincott Williams & Wilkins. Key words: Arithmetic; Distance effect; Fusiform gyrus; Parietal cortex Introduction Brain imaging techniques often reveal a large net- work of cerebral areas involved in a cognitive task. Assigning a precise function to each of these acti- vated areas, however, can be difficult. Here, we address this issue using an extension of the logic of additive factors [1,2]. By selectively manipulating orthogonal parameters of the stimulus set, and identifying which brain areas are implied in proces- sing each parameter, we provide a functional decom- position of the active network. This strategy was applied to a simple number comparison task, in which subjects decide whether a visually presented number is larger or smaller than 5. Models of this task [2–6] decompose it into three successive stages of visual identification (affected by the notation of the stimuli, Arabic or verbal), magnitude compari- son (affected by the distance between the number and 5), and response elaboration and execution (affected by the hand used for responding). A previous event-related potential (ERP) study of this task [2] suggested a temporal and spatial localization of these processes. Visual identification was hy- pothesized to involve the ventral occipito-temporal region at about 150 ms post-stimulus, bilaterally for Arabic numerals (e.g. 4) and with a left lateralization for verbal numerals (e.g. FOUR). Magnitude com- parison involved the left and right inferior parietal regions at about 180 ms post-stimulus, while motor processes were related to the left and right motor cortices starting about 140 ms before the key press. We examined whether these tentative localizations could be confirmed with the anatomically accurate method of functional magnetic resonance imaging (fMRI). Using an event-related design [7] and a statistical analysis capable of detecting any change in the size, shape or amplitude of the blood flow response in local regions, we were able to detect small parameter-dependent effects which were not seen with a more standard method based on statis- tical parameter mapping (SPM). Materials and Methods Subjects: Subjects were 11 healthy volunteers (two women and nine men; mean age 25.7 years), who gave their written informed consent. All subjects were right-handed according to the Edinburgh in- ventory. The protocol was approved by an institu- tional ethical committee for biomedical research. Stimuli: An event-related design was used. A list of 128 randomly intermixed stimuli was presented through mirror glasses and an active matrix video projector (EGA mode, 70 Hz refresh rate), with a 14 s inter-stimulus interval. The fMRI images ana- lyzed here result from a masked priming experiment [8]. Stimuli consisted in an initial random letter string (duration 71 ms), then a numerical prime NeuroReport 10, 1473–1479 (1999) Vol 10 No 7 14 May 1999 1473
-
Upload
independent -
Category
Documents
-
view
5 -
download
0
Transcript of Event-related fMRI analysis of the cerebral circuit for number comparison

Brain Imaging NeuroReport
0959-4965 # Lippincott Williams & Wilkins
Event-related fMRIanalysis of the cerebralcircuit for numbercomparison
Philippe Pinel, Gurvan Le Clec'H,Pierre-Francois van de Moortele,1
Lionel Naccache, Denis Le Bihan1 andStanislas DehaeneCA
INSERM U.334, and 1Service Hospitalier FredericJoliot, CEA/DSV, 4 place du GeÂneÂral Leclerc,91401 Orsay, France
CACorresponding Author
CEREBRAL activity during number comparison wasstudied with functional magnetic resonance imagingusing an event-related design. We identi®ed an extendednetwork of task-related areas that showed a phasicactivation following each trial, including anterior cin-gulate, bilateral sensorimotor areas, inferior occipito-temporal cortices, posterior parietal cortices, inferiorand dorsolateral prefrontal cortices, and thalami. Wethen tested which of these areas were affected bynumber notation, numerical distance and response side,three variables that speci®cally target processes of visualidenti®cation, quantity manipulation and motor re-sponse in a serial-stage model of the number compari-son task. Our results con®rm the role of the rightfusiform gyrus in digit identi®cation processes, and ofthe inferior parietal lobule in the internal manipulationof numerical quantities. NeuroReport 10:1473±1479 #1999 Lippincott Williams & Wilkins.
Key words: Arithmetic; Distance effect; Fusiform gyrus;Parietal cortex
Introduction
Brain imaging techniques often reveal a large net-work of cerebral areas involved in a cognitive task.Assigning a precise function to each of these acti-vated areas, however, can be dif®cult. Here, weaddress this issue using an extension of the logic ofadditive factors [1,2]. By selectively manipulatingorthogonal parameters of the stimulus set, andidentifying which brain areas are implied in proces-sing each parameter, we provide a functional decom-position of the active network. This strategy wasapplied to a simple number comparison task, inwhich subjects decide whether a visually presentednumber is larger or smaller than 5. Models of thistask [2±6] decompose it into three successive stagesof visual identi®cation (affected by the notation ofthe stimuli, Arabic or verbal), magnitude compari-son (affected by the distance between the numberand 5), and response elaboration and execution(affected by the hand used for responding). Aprevious event-related potential (ERP) study of thistask [2] suggested a temporal and spatial localizationof these processes. Visual identi®cation was hy-pothesized to involve the ventral occipito-temporalregion at about 150 ms post-stimulus, bilaterally forArabic numerals (e.g. 4) and with a left lateralizationfor verbal numerals (e.g. FOUR). Magnitude com-parison involved the left and right inferior parietalregions at about 180 ms post-stimulus, while motor
processes were related to the left and right motorcortices starting about 140 ms before the key press.
We examined whether these tentative localizationscould be con®rmed with the anatomically accuratemethod of functional magnetic resonance imaging(fMRI). Using an event-related design [7] and astatistical analysis capable of detecting any change inthe size, shape or amplitude of the blood ¯owresponse in local regions, we were able to detectsmall parameter-dependent effects which were notseen with a more standard method based on statis-tical parameter mapping (SPM).
Materials and Methods
Subjects: Subjects were 11 healthy volunteers (twowomen and nine men; mean age 25.7 years), whogave their written informed consent. All subjectswere right-handed according to the Edinburgh in-ventory. The protocol was approved by an institu-tional ethical committee for biomedical research.
Stimuli: An event-related design was used. A listof 128 randomly intermixed stimuli was presentedthrough mirror glasses and an active matrix videoprojector (EGA mode, 70 Hz refresh rate), with a14 s inter-stimulus interval. The fMRI images ana-lyzed here result from a masked priming experiment[8]. Stimuli consisted in an initial random letterstring (duration 71 ms), then a numerical prime
NeuroReport 10, 1473±1479 (1999)
Vol 10 No 7 14 May 1999 1473

(43 ms), another random letter string (71 ms), and®nally a target number (200 ms). The subject wasasked to decide whether the target number waslarger or smaller than 5 by pressing a button withhis right or left hand. Subjects performed two blocksof 32 trials with the larger response assigned to theright hand, and two blocks to the left hand, inrandom order. Here, we limit our investigations tothe cerebral activation associated with three para-meters of interest: the notation of the target (verbalor Arabic) ; its distance from 5 (two targets wereclose (4 and 6), and two were far (1 and 9)); and itsaccompanying motor response (right or left hand).These are the same parameters that were studied inan earlier ERP study of number comparison [2]. Theprime number varied orthogonally to the targetnumber, following the same parameters. Its effectshave been described in part elsewhere [8]. Since thismasked prime was not consciously seen by thesubjects, and since its effects were very small, theyare not studied in the present report, which is morespeci®cally dedicated to the comparison task.
Image acquisition: On each trial, stimulus onsetwas synchronized with the acquisition of the ®rstslice in a series of seven volumes of 18 slices each(one volume every 2 s). We used a gradient-echoecho-planar imaging sequence sensitive to brain oxy-gen-level dependent contrast (18 contiguous axialslices, 6 mm thickness, TR/TE� 2000/40 ms, in-plane resolution 3 3 4 mm2, 64 3 64 matrix) on a 3 Twhole body system (Bruker, Germany). High-reso-lution anatomical images (3D gradient-echo inver-sion-recovery sequence, T1� 700 ms, TR� 1600 ms,FOV� 192 3 256 mm2, matrix� 128 3 128 3 256,slice thickness� 1 mm) were also acquired.
Image analysis: Analysis was performed with sta-tistical parameter mapping software (SPM96: http://www.®l.ion.ucl.ac.uk/spm). Images were correctedfor subject motion, normalized to Talairach coordi-nates [9] using a linear transform calculated on theanatomical images, and smoothed (FWHM�15 mm). For each subject, correct trials were aver-aged together separately for each level of targetdistance, notation and response side. Thus, the datawere reduced to eight average trials for each subject,each consisting of seven consecutive volumes span-ning the 14 s interval following each stimulus (for atotal of 56 average volumes per subject). The averageimages from all 11 subjects were then analyzedtogether. The generalized linear model was used tomodel the intensity level of each pixel as a linearcombination, for each subject and each trial type, oftwo activation function with hemodynamic lags of 4and 7 s, thus allowing for differences in acquisition
and activation times across slices and brain regions.Three types of statistics were performed. For SPM-based identi®cation of overall task-related cerebralactivity, we ®rst determined the areas that showed atransient increase in activation following stimuluspresentation, as identi®ed by a signi®cant positivecorrelation with the hemodynamic functions. ForSPM-based contrast analysis, we then used a con-trast analysis to identify areas affected by ourexperimental variables. Statistical maps were formedfor each of six contrasts of interest (Arabic vs verbalfor the notation effect, close vs far for the distanceeffect, right vs left for the response side effect). Avoxel-wise signi®cance level of 0.001, corrected top , 0.05 for multiple comparisons across the brainvolume, was used. We also used an uncorrectedsigni®cance level of 0.001 to test speci®c contrastswith a strong anatomical a priori hypothesis: nota-tion effects within the left and right ventral occipito-temporal pathways, and distance effects within theleft and right parietal lobe. For single-voxel tempor-al pro®le analysis, we searched the entire circuit ofactive areas for notation, distance, and response sideeffects. All 47 local maxima identi®ed in the ®rststep, with a Z score . 8 ( p , 5 3 10ÿ15) wereselected. In each of these voxels, an analysis ofvariance (ANOVA) was applied to the averagefMRI signal with notation, distance, response sideand time as within-subject factors. Signi®cant effectswere identi®ed by testing the interaction termsnotation 3 time, distance 3 time, and response side 3time. We report all signi®cant differences withp , 0.05 (corrected with the Greenhouse-Geissermethod).
Results
Task performance: An ANOVA on correct reac-tion times (RT) showed main effects of distance(F(1,10)� 26.6, p� 0.0004; close 28 ms slower thanfar) and notation (F(1,10)� 11.3, p� 0.0072; verbal18 ms slower than Arabic). The effect of responseside did not reach signi®cance (F(1,10)� 0.34,p� 0.575; left 3 ms slower than right). There was nointeraction of these variables, in good agreementwith previous results and with the proposed serial-stage model of comparison. Error rate averaged1.8% and was not affected by any of these variables.
Overall task-related cerebral activity: The entirecircuit of areas showing a signi®cant transient in-crease in activation following stimulus presentationis shown in Fig. 1 and Table 1. It should be notedthat the amplitude of the activation was not alwayscorrelated with its signi®cance, as assessed by theSPM Z-score. The areas where the percentage acti-
1474 Vol 10 No 7 14 May 1999
NeuroReport P. Pinel et al.

Left hemisphere peaks Right hemisphere peaksAxial slices
1 2
3 4
5 6
7 8
9 10
11 12
13 14
15 16 - distance
17 - response side 17 - notation
18 - response side 19
20 - response side 21 - response side
22 - response side 23
p 5 0.004
p 5 0.018p 5 0.007
p 5 0.001
p 5 0.021 p 5 0.049
p 5 0.001
farcloseverbalarabicright handleft hand
global activation0 4 8 12time (seconds)
20.320.1
0.10.30.50.7
%
24 25
26 27
28 29
30 31
32 33
34 35
36 37
38 39
40 41
42 43 - response side
44 - response side 43 - response side
46 47
p 5 0.001
p , 0.001p 5 0.001
24 25
2627
1
z 5 215 z 5 212
z 5 29 z 5 26
z 5 23 z 5 0
29
28
30
31
32
2
3
z 5 3 z 5 6
z 5 9 z 5 12
33
35
36
34
54
6
z 5 15 z 5 21
37
38
7
8
939
40
z 5 24 z 5 30
z 5 33 z 5 36
11
12
10
1341
43
z 5 39 z 5 48
z 5 54z 5 51
15
14
42
16
1745
46
44
18
21
2219
z 5 60 z 5 63
z 5 69z 5 66
4720
23
z 5 75
Vol 10 No 7 14 May 1999 1475
Cerebral network for number comparison NeuroReport
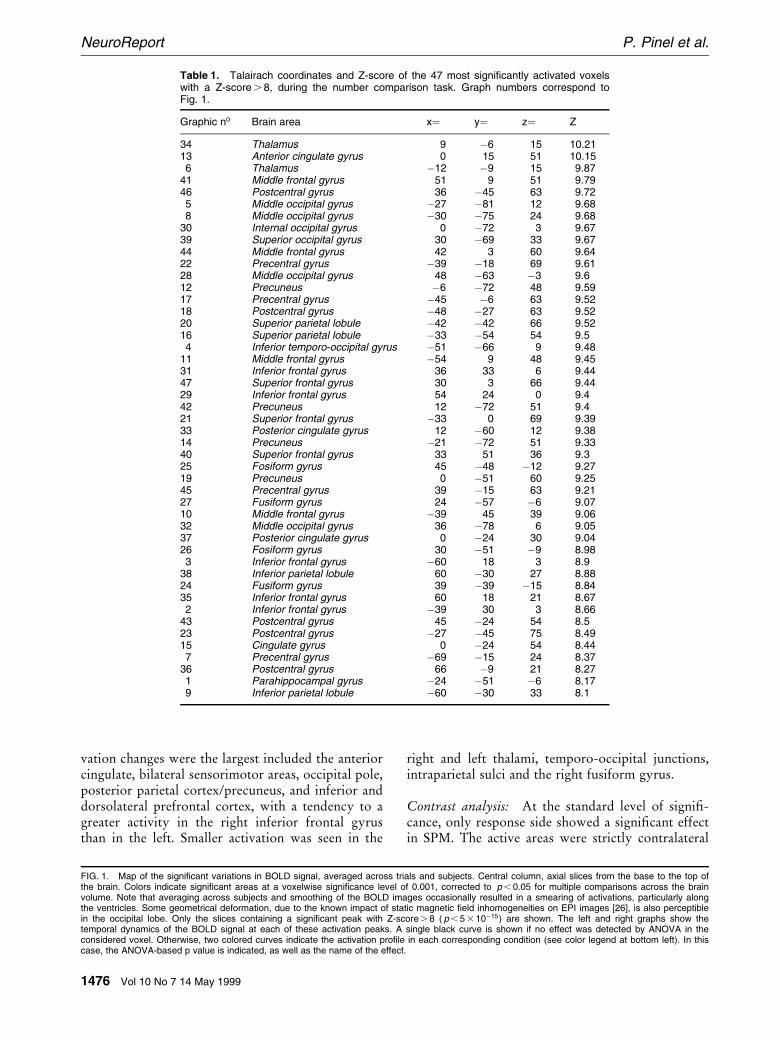
vation changes were the largest included the anteriorcingulate, bilateral sensorimotor areas, occipital pole,posterior parietal cortex/precuneus, and inferior anddorsolateral prefrontal cortex, with a tendency to agreater activity in the right inferior frontal gyrusthan in the left. Smaller activation was seen in the
right and left thalami, temporo-occipital junctions,intraparietal sulci and the right fusiform gyrus.
Contrast analysis: At the standard level of signi®-cance, only response side showed a signi®cant effectin SPM. The active areas were strictly contralateral
FIG. 1. Map of the signi®cant variations in BOLD signal, averaged across trials and subjects. Central column, axial slices from the base to the top ofthe brain. Colors indicate signi®cant areas at a voxelwise signi®cance level of 0.001, corrected to p , 0.05 for multiple comparisons across the brainvolume. Note that averaging across subjects and smoothing of the BOLD images occasionally resulted in a smearing of activations, particularly alongthe ventricles. Some geometrical deformation, due to the known impact of static magnetic ®eld inhomogeneities on EPI images [26], is also perceptiblein the occipital lobe. Only the slices containing a signi®cant peak with Z-score . 8 ( p , 5 3 10ÿ15) are shown. The left and right graphs show thetemporal dynamics of the BOLD signal at each of these activation peaks. A single black curve is shown if no effect was detected by ANOVA in theconsidered voxel. Otherwise, two colored curves indicate the activation pro®le in each corresponding condition (see color legend at bottom left). In thiscase, the ANOVA-based p value is indicated, as well as the name of the effect.
Table 1. Talairach coordinates and Z-score of the 47 most signi®cantly activated voxelswith a Z-score . 8, during the number comparison task. Graph numbers correspond toFig. 1.
Graphic no Brain area x� y� z� Z
34 Thalamus 9 ÿ6 15 10.2113 Anterior cingulate gyrus 0 15 51 10.156 Thalamus ÿ12 ÿ9 15 9.87
41 Middle frontal gyrus 51 9 51 9.7946 Postcentral gyrus 36 ÿ45 63 9.725 Middle occipital gyrus ÿ27 ÿ81 12 9.688 Middle occipital gyrus ÿ30 ÿ75 24 9.68
30 Internal occipital gyrus 0 ÿ72 3 9.6739 Superior occipital gyrus 30 ÿ69 33 9.6744 Middle frontal gyrus 42 3 60 9.6422 Precentral gyrus ÿ39 ÿ18 69 9.6128 Middle occipital gyrus 48 ÿ63 ÿ3 9.612 Precuneus ÿ6 ÿ72 48 9.5917 Precentral gyrus ÿ45 ÿ6 63 9.5218 Postcentral gyrus ÿ48 ÿ27 63 9.5220 Superior parietal lobule ÿ42 ÿ42 66 9.5216 Superior parietal lobule ÿ33 ÿ54 54 9.54 Inferior temporo-occipital gyrus ÿ51 ÿ66 9 9.48
11 Middle frontal gyrus ÿ54 9 48 9.4531 Inferior frontal gyrus 36 33 6 9.4447 Superior frontal gyrus 30 3 66 9.4429 Inferior frontal gyrus 54 24 0 9.442 Precuneus 12 ÿ72 51 9.421 Superior frontal gyrus ÿ33 0 69 9.3933 Posterior cingulate gyrus 12 ÿ60 12 9.3814 Precuneus ÿ21 ÿ72 51 9.3340 Superior frontal gyrus 33 51 36 9.325 Fosiform gyrus 45 ÿ48 ÿ12 9.2719 Precuneus 0 ÿ51 60 9.2545 Precentral gyrus 39 ÿ15 63 9.2127 Fusiform gyrus 24 ÿ57 ÿ6 9.0710 Middle frontal gyrus ÿ39 45 39 9.0632 Middle occipital gyrus 36 ÿ78 6 9.0537 Posterior cingulate gyrus 0 ÿ24 30 9.0426 Fosiform gyrus 30 ÿ51 ÿ9 8.983 Inferior frontal gyrus ÿ60 18 3 8.9
38 Inferior parietal lobule 60 ÿ30 27 8.8824 Fusiform gyrus 39 ÿ39 ÿ15 8.8435 Inferior frontal gyrus 60 18 21 8.672 Inferior frontal gyrus ÿ39 30 3 8.66
43 Postcentral gyrus 45 ÿ24 54 8.523 Postcentral gyrus ÿ27 ÿ45 75 8.4915 Cingulate gyrus 0 ÿ24 54 8.447 Precentral gyrus ÿ69 ÿ15 24 8.37
36 Postcentral gyrus 66 ÿ9 21 8.271 Parahippocampal gyrus ÿ24 ÿ51 ÿ6 8.179 Inferior parietal lobule ÿ60 ÿ30 33 8.1
1476 Vol 10 No 7 14 May 1999
NeuroReport P. Pinel et al.

to the response hand, comprising the right sensor-imotor cortex (Talairach coordinates (TC) 39, ÿ15,63; Z� 9.18), right supplementary motor cortex (TC9, ÿ6, 57; Z� 6.47) and right central/insular cortex(TC 42, ÿ9, 24; Z� 6.53) for left-hand responsesand symmetrical areas (TC ÿ39, ÿ18, 66; Z� 8.81;TC ÿ9, ÿ9, 57; Z� 6.81; TC ÿ45, ÿ12, 24;Z� 5.74) for right-hand responses. At uncorrectedp , 0.001, the anatomically constrained analysisidenti®ed notation and distance effect (see Fig. 2). Asmall area of the right fusiform gyrus was signi®-cantly more activated by Arabic digits than byverbal numerals (TC 54, ÿ51, ÿ6; Z� 3.62; 13voxels). Conversely, no ventral occipito-temporalarea was signi®cantly more activated for verbal thanfor Arabic notation. As for distance effects, a leftinferior parietal area close to the parieto-occipito-temporal boundary was signi®cantly more active fornumbers close to 5 than for numbers far from 5 (TCÿ48, ÿ66, 21; Z� 3.59; 17 voxels). Conversely, aright intraparietal area was signi®cantly more activefor far than for close numbers (TC 48, ÿ36, 39;Z� 3.89; 28 voxels).
Single-voxel temporal pro®le analysis: The 47 iden-ti®ed activation maxima (see Materials and Methods
and Fig. 1) were distributed evenly within thenetwork of active areas, thus allowing us to test fornotation, distance, and response side effects atvarious places throughout this network. Numbernotation affected the activation pro®le in the leftprecentral gyrus. Activation appeared to last longerfor verbal than for Arabic numerals (Fig. 1, box 17).A distance effect was found in the left intraparietalsulcus (Fig. 1, box 16), where numbers close to 5yielded a slightly earlier activation peak than num-bers far from 5. Finally, response side affected manysites distributed bilaterally in precentral and post-central cortices.
Discussion
We used event-related fMRI to analyze an extendedcircuit of brain areas activated phasically duringnumber comparison. In addition to the bilateralparietal activation, which was previously known tobe involved in various number processing tasks [10±12], this circuit included visual and motor corticalareas as well as prefrontal and anterior cingulatecortices. Our event-related design allowed us tovisualize the amplitude and shape of the hemody-namic response in each of these regions. The ampli-tude of the BOLD response varied considerablybetween different areas. For instance, the responseof the thalamus was about three times smaller thanthat of the anterior cingulate, although both ®guredamongst the most signi®cantly activated areas. Atthis point, however, it is dif®cult to disentangle thepotential causes of this effect, which may includedifferences in vascularization, hemodynamics, andthe size of the active neuronal popoulations. Theactivated areas also responded with different delays.Although the order in which the slices were ac-quired (interleaved slices, from the bottom to thetop of the brain) could have induced artefactualdelays [13] of up to 2 s, some of the variations inactivation delays seen in Fig. 1 exceed this value,suggesting that they may partly re¯ect genuineinter-area differences in the shape of the BOLDresponse [14]. Further research, using corrections foracquisition delays, should sort out the respectivecontributions of neural activation delays and/orlocal variations in the coupling of activation toblood ¯ow to this effect.
Considering these variations in amplitude anddelay, we used an ANOVA-based statistical analysiscapable of detecting any task-induced change in theshape of the BOLD response of a given voxel. Usingthe general linear model underlying SPM software,one can only detect changes in the amplitude of theweights allocated to prespeci®ed model hemody-namic functions. On the contrary, an ANOVA
0 2 4 6 8 10 12time (s)
20.2
20.1
0
0.1
0.2
%
notation
verbal
arabic
p 5 0.007
0 2 4 6 8 10 12time (s)
20.2
20.1
0
0.1
0.2
%
distance
far
close
p 5 0.022
B
0 2 4 6 8 10 12time (s)
20.2
20.1
0
0.1
0.2
%
distance
close
far
p 5 0.059
C
x5248 y5266 z521
Ax554 y5251 z526
x548 y5236 z539
Z53.62, 13 voxels
Z53.59, 17 voxels
Z53.89, 28 voxels
FIG. 2. Brain slices where the anatomically constrained contrast analy-sis revealed a signi®cant notation or distance effect. For visualizationpurpose, the image was thresholded at p , 0.01, but an uncorrectedthreshold of p , 0.001 was used to detect signi®cant activations, hereappearing at the intersection of the two red lines. Graphs on the rightside represent the BOLD signal, with an ANOVA analysis of the voxel(see corresponding legend to Fig. 1). (A) Arabic±verbal contrast, rightfusiform gyrus. (B) Close±far contrast, left inferior parietal area. (C) Far±close contrast, right intraparietal area.
Vol 10 No 7 14 May 1999 1477
Cerebral network for number comparison NeuroReport

applied directly to the event-related BOLD signalcan potentially detect any interaction of an experi-mental condition with the time factor, and thus anychange in the lag, size and shape of the BOLDresponse due to experimental factors. One dif®cultyraised by this type of study is the selection of thevoxels which are analyzed with the ANOVA. Thechoice of the most signi®cantly activated voxelsallowed us to analyze only a limited number ofvoxels dispersed throughout the cortex and whichprovided a good description of the cerebral circuitinvolved in the task. However, because we did notapply a statistical correction for the number of testsperformed (three tests at each of 47 voxels), ourresults should be considered as exploratory.
The combined application of this strategy and oftraditional SPM contrast analysis allowed us toidentify candidate areas for number notation, dis-tance and response effects. First, a robust effect ofnumber notation was found in the right fusiformgyrus. This area is more activated by digits than bynumber words. This suggests that within the ventraloccipito-temporal pathway for visual identi®cation,there may exist a right-hemispheric area specializedfor the visual recognition of digits as opposed towords. This region may be homologous to the visualword form system of the left hemisphere [15].Several other published observations corroborate thehypothesis of two different neural systems forArabic and verbal identi®cation. Recordings of local®eld potentials in human extrastriate visual cortex[15] have revealed a ventral area more reactive todigits than to words or faces in the fusiform gyrus,suggesting the existence of a number module speci®-cally sensitive to digit forms. Furthermore, the righthemisphere of patients with callosal lesions canrecognize digits, but not number words [16,17],con®rming the crucianumber module speci®callysensitive to digit forms. Furthermore, the righthemisphere of patients with callosal lesions canrecognize digits, but not number words [16,17],con®rming the crucial role of the left hemisphere forvisual word identi®cation and the capacity of theright hemisphere to identify digits. Finally, a studyof the comparison task with ERP recordings [2] hassuggested a left hemispheric identi®cation processfor words and a bilateral identi®cation process fordigits, both of which later converge onto a commonamodal magnitude representation. Our results arecompatible with this model, and suggest that theright fusiform gyrus may play a special role inrecognizing Arabic digits during number compari-son.
We also noticed a small notation effect in the leftprecentral gyrus. Interestingly, the very same voxelwas also affected by a large effect of response side.
It is unlikely that the same brain area is involved invisual identi®cation and motor processes. Rather,the shape of the notation effect is indicative of adifferential delay in motor activation between thetwo conditions, with a longer activation for verbalnotation than for Arabic notation. Analysis of reac-tion times indicated that subjects responded 18 msslower to verbal than to Arabic numerals. It is thenpossible that the apparent notation effect observedin the BOLD response of this premotor voxel wassimply related to the delayed motor activation ofthis region due to a longer processing of verbalstimuli. This interpretation would require a replica-tion to be validated, however, because it seemssomewhat surprising that such a small response timedifference may be measurable at the level of thehemodynamic response.
We also reported a distance effect, independent ofnotation and response side, in three different sites:two in the left inferior parietal lobule, and one inthe right postcentral/inferior parietal region. Thisbilateral inferior parietal effect is in good agreementwith the assumption of an abstract representation ofnumber magnitude in this area [18]. Our data sug-gest that the lateralization of this magnitude repre-sentation is perhaps more complex than expected.Indeed, we found here the most signi®cant distanceeffect in the left hemisphere, whereas a previousERP experiment suggested a right-hemispheric ad-vantage [2]. In both left and right parietal areas,however, number notation was found irrelevant.While verbal and Arabic notations are identi®ed bypartially distinct inferior temporal areas, as discussedpreviously, parietal cortices may constitute conver-ging points where the common semantic informa-tion conveyed by both notations is represented.
Finally, we observed the expected effect of re-sponse side over a large set of left and right sitessurrounding the central sulcus, as well as in thesupplementary motor area (SMA) and in the insula.Pre- and post-central sensorimotor areas were sys-tematically more activated for contralateral than foripsilateral hand movement. Globally, these data arein good accordance with the proposed theoreticalmodel of the task, which postulates a visual identi®-cation of numbers in the left and right ventraloccipito-temporal areas, a bilateral magnitude repre-sentation in the inferior parietal lobule, and theimplementation of the appropriate response in mo-tor areas.
In addition to comparison itself, the design of ourexperiment probably called on other cognitive capa-cities. First, the fast detection of the target numberprobably required focused visual attention through-out the experiment. Second, the target had to becompared with a ®xed reference number (®ve)
1478 Vol 10 No 7 14 May 1999
NeuroReport P. Pinel et al.

which was memorized, probably requiring the useof working memory resources. Third, the motorresponse instructions changed between blocks,which required subjects to inhibit a previouslyautomatized task and therefore put requirements onhigher-level control processes. Fourth, subjectsmade occasional errors and presumably used errordetection and correction processes on those trials.Those factors may explain our ®nding of widespreadactivation in prefrontal, parietal, cingulate and sub-cortical areas which may not be speci®cally relatedto number comparison. Prefrontal cortex and ante-rior cingulate, in particular, are considered as crucialareas for the high-level control of activity and taskswitching. Anterior cingulate activation is found inmany effortful tasks [19] that require attention foraction [20] and involve the monitoring of con¯ictingresponses [21] and the correction of occasionalerrors [22]. Prefrontal cortex may be related to asupervisory attentional function [23] of controllinglower-level sensorimotor processes. Finally, the lat-eral prefrontal activations, in connection to theparietal activations (at sites where no distance effectwas found), may be indicative of the involvement ofworking memory for the reference number and taskinstructions [24,25].
Conclusion
In conjunction with a previous ERP study of thesame task, the present study provides evidence thatan organized sequence of cerebral activations under-lies the number comparison task. Thanks to theevent-related fMRI method, the size, lag and tem-poral shape of the activations can now be visualized.The complexity of the distributed cerebral networkimplicated in this simple cognitive task reinforces
the idea that any psychological ability results fromthe coordinated activity of multiple specialized cere-bral systems, rather than from the operation of asingle dedicated brain area. The variant of theadditive-factors method proposed here, which in-volves the orthogonal variation of multiple stimulusparameters and the examination of their impact oneach brain area, provides a general means of de®ningthe function of these distributed subsystems.
References
1. Sternberg S. Acta Psychol 30, 276±315 (1969).2. Dehaene S. J Cogn Neurosci 8, 47±68 (1996).3. Moyer RS and Landauer TK. Nature 215, 1519±1520 (1967).4. Dehaene S. Percept Psychophys 45, 557±566 (1989).5. Dehaene S. Cognition 44, 1±42 (1992).6. Dehaene S and Cohen L. Math Cogn 1, 83±120 (1995).7. Dale AM and Buckner RL. Hum Brain Mapp 5, 329±340 (1997).8. Dehaene S, Naccache L, Le Clec'H G et al. Nature 395, 597±600 (1998).9. Talairach J and Tournoux P. Co-planar Stereotaxic Atlas of the Human Brain.
New York: Thieme Medical (1988).10. Roland PE and Friberg L. J Neurophysiol 53, 1219±1243 (1985).11. Dehaene S, Tzourio N, Frak V et al. Neuropsychologia 34, 1097±1106 (1996).12. Rueckert L, Lange N, Partiot A et al. NeuroImage 3, 97±103 (1996).13. Van de Moortele PF, Cerf B, Lobel E et al. NMR Biomed 10, 230±236 (1997).14. Buckner RL. Proc Natl Acad Sci USA 93, 14878±14883 (1996).15. Allison T, McCarthy G, Nobre A et al. Cerebr Cortex 5, 544±554 (1994).16. Seymour SE, Reuter-Lorenz PA and Gazzaniga MS. Brain 117, 105±115 (1994).17. Cohen L and Dehaene S. NeuroCase 2, 155±174 (1996).18. Dehaene S and Cohen L. Math Cogn 1, 83±120 (1995).19. Paus T, Koski L, Caramanos Z and Westbury C. NeuroReport 9, R37±R47
(1998).20. Posner MI and Dehaene S. Trends Neurosci 17, 75±79 (1994).21. Carter CS, Braver TS, Barch DM et al. Science 280, 747±749 (1998).22. Dehaene S, Posner MI and Tucker DM. Psychol Sci 5, 303±305 (1994).23. Shallice T. From Neuropsychology to Mental Structure. Cambridge University
Press, 1988.24. Fuster J. The Prefrontal Cortex, 2nd edn. Philadelphia: Raven Press, 1989.25. Goldman-Rakic PS. Circuitry of primate prefrontal cortex and regulation of
behavior by representational knowledge. In: Plum F and Mountcastle V, eds.Handbook of Physiology (5) , Wasington: American Physiological Society, 1987:373±417.
26. Jezzard P and Balaban RS. Magn Reson Med 34, 65±73 (1995).
ACKNOWLEDGEMENTS: Supported by the Fondation pour la Recherche MeÂdicale,GIS Sciences de la Cognition and INSERM.
Received 6 January 1999;accepted 12 March 1999
Vol 10 No 7 14 May 1999 1479
Cerebral network for number comparison NeuroReport