Event Identification from Georeferenced images
16
Event Identification from Georeferenced Images Yeran Sun and Hongchao Fan Abstract Geotagged images (e.g., Flickr) could indicate some social events (e.g., festival, parade, protest, sports, etc.) with spatial, temporal and semantic infor- mation. Previous researches relied much on tag frequency, thus some images which do not have clearly tag indicating the occurrence of social event would be miss- ing in this case. One potential way to address this problem or enhance the event identification is to make more use of the spatial and temporal information. In this chapter, we take into consideration the underlying spatio-temporal pattern of social events. Particularly, the influence of urban land use and road on the occurrence of event is considered. Specifically, with a spatio-temporal cluster detection method, we firstly detected spatio-temporal clusters composed of geotagged images. Among these detected S-T clusters, we furthermore attempted to identify social events in terms of a classification model. Specifically, land use and road were considered to generate new kinds of spatial characteristics used as dependent variables incorpo- rated into the classification model. In addition to this, user characteristics (i.e., the number of images and the number of users), spatial and temporal range of images, and the heterogeneity of temporal distribution of images were considered as the other dependent variables for the classification model. Consequently, with a binary logistic regression (BLR) method, we estimated the categories (i.e., ‘event’ or ‘non-event’ one) of the S-T clusters (cases). Experimental results demonstrated the good per- formance of the method with a total accuracy of 71%. With the variable selection process of the BLR method, empirical result also indicates that (1) some character- istics (e.g., the distance to the road and the heterogeneity of temporal distribution of images) do not have considerable influence on the occurrence of ‘event’; and (2) compared to the other urban land categories (i.e., residential and recreational land), commercial land has a relatively high influence on the occurrence of ‘event’. Y. Sun (B ) · H. Fan GIScience Research Group, Institute of Geography, University of Heidelberg, Heidelberg, Germany e-mail: [email protected] J. Huerta et al. (eds.), Connecting a Digital Europe Through Location and Place, 73 Lecture Notes in Geoinformation and Cartography, DOI: 10.1007/978-3-319-03611-3_5, © Springer International Publishing Switzerland 2014
-
Upload
uni-heidelberg -
Category
Documents
-
view
2 -
download
0
Transcript of Event Identification from Georeferenced images
Event Identification from GeoreferencedImages
Yeran Sun and Hongchao Fan
Abstract Geotagged images (e.g., Flickr) could indicate some social events(e.g., festival, parade, protest, sports, etc.) with spatial, temporal and semantic infor-mation. Previous researches relied much on tag frequency, thus some images whichdo not have clearly tag indicating the occurrence of social event would be miss-ing in this case. One potential way to address this problem or enhance the eventidentification is to make more use of the spatial and temporal information. In thischapter, we take into consideration the underlying spatio-temporal pattern of socialevents. Particularly, the influence of urban land use and road on the occurrence ofevent is considered. Specifically, with a spatio-temporal cluster detection method,we firstly detected spatio-temporal clusters composed of geotagged images. Amongthese detected S-T clusters, we furthermore attempted to identify social events interms of a classification model. Specifically, land use and road were considered togenerate new kinds of spatial characteristics used as dependent variables incorpo-rated into the classification model. In addition to this, user characteristics (i.e., thenumber of images and the number of users), spatial and temporal range of images,and the heterogeneity of temporal distribution of images were considered as the otherdependent variables for the classificationmodel. Consequently, with a binary logisticregression (BLR) method, we estimated the categories (i.e., ‘event’ or ‘non-event’one) of the S-T clusters (cases). Experimental results demonstrated the good per-formance of the method with a total accuracy of 71%. With the variable selectionprocess of the BLR method, empirical result also indicates that (1) some character-istics (e.g., the distance to the road and the heterogeneity of temporal distributionof images) do not have considerable influence on the occurrence of ‘event’; and (2)compared to the other urban land categories (i.e., residential and recreational land),commercial land has a relatively high influence on the occurrence of ‘event’.
Y. Sun (B) · H. FanGIScience Research Group, Institute of Geography, University of Heidelberg,Heidelberg, Germanye-mail: [email protected]
J. Huerta et al. (eds.), Connecting a Digital Europe Through Location and Place, 73Lecture Notes in Geoinformation and Cartography, DOI: 10.1007/978-3-319-03611-3_5,© Springer International Publishing Switzerland 2014
74 Y. Sun and H. Fan
Keywords Volunteered geographic information · Event detection · Flickr ·Classification model · Spatial environment
1 Introduction
Currently, volunteered geographic information (VGI) has beenwidely used in variousapplications. Some social events are more or less involved in VGI. e.g., geotaggedimages of Flickr indicate social events, such as parade, festival, concert, etc. Spatial,temporal, and textual information of geotagged images can be used to indicate thelocation, time and the related topic of the social event. Similarly, geotagged posts ofTwitter can indicate the occurrence of events, including social events and natural dis-asters, in a more real-time way. Geotagged images and posts have the metadata con-taining longitude, latitude, time, tags, and other semantic information, etc. Geotaggedimages, in addition, have the imagery information. Such information has the potentialto be used in event detection, inwhich spatial, temporal and semantic information canbe used separately or together. Some researchers have already proposed approachesto explore the possibility (e.g., Rattenbury et al. 2007; Earle et al. 2011;Chae et al. 2012). As the most frequently used VGI data sources in social analysis,Flickr georeferenced images and Twitter georeferenced posts have higher potentialto event detection with the growing popularity in social media (e.g., Rattenbury etal. 2007; Jankowski et al. 2010; Sakaki et al. 2010; MacEachren et al. 2011; Ruoccoand Ramampiaro 2012).
Social event usually occurs at a place during a certain time period. For instance,parade usually occurs at the important avenue and plaza of the city in the day timeinstead of the night. Amusic concert held at a pub in the evening has a spatial area nolarger than this pub and a temporal period less than 12h simultaneously, if there aresome geotagged images indicating that this event should be geolocated within thebuilding representing this pub and be taken during the evening and night time of acertain day.At the same time, there are still some social events, e.g., festival and sportsgame, occurring at couples of places in a city or lasting several consecutive days.Even some music concert might occur at a large open air area, e.g., stadium or plaza,whose area is much larger than normal building. In spite of the occurrence location iswithin a building, some conferences last nearly one week. Despite existence of suchsocial events that occur at relatively large scale area or last a long time, for the otherones which are more, basically, the place where and the time period when they occurare both not large (e.g., within a region with an area below 20 × 20m and withinon day). User-generated georeferenced images reflecting the same social events oflimited spatial and temporal space can probably constitute a spatio-temporal cluster.Therefore, some researchers attempted to detect spatio-temporal clusters to identifyevents (e.g., Rattenbury et al. 2007; Chen andRoy 2009; Zhang et al. 2012). However,these researches reliedmainly on the tag of the image. Since a huge amount of imageswhich do not have the tag indicating the occurrence of event clearly, some eventswould be missing when only such tag-based methods are applied.
Event Identification from Georeferenced Images 75
Previous researches relied much on tag frequency, thus some images which do nothave clearly tag indicating the occurrence of social event would be missing in thiscase. One potential way to address this problem or enhance the event identification istomakemore use of the spatial and temporal information. In this chapter, we take intoconsideration the underlying spatio-temporal pattern of social events. Particularly,the influence of urban land use and road on the occurrence of event is considered.Specifically, with a spatio-temporal cluster detection method, we firstly detectedspatio-temporal clusters composed of geotagged images. Among these detected S-Tclusters, we furthermore attempted to identify social events in terms of a classificationmodel incorporating user, spatial and temporal characteristics. The remainder of thischapter is organized as follows. Section 2 introduces the related works made by theother researchers. Section 3 shows the methodology of this chapter. In Sect. 4 theexperimental results were shown. Finally, this chapter made a conclusion with futureworks.
2 Related Works
To detect social event using VGI, several researches proposed methods in whichspatial, temporal, and semantic attributes of images are exploited. Here we brieflyintroduced some of them.
Rattenbury et al. (2007) firstly used geo-tagged images to detect social event. Amethod called Scale-structure Identification is proposed and comparedwith twowell-known burst-analysis methods (i.e., Naive Scan Method and Spatial Scan Method).Semantics of tags were extracted and then identified as place or event with the threemethods. To detect social events and retrieve associated images from Flickr, Brennerand Izquierdo (2012) proposed a classification model combining locational, tempo-ral, textual and visual features of geo-tagged images. Additionally, external informa-tion from datasets and online web services were incorporated to further improve thedetection performance. Liu et al. (2011) made use of geotagged images and videosto detect events. They proposed an approach dedicated to the application of image’stag, description and location to event occurrence detection in nine venues across theglobe. The result shows the ability of the approach to not only detect events withhigh accuracy but also identify events that have not been published in popular eventdirectories. In addition to the textual identification of events, they show how to buildvisual summaries of past events providing viewers with a more compelling feelingof the event’s atmosphere.
Wang et al. (2012) incorporated online social interaction features in the detectionof social events. In addition to the image’smetadata including time, location, tags anddescription, the “social affinity” of two images was utilized to help event detection.An Incremental clustering method was used to group images to clusters representingevents. To find out the occurrence of local events such as local festivals, Lee andSumiya (2010) made use of geographical regularities deduced from the usual behav-ior patterns of crowds with geo-referenced posts of Twitter. By comparing these
76 Y. Sun and H. Fan
regularities with the estimated ones, they decided whether there were any unusualevents happening in the monitored geographical area. Based on Flickr image, Beckeret al. (2010) presented several techniques for identifying events and their associatedsocial media documents, by combining multiple context features of the documentin a variety of disciplined ways. They proposed a general framework for identifyingevents in social media documents via clustering, and used similarity metric learn-ing approaches in this framework, to produce high quality clustering results. Panand Mitra (2011) proposed two event detection approaches aiming at document col-lection of news article. One is to combine the popular Latent Dirichlet Allocation(LDA)modelwith temporal segmentation and spatial clustering. The other is to adaptan image segmentation model, SLDA, for spatial-temporal event detection on text.Using Flickr images to detect event, Chen and Roy (2009) employed a wavelet trans-form to suppress noise. Subsequently, like Rattenbury et al. (2007) they identifiedtags related with events, and further distinguished between tags of aperiodic eventsand those of periodic events.
Considering each Twitter user as a sensor, Sakaki et al. (2010) proposed a prob-abilistic spatiotemporal model for the target event that can estimate the centers ofearthquakes and the trajectories of typhoons. To exploit the Twitter data for moredetails,Watanabe et al. (2011) proposed an automatic geotagging method that identi-fies the location of non-geotagged document. Empirical results demonstrate that theirsystem can detect local events that are difficult to identify using existing event detec-tion methods. Chae et al. (2012) presented a visual analytics system that providesusers with scalable and interactive social media data analysis and visualization. Withthis system, analyst can explore and examine abnormal topics and events within var-ious social media data sources, such as Twitter, Flickr and YouTube. Latent DirichletAllocation method was used to rank extracted topics, whereas seasonal trend decom-position together with traditional control chart methods was applied to find unusualpeaks and outliers within topic time series.
3 Methodology
3.1 Definition of Event in the Context of Flickr Image
Becker et al. (2010) defined that an ‘event’ is something that occurs in a certainplace at a certain time. Moreover, Becker et al. (2011) gave a definition of ‘event’ inthe context of twitter post. In addition to this, some studies attempted to categorizethe event based on some characteristics (e.g., periodicity) (Chen and Roy 2009).Following the definition form Becker et al. (2010), here we need to take the scale ofspace and time into consideration. Specifically, there are some events (e.g., a festivalor a celebration) occur in a large place (a park or a few landmarks) at a long time(e.g., one week or one month). In contrast, more events (e.g., a music concert or aparty) occur in a small place (e.g., a building or a plaza) at a short time (e.g., one

Event Identification from Georeferenced Images 77
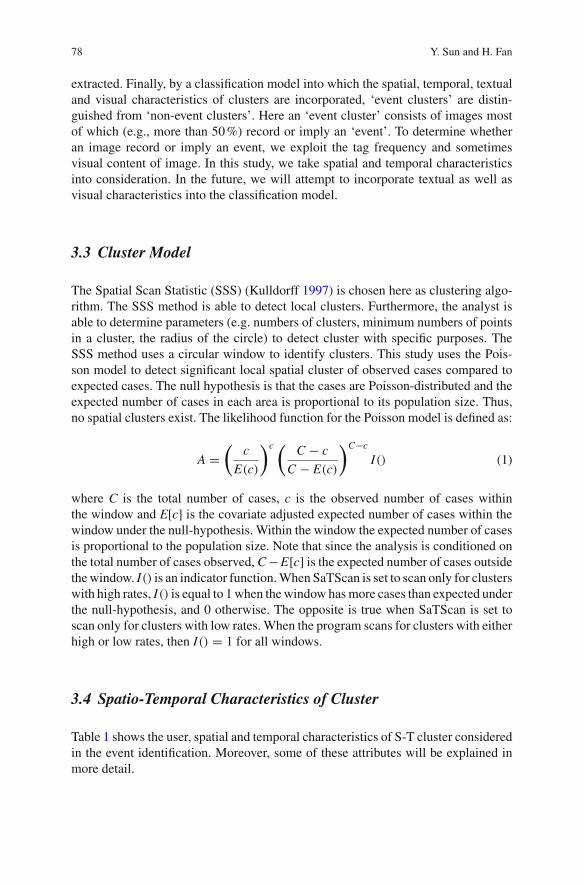
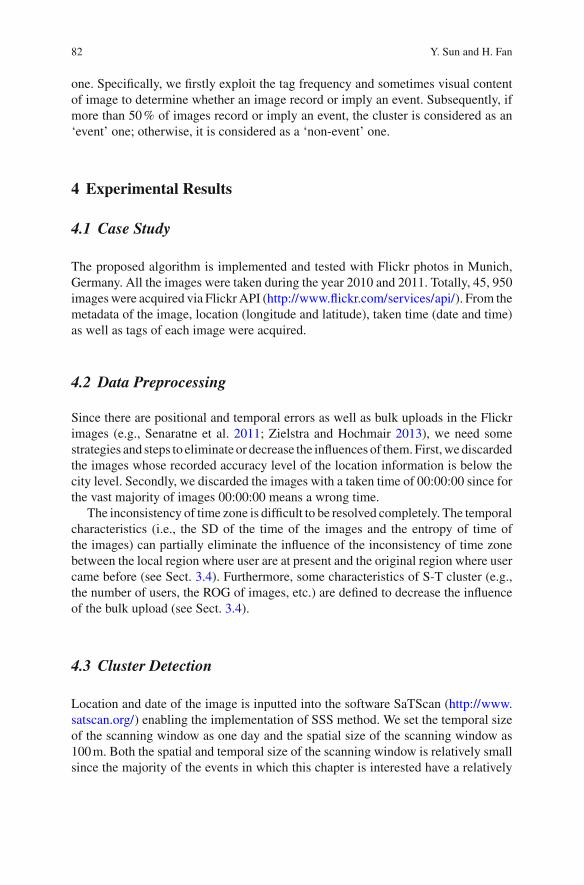
Fig. 1 A prototype of event detection using georeferenced images
day or one night). Both of these two kinds of events are considered in our study. Inthis study, we attempt to identify the latter type of event with a small spatio-temporalrange.
Basically, such event could be indicated by a spatio-temporal (S-T) cluster com-posed of a number of geoferenced images. For instance, a number of images recordingthe same event could constitute a cluster since they are highly spatially and tempo-rally close to each other. For instance, if a number of images recording a musicconcert, these images tend be less than 100m and less than 6h far away from eachother in spatial and temporal dimensions. In other words, a spatio-temporal clusterof Flickr images might indicate an event. In addition to event, bulk upload as well aslandmark can lead to a spatio-temporal cluster of geoferenced images.
3.2 Overview of the Proposed Approach
Figure 1 shows a prototype of event detection using georeferenced images.Initially, using cluster model (e.g., clusteringmethod, cluster detectionmethod, etc.),a number of spatio-temporal clusters are detected from geotagged image data set.Subsequently, spatial, temporal, textual and visual characteristics of the clusters are
78 Y. Sun and H. Fan
extracted. Finally, by a classification model into which the spatial, temporal, textualand visual characteristics of clusters are incorporated, ‘event clusters’ are distin-guished from ‘non-event clusters’. Here an ‘event cluster’ consists of images mostof which (e.g., more than 50%) record or imply an ‘event’. To determine whetheran image record or imply an event, we exploit the tag frequency and sometimesvisual content of image. In this study, we take spatial and temporal characteristicsinto consideration. In the future, we will attempt to incorporate textual as well asvisual characteristics into the classification model.
3.3 Cluster Model
The Spatial Scan Statistic (SSS) (Kulldorff 1997) is chosen here as clustering algo-rithm. The SSS method is able to detect local clusters. Furthermore, the analyst isable to determine parameters (e.g. numbers of clusters, minimum numbers of pointsin a cluster, the radius of the circle) to detect cluster with specific purposes. TheSSS method uses a circular window to identify clusters. This study uses the Pois-son model to detect significant local spatial cluster of observed cases compared toexpected cases. The null hypothesis is that the cases are Poisson-distributed and theexpected number of cases in each area is proportional to its population size. Thus,no spatial clusters exist. The likelihood function for the Poisson model is defined as:
A =(
c
E(c)
)c (C − c
C − E(c)
)C−c
I() (1)
where C is the total number of cases, c is the observed number of cases withinthe window and E[c] is the covariate adjusted expected number of cases within thewindow under the null-hypothesis. Within the window the expected number of casesis proportional to the population size. Note that since the analysis is conditioned onthe total number of cases observed, C−E[c] is the expected number of cases outsidethewindow. I() is an indicator function.When SaTScan is set to scan only for clusterswith high rates, I() is equal to 1when thewindow hasmore cases than expected underthe null-hypothesis, and 0 otherwise. The opposite is true when SaTScan is set toscan only for clusters with low rates. When the program scans for clusters with eitherhigh or low rates, then I() = 1 for all windows.
3.4 Spatio-Temporal Characteristics of Cluster
Table 1 shows the user, spatial and temporal characteristics of S-T cluster consideredin the event identification. Moreover, some of these attributes will be explained inmore detail.
Event Identification from Georeferenced Images 79
Table 1 User, spatial and temporal characteristics of the S-T cluster for the event identification
Characteristic type Feature variables Meaning
User characteristics X1 The number of imagesX2 The number of users
Spatial characteristics X3 The radius of gyration (ROG) of the images(The spatial range of cluster)
X4 The percentage of images within commercialland
X5 The percentage of images within residential landX6 The percentage of images within recreational
landX7 The average distance of images to the nearest
primary roadX8 The average distance of images to the nearest
secondary roadX9 The average distance of images to the nearest
local roadTemporal characteristics X10 The standard deviation (SD) of the time of the
images (The temporal range of cluster)X11 The entropy of time of the images (the temporal
heterogeneity of the distribution of images)
First of all, user characteristics are basically considered in the event identification.The number of images (X1) and the number of users (X2) in an S-T cluster are chosenhere as the user characteristics. The main reason to choose X1 and X2 is to eliminatethe influence of bulk upload. Like ‘event’ and landmark, bulk upload can generateS-T cluster.Auser sometimes uploaded an entire photoset that are georeferencedwithone location and one date, thus the images of this photoset are spatial and temporallyclose to each other. For instance, compared the cluster resulted from ‘event’, the oneresulted from bulk upload seems to have a smaller number of users.
Subsequently, we take into consideration the spatial and temporal range of theimages in a cluster. The radius of gyration (ROG) of the images (X3) is to measurethe spatial range of images in an S-T cluster. ROG is expressed as
ROG (C) =√√√√1
n
n∑i=1
(xi − xc)2 + (yi − yc)2 (2)
xc = 1
n
n∑i=1
xi (3)
yc = 1
n
n∑i=1
yi (4)
80 Y. Sun and H. Fan
where Pi(xi, yi) are the location of the ith image in an S-T cluster C, and (xc, yc) arethe center of the mass of the cluster C.
Similarly, the standard deviation (SD) of the time of the images (X10) is tomeasurethe temporal range of images in an S-T cluster. It is expressed as
SD_of _time (C) =√√√√1
n
n∑i=1
(ti − tc)2 (5)
tc = 1
n
n∑i=1
ti (6)
where ti is the time of the ith image in an S-T cluster C, and tc is mean time of theimages of the cluster C.
In addition to the temporal range of the images, the entropy of time (X11) is tocharacterize the heterogeneity of the temporal distribution of the images in an S-Tcluster. Intuitively, a landmark can attract persons to take pictures in the whole daysince persons can visit it in the morning, afternoon or even evening; whereas an‘event’ tend to attract persons to take pictures within a relatively limited time period(e.g., 2 or 3h) since persons would not do at all once it is already over or disappears.In this case, since they are within a relatively short time period (e.g., 2 or 3h), theimages recording an ‘event’ seems to bemore heterogeneously temporally distributedthan the images recording a landmark. The entropy is widely used to measure theheterogeneity of phenomena in various disciplines. In this study we thus make useof the entropy to characterize the temporal heterogeneity of the distribution of theimages in an S-T cluster. This entropy is defined as
Entropy_of _time(C) = −K∑
i=1
NumTi (C)
NumT (C)log2
(NumT
i (C)
NumT (C)
)(7)
NumT (C) =K∑
i=1
NumTi (C) (8)
whereNumTi (C) represents the number of imageswithin the ith (i = 1, 2, . . .,K(K =
24)) hour on one day. The lower the Entropy_of_time (C) is, the images in the clusterC are more heterogeneously temporally distributed.
X10 and X11 can partially eliminate the influence of the inconsistency of time zonebetween the local region where user are at present and the original region where usercame before. Since the time when the picture was taken depends on the time thatis recorded on the device with which the photos are taken. For instance, a touristvisits to a region whose time zone is different with that of his or her hometown. Ifshe forgets to change the time zone of her camera from the one of her hometown
Event Identification from Georeferenced Images 81
to the one of this region, the images taken by her in this region would be uploadedwith the time computed based on the time zone of users’ hometown instead of thetime computed based on the time zone of this local region. In this situation, suchrecorded time is not the really local time when the picture is taken. X10 and X11 caneliminate much influence when the number of users is small or difference of timezone between these two regions is small in a cluster.
X3, X10 and X11 can eliminate the influence of bulk upload. Due to a lower spatialand temporal range, the cluster resulted from bulk upload seems to have a lowerX3, X10 and X11 than the once resulted from ‘event’.
Furthermore, to get a better understanding of the influence of the spatial envi-ronment on the occurrence of ‘event’, we attempt to explore if land use as well asroad affect the occurrence of ‘event’ in the context of Flickr. Specifically, three typ-ical urban land use types (i.e., commercial land, residential land and recreationalland) and three main road types (i.e., prime road, secondary road and local road) arechosen. For an S-T cluster, X4, X5 and X6 represent the percentage of images geolo-cated within commercial land, residential land and recreational land respectively;X7, X8 and X9 represent the average distance of images to the nearest prime road,secondary road and local road respectively.
3.5 Classification Model
The binary logistic regression (BLR) method is able to measure the relationshipbetween the binary dependent variable and one or several independent variable(s),by computing the probabilities of the outputs for the different category. BLR allowsassessing the contribution of individual variables to the classification and subse-quently choosing the important variables to build a newmodel, leading to an enhance-ment of the classification. The BLR model is represented as
P (y) = 1
1+ e−(a0+a1x1+a2x2+···+aixi)(9)
where y ε {1, 0} is the dependent variable, and (x1, x2, . . ., xi) are the independentvariables. a0 is the intercept, and (a1, a2, . . ., ai) are the coefficients of the inde-pendent variables (x1, x2, . . ., xi). In this classification problem, the targeted classi-fication category (1 or 0) and the 11 feature variables in Table 1 correspond to thedependent variable Y and the initially independent variables in Eq. (9) respectively.
3.6 ‘Event’ and ‘Non-event’ S-T Cluster
In Eq. (9), there are two targeted classification categories, i.e., 1 and 0.1 means thatan S-T cluster is an ‘event’ one whereas 0 means that an S-T cluster is a ‘non-event’
82 Y. Sun and H. Fan
one. Specifically, we firstly exploit the tag frequency and sometimes visual contentof image to determine whether an image record or imply an event. Subsequently, ifmore than 50% of images record or imply an event, the cluster is considered as an‘event’ one; otherwise, it is considered as a ‘non-event’ one.
4 Experimental Results
4.1 Case Study
The proposed algorithm is implemented and tested with Flickr photos in Munich,Germany. All the images were taken during the year 2010 and 2011. Totally, 45, 950imageswere acquired via Flickr API (http://www.flickr.com/services/api/). From themetadata of the image, location (longitude and latitude), taken time (date and time)as well as tags of each image were acquired.
4.2 Data Preprocessing
Since there are positional and temporal errors as well as bulk uploads in the Flickrimages (e.g., Senaratne et al. 2011; Zielstra and Hochmair 2013), we need somestrategies and steps to eliminate or decrease the influences of them.First,wediscardedthe images whose recorded accuracy level of the location information is below thecity level. Secondly, we discarded the images with a taken time of 00:00:00 since forthe vast majority of images 00:00:00 means a wrong time.
The inconsistency of time zone is difficult to be resolved completely. The temporalcharacteristics (i.e., the SD of the time of the images and the entropy of time ofthe images) can partially eliminate the influence of the inconsistency of time zonebetween the local region where user are at present and the original region where usercame before (see Sect. 3.4). Furthermore, some characteristics of S-T cluster (e.g.,the number of users, the ROG of images, etc.) are defined to decrease the influenceof the bulk upload (see Sect. 3.4).
4.3 Cluster Detection
Location and date of the image is inputted into the software SaTScan (http://www.satscan.org/) enabling the implementation of SSS method. We set the temporal sizeof the scanning window as one day and the spatial size of the scanning window as100m. Both the spatial and temporal size of the scanning window is relatively smallsince the majority of the events in which this chapter is interested have a relatively
Event Identification from Georeferenced Images 83
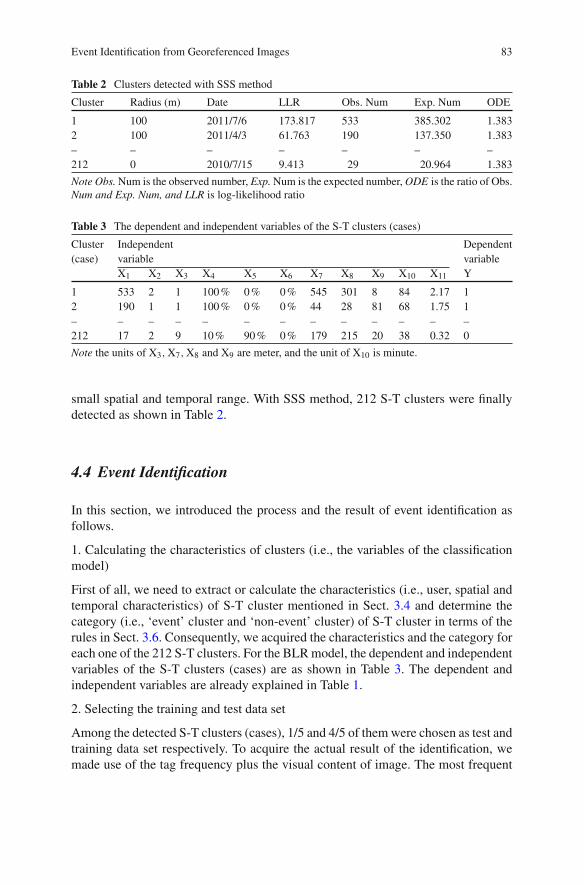
Table 2 Clusters detected with SSS method
Cluster Radius (m) Date LLR Obs. Num Exp. Num ODE
1 100 2011/7/6 173.817 533 385.302 1.3832 100 2011/4/3 61.763 190 137.350 1.383– – – – – – –212 0 2010/7/15 9.413 29 20.964 1.383
Note Obs. Num is the observed number, Exp. Num is the expected number, ODE is the ratio of Obs.Num and Exp. Num, and LLR is log-likelihood ratio
Table 3 The dependent and independent variables of the S-T clusters (cases)
Cluster Independent Dependent(case) variable variable
X1 X2 X3 X4 X5 X6 X7 X8 X9 X10 X11 Y
1 533 2 1 100% 0% 0% 545 301 8 84 2.17 12 190 1 1 100% 0% 0% 44 28 81 68 1.75 1– – – – – – – – – – – – –212 17 2 9 10% 90% 0% 179 215 20 38 0.32 0
Note the units of X3,X7,X8 and X9 are meter, and the unit of X10 is minute.
small spatial and temporal range. With SSS method, 212 S-T clusters were finallydetected as shown in Table 2.
4.4 Event Identification
In this section, we introduced the process and the result of event identification asfollows.
1. Calculating the characteristics of clusters (i.e., the variables of the classificationmodel)
First of all, we need to extract or calculate the characteristics (i.e., user, spatial andtemporal characteristics) of S-T cluster mentioned in Sect. 3.4 and determine thecategory (i.e., ‘event’ cluster and ‘non-event’ cluster) of S-T cluster in terms of therules in Sect. 3.6. Consequently, we acquired the characteristics and the category foreach one of the 212 S-T clusters. For the BLRmodel, the dependent and independentvariables of the S-T clusters (cases) are as shown in Table 3. The dependent andindependent variables are already explained in Table 1.
2. Selecting the training and test data set
Among the detected S-T clusters (cases), 1/5 and 4/5 of themwere chosen as test andtraining data set respectively. To acquire the actual result of the identification, wemade use of the tag frequency plus the visual content of image. The most frequent
84 Y. Sun and H. Fan
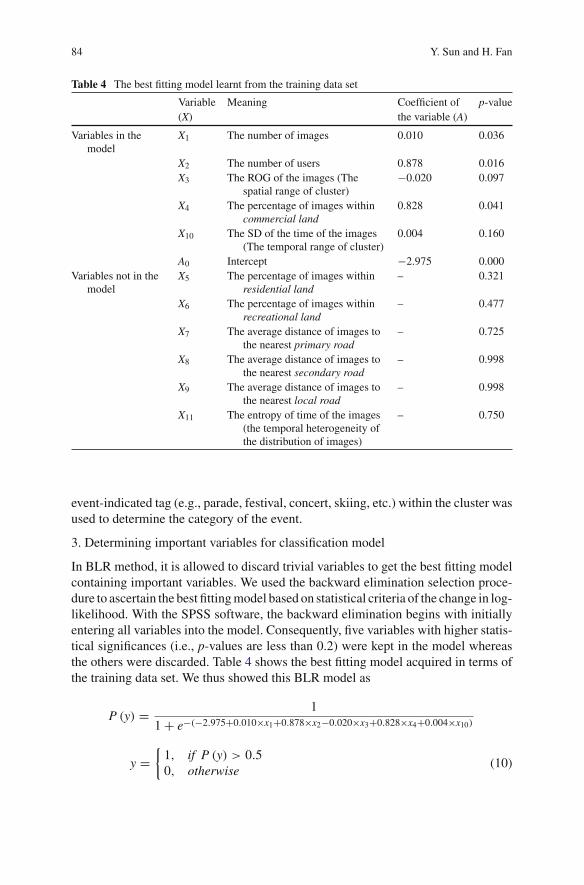
Table 4 The best fitting model learnt from the training data set
Variable Meaning Coefficient of p-value(X) the variable (A)
Variables in themodel
X1 The number of images 0.010 0.036
X2 The number of users 0.878 0.016X3 The ROG of the images (The
spatial range of cluster)−0.020 0.097
X4 The percentage of images withincommercial land
0.828 0.041
X10 The SD of the time of the images(The temporal range of cluster)
0.004 0.160
A0 Intercept −2.975 0.000Variables not in the
modelX5 The percentage of images within
residential land– 0.321
X6 The percentage of images withinrecreational land
– 0.477
X7 The average distance of images tothe nearest primary road
– 0.725
X8 The average distance of images tothe nearest secondary road
– 0.998
X9 The average distance of images tothe nearest local road
– 0.998
X11 The entropy of time of the images(the temporal heterogeneity ofthe distribution of images)
– 0.750
event-indicated tag (e.g., parade, festival, concert, skiing, etc.) within the cluster wasused to determine the category of the event.
3. Determining important variables for classification model
In BLR method, it is allowed to discard trivial variables to get the best fitting modelcontaining important variables. We used the backward elimination selection proce-dure to ascertain the best fittingmodel based on statistical criteria of the change in log-likelihood. With the SPSS software, the backward elimination begins with initiallyentering all variables into the model. Consequently, five variables with higher statis-tical significances (i.e., p-values are less than 0.2) were kept in the model whereasthe others were discarded. Table 4 shows the best fitting model acquired in terms ofthe training data set. We thus showed this BLR model as
P (y) = 1
1+ e−(−2.975+0.010×x1+0.878×x2−0.020×x3+0.828×x4+0.004×x10)
y ={1, if P (y) > 0.50, otherwise
(10)
Event Identification from Georeferenced Images 85
Table 5 Classification accuracy of event and non-event S-T clusters
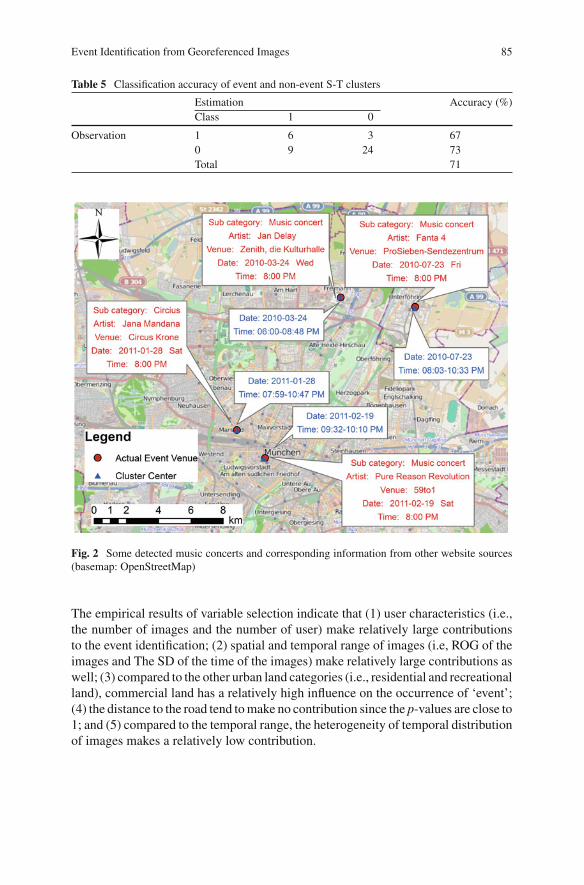
Estimation Accuracy (%)Class 1 0
Observation 1 6 3 670 9 24 73Total 71
Fig. 2 Some detected music concerts and corresponding information from other website sources(basemap: OpenStreetMap)
The empirical results of variable selection indicate that (1) user characteristics (i.e.,the number of images and the number of user) make relatively large contributionsto the event identification; (2) spatial and temporal range of images (i.e, ROG of theimages and The SD of the time of the images) make relatively large contributions aswell; (3) compared to the other urban land categories (i.e., residential and recreationalland), commercial land has a relatively high influence on the occurrence of ‘event’;(4) the distance to the road tend tomake no contribution since the p-values are close to1; and (5) compared to the temporal range, the heterogeneity of temporal distributionof images makes a relatively low contribution.
86 Y. Sun and H. Fan
4. the result of the classification (event identification)
With the BLRmodel in Eq.10, among 42 test cases (clusters), 30 oneswere estimatedcorrectly, thus the total accuracy was 71%. Table5 shows the results of estimationwith details. Class 1 and 0 mean event and non-event S-T cluster respectively.
5. Visualizing the identified ‘events’
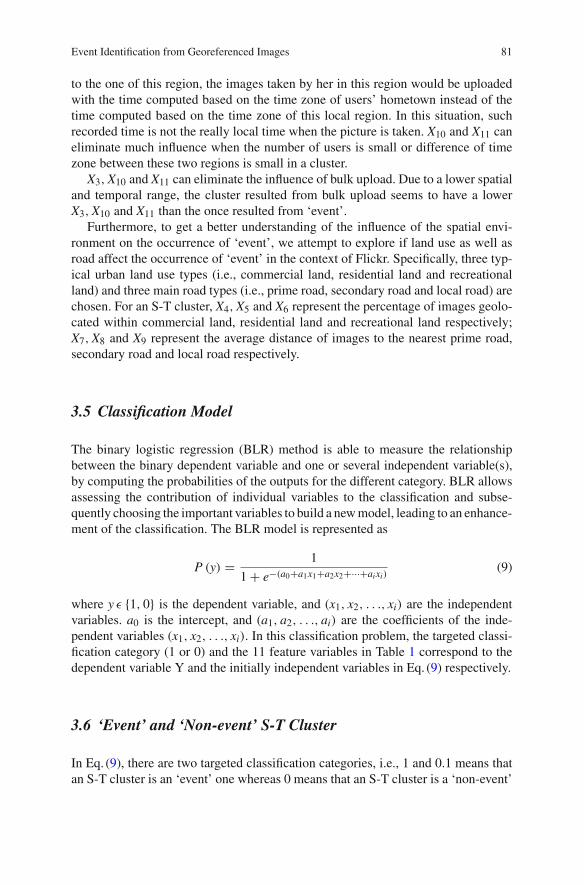
Besides, we geo-visualized some detected social events. To evaluate the detection inmore detail, we offer the actual information of these events acquired from thewebsitedevoted to concert notification or ticket affairs (e.g., Bandsintown, Upcomming,etc.). Figure 2 shows the detected ‘music concerts’ with the spatial and temporalinformation acquired from the georeferenced images. Here we chose the locationof the cluster center to indicate the position of the event, and the time of the firstimage and last image as the time of the event. Red color text indicates the actualinformation of these events acquired from some websites whereas blue color textindicates the information acquired fromgeoreferenced images.Wecan see that spatialand temporal information of these events approximate the actual one offered by someprofessional websites.
5 Conclusion and Future Works
In this chapter, we exploited Flickr images to identify social event. Our approachtook into consideration the underlying spatio-temporal patterns of social events.Specifically, with a spatio-temporal cluster detection method, we firstly detectedspatio-temporal clusters composed of geotagged images. Among these detected S-Tclusters, we furthermore attempted to identify social events in terms of a classificationmodel. Specifically, land use and road were considered to generate new kinds ofspatial characteristics used as dependent variables incorporated into the classificationmodel. In addition to this, user characteristics (i.e., the number of images and thenumber of users), spatial and temporal range of clusters, and the heterogeneity oftemporal distribution of images were considered as the other dependent variablesfor the classification model. Consequently, with a BLR method, we estimated thecategories (i.e., ‘event’ or ‘non-event’ one) of the S-T clusters (cases). Experimentalresults demonstrated the good performance of the method with a total accuracyof 71%. With the variable selection process of the BLR method, empirical resultalso indicates that (1) some characteristics (e.g., the distance to the road and theheterogeneity of temporal distribution of images) do not have considerable influenceon the occurrence of ‘event’; and (2) compared to the other urban land categories (i.e.,residential and recreational land), commercial land has a relatively high influence onthe occurrence of ‘event’.
There are some aspects needed to be considered in the future works to enhancethis approach. Firstly, as the most important characteristics, textual and visual char-acteristics should be combined with the spatial and temporal characteristics used in
Event Identification from Georeferenced Images 87
this chapter to enhance the event identification. Secondly, different types of eventshave different levels of spatio-temporal range. For instance, a festival or sport gametends to last longer (e.g., a week) within a larger spatial area (e.g., a large park orgreen space) than a music concert which might take place at a building and be overwithin one day. Therefore, it will be interesting to take the level of spatio-temporalrange into account since distinct types of events might correspond to distinct levelof spatio-temporal range. Accordingly, the spatial and temporal size of the scanningwindow for the cluster detection method would be changed.
References
RattenburyT,GoodN,NaamanM(2007)Towards automatic extraction of event and place semanticsfrom Flickr tags. In: Proceedings of the 30th ACM international conference on research anddevelopment in information retrieval, Amsterdam, Netherlands, 23–27 July 2007
Earle PS, Bowden DC, Guy M (2011) Twitter earthquake detection: earthquake monitoring in asocial world. Ann Geophys 54(6):708–715
Chae J, ThomD, Bosch H, Jang Y (2012) Spatiotemporal social media analytics for abnormal eventdetection and examination using seasonal-trend decomposition. In: Proceedings of the 2012 IEEEconference on visual analytics science and technology (VAST), Seattle, WA, 14–19 Oct 2012
Chen L, Roy A (2009) Event detection from flickr data through wavelet-based spatial analysis.In: Proceeding of the 18th ACM conference on information and knowledge management, HongKong, China, 02–06 Nov 2009
BrennerM, IzquierdoE (2012)Social event detection and retrieval in collaborative photo collections.In: Proceedings of the 2nd ACM international conference on multimedia retrieval, Hong Kong,China, 05–08 June 2012
Liu X, Troncy R, Huet B (2011) Using social media to identify events. In: Proceedings of the 3rdACM SIGMM international workshop on Social media, Scottsdale, Arizona, USA, 30–30 Nov2011
Wang Y, Sundaram H, Xie L (2012) Social event detection with interaction graph modeling. In:Proceedings of the 20th ACM international conference on multimedia, Nara, Japan, 29 Oct–02Nov 2012
Lee R, Sumiya K (2010) Measuring geographical regularities of crowd behaviors for Twitter-basedgeo-social event detection. In: Proceedings of the 2ndACMSIGSPATIAL international workshopon location based social networks, San Jose, California, 02–02 Nov 2010
Becker H, Naaman M, Gravano L (2010) Learning similarity metrics for event identification insocial media. In: Proceedings of the third ACM international conference on web search and datamining, New York, USA, 04–06 Feb 2010
Pan C, Mitra P (2011) Event detection with spatial latent Dirichlet allocation. In: Proceedings ofthe 11th annual international ACM/IEEE joint conference on digital libraries, Ottawa, Ontario,Canada, 13–17 June 2011
Sakaki T, Okazaki M, Matsuo Y (2010) Earthquake shakes Twitter users: real-time event detectionby social sensors. In: Proceedings of the 19th international conference on world wide web,Raleigh, North Carolina, USA, 26–30 April 2010
Watanabe K, Ochi M, Okabe M, Onai R (2011) Jasmine: a real-time local-event detection systembased on geolocation information propagated to microblogs. In: Proceedings of the 20th ACMinternational conference on Information and knowledge management, Glasgow, Scotland, UK,24–28 Oct 2011
Kulldorff M (1997) A spatial scan statistic. Commun Stat Theory Methods 1997(26):1481–1496
88 Y. Sun and H. Fan
Becker H, NaamanM, Gravano L (2011) Beyond trending topics: real-world event identification ontwitter. In: Proceedings of the fifth international AAAI conference on Weblogs and social, media(ICWSM’11)
Zielstra D, Hochmair HH (2013) Positional accuracy analysis of Flickr and Panoramio images forselected world regions. J Spat Sci 58(2):251–273
Senaratne H, Bröring A, Schreck T (2011) Assessing the credibility of VGI contributors based onmetadata and reverse viewshed analysis: an experiment with geotagged Flickr images. ComputGraph Forum 30(3):871–880
MacEachren AM, Robinson AC, Jaiswal A, Pezanowski S, Savelyev A, Blanford J, Mitra P (2011)Geo-twitter analytics: applications in crisismanagement. In: Proceedings of the 25th internationalcartographic conference, Paris, France
Jankowski P, Andrienko N, Andrienko G, Kisilevich S (2010) Discovering landmark preferencesand movement patterns from photo postings. Trans GIS 14(6):833–852
RuoccoM,RamampiaroH (2012)A scalable algorithm for extraction and clustering of event-relatedpictures. Multimedia Tools Appl J doi:10.1007/s11042-012-1087-z
Zhang H, Korayem M, You E, Crandall DJ (2012) Beyond co-occurrence: discovering and visu-alizing tag relationships from geo-spatial and temporal similarities. In: Proceedings of the fifthACM international conference on web search and data mining, Seattle, Washington, USA, 8–12Feb 2012