
Evaluation of training in African enterprises
31
Evaluation of Training in African Enterprises * Michael Rosholm ** Department of Economics, University of Aarhus, Denmark Helena Skyt Nielsen Department of Economics, University of Aarhus, Denmark Andrew Dabalen The World Bank, Washington DC Abstract: The importance of skill-shortage in Africa, combined with the extensive use of training, necessitates appropriate evaluation of training programs. By using firm data from Sub- Saharan Africa, we evaluate the effect of on-the-job training on log wages using matching estimators. We find that training tends to improve wages, and that the effect is larger and more well-determined when we focus on long training durations and large firms. JEL: J31. Keywords: Evaluation, training, matching, endogenous variables, Sub-Saharan Africa. * Acknowledgement: Financial support from The World Bank is gratefully acknowledged. The World Bank is not responsible for the results obtained in the paper, nor does it necessarily reflect the views of The World Bank. We are grateful to Richard K. Johanson, Hong W. Tan, Zafiris Tzannatos and two anonymous referees for useful comments on earlier versions of the paper. The usual disclaimer applies. ** Corresponding author. Mailing address: Michael Rosholm, Department of Economics, University of Aarhus, University Park, Bld. 322, DK-8000 Aarhus C. Email: [email protected] . Phone: +45 8942 1559
Transcript of Evaluation of training in African enterprises

Evaluation of Training in African Enterprises*
Michael Rosholm**
Department of Economics, University of Aarhus, Denmark
Helena Skyt Nielsen
Department of Economics, University of Aarhus, Denmark
Andrew Dabalen
The World Bank, Washington DC
Abstract:
The importance of skill-shortage in Africa, combined with the extensive use of training,
necessitates appropriate evaluation of training programs. By using firm data from Sub-
Saharan Africa, we evaluate the effect of on-the-job training on log wages using
matching estimators. We find that training tends to improve wages, and that the effect is
larger and more well-determined when we focus on long training durations and large
firms.
JEL: J31.
Keywords: Evaluation, training, matching, endogenous variables, Sub-Saharan Africa.
* Acknowledgement: Financial support from The World Bank is gratefully acknowledged. The World Bank is not responsible for the results obtained in the paper, nor does it necessarily reflect the views of The World Bank. We are grateful to Richard K. Johanson, Hong W. Tan, Zafiris Tzannatos and two anonymous referees for useful comments on earlier versions of the paper. The usual disclaimer applies. ** Corresponding author. Mailing address: Michael Rosholm, Department of Economics, University of Aarhus, University Park, Bld. 322, DK-8000 Aarhus C. Email: [email protected]. Phone: +45 8942 1559

1
1. Introduction For decades, training, entrepreneurship and vocational education have been seen as a
key to provision of skills for the large and - to a large extent - unskilled populations of
Africa.1 Though expensive, vocational education and training in general have been
viewed as a fast and efficient way to improve skills for the population in Africa.2 First
of all, the reason behind this great interest in vocational education and training is that
these remedies are directed towards development of skills that are expected to be useful
in the productive process of an enterprise operating in a competitive environment.
Training represents a flexible response to changes in market demand. Secondly, the
individuals are partly productive while being trained or educated. Whether in training
institutions or in employment based (on-the-job) training, the education is focused
around some sort of commercial production, which could reduce the invested amount
and thus increase returns. Thirdly, the educational system in many African countries has
been run down, which increases the relative efficacy of alternative ways of upgrading
the skills of workers outside the range of general and academic education.3
The obvious motivation behind this interest in training and vocational education
activities is the implicit assumption that these types of human capital investments
increase the productivity of workers. Middleton et al. (1993) and Grubb and Ryan
(1999) conclude that there is (almost) consensus that earnings increase after training.
According to the literature survey by Middleton et al. (1993), the magnitude of the
effect seems to be about 20% in many developing countries.4
1 Biggs et al. (1995b), World Bank (2001) and Middleton et al. (1993) confirm that this is high on the agenda of NGOs and international aid donors. The main focus, though, is on improving basic education. 2 However, market failure may result in too little training (Becker, 1975). Hence, donor assistance for capacity building and institution building is important (Chandra et al. 2001), and therefore, donors and NGOs have subsidised training institutions for years. 3 However, at the same time it may decrease the trainability of the individuals. 4 However, for the benefit to occur, employment should be available, of course. This is apparently not a great problem, since skill-shortage has been reported as a main obstacle to business growth; Chandra et

2
Another motivation for being interested in training is that returns to the acquired skills
are shared between employer and employee, so that training simultaneously benefits
both the workers and the producers of goods. In a previous study by Biggs et al.
(1995a), it is shown that training appears to benefit the employers by increasing output,
that is, training increases productivity. This is shown in a pooled regression, which
estimates the production function of firms. Specifically, they estimate log value added
as a function of inputs to the production process and other important factors. Including a
dummy for whether the firm provides training to (some of) its workers, they find a
significantly positive effect of training on productivity. They use OLS as well as two
stage least squares. Their estimates imply that firms that train their workers have 50-
127% higher outputs than firms that do not. They do, however, note that these estimates
may be biased upwards due to non-random selection.
The extensive use of and investment in training in Sub-Saharan Africa accentuates the
need for evaluations of its effects. Yet, to our knowledge, such evaluations are scarce
for African countries. Applying state-of-the art econometric methods, studies for
developed countries show that publicly financed on-the-job and classroom training
programs have had disappointingly low effects on the income of workers (and in some
cases even negative effects), see e.g. the survey by Heckman et al. (1999), or Lechner
(1999) for a recent example. Investigating firm-sponsored training, Lynch (1992) shows
that on-the-job (informal) training has low returns and is firm specific, whereas off-the-
job (classroom) training is more general in nature and has significantly positive returns.
In this paper, we apply matching techniques to estimate the effects of training conducted
in African enterprises, specifically, in formal sector enterprises in Kenya and Zambia.
al. (2001) report that 2/3 of firms view skill-shortage as an important obstacle to business growth in South Africa.
3
The motivation for using matching techniques is that we have access to a rich set of
variables affecting the selection into training as well as the earnings of workers.
We find a positive return of roughly 20%, which is larger and more well-determined
when we focus on long durations training and large firms. This number is confirmed for
three waves of data for other Sub-Saharan African countries where more general
training indicators are available. One might expect different returns to training across
education levels because more educated individuals learn faster, but unfortunately the
number of trainees in our samples do not allow for such an analysis.
The paper is organized as follows: Section 2 describes the data sources. Section 3
discusses training institutions in Sub-Saharan Africa and describes the extent of training
plus the selection process into training in African enterprises. Section 4 contains a
discussion of theoretical considerations of the evaluation problem and presents the
matching technique used to estimate training effects. Section 5 contains results, and
section 6 discusses policy issues. Section 7 concludes.
2. Data sources We have access to Regional Programme on Enterprise Development (RPED) data from
five Sub-Saharan African countries: Côte d’Ivoire, Ghana, Kenya, Zimbabwe and
Zambia. In each country, around 250 firms within the manufacturing sector are
interviewed two or three times. In addition to information about the firm and the owner,
the data sets contain information on roughly 1000 employees per wave. In this paper,
however, we will focus on two of these countries, Kenya and Zambia, since there is
most information about the receipt of training in the questionnaires conducted in these
4
countries, see section 3. In the three other countries, there was merely a question on
whether the worker had received training in the past.5
The RPED data sets are samples of firms, and for each firm, a selection of workers has
been asked a number of questions concerning their employment relations. Because the
sample is essentially one of manufacturing firms, the sample of workers is not
representative, even of the labor force in the manufacturing sector. The sample of
workers may overlap over time, but there are no unique person identifiers in the data
sets. The worker sampling frame within firms is not described in the underlying
documentation of the data sets, except that at least one worker was selected from each
job category present in the firm.6 This leads to overrepresentation of employees from
smaller firms and from smaller job categories. Unfortunately, there is not enough
information in the data to introduce weights. Thus, in the following we analyze
unweighted data. To some extent this problem is reduced by the presence of a rich set of
covariates one can condition upon in the econometric analyses.
In some cases, we had to merge data sets across different waves to be able to use
information on ownership status of the firm. The ownership information is often only
available in the first wave in a given country. The training questions we use in this study
are never asked in the first wave, however, hence the need to merge. Unfortunately this
implies a loss of data, as some firms are added to the data in each wave to compensate
for the process of attrition. For these firms, ownership information is not available and
we control for that in the analyses in order not to exclude these observations.
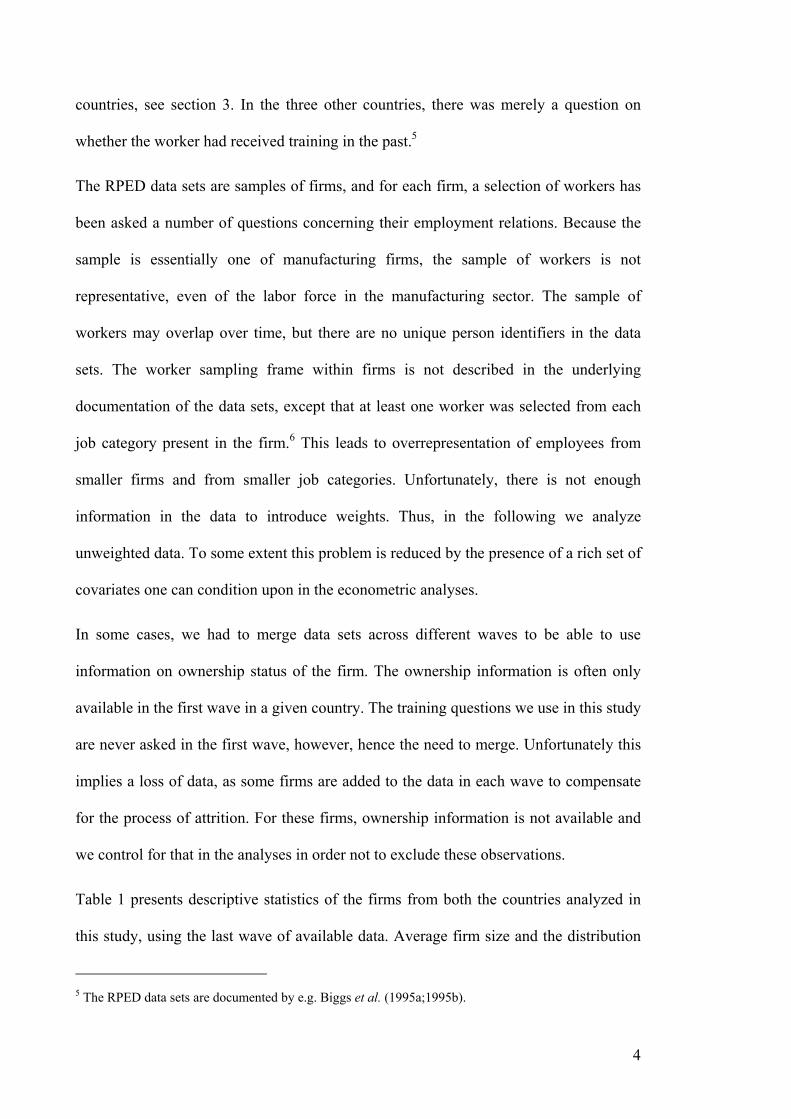
Table 1 presents descriptive statistics of the firms from both the countries analyzed in
this study, using the last wave of available data. Average firm size and the distribution
5 The RPED data sets are documented by e.g. Biggs et al. (1995a;1995b).
5
of firm sizes is quite similar in the two countries. The same holds for the industry
composition of firms. The only difference is with respect to ownership, where Zambia
has 7 percent of firms owned by the state, while in Kenya state ownership does not
exist.
Table 1. Descriptive statistics, firm level
Kenya 1995
Zambia 1995
Number of observations (firms) 218 196 Mean firm size 94.6 75.6
Size 1-10 0.38 0.40 Size 11-50 0.29 0.34 Size 51-150 0.21 0.15 Size 150+ 0.12 0.11 Food industry 0.25 0.26 Textile industry 0.24 0.27 Wood industry 0.27 0.24 Metal industry 0.25 0.23 Private ownership 0.76 0.66 Joint state-private ownership 0.01 0.01 State ownership 0.00 0.07 Missing ownership 0.23 0.26 Foreign ownership 0.06 0.06 Joint domestic-foreign ownership 0.08 0.06 Domestic ownership 0.63 0.63 Missing ownership 0.23 0.26
3. Description of training in African enterprises To study the effect of training on the incomes of workers in African enterprises, we
focus on the logarithm of the monthly wage as the outcome variable and training as an
endogenous treatment as is standard in evaluation studies (see section 4).
Before describing the data and the training selection process, we will first briefly
discuss the general background as regards training in Sub-Saharan Africa. In this paper,
6 In some of the waves, it is made explicit that the distribution of selected workers across job categories should reflect the distribution in the firm.

6
we only analyze formal sector firms, so training in the informal sector (mostly in terrms
of unstructured apprenticeships paid for by the trainees, see Ziderman, 2003) is not
discussed.
3.1 Training Institutions in Sub-Saharan Africa
Training in formal sector enterprises in sub-Saharan Africa during the nineties was
characterized as being mainly Enterprise Based Training (EBT), see e.g. Grierson
(2002b) and Johanson and Van Adams (2004), both of which are specifically concerned
with training in Sub-Saharan Africa in the nineties. Publicly provided on-the-job
training in Sub-Saharan Africa (particularly in Kenya and Zambia, two of the countries
studied by Grierson) has been decreasing in size for some time and is becoming
increasingly irrelevant. Indeed, Grierson (2002b) argues that
“…governments keep investing their scarce resources in pre-employment training for sectors that are not hiring…”7
This point of view is basically shared by Ziderman (2003) and Johanson and Van
Adams (2004), who both contend that public sector training is very inefficient.
Moreover, national trade and/or sector associations have not filled the gap left by the
stagnation in public sector training provision. Hence, the burden of provision of training
has fallen upon the firms themselves, with the advantages and drawbacks that entail:
EBT is flexible, efficient, demand driven, and it can easily be targeted towards firms’
specific needs. In addition, it may help to promote firm specific social skills and
traditions. The drawbacks are, naturally, that EBT is firm specific, that is, a large part of
the human capital invested in a worker is not transferable between firms. Moreover, the
quality of EBT may be low and vary a lot between firms. EBT also is not necessarily
conducive to long-term growth, as its objective is probably to boost short-term profits in
the firm.

7
The financing of EBT falls largely upon the firms and to some extent also on the
trainees, mainly through lower wages during the training period. In some countries, e.g.
Kenya and Zimbabwe, publicly provided training (which is mainly pre-employment
training through formalized apprenticeship systems) is financed through training levies
on employers, either as payroll taxes or as a fixed amount per worker or per unit of
output produced.
As regards selection processes (who receives training?), not much is known in advance.
Grierson (2002b) as well as Johanson and Van Adams (2004) report that training
resources often are concentrated on already highly skilled ‘key’ personnel.
In the present study, we are not able to identify EBT as a specific training category, but
as will be evident from the next sub-section, it would appear that many of the
descriptive statistics are consistent with this broader picture, namely that EBT is the
predominant form of training and that mainly high skilled workers are trained.
3.2 Training
The survey contains various sources of information regarding the extent of training. We
have information about whether the worker has received training in the 12 months
leading up to the survey as well as information about training received during the first
year of employment at the current firm. We have chosen to focus on the impact of
training received in the year leading up to the survey in order to avoid clear endogeneity
biases of, say, tenure when focusing on past training in the econometric analysis.8
7 P. 1. 8 A potential problem of using past training arises if trained individuals leave the manufacturing sector at a rate different from that of non-trained workers. This problem is not addressed in the study, except by limiting the focus to training received during the past 12 months, due to lack of relevant information.

8
The specific question asked to the worker is
In the past 12 months, have you participated in any of the following
learning activities?
A. At a school, vocational or training institute
B. At an industry association training center
C. Formal training courses provided by your employer
D. Instructions from a supervisor or co worker
E. Watching others or learning on your own
The categories A to E represent a decreasing level of formality of training. In what
follows, an affirmative answer to any of A through C is considered to mean ‘formal
training’, whereas D is considered ‘informal training’. We have chosen to disregard
answer E.9 In addition to this, the worker is being asked to report the amount of time
spent in each of these learning activities during the 12 months period.
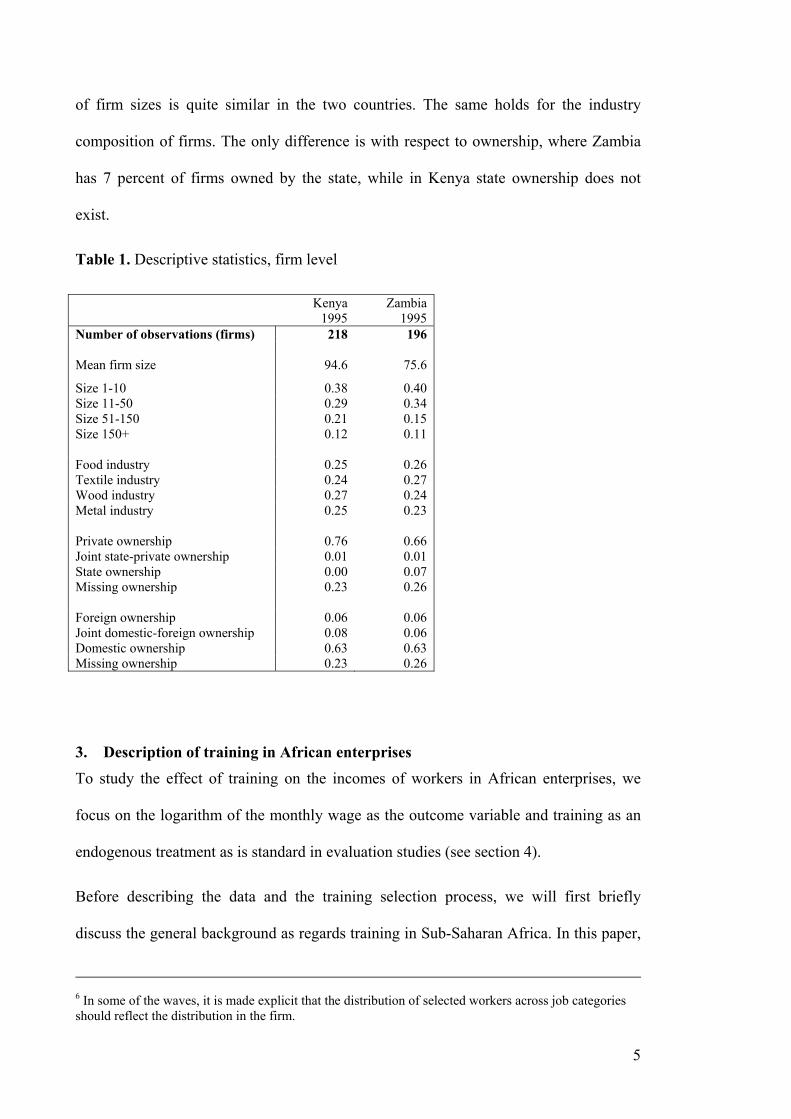
In Table 2, we look at training received during the previous year with the present
employer. As reported by Barron, Berger and Black (1997), the incidence of training
increases as we move down the table to less formal training modes.
The table shows that the fraction receiving formal training is similar in Zambia and
Kenya, and that informal training is used more frequently in Kenya. If we take a look at
the intensity of training, defined as the number of hours per year, some remarkable
differences reveal themselves.10 Category A training (i.e. training at a school) is
apparently much more intensive in Zambia compared to Kenya, and moreover, most of
9 Lumping of A, B, and C into a single indicator is needed in order to have enough trained individuals to perform the econometric analysis. Judging from Barron, Berger and Black (1997), there tends to be a lot of measurement error (i.e. disagreement about how to categorize training between employers and employees) if very detailed training categories are used. If more aggregate training categories are used, there tends to be agreement about the amount and incidence of training between the employer and employee. 10 In the table we report the mean and the median of the distribution of hours spent in training. There is not enough data points to generate plots of the distribution of hours within each category, but if we add – for each individual - the hours spent in training types A-D, the distribution is highly skewed with a probability density function which decreases with the number of hours in both countries.
9
formal training is paid for by the firm (it is on company hours). Category B training (i.e.
training at industry associations) is used less intensively in both countries, and still, the
intensity of this type of training is about twice as large in Zambia compared to Kenya.
For category C training (i.e. courses), the intensity is about the same in the two
countries, but more hours are on company time in Kenya. For category D training,
which we denote informal training, the intensity is larger in Zambia, while its extent is
larger in Kenya. The general picture is that nearly all formal training is paid for by the
firm (on company hours).
Table 2. Worker training in the previous year of the present job (1995 waves) Fraction receiving training Previous year of present job Kenya Zambia A: At a school, vocational or training institute Of which public Mean and Median # hours on company time (if yes) Mean and Median # hours on own time (if yes)
2.4 -
57.1 15 76.0 1
2.8 0.9
230.1 36 188.6 0
B: At an industry association training centre Mean and Median # hours on company time (if yes) Mean and Median # hours on own time (if yes)
1.3 53.5 50
0.0 0
0.7 12.7 0 92.4 0
C: Formal training courses provided by employer Mean and Median # hours on company time (if yes) Mean and Median # hours on own time (if yes)
1.8 84.4 4 7.0 0
2.0 57.6 80 23.5 0
D: Instructions from supervisors or co-workers Mean and Median # hours on company time (if yes) Mean and Median # hours on own time (if yes)
6.3 91.1 30
0.4 0
4.7 266.4 140
1.0 0
E: Watching others or learning on your own Mean and Median # hours on company time (if yes) Mean and Median # hours on own time (if yes)
4.3 74.4 16 27.5 0
6.9 118.4 50
97.3 10
3.3 Dependent and explanatory variables
The dependent variable in this study is the natural logarithm of the monthly wage
measured in the local currency. In Table 3 we present the average log wages in the
samples studied, as well as the raw difference in the averages.
10
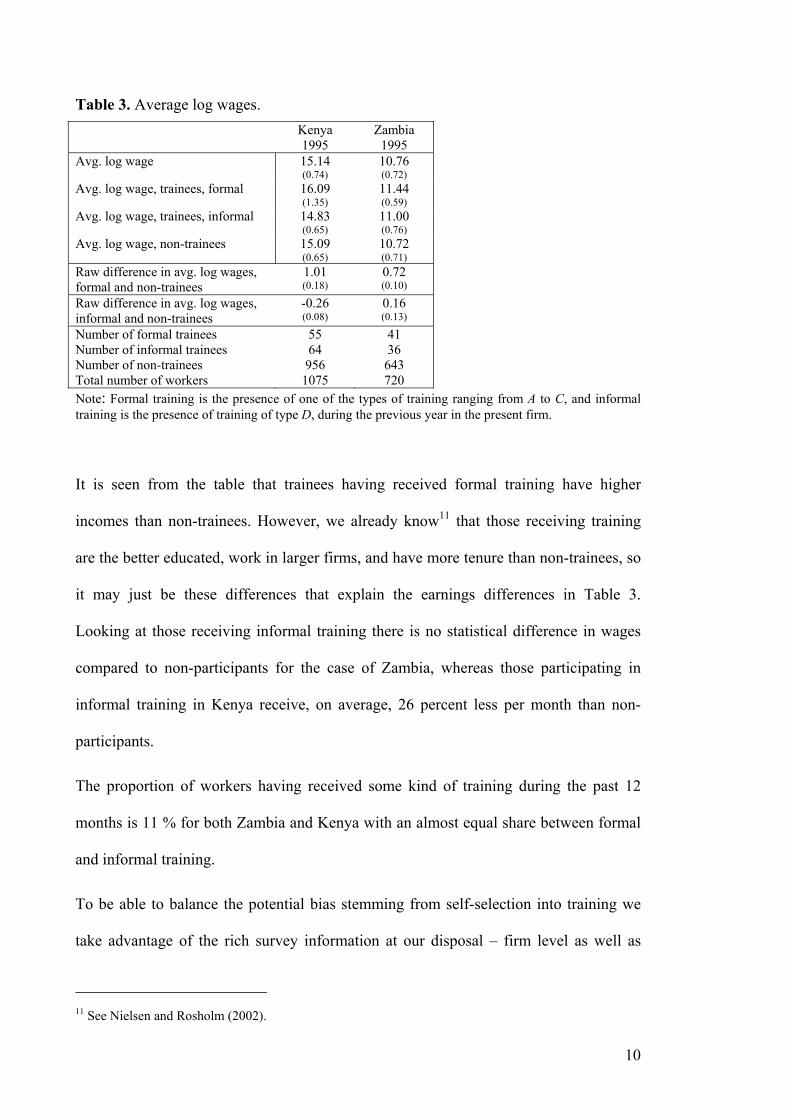
Table 3. Average log wages. Kenya
1995 Zambia
1995 Avg. log wage 15.14
(0.74) 10.76 (0.72)
Avg. log wage, trainees, formal 16.09 (1.35)
11.44 (0.59)
Avg. log wage, trainees, informal 14.83 (0.65)
11.00 (0.76)
Avg. log wage, non-trainees 15.09 (0.65)
10.72 (0.71)
Raw difference in avg. log wages, formal and non-trainees
1.01 (0.18)
0.72 (0.10)
Raw difference in avg. log wages, informal and non-trainees
-0.26 (0.08)
0.16 (0.13)
Number of formal trainees Number of informal trainees Number of non-trainees Total number of workers
55 64 956
1075
41 36 643 720
Note: Formal training is the presence of one of the types of training ranging from A to C, and informal training is the presence of training of type D, during the previous year in the present firm.
It is seen from the table that trainees having received formal training have higher
incomes than non-trainees. However, we already know11 that those receiving training
are the better educated, work in larger firms, and have more tenure than non-trainees, so
it may just be these differences that explain the earnings differences in Table 3.
Looking at those receiving informal training there is no statistical difference in wages
compared to non-participants for the case of Zambia, whereas those participating in
informal training in Kenya receive, on average, 26 percent less per month than non-
participants.
The proportion of workers having received some kind of training during the past 12
months is 11 % for both Zambia and Kenya with an almost equal share between formal
and informal training.
To be able to balance the potential bias stemming from self-selection into training we
take advantage of the rich survey information at our disposal – firm level as well as
11 See Nielsen and Rosholm (2002).

11
worker level information is available. On the firm level we use information that
potentially affects the likelihood and intensity with which training is used. This
information consist of the ownership type of the firm (privately or publicly owned or a
combination of the two, whether the company is domestically or internationally owned
or a combination thereof), industry (textile, wood, metal, or food sector), location of the
firm, the size of the firm with respect to number of employees in the years leading up to
the training period, the financial situation of the firm (whether profits went up or down
in the period), whether the firm was experiencing a shortage of skilled labor, the number
of people hired and fired, the degree of unionization within the firm, whether formal
training is provided within the firm, and the amount spent annually on training of
employees. The information used on the individual level is gender, ethnicity, age,
educational attainment, tenure in the firm, years of labor market experience prior to the
current employment spell, occupation, whether the individual is a relative to any of the
owners, and whether the individual is member of a labour union. The descriptive
statistics for the workers in the samples are shown in Appendix Table A1.
3.4 Selection into Training
Examining the selection into formal training we first note that firms fully owned by the
state have no workers in training, and as a consequence these observations are excluded
in the selection analyses below. For the case of Kenya, the same is the case for firms
jointly owned by private firms and the state. Moreover, the group without any formal
education is also not participating in formal training and is excluded. The five percent
found to be relatives to either the owner of the firm or the plant manager do not
participate in training neither and are excluded from the analyses. We could potentially
leave this group in below, but we conjecture that they might differ systematically in

12
their earnings potentials compared to their non-relative counterparts, and since the
number of non-participants in our sample is relatively large, we weigh the importance of
minimising the bias higher than the precision of our estimates. Finally, those working in
the occupational category ‘sales’ were found not to participate in formal training and we
exclude this population accordingly. This leaves us with 1075 individuals for Kenya
and 720 for Zambia, of whom 55 individuals in Kenya and 41 in Zambia receives
formal training. For informal training, the corresponding numbers are 64 and 36,
respectively.
We now proceed by conducting a more thorough investigation of participation in
training in the two samples. We do this by running a simple probit model. The
probability of receiving training plays a central role in our impact estimator below. In
this paper we employ the method of propensity score matching. We therefore need a
sufficiently rich set of attributes to balance the bias coming from self-selection into
training, see section 4 below.
Previous studies on the impact of training on earnings (see Heckman et al. (1999) and
Heckman & Smith (1999)) have shown the importance of labour market transitions as
key predictors of training participation. The questionnaires at our disposal do not lend
themselves to constructions of such a set of conditioning variables besides tenure and
the amount of experience the individual had prior to joining the current firm. However,
what we lack in information on the individual worker level, we have on the firm level,
where a variety of information is available, as discussed in section 3.3. Table 4 reports
the results from the participation probit. Here we report only the overall probit model
for each country, that is, where participation into formal or informal training is
estimated.
13
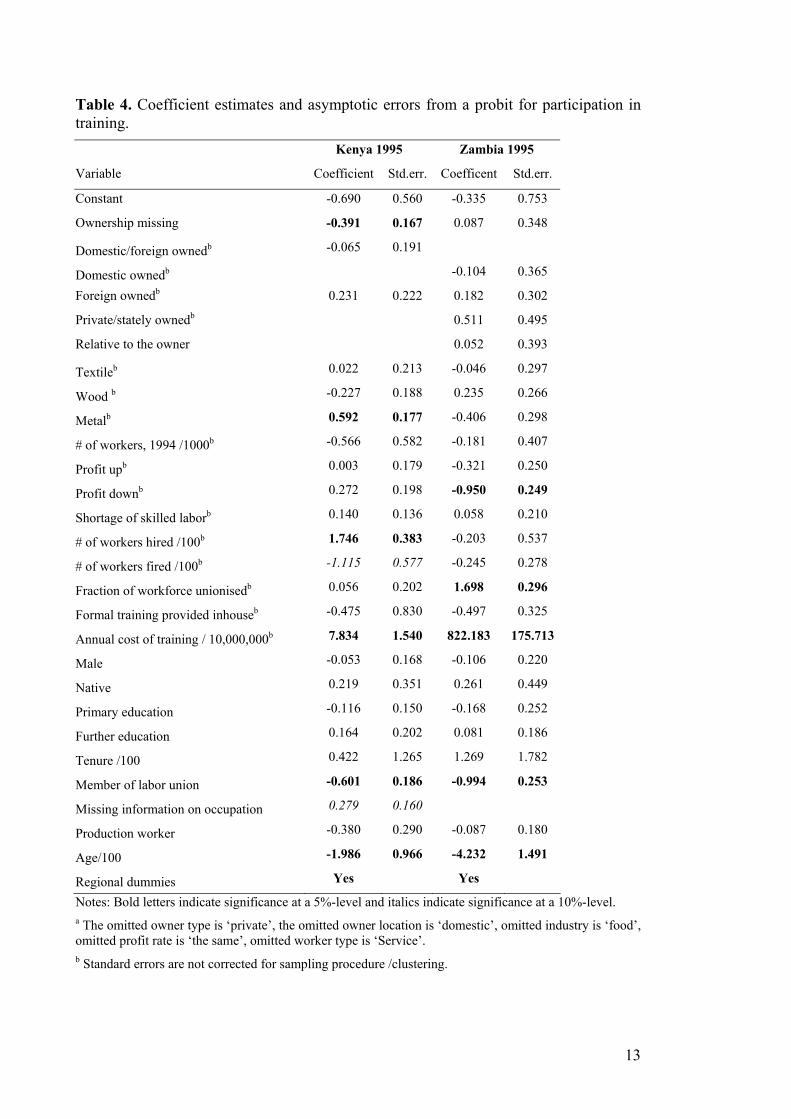
Table 4. Coefficient estimates and asymptotic errors from a probit for participation in training. Kenya 1995 Zambia 1995
Variable Coefficient Std.err. Coefficent Std.err.
Constant -0.690 0.560 -0.335 0.753
Ownership missing -0.391 0.167 0.087 0.348
Domestic/foreign ownedb -0.065 0.191
Domestic ownedb -0.104 0.365
Foreign ownedb 0.231 0.222 0.182 0.302
Private/stately ownedb 0.511 0.495
Relative to the owner 0.052 0.393
Textileb 0.022 0.213 -0.046 0.297
Wood b -0.227 0.188 0.235 0.266
Metalb 0.592 0.177 -0.406 0.298
# of workers, 1994 /1000b -0.566 0.582 -0.181 0.407
Profit upb 0.003 0.179 -0.321 0.250
Profit downb 0.272 0.198 -0.950 0.249
Shortage of skilled laborb 0.140 0.136 0.058 0.210
# of workers hired /100b 1.746 0.383 -0.203 0.537
# of workers fired /100b -1.115 0.577 -0.245 0.278
Fraction of workforce unionisedb 0.056 0.202 1.698 0.296
Formal training provided inhouseb -0.475 0.830 -0.497 0.325
Annual cost of training / 10,000,000b 7.834 1.540 822.183 175.713
Male -0.053 0.168 -0.106 0.220
Native 0.219 0.351 0.261 0.449
Primary education -0.116 0.150 -0.168 0.252
Further education 0.164 0.202 0.081 0.186
Tenure /100 0.422 1.265 1.269 1.782
Member of labor union -0.601 0.186 -0.994 0.253
Missing information on occupation 0.279 0.160
Production worker -0.380 0.290 -0.087 0.180
Age/100 -1.986 0.966 -4.232 1.491
Regional dummies Yes Yes
Notes: Bold letters indicate significance at a 5%-level and italics indicate significance at a 10%-level. a The omitted owner type is ‘private’, the omitted owner location is ‘domestic’, omitted industry is ‘food’, omitted profit rate is ‘the same’, omitted worker type is ‘Service’. b Standard errors are not corrected for sampling procedure /clustering.

14
Ownership and industry dummies have some explanatory power for Kenya. If the firms
profit went down from past years, workers are less likely to have been trained in
Zambia, but more likely to have received training in Kenya. In Kenya, the number of
hires the previous year increases the probability of participation, whereas the number of
fires decreases the probability. The larger the fraction of the workforce in the firm,
which is unionized, the larger is the probability of training in Zambia. However, if the
worker him or herself is unionized participation decreases. Training probabilities
increase strongly with the annual cost of training in the firm, naturally. Less educated
workers receive less training, while workers with a further education receive more
training than the reference category with secondary schooling. None of these effects are
significant, though. Recall that workers without formal education are excluded since
they never received training. Finally, tenure does not appear to have any explanatory
power for the receipt of training, but higher age does indeed decrease the participation.12
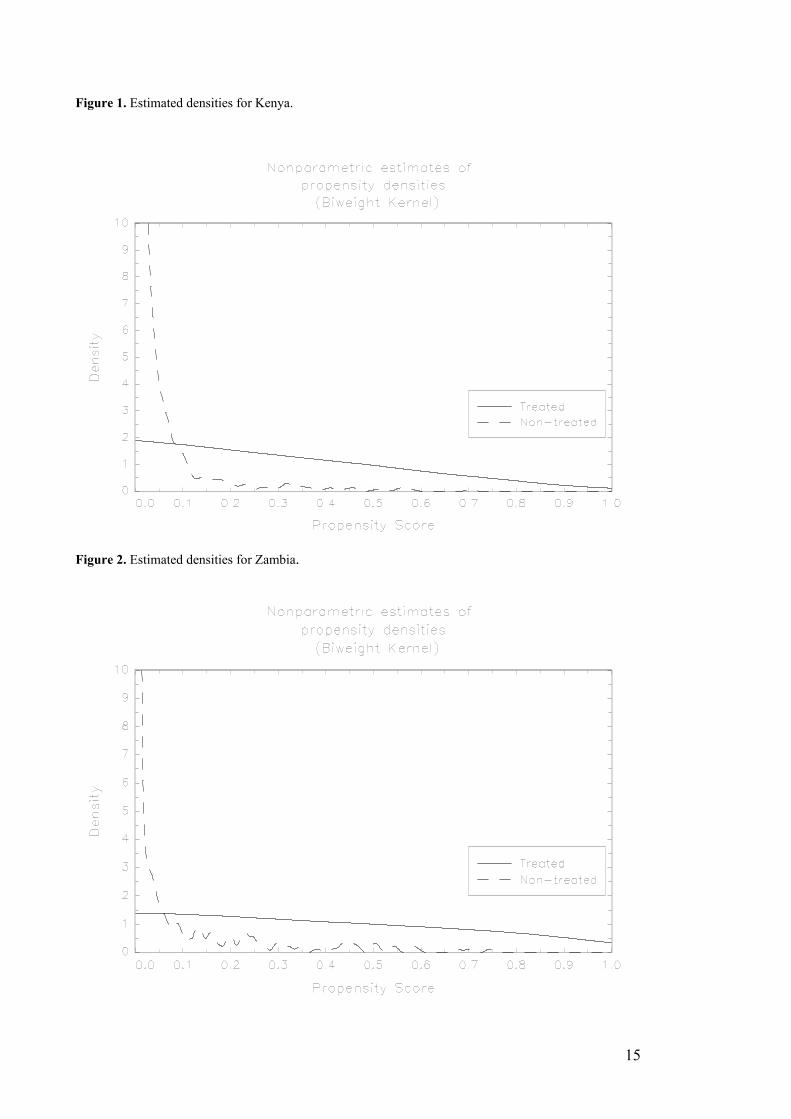
In Figures 1 and 2, we plot the estimated densities of the probability of training receipt
for those who received training - the treated – and those who did not- the non-treated. It
can be observed that the distribution of the propensity scores differ widely among
treated and non-treated, but still, there appears to be an area of common support below a
probability of 0.7.
12 Notice that: age=7 + education + experience in previous jobs + time in unemployment + tenure with firm. Although time in unemployment was not included as an explanatory variable, we had to exclude experience in previous jobs as well to estimate the propensity scores. Although we try to identify as detailed effects as possible, only age turn out to be significant.
15
Figure 1. Estimated densities for Kenya.
Figure 2. Estimated densities for Zambia.

16
4. The Evaluation Problem Suppose we have a random variable Y on which we want to measure the impact of
receiving training. Let D be an indicator variable denoting receipt of training; if D=1,
the individual received training, and D=0 otherwise. Let 1Y be the outcome in the
presence of training and 0Y the outcome in the absence of training. Think of 1Y and 0Y
as two latent variables, of which only one is observed.
Hence, for a given person, the effect of training is the effect of shifting from ‘D=0’ to
‘D=1’, or 1 0Y Y− . The mean effect of training in the population is [ ]1 0E Y Y− while the
average effect of training on the trained (ATET) is
(1) [ ]
[ ] [ ]1 0
1 0
| 1
| 1 | 1
E Y Y D
E Y D E Y D
∆ = − =
= = − =
The first term in the second line – the outcome in the presence of training among those
receiving training – is directly observed in the data. The second term – the outcome in
the absence of training for a trained person – is not observed, and herein lies the
evaluation problem. To estimate the impact of training one thus needs to estimate the
unobserved counterfactual ( [ ]0 | 1E Y D = ) in the equation above. While the discussion
of the appropriate measure of the impact of training is highly relevant, we will skip it
here and refer the interested reader to the discussion in Heckman et al. (1999). We only
note that the parameter that we estimate in this paper is the average effect of training on
the trained (ATET), that is, the parameter ∆ above.

17
4.1 Matching estimators
The matching estimator tries to mimic the laboratory experiment by equalizing trained
and untrained workers along measurable dimensions. The assumption required for
consistent estimators is that
(3) 0 |Y D X⊥
where X is a set of observed variables. The conventional term for this condition in the
econometrics literature has become the ‘conditional independence assumption’ (CIA).
The problem with this assumption is evident if, for instance, X is multidimensional or
contains continuous variables, because in those cases matching on X becomes very
tedious. Rosenbaum and Rubin (1983) prove that (3) actually implies that
(4) 0 | ( )Y D p X⊥
where [ ]( ) Pr 1|p X D X= = is the propensity score, that is, the probability of
participating in training. This means that, instead of conditioning on X, all that is
necessary is to condition on the propensity score, which is one-dimensional.13
Given the access to rich information as regards the selection into training, we argue that
many of the variables affecting selection into training are observed, and we will
therefore proceed by employing matching estimators.14
13 Of course, if the propensity has to be estimated non-parametrically, the ‘curse of dimensionality’ re-emerges, see Smith & Todd (2003) for discussion.

18
Several matching algorithms are available, including nearest neighbor matching, caliper
matching, kernel and local linear matching. In this paper we employ the last of the four.
Local linear matching uses multiple comparison sample members to construct kernel
weighted averages to use as matches. Relative to simpler techniques, kernel techniques
allow a reduction of the variance of the matching estimate by using more individuals for
each match. The cost is a small increase in bias due to the increased average distance
between trained and matched non-trained individuals.
The local linear matching estimator has a slight advantage over the kernel matching
estimator because of some desirable statistical properties (Heckman et al., 1997). As
kernel function, we use the biweight kernel
(10) 2 215 (1 ) for | | 1
( ) 160 otherwise
s sK s
− <=
The rule of thumb by Silverman (1986) is used for the choice of bandwidth, and a 3%
trimming level is applied to determine the area of common support.
5. Results Trainees generally receive higher log wages than non-trainees. When estimating the
average effect of training on the trained, the exercise is to find out whether this
relationship reflects a mere productivity enhancing effect of training, or whether
trainees just have favorable characteristics, which would have given them higher wages
even in the absence of training. In this section we present estimates of the average effect
of training (during the last 12 months before the survey) on the monthly log wages of
trained workers. First, we report the raw log wage differences and estimated training
effects using a propensity score matching estimator. Then, to the extent that data allows,
14 In previous versions of the paper we tried to estimate models which take into account selection on

19
we check robustness of the results by looking at variation in training effects by duration
of training and by firm characteristics.15 Finally, we check robustness by comparing
with the training effects as estimated from three other Sub-Saharan African countries
where more general training indicators are available.
5.1 Average training effects
Table 5 below presents the estimates of training effects on log wages of workers. Using
a local linear matching estimator, we find that the training effect is significantly positive
for Kenya, but not well-determined for Zambia. We also distinguish between formal
and informal training. We denote training which takes place at a formal training course
as ‘formal training’, whereas training which consists of instruction by a supervisor or a
co-worker is denoted ‘informal training’.16
For Kenya, the average effect of training on the wages of trained workers is 24.1%, and
it is significantly positive at a 10% level. The effect stems mainly from formal training.
For Zambia, the average effect of training on wages is small and insignificant. Looking
separately at formal and informal training, we find that informal training has a
significantly positive effect in Zambia, while formal training does not.
unobservables, but we were unable to come up with convincing instruments/exclusion restrictions. 15 We also tried with individual characteristics like the educational level, but were unable to obtain meaningful results, due to there being too few individuals irrespective of the grouping chosen. 16 Section 3 gives more details on the training indicator. ‘Formal training’ refers to category A-C, whereas ‘informal training’ refers to category D.

20
Table 5. Average training effect on the trained.
Kenya 1995 Zambia 1995
All Formal Informal All Formal Informal
Raw difference in log wages 0.366 1.008 -0.258 0.427 0.664 0.181
ATET (Local linear matching)
0.241
(0.124)
0.402
(0.318)
Too few
Observ.
0.112
(0.119)
0.083
(0.338)
0.286
(0.147)
Sample size 1075 720
Sample size after elimination of zero densities 986 929 . 672 545 587
# treatments (after trimming) 81 26 . 53 20 23
# controls (after trimming) 847 849 . 580 494 532
Note: Std. errors are based on 999 bootstraps with 100% resampling. Trimming level 0.03. Bold letters indicate significance at a 5%-significance level, whereas italics indicate significance at a 10%-significance level.
In the appendix, we report balancing tests to investigate how well the propensity score
matching succeeds in matching on a long range of variables. In general, the means are
similar and biases moderate. We experimented with interactions and polynomials for
each estimation. Still, there are a few variables where the match is not very good on
average.
5.2 Training effects for different training durations
If training has a productivity enhancing effect, one should see wage effects increasing
with the amount of training. Therefore, we investigate whether training effects vary
with the duration of training. Due to the low number of trainees in the samples, this is
done by gradually removing workers receiving only small amounts of training. Table 6
shows the results. The columns ‘10+’ include only trainees with more than 10 hours of
training, while the columns ‘80+’ include trainees receiving more than 80 hours of
training. For Kenya, the effect of training tends to increase and become more well-
determined when we exclude individuals with a short training duration, whereas for
Zambia the results are inconclusive.
21
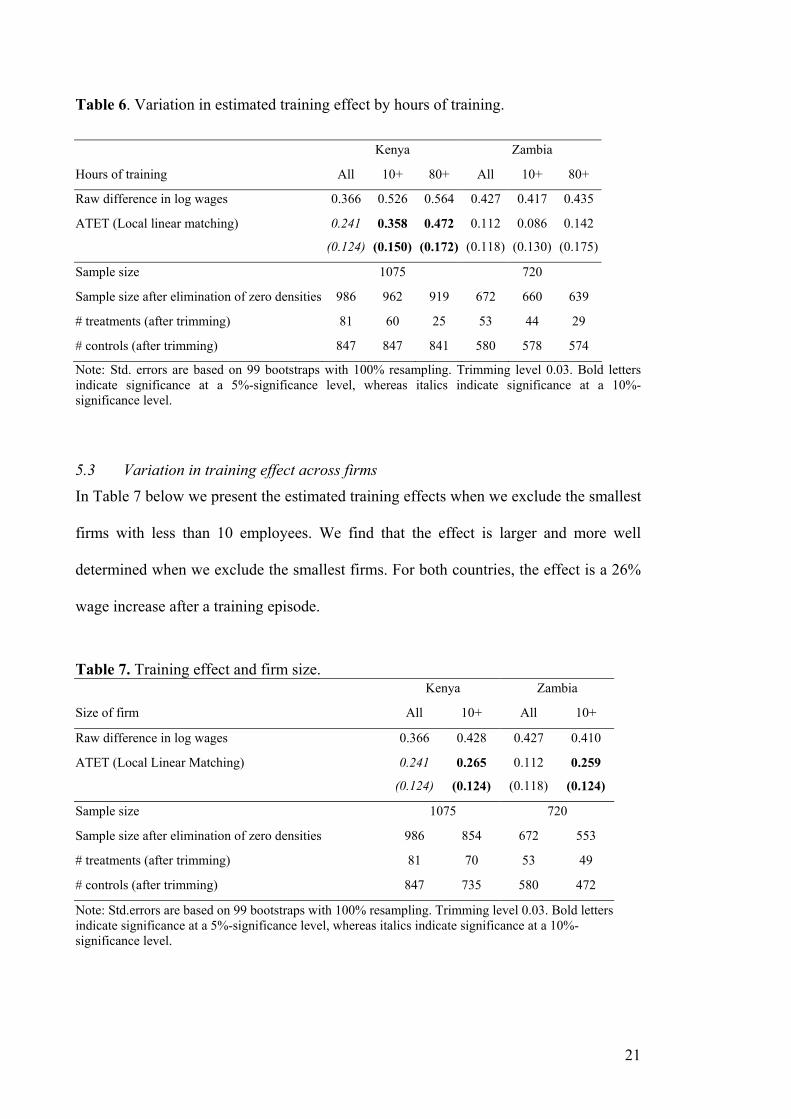
Table 6. Variation in estimated training effect by hours of training.
Kenya Zambia
Hours of training All 10+ 80+ All 10+ 80+
Raw difference in log wages 0.366 0.526 0.564 0.427 0.417 0.435
ATET (Local linear matching)
0.241
(0.124)
0.358
(0.150)
0.472
(0.172)
0.112
(0.118)
0.086
(0.130)
0.142
(0.175)
Sample size 1075 720
Sample size after elimination of zero densities 986 962 919 672 660 639
# treatments (after trimming) 81 60 25 53 44 29
# controls (after trimming) 847 847 841 580 578 574
Note: Std. errors are based on 99 bootstraps with 100% resampling. Trimming level 0.03. Bold letters indicate significance at a 5%-significance level, whereas italics indicate significance at a 10%-significance level.
5.3 Variation in training effect across firms
In Table 7 below we present the estimated training effects when we exclude the smallest
firms with less than 10 employees. We find that the effect is larger and more well
determined when we exclude the smallest firms. For both countries, the effect is a 26%
wage increase after a training episode.
Table 7. Training effect and firm size. Kenya Zambia
Size of firm All 10+ All 10+
Raw difference in log wages 0.366 0.428 0.427 0.410
ATET (Local Linear Matching)
0.241
(0.124)
0.265
(0.124)
0.112
(0.118)
0.259
(0.124)
Sample size 1075 720
Sample size after elimination of zero densities 986 854 672 553
# treatments (after trimming) 81 70 53 49
# controls (after trimming) 847 735 580 472
Note: Std.errors are based on 99 bootstraps with 100% resampling. Trimming level 0.03. Bold letters indicate significance at a 5%-significance level, whereas italics indicate significance at a 10%- significance level.

22
There are several potential explanations why the return to training increases with firm
size. One is that large firms have internal labor markets that reward increased
productivity by promotion (Lazear, 1995). Another explanation is that there may be
economies of scale in training provision and economies of scale in access to
government sponsored training programs. The existence of internal labour markets
allows large firms to invest more in training and get a higher pay-off to training for at
least two reasons (Middleton et al., 1993). The promotion possibility makes it more
attractive for workers to stay in the firm, and therefore the potential market failure in the
training market is reduced. Moreover, large firms may be more inclined to hire low-
educated workers and train them themselves, if the skills from the school system are
inappropriate or insufficient. On the other hand, they may use education as a screening
device since education is expected to be positively correlated with favorable unobserved
traits (Stiglitz, 1975).
The effect of training may also vary across individuals. Middleton et al. (1993) report
several explanations why the training effect might vary with gender or education.
However, we are not able to identify gender specific training effects, since females
constitute a small proportion of the samples, and hence the overall effect stems from
training of males. Neither is it possible to detect variation in the training effect across
education. The only educational group where we succeed to estimate the training effect
separately consists of individuals with secondary or further education in Zambia in
which case the effect was slightly more well-determined (ATET 0.15, std.err. 0.11) than
for the overall sample.

23
5.4 Training effects for alternative data sources
As a further check of the robustness of the results, we use other available waves of
African firm data. We use three waves of RPED data collected in Ghana, Zimbabwe and
Kenya in 1994. For these three waves of data we know whether an employee has
received training in the past or not. However, the training indicator is more general
(“Did you receive training in the past?” Possible answers: Within, outside or no) and the
information about the selection process is more scarce than for Kenya and Zambia.
As a robustness check, we report the estimated average training effect on the trained for
these three waves in Table 8. The training effects for these waves are found to be 15-
20%, which is similar to the findings from the data sets, where we have more details on
the type of training and the selection process.
Table 8. Estimates of average training effects for alternative data waves. Ghana
1994
Zimbabwe
1994
Kenya
1994
Raw difference in log Wages 0.18 0.39 0.17
ATET (Kernel Matching) 0.22
(0.10)
0.22
(0.07)
0.15
(0.05)
Note: Bold letters indicate significance at a 5%-significance level. For the kernel and the regression adjusted local linear matching estimators, standard errors have been obtained by 999 bootstraps with 100% re-sampling
6. Policy issues The first crucial policy question is whether training increases wage and productivity at
all. Like most other studies17 evaluating the average effect of employer-sponsored
training, we tend to find a positive wage effect. We find an average effect of training on
the trained, which is roughly a 20% wage increase. If wages reflect productivity, both
employers and employees seem to benefit from training.

24
The second crucial policy question is whether the net benefit after considering costs
associated with training is also positive. Our data for Kenya and Zambia show that
training (in terms of time spent) is employer financed rather than employee financed.
The amount of individual hours spent on training is lower than the number of company
hours spent, cf. Table 2.18 Hence, the employers seem to carry most of the costs, which
may lead to under-investment in training, at least if the skills are transferable across
firms (Becker, 1975).
If skills are fully transferable from firm to firm, and if labor markets are competitive
such that wages reflect productivity only, the simple evaluation studies performed in the
previous section of this paper are valid. For the UK, Blundell et al. (1996) find that
benefits of employer-sponsored in-service training has long-lasting effects and that the
acquired skills are almost completely transferable. To our knowledge no such analysis
exists for Sub-Saharan Africa.
After a period of training, pay rises may occur due to a productivity increase or due to
promotion. We are not able to distinguish the two, and hence we just attribute pay rises
to training, irrespective of the source of the increase in pay, productivity increase or
promotion, since both are caused by training. We estimate that the average effect of
training on the trained is a 20% wage increase, and if wages do indeed mirror
productivity, both employers and employees benefit from training. For these numbers to
be useful, the associated costs need to be considered also. For Kenya and Zambia, the
indirect costs (output lost) of training are indicated by Table 2, which shows that the
17 See Grubb and Ryan (1999). 18 In 1991, the World Bank recommended to move the focus from supply driven to demand driven training, and to switch from public towards employer and private training, see Bennell (1996) and Middleton et al. (1993). Bennell (1996) indicates that the policy has not been implemented in Sub-Saharan Africa, and that it is not likely to be successfully introduced either. It is not evident from our data whether this switch has actually taken place, but in-depth interviews (Grierson, 2002a) indicate that it has taken place in Zambia.
25
invested company hours range from 50 to 400 hours per trainee, which is roughly 3-
25% of annual working time. There is no direct evidence on the direct costs of training,
partly due to the fact that training is heterogeneous (see Table 4). However, some of the
training is informal, involving foremen and/or co-workers. If we make the ad hoc
assumption that informal training involves a one-to-one relation, then the total costs are
approximately twice the indirect costs. Hence, total costs add up to 6-50% of average
annual wages. However, informal training shows less variation in terms of the number
of hours used, which is around 250, corresponding to 15% of annual working time.
Assuming that these numbers are generally valid for the countries in this study, and
adding a little costs for formal training, we can perform an approximate cost-benefit
analysis for training. Moreover, assume that labor’s share of output is two-thirds -
which is roughly in accordance with Biggs et al. (1995a) – and that a productivity
increase is shared in the same proportion between the capital owner(s) and the workers.
We use discount rates of 0, 0.05, and 0.10. The formula used for the analysis is the
following:
16
0 2rtPDV c e dt−∆
⋅= − + ∫
PDV is present discounted value of training, expressed in ‘annual output per worker’
units, c denotes the initial cost of training (as a fraction of annual output per worker), ∆
is the return to training, and r is the discount rate. The upper limit of the integral is set to
16 years; in the descriptive statistics in Table A1, reported tenure levels are around 8
years. Assuming an exponential distribution, the expected duration of a stock sampled
observation is twice the elapsed duration, that is, 16 years. The division by 2 is simply
because the firm owner gets 1/3 of the output generated, and ∆ corresponds to 2/3. We
also calculate the amount of tenure required for the investment to be worthwhile for the

26
firm, that is, the time until the PDV is positive; we just replace the upper integral limit
with an x and solve for the value of x that sets PDV=0. Table 9 shows this back-of-the-
envelope calculation of PDV and break-even of employer-financed training.
Table 9. PDV and break-even of employer-financed training. Rate of return, ∆ 20% PDV Break-even 0% discount rate Costs 6% Costs 15% Costs 80%
- annual output -
1.54 1.45 0.80
- years in the firm until break-even - 0.60 1.50 8.00
5% discount rate Costs 6% Costs 15% Costs 80%
1.04 0.95 0.30
0.61 1.56 10.22
10% discount rate Costs 6% Costs 15% Costs 80%
0.74 0.65 -0.00
0.62 1.63
-
Note that the PDV is positive in all except one case. For example, with a 5% discount
rate and 15% costs, the firm experiences an accumulated gain corresponding to the
annual output of 0.95 workers, implying that the investment pays off as long as the
worker stays in the firm at least 1.56 years after being trained.
Based on these calculations, we would argue that the case for training is very good.
Firms have gained from investing in training, and since the gain is increasing in tenure,
firms should construct training schemes in such a way that they induce the worker to
stay in the firm. To the extent that training produces firm specific productivity
increases, that is not a problem, but if some of the productivity increase is transferable
to other firms, it may be worthwhile to design pay profiles in such a way that the worker
has an incentive to stay in the firm at least until the firm reaches its break-even point.

27
These relatively optimistic conclusions hold for the trained on average, and they do not
necessarily carry over to the marginal trainee. Therefore, it is not possible to infer
anything about prospects for future policy. Furthermore, the conclusions do not
necessarily carry over to public sponsored training programs.
7. Conclusion Econometric evaluation of training programs in Sub-Saharan Africa is scarce. Biggs et
al. (1995a) show that African manufacturing firms gain from training its workers, and in
this paper we show that workers also experience wage gains from participation in
training. We find that the returns to training are roughly 20% in general. Returns are
larger for formal than informal training in Kenya, while the reverse appears to be the
case in Zambia. We find, moreover, indications that the returns to training increases
with the amount of training received and that the returns to training increase with firm
size. Cost-benefit analyses show that the case for training is very good, since the
calculated present value is positive under most assumptions. Under training schemes
with high costs, the break-even point may be sufficiently far out in the future that it may
be worthwhile to design pay profiles such that the worker has an incentive to stay in the
firm at least until the firm reaches its break-even point.
References
Barron, J. M., M. C. Berger and D. A. Black (1997), “How Well Do We Measure Training?” Journal of Labor Economics 15 (3): 507-528.
Becker, G. (1975), Human Capital: A Theoretical and Empirical Analysis with Special Reference to Education. New York: NBER.
Bennell, P. (1996), “Privatization Choice and Competition: The World Bank’s Reform Agenda for vocational Education and Training in Sub-Saharan Africa.” Journal of International Development 8 (3): 467-487.
Biggs, T., M. Shah and P. Srivastava (1995a),”Training and Productivity in African Manufacturing Enterprises”, RPED Discussion Papers. The World Bank: Washington D.C.
Biggs, T., M Shah and P. Srivastava (1995b), “Technological Capabilities and Learning in African Enterprises”. Technical Paper No. 288. Africa Technical Department, World Bank, Washington, D.C.

28
Blundell, R., L. Dearden, and C. Meghir (1996), The Determinants and Effects of Work Related Training in Britain. IFS, London.
Chandra, V, L. Moorty, B. Rajaratnam, and K. Schaefer (2001), “Constraints to Growth and Employment in South Africa.” Informal Discussion Paper on Aspects of the Economy of South Africa #14. The World Bank, Washington D.C.
Grierson, J., editor, (2002a), “Enterprise-based Training in Africa: Case Studies from Kenya and Zambia.” Occasional Paper, International Training Centre of ILO, Turin.
Grierson, J. (2002b), “Practices and Trends in formal Sector Enterprise-Based Training in Africa.” Occasional Paper, Occasional Paper, International Training Centre of ILO, Turin.
Grubb, W. N. and P. Ryan (1999), “The Roles of Evaluation for Vocational Education and Training: Plain Talk on the Fields of Dreams.” Kogan Page, UK.
Heckman, J. J., R. J. LaLonde, and J. A. Smith (1999), “The Economics and Econometrics of Active Labour Market Programs.” In Ashenfelter and Card (eds.) Handbook of Labor Economics. North Holland: Amsterdam.
Heckman, J. & Smith, J. (1999), “The Pre-Program Earnings Dip and the Determinants of Participation in a Social Program: Implications for Simple Program Evaluation Strategies.” The Economic Journal 109: 313–348.
Johanson, R. and A. Van Adams (2004), Skills Development in Sub-Saharan Africa. The World Bank, Washington D.C.
Lazear, E. (1995), Personnel Economics. MIT Press.
Lechner, M. (1999), “An Evaluation of Public-Sector Sponsored Continuous Vocational Training Programs in East Germany.” Journal of Human Resources 35 (2): 347-375.
Lynch, L. (1992), “Private-Sector Training and the Earnings of Young Workers.” American Economic Review 82 (1): 299-312.
Middleton, J., A. Ziderman, A. Van Adams (1993), Skills for Productivity: Vocational Education and Training in Developing Countries. The World Bank, Washington D.C.
Nielsen, H. S. and M. Rosholm (2002), “The Extent of Training Among African Enterprises and African Workers.” Manuscript.
Rosenbaum, P. R., and D. B. Rubin (1983), “The Central Role of the Propensity Score in Observational Studies for Causal Effects”, Biometrika 70 (1) 41-55.
Silverman, B. W. (1986), Density Estimation for Statistics and Data Analysis. Chapman and Hall/CRC.
Smith, J. A. & P. E. Todd (2003), “Does Matching Overcome LaLonde’s Critique of Nonexperimental Estimators?” Journal of Econometrics, forthcoming.
Stiglitz, J. (1975), “The Theory of Screening, Education, and the Distribution of Income.” American Economic Review 65: 283-300.
World Bank (2001), Private Sector Development Strategy – Directions for the World Bank Group. World Bank, Washington D.C.
Ziderman, A. (2003), Financing Vocational Training in Sub-Saharan Africa. World Bank, Washington D.C.

29
APPENDIX Table A1. Descriptive statistics for the workers in the two samples Kenya
1995 Zambia
1995 Firm Level: Ownership type:
1. Private 2. Public 3. Jointly private and public 4. Ownership missing
0.761 0.000 0.014 0.225
0.704 0.158 0.029 0.109
Ownership nationality 1. Domestic 2. Foreign 3. Jointly domestic/ foreign 4. Ownership missing
0.588 0.074 0.113 0.225
0.731 0.082 0.079 0.109
Industry 1. Textile 2. Wood 3. Metal 4. Food
0.203 0.285 0.244 0.288
0.276 0.176 0.249 0.299
Firm location 1. Nairobi / Lusaka 2. Mombasa / Livingstone 3. Nakuru / Kitwe 4. Eldoret / Ndola
0.642 0.179 0.105 0.074
0.399 0.093 0.139 0.369
Total number of employees 1. 1993 2. 1994
123.6 127.9
178.1 162.7
Profit rate compare to previous year 1. Higher 2. Lower
0.375 0.388
0.276 0.621
Shortages of skilled labor an obstacle (1=yes)? 0.442 0.151 Number of permanent employees
1. Hired previous year 2. Fired previous year
7.2 6.6
8.4
16.7 Fraction of employees member of a labor union 0.396 0.467 Provision of training within firm (1=yes)? 0.013 0.097 Total amount spend on training previous year 124,608 1503 Worker level: Gender (1=male) 0.854 0.812 Ethnicity (1=African) 0.969 0.975 Educational Attainment, highest:
1. None 2. Primary 3. Secondary 4. Further
0.028 0.434 0.438 0.101
0.011 0.228 0.481 0.281
Tenure 7.70 7.40 Experience minus tenure 3.16 4.99 Whether relative to firm owner or manager (1=yes) 0.044 0.053 Member of labour union 0.339 0.310 Job previous year:
1. Sales 2. Production 3. Service
0.028 0.963 0.01
0.056 0.545 0.038
Age 33.56 35.40

30
Table A2. Balancing tests. Kenya – all Zambia – all
Treated
means
Matched
means Bias-%
Treated
means
Matched
means Bias-%
Ownership missing 0.163 0.117 13.145 0.075 0.059 6.532
Freign owned 0.113 0.101 3.586 0.113 0.098 4.878
Textile 0.088 0.104 -5.667 0.302 0.286 3.506
Wood 0.188 0.187 0.197 0.208 0.226 -4.379
Metal 0.438 0.442 -0.940 0.245 0.217 6.608
Nairobi/Lusaka 0.563 0.561 0.350 0.453 0.445 1.544
Nakuru/Kitwe 0.138 0.146 -2.400 0.208 0.196 2.742
Eldoret/Ndola 0.100 0.101 -0.341 0.264 0.244 4.617
# of workers, 1994 /1000 0.097 0.100 -1.894 0.198 0.221 -7.327
Profit up 0.500 0.502 -0.437 0.415 0.336 16.244
Profit down 0.300 0.293 1.584 0.509 0.538 -5.650
Shortage of skilled labor 0.488 0.505 -3.408 0.226 0.220 1.609
# of workers hired /100 0.046 0.051 -7.613 0.109 0.109 -0.165
# of workers fired /100 0.008 0.029 -18.284 0.185 0.170 3.964
Fraction of workforce unionised 0.315 0.338 -5.775 0.596 0.616 -5.540
Whether formal training provided inhouse 0.000 0.000 . 0.132 0.131 0.317
Annual cost of training / 10,000,000 0.011 0.010 3.792 0.000 0.000 0.158
Male 0.813 0.848 -9.399 0.755 0.793 -9.236
Native 0.963 0.978 -9.256 0.943 0.971 -13.557
Primary education 0.325 0.351 -5.425 0.113 0.119 -1.709
Further education 0.175 0.156 5.134 0.377 0.347 6.258
Tenure /100 0.059 0.056 5.084 0.067 0.071 -5.680
Member of labor union 0.150 0.155 -1.471 0.189 0.185 1.031
Production worker 0.925 0.904 7.625 0.434 0.519 -16.940
Age 0.301 0.306 -6.070 0.325 0.334 -10.389