Optimization of Multilayer Shields Made of Composite Nanostructured Materials
Evaluation of the effect of rolling correction ofdouble-o-tunnel shields via one-side loading
Shui-Long Shen, Yan-Jun Du, and Chun-Yong Luo
Abstract: During construction of a double-o-tunnel (DOT), rolling will inevitably occur due to the following: (i) nonuni-formity of subsoil condition, (ii) manufacturing errors in the DOT shield machine, (iii) different pulling forces at two sidesof the DOT, (iv) effect of assembled segments, (v) loss of grout, and (vi) inappropriate operation. In engineering practice,rolling correction using a one-side load at the elevated side is a cost-effective method. The weight of the one-side load isdetermined by the experience of the engineers and (or) through observation of the returned rolling angle. However, thesemethods cannot predict the value of the one-side load before applying it. This paper presents a series of finite elementanalyses that was performed to investigate the relationship among the one-side load, rolling angle, and subsoil deforma-tion. The analytical results show that the proposed approach can predict field-observed data well. It is concluded that ana-lytical results can be used as guidance for DOT construction.
Key words: double-o-tunnel (DOT) shield, rolling correction, one-side loading, finite element analysis, settlement.
Resume : Pendant la construction d’un tunnel double circulaire (« double-o-tunnel, DOT »), il y aura inevitablement duroulage pour les raisons suivantes : (i) des conditions de sous-sol non uniformes; (ii) des erreurs lors de la manufacture dubouclier pour foncer le tunnel DOT; (iii) des forces differentes tirant de chaque cote du tunnel DOT; (iv) les effets dessegments assembles; (v) les pertes de coulis; (vi) une operation inappropriee. Dans la pratique, une methode efficace etpeu couteuse est la correction du roulage par l’ajout d’une charge d’un cote, du cote eleve. Le poids de la charge est deter-mine par l’experience des ingenieurs et (ou) par l’observation de l’angle de roulage suite a l’application de la charge d’uncote. Cependant, ces methodes ne peuvent pas predire la valeur de la charge avant son application. Cet article presente desanalyses par elements finis qui ont ete effectuees pour evaluer la relation entre la charge d’un cote, l’angle de roulage etla deformation du sous-sol. Les resultats analytiques demontrent que l’approche proposee permet de bien predire les obser-vations sur le terrain. On peut ainsi conclure que les resultats analytiques peuvent etre utilises pour diriger la constructiond’un DOT.
Mots-cles : bouclier pour le foncage d’un tunnel double circulaire (« DOT »), correction du roulage, charge d’un cote, ana-lyse par elements finis, tassement.
[Traduit par la Redaction]
IntroductionThe process of urbanization continuously exploits under-
ground space in urban areas. The shield tunneling method isone of the main construction methods for urban tunnels.Generally, a shield tunnel is in a single circular configura-tion. However, there are many disadvantages to a single cir-cular shield tunnel, e.g., (i) use of a large undergroundspace, (ii) high construction costs, and (iii) a long construc-tion period. To overcome these disadvantages, a newmethod named the double-o-tube shield tunnel (hereaftercalled double-o-tunnel and labeled DOT) method was pro-posed in Japan in the early 1980s (RANSTT 1998). DOT
technology was first applied in a tunnel project in Hirosh-ima, Japan, in 1989 (Iida and Sumida 1992). Figure 1 illus-trates the schematic configuration of a typical DOT shield;which is composed of three bodies: (i) head, (ii) middle,and (iii) tail. The head body includes two cutters and twosoil chambers; the middle body includes two sets of cuttersupporters, two sets of cutter drivers, shield jacks, and twosets of screw conveyor supporters; and the tail body includestwo sets of lining assembling devices and two sets of tailgrout devices. As shown in Fig. 1, one DOT shield can con-struct two tunnels simultaneously. Figure 2 depicts thecross-sectional view of lining segments.
During shield tunnel construction, surface settlement is in-evitable due to ground loss (Peck 1969a). Peck (1969a) in-dicated that the shape of the surface settlement trough for asingle circular shield tunnel was symmetrically distributedon either side of the centerline of the tunnel. However, ifDOT tunneling was carried out, field-measured data showthat in most cases, the surface settlement trough may notfollow Peck’s pattern (Yonei 2000; Bai and Ding 2008).Figure 3 shows a recorded case of the asymmetrical surfacesettlement trough of a DOT constructed in Tokyo (Yonei2000). The asymmetrical distribution of the settlementtrough may be due to the operation of rolling correction dur-
Received 4 September 2008. Accepted 20 February 2010.Published on the NRC Research Press Web site at cgj.nrc.ca on28 September 2010.
S.-L. Shen1 and C.-Y. Luo. School of Naval Architecture,Ocean, and Civil Engineering, Shanghai Jiao Tong Universityand State Key Laboratory of Ocean Engineering, Shanghai200240, China.Y.-J. Du. Institute of Geotechnical Engineering, TransportationCollege, Southeast University, Nanjing, Jiangsu 210096, China.
1Corresponding author (e-mail: [email protected]).
1060
Can. Geotech. J. 47: 1060–1070 (2010) doi:10.1139/T10-013 Published by NRC Research Press

ing DOT tunneling (Iida and Sumida 1992; Yonei 2000; Ish-ihara et al. 2003; Shen et al. 2006, 2009).
During DOT tunneling, rolling will inevitably occur dueto nonuniformity of subsoils, machine manufacturing errors,and inappropriate operation. Rolling results in different ele-vations of the two tunnels, and affects the life span andquality of the DOT. Therefore, rolling correction is neces-sary and should be conducted during shield driving (Iidaand Sumida 1992; RANSTT 1998; Ishihara et al. 2003).However, rolling correction causes extra inner forces in thelining, disturbs surrounding soils, and induces additional sur-face settlement (Shen et al. 2009). In engineering practice,block loading on one side of the DOT shield is a cost-effectiveway to correct rolling (Ishihara et al. 2003). Generally, themagnitude of one-side loading is determined by the experi-ence of the engineers and (or) through observation of thereturned rolling angle. However, none of these methodscan predict the value of the load before it is applied.
The objectives of this paper are to (i) confirm the effec-tiveness of the one-side loading method used to correct roll-ing of a DOT shield and (ii) evaluate the effect of one-sideloading on rolling correction by finite element method(FEM) analysis.
Characteristics of DOT tunneling
Disadvantages of double-o-tunnels (DOTs)Compared with a single circle shield tunnel, DOTs have
the following characteristics:
(1) The ratio of lateral to vertical dimension for DOTs ismuch larger than the same ratio for circle shield tunnels,as shown in Figs. 1 and 2.
(2) DOTs have more types of segments and segment jointsthan circle shield tunnels. Segments in DOTs are labeledA1 to A8, B, C, and D as shown in Fig. 2.
(3) The dumbbell shape of DOTs leads to a much morecomplex and nonuniform distribution of internal stressin linings than that of circular shield tunnels, which con-sequently results in a potentially less stable lining anddifficulty in lining assembly (Shen et al. 2006, 2009).Even a small tunnel rolling angle will cause considerableredistribution of internal stresses in lining segments(Shen et al. 2009).
(4) The intersected concave area between the two tunnelsweakens the waterproof function during excavation (Ishi-hara et al. 2003; Shen et al. 2006).
(5) Subsoils can easily stick and pile up in the intersectedconcave area and will move together with the shield ma-chine, which is called the ‘‘back-soil’’ phenomenon. Thisundesirable phenomenon will cause the ground to swell.After the shield passes, a large amount of ground settle-ment occurs (RANSTT 1998).
(6) Due to the special configuration of the DOT shield, it isdifficult to control the centerline of the DOT during con-struction. In other words, it is difficult to control themoving trajectory of the DOT shield (Ishihara et al.2003; Shen et al. 2006).
Moving trajectory of DOT shieldFigure 4 schematically illustrates the moving trajectory of
a DOT shield during construction. The moving trajectory ofthe DOT shield includes rolling, yawing, and pitching. Roll-ing is the rotating movement of the two cross sections of theshield, yawing is the transversal right-to-left movement ofthe DOT shield, and pitching is the longitudinal up–downmovement of the DOT shield. All these movements willlead to deviation of the tunnel centerline from the intendedposition. Thus, the centerline direction is controlled by thesethree moving states of the DOT machine during construc-tion.
Causes of rollingRolling movement of a DOT shield during construction is
unavoidable because of (i) asymmetry of the cross section ofthe DOT shield machine caused by manufacturing error;(ii) the unbalanced weight of the DOT shield machine on ei-ther side; (iii) different traction forces between trolleys oneither side; (iv) different torques of the two cutters due todifferent soil properties and different pressures in the twosoil chambers; (v) different earth loads due to different top-ography, such as slant, on either side; (vi) loss of real-timegrouting at the tail; and (vii) the different supporting posi-tion of the belt conveyor for removing excavated soils. Dur-
Fig. 1. Schematic diagram of DOT shield: (a) cutter face and (b) longitudinal section. All dimensions in millimetres. 1, shield shell;2, cutter; 3 copy cutter; 4, observation hole; 5, manhole; 6, soil chamber; 7, screw conveyor; 8, jack; 9, segment assembling device.
Fig. 2. Cross-sectional view of DOT and layout of segments.
Shen et al. 1061
Published by NRC Research Press

ing DOT construction, rolling occurs due to one, or a com-bination of several, of the aforementioned reasons(RANSTT 1998; Yonei 2000; Ishihara et al. 2003; Shen etal. 2006).
Rolling correction operationRolling results in different elevations between the two
cross sections of the DOT and inclinations of segment D, asshown in Fig. 2. Thus, higher stress levels may occur inrolled DOT linings than those in the unrolled state (Shen etal. 2009). The analytical results presented by Shen et al.(2009) show that internal forces in the tunnel lining are al-tered significantly due to the rolling correction operationduring DOT construction. With the increase in the rollingcorrection angle, the magnitude of the internal forceschanged remarkably. The internal force increased at somenodes and decreased at other nodes, leading to the changein its sign. To control the rolling within 0.68 of the DOTshield, the following measures were adopted (Shen et al.2006; Bai and Tang 2007):
(1) Control of rolling correction jacks — This countermea-sure is conducted by using rolling correction jacks at thecircumference of the shield, to correct the rolling(RANSTT 1998; Ishihara et al. 2003).
(2) Control of the soil conveyor — Because the rotationspeed of screw conveyors on each side of the tunnel canbe controlled at different states, earth pressures acting onthe two cutters can be adjusted to different values.Therefore, the torques of the two cutters are different.As a result, rolling can be corrected by using cutters
with different torques (RANSTT 1998; Ishihara et al.2003).
(3) One-side loading — This is a simplest way to correctrolling. When the level of one side is higher than the le-vel of the other side, the weight of the elevated side isincreased via control of three different bodies of theDOT shield in the following three ways (see Fig. 1):(i) leave a larger amount of soil in the soil chamber andon the screw conveyor at the elevated side by slowingthe conveyor down; (ii) mount lead blocks in the middlebody at the clearance between jacks; (iii) suspend seg-ments in the tail body during shield jacking.
(4) Overexcavation by the copy cutter — To correct the roll-ing, some overexcavation can be carried out on the sideopposite the rolling direction. Generally, this measureshould be avoided because overexcavation will increasesettlement (RANSTT 1998).
(5) Real-time grouting — If overexcavation is conducted,the volume of grouting should be increased to compen-sate for the overexcavated soil. Grouting will result in arolling correction torque on the DOT shield.
(6) Secondary grouting — After the lining of the DOT is as-sembled, the rolled tunnel can also be corrected by useof secondary grouting in the opposite direction from therolling. This method will produce a torque opposite tothe rolling direction.
In addition, it is suggested that a highly precise apparatusmust be employed to measure the tunnel direction, whichcan detect rolling at its earliest stage so that it can be cor-rected as soon as possible (RANSTT 1998; Yonei 2000).
Analytical method for one-side loading
Subsoil conditionThe metro tunnel from Minsheng Road Station to North
Yangjing Station of Shanghai Metro Line 6 is located at thePudong New Development Area of Shanghai. It was con-structed using a DOT shield. This DOT is 395 m long andconsists of 329 segments, which are labeled consecutivelyfrom R1 to R329 (see Fig. 5). The tunnel was constructedin a very soft clay (MC) deposit at an elevation of approxi-mately –3 to –12 m.
The elevation of the ground surface at the constructionsite is 3–5 m above sea level. The soft deposit of Shanghaiis a multi-aquifer–aquitard system with a high groundwater
Fig. 3. Asymmetric ground surface settlement trough induced by DOT tunneling (data from Yonei 2000).
Fig. 4. Moving trajectory of DOT shield during jacking (modifiedafter RANSTT 1998).
1062 Can. Geotech. J. Vol. 47, 2010
Published by NRC Research Press

level (Xu et al. 2009). The groundwater level fluctuates be-tween 1 and 2 m below the ground surface. Three boreholeswere drilled to investigate the geological and geotechnicalcondition at the site (see Fig. 5). The first layer is loosebackfill with a depth of 1–4 m. Under the fill layer, a se-quence of layered soft soils with an overall thickness ofover 10 m is present, including a silty clay (SC), a soft siltyclay (MSC) with clayey silt lens, and MC. The soft soil is ina lightly overconsolidated state and is classified as clay (CL)based on the Unified Soil Classification System (ASTM2006) method. The soft soil is underlain by medium to stiffSC layers from a depth of 17 to 30 m.
Figure 6 presents the geotechnical profile and soil proper-ties of the subsoil at borehole BH-1. The grain-size distribu-tion test on soil samples from borehole BH-1 indicates thatthis MC consists of clay, silt, and sand with a distribution43%, 52.7%, and 4.3%, respectively. Water content is gener-ally close to its liquid limit and the plasticity index of thisMC is about 20%. The initial void ratio, e, was determinedbased on soil physical properties from laboratory tests. Thecompression index, Cc, was obtained from laboratory oed-ometer tests. Figure 7 shows the typical e–logPc curves foreach layer obtained from oedometer tests, where Pc is theconsolidation pressure. The Cc value is about 0.15 for stiffclay. For MC, Cc varies from 0.4 to 0.75. From Fig. 7, itcan be seen that the yield stress, Py, varies from 80 to450 kPa. The profile of the tip resistance from a cone pene-tration test and the sensitivity are also presented in Fig. 6.These results indicate that weak, compressible, and sensitivesoils exist below an elevation of 13.2 m. The sensitivity ofthese soft clays ranges from 4.0 to 5.0.
Modeling methodology for one-side loading
Range of calculationTo evaluate the effectiveness of the rolling correction
with one-side loading, FEM analysis under a two-dimen-sional (2D) condition was conducted. The reason for choos-ing the 2D condition is discussed in a later section. Themodeled range is a 25 m depth from the ground surface anda 40 m horizontal distance from the DOT shield centerline.The diameter of the DOT shield is set as 6.2 m and the dis-
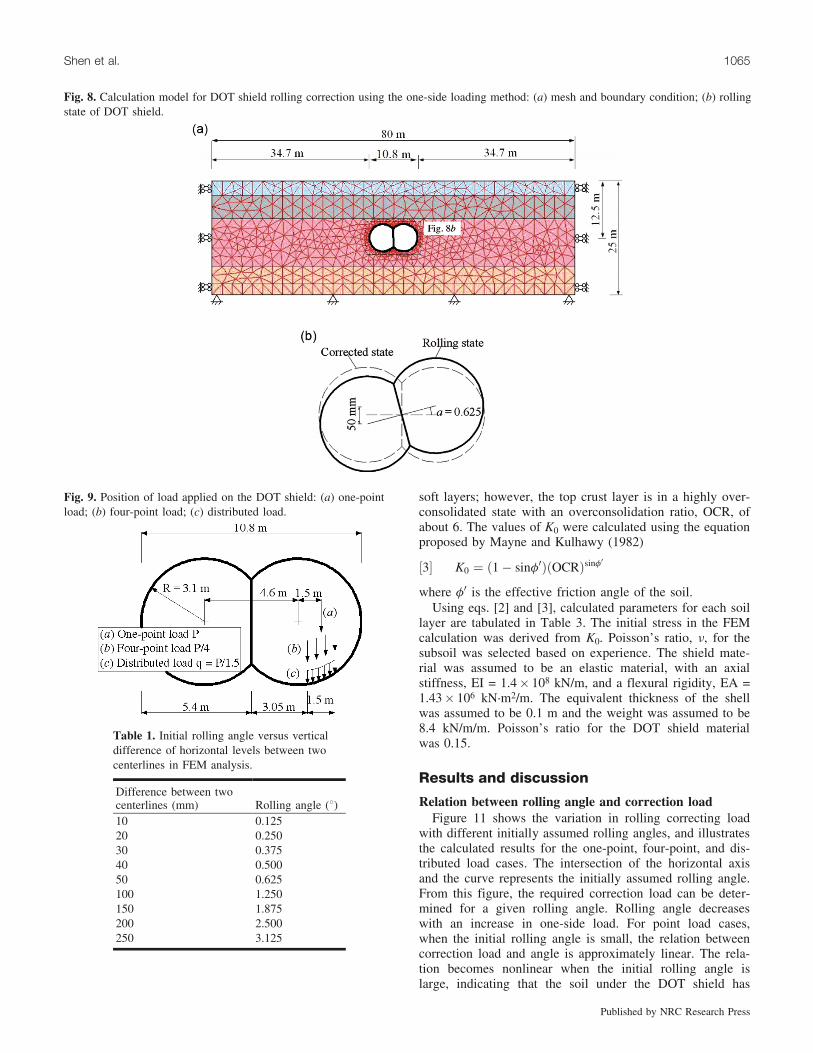
tance between the two centers is 4.6 m in the numericalanalysis. The buried depth of the centerline of the shield is12.5 m. Figure 8 shows the FEM model and calculationmesh for a DOT shield with a rolling angle, a, of 0.6258.
Loading approachesAs shown in Fig. 1, the width of the soil chamber is
0.915 m. In the head body, the maximum unbalanced one-side load is *450 kN. In the tail body, one or two segmentscan be hung up by the segment assembling device, and theload is *32–60 kN/m, distributed within the longitudinalloading length of 3.11 m. In the middle body, lead blocksare allocated as required within the available longitudinallength of 3.17 m. Therefore, the load along the longitudinaldirection of the DOT shield is nonuniformly distributed, andthe actual movement and loading condition of the DOTshield during construction is three-dimensional. In thisstudy, a 2D plain strain condition is adopted to simulate themiddle body of the shield under lead block loading. The rea-son for choosing 2D analysis is to simplify the problem,which is useful to illustrate the concept of one-side loading.Moreover, it is difficult to estimate soil weights in the DOTshield accurately, which may result in inaccuracy for three-dimensional modeling.
In construction, there are different load types, i.e.; distrib-uted load, such as remaining soil; point load, such as sus-pended segments; or separately distributed lead blocks.Therefore, three types of load (i.e., one-point, four-point,and distributed) were adopted to simulate one-side loading.For a one-point load condition, a load was applied on theshell of the shield element at the node 1.5 m away from theshield center (see Fig. 9a). For the four-point load condition,loads were applied on the shield element with an even spac-ing of 0.5 m, and the first point was 0.75 m from the shieldcenter (see Fig. 9b). For the distributed load condition, loadswere uniformly applied on the shield element within thetransverse length of 1.5 m, and the left edge was 0.75 mfrom the shield center (see Fig. 9c). The magnitude of theone-point load was from 0 to 380 kN/m. The resulting mag-nitude and position for the case of the four-point load andthe case of the distributed load were the same as those forthe case of the one-point load. Therefore, the magnitude for
Fig. 5. Longitudinal section of DOT in Shanghai Metro Line 6. BF, backfill; MC, very soft clay; MSC, soft silty clay; SC, silty clay.
Shen et al. 1063
Published by NRC Research Press

each point of the four-point load condition was calculated tobe 0–95 kN/m. The calculated resultant and the intensity ofthe distributed load are from 0 to 380 kN/m and 0 to253.3 kN/m/m, respectively. Moreover, the mesh around theDOT shield was refined in FEM analysis. For the one-pointload condition, as it may have resulted in a loading concen-tration phenomenon, an artificial densification for the shellelement and node on which loading was applied was con-ducted in the numerical analysis.
Initial and boundary conditionsIn the model, the DOT shield was initially assumed to be
in a rolling state with several selected rolling angles andvertical differences of horizontal levels between the twocenterlines, as shown in Table 1. Groundwater was set at1.5 m below the ground surface. Displacement boundaryconditions were set as follows: inside the lining, there wasa free boundary; at the bottom, both vertical and horizontaldisplacements were constrained; for the left and right verti-
cal boundaries, the horizontal displacement was constrained.Each boundary was modeled under drained conditions.
Materials and parametersAs shown in Fig. 6, physical and mechanical properties of
the three layers (MSC, clayey silt, and MSC) under the topcrust are similar. In an FEM calculation, the soft subsoil wasdivided into five layers, i.e., backfill, MSC, MC, stiff clay,and SC. Parameters of these soft soils are tabulated in Ta-bles 2 and 3. The mechanical behavior of subsoils was rep-resented by the soft soil model as shown in the Plaxispackage (Brinkgreve 2004). Model parameters for each layerare listed in Table 2. The modified compression index, l*,and the modified swelling index, k*, were derived from Ccand the swelling index, Cr, as shown in the following equa-tions (Brinkgreve 2004):
½1� l� ¼ Cc
2:3ð1þ eÞ ; k� ¼ 2
2:3
Cr
1þ e
Values of Cc and Cr were determined from oedometertests, as shown in Figs. 6 and 7. However, as shown inFig. 6, Cc is very scattered for each layer, which is mainlydue to the effect of sampling disturbance (Hong and Han2007). Laboratory tests show that the average value of Ccfor remolded samples of the MC layer in Shanghai is about0.3 (Zhou and Sun 2009). It is thought that Cc for the in situMC must be higher than 0.3. Therefore, the highest value ofCc for each layer was adopted in the FEM analysis, shownas the selected vertical lines in Fig. 6.
The critical state ratio, M, was derived from triaxialcompression tests (Su 1979; Huang and Gao 2005), asshown in Fig. 10. In the Plaxis package, the critical stateratio, M, is determined approximately from the followingequation (Brinkgreve 1994):
½2� M ¼ 3:0� 2:8K0
where K0 is the lateral earth pressure coefficient at rest.The subsoil is in a lightly overconsolidated state for the
Fig. 6. Soil profile and properties at the construction site. qs, cone tip resistance; St, sensitivity; wL, liquid limit; wn, natural water content,wp, plastic limit; gt, unit weight.
Fig. 7. Typical e–logPc curves for each layer from oedometer tests.
1064 Can. Geotech. J. Vol. 47, 2010
Published by NRC Research Press
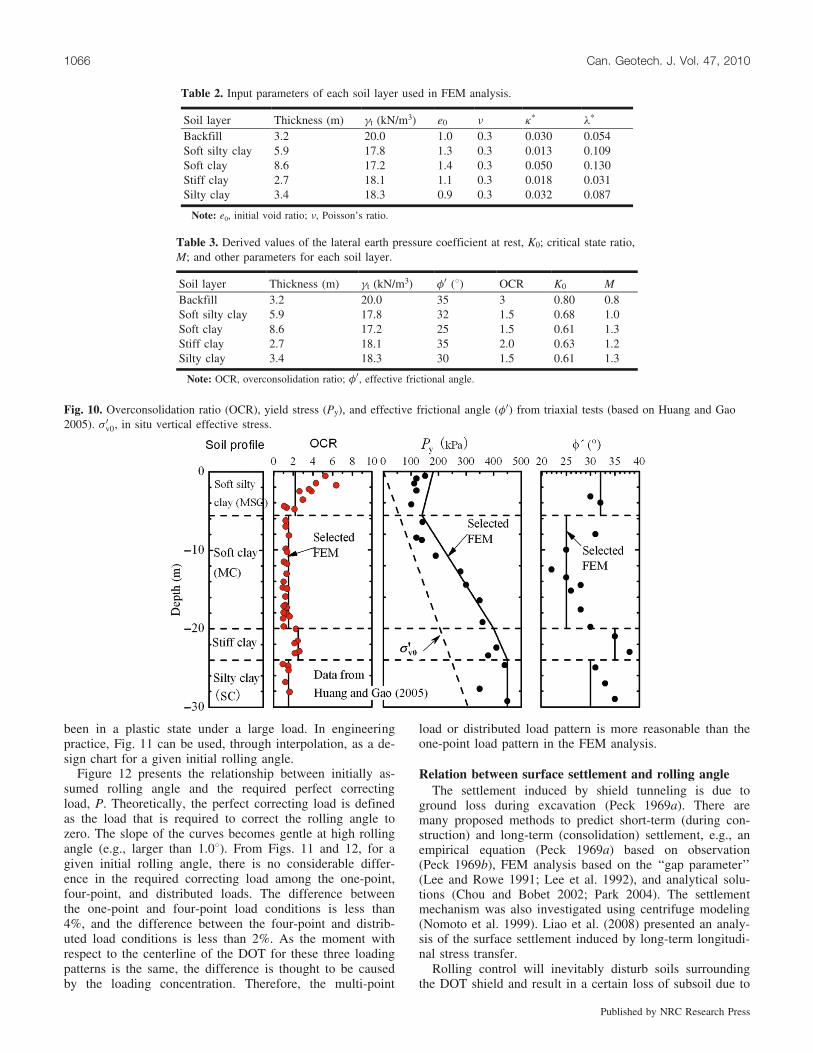
soft layers; however, the top crust layer is in a highly over-consolidated state with an overconsolidation ratio, OCR, ofabout 6. The values of K0 were calculated using the equationproposed by Mayne and Kulhawy (1982)
½3� K0 ¼ ð1� sinf0ÞðOCRÞsinf0
where f0 is the effective friction angle of the soil.Using eqs. [2] and [3], calculated parameters for each soil
layer are tabulated in Table 3. The initial stress in the FEMcalculation was derived from K0. Poisson’s ratio, n, for thesubsoil was selected based on experience. The shield mate-rial was assumed to be an elastic material, with an axialstiffness, EI = 1.4� 108 kN/m, and a flexural rigidity, EA =1.43� 106 kN�m2/m. The equivalent thickness of the shellwas assumed to be 0.1 m and the weight was assumed to be8.4 kN/m/m. Poisson’s ratio for the DOT shield materialwas 0.15.
Results and discussion
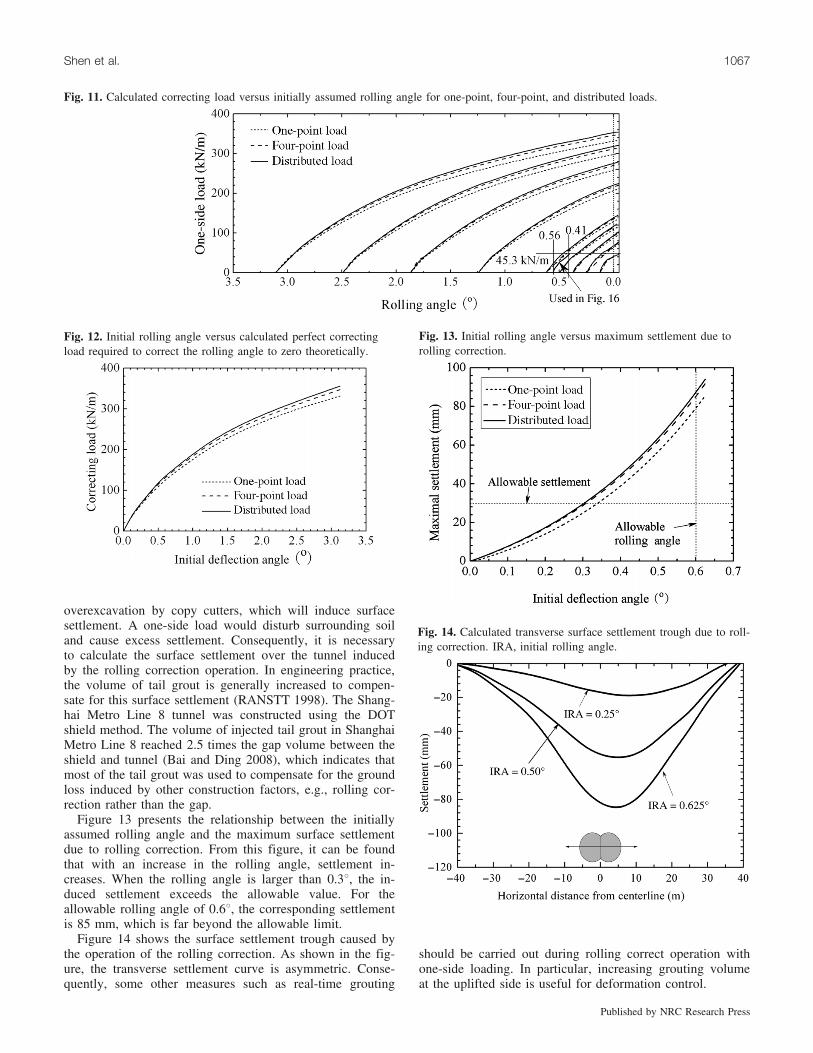
Relation between rolling angle and correction loadFigure 11 shows the variation in rolling correcting load
with different initially assumed rolling angles, and illustratesthe calculated results for the one-point, four-point, and dis-tributed load cases. The intersection of the horizontal axisand the curve represents the initially assumed rolling angle.From this figure, the required correction load can be deter-mined for a given rolling angle. Rolling angle decreaseswith an increase in one-side load. For point load cases,when the initial rolling angle is small, the relation betweencorrection load and angle is approximately linear. The rela-tion becomes nonlinear when the initial rolling angle islarge, indicating that the soil under the DOT shield has
Fig. 8. Calculation model for DOT shield rolling correction using the one-side loading method: (a) mesh and boundary condition; (b) rollingstate of DOT shield.
Fig. 9. Position of load applied on the DOT shield: (a) one-pointload; (b) four-point load; (c) distributed load.
Table 1. Initial rolling angle versus verticaldifference of horizontal levels between twocenterlines in FEM analysis.
Difference between twocenterlines (mm) Rolling angle (8)10 0.12520 0.25030 0.37540 0.50050 0.625100 1.250150 1.875200 2.500250 3.125
Shen et al. 1065
Published by NRC Research Press
been in a plastic state under a large load. In engineeringpractice, Fig. 11 can be used, through interpolation, as a de-sign chart for a given initial rolling angle.
Figure 12 presents the relationship between initially as-sumed rolling angle and the required perfect correctingload, P. Theoretically, the perfect correcting load is definedas the load that is required to correct the rolling angle tozero. The slope of the curves becomes gentle at high rollingangle (e.g., larger than 1.08). From Figs. 11 and 12, for agiven initial rolling angle, there is no considerable differ-ence in the required correcting load among the one-point,four-point, and distributed loads. The difference betweenthe one-point and four-point load conditions is less than4%, and the difference between the four-point and distrib-uted load conditions is less than 2%. As the moment withrespect to the centerline of the DOT for these three loadingpatterns is the same, the difference is thought to be causedby the loading concentration. Therefore, the multi-point
load or distributed load pattern is more reasonable than theone-point load pattern in the FEM analysis.
Relation between surface settlement and rolling angleThe settlement induced by shield tunneling is due to
ground loss during excavation (Peck 1969a). There aremany proposed methods to predict short-term (during con-struction) and long-term (consolidation) settlement, e.g., anempirical equation (Peck 1969a) based on observation(Peck 1969b), FEM analysis based on the ‘‘gap parameter’’(Lee and Rowe 1991; Lee et al. 1992), and analytical solu-tions (Chou and Bobet 2002; Park 2004). The settlementmechanism was also investigated using centrifuge modeling(Nomoto et al. 1999). Liao et al. (2008) presented an analy-sis of the surface settlement induced by long-term longitudi-nal stress transfer.
Rolling control will inevitably disturb soils surroundingthe DOT shield and result in a certain loss of subsoil due to
Table 2. Input parameters of each soil layer used in FEM analysis.
Soil layer Thickness (m) gt (kN/m3) e0 n k* l*
Backfill 3.2 20.0 1.0 0.3 0.030 0.054Soft silty clay 5.9 17.8 1.3 0.3 0.013 0.109Soft clay 8.6 17.2 1.4 0.3 0.050 0.130Stiff clay 2.7 18.1 1.1 0.3 0.018 0.031Silty clay 3.4 18.3 0.9 0.3 0.032 0.087
Note: e0, initial void ratio; n, Poisson’s ratio.
Table 3. Derived values of the lateral earth pressure coefficient at rest, K0; critical state ratio,M; and other parameters for each soil layer.
Soil layer Thickness (m) gt (kN/m3) f0 (8) OCR K0 MBackfill 3.2 20.0 35 3 0.80 0.8Soft silty clay 5.9 17.8 32 1.5 0.68 1.0Soft clay 8.6 17.2 25 1.5 0.61 1.3Stiff clay 2.7 18.1 35 2.0 0.63 1.2Silty clay 3.4 18.3 30 1.5 0.61 1.3
Note: OCR, overconsolidation ratio; f0, effective frictional angle.
Fig. 10. Overconsolidation ratio (OCR), yield stress (Py), and effective frictional angle (f0) from triaxial tests (based on Huang and Gao2005). s 0v0, in situ vertical effective stress.
1066 Can. Geotech. J. Vol. 47, 2010
Published by NRC Research Press
overexcavation by copy cutters, which will induce surfacesettlement. A one-side load would disturb surrounding soiland cause excess settlement. Consequently, it is necessaryto calculate the surface settlement over the tunnel inducedby the rolling correction operation. In engineering practice,the volume of tail grout is generally increased to compen-sate for this surface settlement (RANSTT 1998). The Shang-hai Metro Line 8 tunnel was constructed using the DOTshield method. The volume of injected tail grout in ShanghaiMetro Line 8 reached 2.5 times the gap volume between theshield and tunnel (Bai and Ding 2008), which indicates thatmost of the tail grout was used to compensate for the groundloss induced by other construction factors, e.g., rolling cor-rection rather than the gap.
Figure 13 presents the relationship between the initiallyassumed rolling angle and the maximum surface settlementdue to rolling correction. From this figure, it can be foundthat with an increase in the rolling angle, settlement in-creases. When the rolling angle is larger than 0.38, the in-duced settlement exceeds the allowable value. For theallowable rolling angle of 0.68, the corresponding settlementis 85 mm, which is far beyond the allowable limit.
Figure 14 shows the surface settlement trough caused bythe operation of the rolling correction. As shown in the fig-ure, the transverse settlement curve is asymmetric. Conse-quently, some other measures such as real-time grouting
should be carried out during rolling correct operation withone-side loading. In particular, increasing grouting volumeat the uplifted side is useful for deformation control.
Fig. 11. Calculated correcting load versus initially assumed rolling angle for one-point, four-point, and distributed loads.
Fig. 12. Initial rolling angle versus calculated perfect correctingload required to correct the rolling angle to zero theoretically.
Fig. 13. Initial rolling angle versus maximum settlement due torolling correction.
Fig. 14. Calculated transverse surface settlement trough due to roll-ing correction. IRA, initial rolling angle.
Shen et al. 1067
Published by NRC Research Press

Verification based on field observationField experience (Shen et al. 2006) showed that to restrict
the rolling angle to the range of allowable values, when therolling angle reaches some selected value, i.e., 0.28, the roll-ing correction operation is generally conducted in the fol-lowing sequence: start rolling correction jacks, adjust theexcavated soil volume with the screw conveyor, apply blockloading at one side, and increase grouting volume. If thesemeasures are not effective, overexcavation using a copy cut-ter can be subsequently conducted.
In Shanghai Metro Line 6, there was an upward slope lo-cated in the MC layer (see Fig. 5), where rolling occurseasily. Figure 15 presents the field-observed rolling curveduring rolling correcting operations. The negative rolling an-gle presented in Fig. 15 represents the clockwise direction.Recording of the rolling angle was started when the DOTshield was launched. When the rolling angle reached 0.188(235 m from launching shaft), the rolling correction opera-tion was started with jacks at first. However, rollingdevel-oped continuously until 0.308 (250 m). For this reason, thespeed of the screw conveyor at the elevated side was re-duced to maintain more excavated soils at this side, whichwas about 149 kN heavier than at the depressed side. Therolling angle was set to 0.308 within eight rings (250–260 m). Once the jacked distance reached *260 m fromthe launching shaft, the rolling angle increased again. Thisphenomenon indicates that the adjustment of the soil con-veyor speed had begun to lose its effectiveness. The rollingangle continued to increase until it reached a temporarystate, i.e., 0.418 within 10 rings (from 265 to 277 m). How-ever, after 277 m, rolling developed again. This observationshows that all of the aforementioned rolling correctingmeasures were not sufficient. Therefore, one-side loadingwith lead blocks was adopted when the rolling angle reached0.568 (292 m). The lead block was gradually added from 0to 150 kN within 17 m (292 to 309 m). At the same time, asegment with a 32 kN weight was attached with the hook ofthe assembling device. It was found that with these twomeasures, the rolling angle decreased considerably(Fig. 15). The recorded rolled angle decreased to 0.418
(309 m). Compared with the recorded maximum rolling an-gle (0.568), the corrected rolling angle reached 0.148 withinthe distance of 309 m. In other words, 25% of the maximumrolling angle had been corrected using the one-side loadmethod, indicating that one-side loading is very effective incontrolling rolling.
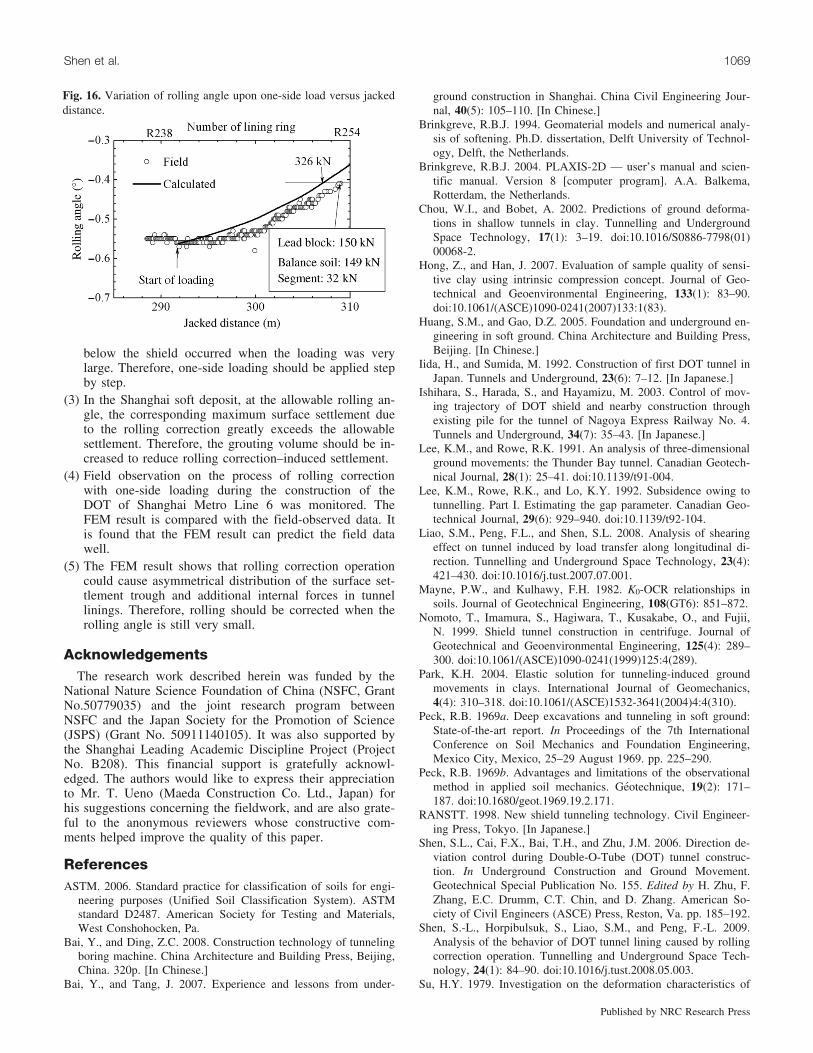
Figure 16 illustrates a comparison between the observedand calculated rolling angles during correction operation viaone-side loading. Here, it must be mentioned that the calcu-lated value was not calculated directly from FEM; it wasdone through the following procedure. Figure 11 was em-ployed to derive the one-side load value of 45.3 kN/m byinterpolation, indicating that the rolling angle was correctedfrom 0.568 initially to 0.418 (0.148 change). This load wasgradually applied during the construction of 14 lining rings,and for each ring the average corrected rolling angle wascalculated as 0.018. Therefore, the correcting load was*3.24 kN/m per ring, and a one-side load of about 326 kNwas required along the longitudinal shield length(*7.195 m). As the balance soil in the soil chamber was149 kN and the suspended segment was 32 kN, the requiredlead block weight was then theoretically calculated as about141 kN based on force equilibrium. This value is slightlysmaller than the field value, 150 kN, as illustrated inFig. 16. The calculated rolling angle changed from 0.568 to0.418 within 17 m, which is easily consistent with the field-observed value. It is therefore concluded that the calculatedresult is applicable in engineering practice.
ConclusionsOne-side loading is one of the countermeasures used to
correct the rolling of DOT shields during construction. Thispaper presents an FEM simulation of the one-side loadingprocedure in rolling correction of DOT shields. The follow-ing conclusions can be drawn:
(1) With an increase in one-side loading, the rolled anglecan be reduced indicating that one-side loading is acost-effective rolling correction method.
(2) Under one-side loading, plastic deformation of the soil
Fig. 15. Field-observed rolling curve during rolling correcting operations.
1068 Can. Geotech. J. Vol. 47, 2010
Published by NRC Research Press
below the shield occurred when the loading was verylarge. Therefore, one-side loading should be applied stepby step.
(3) In the Shanghai soft deposit, at the allowable rolling an-gle, the corresponding maximum surface settlement dueto the rolling correction greatly exceeds the allowablesettlement. Therefore, the grouting volume should be in-creased to reduce rolling correction–induced settlement.
(4) Field observation on the process of rolling correctionwith one-side loading during the construction of theDOT of Shanghai Metro Line 6 was monitored. TheFEM result is compared with the field-observed data. Itis found that the FEM result can predict the field datawell.
(5) The FEM result shows that rolling correction operationcould cause asymmetrical distribution of the surface set-tlement trough and additional internal forces in tunnellinings. Therefore, rolling should be corrected when therolling angle is still very small.
AcknowledgementsThe research work described herein was funded by the
National Nature Science Foundation of China (NSFC, GrantNo.50779035) and the joint research program betweenNSFC and the Japan Society for the Promotion of Science(JSPS) (Grant No. 50911140105). It was also supported bythe Shanghai Leading Academic Discipline Project (ProjectNo. B208). This financial support is gratefully acknowl-edged. The authors would like to express their appreciationto Mr. T. Ueno (Maeda Construction Co. Ltd., Japan) forhis suggestions concerning the fieldwork, and are also grate-ful to the anonymous reviewers whose constructive com-ments helped improve the quality of this paper.
ReferencesASTM. 2006. Standard practice for classification of soils for engi-
neering purposes (Unified Soil Classification System). ASTMstandard D2487. American Society for Testing and Materials,West Conshohocken, Pa.
Bai, Y., and Ding, Z.C. 2008. Construction technology of tunnelingboring machine. China Architecture and Building Press, Beijing,China. 320p. [In Chinese.]
Bai, Y., and Tang, J. 2007. Experience and lessons from under-
ground construction in Shanghai. China Civil Engineering Jour-nal, 40(5): 105–110. [In Chinese.]
Brinkgreve, R.B.J. 1994. Geomaterial models and numerical analy-sis of softening. Ph.D. dissertation, Delft University of Technol-ogy, Delft, the Netherlands.
Brinkgreve, R.B.J. 2004. PLAXIS-2D — user’s manual and scien-tific manual. Version 8 [computer program]. A.A. Balkema,Rotterdam, the Netherlands.
Chou, W.I., and Bobet, A. 2002. Predictions of ground deforma-tions in shallow tunnels in clay. Tunnelling and UndergroundSpace Technology, 17(1): 3–19. doi:10.1016/S0886-7798(01)00068-2.
Hong, Z., and Han, J. 2007. Evaluation of sample quality of sensi-tive clay using intrinsic compression concept. Journal of Geo-technical and Geoenvironmental Engineering, 133(1): 83–90.doi:10.1061/(ASCE)1090-0241(2007)133:1(83).
Huang, S.M., and Gao, D.Z. 2005. Foundation and underground en-gineering in soft ground. China Architecture and Building Press,Beijing. [In Chinese.]
Iida, H., and Sumida, M. 1992. Construction of first DOT tunnel inJapan. Tunnels and Underground, 23(6): 7–12. [In Japanese.]
Ishihara, S., Harada, S., and Hayamizu, M. 2003. Control of mov-ing trajectory of DOT shield and nearby construction throughexisting pile for the tunnel of Nagoya Express Railway No. 4.Tunnels and Underground, 34(7): 35–43. [In Japanese.]
Lee, K.M., and Rowe, R.K. 1991. An analysis of three-dimensionalground movements: the Thunder Bay tunnel. Canadian Geotech-nical Journal, 28(1): 25–41. doi:10.1139/t91-004.
Lee, K.M., Rowe, R.K., and Lo, K.Y. 1992. Subsidence owing totunnelling. Part I. Estimating the gap parameter. Canadian Geo-technical Journal, 29(6): 929–940. doi:10.1139/t92-104.
Liao, S.M., Peng, F.L., and Shen, S.L. 2008. Analysis of shearingeffect on tunnel induced by load transfer along longitudinal di-rection. Tunnelling and Underground Space Technology, 23(4):421–430. doi:10.1016/j.tust.2007.07.001.
Mayne, P.W., and Kulhawy, F.H. 1982. K0-OCR relationships insoils. Journal of Geotechnical Engineering, 108(GT6): 851–872.
Nomoto, T., Imamura, S., Hagiwara, T., Kusakabe, O., and Fujii,N. 1999. Shield tunnel construction in centrifuge. Journal ofGeotechnical and Geoenvironmental Engineering, 125(4): 289–300. doi:10.1061/(ASCE)1090-0241(1999)125:4(289).
Park, K.H. 2004. Elastic solution for tunneling-induced groundmovements in clays. International Journal of Geomechanics,4(4): 310–318. doi:10.1061/(ASCE)1532-3641(2004)4:4(310).
Peck, R.B. 1969a. Deep excavations and tunneling in soft ground:State-of-the-art report. In Proceedings of the 7th InternationalConference on Soil Mechanics and Foundation Engineering,Mexico City, Mexico, 25–29 August 1969. pp. 225–290.
Peck, R.B. 1969b. Advantages and limitations of the observationalmethod in applied soil mechanics. Geotechnique, 19(2): 171–187. doi:10.1680/geot.1969.19.2.171.
RANSTT. 1998. New shield tunneling technology. Civil Engineer-ing Press, Tokyo. [In Japanese.]
Shen, S.L., Cai, F.X., Bai, T.H., and Zhu, J.M. 2006. Direction de-viation control during Double-O-Tube (DOT) tunnel construc-tion. In Underground Construction and Ground Movement.Geotechnical Special Publication No. 155. Edited by H. Zhu, F.Zhang, E.C. Drumm, C.T. Chin, and D. Zhang. American So-ciety of Civil Engineers (ASCE) Press, Reston, Va. pp. 185–192.
Shen, S.-L., Horpibulsuk, S., Liao, S.M., and Peng, F.-L. 2009.Analysis of the behavior of DOT tunnel lining caused by rollingcorrection operation. Tunnelling and Underground Space Tech-nology, 24(1): 84–90. doi:10.1016/j.tust.2008.05.003.
Su, H.Y. 1979. Investigation on the deformation characteristics of
Fig. 16. Variation of rolling angle upon one-side load versus jackeddistance.
Shen et al. 1069
Published by NRC Research Press

soft deposit in Shanghai under pumping and recharge. ChineseJournal of Geotechnical Engineering, 1(1): 24–35. [In Chinese.]
Xu, Y.-S., Shen, S.-L., and Du, Y.-J. 2009. Geological and hydro-geological environment in Shanghai with geohazards to con-struction and maintenance of infrastructures. EngineeringGeology, 109(3–4): 241–254. doi:10.1016/j.enggeo.2009.08.009.
Yonei, Y. 2000. Construction of common underground municipal
facility using large diameter DOT shield. In Construction Tech-nology Shield Tunnel. Edited by A. Koyama, K. Ohishi, and T.Noguchi. Civil Engineering Press, Tokyo. pp. 190–197. [In Ja-panese.]
Zhou, K., and Sun, D.A. 2009. Experiments on compression char-acteristics of remoulded soft clay in Shanghai. Journal of Shang-hai University (Natural Science Edition), 15(1): 99–104.
1070 Can. Geotech. J. Vol. 47, 2010
Published by NRC Research Press
Copyright © 2022 FDOKUMEN