Dietary Intake and other Factors in the Etiology of Malnutrition
J A C C : C A R D I O V A S C U L A R I M A G I N G V O L . 4 , N O . 2 , 2 0 1 1
© 2 0 1 1 B Y T H E A M E R I C A N C O L L E G E O F C A R D I O L O G Y F O U N D A T I O N I S S N 1 9 3 6 - 8 7 8 X / $ 3 6 . 0 0
P U B L I S H E D B Y E L S E V I E R I N C . D O I : 1 0 . 1 0 1 6 / j . j c m g . 2 0 1 0 . 1 1 . 0 1 5
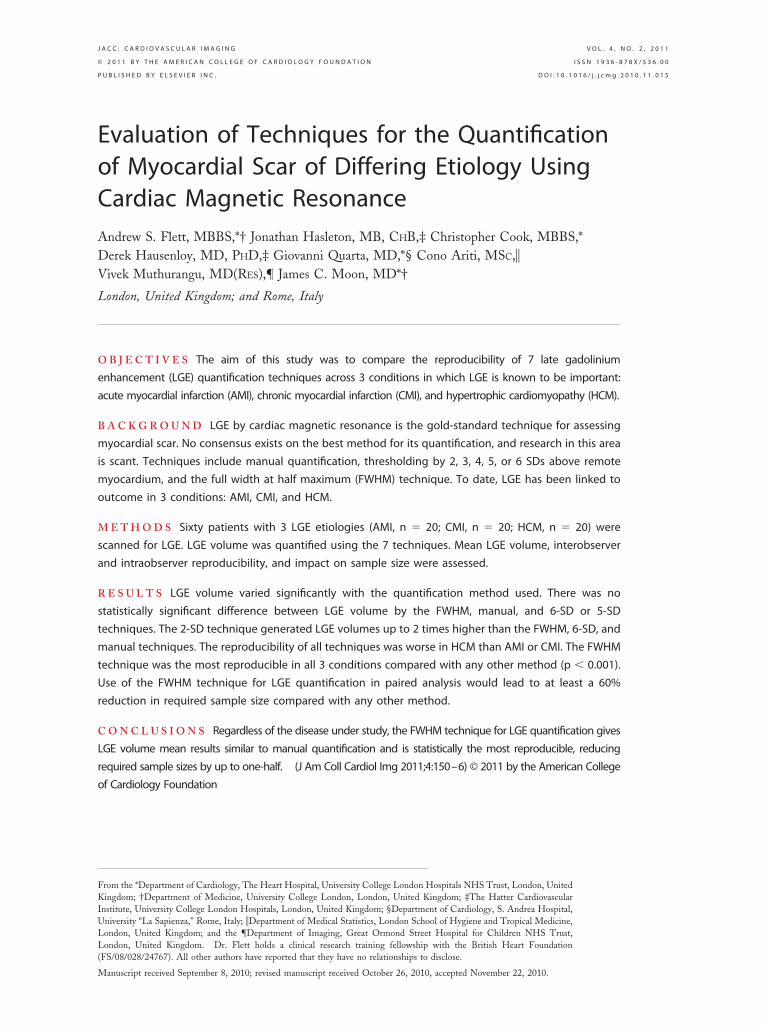
Evaluation of Techniques for the Quantificationof Myocardial Scar of Differing Etiology UsingCardiac Magnetic ResonanceAndrew S. Flett, MBBS,*† Jonathan Hasleton, MB, CHB,‡ Christopher Cook, MBBS,*Derek Hausenloy, MD, PHD,‡ Giovanni Quarta, MD,*§ Cono Ariti, MSC,�Vivek Muthurangu, MD(RES),¶ James C. Moon, MD*†
London, United Kingdom; and Rome, Italy
O B J E C T I V E S The aim of this study was to compare the reproducibility of 7 late gadolinium
enhancement (LGE) quantification techniques across 3 conditions in which LGE is known to be important:
acute myocardial infarction (AMI), chronic myocardial infarction (CMI), and hypertrophic cardiomyopathy (HCM).
B A C K G R O U N D LGE by cardiac magnetic resonance is the gold-standard technique for assessing
myocardial scar. No consensus exists on the best method for its quantification, and research in this area
is scant. Techniques include manual quantification, thresholding by 2, 3, 4, 5, or 6 SDs above remote
myocardium, and the full width at half maximum (FWHM) technique. To date, LGE has been linked to
outcome in 3 conditions: AMI, CMI, and HCM.
M E T H O D S Sixty patients with 3 LGE etiologies (AMI, n � 20; CMI, n � 20; HCM, n � 20) were
scanned for LGE. LGE volume was quantified using the 7 techniques. Mean LGE volume, interobserver
and intraobserver reproducibility, and impact on sample size were assessed.
R E S U L T S LGE volume varied significantly with the quantification method used. There was no
statistically significant difference between LGE volume by the FWHM, manual, and 6-SD or 5-SD
techniques. The 2-SD technique generated LGE volumes up to 2 times higher than the FWHM, 6-SD, and
manual techniques. The reproducibility of all techniques was worse in HCM than AMI or CMI. The FWHM
technique was the most reproducible in all 3 conditions compared with any other method (p � 0.001).
Use of the FWHM technique for LGE quantification in paired analysis would lead to at least a 60%
reduction in required sample size compared with any other method.
C O N C L U S I O N S Regardless of the disease under study, the FWHM technique for LGE quantification gives
LGE volume mean results similar to manual quantification and is statistically the most reproducible, reducing
required sample sizes by up to one-half. (J Am Coll Cardiol Img 2011;4:150–6) © 2011 by the American College
of Cardiology Foundation
From the *Department of Cardiology, The Heart Hospital, University College London Hospitals NHS Trust, London, UnitedKingdom; †Department of Medicine, University College London, London, United Kingdom; ‡The Hatter CardiovascularInstitute, University College London Hospitals, London, United Kingdom; §Department of Cardiology, S. Andrea Hospital,University “La Sapienza,” Rome, Italy; �Department of Medical Statistics, London School of Hygiene and Tropical Medicine,London, United Kingdom; and the ¶Department of Imaging, Great Ormond Street Hospital for Children NHS Trust,London, United Kingdom. Dr. Flett holds a clinical research training fellowship with the British Heart Foundation(FS/08/028/24767). All other authors have reported that they have no relationships to disclose.
Manuscript received September 8, 2010; revised manuscript received October 26, 2010, accepted November 22, 2010.
S
tuMF(abpqt2twsTn region of interest
J A C C : C A R D I O V A S C U L A R I M A G I N G , V O L . 4 , N O . 2 , 2 0 1 1
F E B R U A R Y 2 0 1 1 : 1 5 0 – 6
Flett et al.
LGE Quantification Techniques
151
car as a result of acute myocardial infarction(AMI) and chronic myocardial infarction(CMI) has important prognostic implica-tions (1–4). There is growing evidence sug-
gesting that cardiac magnetic resonance (CMR)using the late gadolinium enhancement (LGE)technique can be considered the gold-standardmodality for its assessment (5–8). LGE can alsodetect scar in cardiomyopathy (9 –13) and in
See page 157
inflammatory (14,15) and infiltrative (16) condi-tions, and there is a growing prognostic evidencebase (17). However, the optimal method for quan-tifying LGE remains unclear. All techniques rely onthe fact that the LGE technique makes scar appearbright and as such can be defined as a signalintensity above normal myocardium, with 2 SDsbeing advocated by official guidelines (18). Howeverother techniques are also used: 3, 4, 5, or 6 SDs;manual quantification (drawing regions of interest[ROIs] around scar); and the full width at halfmaximum (FWHM) technique, which uses half themaximal signal within the scar as the threshold.Each method results in different mean LGE vol-umes, confounding comparison of individual valueswith prognostic outcome papers. Moreover, in theresearch setting, where scar is used as a surrogateend point, the reproducibility of its quantification isa key determinant of sample size.
Our aim was to compare the 7 quantificationtechniques across the spectrum of disease inwhich LGE has been linked to outcome: AMI,CMI, and hypertrophic cardiomyopathy (HCM),assessing the LGE volumes obtained, the repro-ducibility of each method, and any associatedeffects on future study design. We hypothesizedthat the techniques would yield significantly dif-ferent LGE volumes, that LGE quantificationwould vary with LGE etiology, and that the 7techniques would have statistically different re-producibility.
M E T H O D S
All research was carried out at University CollegeLondon Hospital NHS Trust between October2008 and December 2009. An ethics committeeof the U.K. National Research Ethics Serviceapproved generic analysis of anonymized clinicalscans. The 7 techniques (thresholding at 2, 3, 4,
5, and 6 SDs from remote myocardium; FWHM;and manual quantification) were compared in aretrospective manner in 60 consecutive patientsreferred for CMR with the confirmed clinicaldiagnosis of HCM (from a tertiary referral car-diomyopathy clinic, n � 20), AMI (n � 20), andCMI (n � 20) who had manifest LGE. Myocar-dial infarction was defined by clinical presenta-tion compatible with an ST-segment elevationmyocardial infarction, angiographic confirmationof coronary artery disease in the appropriateterritory, and an elevated troponin level. In AMI,CMR was performed within 1 week, and in CMI,the scan was performed no less than 3 monthsfrom the AMI. No other inclusion or exclusioncriteria were used. Mean LGE volume and in-traobserver and interobserver variability were as-sessed, and implications for sample size calcula-tions derived.CMR protocol. Standard CMR examina-ions were performed in all patients (18)sing a 1.5-T scanner (Avanto; Siemensedical Imaging, Erlangen, Germany).
or LGE imaging, 0.1 mmol/kg DotaremGuerbet, S.A., Villepinte, France) wasdministrated intravenously and standardreath-hold inversion recovery imagingerformed (spoiled gradient-echo se-uence, slice thickness 8 mm, repetitionime 9.8 ms, echo time 4.6 ms, flip angle1°, 21 lines per segment, spatial resolu-ion 1.4 � 2.8 � 8 mm with phase swapshen appropriate, typical breath-hold 12
econds). Inversion times are reported inable 1 and were adjusted to optimallyull normal myocardium.
Image analysis. Signal-to-noise ratio andcontrast-to-noise ratio are reported as assessmentsof image quality (8). Signal-to-noise ratio wascalculated as mean signal intensity of enhancedarea/SD of noise. Contrast-to-noise ratio was cal-culated as (mean signal intensity of enhanced area� mean signal intensity of unenhanced area)/1.5 �SD air. Myocardial volume and mass analysis werecarried out on cine images using standard tech-niques (18). Before further analysis, short-axis im-ages were manually segmented for epicardial andendocardial borders (excluding papillary muscles) toobtain the myocardial volume. If more than 1 imageof the same slice position was available because ofphase swaps, the optimal image was selected foranalysis. All further quantification occurred on thepresegmented images, and LGE was quantified
A B B
A N D
AMI �
infarc
CMI �
infarc
CMR �
reson
FWHM
maxim
HCM
cardio
ICC �
coeffi
LGE �
enhan
ROI �
manually by tracing around its perimeter. Se
R E V I A T I O N S
A C R O N YM S
acute myocardial
tion
chronic myocardial
tion
cardiac magnetic
ance
� full width at half
um
� hypertrophic
myopathy
intraclass correlation
cient
late gadolinium
cement
miau-
cvd(udforsavsccuvavfd
idci5wamc
thickness.
J A C C : C A R D I O V A S C U L A R I M A G I N G , V O L . 4 , N O . 2 , 2 0 1 1
F E B R U A R Y 2 0 1 1 : 1 5 0 – 6
Flett et al.
LGE Quantification Techniques
152
tomated analyses followed using purpose-writtenImageJ (National Institutes of Health, Bethesda,MD) macros to determine FWHM and 6-, 5-, 4-,3-, and 2-SD (above the mean remote myocardialsignal) derived volumes (Fig. 1). This involved themanual delineation of 2 ROIs: first in remotemyocardium (defined as a region with no enhance-ment and normal wall motion; the size of the ROIwas dictated by the boundaries of this area andavoidance of the endocardial and epicardial sur-faces), used to generate mean and SD for 6-, 5-, 4-,3-, and 2-SD thresholds. Second, an ROI wasdrawn around hyperintense myocardium and usedto define maximal signal for the FWHM threshold.Two manual corrections were then required for allautomated ROIs: first, microvascular obstruction(defined as hypointensity within an hyperintenseregion in patients with infarctions) was manuallyadjusted to be included as LGE; this was straight-forward because microvascular obstruction wasbounded by infarction and the endocardial margin.Second, any obvious blood pool or pericardial par-tial voluming and artifact (which occurred onlyrarely) were manually removed from the ROI.Slices with no LGE were not analyzed using thesemiautomatic techniques. LGE volume as a per-cent of myocardium was quantified per slice, twiceby 2 readers (A.S.F. and J.H., analysis blinded with
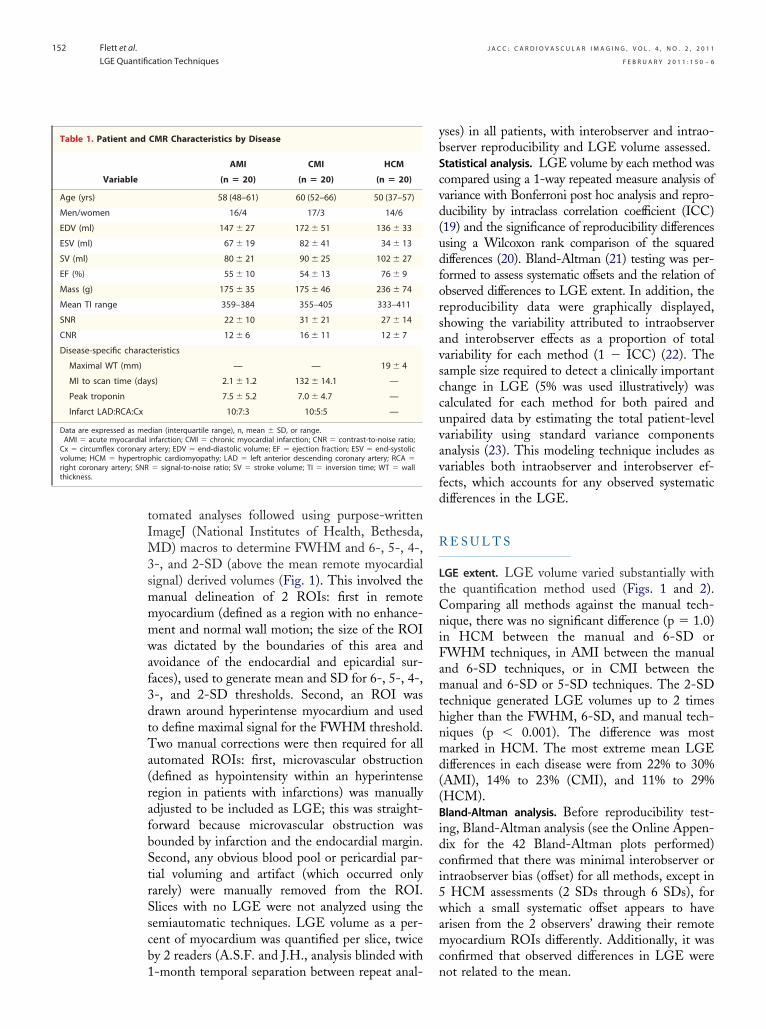
CMR Characteristics by Disease
AMI CMI HCM
(n � 20) (n � 20) (n � 20)
58 (48–61) 60 (52–66) 50 (37–57)
16/4 17/3 14/6
147 � 27 172 � 51 136 � 33
67 � 19 82 � 41 34 � 13
80 � 21 90 � 25 102 � 27
55 � 10 54 � 13 76 � 9
175 � 35 175 � 46 236 � 74
359–384 355–405 333–411
22 � 10 31 � 21 27 � 14
12 � 6 16 � 11 12 � 7
teristics
— — 19 � 4
s) 2.1 � 1.2 132 � 14.1 —
7.5 � 5.2 7.0 � 4.7 —
10:7:3 10:5:5 —
dian (interquartile range), n, mean � SD, or range.infarction; CMI � chronic myocardial infarction; CNR � contrast-to-noise ratio;artery; EDV � end-diastolic volume; EF � ejection fraction; ESV � end-systolichic cardiomyopathy; LAD � left anterior descending coronary artery; RCA �� signal-to-noise ratio; SV � stroke volume; TI � inversion time; WT � wall
1-month temporal separation between repeat anal- n
yses) in all patients, with interobserver and intrao-bserver reproducibility and LGE volume assessed.Statistical analysis. LGE volume by each method wasompared using a 1-way repeated measure analysis ofariance with Bonferroni post hoc analysis and repro-ucibility by intraclass correlation coefficient (ICC)19) and the significance of reproducibility differencessing a Wilcoxon rank comparison of the squaredifferences (20). Bland-Altman (21) testing was per-ormed to assess systematic offsets and the relation ofbserved differences to LGE extent. In addition, theeproducibility data were graphically displayed,howing the variability attributed to intraobservernd interobserver effects as a proportion of totalariability for each method (1 � ICC) (22). Theample size required to detect a clinically importanthange in LGE (5% was used illustratively) wasalculated for each method for both paired andnpaired data by estimating the total patient-levelariability using standard variance componentsnalysis (23). This modeling technique includes asariables both intraobserver and interobserver ef-ects, which accounts for any observed systematicifferences in the LGE.
R E S U L T S
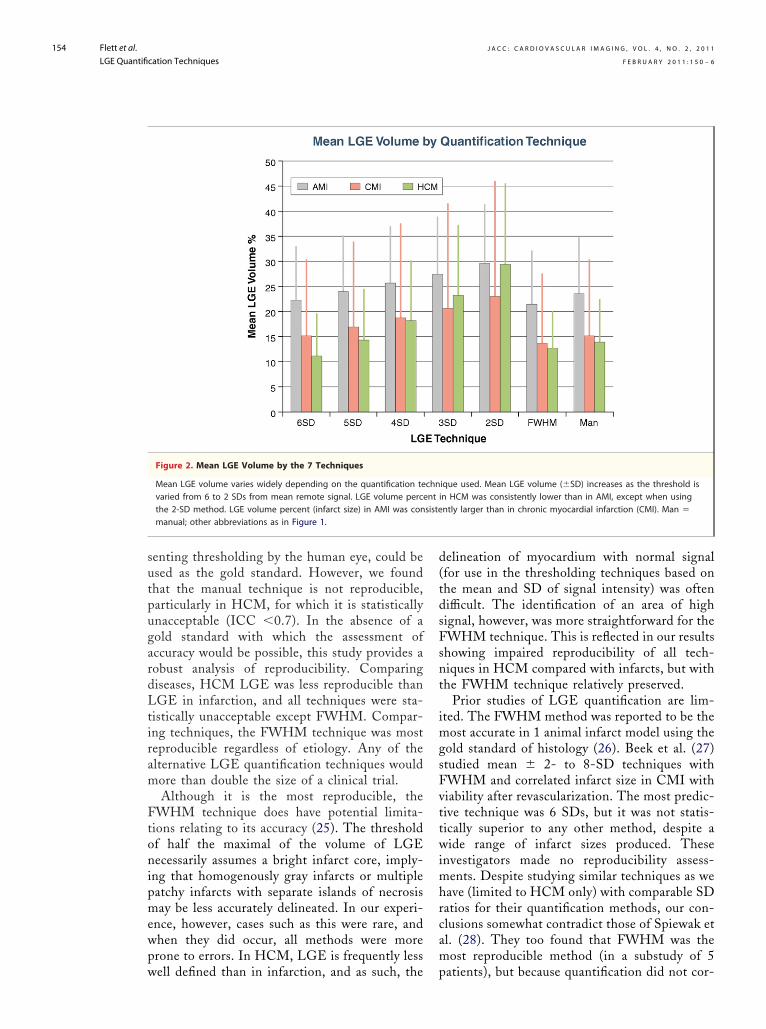
LGE extent. LGE volume varied substantially withthe quantification method used (Figs. 1 and 2).Comparing all methods against the manual tech-nique, there was no significant difference (p � 1.0)in HCM between the manual and 6-SD orFWHM techniques, in AMI between the manualand 6-SD techniques, or in CMI between themanual and 6-SD or 5-SD techniques. The 2-SDtechnique generated LGE volumes up to 2 timeshigher than the FWHM, 6-SD, and manual tech-niques (p � 0.001). The difference was mostmarked in HCM. The most extreme mean LGEdifferences in each disease were from 22% to 30%(AMI), 14% to 23% (CMI), and 11% to 29%(HCM).Bland-Altman analysis. Before reproducibility test-ng, Bland-Altman analysis (see the Online Appen-ix for the 42 Bland-Altman plots performed)onfirmed that there was minimal interobserver orntraobserver bias (offset) for all methods, except in
HCM assessments (2 SDs through 6 SDs), forhich a small systematic offset appears to have
risen from the 2 observers’ drawing their remoteyocardium ROIs differently. Additionally, it was
onfirmed that observed differences in LGE were
Table 1. Patient and
Variable
Age (yrs)
Men/women
EDV (ml)
ESV (ml)
SV (ml)
EF (%)
Mass (g)
Mean TI range
SNR
CNR
Disease-specific charac
Maximal WT (mm)
MI to scan time (day
Peak troponin
Infarct LAD:RCA:Cx
Data are expressed as meAMI � acute myocardialCx � circumflex coronaryvolume; HCM � hypertropright coronary artery; SNR
ot related to the mean.

can
J A C C : C A R D I O V A S C U L A R I M A G I N G , V O L . 4 , N O . 2 , 2 0 1 1
F E B R U A R Y 2 0 1 1 : 1 5 0 – 6
Flett et al.
LGE Quantification Techniques
153
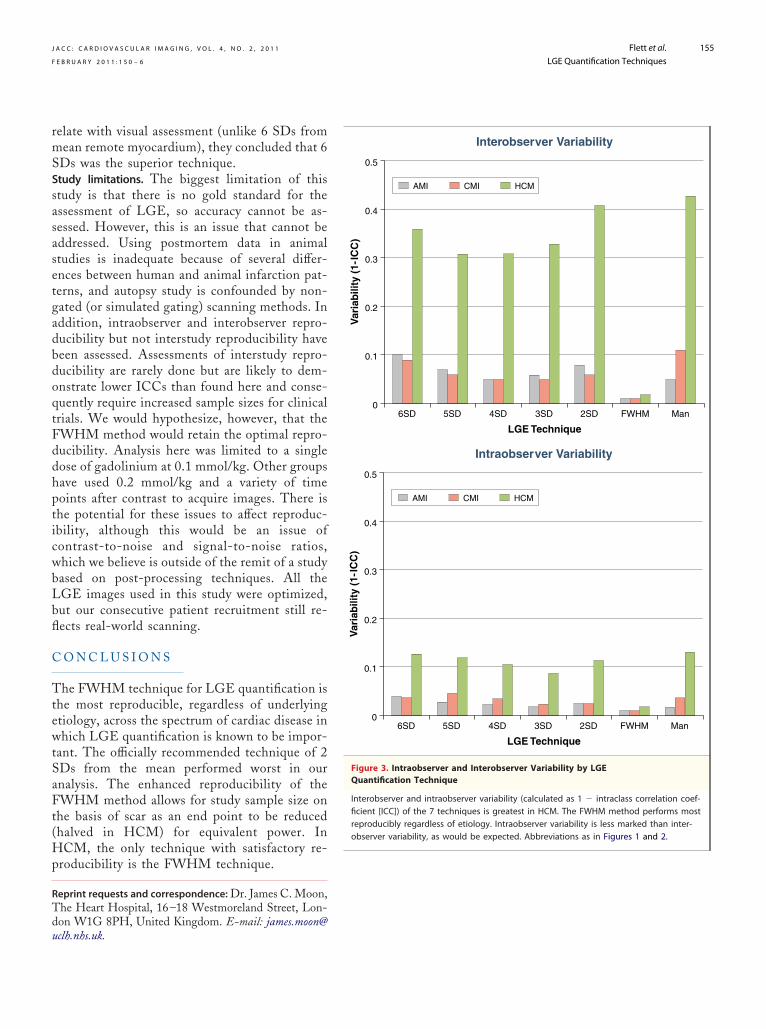
LGE reproducibility. Compared with any other tech-nique, for both intraobserver and interobserver re-liability, the FWHM technique was the most re-producible in all 3 conditions (p � 0.001). Thereproducibility of all techniques was worse in HCMthan in AMI and CMI. In CMI and HCM,manual quantification was the least reproducibletechnique. For HCM, the FWHM technique wasthe only statistically acceptable quantificationmethod (ICC �0.7) (24) (Fig. 3).Impact of reproducibility on sample size calculations.The enhanced reproducibility of the FWHMtechnique has a large impact on the sample sizeneeded to demonstrate a change in the number ofpatients required for a trial with the same power.On the basis of a difference in paired comparisonsof slices between 2 observers, the FWHM tech-nique’s interobserver reproducibility comparedwith the next best method reduces requiredsample size by 69% (CMI), 60% (AMI), and 91%(HCM) for equivalent power. On the basis of
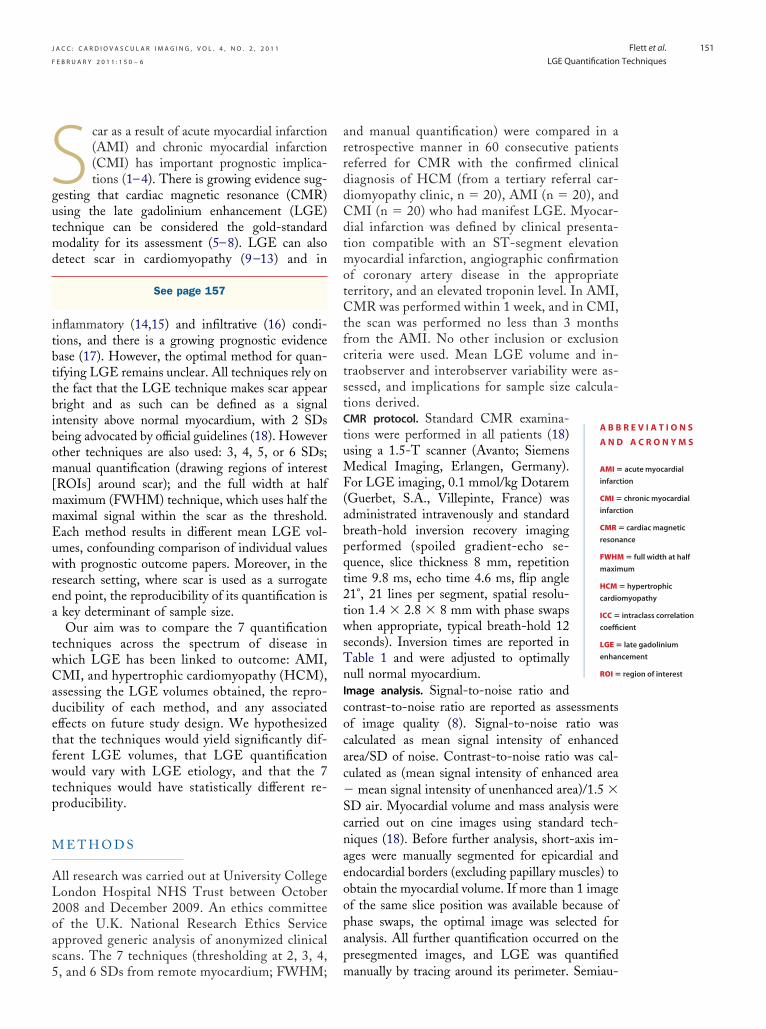
Figure 1. LGE Quantification Using 7 Techniques in HCM and A
Example analysis of a single short-axis late gadolinium enhancemenmyocardial infarction (AMI) using the 7 quantification techniques. Rvolumes. The 2-SD technique yields a much larger volume than theIn the case of AMI, a hypointense core of microvascular obstruction
unpaired analysis, taking into account an estimate
of the total variability of each method on apatient basis, the calculated sample sizes usingthe FWHM technique compared with the nextbest method is reduced by 17% (AMI), 7%(CMI), and 56% (HCM). For example, thesample size required in patients with HCM forthe FWHM technique to detect a 5% change inLGE is halved (from 126 to 56 patients). Thiscontrasts with the worst technique (2 SDs),which would require 296 patients.
D I S C U S S I O N
As previously shown by other groups, these dataconfirm that in 3 conditions, 7 commonly usedtechniques for LGE quantification producewidely differing results for fibrosis quantification.Here, the officially recommended 2-SD tech-nique can double the LGE volume comparedwith the manual, FWHM, and 6- or 5-SDtechniques. In the absence of a gold standard, one
GE) slice in hypertrophic cardiomyopathy (HCM) and in acutecing the threshold from 6 to 2 SDs yields increasingly large LGEnual or full width at half maximum (FWHM) method (p � 0.001).be seen.
MI
t (Leduma
might assume that the manual technique, repre-
gardLtiram F
vttwimhrcam
J A C C : C A R D I O V A S C U L A R I M A G I N G , V O L . 4 , N O . 2 , 2 0 1 1
F E B R U A R Y 2 0 1 1 : 1 5 0 – 6
Flett et al.
LGE Quantification Techniques
154
senting thresholding by the human eye, could beused as the gold standard. However, we foundthat the manual technique is not reproducible,particularly in HCM, for which it is statisticallyunacceptable (ICC �0.7). In the absence of aold standard with which the assessment ofccuracy would be possible, this study provides aobust analysis of reproducibility. Comparingiseases, HCM LGE was less reproducible thanGE in infarction, and all techniques were sta-
istically unacceptable except FWHM. Compar-ng techniques, the FWHM technique was mosteproducible regardless of etiology. Any of thelternative LGE quantification techniques wouldore than double the size of a clinical trial.Although it is the most reproducible, the
FWHM technique does have potential limita-tions relating to its accuracy (25). The thresholdof half the maximal of the volume of LGEnecessarily assumes a bright infarct core, imply-ing that homogenously gray infarcts or multiplepatchy infarcts with separate islands of necrosismay be less accurately delineated. In our experi-ence, however, cases such as this were rare, andwhen they did occur, all methods were moreprone to errors. In HCM, LGE is frequently less
Figure 2. Mean LGE Volume by the 7 Techniques
Mean LGE volume varies widely depending on the quantification tevaried from 6 to 2 SDs from mean remote signal. LGE volume percthe 2-SD method. LGE volume percent (infarct size) in AMI was conmanual; other abbreviations as in Figure 1.
well defined than in infarction, and as such, the p
delineation of myocardium with normal signal(for use in the thresholding techniques based onthe mean and SD of signal intensity) was oftendifficult. The identification of an area of highsignal, however, was more straightforward for theFWHM technique. This is reflected in our resultsshowing impaired reproducibility of all tech-niques in HCM compared with infarcts, but withthe FWHM technique relatively preserved.
Prior studies of LGE quantification are lim-ited. The FWHM method was reported to be themost accurate in 1 animal infarct model using thegold standard of histology (26). Beek et al. (27)studied mean � 2- to 8-SD techniques with
WHM and correlated infarct size in CMI withiability after revascularization. The most predic-ive technique was 6 SDs, but it was not statis-ically superior to any other method, despite aide range of infarct sizes produced. These
nvestigators made no reproducibility assess-ents. Despite studying similar techniques as we
ave (limited to HCM only) with comparable SDatios for their quantification methods, our con-lusions somewhat contradict those of Spiewak etl. (28). They too found that FWHM was theost reproducible method (in a substudy of 5
ique used. Mean LGE volume (�SD) increases as the threshold isin HCM was consistently lower than in AMI, except when usingntly larger than in chronic myocardial infarction (CMI). Man �
chnentsiste
atients), but because quantification did not cor-
Tdu
observer variability, as would be expected. Abbreviations as in Figures 1 and 2.
J A C C : C A R D I O V A S C U L A R I M A G I N G , V O L . 4 , N O . 2 , 2 0 1 1
F E B R U A R Y 2 0 1 1 : 1 5 0 – 6
Flett et al.
LGE Quantification Techniques
155
relate with visual assessment (unlike 6 SDs frommean remote myocardium), they concluded that 6SDs was the superior technique.Study limitations. The biggest limitation of thisstudy is that there is no gold standard for theassessment of LGE, so accuracy cannot be as-sessed. However, this is an issue that cannot beaddressed. Using postmortem data in animalstudies is inadequate because of several differ-ences between human and animal infarction pat-terns, and autopsy study is confounded by non-gated (or simulated gating) scanning methods. Inaddition, intraobserver and interobserver repro-ducibility but not interstudy reproducibility havebeen assessed. Assessments of interstudy repro-ducibility are rarely done but are likely to dem-onstrate lower ICCs than found here and conse-quently require increased sample sizes for clinicaltrials. We would hypothesize, however, that theFWHM method would retain the optimal repro-ducibility. Analysis here was limited to a singledose of gadolinium at 0.1 mmol/kg. Other groupshave used 0.2 mmol/kg and a variety of timepoints after contrast to acquire images. There isthe potential for these issues to affect reproduc-ibility, although this would be an issue ofcontrast-to-noise and signal-to-noise ratios,which we believe is outside of the remit of a studybased on post-processing techniques. All theLGE images used in this study were optimized,but our consecutive patient recruitment still re-flects real-world scanning.
C O N C L U S I O N S
The FWHM technique for LGE quantification isthe most reproducible, regardless of underlyingetiology, across the spectrum of cardiac disease inwhich LGE quantification is known to be impor-tant. The officially recommended technique of 2SDs from the mean performed worst in ouranalysis. The enhanced reproducibility of theFWHM method allows for study sample size onthe basis of scar as an end point to be reduced(halved in HCM) for equivalent power. InHCM, the only technique with satisfactory re-producibility is the FWHM technique.
Reprint requests and correspondence: Dr. James C. Moon,he Heart Hospital, 16–18 Westmoreland Street, Lon-on W1G 8PH, United Kingdom. E-mail: james.moon@
clh.nhs.uk.0
0.1
0.2
0.3
0.4
0.5
LGE Technique
Interobserver Variability
Var
iab
ility
(1-
ICC
)
6SD 5SD 4SD 3SD 2SD FWHM Man
AMI CMI HCM
0
0.1
0.2
0.3
0.4
0.5
LGE Technique
Intraobserver Variability
Var
iab
ility
(1-
ICC
)
6SD 5SD 4SD 3SD 2SD FWHM Man
AMI CMI HCM
Figure 3. Intraobserver and Interobserver Variability by LGEQuantification Technique
Interobserver and intraobserver variability (calculated as 1 � intraclass correlation coef-ficient [ICC]) of the 7 techniques is greatest in HCM. The FWHM method performs mostreproducibly regardless of etiology. Intraobserver variability is less marked than inter-

J A C C : C A R D I O V A S C U L A R I M A G I N G , V O L . 4 , N O . 2 , 2 0 1 1
F E B R U A R Y 2 0 1 1 : 1 5 0 – 6
Flett et al.
LGE Quantification Techniques
156
1
1
1
1
1
1
1
1
1
1
y
R E F E R E N C E S
1. Wu E, Ortiz JT, Tejedor P, et al.Infarct size by contrast enhanced car-diac magnetic resonance is a strongerpredictor of outcomes than left ven-tricular ejection fraction or end-systolic volume index: prospective co-hort study. Heart 2008;94:730–6.
2. Larose E, Rodés-Cabau J, Pibarot P,et al. Predicting late myocardial recov-ery and outcomes in the early hours ofST-segment elevation myocardial in-farction traditional measures com-pared with microvascular obstruction,salvaged myocardium, and necrosischaracteristics by cardiovascular mag-netic resonance. J Am Coll Cardiol2010;55:2459–69.
3. Choi KM, Kim RJ, Gubernikoff G,Vargas JD, Parker M, Judd RM.Transmural extent of acute myocardialinfarction predicts long-term im-provement in contractile function.Circulation 2001;104:1101–7.
4. Krittayaphong R, Laksanabunsong P,Maneesai A, Saiviroonporn P, Udom-punturak S, Chaithiraphan V. Com-parison of cardiovascular magneticresonance of late gadolinium enhance-ment and diastolic wall thickness topredict recovery of left ventricularfunction after coronary artery bypasssurgery. J Cardiovasc Magn Reson2008;10:41.
5. Hendel RC, Patel MR, Kramer CM,Poon M. ACCF/ACR/SCCT/SCMR/ASNC/NASCI/SCAI/SIR2006 appropriateness criteria for car-diac computed tomography and car-diac magnetic resonance imaging.J Am Coll Cardiol 2006;48:1475–97.
6. Wu E, Judd RM, Vargas JD, KlockeFJ, Bonow RO, Kim RJ. Visualisationof presence, location, and transmuralextent of healed Q-wave and non-Q-wave myocardial infarction. Lancet2000;357:21–8.
7. Wagner A, Mahrholdt H, Holly TA, etal. Contrast-enhanced MRI and routinesingle photon emission computed to-mography (SPECT) perfusion imagingfor detection of subendocardial myocar-dial infarcts: an imaging study. Lancet2003;1:359–60.
8. Simonetti OP, Kim RJ, Fieno DS, etal. An improved MR imaging tech-nique for the visualization of myocar-dial infarction. Radiology 2001;218:
215–23.9. Choudhury L, Mahrholdt H, WagnerA, et al. Myocardial scarring in asymp-tomatic or mildly symptomatic patientswith hypertrophic cardiomyopathy.J Am Coll Cardiol 2002;40:2156–64.
0. Keller DI, Osswald S, Bremerich J, et al.Arrhythmogenic right ventricular car-diomyopathy: diagnostic and prognosticvalue of the cardiac MRI in relation toarrhythmia-free survival. Int J Cardio-vasc Imaging 2003;19:537–43.
1. Moon JC, McKenna WJ, McCrohon JA,Elliott PM, Smith GC, Pennell DJ. To-ward clinical risk assessment in hypertro-phic cardiomyopathy with gadoliniumcardiovascular magnetic resonance. J AmColl Cardiol 2003;41:1561–7.
2. Dumont C, Monserrat L, Soler R, etal. Clinical significance of late gado-linium enhancement on cardiac mag-netic resonance in patients with hy-pertrophic cardiomyopathy. Rev EspCardiol 2007;60:15–23.
3. Adabag SA, Maron B, Appelbaum E, etal. Occurrence and frequency of arrhyth-mias in hypertrophic cardiomyopathy inrelation to delayed enhancement on car-diovascular magnetic resonance. J AmColl Cardiol 2008;51:1369–74.
4. Smedema JP, Snoep G, van Kroonen-burgh MP, et al. Evaluation of theaccuracy of gadolinium-enhanced car-diovascular magnetic resonance in thediagnosis of cardiac sarcoidosis. J AmColl Cardiol 2005;45:1683–90.
5. Wagner A, Schulz-Menger J, Dietz R,Friedrich MG. Long-term follow-up ofpatients with acute myocarditis by mag-netic resonance imaging. MAGMA2003;16:17–20.
6. Maceira AM, Joshi J, Prasad SK, et al.Cardiovascular magnetic resonance incardiac amyloidosis. Circulation 2005;111:186–93.
7. Flett AS, Westwood MA, Davies LC,Mathur A, Moon JC. The prognosticimplications of cardiovascular mag-netic resonance. Circ Cardiovasc Im-aging 2009;2:243–50.
8. Kramer C, Barkhausen J, Flamm SD,Kim R, Nagel E. Standardized cardiovas-cular magnetic resonance imaging(CMR) protocols, Society for Cardiovas-cular Magnetic Resonance: Board ofTrustees Task Force on StandardizedProtocols. J Cardiovasc Magn Reson2008;10:35.
9. McGraw K, Wong S. Forming inferencesabout some intraclass correlation coeffi-
cients. Psychol Meth 1996;1:30–46.20. Moon JC, Lorenz CH, Francis JM,Smith GC, Pennell DJ. Breath-holdFLASH and FISP cardiovascular MRimaging: left ventricular volume dif-ferences and reproducibility. Radiol-ogy 2002;223:789–97.
21. Bland JM, Altman DG. Statisticalmethods for assessing agreement be-tween two methods of clinical mea-surement. Lancet 1986;1:307–10.
22. Bellenger N, Davies LC, Francis JM,Coats AJ, Pennell DJ. Reduction insample size for studies of remodeling inheart failure by the use of cardiovascularmagnetic resonance. J Cardiovasc MagnReson 2000;4:271–8.
23. Rabe-Hesketh S, Skrondal A. Multi-Level and Longitudinal Modeling Us-ing Stata. College Station, TX: StataPress, 2008.
24. Vincent WJ. Statistics in Kinesiology.2nd ed. Champaign, IL: Human Ki-netics, 1999.
25. Kim HW, Farzaneh-Far A, Kim RJ.Cardiovascular magnetic resonance inpatients with myocardial infarctioncurrent and emerging applications.J Am Coll Cardiol 2010;55:1–16.
26. Amado LC, Gerber B, Gupta SN, etal. Accurate and objective infarct siz-ing by contrast-enhanced magneticresonance imaging in a canine myo-cardial infarction model. J Am CollCardiol 2004;44:2383–9.
27. Beek AM, Bondarenko O, Afshar-zada F, van Rossum AC. Quantifica-tion of late gadolinium enhancedCMR in viability assessment inchronic ischemic heart disease: a com-parison to functional outcome. J Car-diovasc Magn Reson 2009;11:6.
28. Spiewak M, Malek LA, Misko J, et al.Comparison of different quantifica-tion methods of late gadolinium en-hancement in patients with hypertro-phic cardiomyopathy. Eur J Radiol2010;74:e149–53.
Key Words: cardiac magneticresonance y cardiomyopathy yimaging y myocardial infarction
SVCs.
‹ A P P E N D I X
For the 42 Bland-Altman plots performed,
please see the online version of this article.
Copyright © 2022 FDOKUMEN