Evaluation of Quality Control in the Open University Education ...
173
1 VOLUME 17, NUMBER 2, 2018 ISSN 0795-3607 NIGERIAN JOURNAL OF EDUCATIONAL RESEARCH AND EVALUATION (Website: www.naere.org.ng) A PUBLICATION OF THE ASSOCIATION OF EDUCATIONAL RESEARCHERS AND EVALUATORS OF NIGERIAN (ASSEREN)
-
Upload
khangminh22 -
Category
Documents
-
view
6 -
download
0
Transcript of Evaluation of Quality Control in the Open University Education ...
Evaluation of Quality Control in the Open University Education System in Nigeria
1
VOLUME 17, NUMBER 2, 2018 ISSN 0795-3607
NIGERIAN JOURNAL OF
EDUCATIONAL RESEARCH
AND EVALUATION
(Website: www.naere.org.ng)
A PUBLICATION OF
THE ASSOCIATION OF EDUCATIONAL
RESEARCHERS AND EVALUATORS
OF NIGERIAN (ASSEREN)
Nigerian Journal of Educational Research and Evaluation
2
EDITORIAL BOARD
Prof. Ukwuije, R.P.I. (Editor-in-Chief)
[email protected] [email protected] 08033429222
Faculty of Education, University of Port-Harcourt
Rivers State.
Dr. Uzoma, P.(Managing Editor)
[email protected] 08033577195
Faculty of Education, Imo State University,
Owerri, Imo State.
Dr. Osadebe, P.U.
[email protected] 08035776610
Faculty of Education Delta State University
,Abaraka, Delta State.
Dr. Faleye, B.A.
Faculty of Education, Obafemi Awolowo University, Ile-Ife
Osun State, Nigeria.
Dr. Abbas Yusuf Mustapha
[email protected] 080331857059
Faculty of Education.University of Jos,
Plateau State, Nigeria
Dr. Orluwene, G.W.
[email protected] 08055474248
Faculty of Education , University of Port Harcourt,
Rivers State.
Editorial Advisers
Prof. Ogomaka, P.M. Imo State University, Owerri, Imo State.
Prof. Joe,A.I. University of Port Harcourt, Rivers State.
Prof. Afemikhe,O.A. University of Benin, Benin City, Edo State
Prof. Joshua,M.T. University of Calabar, Cross River State.
Prof. Akanwa,U.N. University of Agriculture Umudike, Abia State
Prof. Abubakar H.T. University of Maidugiri, Bornu State.
Evaluation of Quality Control in the Open University Education System in Nigeria
3
TABLE OF CONTENTS
Evaluation of Quality Control in the Open University Education System in Nigeria
Joshua Adetunji Ogunbiyi., Abbas Yusuf Mustapha &
Clementina Hashimu Bulus .................................................................................................. 1
Framing Instructional Strategy and Senior Secondary School Chemistry Students’
Achievement in Stoichiometry in Aba Educational Zone of Abia State
Madu, Adolphus Onuabuchi., Egwuonu Franklin & Ihuoma, Moses ............................ 12
Students’ Evaluation as a Basis for the Promotion of Measurement and Evaluation
Lecturers in Colleges of Education in Nigeria
G.G.Ezugwu ......................................................................................................................... 20
Values Re-orientation in Enhancing Girl Child School Participation in Jema’a Local
Government Area of Kaduna State, Nigeria.
Comfort K. Bakau., James N. Bature & Bawa John ...................................................... 29
Assessment of Quality of Teacher-Made Geography Tests used for Senior Secondary School
Students in Jos, Plateau State
Sayita Sarah G. Wakjissa .................................................................................................... 41
Teachers Continuous Assessment Practices and Secondary School Students’ Biology
Achievement in Obubra Local Government Area of Cross River State
Ayang, Ethelbert Edim ........................................................................................................ 54
Effects of Formative Assessment with Feedback on Junior Secondary School Students’
Attitude and Performance in Mathematics in Barkin-Ladi, Plateau State, Nigeria
Geoginia Cyril Imo & Hwere Mary Samuel ................................................................... 66
The Effect of Using Coefficient Alpha for Estimating the Reliability of Mathematics Test
when the Assumptions Underlying its Utilization are Violated
Michael Akinsola Metibemu, & Chinyere C. Oguoma ..................................................... 74
Achieving Quality Problem-Solving in Junior Secondary School Mathematics Through
Formative Assessment with Feedback
Hwere Mary Samuel., G. C. Imo & A.Y. Mustapha ......................................................... 89
Experimental Study on Using Portfolio Assessment to Enhance Learning in Senior
Secondary School Economics in Ibadan North, Oyo State, Nigeria
T. Godwin Atsua & A.O.U. Onuka .................................................................................... 99
Nigerian Journal of Educational Research and Evaluation
4
Students’ Evaluation of Open Book Assessment in Restoring Value to our Educational
Assessment System. Popoola S.F. .................................................................................... 113
The Effects of Formative Evaluation on Students Achievement and Interest in
Secondary School Geography.
Ame Festus Okechukwu & Ebuoh Casmir .N. ............................................................... 120
Usage of Dice in the Teaching and Learning of Probability in Senior Secondary Two in Jos-
North Local Government Area of Plateau State.
Obadare-Akpata Oluwatoyin C. & Osazuwa Christopher ............................................ 128
Relative Effects of Mediated Instructional Techniques on Senior Secondary School
Students’ Achievement in Vocabulary in Kwara State, Nigeria
Mmohammed, Bola Sidikat & Ogunwole, Opeyemi ....................................................... 141
Assessment of Item and Test Information Functions in the Selection of Senior Secondary
School Certificate Mathematics Examination Items, 2016.
Roseline, Amos Aku., Bako, Gonzwal & Ndulue, Loretta,G. S.E ................................. 154
Violence against children in Northern Nigeria; An appraisal
Ahmed Taminu Mahmoud., Hassan Bukar Adam &
Suleiman Mohammed Saye ............................................................................................... 163
Evaluation of Quality Control in the Open University Education System in Nigeria
5
EDITORIAL COMMENTS
The Nigerian Journal of Educational Research and Evaluation is one of the official Journals
of the Association of Educational Researchers and Evaluators of Nigeria (ASSEREN). It
publishes empirical and theoretical papers covering a broad range of issues in educational
research, assessment, evaluation and other related issues all emanated from papers presented
at our annual conference held in Jos 2017. It contains well written articles that could serve
locally and internationally.
We have done our best to improve the quality of the Journal. A number of articles were
received and peer-reviewed. Accepted papers are published in this volume 17 in two numbers
1 and 2. We acknowledge the contributors to this Edition, our Editorial Advisers and
reviewers.
Therefore, we present this edition with the hope that you will find it very resourceful and
informative. We look forward to your continuous contribution to the Journal.
Dr. P. U. Osadebe
Member Editorial Board..
Nigerian Journal of Educational Research and Evaluation
6
INFORMATION TO CONTRIBUTORS
i. Each article should not exceed 12 (double-space) typewritten quarto-size pages,
accompanied by an abstract of not more than 200 words.
ii. References for citations in the manuscripts should follow the recent APA format.
iii. Manuscripts which have been submitted for publication elsewhere or which have
previously been published are not welcome.
iv. Subscribers are to pay assessment fee and a publication fee upon the acceptance
of their manuscripts as determined by the Editorial Board.
v. Authors are assured of prompt editorial decisions on manuscripts.
vi. The journal is published once a year, mostly from papers presented at the annual
national conference of ASSEREN.
vii. If the article is the report of a study it should include: Introduction, Method,
Result, Discussion, Recommendation, Conclusion and References.
(a) Introduction includes: Background, Statement of problem, Research
questions, hypothesis and review of literature.
(b) Method includes: Design, Sample, Sampling procedure, Instruments and
their psychometric properties, and procedure.
(Note: a and b are all in running sentences, not as subheadings)
viii. All correspondences are transacted on-line and should be directed to
Prof. Ukwuije,R.P.I.
Department of Educational Psychology, Guidance and Counselling
University of Port-Harcourt.Rivers State.
[email protected]. [email protected] 08033429222.
Or
Dr. Uzoma, P. (Managing Editor)
Faculty of Education
Imo State University,
Owerri, Imo State.
[email protected] 08033577195
Evaluation of Quality Control in the Open University Education System in Nigeria
7
EVALUATION OF QUALITY CONTROL IN THE OPEN UNIVERSITY
EDUCATION SYSTEM IN NIGERIA
Joshua Adetunji Ogunbiyi
Abbas Yusuf Mustapha
[email protected] 08031857059
&
Clementina Hashimu Bulus
Department of Educational Foundation, Faculty of Education University of Jos, Jos
Abstract
The Open University Education system has been accepted and integrated into the
mainstream of the Nigerian education policy. However, the programme has to contend with
the acceptability of the certificate by labour market because of suspicion and fear of quality
control compromise. Consequently, this study evaluated quality control in the Open
University education system in Nigeria using the survey method. A simple random sample of
450 respondents was selected for the study from five National Open University of Nigeria
(NOUN) study centres located in Abuja, Enugu, Ikeja, Jos and Kaduna. A questionnaire was
used for data collection. Data were analyzed using descriptive statistics. The findings
revealed that the tutorial facilitation to the students in all academic programmes of NOUN is
not adequate and the course materials are not easily accessible to the students. It was
recommended that the Federal Government should diversify sources of educational funds to
the Open University education system in Nigeria and NOUN should establish a full fledge
instructional resource centre.
Keywords: Evaluation, Open University, Distance learning.
Introduction
The significant position occupied by education in national development cannot be over-
emphasized. Education contributes to the growth of national income and individual earnings.
In today’s information societies, knowledge drives economic growth as well as development.
Nationally and internationally, experiences have shown that conventional education is
extremely hard pressed to the demands of today’s social educational milieu, especially for
developing countries like Nigeria (Olubor and Ogonor, 2008). The limitation of spaces and
other learning facilities in the Nigerian Universities impose restrictions on access. If they had
their way, almost every product of the senior secondary school system will want a place in a
conventional university. An example is the 1,543,739 applicants to the 134 universities in
2016 (www.jamb.gov.ng/statistics.aspx).
Nigerian Journal of Educational Research and Evaluation
8
The ever-increasing growth in Nigeria’s population, the attendant escalating demand
for education, the difficulty of resourcing education through the traditional face-to-face
classroom and the need to provide education for all mean that Nigeria must of necessity find
an appropriate and cost-effective means to meet the demand for education. These led to the
establishment of open and distance learning (ODL) in 1983by the Federal Government of
Nigeria in order to meet the educational needs of the country. The programme was however
suspended in 1984 following a change in government.
The resuscitation of ODL in 2001 and subsequent opening of the National Open
University of Nigeria (NOUN), in 2003, has indeed provided opportunity for many
Nigerians that hitherto would not have had access to higher education to be enrolled. NOUN
is designed to provide access to all Nigerians who yearn for education in a manner
convenient to their circumstances. This will cater for the continuous educational
development of professionals such as teachers, accountants, bankers, lawyers, doctors,
engineers, politicians, self employed businessmen and women. The clientele range is elastic
and dynamic, so a constant review is essential to meet ever changing needs.
The Open University system has been accepted and integrated into the mainstream
of the Nigerian education policy. However, the programme has to contend with the
acceptability of the certificate by labour market because of suspicion and fear of quality
control compromise. This is a natural occurrence for any new product (Olubor and Ogonor,
2008). In this respect, the National Universities Commission (NUC), as a regulatory agency
of the universities, has a vital role to play in ensuring that the standards laid down are
strictly adhered to. The programmes of the Open University should compare favourably
with similar programmes in conventional university system based on the approved
minimum academic standards (AMAS) stipulated by the NUC.
The National Open University of Nigeria (NOUN) was formally opened in 2003.
The vision of the NOUN is to be regarded as the foremost University providing highly
accessible and enhanced quality education anchored by social justice, equity, equality, and
national cohesion through a comprehensive reach that transcends all barriers. To ensure that
high quality instructional materials are produced by its consultant writers, NOUN has
developed rigorous quality control measures. Consultant writers are selected on the basis of
the quality of their draft course outlines submitted in response to advertisements calling for
course writers. The selected writers are required to attend an instructional designing
workshop where they receive training on how to write for distance learners. The NOUN
Quality Assurance Unit is a unit within the Office of the Vice-Chancellor. Established in
August 2014, the Quality Assurance Unit of NOUN is a reflection of the University’s
commitment to promote institutional excellence through quality enhancement of its
educational provisions in order to meet learners and stakeholders’ expectations, and to
achieve a competitive advantage in the higher education sector.
The Open University is the United Kingdom’s (UK) largest university. In addition to
the quality control arrangements within the University, the Open University also operated the
quality systems common to the rest of UK higher education. Principal amongst these was the
Evaluation of Quality Control in the Open University Education System in Nigeria
9
external examiner system whereby experienced academics from other universities would be
involved in the assessment of students, including providing written reports to the University
on the comparability of its standards with those of other universities (Brennan, Holloway and
Shah 1997).
The Indira Gandhi National Open University (IGNOU) in India, established by an
Act of Parliament in 1985, has continuously strived to build an inclusive knowledge society
through inclusive education. There are 134 active two-way video conferencing centres; all
the regional centres and high enrolment study centres have been provided with network
connectivity, which has made it possible to transact through interactive digital content.
Another initiative is the Flexi Learn platform (www.ignouflexilearn.ac.in). This was
launched on 19th November, 2009 for free and easy access to open courses of IGNOU. A
major quality intervention that has been achieved is the introduction of the Student/Learner
Satisfaction Survey, which has been implemented with the objective of gathering inputs from
each and every learner about the performance of the University and the benefits they receive
from the IGNOU system (Avabrath, 2013).
The Botswana College of Distance and Open Learning (BOCODOL) was instituted
by an Act of Parliament in 1998, as a result of the quest for quality education emphasised by
the Revised National Policy on Education (RNPE 1994). Since its inception, BOCODOL has
been aspiring to be a college of excellence in ODL. Capacity-building in ODL became a
primary tool in ensuring that the college marched towards excellence. Another strategy that
the college adopted in pursuit of excellence was to participate in regional distance education
conferences, seminars and associations’ meetings with a view to learn from other ODL
providers. To make things work and to establish this culture on a sound footing, there is also
funding set aside on an annual basis for quality assurance activities, including training of
staff to ensure they keep pace with emerging quality trends (Tau and Thutoetsile, 2006).
The theoretical foundation for this study was the system theory. System theory
focuses on the arrangement of and relations between the parts, how they work together as a
whole rather than reducing an entity into its parts or elements. The way the parts are
organised and how they interact with each other determines the properties of that system. The
behaviour of the system is independent of the properties of the elements. This is often
referred to as a holistic approach to understanding phenomena (Ansari, 2004). Thus, a
systems approach is a theoretical perspective that analyses a phenomenon seen as a whole
and not as simply the sum of elementary parts. Ansari identifies two versions of system
theory namely; closed system and open system. For the purpose of this research, the open
system is preferable. This is because closed systems approach considers the internal
environment and the organisations interaction with it to be for the most part inconsequential.
Open systems approach views the organisation’s interaction with the external environment as
vital for organisational survival and success. Moreover, closed systems are static and self-
regulated. Joiner (1994) believes that the optimization of any sub-system will result in the
sub-optimization of the entire system. Thus, distance education could be approached through
a systemic view which subdivides all the components of distance education into various
Nigerian Journal of Educational Research and Evaluation
10
groups to facilitate all types of interventions including academic and the evaluative. Also, the
open systems approach is applicable to NOUN programme since the organisation interacts
with the external environment, for example, NUC – for accreditation of its academic
programmes.
The present study was designed to evaluate the application of quality control
measures in the Open University education system in Nigeria since 2003. In order to achieve
this purpose, the following research questions were answered:
1. What are NOUN’s strategies to enhance quality control of its graduates?
2. How effective is NOUN’s quality control strategies in providing quality academic
programmes and education best practices?
3. How adequate are the resources employed by NOUN in its quality control activities?
Method
The study is both analytical and descriptive since it is concerned with a condition that already
exists; that is quality control in the Open University education system in Nigeria. The survey
method was used in this study. The research design was validated through a trial run of the
instrument on 100 respondents from NOUN Study Centre, Abuja, due to its cosmopolitan
nature as the capital of Nigeria. The pilot study report provided insight that gave indication
that the main study would yield viable results.
The target population for the study comprised the staff and students from 77 NOUN
study centres across Nigeria, who did not participate in the pilot study to validate the
instrument. The study used non proportional stratified random sampling technique to draw
two study centres from each of the northern and southern parts of Nigeria and one of the
NOUN Special Study Centres in Abuja, the NOUN Special Study Centre for Nigeria Prisons
Abuja. The sampled respondents were made up of a total of four hundred and fifty (450) staff
and students randomly selected in the Abuja, Enugu Ikeja, Jos, and Kaduna study centres.
The instrument for data collection was the Quality Control Questionnaire, (QCQ), a
close-ended-questionnaire. The QCQ was divided into four: sections A, B, C and D. In
section A, the bio data of the respondents was gathered. Sections B and C gathered data on
strategies to enhance quality control of graduates of NOUN and the effectiveness of the
strategies, respectively. Section D collected data on adequacy of resources employed.
Secondary data were obtained from appropriate documentary materials from National
Universities Commission (NUC), National Open University of Nigeria (NOUN), books and
articles from journals, magazines, newspapers, internet, monographs, published and
unpublished works.
The validation of the instrument was determined through the judgment of six experts,
who are proficient and knowledgeable on education. The six experts were made up of two
senior staff at the NUC (the statutory quality assurance agency in the Nigerian university
education system), two experts in Test and Measurement at the University of Jos and two
staff of Quality Assurance Unit at NOUN. The instrument was judged for its appropriateness
and adequacy to obtain the desired responses for the study.
Evaluation of Quality Control in the Open University Education System in Nigeria
11
The data for this research were gathered through the administration of the Quality
Control Questionnaire on the respondents in their study centres by the researchers, who
visited the centres during the examination period. The researchers were assisted by the
Director of Study Centre’s nominees. The questionnaire for staff were distributed to them in
their offices and collected later. The questionnaire for the students were distributed to them
after their examination in the hall and collected on completion.
Results
Out of 450 copies of the questionnaire administered, 378 representing 84% were returned.
Data on all the returned questionnaires were analysed by frequency distributions and
percentages. The data analysis is represented in tables.
Research Question One
Seeks to find out the various strategies that can enhance quality control of NOUN graduates.
Table 3.1 presents the respondents opinion.
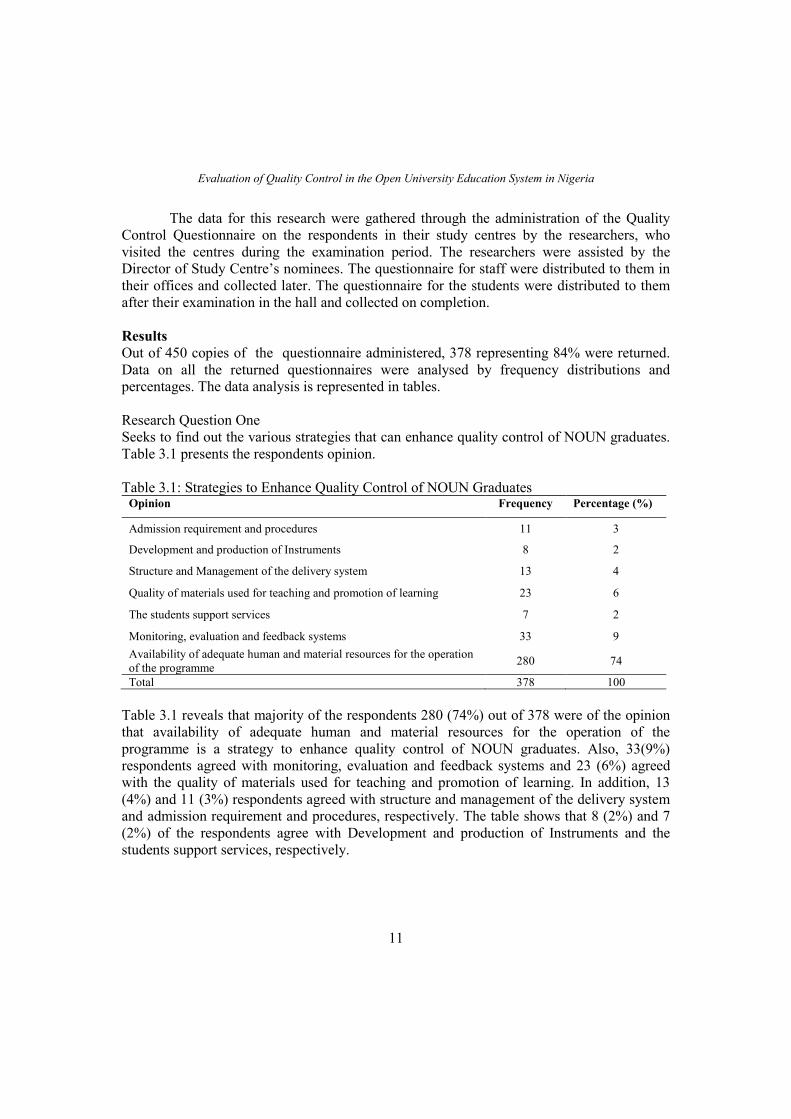
Table 3.1: Strategies to Enhance Quality Control of NOUN Graduates Opinion Frequency Percentage (%)
Admission requirement and procedures 11 3
Development and production of Instruments 8 2
Structure and Management of the delivery system 13 4
Quality of materials used for teaching and promotion of learning 23 6
The students support services 7 2
Monitoring, evaluation and feedback systems 33 9
Availability of adequate human and material resources for the operation
of the programme 280 74
Total 378 100
Table 3.1 reveals that majority of the respondents 280 (74%) out of 378 were of the opinion
that availability of adequate human and material resources for the operation of the
programme is a strategy to enhance quality control of NOUN graduates. Also, 33(9%)
respondents agreed with monitoring, evaluation and feedback systems and 23 (6%) agreed
with the quality of materials used for teaching and promotion of learning. In addition, 13
(4%) and 11 (3%) respondents agreed with structure and management of the delivery system
and admission requirement and procedures, respectively. The table shows that 8 (2%) and 7
(2%) of the respondents agree with Development and production of Instruments and the
students support services, respectively.
Nigerian Journal of Educational Research and Evaluation
12
Research Question Two
Seeks to find out the effectiveness of strategies adopted to enhance quality control in NOUN.
Table 3.2 presents the respondents opinion.
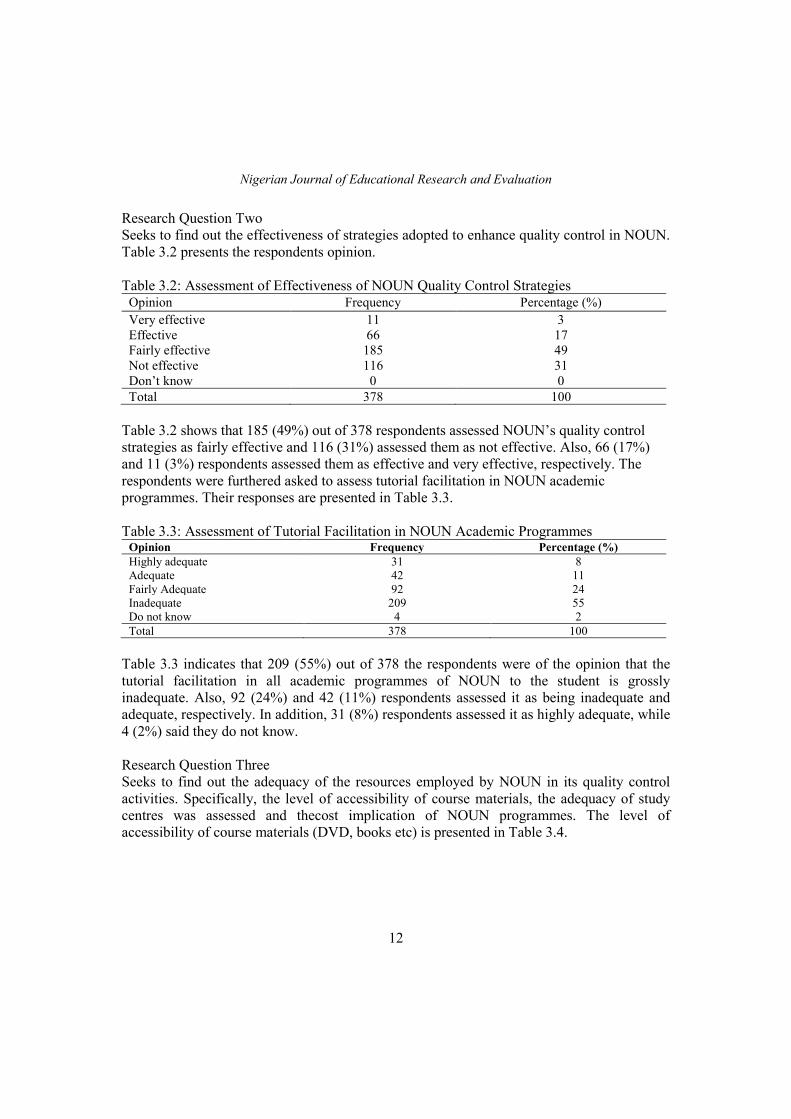
Table 3.2: Assessment of Effectiveness of NOUN Quality Control Strategies Opinion Frequency Percentage (%)
Very effective 11 3
Effective 66 17
Fairly effective 185 49
Not effective 116 31
Don’t know 0 0
Total 378 100
Table 3.2 shows that 185 (49%) out of 378 respondents assessed NOUN’s quality control
strategies as fairly effective and 116 (31%) assessed them as not effective. Also, 66 (17%)
and 11 (3%) respondents assessed them as effective and very effective, respectively. The
respondents were furthered asked to assess tutorial facilitation in NOUN academic
programmes. Their responses are presented in Table 3.3.
Table 3.3: Assessment of Tutorial Facilitation in NOUN Academic Programmes Opinion Frequency Percentage (%)
Highly adequate 31 8
Adequate 42 11
Fairly Adequate 92 24
Inadequate 209 55
Do not know 4 2
Total 378 100
Table 3.3 indicates that 209 (55%) out of 378 the respondents were of the opinion that the
tutorial facilitation in all academic programmes of NOUN to the student is grossly
inadequate. Also, 92 (24%) and 42 (11%) respondents assessed it as being inadequate and
adequate, respectively. In addition, 31 (8%) respondents assessed it as highly adequate, while
4 (2%) said they do not know.
Research Question Three
Seeks to find out the adequacy of the resources employed by NOUN in its quality control
activities. Specifically, the level of accessibility of course materials, the adequacy of study
centres was assessed and thecost implication of NOUN programmes. The level of
accessibility of course materials (DVD, books etc) is presented in Table 3.4.
Evaluation of Quality Control in the Open University Education System in Nigeria
13
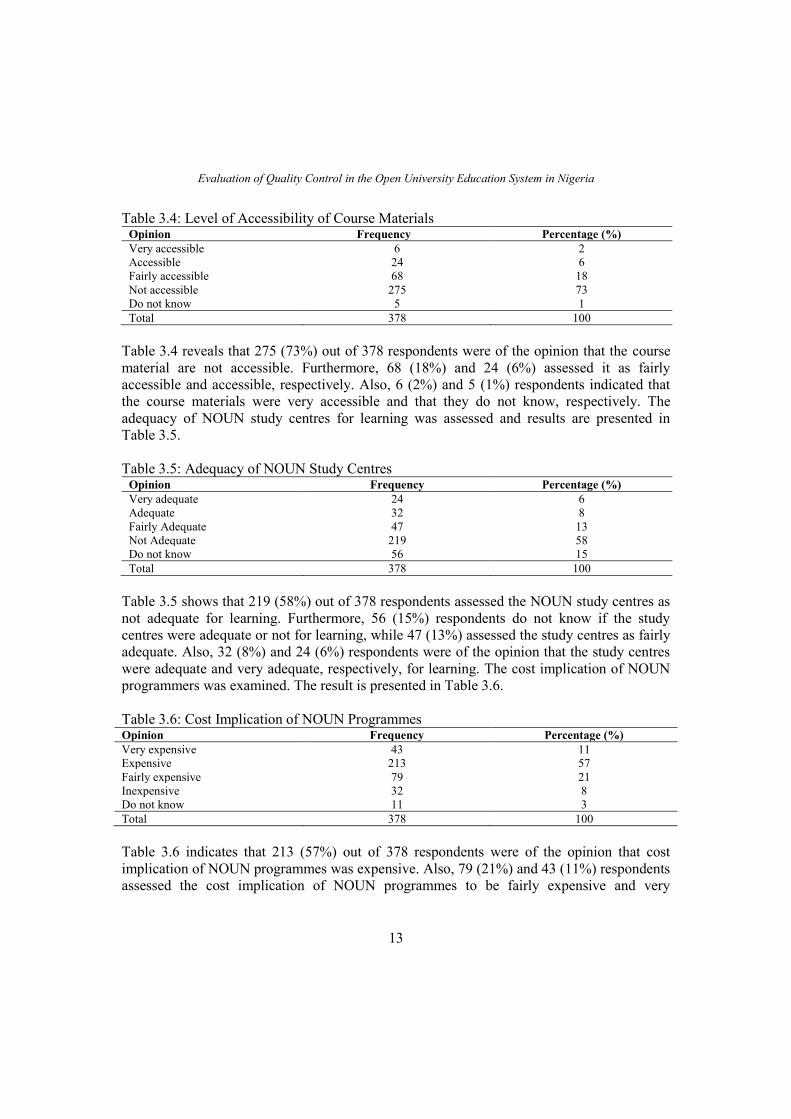
Table 3.4: Level of Accessibility of Course Materials Opinion Frequency Percentage (%)
Very accessible 6 2
Accessible 24 6
Fairly accessible 68 18
Not accessible 275 73
Do not know 5 1
Total 378 100
Table 3.4 reveals that 275 (73%) out of 378 respondents were of the opinion that the course
material are not accessible. Furthermore, 68 (18%) and 24 (6%) assessed it as fairly
accessible and accessible, respectively. Also, 6 (2%) and 5 (1%) respondents indicated that
the course materials were very accessible and that they do not know, respectively. The
adequacy of NOUN study centres for learning was assessed and results are presented in
Table 3.5.
Table 3.5: Adequacy of NOUN Study Centres Opinion Frequency Percentage (%)
Very adequate 24 6
Adequate 32 8
Fairly Adequate 47 13
Not Adequate 219 58
Do not know 56 15
Total 378 100
Table 3.5 shows that 219 (58%) out of 378 respondents assessed the NOUN study centres as
not adequate for learning. Furthermore, 56 (15%) respondents do not know if the study
centres were adequate or not for learning, while 47 (13%) assessed the study centres as fairly
adequate. Also, 32 (8%) and 24 (6%) respondents were of the opinion that the study centres
were adequate and very adequate, respectively, for learning. The cost implication of NOUN
programmers was examined. The result is presented in Table 3.6.
Table 3.6: Cost Implication of NOUN Programmes Opinion Frequency Percentage (%)
Very expensive 43 11
Expensive 213 57
Fairly expensive 79 21
Inexpensive 32 8
Do not know 11 3
Total 378 100
Table 3.6 indicates that 213 (57%) out of 378 respondents were of the opinion that cost
implication of NOUN programmes was expensive. Also, 79 (21%) and 43 (11%) respondents
assessed the cost implication of NOUN programmes to be fairly expensive and very
Nigerian Journal of Educational Research and Evaluation
14
expensive, respectively. Furthermore, 32 (8%) respondents assessed it as inexpensive, while
11 (3%) do not know.
Discussion
It can be deduced from the responses in research question one that NOUN quality control
strategies are generally effective. Availability of adequate human and material resources for
the operation of the NOUN programmers as well as monitoring, evaluation and feedback
systems are strategies to enhance quality control. The external examiner system whereby
experienced academics from the conventional universities would be involved in the
assessment of students should be sustained. This should include written reports by the
external examiners to the NOUN on the comparability of its standards with those of other
conventional universities as it is being practised by the Open University of United Kingdom
(OU). Another quality intervention can be achieved by the introduction of the
Student/Learner Satisfaction Survey, with the objective of gathering inputs from each and
every learner about the performance of NOUN and the benefits they receive from it, like it is
done in the Indira Gandhi National Open University (IGNOU) system.
Based on the responses in research question two, the tutorial facilitation in all
academic programmes of NOUN to the student is grossly inadequate. The researchers’
interactions with some NOUN students during visits to the study centres showed that many
students were not available for the tutorial due to various reasons which included inadequate
time to leave other engagements for the tutorials. Also, the researchers gathered, from the
Directors of the study centres visited, that the fund available to NOUN could not sustain the
payment of the facilitators. Indeed, NOUN was indebted to some facilitators for past services
rendered. Therefore, facilitators felt reluctant to participate in the tutorials.
The responses to research question three show that course materials were not
accessible to the students. The reasons for lack of access to course materials were diverse.
According to the Directors of the study centres visited, these included inadequate fund and
bureaucratic bottleneck in going through due process of award of contract to print the course
materials. Also, some materials were out of stock and even when available, there was
problem of logistics for distribution. It was further revealed that there is only one central
warehouse located in Kaduna. The cost of transportation of these course materials from the
central warehouse to the various centres across the country was exorbitant.
Conclusion
As a result of the findings, it is observed that an effective quality control measure will require
adequate human and material resources for the operation of NOUN programme. The study
noted that NOUN is faced with numerous challenges which tend to bedevil its otherwise
laudable course towards educational development in Nigeria. These challenges range from
inadequate human and material resources in quality and quantity, poor infrastructural facility,
and poor funding of NOUN. To maintain quality in teaching and learning, NOUN must use
Evaluation of Quality Control in the Open University Education System in Nigeria
15
ICT in course content delivery, assessment of students’ performances, admission and
registration of students.
Furthermore, the study revealed that, the poor infrastructural facilities include
inadequate classrooms and office spaces, lack of computer centres and laboratories for
practical work. This was the result of paucity of fund. Both Federal and State Governments
will, therefore, need to collaborate and intensify efforts for all study centres to move to their
permanent sites and minimum equipment and facilities provided as a starter. Arising from the
findings of the study, it is revealed that the Federal and State Governments contribute in
funding the Open University Education system; however, they do not favourably contribute
to the provision of infrastructures and maintenance of the study centres.
Recommendations
In view of the findings of the study, the researchers make the following recommendations
1. The Federal Government should appropriately diversify sources of educational funds to
Open University education system in Nigeria.
2. NOUN should establish a full fledge instructional resource centre.
3. NOUN should explore ways of increasing students’ access to modern technologies so
that learners are not excluded from the benefits of the multimedia instructional
approaches.
4. NOUN should emplace a mechanism to conduct all courses online.
References
Akpan. C. P., (2008), “Enhancing Quality in Open and Distance Education through effective
utilization of Information and Communication Technology (ICT) in Nigeria,” (Paper
presented at the 2nd African Council for Distance Education (ACDE) Conference
and General Assembly, Lagos, Nigeria, July 8th -11th , 2008).
Ansari, S. (2004), Systems Theory and Management Control, New York: Aldine.
Avabrath, G. (2013). “Quality Assurance in Open Distance Learning: IGNOU a Case Study,”
International Journal of Computer Science and Network, 2(1): 119-124.
Brennan, J., J. Holloway, & T. Shah (1997), Quality Assessment-Open University. Quality
Assurance Fund Project (unpublished).
Chacon-Duque, F. J. (1985), Building Academic Excellence in Distance Higher Education: A
Monograph in Higher Education Evaluation and Policy University Park:
Pennsylvania State University.
Chu, G. & W. Schramm (1975), Learning from Television: What Does the Research Say?,
Stanford, C.A.: Stanford University Press.
Joiner, B. L. (1994), “Fourth generation management”, in Dent, E. B. and S.A. Umpleby
(1998), Underlying Assumptions of Several Traditions in Systems Theory and
Cybernetics, published in Trappl, R. ed. Cybernetics and Systems, Vienna: Austrian
Society for Cybernetic Studies.
Nigerian Journal of Educational Research and Evaluation
16
Kawatra, P. S & N. K. Singh (2006), “E-learning in LIS education in India” in Khoo, C., D.
Singh & A.S. Chaudhry, eds. (Proceedings of the Asia-Pacific Conference on
Library & Information Education & Practice 2006 (A-LIEP 2006), Singapore, 3-6
April 2006 (pp. 605-611). Singapore: School of Communication & Information,
Nanyang Technological University).
Kulik, C. L., J. A. Kulik & B. J. Schwalb (1985), “The Effectiveness of Computer-Based
Adult Education”, (Paper presented at the 69th Annual Meeting of the American
Educational Research Association, Chicago).
Kulik, J. A., C. L. Kulik & P. A. Cohen (1979), “Research on audio-tutorial instruction: A
meta-analysis of comparative studies,” Research in Higher Education, (XI): 321-
341.
Leverenz, T. R. (1979), “Student Perception of Instructional Quality of Correspondence
Courses: Report of a Nine Schools Comparative Study”, (ERIC Document
Reproduction Service), 202-267. Jsaer.org/pdf/Vol50/50-00-040.pdf., Retrieved on
May 28th , 2013.
Moore, M. & G. Kearsley (1996), “Distance Education – A systems view”, Belmont, CA:
Wadsworth in Gokool-Ramdoo, S. (2008), “Beyond the Theoretical Impasse:
Extending the Applications of Transactional Distance Theory,” The International
Review of Research in Open and Distance Learning, 9(3).
Moore, M. G. &M. M. Thompson (1990), The Effects of Distance Learning: A Summary of
Literature, (N.P.): American Centre for the Study of Distance Education).
Nhundu, T. J. (1996), “Alternative Delivery Systems in Higher Education and the Search for
Quality through Distance Education”, Zambezia, xxiii (ii).
Niemiec, R. & H. J. Walberg (1987), “Comparative effects of computer assisted instruction:
A synthesis of reviews,” Journal of Educational Computer Research, III(i):19-37.
NOUN (2012), General Catalogue, 2012-2015: Undergraduate & Graduate.
NUC (2009), Guidelines for Open and Distance Learning in Nigerian Universities.
Olakulehin, F. K. (2009). Strengthening the Internal Quality Assurance Mechanisms in Open
and Distance Learning Systems, Lagos: IGI Global.
Olubor, R. O. & Ogonor, B.O., (2008), “Quality Assurance in Open and Distance Learning in
National Open University of Nigeria: Concepts, Challenges, Prospects and
Recommendations”, (Paper presented at 2nd ACDE Conference and General
Assembly, Eko Hotel Suites, Lagos, July 8th – 11th , 2008).
Olugbile, S. (2012), The Punch, “Tackling inadequate varsity enrolments with ODL,” April
15, 2012. www.punchng.com/education Retrieved on October 28th, 2013.
Pierre, S. &L. K. Olsen (1991), “Student perspectives of the effectiveness of correspondence
instruction,” The American Journal of Distance Education, V, (iii): 61-79.
Republic of Botswana (1994), The Revised National Policy on Education. Gaborone:
Government Printer.
SAIDE (1995), Open Learning and Distance Education in South Africa: Report of an
International Commission, Manzini, Swaziland: Macmillan Boleswa Publishers.
Evaluation of Quality Control in the Open University Education System in Nigeria
17
Tau, D. R. & T. Thutoetsile (2006), “Quality Assurance in Distance Education: Towards a
Culture of Quality in Botswana College of Distance and Open Learning” in Koul, B.
N. and A.Kanwar, eds. Perspectives on Distance Education: Towards a Culture of
Quality, Vancouver: Commonwealth of Learning.
Willett, J. B., J. M. Yamashita & R. D. Anderson (1983), “A meta-analysis of instructional
systems applied in science teaching,” Journal of Research in Science Teaching, XX,
(v): 405-417.
Zigerell, J. (1984), Distance Education: An Information Age Approach to Adult Education,
Columbus, Ohio: ERIC Clearinghouse on Adult, Career and Vocational Education.
Response Theory and their Application to Test Development. Journal of Research &
Methods in Education,5(11),38-45.
Zieba,A.(2013). The Item Information Function in one and two parameter logistics model- A
comparison and use in the analysis of the results of school test. International Journal
of educational Science, 10(14), 54-63.
Framing Instructional Strategy and Senior Secondary School Chemistry Students’ Achievement....
18
FRAMING INSTRUCTIONAL STRATEGY AND SENIOR SECONDARY SCHOOL
CHEMISTRY STUDENTS’ ACHIEVEMENT IN STOICHIOMETRY IN ABA
EDUCATIONAL ZONE OF ABIA STATE
Madu Adolphus Onuabuchi
Email: [email protected]. 08035836499
Egwuonu Franklin
Email: [email protected]. 08035805334
&
Ihuoma Moses
Department of Science Education College of Education
Michael Okpara University of Agriculture, Umudike, Abia State, Nigeria
Abstract
The study aimed at examining Framing Instructional Strategy and senior secondary school
chemistry students’ Achievement in Stoichiometry in Aba Educational Zone of Abia State.
The study adopted quasi experimental design. Three research questions and four hypotheses
were formulated to guide the study. The population of the study comprised all the 5,686
chemistry students of 2015/2016 session in public secondary schools in Aba Educational
Zone of Abia State. Purposive sampling technique was used to select 72 chemistry students
and the use of intact classes was involved. A 30 item multiple choice Stoichiometry
Achievement Test (SAT) with option A-D was developed which covered the SS2 Chemistry
curriculum. The content areas are: particulate nature of matter, symbols, formulae and
equations, mass-volume relationship. The reliability of the instrument was established using
Kuder-Richardson KR-20 and it yielded estimate of 0.72. The data collected were analyzed
using mean and standard deviation for research questions while the hypotheses were tested
using Analysis of Co-variance (ANCOVA) at 0.05 level of significance. The findings of the
study among others showed that there was significant mean difference between achievement
scores of students taught with framing instructional strategy and those taught with lecture
method. It was recommended that chemistry teachers should use framing instructional
strategy in teaching and learning of Stoichiometry among others.
Keywords: Framing Instructional strategy, lecture method, Stoichiometry and Achievement
Introduction
Chemistry is fundamental to everyone’s life and permeates almost every aspect of man’s
existence. Chemistry is essential for meeting basic needs of food, clothing, shelter, health,
energy and plays a vital role in the advancement of technology (Ababio, 2011; Amajuoyi,
Joseph & Udoh, 2013).
Nigerian Journal of Educational Research and Evaluation
19
Chemistry has been identified as the core of the basic sciences and one of the science
subjects stipulated by the National Policy on Education (Federal Republic of Nigeria, 2013)
which students must compulsorily offer to enable them gain admission into Nigerian tertiary
institutions to study any of the sciences and science related courses.
Chemistry is involved in several fields of study and candidates are expected to
satisfy the requirement of at least a credit in chemistry in the West African Senior School
Certificate Examination (WASSCE) to qualify to study courses like Medicine, Pharmacy,
Industrial Chemistry, Biochemistry, Chemical Engineering and other applied sciences in
tertiary institutions (Jegede, 2012).
In spite of the importance of chemistry, candidates’ enrolment and performance in
chemistry have not been impressive over the years (WAEC, 2000; Udo & Eshiet, 2009).
WAEC (2007) noted from their analyses, that for a period of ten years (1998-2007), it was
only in 2003 that up to 50.98% of candidates who sat for Chemistry in WASSCE passed at
credit level. Similarly, Ifeakor (as cited in Okonkwo, 2012) reported a consistent trend of
poor performances of students in Chemistry in the National Examination Council (NECO)
between (2004-2007). This trend has always generated concern among scholars, parents,
educators, scientists and the government. It could be blamed on the instructional strategy,
instructional materials or assessment techniques used in teaching (Jegede, 2012).
On this basis, many educationists have suggested different strategies in teaching and
learning of Chemistry topics and these include lecture, discussion, demonstration, field trips,
inquiry and mastery learning methods. Research reports by Inyang and Ekpenyong (2000)
showed that poor teaching strategy seems to be a reoccurring reason for poor achievement in
the science classroom. Ololade (2000) indicated that the teaching of Chemistry in schools in
Nigeria has not completely weaned itself from its historical antecedents in which the class is
dominated by the teacher and the participation of students in verbal interaction and skill
demonstration is limited. The effects of instructional strategy on the science concepts seem to
differ in effectiveness as it concerns areas perceived to be difficult in chemistry especially
Stoichiometry.
Stoichiometry is the study of the quantitative relations between amounts of reactants
and products. It is important that students know the nature of products when other elements
react with each other. Stoichiometry is one of the chemistry concepts that pose strong
difficulties to students’ understanding. It has been considered as unifying concept linking
many aspects of subject matter in Chemistry Curriculum (Olalede, 2006). Majek (2008)
reported that students as well as teachers ranked Stoichiometry as one of difficult
areas/contents to teach. He noted that Stoichiometry is difficult not only to learn but also
difficult to teach because of the poor methods adopted.
One of the methods suggested that can effectively aid in teaching Stoichiometry is
framing instructional strategy which is an aspect of meta cognitive strategy. The framing
instructional strategy was used in this study because it is learner’s centered and activity
based.
Framing Instructional Strategy and Senior Secondary School Chemistry Students’ Achievement....
20
Framing strategy is a visual arrangement that enables a substantial amount of information to
be put in a grid or matrix or framework. Frames consists of main ideas in rows and columns
which allow information about the main ideas to be entered in ‘slots’ as facts, examples,
descriptions, explanations, processes and procedures in order to show the relationship among
them and within concepts.
In learning the concept of Stoichiometry, students need to move from passive to
active and dependence to independence, students learn the same concept in different ways,
and teachers need to move learning from teacher-centered to student-centered. As the centre
of all learning and teaching revolves around the student, it will be unwise if the teaching
strategy fails to recognize the central position of the student. The teaching strategy based on
the student-centered approach allows the involvement of the student in an open-ended
laboratory exercise.
Furthermore, the uncertainty over the extent instruction in learning strategy is
dependent on gender appear not to have been resolved. For instance, Furio, Azcona and
Guisasola (2002) found significant difference in chemistry achievement in favour of males.
Mariogu (2012) investigated the effects of framing instructional strategy on students’
Achievement and retention in mole concept. The study was a quasi-experimental study of a
non-equivalent control group design. Results revealed that there were significant effect of the
instructional strategy on students’ achievement in the mole concept and retention when
taught with framing instructional strategy than when taught with lecture method.
The result shows no significant interaction effect between instructional approaches and
gender of students’ achievements in mole concept and retention. The result further revealed
that students taught with the framing instructional strategy achieved more than their
counterparts in the control group. It is worthy of note that Miriogu (2012) based his study on
the teaching of mole concept and retention. In effect his work cannot comfortably be used for
basis of generalization in the teaching of Stoichiometry. It accounts for one of the reasons the
present study focused on Stoichiometry.
Similarly, Igwe (2006) determined the effect of concept mapping and framing
instructional strategies on students’ attainment of selected chemistry topics. A quasi-
experimental pre test, post-test control group design was used for the study. The study also
determined possible mediating effects of gender on the attainment of the chemistry topics.
Results indicated that the combined strategy obtained the highest adjusted post-test mean
score to cognitive achievement followed by concept mapping, then framing strategy and the
last lecture method. Result also revealed that gender did not have a significant mean effect on
cognitive achievements towards chemistry. Igwe (2006), covered more content areas in the
study carried out than the present study that focused intensively on Stoichiometry.
On these bases, the effect of framing on students’ achievement in Stoichiometry,
have not been explored and resolved. The questions raised should be how would framing
instructional strategy influence students’ Achievement in Stoichiometry? How would
framing instructional strategy interact with each of gender?
Nigerian Journal of Educational Research and Evaluation
21
Based on the foregoing, the study was to examine the effect of framing instructional
strategy on the students’ achievement in Stoichiometry. The study was guided by research
questions and hypotheses.
The following research questions were formulated to guide the study;
1) What are the mean achievement scores of students taught Stoichiometry using lecture
method as measured by Stoichiometry Achievement Test (SAT)?
2) What are the mean achievement score of students when taught Stoichiometry using
framing instructional strategy based on gender of students as measured by Stoichiometry
Achievement Test (SAT)?
The study was guided by the following hypotheses and were tested at 0.05 level of
Significance
1) There is no statistically significant mean difference between the Achievement of students
taught Stoichiometry using framing instructional strategy and those taught with lecture
method.
2) There is no statistically significant mean difference between the mean Achievement of
students’ taught Stoichiometry using framing instructional strategy and those taught with
lecture method based on gender.
Method
This research work adopted the quasi-experimental design. The non-equivalent control group
design was employed because it was difficult to have complete randomization of subjects due
to practical consideration (for example, school time table and school regulation) which can
prevent assignment of subjects to groups.
The population of the study was 5686 Senior Secondary School two students in
2015/2016 Academic session in Aba education Zone. The population of the study was made
up of 2,814 males and 2,872 females. The Senior Secondary two Students were used because
Stoichiometry was in their Scheme of work and believed that students were familiar with the
work.
Purposive Sampling technique was used to select two schools used for the study.
Purposive sampling was used because the researcher’s discretions were needed for the
selection of schools appropriate for the study. In each school, two intact streams were used
for the study. One stream was randomly assigned to experimental group and the other,
control group. On the whole, there were four groups (2 experimental and 2 control groups)
from two selected schools, which comprised 34 students’ in experimental group and 38 in the
control group.
The instrument for data collection was Stoichiometry Achievement Test (SAT)
developed based on the topics as Contained in Chemistry Curriculum (NEDRC, 2005).It was
a 4-option multiply choice items containing 30 items on Stoichiometry. Two types of lesson
plans were developed for experimental and control groups. The lesson plans were face
Framing Instructional Strategy and Senior Secondary School Chemistry Students’ Achievement....
22
validated by experts. The content validity of SAT involved the use of Table of specification
and the experts were required to determine the extent to which the items of the instrument
covered a representative sample of Stoichiometry. An estimate of internal consistency was
obtained using Kuder Richardson (KR-20) in estimating the reliability because the test items
used for trial testing were a multiple choice scored dichotomously. The value of 0.72,
reliability Coefficient was obtained.
The researcher administered pre test and post test to both the experimental group and
control groups. The experimental group was taught with framing instructional strategy while
the control group was taught with lecture method. The experimental treatment lasted for a
period of six weeks. Framing strategy as said earlier is a visual arrangement that enables a
substantial amount of information to be put in a form of a grid, framework spatial matrix.
While concept mapping depicts hierarchy and relationships among concepts, framing begins
from the most general, most inclusive concept at the top and proceeds downwards to general
specifics. Based on this, students were taught Particulate Nature of Matter, Symbols, formula
and equations, Mass-volume relationships, Acid-base reactions, Reduction-Oxidation and
Electrolysis. They were taught these topics using researchers’ frames based on topics on
weekly basis. A delayed post-test was administered after one week to allow time between
pre-test and post test.
The data collected were analyzed using mean and standard deviation for research
questions and the hypotheses were tested at 0.05 level of significance using analysis of Co-
Variance (ANCOVA). The ANCOVA served as a controller for initial differences across
groups as well as increasing the precision due to the extraneous Variable, thus reducing the
error Variance.
Results
The results of data analysis are presented in tables 1 to 4
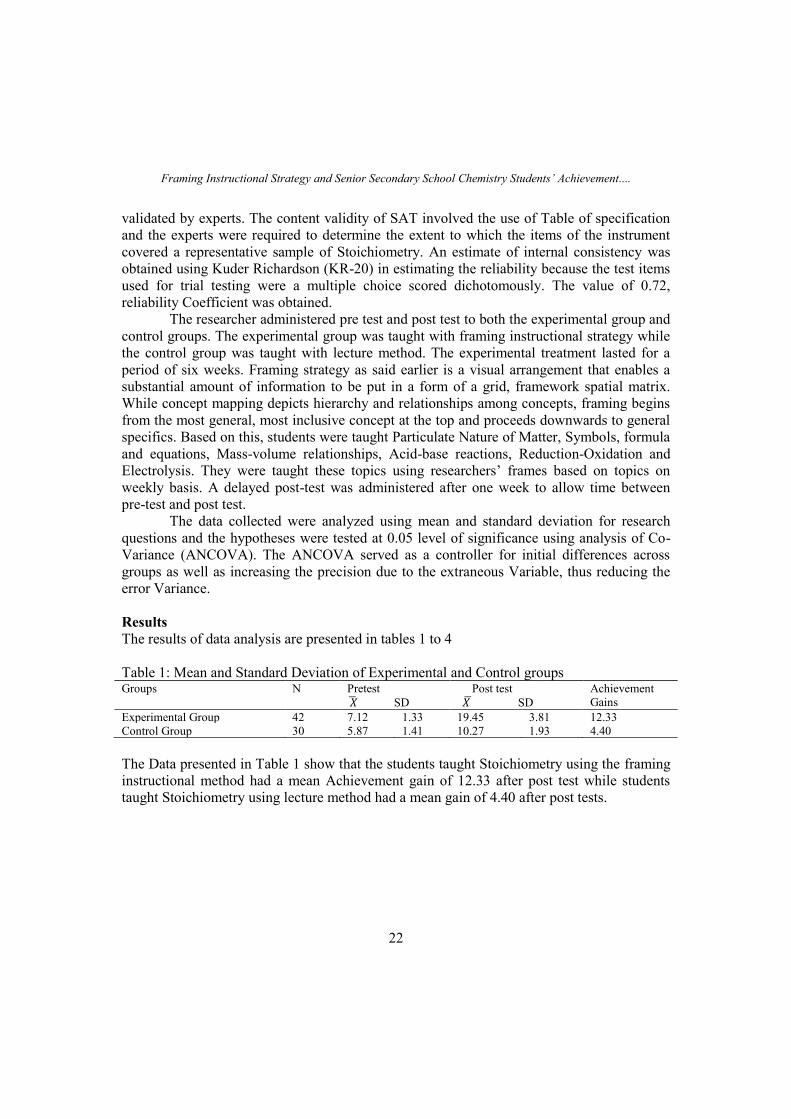
Table 1: Mean and Standard Deviation of Experimental and Control groups Groups N Pretest
�̅� SD
Post test
𝑋 ̅ SD
Achievement
Gains
Experimental Group 42 7.12 1.33 19.45 3.81 12.33
Control Group 30 5.87 1.41 10.27 1.93 4.40
The Data presented in Table 1 show that the students taught Stoichiometry using the framing
instructional method had a mean Achievement gain of 12.33 after post test while students
taught Stoichiometry using lecture method had a mean gain of 4.40 after post tests.
Nigerian Journal of Educational Research and Evaluation
23
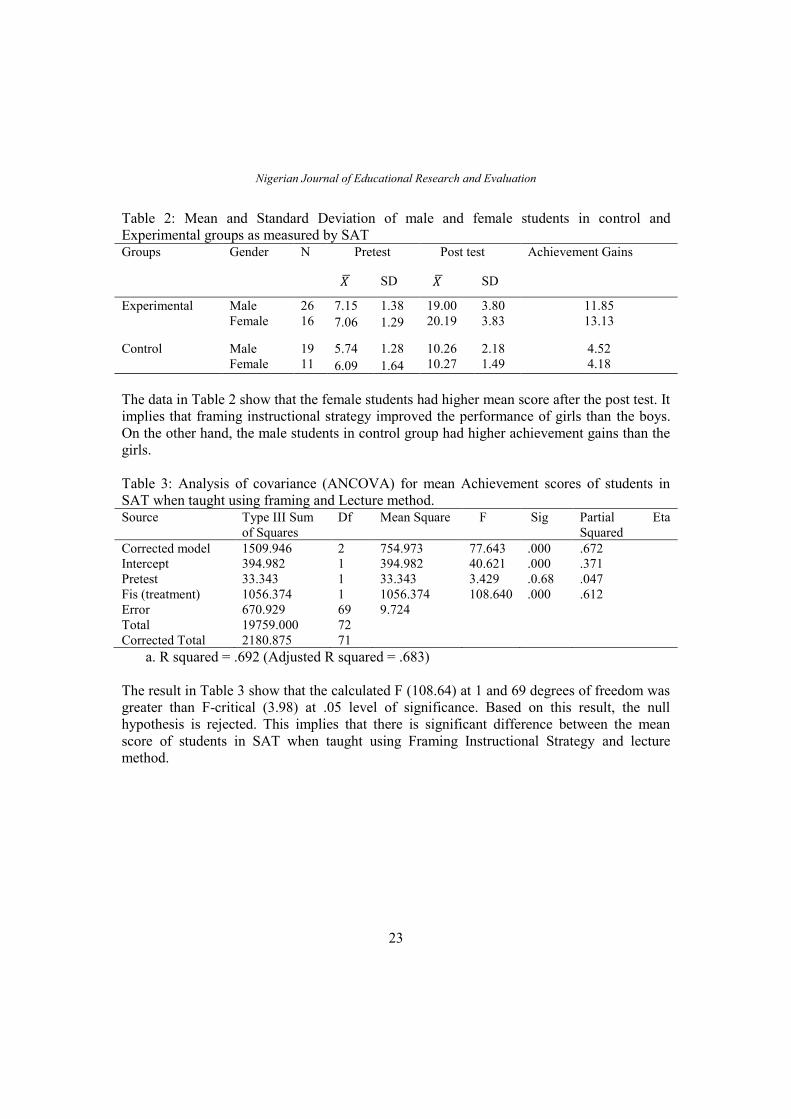
Table 2: Mean and Standard Deviation of male and female students in control and
Experimental groups as measured by SAT Groups Gender N Pretest Post test Achievement Gains
𝑋 ̅ SD 𝑋 ̅ SD
Experimental Male
Female
26
16
7.15 1.38 19.00
20.19
3.80
3.83
11.85
13.13 7.06 1.29
Control Male
Female
19
11
5.74 1.28 10.26
10.27
2.18
1.49
4.52
4.18 6.09 1.64
The data in Table 2 show that the female students had higher mean score after the post test. It
implies that framing instructional strategy improved the performance of girls than the boys.
On the other hand, the male students in control group had higher achievement gains than the
girls.
Table 3: Analysis of covariance (ANCOVA) for mean Achievement scores of students in
SAT when taught using framing and Lecture method. Source Type III Sum
of Squares
Df Mean Square F Sig Partial Eta
Squared
Corrected model 1509.946 2 754.973 77.643 .000 .672
Intercept 394.982 1 394.982 40.621 .000 .371
Pretest 33.343 1 33.343 3.429 .0.68 .047
Fis (treatment) 1056.374 1 1056.374 108.640 .000 .612
Error 670.929 69 9.724
Total 19759.000 72
Corrected Total 2180.875 71
a. R squared = .692 (Adjusted R squared = .683)
The result in Table 3 show that the calculated F (108.64) at 1 and 69 degrees of freedom was
greater than F-critical (3.98) at .05 level of significance. Based on this result, the null
hypothesis is rejected. This implies that there is significant difference between the mean
score of students in SAT when taught using Framing Instructional Strategy and lecture
method.
Framing Instructional Strategy and Senior Secondary School Chemistry Students’ Achievement....
24
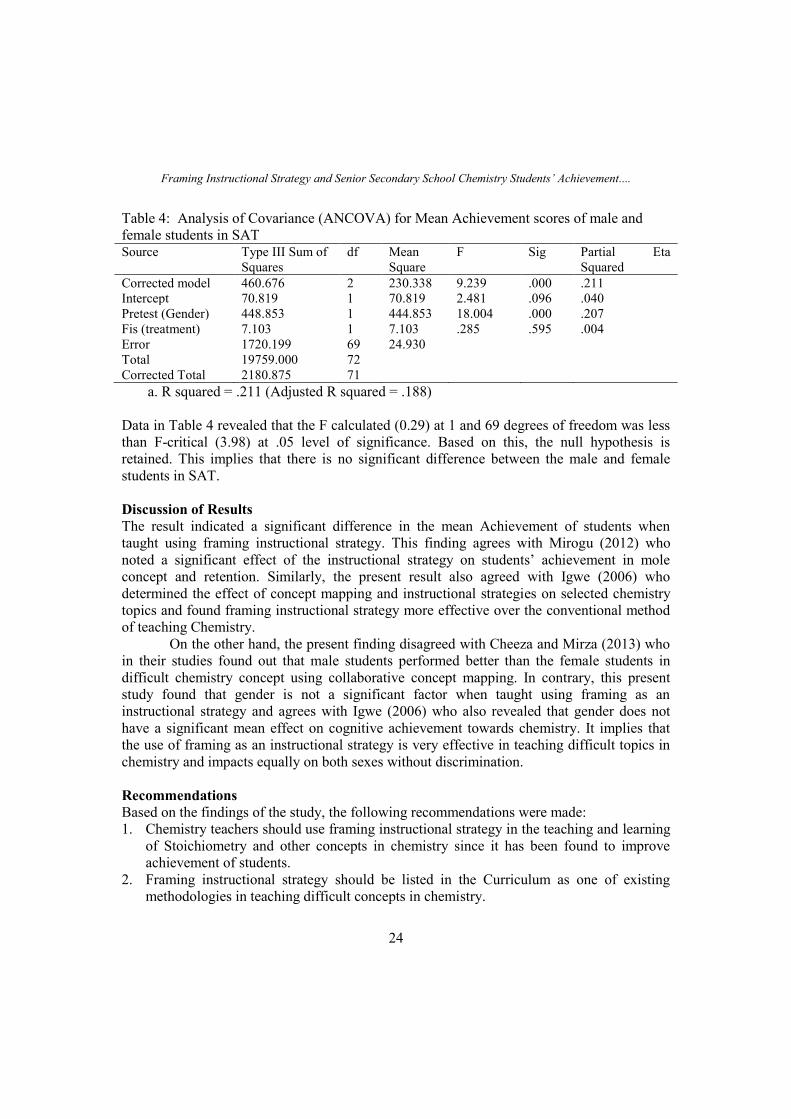
Table 4: Analysis of Covariance (ANCOVA) for Mean Achievement scores of male and
female students in SAT Source Type III Sum of
Squares
df Mean
Square
F Sig Partial Eta
Squared
Corrected model 460.676 2 230.338 9.239 .000 .211
Intercept 70.819 1 70.819 2.481 .096 .040
Pretest (Gender) 448.853 1 444.853 18.004 .000 .207
Fis (treatment) 7.103 1 7.103 .285 .595 .004
Error 1720.199 69 24.930
Total 19759.000 72
Corrected Total 2180.875 71
a. R squared = .211 (Adjusted R squared = .188)
Data in Table 4 revealed that the F calculated (0.29) at 1 and 69 degrees of freedom was less
than F-critical (3.98) at .05 level of significance. Based on this, the null hypothesis is
retained. This implies that there is no significant difference between the male and female
students in SAT.
Discussion of Results
The result indicated a significant difference in the mean Achievement of students when
taught using framing instructional strategy. This finding agrees with Mirogu (2012) who
noted a significant effect of the instructional strategy on students’ achievement in mole
concept and retention. Similarly, the present result also agreed with Igwe (2006) who
determined the effect of concept mapping and instructional strategies on selected chemistry
topics and found framing instructional strategy more effective over the conventional method
of teaching Chemistry.
On the other hand, the present finding disagreed with Cheeza and Mirza (2013) who
in their studies found out that male students performed better than the female students in
difficult chemistry concept using collaborative concept mapping. In contrary, this present
study found that gender is not a significant factor when taught using framing as an
instructional strategy and agrees with Igwe (2006) who also revealed that gender does not
have a significant mean effect on cognitive achievement towards chemistry. It implies that
the use of framing as an instructional strategy is very effective in teaching difficult topics in
chemistry and impacts equally on both sexes without discrimination.
Recommendations
Based on the findings of the study, the following recommendations were made:
1. Chemistry teachers should use framing instructional strategy in the teaching and learning
of Stoichiometry and other concepts in chemistry since it has been found to improve
achievement of students.
2. Framing instructional strategy should be listed in the Curriculum as one of existing
methodologies in teaching difficult concepts in chemistry.
Nigerian Journal of Educational Research and Evaluation
25
3. Grouping of students based on sex should not be considered when framing instructional
strategy is being used in teaching chemistry.
Conclusion
The use of framing instructional strategy in teaching chemistry especially Stoichiometry is
very effective. In doing so, no effort should be wasted in grouping students based on gender
since the use of framing as an instructional strategy impacts equally on both sexes.
References
Ababio, O. Y. (2011). New School Chemistry for Senior Secondary (6th Ed). Ibadan: African
Publishers.
Amajuoyi, I. J., Joseph, E. U. & Udo, N. A. (2013). Content Validity of May/June WASSCE
Questions in chemistry. Journal of Education and practice, 4(7), 15-121.
Federal Republic of Nigeria (2013). National Policy on Education. Abuja: Government
Press.
Furio, C. O., Azcona, R. &, J. (2002). The learning and teaching of the concepts of substance
and mole: A review of the Literature. Chemistry Education Research and Practice.
3, 277-292.
Igwe, I. O. (2006). Relative Effectiveness of Concept mapping and Framing Instructional
Strategies on Students’ Achievement in selected chemistry topics. Ebonyi State
University Journal of Education, 4(1).
Inyang, N. E. U. & Ekpenyong, H. E. (2000). Influence of ability and gender groupings on
senior secondary school chemistry Achievement on the concept of Redox reactions.
Journal of the Science Teachers Association of Nigeria, 35(1 & 2), 60-65.
Jegede, S. A. (2012). Remediation of Students’ Weakness for Enhanced Achievement in
chemistry: Greener Journal of Educational Research, 2(4): 95-99.
Majek, F. (2008). Chemistry Driver for National Development. A Paper Presented at the
National Conference of Chemical Society of Nigeria, Abuja.
Miriogu, C. A. (2012). Effects of Framing Instructional Strategy on Students’ Achievement
and Retention in Mole concept. [An Unpublished PhD Thesis], University of
Nigeria, Nsukka.
Ololade, O. I. (2006). Enhanced Mastery Learning Strategy of the Achievement and Self
concept in Senior Secondary School chemistry. Humanity and Social Sciences
Journal, 5(1), 9-24.
Udo, M. F. & Eshiet, I. T. (2007). Chemistry of Corrosion of Metals: A Resource for
Teaching Kinetics. Journal of Science Teachers Association of Nigeria, 42(172): 26-
32
West African Examination Council (2007). Annual Report (1998 – 2007)
Students’ Evaluation as a Basis for the Promotion of Measurement and Evaluation....
26
STUDENTS’ EVALUATION AS A BASIS FOR THE PROMOTION OF
MEASUREMENT AND EVALUATION LECTURERS IN COLLEGES OF
EDUCATION IN NIGERIA
G. G. Ezugwu
[email protected], +2347038355444, +2348055877540
Department of Educational Psychology School of Education,
Federal College of Education, Zaria Kaduna State of Nigeria
Abstract
The main purpose, among others, in this paper is to examine how effective, or otherwise, the use
of Students’ Evaluation can be a basis for promotion of measurement and evaluation lecturers
in Colleges of Education in Nigeria. On annual basis in Colleges of Education,
administrators/Heads of Departments fill Annual Evaluation Report (APER) as a part of the
overall score for promotion, or otherwise, of lecturers. On the basis of that the researcher feels
that students being closer to lecturers on daily basis, are in a position to know who is effective
among lecturers, and should be allowed to make an impute in the lecturers promotion . A
twenty-six-item questionnaire on a five-point rating scale was developed by the researcher and
validated by two independent lecturers in measurement and evaluation, from FCE ,Zaria and
ABU, Zaria respectively, and used for data collection. A total of 405 copies were produced and
distributed, out of which 390 were correctly filled and returned and used in data analyses.
Using both descriptive and inferential statistical tools, Chi-Square analyses of the tallied copies
show, among other things, that the instrument is significantly very effective in assessing the
teaching performances of the lecturers. It is recommended, among other things, that the
assessments should be done at specified periods and times in all the Departments to avoid halo
effect.
Key Words: Aper, Instrument, Teaching, Assessment and Colleges.
Introduction
The main purpose, among others, in this paper was to examine how effective and relevance, the
use of students’ evaluation of lecturers in Measurement and Evaluation should be in Colleges
of Education in Nigeria. With the apparent fallen standards of education or in examination or
both, teacher or lecturer assessment for effectiveness has become a burning and controversial
issue in Nigeria. This controversy is hinged on two main issues, thus:
a. To justify the relatively enhanced salaries and allowances the lecturers receive at the end of
the month.
b. As an objective tool for promotion and discipline for effectiveness and ineffectiveness
respectively. That objective tool seems to have been found in the use of students evaluation
of lecturers in colleges of Education in Nigeria.
Nigerian Journal of Educational Research and Evaluation
27
The Colleges of Education in Nigeria are charged with the responsibility of providing the
middle manpower teachers needed for both the primary and junior secondary school system
(FRN, 2005). The National Commission for Colleges of Education (NCCE) fashions out a
policy necessary for the full development of teacher education; seeing to the quality of
academic staff; accreditation of NCE courses; certification and other academic awards;
disbursement of funds to the Federal, State and privately-owned Colleges of Education based
on prescribed rules (Lassa, 1998).
The mandate of the NCCE on face value appears relevant, useful, credible and
adequate. Still, there is an evidence that NCE graduates have not distinguished themselves as
having received quality teaching in the Colleges they attended in this present dispensation.
For instance, Ezugwu (1997) observed that many Colleges of Education authorities play
down standards in their recruitment of academic staff, which apparently, bring low quality
products. To this, he advised that all the institutions producing teachers should make sure that
they follow the laid-down minimum standards especially for Colleges of Education and
Universities. This may have prompted Lassa (1998) to recommend that in recruiting
academic staff for Colleges of Education, it has to be a holder of Masters Degree who is
proficient in his field of study. In the same vein Ali, (1998), described academic staff as
highly experienced and frontline scholars in their various disciplines and those who may
utilize the required essential teaching and learning facilities as well as opportunities for
professional and career growth in such system.
Ultimately, it is the responsibilities of the academic staff of the different Colleges to
perform this obvious task creditably. For this goal to be achieved, the lecturers who teach and
perform their academic duties in the Colleges must be effective in doing so. Teaching
effectiveness serves as a benchmark against which measure the performance in the general
preparation of teachers for the task of teaching (Baikie, 2002).
One way of determining if these lecturers are effective is through the appraisal of
their teaching effectiveness. Definitely, there is an annual appraisal exercise known as
“Annual Performance Evaluation Report” (APER) which is filled by every worker annually
for the purposes of promotion. This annual exercise is usually carried out by the superior
officers on their subordinates. This is made possible because they work closely with each
other. As was the practice, the Heads of department and the Deans do the appraisal of the
lecturers or academic staff. Even though they have roles to play in the appraisal exercise,
they should not be the principal actors.
It is clear that students who are always with the lecturers in the classroom are, and
should be in a better position to correctly do the appraisal of the lecturers’ teaching
competence. Hence, the opinion of those who eat the dinner should be considered, if we
want to know how it tastes (Arubayi, 2003). According to Centra (1974), the implication of
this is that students are in a better place to determine who the effective or ineffective lecturer
is. Therefore, the problem of this study put in question form: Is it possible for students to
evaluate the lecturers’ teaching effectiveness in Colleges of Education in Nigeria?
Students’ Evaluation as a Basis for the Promotion of Measurement and Evaluation....
28
A College of Education is primarily designed and programmed to produce middle
manpower needs of the country vis-à-vis teachers who will teach at the Primary School level
with NCE as the minimum qualification. With establishment of Teachers’ Registration Council
of Nigeria (TRCN) charged with the responsibility of regulating teaching as a profession,
inducting education graduates and issuing certificates to them, the status of teachers in Nigeria
appears to have been better enhanced now than before. Bravo to TRCN!
To address the title squarely four null hypotheses were formulated.
1. The instrument for students’ evaluation is not significantly effective in assessing the
Cognitive Performances of measurement and evaluation lecturers in Colleges of Education
in Nigeria.
2. The instrument for students’ evaluation is not significantly effective in assessing the
Affective Performances of the measurement and evaluation lecturers in Colleges of
Education in Nigeria.
3. The instrument for students for students is not significantly effective in assessing the
Psychomotor Performances of the measurement and evaluation lecturers in Colleges of
Education in Nigeria.
Methods
Geo-Political Zones:Nigeria is structured into six Geo-Political Zones:
1. North-East Zone comprising Adamawa, Bauchi, Borno, Gombe, Taraba and Yobe
States.
2. North-Central Zone which is made up of six states and Federal Capital Territory (FCT)
Abuja, Benue, Kogi, Nasarawa, Niger and Plateau States.
3. North-West Zone comprising seven states thus: Jigawa, Kaduna, Kano, Katsina, Kebbi,
Sokoto and Zamfara States.
4. South-East Zone comprising five states: Abia, Anambra, Ebonyi, Enugu and Imo States.
5. South-South Zone consisting of six states: Akwa-Ibom, Cross-River, Bayelsa, Delta, Edo
and Rivers States.
6. South-West Zone which is made up of six states: Ekiti, Lagos, Ogun, Ondo, Osun and
Oyo States.
All the six Geo-Political Zones, Colleges of Education therein and all the Departments of
Educational Psychology, which houses measurement and evaluation comprise the material
population for the study. All the measurement and evaluation students of NCE programme and
their lecturers comprise the human population for the study. From these populations, samples
were drawn.
In specific terms, and according to TRCN, (2011) there are 84 Colleges of Education in
Nigeria partitioned out as follows:
Nigerian Journal of Educational Research and Evaluation
29
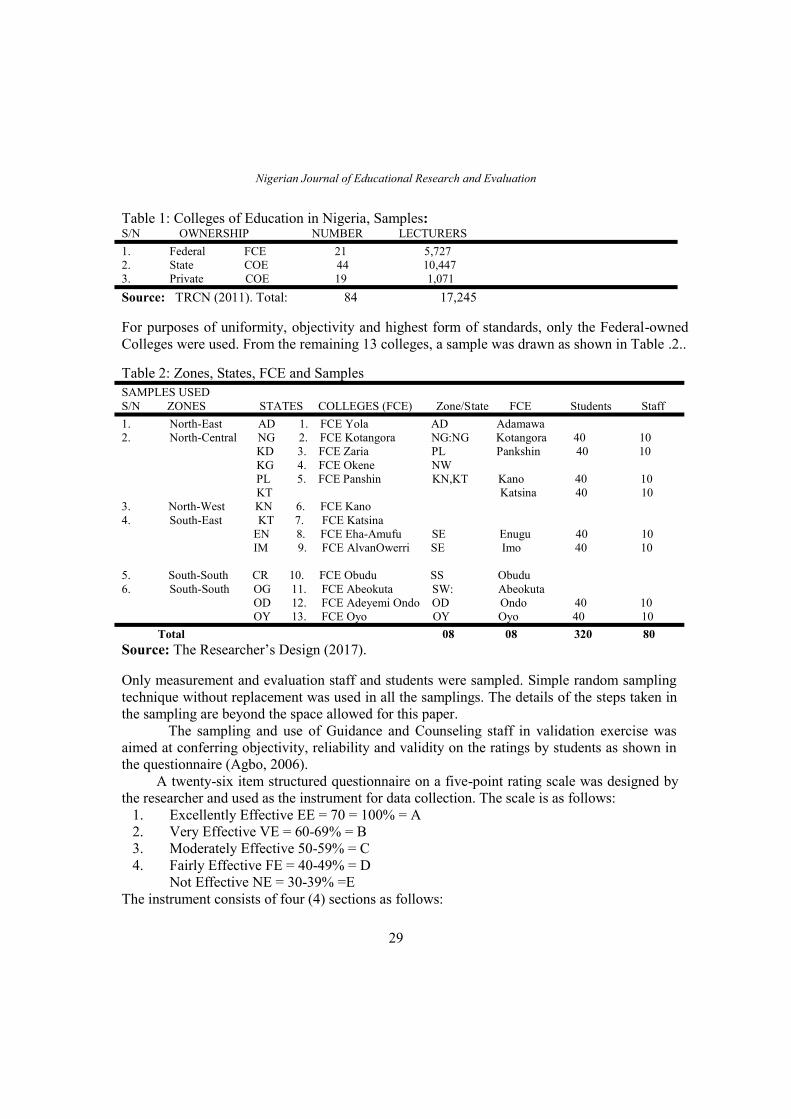
Table 1: Colleges of Education in Nigeria, Samples: S/N OWNERSHIP NUMBER LECTURERS
1. Federal FCE 21 5,727
2. State COE 44 10,447
3. Private COE 19 1,071
Source: TRCN (2011). Total: 84 17,245
For purposes of uniformity, objectivity and highest form of standards, only the Federal-owned
Colleges were used. From the remaining 13 colleges, a sample was drawn as shown in Table .2..
Table 2: Zones, States, FCE and Samples
SAMPLES USED
S/N ZONES STATES COLLEGES (FCE) Zone/State FCE Students Staff
1. North-East AD 1. FCE Yola AD Adamawa
2. North-Central NG 2. FCE Kotangora NG:NG Kotangora 40 10
KD 3. FCE Zaria PL Pankshin 40 10
KG 4. FCE Okene NW
PL 5. FCE Panshin KN,KT Kano 40 10
KT Katsina 40 10
3. North-West KN 6. FCE Kano
4. South-East KT 7. FCE Katsina
EN 8. FCE Eha-Amufu SE Enugu 40 10
IM 9. FCE AlvanOwerri SE Imo 40 10
5. South-South CR 10. FCE Obudu SS Obudu
6. South-South OG 11. FCE Abeokuta SW: Abeokuta
OD 12. FCE Adeyemi Ondo OD Ondo 40 10
OY 13. FCE Oyo OY Oyo 40 10
Total 08 08 320 80
Source: The Researcher’s Design (2017).
Only measurement and evaluation staff and students were sampled. Simple random sampling
technique without replacement was used in all the samplings. The details of the steps taken in
the sampling are beyond the space allowed for this paper.
The sampling and use of Guidance and Counseling staff in validation exercise was
aimed at conferring objectivity, reliability and validity on the ratings by students as shown in
the questionnaire (Agbo, 2006).
A twenty-six item structured questionnaire on a five-point rating scale was designed by
the researcher and used as the instrument for data collection. The scale is as follows:
1. Excellently Effective EE = 70 = 100% = A
2. Very Effective VE = 60-69% = B
3. Moderately Effective 50-59% = C
4. Fairly Effective FE = 40-49% = D
Not Effective NE = 30-39% =E
The instrument consists of four (4) sections as follows:
Students’ Evaluation as a Basis for the Promotion of Measurement and Evaluation....
30
SECTION I. Bio-data of Respondents.
SECTION II. Cognitive Domain Assessment of the lecturers.
SECTION III. Affective Domain Assessment of the lecturers.
SECTION IV. Psychomotor Domain Assessment of lecturers.
Using split-half method, a reliability co-efficient of 0.94 (r =0.94) was established.
A total of 405 copies of the questionnaire were produced and distributed to the respondents by
the Researcher and his four (4) Research Assistants, one from each of the sampled zones. They
waited on the spot to retrieve the copies. The exercise lasted for two weeks. The responses
were tallied and built into simple frequency tables.
Statistical Applications: Descriptive statistics of frequency (f), percentage (%) and (mean x)
were used in analyzing the data.
A Chi-Square statistics was used in testing for significance of effectiveness of the
assessment instrument. Alpha level was set 0.05, one tailed test, for the rejection or otherwise
of the hypotheses.
Results
Of the 405 copies distributed, 390 copies were correctly filled and retrieved. This is represents
96.3% return rate. Therefore, only the 390 copies were used in data analyses (n= 390).
Using a tabular format, the results are presented thus:
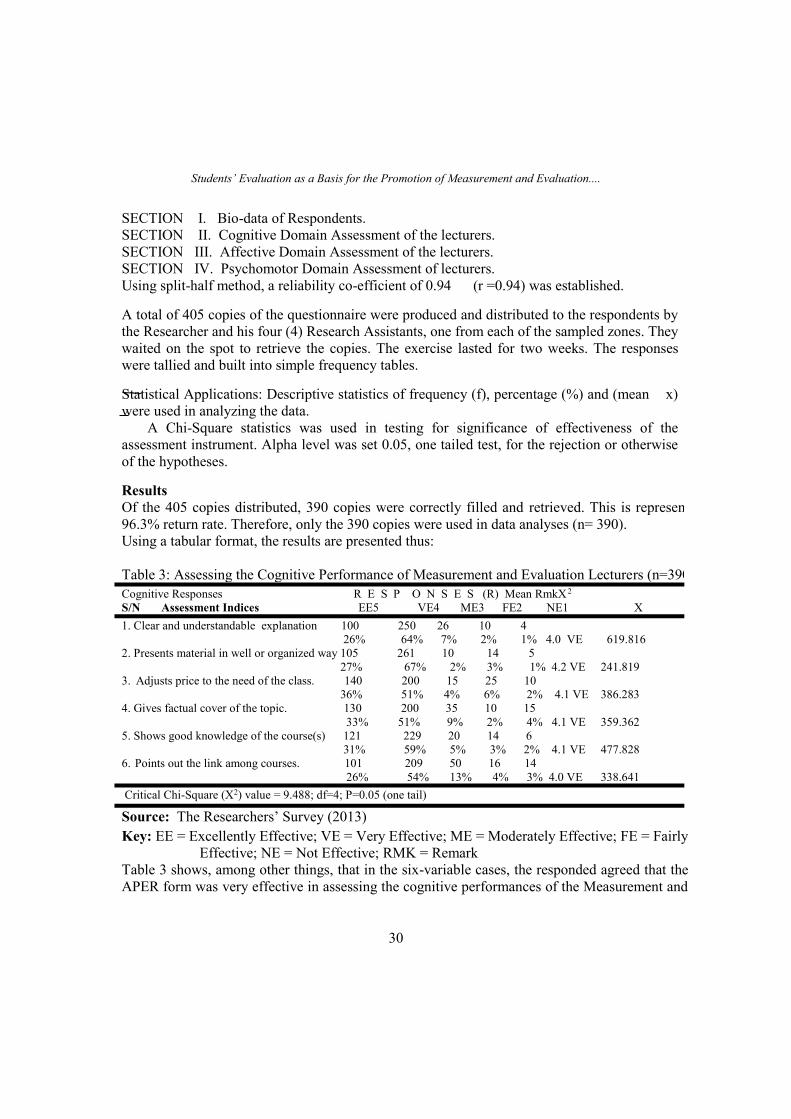
Table 3: Assessing the Cognitive Performance of Measurement and Evaluation Lecturers (n=390)
Cognitive Responses R E S P O N S E S (R) Mean RmkX2
S/N Assessment Indices EE5 VE4 ME3 FE2 NE1 X
1. Clear and understandable explanation 100 250 26 10 4
26% 64% 7% 2% 1% 4.0 VE 619.816
2. Presents material in well or organized way 105 261 10 14 5
27% 67% 2% 3% 1% 4.2 VE 241.819
3. Adjusts price to the need of the class. 140 200 15 25 10
36% 51% 4% 6% 2% 4.1 VE 386.283
4. Gives factual cover of the topic. 130 200 35 10 15
33% 51% 9% 2% 4% 4.1 VE 359.362
5. Shows good knowledge of the course(s) 121 229 20 14 6
31% 59% 5% 3% 2% 4.1 VE 477.828
6. Points out the link among courses. 101 209 50 16 14
26% 54% 13% 4% 3% 4.0 VE 338.641
Critical Chi-Square (X2) value = 9.488; df=4; P=0.05 (one tail)
Source: The Researchers’ Survey (2013)
Key: EE = Excellently Effective; VE = Very Effective; ME = Moderately Effective; FE = Fairly
Effective; NE = Not Effective; RMK = Remark
Table 3 shows, among other things, that in the six-variable cases, the responded agreed that the
APER form was very effective in assessing the cognitive performances of the Measurement and
Nigerian Journal of Educational Research and Evaluation
31
Evaluation lecture’s in the Federal Colleges of Education in Nigeria. This view is reflected in
the mean response of 4.0 and above.
The Table further shows that in all the six cognitive assessment indices, the obtained
Chi-Square (X2) values are by far greater than the critical value of 9.488 at 4 degrees of freedom
and alpha level of 0.05 one tail. Consequently, null hypothesis one (H01) is rejected in each
index. The alternative is accepted.
This implies that the APER form is significantly very effective in assessing the
cognitive performance of the lecturers in the colleges.
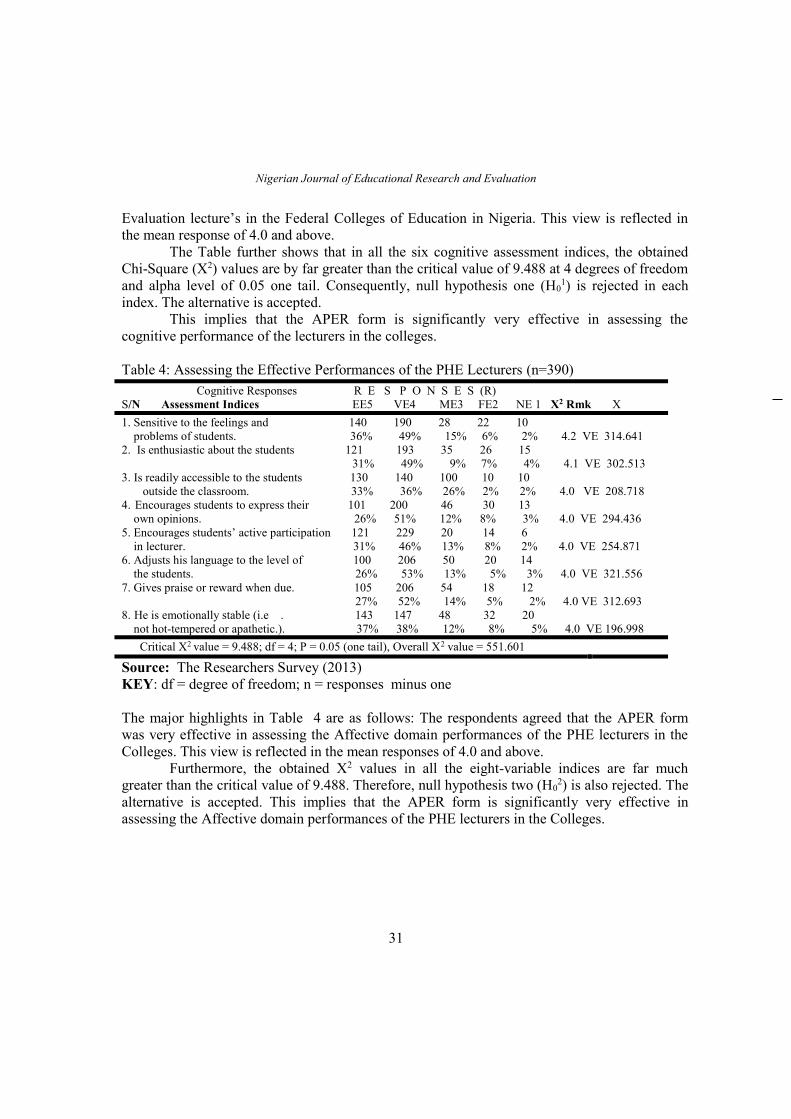
Table 4: Assessing the Effective Performances of the PHE Lecturers (n=390)
Cognitive Responses R E S P O N S E S (R)
S/N Assessment Indices EE5 VE4 ME3 FE2 NE 1 X2 Rmk X
1. Sensitive to the feelings and 140 190 28 22 10
problems of students. 36% 49% 15% 6% 2% 4.2 VE 314.641
2. Is enthusiastic about the students 121 193 35 26 15
31% 49% 9% 7% 4% 4.1 VE 302.513
3. Is readily accessible to the students 130 140 100 10 10
outside the classroom. 33% 36% 26% 2% 2% 4.0 VE 208.718
4. Encourages students to express their 101 200 46 30 13
own opinions. 26% 51% 12% 8% 3% 4.0 VE 294.436
5. Encourages students’ active participation 121 229 20 14 6
in lecturer. 31% 46% 13% 8% 2% 4.0 VE 254.871
6. Adjusts his language to the level of 100 206 50 20 14
the students. 26% 53% 13% 5% 3% 4.0 VE 321.556
7. Gives praise or reward when due. 105 206 54 18 12
27% 52% 14% 5% 2% 4.0 VE 312.693
8. He is emotionally stable (i.e . 143 147 48 32 20
not hot-tempered or apathetic.). 37% 38% 12% 8% 5% 4.0 VE 196.998
Critical X2 value = 9.488; df = 4; P = 0.05 (one tail), Overall X2 value = 551.601
Source: The Researchers Survey (2013)
KEY: df = degree of freedom; n = responses minus one
The major highlights in Table 4 are as follows: The respondents agreed that the APER form
was very effective in assessing the Affective domain performances of the PHE lecturers in the
Colleges. This view is reflected in the mean responses of 4.0 and above.
Furthermore, the obtained X2 values in all the eight-variable indices are far much
greater than the critical value of 9.488. Therefore, null hypothesis two (H02) is also rejected. The
alternative is accepted. This implies that the APER form is significantly very effective in
assessing the Affective domain performances of the PHE lecturers in the Colleges.
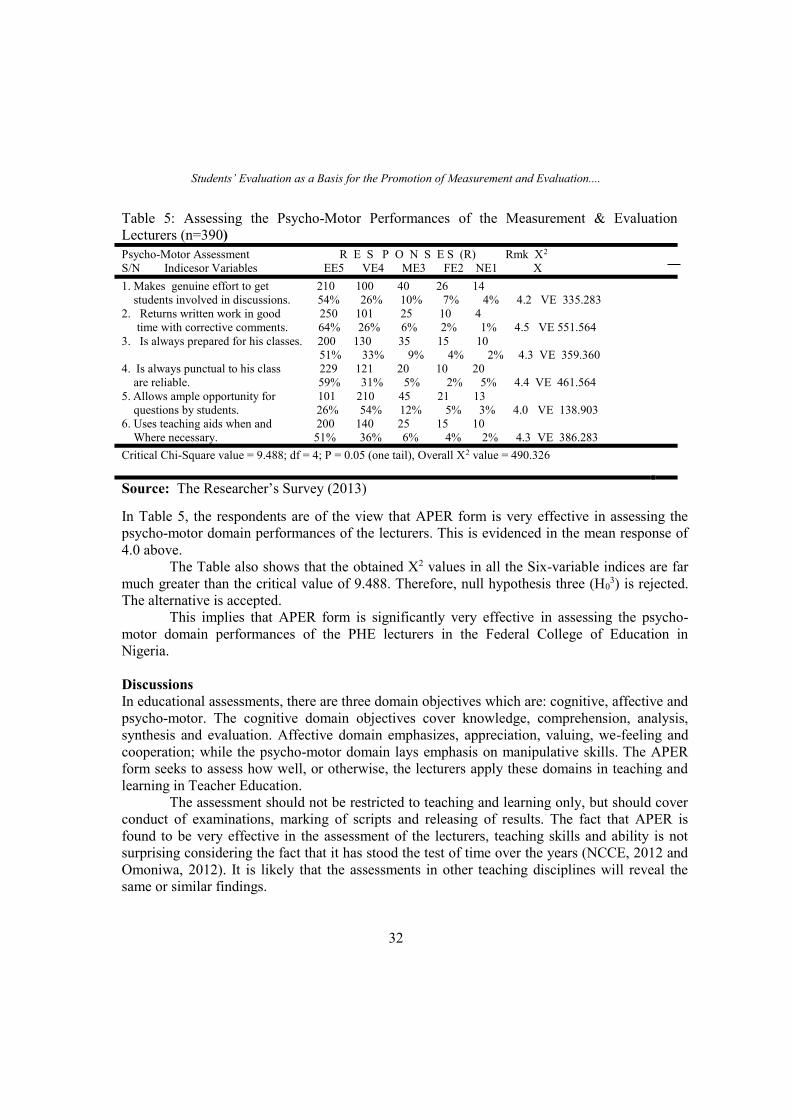
Students’ Evaluation as a Basis for the Promotion of Measurement and Evaluation....
32
Table 5: Assessing the Psycho-Motor Performances of the Measurement & Evaluation
Lecturers (n=390)
Psycho-Motor Assessment R E S P O N S E S (R) Rmk X2
S/N Indicesor Variables EE5 VE4 ME3 FE2 NE1 X
1. Makes genuine effort to get 210 100 40 26 14
students involved in discussions. 54% 26% 10% 7% 4% 4.2 VE 335.283
2. Returns written work in good 250 101 25 10 4
time with corrective comments. 64% 26% 6% 2% 1% 4.5 VE 551.564
3. Is always prepared for his classes. 200 130 35 15 10
51% 33% 9% 4% 2% 4.3 VE 359.360
4. Is always punctual to his class 229 121 20 10 20
are reliable. 59% 31% 5% 2% 5% 4.4 VE 461.564
5. Allows ample opportunity for 101 210 45 21 13
questions by students. 26% 54% 12% 5% 3% 4.0 VE 138.903
6. Uses teaching aids when and 200 140 25 15 10
Where necessary. 51% 36% 6% 4% 2% 4.3 VE 386.283
Critical Chi-Square value = 9.488; df = 4; P = 0.05 (one tail), Overall X2 value = 490.326
Source: The Researcher’s Survey (2013)
In Table 5, the respondents are of the view that APER form is very effective in assessing the
psycho-motor domain performances of the lecturers. This is evidenced in the mean response of
4.0 above.
The Table also shows that the obtained X2 values in all the Six-variable indices are far
much greater than the critical value of 9.488. Therefore, null hypothesis three (H03) is rejected.
The alternative is accepted.
This implies that APER form is significantly very effective in assessing the psycho-
motor domain performances of the PHE lecturers in the Federal College of Education in
Nigeria.
Discussions
In educational assessments, there are three domain objectives which are: cognitive, affective and
psycho-motor. The cognitive domain objectives cover knowledge, comprehension, analysis,
synthesis and evaluation. Affective domain emphasizes, appreciation, valuing, we-feeling and
cooperation; while the psycho-motor domain lays emphasis on manipulative skills. The APER
form seeks to assess how well, or otherwise, the lecturers apply these domains in teaching and
learning in Teacher Education.
The assessment should not be restricted to teaching and learning only, but should cover
conduct of examinations, marking of scripts and releasing of results. The fact that APER is
found to be very effective in the assessment of the lecturers, teaching skills and ability is not
surprising considering the fact that it has stood the test of time over the years (NCCE, 2012 and
Omoniwa, 2012). It is likely that the assessments in other teaching disciplines will reveal the
same or similar findings.
Nigerian Journal of Educational Research and Evaluation
33
Implications in Teacher Education
The merits notwithstanding, due to the unpredictable nature of human behaviour, the APER
form could be subjected to manipulations, abuses and misuses in the areas of favouritism,
vendetta and witch-hunting by administrators in the Public Sector.
Some administrators can use the APER form to unduly favour their “errand boys and
girls” by awarding them unmerited and undeserved high scores. Some can also use it to settle
scores with their perceived imaginary or real “enemies”. It can also be used as a tool for witch-
hunting lecturers who oppose the views of such administrators. In this era of sexual harassments
in campuses, some female students could score lecturers low marks as a way of paying such
lecturers in their own coins.
Conclusions and Recommendations
In this paper, it has been established that the APER form is a very effective instrument in
assessing the cognitive, Affective and Psycho-motor domains of teaching performances of
Measurement and Evaluation Lecturers in Colleges of Education in Nigeria. Consequently, it
stands a very veritable and reliable tool for use by both students and administrators in the Public
Sector in assessing the teaching performances of lecturers within and outside the classroom in
Teacher Education.
Therefore, it is recommended as follows: In this era of Computer Revolution, the APER
form should be revised every year to increase its objectivity; reliability as well as both face and
content validities.
Only students who have spent at least one academic session should qualify to participate
in the assessment of the lecturers with regard to academic, social and psychological maturity
and experiences.
The APER form should continue to be used by students to assess the teaching
performances of lecturers not only in Measurement and Evaluation, but in other teaching-
learning disciplines in Teacher Education.
There should be specified periods and times for the assessments to avoid halo effects.
References
Agbo, AA (2006). Evaluation Research for Political Applications; Enugu: Chestron Publishers.
Ezugwu, G.G. (1998). Monitoring Teachers’ production in Colleges of Education:
Implication for Primary Education in the 21st Century Nigeria. Journal of Problems
Solving in Education 1,(1)
Federal College of Education, Zaria (2012).Revised Annual Performance Evaluation Report
(APER); Zaria: FCEZ.
Federal Government of Nigeria (1998).Annual Performance Evaluation Report (APER); Lagos:
Federal Ministry of Information.
Federal Ministry of Education (2006).Annual Performance Evaluation Report (APER); Abuja:
Federal Government Press.
Students’ Evaluation as a Basis for the Promotion of Measurement and Evaluation....
34
Lassa, P.N. (1998). Vision and Mission of Teacher Education in Nigeria. Kaduna. NCCE
Publications.
National Commission for Colleges of Education (2012).Revised Edition of Annual Performance
Evaluation Report; Abuja: NCCE.
Omoniwa, O. (2012). “A Memo Presented to Members of the Academic Board during the 101th
Meeting on the Revised Edition of the APER Form on Tuesday 31st July.
Teachers Registration Council of Nigeria (2011). Statistical Digest of Teachers in Nigeria;
TRCN for Quality Education, Vol.6, Abuja: TRCN.
Values Re-Orientation In Enhancing Girl Child School Participation In Jema’a Local Government Area
35
VALUES RE-ORIENTATION IN ENHANCING GIRL CHILD SCHOOL
PARTICIPATION IN JEMA’A LOCAL GOVERNMENT AREA OF
KADUNA STATE, NIGERIA.
Comfort K. Bakau
Ministry of Education Kaduna State.
08022667567 [email protected]
James N. Bature
Department of Educational Foundations,
Faculty of Education, University of Jos, Jos.
08063184325 [email protected]
&
Bawa John
Department of Educational Foundations,
Federal University Kashere, Gombe.
08034016897 [email protected]
Abstract
This study investigated cultural values/values education and community participation in
enhancing school retention of girls in Jema’a Local Government Area of Kaduna State,
Nigeria; so as to provide solution to the problem of girls’ retention in school and completing
of programme of study for national and global participation. Two research questions guided
the study. The descriptive survey was used following an Action Research Plan. A targeted
311 respondents in the area of study consisting of various groups in the community made up
the population at the survey from which a sample of 174 and 64 respondents were drawn at
the “Look” and “Think” Stages respectively. Two instruments namely Data on Records
(DOR) and Factors and Solution to Girls Retention in School (FSGRS) were used for data
collection. The validity of the instruments was determined by three experts in the Faculty of
Education, University of Jos. Data collected was analyzed using percentages, frequency
counts and rank ordering to answer the research questions. The study revealed among other
findings that there is a break down in the cultural values in the communities studied. It was
recommended that community leaders should reinvent and articulate measures of enforcing
the cultural values on community members, especially the girls.
Keywords: Values re-orientation, Community participation and Retention.
Introduction
Girl-child of school age will be the wife, mother and member of her wider society tomorrow.
She will be expected to perform certain roles/responsibilities in her community. To equip her
for effective living as well as to develop her potential for self, family, community and
Nigerian Journal of Educational Research and Evaluation
36
national development, she needs to be educated. But certain cultural issues seem to
undermine her participation in school; issues such as male preference, roles expected of girls,
religious misinterpretation, the fear of girls becoming pregnant and too independent if sent to
school. Values that were once regarded as important in our communities such as the care for
each other, respect for elders, obedience to constituted authorities, parental care, value placed
on virginity and shame at becoming pregnant out of wedlock, to mention but a few, seem to
be absent in most of our communities today.
Cultural/religious issues are important indices in determining girl-child participation
in school. The attitude of parents determine to a large extent who to invest in with regards to
education. Some believe that investing in boys is more beneficial since they are more
intelligent than girls and perform better (Umar, 2009). However, Sada, Adamu and Ahmad
(2004) are of the view that it is more of a preference for the male-child as found in most
African countries. They observe that in Northern Nigeria the issue is closely linked to that of
inheritance of family assets. According to this tradition, investing in the boy child who would
remain within the family is better than “wasting” the resources on the girl who would
eventually marry and go to another man’s house. In Chad for example, some parents believe
that their daughters will be driven to prostitution if they are sent to school while in some
parts of Cameroun, educated girls are seen to be too independent and likely to challenge the
traditional role expected of them in marriage (Cammish & Brock in Odaga & Heneveld,
1995).Others believe that educated girls are a disgrace to the community because they
usually may not get married to men in the community who may be less educated than them.
Studies by UNESCO (2006) showed that after participation in some cultural rites,
some girls find it difficult to return to school. Genital mutilation for girls in southern Nigeria,
and early marriage and teenage pregnancy in the North are some of the cultural practices
hindering girls’ attendance and retention in school. After participating in these social
festivals, they usually find it difficult to return to school. For some, it is the feeling that they
have attained some level of maturity and can no longer accept discipline from the school
authority. Others, however, feel uneasy associating with those pupils who might not have
undergone such cultural rites.
Religious misinterpretation especially in Islam and Christianity has negative effects
on girl-child education. Adeyanju (2008) posits that this misinterpretation is more prevalent
among parents of Islamic faith, who fear that their daughters will be converted to Christianity
if sent to schools where western education could be acquired (since formal education has
long been associated with Christianity). Girls are indoctrinated early in life to believe that
fulfillment in life is not found in getting formal western education (Oleribe, 2008) but in
marrying early, having children and making one’s husband happy. To such girls, education is
not a priority. They wait eagerly for the arrival of the man who would marry them. Anderson,
Bloch and Soumare (in Odaga & Heneveld, 1995) report that in Guinea, religious beliefs
hinder children especially girls from attending public schools. They report that in some
villages, no children were sent to school at all while in some, parents prefer to send their
children to Koranic schools. More boys than girls are often sent to public schools with the
Values Re-Orientation In Enhancing Girl Child School Participation In Jema’a Local Government Area
37
belief that girls only need to learn ‘prayers’. The girls sent to the Koranic schools spend
shorter years than the boys. Cammish and Brock (in Odaga & Heneveld, 1995) reported that
although the seclusion of women and their low status is justified by men as being Islamic in
northern Cameroun, elite Muslim families in urban areas educate their daughters with
enthusiasm. Those parents who believe that schooling undermines their daughters’ religious
beliefs are based in the rural areas. The Christian faith, according to Kwashi (1997) teaches
the oneness of male and female as found in Galatians 3:28 which states: “There is neither
Jew or Greek, slave nor free, male nor female for we are all one in Christ Jesus”. The
researcher observes, however, that the truth of this teaching is usually overshadowed by
cultural practices in most communities which often give rise to unequal treatment especially
when it comes to educational opportunities given to males and females.
Girls are given out as brides in Ethiopia with possibility of early pregnancy and the
responsibility to their in-laws and husbands will not allow them access to school. Mgwangi
in Offorma (2009) reported that in Kenya, girl child education is hindered by factors such as
backward cultural practices, poverty and disease. Also, child marriage, house chores, death
of a mother and looking after sick family members keep girls from school despite the
introduction of free primary education in the country. Most of the girls are usually given out
in marriage against their wish by the parents for a bride price. The reason given by some
parents is to avoid girls bringing shame to the family by becoming pregnant outside
marriage. Girls are given early in marriage (sometimes forcefully), they become pregnant,
take family responsibilities which do not allow them access to school. Backward cultural
practices such as parents fearing that girls will become pregnant at home thereby bringing
shame to them and that an educated girl is a disgrace to the community among others,
apparently constrain commitments to enrol and support the girl child to complete circle of
educational programmes. Early pregnancy/marriage are factors that affect school retention of
girls. Aku (2011) and Ajaja (2012)observed that 30% of Nigerian teenagers drop out of
school having already begun child-bearing. Once they become pregnant, it becomes difficult
for them to continue in school. School retention rate is low among these girls; very few of
them are able to return to school and complete their education.
The need to revisit and reinvent our values that we once held in high regard cannot
be overemphasized. Speaking on value reorientation, Ogude (2017) observed that all is not
well with our nation and that the values that were once held dearly belong to another era:
values such as honesty, integrity, good neighbourliness, religious tolerance that once defined
our society are no longer practiced. For the girl child to be retained in school, there is need
for values re-orientation where those cultural issues that seem to undermine her participation
in school are articulated and addressed. In doing so, girl child will be enrolled and retained in
school to complete at any given level of education.
Low retention of girls in school, if left unchecked, will have implications not only for
the girls but also the family, community and the nation at large. It makes great negative
impact on the education, employment and income earning opportunity of the girls later in
life. It is not only girls that pay for early marriage but also the society as a whole; population
Nigerian Journal of Educational Research and Evaluation
38
pressure, health care costs and loss of opportunity of human development (because of lack of
education) are just a few of the growing burdens that society shoulders because of teenage
pregnancies (Aku, 2011; Ajaja, 2012). There is need, therefore, for all stakeholders to work
collaboratively to ensure that the girl child is not only enrolled in school but retained until
she completes a given level of education and transits to the next.
The Ecological Systems Theory (EST) usually credited to Bronfenbrenner (1979)
was used to underpin this study. The Ecological Systems Theory emphasizes that:
(1) there are environmental factors that play important role in an individual’s
development from birth to adulthood,
(2) there is interaction between these systems, none operates in isolation and
(3) working together, they influence one’s behaviour and outlook on life.
The relevance of the Ecological Systems Theory to this work is that it was used to collect
data by engaging the various clusters of the community members in identifying, defining,
categorizing and discussing respondents’ views on the factors undermining school retention
of girls in the community and to suggest solutions.
Girls in Kaduna state need to complete school for self and national development.
But this has not been the case as many girls (over the years) are not retained in school to
complete a given level of education, mainly as a result of some cultural factors. The
implication of low retention of girls in school in Jema’a LGA is that it has contributed to the
non-realization of the objectives of the National Policy on Education (NPE), the Education
for All (EFA) and the education-related Millennium Developments Goals (MDGs) of
providing education for all school age children by 2015. Also, with many girls not retained
in school, Jema’a LGA is in danger of producing illiterate mothers in future; those incapable
of making meaningful contributions to self, family, community and national development.
There is also the problem of low self esteem among the girls and loss of life-time
opportunities for development as provided in the NPE. There is the need to create a
conducive environment for the retention of girls in schools today. How can community
participation through values reorientation enhance school retention of girls in Jema’a LGA
of Kaduna State?
The purpose of the study is to examine community participation through values
reorientation in enhancing girl child retention in Junior Secondary Schools in Jema’a Local
Government Area of Kaduna State. The objectives of the study are to:
1. Find out the retention rate of girls in junior secondary schools in Jema’a Local
Government Area of Kaduna State.
2. Find out what the community believes are the factors affecting girl child retention in
Junior Secondary Schools in Jema’a LGA.
Method
This study employed the descriptive survey, following an Action Research Plan of “Look”
and “Think” stages. The descriptive survey design followed the Look and Think stages of the
Values Re-Orientation In Enhancing Girl Child School Participation In Jema’a Local Government Area
39
Action Research Plan. The purpose was to gather baseline data by identifying and defining
the factors undermining school retention of girls in the communities under investigation and
to identify effective intervention based on those factors. Jema’a Local Government Area of
Kaduna State has a population of 278,202 by the 2006 population census (Kaduna State
Population Statistics, 2016). Community members from two communities (n1 and n2)
comprising of community leaders, teachers, girls, boys, women and men formed the
population for the study (311 at the survey stage). The choice of this population was
informed by the existing clusters in the communities by these groupings. This fitted well into
the nature of the study that required interaction (from start to finish) with these various
clusters in the communities. The breakdown of the targeted population in n1and n2
respectively is as follows: community leaders (18 & 26), teachers (35 & 35), girls (24 & 24),
boys (24 & 24), women (24 & 24), and men (24 & 24). The rationale for the inclusion of all
the clusters is that they are the representatives of the various groups in the communities.
Therefore, their views can reflect those of their group members. The sample at the Look
Stage consisted of 174 community members (community leaders, teachers, girls, boys,
women and men; (n1 = 92 & n2 = 82). The distribution of the sample at the Look Stage for
communities n1 and n2 respectively are: community leaders (15 & 24), teachers (13 & 11),
girls (14 & 7), boys (24 & 14), women (20 & 15) and men (7 & 11). The sample for the
Focus Group Discussion was 64 community members; this number was further narrowed
down for effective analysis of data collected during the interview sessions. Out of the number
left, some were chosen as their districts representatives. The purpose was to get community
members to participate in the process of reviewing, identifying and analyzing the data
collected. Two instruments were used for data collection namely; Data on Records (DOR)
and Factors and Solutions to Girls Retention in School (FSGRS). DOR was used to collect
data on enrolment and progression of JSS1-3 girls from 10 schools for a five year period
(2010-2016) to compute the retention rate of the girls. FSGRS consisted of various interview
schedules for the different clusters of respondents identified for the interview: community
leaders, teachers, girls, boys, women and men. Interview sessions were held at individual
levels. Questions asked were mostly open ended to allow interviewees express freely their
opinions on the issues under investigation. At the focus group discussion, questions similar to
those on FSGRS were asked to guide categorization, analysis and discussion of the interview
responses. Data collected was analyzed using frequency counts, percentages and rank
ordering to answer the research questions.
Results
What is the retention rate of girls in junior secondary schools (JSS) in Jema'a Local
Government Area (LGA) of Kaduna State? Data on enrolment and progression was collected
from 10 schools over a five-year period (2010–2016). Retention rates were computed by
cohorts in each school, then the overall rate for the LGA. The retention rate is presented in
Table 1.
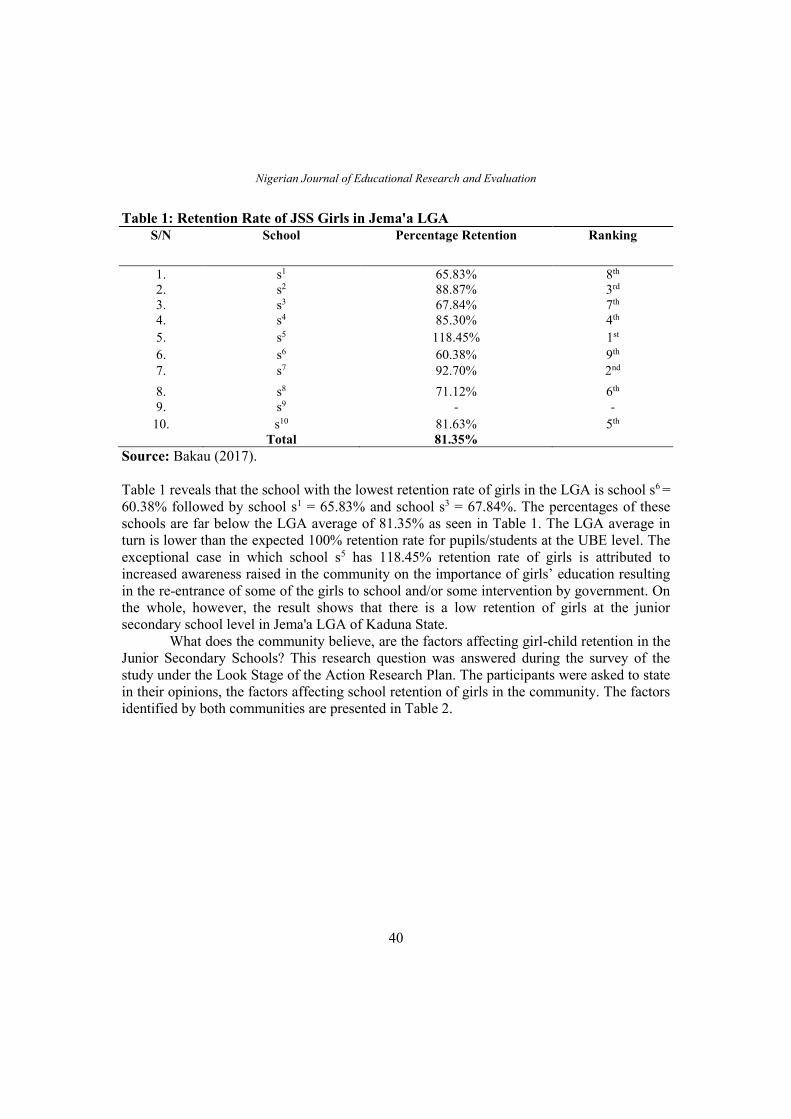
Nigerian Journal of Educational Research and Evaluation
40
Table 1: Retention Rate of JSS Girls in Jema'a LGA
S/N School Percentage Retention Ranking
1. s1 65.83% 8th
2. s2 88.87% 3rd
3. s3 67.84% 7th
4. s4 85.30% 4th
5. s5 118.45% 1st
6. s6 60.38% 9th
7. s7 92.70% 2nd
8. s8 71.12% 6th
9. s9 - -
10. s10 81.63% 5th
Total 81.35%
Source: Bakau (2017).
Table 1 reveals that the school with the lowest retention rate of girls in the LGA is school s6 =
60.38% followed by school s1 = 65.83% and school s3 = 67.84%. The percentages of these
schools are far below the LGA average of 81.35% as seen in Table 1. The LGA average in
turn is lower than the expected 100% retention rate for pupils/students at the UBE level. The
exceptional case in which school s5 has 118.45% retention rate of girls is attributed to
increased awareness raised in the community on the importance of girls’ education resulting
in the re-entrance of some of the girls to school and/or some intervention by government. On
the whole, however, the result shows that there is a low retention of girls at the junior
secondary school level in Jema'a LGA of Kaduna State.
What does the community believe, are the factors affecting girl-child retention in the
Junior Secondary Schools? This research question was answered during the survey of the
study under the Look Stage of the Action Research Plan. The participants were asked to state
in their opinions, the factors affecting school retention of girls in the community. The factors
identified by both communities are presented in Table 2.
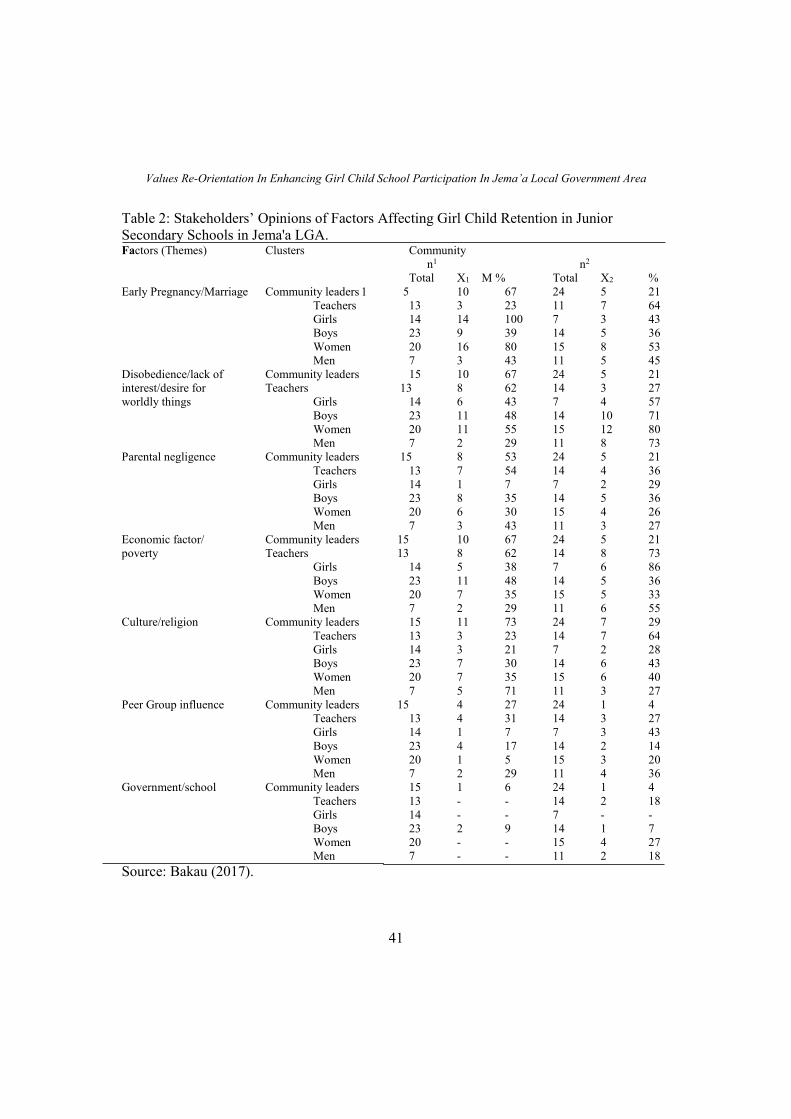
Values Re-Orientation In Enhancing Girl Child School Participation In Jema’a Local Government Area
41
Table 2: Stakeholders’ Opinions of Factors Affecting Girl Child Retention in Junior
Secondary Schools in Jema'a LGA. Factors (Themes) Clusters Community
n1 n2
Total X1 M % Total X2 %
Early Pregnancy/Marriage Community leaders 1 5 10 67 24 5 21
Teachers 13 3 23 11 7 64
Girls 14 14 100 7 3 43
Boys 23 9 39 14 5 36
Women 20 16 80 15 8 53
Men 7 3 43 11 5 45
Disobedience/lack of Community leaders 15 10 67 24 5 21
interest/desire for Teachers 13 8 62 14 3 27
worldly things Girls 14 6 43 7 4 57
Boys 23 11 48 14 10 71
Women 20 11 55 15 12 80
Men 7 2 29 11 8 73
Parental negligence Community leaders 15 8 53 24 5 21
Teachers 13 7 54 14 4 36
Girls 14 1 7 7 2 29
Boys 23 8 35 14 5 36
Women 20 6 30 15 4 26
Men 7 3 43 11 3 27
Economic factor/ Community leaders 15 10 67 24 5 21
poverty Teachers 13 8 62 14 8 73
Girls 14 5 38 7 6 86
Boys 23 11 48 14 5 36
Women 20 7 35 15 5 33
Men 7 2 29 11 6 55
Culture/religion Community leaders 15 11 73 24 7 29
Teachers 13 3 23 14 7 64
Girls 14 3 21 7 2 28
Boys 23 7 30 14 6 43
Women 20 7 35 15 6 40
Men 7 5 71 11 3 27
Peer Group influence Community leaders 15 4 27 24 1 4
Teachers 13 4 31 14 3 27
Girls 14 1 7 7 3 43
Boys 23 4 17 14 2 14
Women 20 1 5 15 3 20
Men 7 2 29 11 4 36
Government/school Community leaders 15 1 6 24 1 4
Teachers 13 - - 14 2 18
Girls 14 - - 7 - -
Boys 23 2 9 14 1 7
Women 20 - - 15 4 27
Men 7 - - 11 2 18
Source: Bakau (2017).
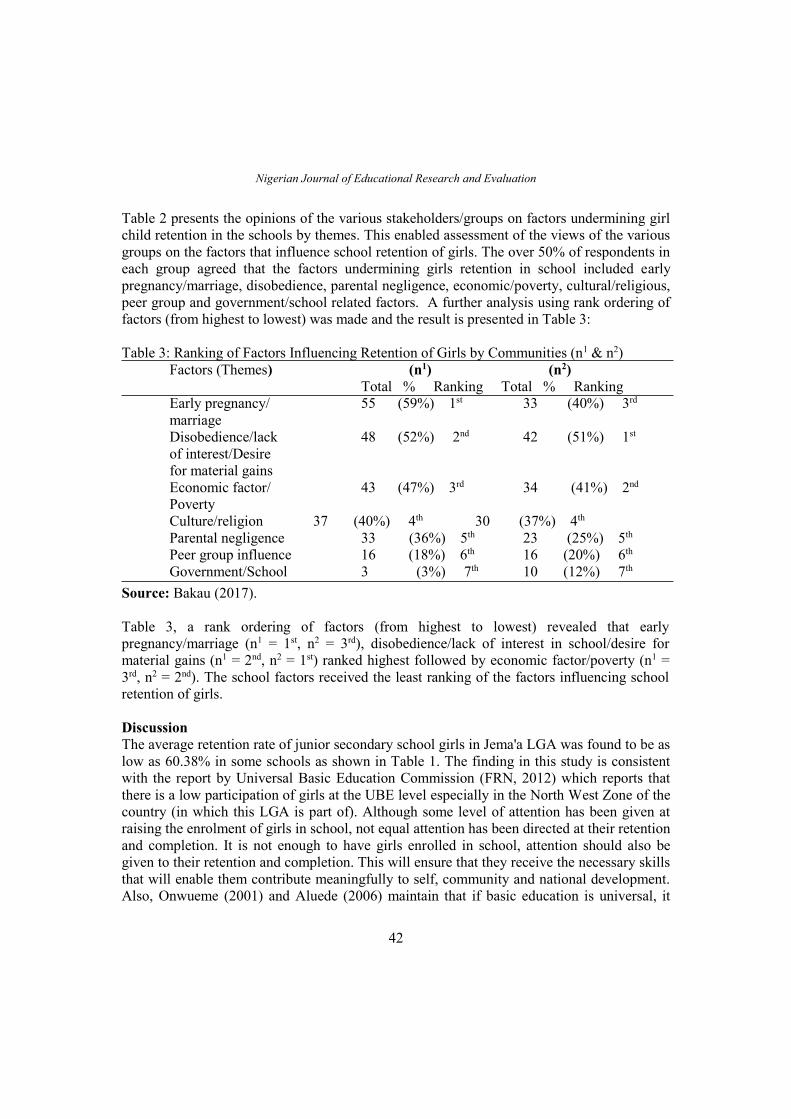
Nigerian Journal of Educational Research and Evaluation
42
Table 2 presents the opinions of the various stakeholders/groups on factors undermining girl
child retention in the schools by themes. This enabled assessment of the views of the various
groups on the factors that influence school retention of girls. The over 50% of respondents in
each group agreed that the factors undermining girls retention in school included early
pregnancy/marriage, disobedience, parental negligence, economic/poverty, cultural/religious,
peer group and government/school related factors. A further analysis using rank ordering of
factors (from highest to lowest) was made and the result is presented in Table 3:
Table 3: Ranking of Factors Influencing Retention of Girls by Communities (n1 & n2)
Factors (Themes) (n1) (n2)
Total % Ranking Total % Ranking
Early pregnancy/ 55 (59%) 1st 33 (40%) 3rd
marriage
Disobedience/lack 48 (52%) 2nd 42 (51%) 1st
of interest/Desire
for material gains
Economic factor/ 43 (47%) 3rd 34 (41%) 2nd
Poverty
Culture/religion 37 (40%) 4th 30 (37%) 4th
Parental negligence 33 (36%) 5th 23 (25%) 5th
Peer group influence 16 (18%) 6th 16 (20%) 6th
Government/School 3 (3%) 7th 10 (12%) 7th
Source: Bakau (2017).
Table 3, a rank ordering of factors (from highest to lowest) revealed that early
pregnancy/marriage (n1 = 1st, n2 = 3rd), disobedience/lack of interest in school/desire for
material gains (n1 = 2nd, n2 = 1st) ranked highest followed by economic factor/poverty (n1 =
3rd, n2 = 2nd). The school factors received the least ranking of the factors influencing school
retention of girls.
Discussion
The average retention rate of junior secondary school girls in Jema'a LGA was found to be as
low as 60.38% in some schools as shown in Table 1. The finding in this study is consistent
with the report by Universal Basic Education Commission (FRN, 2012) which reports that
there is a low participation of girls at the UBE level especially in the North West Zone of the
country (in which this LGA is part of). Although some level of attention has been given at
raising the enrolment of girls in school, not equal attention has been directed at their retention
and completion. It is not enough to have girls enrolled in school, attention should also be
given to their retention and completion. This will ensure that they receive the necessary skills
that will enable them contribute meaningfully to self, community and national development.
Also, Onwueme (2001) and Aluede (2006) maintain that if basic education is universal, it
Values Re-Orientation In Enhancing Girl Child School Participation In Jema’a Local Government Area
43
implies that all children of the said age bracket, without exception, irrespective of gender or
geographical location, should be in school. But this is not the case in Jema'a LGA as evident
in the worrisomely low percentage (as low as 60.38%) of school age girls being retained in
school in some cases.
Community members’ beliefs of the factors affecting school retention of girls were
found to be many. These include socio-cultural factors, early pregnancy/marriage and
parental negligence among others.
Socio-cultural factors were identified by respondents (40%, 4th); (37%, 4th) in
communities n1 and n2 respectively as influencing school retention of girls as shown in Table
3. Some of the interview responses were:
Breakdown of the family structure is at the centre of girls drop out from
school.
Some girls do not sleep at home and the parents care-less.
There is no fear of God in the girls.
Some parents prefer sending boys not girls to school.
These findings are consistent with the studies of Sada, Adamu and Ahmad (2004) who found
that preference for the male child as found in most African countries and also in Northern
Nigeria is closely linked to the issue of the inheritance of family assets. According to this
tradition, investing in a boy who would remain within the family, is better than wasting the
scarce resources on the girl who would eventually marry and go to another man’s house.
Bukoye (2007) also found that parental preference for the male-child is a major factor
hindering girl-child participation in school with a mean score of 3.85. Further, Adeyanju
(2008) observed that religious and cultural misinterpretation have negative effects on girls’
education. According to him, this misinterpretation is more prevalent among parents of the
Islamic faith who fear that their daughters will be converted to Christianity if sent to western
education schools.
The findings of this study also revealed that teenage pregnancy and early marriage
are major factors affecting school retention of girls (n1 = 1st, n2 = 3rd) as seen in Table 3.
Some views expressed by the respondents were:
I am a victim, my daughter is pregnant.
Some girls see their mate marry so they want to compete, I will also marry.
The girls go wayward and become pregnant so drop out of school.
This finding is consistent with the works of Obeng-Denteh and Amedeker (2011) and Uche
(2013) which found that teenage pregnancy is a major factor in school drop out of girls (with
both studies having mean scores of 74%) and that most of the girls who drop out of school
are at the junior secondary school level of education.
Nigerian Journal of Educational Research and Evaluation
44
Conclusion
There is low retention of girls in junior secondary schools in Jema’a Local Government Area
of Kaduna State. This is evident by the worrisomely low retention rates found in some
schools that participated (as low as 60.38% in some cases).
The phenomenon of low retention of girls in school is of concern to Jema’a LGA in
particular and the nation at large. Low retention of girls means that the LGA is at risk of
having illiterate adult women in future, who are incapable of making meaningful
contribution to self and national development. This situation calls for urgent and appropriate
interventions by all stakeholders to ensure that girls do not only enroll but are retained in
school. This could be done through value re-orientation that will ensure that cultural issues
that have constrained girls’ participation in school are identified and interventions are
articulated to address them. These issues include among others: male preference, parental
neglect and early pregnancy/marriage due largely to lack of the fear of God, disobedience to
constituted authority and community/parental neglect of their roles.
Recommendations
1 Educational policy planners should rise to the challenge of low school retention of
girls by partnering with communities to articulate strategies at enhancing retention of
girls in school. This way girls will be retained in school.
2 Given the dynamics of the society, solutions at enhancing school retention of girls in
communities should be suggested by community members. In doing so, communities
will not feel that the solutions were imposed on them from outside, but that they are
the owners of such suggestions.
3 Community Opinion Molders should highlight and ensure compliance with the roles
of each group in the community. In this way everyone becomes an active participant
(not α passive on-looker) at ensuring that girls remain to complete school in the
community.
References
Adeyanju, T.K. (2008). Challenges to ensuring equity participation in education in the
northern states. A paper presentation at the Northern Governors’ pre-summit
workshop on repositioning education in the Northern States. Challenges for the 21st
Century. Arewa House, Kaduna, 14th-15th April.
Ajaja, O.P. (2012). School dropout pattern among senior secondary schools in Delta State
Nigeria. International Education Studies, 5(2), 145-153.
Aku, P.S. (2011). Girl child pregnancy: Problems and prevention. Zaria: Depeak Publishers.
Alika, I.H., & Egbochukwu, E.O. (2009). Dropout from school among girls in EdoState:
Implications for counselling. Edo Journal of Counselling, 2(2), 135-141.
Aluede, R.O.A. (2006). Universal basic education in Nigeria: Matters arising. Journal of
Human Ecology, 20(2), 97-101.
Values Re-Orientation In Enhancing Girl Child School Participation In Jema’a Local Government Area
45
Bakau, C.K. (2017). Community participation and girl child retention in junior secondary
schools in Jema’a Local Government Area of Kaduna State, Nigeria. (Unpublished
Doctoral thesis), Faculty of Education, University of Jos, Jos.
Bello, H.M. (2006). The Nigerian women in quest for peace and stability: Challenge to
Teacher Education. Journal of Educational Studies,12(1), 1-6.
Bukoye, R.O. (2007). Factors militating against girl- education in Nigeria: Implication for
counselling. The Nigerian Journal of Guidance and Counselling, 2(1), 4-6.
Bronferbrenner, U. (1979). The ecology of human development: Experiments by nature and
design. Cambridge: Harvard University Press.
Creswell J.W. (2012). Educational research, planning, conducting and evaluating and
quantifying research (4th ed.). Boston: Pearson Education, Inc.
Federal Republic of Nigeria (2013). National policy on education (6th edition). Lagos:
NERDC Press.
Gimba, V.K., & Ayodele, J. (2014). The socio-economic effect of early marriage in northern
Nigeria. Mediterranean Journal of Social Sciences, 5(14), 582-592.
Kwashi, B.A. (1997). Religious and cultural constraints in the education of the girl-child: A
Christian perspective. In family support prograamme (Ed.). Girl-child development
on the Plateau (pp. 61-66). Ibadan: Heinemann Educational Books.
Obaji, C.N. (2005). Nigeria’s experience with girls’ education and linkages with action on
adult literacy to impact on poverty alleviation. United Nations Girl’s Education
Initiative. Technical Consultation Beijing, China, 26th – 27th November.
Obeng-Denteh, W., & Amedeker, M.A. (2001). Causes and effects of female school drop
outs and the financial impact on government budget. Case study: Ayeduase
Township, Ghana. Continental Journal of Social Sciences, 4 (2), 1-7.
Odaga, A., & Heneveld, W. (1995). Girls and schools in sub-Saharan Africa from analysis to
action. Washington, D.C: The World Bank.
Offorma, G.C. (2009). Girl-child education in Africa. A Keynote Address presented at the
Conference of the Federation of the University Women of Africa. Lagos-Nigeria,
16th – 19th July.
Ogude, E. (2017). Value re-orientation in Nigeria: The role of women as change agents.
International Journal of Innovative Social Sciences & Human Resources, 5 (1): 36-
41.
Oleribe, O. E. (2007). Neglect of girl-child education: Bridging the Gap. A case study of a
Nigerian agrarian northern community. International NGP Journal, 2 (2), 30-35.
Onwueme, M.S. (2001). Management of the free and compulsory education in Nigeria:
Issues and problems. In N. A. Nwagwu, E. T. Ehiametalor, M. A. Ogunu & M.
Nwadiani (Eds). Current issues in educational management in Nigeria. A publication
of Nigerian Association of Educational Administration and Planning (NAEAP)(pp.
12-22). Benin City: Ambik Press Ltd.
Osuola, E.C. (2001). Introduction to research methodology. Onitsha: Africana Feb
Publishers.
Nigerian Journal of Educational Research and Evaluation
46
Sada, I.N., Adamu, F.L., & Ahmad, A. (2004). Promoting women’s right through Sharia in
northern Nigeria. ABU Zaria: Centre for Islamic Legal Studies.
Stringer, E. T. (2007). Action Research (3rd ed.). California: Sage Publications Inc.
Uche, R. D. (2013). Drop out syndrome among girls in secondary schools and human
resources development in Nigeria. Journal of Education and Practice,4, 26.
Umar, F. M. (2008). Impediments in girl children’s enrolment and retention in schools. A
Paper presented at a conference on Girl-Child Education in Nigeria. Kaduna, 5th – 6th
August.
UNESCO (2006). Winning people’s will for girl-child education: Community mobilization
for gender equality in basic education. Retrieved March 6, 2013 from
http://www.unesco.org/kathmandu.
UNICEF Information Sheet (2007). Girls’ education. Nigeria Country Office.
Universal Basic Education Commission (2012). 2010 national personnel audit
report. Abuja:
.
Assessment of Quality of Teacher-Made Geography Tests Used for Senior Secondary School Students....
47
ASSESSMENT OF QUALITY OF TEACHER-MADE GEOGRAPHY TESTS USED
FOR SENIOR SECONDARY SCHOOL STUDENTS IN JOS, PLATEAU STATE
Sayita Sarah G. Wakjissa
[email protected] (08031146318)
Department of Educational Foundations, Faculty of Education, University of Jos
Abstract
The rapid improvement in technology calls for changes in our educational programmes,
including assessment strategies so as to equip students with learning and success levels that
involve knowledge construction and application of skills as found in real world. Quality
instruction and assessment produce authentic results of student mastery level. The issues of
quality accountability in education are vital to the improvement of education and can only be
realized through quality assessment. The study assesses the quality of teacher-made tests
constructed for use by secondary school teachers in Jos. The cross sectional survey design
was adopted where 20 schools were randomly selected out of the 58 secondary schools in Jos
North and South local government areas of Plateau State. The instruments used for data
collection were the 2017 geography test questions used for SSII students in the selected
schools. Six research question were formulated for the study. The research questions were
answered using frequency counts and simple percentages. The findings of the study revealed
that the geography tests questions constructed by the teachers mostly assessed lower levels
thinking. The test items were mostly multiple-choice items and most of the test items
constructed did not employ the use of action verbs and the instructions were inadequate in
some of the tests. The tests lacked content validity and the test length were inadequate in
some schools. It was also found that few of the items were not logically arranged in order of
difficulty and content areas. The findings revealed that the teacher’s quality of tests were
independent of their qualifications and years of experience. The study recommended among
others that the Plateau State+ Ministry of Education should employ test experts and post to
schools and should organise seminars and workshops on how to teachers in the state could
construct quality tests in geography for the students.
Key words: Assessment, teacher made test, authentic results, validity.
Introduction
The quality of any education system depends a great deal on accountability. One of the ways
by which accountability in education is derived is through assessment of learners’ level of
mastery which is obtained from assessment tools such as quizzes, assignments, projects,
examinations and tests among others. The desire for school effectiveness and improvement at
all levels of education calls for quality assessment in the school system for improving
teaching and learning. Assessment plays a central role in the school system because it
produces results that are used for improving teaching and learning as well as for placement
Nigerian Journal of Educational Research and Evaluation
48
and certification of students. Measuring the achievement of students is a vital process for
improving students’ learning. This is because decisions on students are based on feedback
derived from results of instruments (tests) used to measure students’ level of mastery
(achievement) in schools. Two types of tests that are used in assessing student learning are
teacher-made tests which are tests developed by classroom teachers and standardized test
which are the tests developed by subject and tests experts, examining bodies and curriculum
planners.
Classroom assessment is an integral part of instruction. It involves a day-by-day
appraisal of learning contents based on the expected learning outcomes. Most of the tests
developed and used in schools for monitoring learning progress are the teacher-made tests.
Classroom tests are developed and used by teachers for formative and summative purposes.
Formative tests are those given in the course of instruction or programme and are used to
monitor teaching and learning progress and are referred to as assessment for learning.
Summative tests on the other hand are tests given at the end of instruction, a course or
programme and are termed as assessment of learning. The results are of summative tests are
used for the purpose of grading, promotion and certification of learners. It is used by teachers
as part and parcel of the teaching and learning process to monitor learning progress and
diagnose students’ areas of difficulty so as to provide remediation. Furthermore, classroom
assessments provide feedback that would enable students adjust how they are learning or for
teachers to adjust how they are teaching (Frey, n.d.). Teacher-made tests are the primary
tools used in determining student learning that dominate the assessments used for decisions
about learners, regardless of the purpose, education level or subject area (Oescher & Kirby,
1990).
There is the assumption that students’ performance in teacher-made tests can be used
to predict their potential performance in standardized tests such as external examinations
(Kinyua &.Okunya, 2014). This is because as a day-by-day method of assessing student
learning, the teacher-made tests regularly inform students about their progress in learning and
they are encouraged to learn better due to the feedback they receive from the teacher-made
tests (Wrightstone, 1961). Teacher-made tests serve as part of the learning process because
they are usually criterion-referenced tests that are designed to assess student mastery of a
specific body of knowledge. By implication, the thinking is that if students perform well in
teacher-made tests, then they are more likely to earn good grades in external examinations.
The relevance accorded to teacher-made demands that such tests should be valid,
reliable and objective for any meaningful decisions to occur (Ugodulunwa & Wakjissa,
2016). Hence, there is the need for teachers to develop quality test items that will produce
valid and reliable results for proper decision making. The key to teacher-made tests is to
make them part of instruction - not separate from it. Teachers should follow valid item-
writing rules in order to construct quality teacher-made tests. They should construct test
items using tables of specifications which specifically outline the topics students have been
exposed (taught) for the period under review and how many items will be allocated the topics
covered as suggested in the guidelines for quality classroom test item writing rules. Due to
Assessment of Quality of Teacher-Made Geography Tests Used for Senior Secondary School Students....
49
the need for developing quality teacher-made test items, experts have made great
advancements in providing all that is needed to develop quality tests in schools. For instance,
test construction has been built into the course contents of teacher training programmes under
the Research, Measurement and Evaluation (RME) units of faculties of education in the
universities, colleges of education and related teacher training institutions and programmes to
equip teachers on training to quality test construction procedures. The course equips teachers
on how to construct quality test items using action verbs including how to allocate items on a
test based on contents and behavioural objectives set for the topics under consideration. The
course is intended to provide teachers with the necessary skills needed to develop quality
tests that would provide results of student learning could serve for proper decision-making
about learners. The guidelines for writing teacher-made tests as identified by Ugodulunwa,
2008; Kinyua, 2012 are:
1. Determine the purpose of the test.
2. Outline the topics to cover in the test
3. Make an outline of the instructional objectives.
4. Develop a table of specifications
5. Write relevant test items.
6. Select appropriate item format; vary the question types (true/false, fill-in-the-blank,
multiple choice, essay, matching). Limit to 10 questions per type.
7. Arrange the questions from simple to complex.
8. Group item types together.
9. Give point values for each section (e.g., true/false count for two points each).
10. Type or print clearly. (Leave space between questions to facilitate easy reading and
writing.)
11. Make sure appropriate reading (language) level is used.
12. Include a variety of visual, oral and kinesthetic tasks.
13. Make allowances for students with special needs.
14. Give students some choice in the questions they select (e.g., choice of graphic organizers
or essay questions).
15. Give clear directions for each section of the test.
Despite all the efforts made at developing quality tests, it is worrisome that when practicing
teachers are asked about the quality of tests they develop, they seem to indicate lack of
confidence about the effectiveness and validity their test items. Furthermore, researches have
shown that teacher-made tests are flawed and characterized by the following: having about
80% of their items constructed at the lower level of Bloom’s taxonomy of cognitive
objectives, using of short and ambiguous items, grammatical errors and lack of direction
among others (Oescher & Kirby, 1990; Wakjissa, 2011). There is little assurance as to
whether the tests serve the purpose for which they are designed. In addition, there seem to be
problems on how prepared, committed and dedicated teachers are to their tasks of test item
Nigerian Journal of Educational Research and Evaluation
50
construction. Teachers need to understand that they can assure quality only when they
believe that it is in their power to improve student learning.
The foregoing implies that assessment derives learning and that the use of quality assessment
tools is inevitable because it is assessment results that are used to judge whether mastery has
occurred or not (Griwold, 1990; Henard & Leprince-Ringuet, 2008). Thus, there is the call on
teachers to construct valid and reliable test items that are comprehensive, precise and
adequate so enable them evaluate properly the learning objectives. Hence, the present study
assesses the quality of teacher-made geography tests constructed for use in secondary schools
in Jos north and Jos south LGAs of Plateau State. The study will assess the quality of
teacher-made test items in terms of the test item types used, frequency of use of various item
types, use of action verbs in developing test items, length of the tests, cognitive objectives
covered by the tests, test item format, test instructions, teachers’ qualifications and years of
experience. Five research questions were posed to aid the study.
1. What are the types of test items used by the teachers in constructing their test items?
2. To what extent do the teachers employ the use of action verbs in constructing their test
items?
3. To What extent do the teachers’ test items cover the content areas intended by the tests?
4. To what extent do the teachers’ tests cover the six levels of cognitive objectives of
Bloom’s taxonomy?
5. To what extent are the test formats in compliance with test item writing rules?
6. How adequate and clear are the test instructions of the teachers?
Method
The study was a descriptive survey geared towards assessing the quality of tests constructed
and used by geography teachers in senior secondary schools in Jos North/South LGAs of
Plateau State. Twenty secondary schools out of the 58 secondary schools in the study area
were selected using a table of random digits. The teachers and their test items were used for
the study. Five out of the 20 teachers had M.Sc. (Ed/ PGDE), 11 had B.Sc. (Ed) and four
were holders of NCE. Out of these teachers, three had between 1-5 years teaching
experience, eight had 6-10 years teaching experience while nine had 11plus teaching
experience. The SSII geography test questions constructed by the geography teachers in the
20 schools were the instruments used for the study. Six research questions were formulated
to guide the study. The research questions sought the quality of the geography tests based on
the senior secondary school two (SSSII) geography curriculum for compliance with test item
writing rules in terms of content coverage among others. The five variables assessed in the
study were; the length of the tests (with particular emphasis on content areas and behavioural
objectives covered by the tests), item types used, action verbs used in developing the test
items, levels cognitive objective covered by the tests, formatting of the test items and test
instructions. These were rated using a five-point scale of excellent, very good, good, fair and
poor rated as 5, 4, 3, 2 & 1 respectively while very adequate, adequate and inadequate were
employed in rating the adequacy and clarity of the test instructions. The study also looked
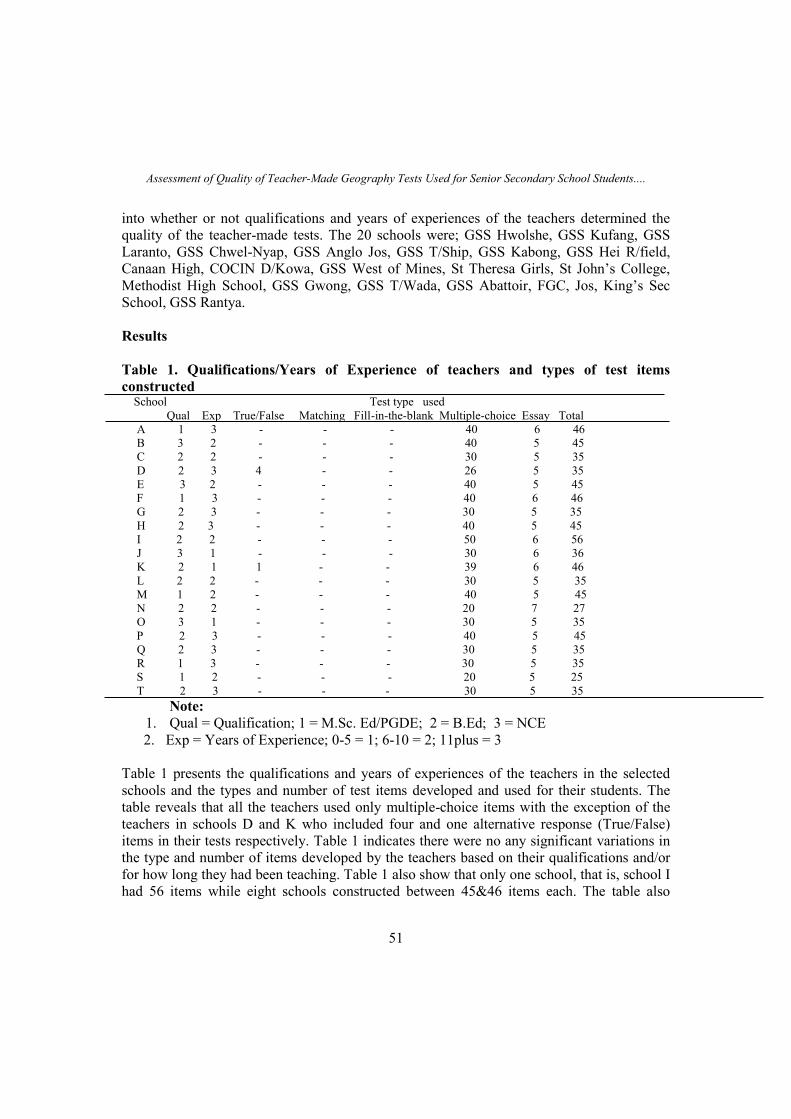
Assessment of Quality of Teacher-Made Geography Tests Used for Senior Secondary School Students....
51
into whether or not qualifications and years of experiences of the teachers determined the
quality of the teacher-made tests. The 20 schools were; GSS Hwolshe, GSS Kufang, GSS
Laranto, GSS Chwel-Nyap, GSS Anglo Jos, GSS T/Ship, GSS Kabong, GSS Hei R/field,
Canaan High, COCIN D/Kowa, GSS West of Mines, St Theresa Girls, St John’s College,
Methodist High School, GSS Gwong, GSS T/Wada, GSS Abattoir, FGC, Jos, King’s Sec
School, GSS Rantya.
Results
Table 1. Qualifications/Years of Experience of teachers and types of test items
constructed School Test type used
Qual Exp True/False Matching Fill-in-the-blank Multiple-choice Essay Total
A 1 3 - - - 40 6 46
B 3 2 - - - 40 5 45
C 2 2 - - - 30 5 35
D 2 3 4 - - 26 5 35
E 3 2 - - - 40 5 45
F 1 3 - - - 40 6 46
G 2 3 - - - 30 5 35
H 2 3 - - - 40 5 45
I 2 2 - - - 50 6 56
J 3 1 - - - 30 6 36
K 2 1 1 - - 39 6 46
L 2 2 - - - 30 5 35
M 1 2 - - - 40 5 45
N 2 2 - - - 20 7 27
O 3 1 - - - 30 5 35
P 2 3 - - - 40 5 45
Q 2 3 - - - 30 5 35
R 1 3 - - - 30 5 35
S 1 2 - - - 20 5 25
T 2 3 - - - 30 5 35
Note:
1. Qual = Qualification; 1 = M.Sc. Ed/PGDE; 2 = B.Ed; 3 = NCE
2. Exp = Years of Experience; 0-5 = 1; 6-10 = 2; 11plus = 3
Table 1 presents the qualifications and years of experiences of the teachers in the selected
schools and the types and number of test items developed and used for their students. The
table reveals that all the teachers used only multiple-choice items with the exception of the
teachers in schools D and K who included four and one alternative response (True/False)
items in their tests respectively. Table 1 indicates there were no any significant variations in
the type and number of items developed by the teachers based on their qualifications and/or
for how long they had been teaching. Table 1 also show that only one school, that is, school I
had 56 items while eight schools constructed between 45&46 items each. The table also
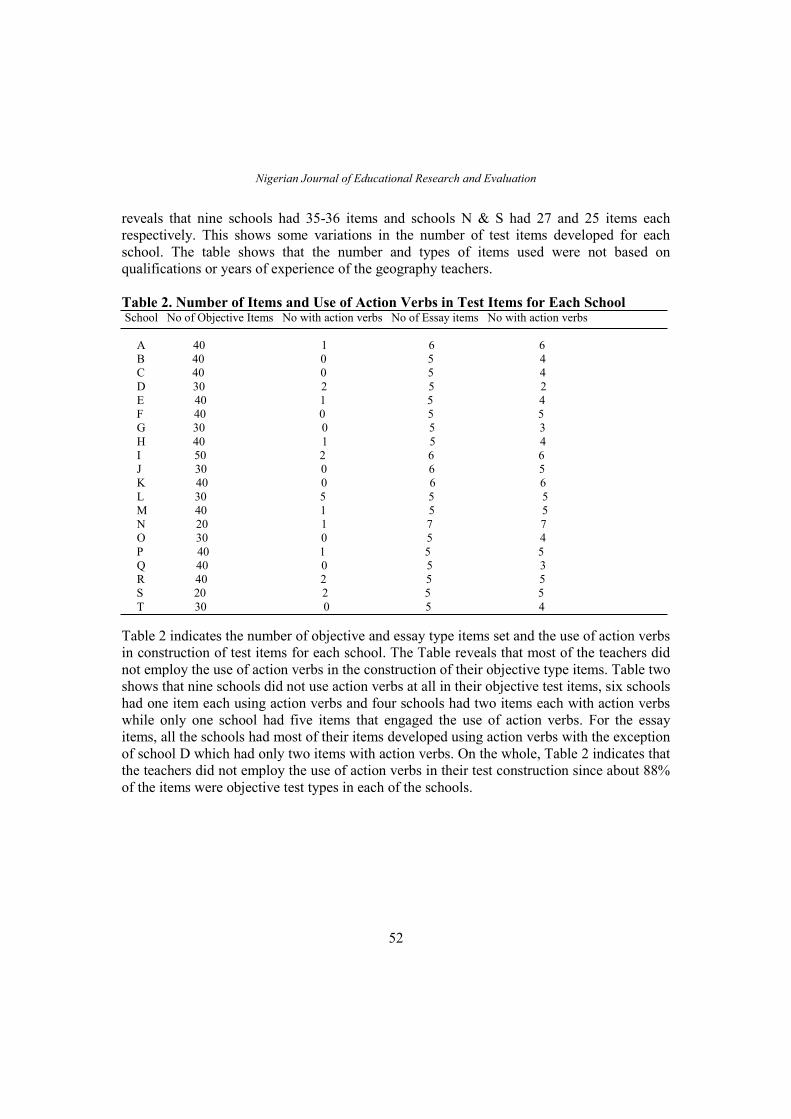
Nigerian Journal of Educational Research and Evaluation
52
reveals that nine schools had 35-36 items and schools N & S had 27 and 25 items each
respectively. This shows some variations in the number of test items developed for each
school. The table shows that the number and types of items used were not based on
qualifications or years of experience of the geography teachers.
Table 2. Number of Items and Use of Action Verbs in Test Items for Each School School No of Objective Items No with action verbs No of Essay items No with action verbs
A 40 1 6 6
B 40 0 5 4
C 40 0 5 4
D 30 2 5 2
E 40 1 5 4
F 40 0 5 5
G 30 0 5 3
H 40 1 5 4
I 50 2 6 6
J 30 0 6 5
K 40 0 6 6
L 30 5 5 5
M 40 1 5 5
N 20 1 7 7
O 30 0 5 4
P 40 1 5 5
Q 40 0 5 3
R 40 2 5 5
S 20 2 5 5
T 30 0 5 4
Table 2 indicates the number of objective and essay type items set and the use of action verbs
in construction of test items for each school. The Table reveals that most of the teachers did
not employ the use of action verbs in the construction of their objective type items. Table two
shows that nine schools did not use action verbs at all in their objective test items, six schools
had one item each using action verbs and four schools had two items each with action verbs
while only one school had five items that engaged the use of action verbs. For the essay
items, all the schools had most of their items developed using action verbs with the exception
of school D which had only two items with action verbs. On the whole, Table 2 indicates that
the teachers did not employ the use of action verbs in their test construction since about 88%
of the items were objective test types in each of the schools.
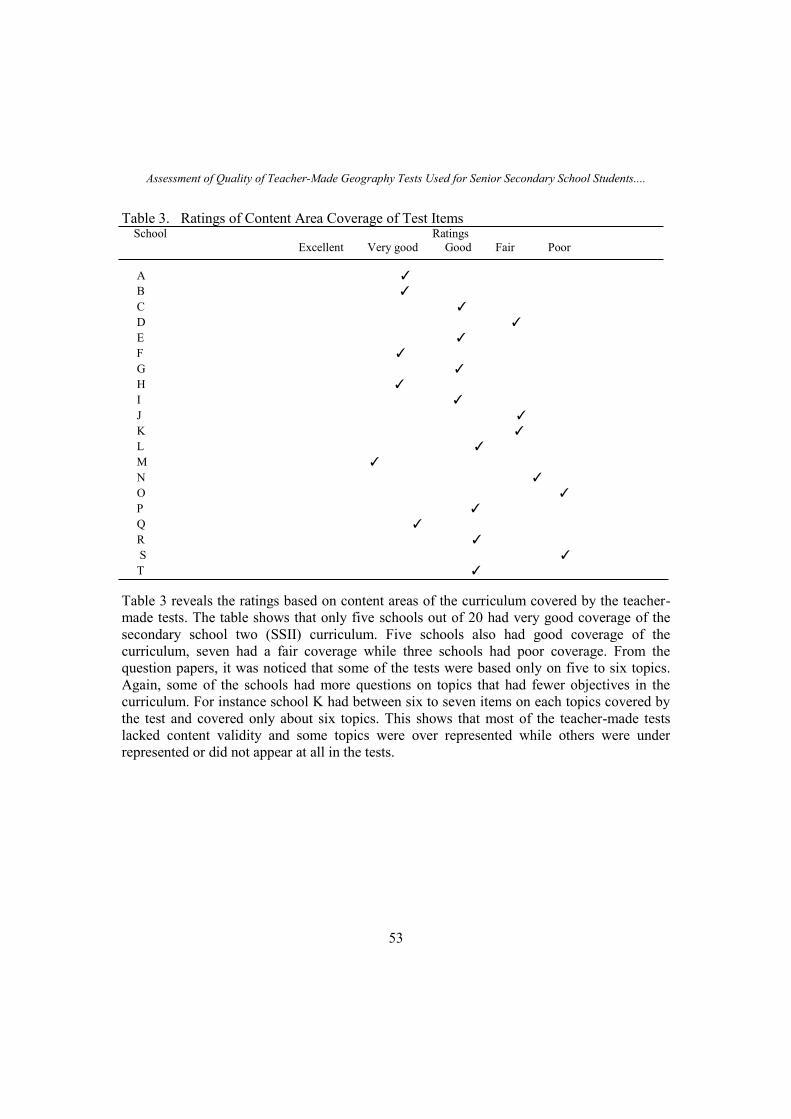
Assessment of Quality of Teacher-Made Geography Tests Used for Senior Secondary School Students....
53
Table 3. Ratings of Content Area Coverage of Test Items School Ratings
Excellent Very good Good Fair Poor
A ✓
B ✓
C ✓
D ✓
E ✓
F ✓
G ✓
H ✓
I ✓
J ✓
K ✓
L ✓
M ✓
N ✓
O ✓
P ✓
Q ✓
R ✓
S ✓
T ✓
Table 3 reveals the ratings based on content areas of the curriculum covered by the teacher-
made tests. The table shows that only five schools out of 20 had very good coverage of the
secondary school two (SSII) curriculum. Five schools also had good coverage of the
curriculum, seven had a fair coverage while three schools had poor coverage. From the
question papers, it was noticed that some of the tests were based only on five to six topics.
Again, some of the schools had more questions on topics that had fewer objectives in the
curriculum. For instance school K had between six to seven items on each topics covered by
the test and covered only about six topics. This shows that most of the teacher-made tests
lacked content validity and some topics were over represented while others were under
represented or did not appear at all in the tests.
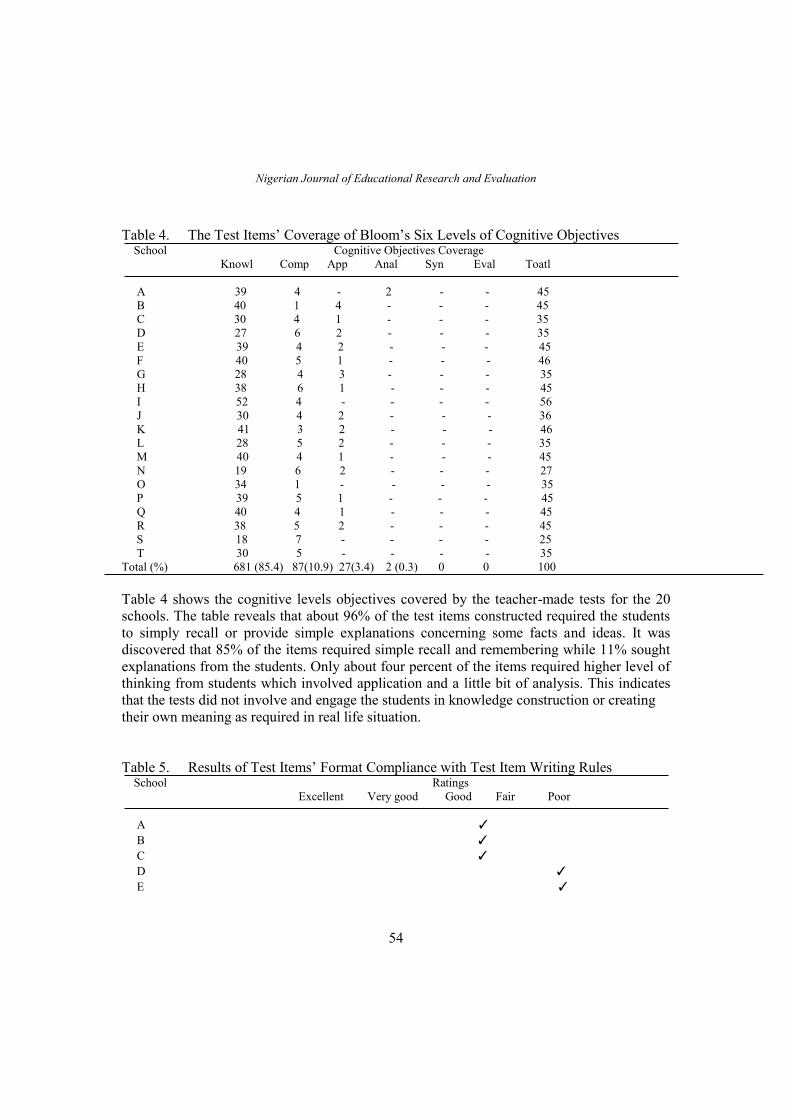
Nigerian Journal of Educational Research and Evaluation
54
Table 4. The Test Items’ Coverage of Bloom’s Six Levels of Cognitive Objectives School Cognitive Objectives Coverage
Knowl Comp App Anal Syn Eval Toatl
A 39 4 - 2 - - 45
B 40 1 4 - - - 45
C 30 4 1 - - - 35
D 27 6 2 - - - 35
E 39 4 2 - - - 45
F 40 5 1 - - - 46
G 28 4 3 - - - 35
H 38 6 1 - - - 45
I 52 4 - - - - 56
J 30 4 2 - - - 36
K 41 3 2 - - - 46
L 28 5 2 - - - 35
M 40 4 1 - - - 45
N 19 6 2 - - - 27
O 34 1 - - - - 35
P 39 5 1 - - - 45
Q 40 4 1 - - - 45
R 38 5 2 - - - 45
S 18 7 - - - - 25
T 30 5 - - - - 35
Total (%) 681 (85.4) 87(10.9) 27(3.4) 2 (0.3) 0 0 100
Table 4 shows the cognitive levels objectives covered by the teacher-made tests for the 20
schools. The table reveals that about 96% of the test items constructed required the students
to simply recall or provide simple explanations concerning some facts and ideas. It was
discovered that 85% of the items required simple recall and remembering while 11% sought
explanations from the students. Only about four percent of the items required higher level of
thinking from students which involved application and a little bit of analysis. This indicates
that the tests did not involve and engage the students in knowledge construction or creating
their own meaning as required in real life situation.
Table 5. Results of Test Items’ Format Compliance with Test Item Writing Rules School Ratings
Excellent Very good Good Fair Poor
A ✓
B ✓
C ✓
D ✓
E ✓
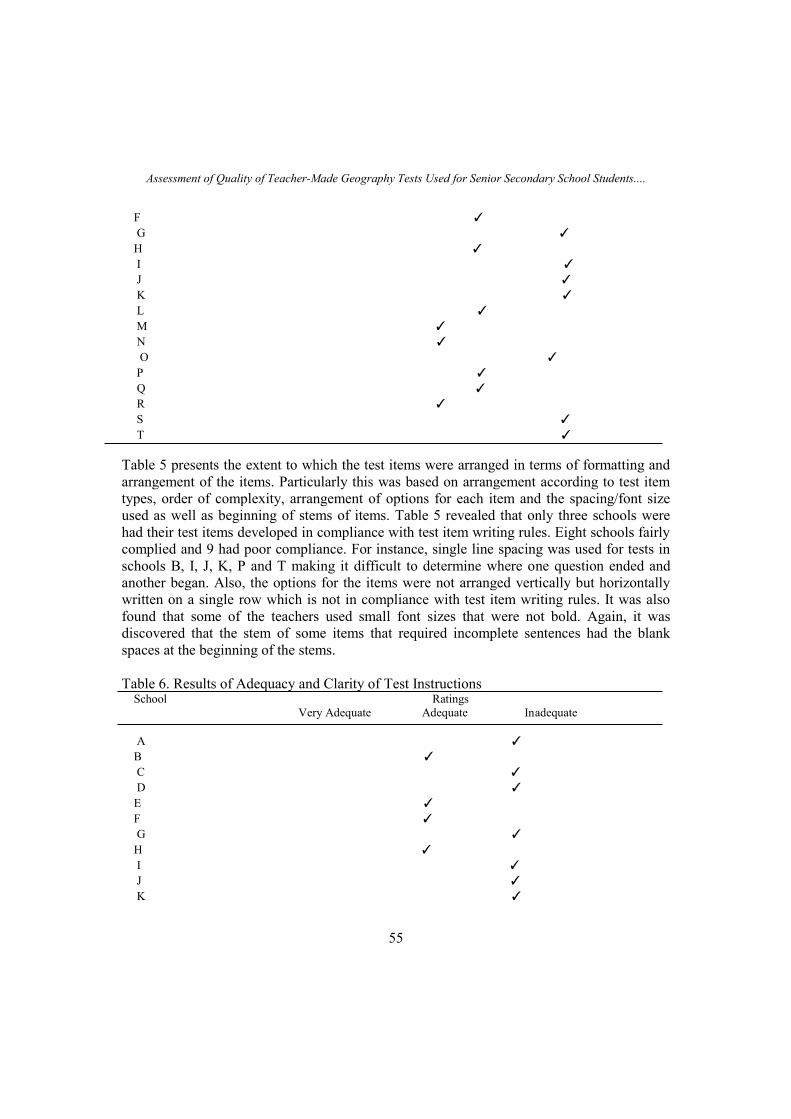
Assessment of Quality of Teacher-Made Geography Tests Used for Senior Secondary School Students....
55
F ✓
G ✓
H ✓
I ✓
J ✓
K ✓
L ✓
M ✓
N ✓
O ✓
P ✓
Q ✓
R ✓
S ✓
T ✓
Table 5 presents the extent to which the test items were arranged in terms of formatting and
arrangement of the items. Particularly this was based on arrangement according to test item
types, order of complexity, arrangement of options for each item and the spacing/font size
used as well as beginning of stems of items. Table 5 revealed that only three schools were
had their test items developed in compliance with test item writing rules. Eight schools fairly
complied and 9 had poor compliance. For instance, single line spacing was used for tests in
schools B, I, J, K, P and T making it difficult to determine where one question ended and
another began. Also, the options for the items were not arranged vertically but horizontally
written on a single row which is not in compliance with test item writing rules. It was also
found that some of the teachers used small font sizes that were not bold. Again, it was
discovered that the stem of some items that required incomplete sentences had the blank
spaces at the beginning of the stems.
Table 6. Results of Adequacy and Clarity of Test Instructions School Ratings
Very Adequate Adequate Inadequate
A ✓
B ✓
C ✓
D ✓
E ✓
F ✓
G ✓
H ✓
I ✓
J ✓
K ✓
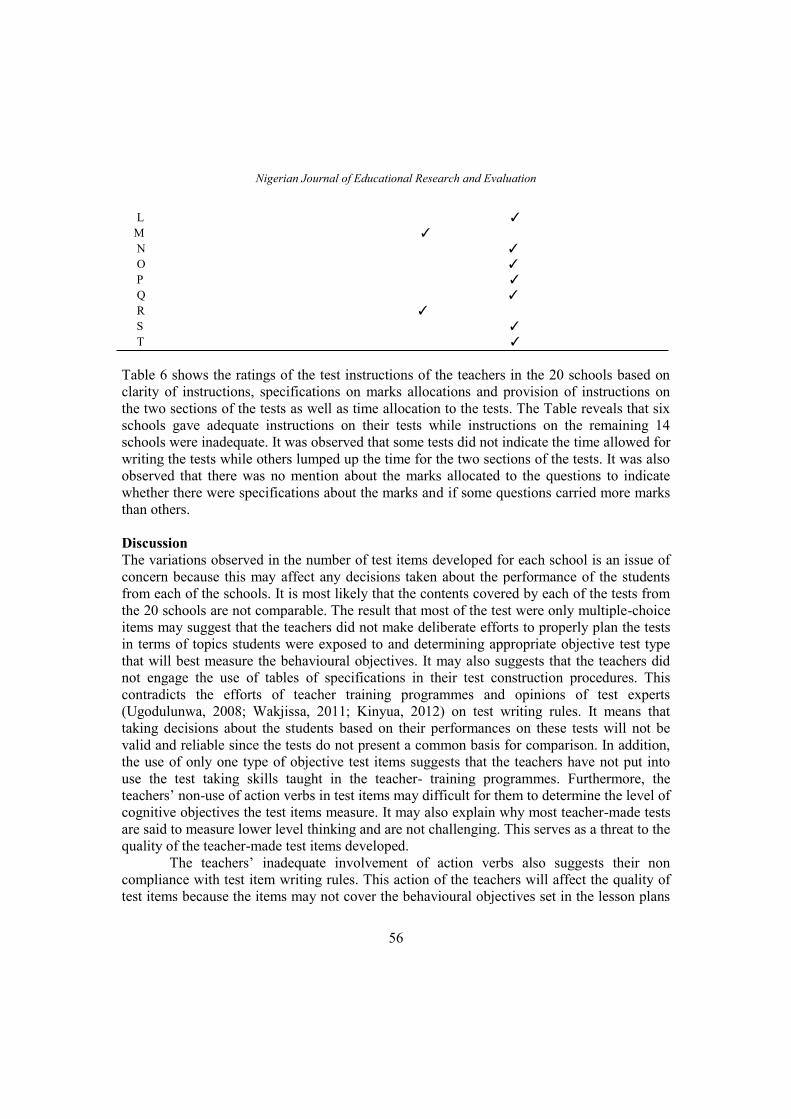
Nigerian Journal of Educational Research and Evaluation
56
L ✓
M ✓
N ✓
O ✓
P ✓
Q ✓
R ✓
S ✓
T ✓
Table 6 shows the ratings of the test instructions of the teachers in the 20 schools based on
clarity of instructions, specifications on marks allocations and provision of instructions on
the two sections of the tests as well as time allocation to the tests. The Table reveals that six
schools gave adequate instructions on their tests while instructions on the remaining 14
schools were inadequate. It was observed that some tests did not indicate the time allowed for
writing the tests while others lumped up the time for the two sections of the tests. It was also
observed that there was no mention about the marks allocated to the questions to indicate
whether there were specifications about the marks and if some questions carried more marks
than others.
Discussion
The variations observed in the number of test items developed for each school is an issue of
concern because this may affect any decisions taken about the performance of the students
from each of the schools. It is most likely that the contents covered by each of the tests from
the 20 schools are not comparable. The result that most of the test were only multiple-choice
items may suggest that the teachers did not make deliberate efforts to properly plan the tests
in terms of topics students were exposed to and determining appropriate objective test type
that will best measure the behavioural objectives. It may also suggests that the teachers did
not engage the use of tables of specifications in their test construction procedures. This
contradicts the efforts of teacher training programmes and opinions of test experts
(Ugodulunwa, 2008; Wakjissa, 2011; Kinyua, 2012) on test writing rules. It means that
taking decisions about the students based on their performances on these tests will not be
valid and reliable since the tests do not present a common basis for comparison. In addition,
the use of only one type of objective test items suggests that the teachers have not put into
use the test taking skills taught in the teacher- training programmes. Furthermore, the
teachers’ non-use of action verbs in test items may difficult for them to determine the level of
cognitive objectives the test items measure. It may also explain why most teacher-made tests
are said to measure lower level thinking and are not challenging. This serves as a threat to the
quality of the teacher-made test items developed.
The teachers’ inadequate involvement of action verbs also suggests their non
compliance with test item writing rules. This action of the teachers will affect the quality of
test items because the items may not cover the behavioural objectives set in the lesson plans
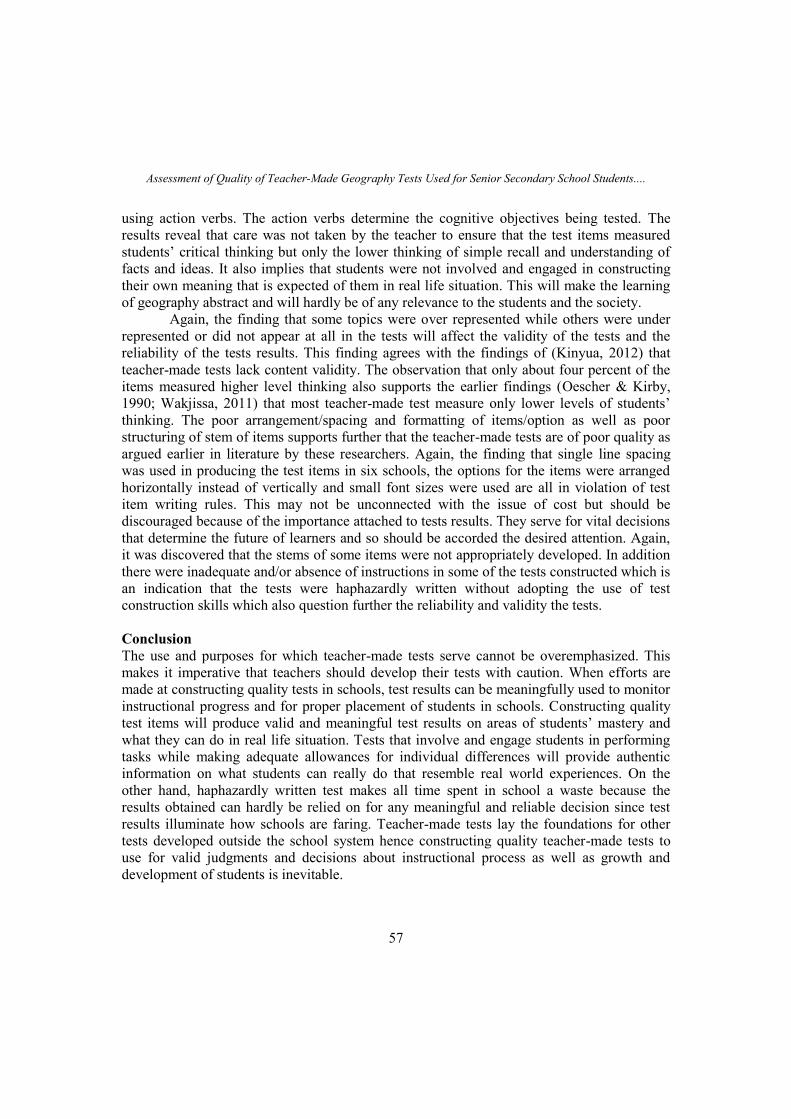
Assessment of Quality of Teacher-Made Geography Tests Used for Senior Secondary School Students....
57
using action verbs. The action verbs determine the cognitive objectives being tested. The
results reveal that care was not taken by the teacher to ensure that the test items measured
students’ critical thinking but only the lower thinking of simple recall and understanding of
facts and ideas. It also implies that students were not involved and engaged in constructing
their own meaning that is expected of them in real life situation. This will make the learning
of geography abstract and will hardly be of any relevance to the students and the society.
Again, the finding that some topics were over represented while others were under
represented or did not appear at all in the tests will affect the validity of the tests and the
reliability of the tests results. This finding agrees with the findings of (Kinyua, 2012) that
teacher-made tests lack content validity. The observation that only about four percent of the
items measured higher level thinking also supports the earlier findings (Oescher & Kirby,
1990; Wakjissa, 2011) that most teacher-made test measure only lower levels of students’
thinking. The poor arrangement/spacing and formatting of items/option as well as poor
structuring of stem of items supports further that the teacher-made tests are of poor quality as
argued earlier in literature by these researchers. Again, the finding that single line spacing
was used in producing the test items in six schools, the options for the items were arranged
horizontally instead of vertically and small font sizes were used are all in violation of test
item writing rules. This may not be unconnected with the issue of cost but should be
discouraged because of the importance attached to tests results. They serve for vital decisions
that determine the future of learners and so should be accorded the desired attention. Again,
it was discovered that the stems of some items were not appropriately developed. In addition
there were inadequate and/or absence of instructions in some of the tests constructed which is
an indication that the tests were haphazardly written without adopting the use of test
construction skills which also question further the reliability and validity the tests.
Conclusion
The use and purposes for which teacher-made tests serve cannot be overemphasized. This
makes it imperative that teachers should develop their tests with caution. When efforts are
made at constructing quality tests in schools, test results can be meaningfully used to monitor
instructional progress and for proper placement of students in schools. Constructing quality
test items will produce valid and meaningful test results on areas of students’ mastery and
what they can do in real life situation. Tests that involve and engage students in performing
tasks while making adequate allowances for individual differences will provide authentic
information on what students can really do that resemble real world experiences. On the
other hand, haphazardly written test makes all time spent in school a waste because the
results obtained can hardly be relied on for any meaningful and reliable decision since test
results illuminate how schools are faring. Teacher-made tests lay the foundations for other
tests developed outside the school system hence constructing quality teacher-made tests to
use for valid judgments and decisions about instructional process as well as growth and
development of students is inevitable.
Nigerian Journal of Educational Research and Evaluation
58
Recommendations
1. The Plateau Stat Ministry of Education should organise seminars and workshops to
update teachers’ knowledge on quality test construction for the geography teachers.
2. The Plateau Ministry of Education should employ Research, Measurement and
Evaluation experts and post to schools to be charged with the responsibility of setting
and/or moderating test items before they are used.
3. The principals of schools should set up committees that will moderate all tests developed
for students in their schools to ensure they are valid and reliable.
4. The principals of schools should encourage subject teachers to sit together to develop test
items and subject to moderation before they are administered to students.
5. The teachers should ensure they develop test items in conformity with test item
rules/guidelines.
6. The teachers should employ the use of tables of specifications in the construction of test
items.
7. The teachers should make sure they design tests to cover appropriate test item formats so
as motivate and challenge students to be creative.
8. The teachers should ensure that they construct test items that are relevant to students and
reflect what students have learnt
9. The teachers should plan adequately for tests in schools by according the desired time
and attention to constructing the test items.
References
Frey, B. B. (n.d). The University of Kansas (KU). Quality test construction. Retrieved from
http://www.specialconnections.ku.edu/?q=assessment/quality_test_construction
Griwold, P. A. (1990). Assessing relevance and reliability to improve the quality of teacher-
made tests. Retrieved fromhttp://journals.sagepub.com/doi/abs/
10.1177/019263659007452305?journalCode=buld
Henard F. & Leprince-Ringuet S. (2008). The path to quality teaching in higher education.
Retrieved from https://www1.oecd.org/edu/imhe/44150246.pdf
Kinyua, D.K. (2012). ).Validity and reliability of teacher made tests in Kenya: Case study of
physics form three in Nyahururu District. Retrieved from
http://www.erepository.uonbi. ac.ke/handle/11295/96250
Kinyua, D. K & Okunya, D. (2014).Validity and reliability of teacher-made tests: Case study
of year 11 physics in Nyahururu District of Kenya. African Educational Research
Journal Vol. 2(2), 61-71. Retrieved from http://www.netjournals.
org/pdf/AERJ/2014/2/14-015.pdf
Oescher, J & Kirby, P. C. (1990). Assessing teacher-made tests in secondary math and
science classrooms. Retrieved from http://files.eric.ed.gov/fulltext/ED322169.pdf
Assessment of Quality of Teacher-Made Geography Tests Used for Senior Secondary School Students....
59
Ugodulunwa, C. A. (2008). Fundamentals of educational measurement and evaluation. Jos:
Fab Annieh.
Ugodulunwa, C. A. & Wakjissa, S. G. (2016). What teachers know about validity of
classroom tests: Evidence from a university in Nigeria. IOSR Journal of Research &
Method in Education (IOSR-JRME) 6 (I) 14-19 Retrieved from
http://www.iosrjournals.org-jrme/ Vol-6%20Issue-3/Version-1/C0603011419.pdf
Wakjissa, S. G. (2011). Appraisal of Senior secondary II geography teachers’ competencies
in assessing students using Bloom’s level of cognitive objectives in Plateau State,
Nigeria. Journal of Educational Assessment in Africa (AEAA)5, 177–189.
Wrightstone, J.W. (1961). Teacher-made tests and techniques can help in evaluating growth.
Retrieved from http://www.ascd.org/ASCD/pdf/journals/ed.lead/el_196112
wrightstone. pdf
Teachers Continuous Assessment Practices and Secondary School Students’ Biology Achievement....
60
TEACHERS CONTINUOUS ASSESSMENT PRACTICES AND SECONDARY
SCHOOL STUDENTS’ BIOLOGY ACHIEVEMENT IN OBUBRA
LOCAL GOVERNMENT AREA OF CROSS RIVER STATE
Ayang, Ethelbert Edim
[email protected] 07064554325
Department of Educational Foundations and Administration
(Measurement and Evaluation Unit)
Cross River University of Technology, Crutech - Calabar
Abstract
This research investigated teachers’ continuous assessment practices’ influence on public
secondary school students’ biology achievement in Obubra Local Government Area of Cross
River State. Three null hypotheses guided the study. Related literature was reviewed
accordingly. Eighty five science related tutors and 235 SS-II students were randomly selected
from 6 (out of 15) public secondary schools as the representative sample for the study, using
simple random sampling technique. The research design was survey. A 15 items
questionnaire and students records of biology achievement scores were the instruments used
for data generation. The questionnaire was validated and tested for reliability (a Crumbach
alpha of .612 was recorded) by the researcher-a professional measurement and evaluation
expert. The instrument was then administered on the sample to generate the data used for
hypotheses testing. The Pearson Product Moment Coefficient (r)and simple linear regression
statistics analyses were used in testing the hypotheses at 0.05 level of significance. The
findings revealed that two of the hypotheses (2 and 3) were significant while hypothesis one
did not show significance with the dependent variable- students’ biology achievement. While
it was concluded that teachers’ continuous assessment practices do influence students
Biology achievement in secondary schools, recommendations among others was that;
teachers should be exposed to train-the-trainers workshops, seminars, etc. to enhance their
utilization of classroom assignment scores for effective students’ achievement outputs in not
only Biology but in other science-related subjects in secondary schools.
Keywords: Continuous Assessment, Practices Teachers, Secondary School Achievements
Introduction
Cowley, Callanan, Jipson, Galco, Topping, and Shrager, (2001) defined assessment as any
procedure or activity that is designed to collect information about the knowledge, attitude or
skills of the learner or group of learners. Assessment is therefore a process through which the
quality of an individuals’ work or performance is judged; when carried out as an on-going
process, assessment is known as Continuous Assessment (CA). Continuous Assessment is a
formative evaluation procedure concerned with finding out, in a systematic manner, the over-
Nigerian Journal of Educational Research and Evaluation
61
all gains that a student has made in terms of knowledge, attitudes and skills after a given set
of learning experience (Cakiroglu, 2006).
In order to reform the educational system, the Federal Government of Nigeria in
2004, reviewed the National Policy on Education. One of the highest provisions in the
National Policy in education instrument is the emphasis laid on continuous assessment
practices in various levels of education and programmes. The intention is to make assessment
of the learners more reliable, valid, objective and comprehensive. In short, continuous
assessment is an integral part of the new system of education in Nigeria otherwise known as
the 9-3-3-4 system. According to this document; Federal Ministry of Education Nigeria
(FMEN, 2004), continuous assessment was introduced as a mechanism through which the
final grading of a student in the cognitive, affective and psychomotor domains of behaviour
takes account in a systematic way. In the context of this study, continuous assessment is a
system of assessment that is carried out in biology at predetermined intervals for the
monitoring and improving the overall performance of students. Assessment is an important
element in not only biology teaching but also in other sciences., Houston in Anaf, &
Yamene, (2011) opines that teachers must regularly assess the effectiveness of the learning
experiences which they have organize to enable students achieve the earlier stated objectives.
Biology is one of the core science subjects and it is all encompassing as a mother
science and all science related subjects are embedded in the subject. Biology which is the
study of life and its dynamic (Anaf & Yamene 2011) is important in the sense that it is only
core science that is loved and liked by all students including those in the pure arts and
humanities. Hence Anaf & Yamene (2011), stated that biological knowledge is dynamic
which implies that sciences instructional practices of teachers should also be dynamic.
Pearse & Tesi (2004) defined achievement as anything that brings about or that is
accomplished by effort, skill or courage. The level of knowledge attained connotes
achievement in a school subject as symbolic by a score or grade in an achievement lest.
Lewis, (1995) also stated that students achievement connote the level of knowledge, skill or
accomplishment in an area of endeavour. Thus, it is explained that students’ achievement
should be measured by classroom tests (continuous assessment) and examination. The author
stated further that continuous assessment and examination are clear indicators of
performance in any subject.
High academic achievement is an indication of the attainment expected of secondary
school students including those in Obubra Local Government Area, but unfortunately it had
been observed by the researcher that the performance of the students in biology is often poor
and considering this fact, one wonders whether the continuous assessment practices carried
out by teachers in Obubra Local Government Area are adequate to enhance the academic
achievement of students in biology, hence the reason for carrying out this research work.
To back up this study, a brief explanation of Pavlov’s 1929’s classical conditioning
theory became inevitable. This theory relates that: Pavlov performed an experiment on dogs
and discovered that these organisms learnt to salivate in response to a bell. Many trials had
been given in each of which the bell was sounded and food was simultaneously (slightly
Teachers Continuous Assessment Practices and Secondary School Students’ Biology Achievement....
62
later) presented. It was thus correlated that students in Biology will get good grades
whenever the teachers taught, and students were exposed to many trials of continuous
assessment activities. According to Pavlov, condition response (CR) is the response that is
developed during training, while conditioning stimulus (CS) is the stimulus, which include
trainings/teaching activities intended to evoke the CR that is good grades in the subject
(biology).
A lot of literature abound that relate to teachers’ continuous assessment practices in
secondary schools. Only a few of such literature was reviewed in this study as follow: Onuka
(2006) found out that between 1948 and the early 1990s there was a comprehensive
implementation of continuous assessment and feedback for the improvement of the education
system in Nigeria for the effectively accomplishment of learning objectives by students. This
is concurred by the findings of Onuka and Oludipe (2005), that there was a significant
remediation for poor achievement in biology as a result of the application of the feedback
mechanism resulting from formative evaluation of learners activities. Furthermore,
Etiene(2007:2) contended that, the project against final examination in biology by students in
France in May 2002 was the perfect opportunity for students to point at the unfair and risky
final assessment in their schools. Thus according to Etiene (2007) students made it clear that
such examination merely represented the achievement of the moment (or immediate course
content) and not the efforts made through the year. Students insisted on the risk that even the
best prepared student could have a problem on the day of examination, leading a poor grade.
Furthermore, that such problem could be able score favour of the continuous assessment
activity, thereby reducing the risk of some difficulties are likely to occur during
implementation of the recap exercises of these activities.
Grauma and Naidoo, (2004).Also noted that in secondary schools, the assessment of
students is done through terminal, half yearly and annual examinations at the schools.
Larnoy, (1999) contents that, when continuous assessment practices are applied over a while
period of time, they do not give an indication whether improvement is taking place or not.
But before 999, Ogunnyi (1984) had noted that continuous assessment is cumulative in that
any decision made at any time about a learner still has much to talk about the learner.
Continuous assessment also provides the students with maximum opportunities to learn and
demonstrate from time to time the knowledge, skills and the attitudes that they learners have
during the teaching-learning processes, especially in biology. However, this researcher felt
that in the secondary schools in the area of this study, it cannot be over emphasized that the
measurement in the various domains, using varieties continuous assessment models makes it
a good stool for achieving learning objectives in biology in particular. This is so because in
his research, Kalleghan and Greaney (2003) noted a deficiency in the practice of continuous
assessment involving only one-shot test or teacher-made test in Africa (where Nigeria is
part). This therefore may account for the variances in performance or achievement among
students of science biology (especially) in secondary schools. Since there is need to improve
students achievement in biology the need exist to establish what continuous assessment
practices are being used for by teachers in secondary schools. The need also exists to
Nigerian Journal of Educational Research and Evaluation
63
investigate whether any relationship exists between continuous assessment practices being
used in secondary schools and students’ achievement in sciences; finally, the need exist to fin
gut the teachers perception on whether students exposed to numerous continuous assessment
practices perform better than their counterpart who are not exposed to such practice
activities.
Graume and Naidoo (2003) conducted a study to determine whether teachers’
utilization of assignment enhances students’ academic achievement in Biology, using a
survey research design. To achieve the purpose, three research questions and hypotheses
were formulated. The population of the study comprised 109 teachers and 898 students 25
items questionnaire was developed and administered to a sample of 308 respondents (30
teachers and 278 students). Mean scores and standard deviations were used to answer the
research questions. While 2 test statistics were used to test the null hypotheses. The result
showed that assignments enable students to get exposed to variety of questions more often
and when given feedback from teachers; students were able to learn the best ways of
approaching questions and presenting their answers. It was therefore concluded that
assignments which is one of the continuous assessment practice model, positively relates to
students achievement in biology. This findings were supported by Bassey, Akpama, Ayang
& Obeten (2015) whose study on effect of assignment scores on students’ academic
achievement in mathematics showed a positive correlation effect on their overall
performance.
Greaney (2001) conducted a study on teacher-made test as a critical factor for
students’ academic achievement in Biology, evidence from multi levels of post primary
schools. The main purpose of the study was to determine if teacher made test as a continuous
assessment practice enhance students’ academic achievement in biology. The study was a
survey. It was guided by four research questions and four hypotheses. A total sample of 282
teachers and 788 students from a population of 2,282 teachers and teachers and 4,678
students purposive sampling questionnaire with a four point rating scale were the instrument
used to collect data for the study. The data collected were analyzed using mean, standard
deviation and t-test statistic. This study revealed that through written test, students were
informed of their main weak areas, which helped them to devise ways of improving on their
performance. Teacher-made-test contained questions selected from various topics already
learnt after a given period of time. Therefore when students failed the questions, they could
easily be forced to revise more which will enhance their knowledge of the content.
Lewis studied the relationship between teachers’ utilization of projects assessment
and students’ academic achievement in biology in Abu Ohabi. The study which was a survey,
was guided by three each of research questions and null hypotheses. A total of 555 students
and 209 teachers were selected from a population of 22,526 students and 4837 teachers using
purposive sampling. The data collected were analyzed using means, standard deviations and
t-test statistics. The study revealed that this practice (use of projects for students assessment)
is rarely used and most teachers have never used project to assess students in biology.
Teachers Continuous Assessment Practices and Secondary School Students’ Biology Achievement....
64
This is because projects are difficult to monitor due to limited time available during
term. Findings showed that teachers are always teaching to complete the syllabus, and
anything beyond that is useless to them. This implies that teachers are only interested in
assessment of teaching instead of assessment of learning (Ivan Pavlov, 1936; Yigzaw, 2013,
&Bassey et al., 2015, etc). However, these project issues were used to enable readers
understand how the variables of the study inter-related in studies of this nature; that is
predicting future behaviour of learners on the basis of already determined pre-scores of
Continuous Assessment (CA). This would also create anxieties on the part of learners if the.
pre-achievement scores of Continuous Assessment (CA)are not used in the determination of
the overall achievement of the learners, etc. In general, the literature review had exposed
some loop-holes in the aspects of utilization of assignment, classroom test and project; which
and were hoped to be closed at the end of the research.
The general need to promote learning and improve students’ performance in
secondary schools in the country (particularly in Obubra Local Government Area), resulted
to a range of related but different development in continuous assessment at classroom levels.
The resultant feature has not been consisted with achievement of students in science
especially biology as performance still varies from school to school. This endangers the
future of many students who are in schools that perform poorly (particularly in the sciences).
On the basis of the above introduction, it becomes glaring obvious that the only hope of
ascertaining somewhat near good academic achievement in sciences is assessment practices.
And the assessment practices adopted by teachers in secondary schools in most states, and
Local Government Areas in the country, even in Obubra Local Government of Cross River
State, still have much to be said than written. It was on the premise that this study became
necessary, to determine the extent to which utilization of scores from class assignment,
classroom test, and field-trip contribute to students’ academic achievement in the science
subjects, particularly in biology in secondary schools.
The main purpose of this study was to find out teacher’s continuous assessment practices
and secondary school students achievement in Biology in Obubra Local Government Area of
Cross River State. The specific objectives were:
i) To examine the extent to which teacher’s utilization of assignment scores influence
students’ academic achievement in Biology.
ii) To determine the extent to which scores of teachers made test influence students
achievement in biology.
iii) To determine whether teachers utilization of project scores influence students
achievement in biology.
On the basis of the specific purposes, the following null hypotheses were formulated to guide
the study:
i) There is no significant influence of teachers’ utilization of assignment on the academic
achievements of students in Biology.
Nigerian Journal of Educational Research and Evaluation
65
ii) There is no significant influence of teachers’ utilization of teacher-made test on the
academic achievement of students in Biology.
iii) There is no significant influence of utilization of project assessment scores on students’
academic achievement in Biology.
Method
The survey inferential research design was adopted for conducting this study. This was
because according to Isangidighi, Joshua, Asim & Ekuri (2004), and Isangidighi (2012), the
survey research design involves collection of data to accurately and objectively describe
existing phenomena. Studies that make use of this approach are employed to obtain pictures
of the present (prevailing conditions) of particular phenomena, hence the survey research
design was considered appropriate for this study, because it allowed the researcher to make
inferences about the population under study.
This study was conducted in public secondary schools in Obubra Local Government
Area in Cross River State. This local government lies between latitudes 5o 3′ and 6o3′ North
of the equator and longitude 8o5′ and 9o5′ East of the Greenwich Meridian (NEST, 1991). It
is bounded on by North by Ikom LGA, on the South and East by Yakurr and Akamkpa
LGAs, and in the West by Yala LGA and Ebonyi State respectively. Obubra covers an areas
of 313.39sqkms and is mainly an agrarian community with farming in yam, cocoyam,
fishing, trading etc as their main stay.
Traditionally, the Obubra peoples have a cultural heritage that is reflected in some of
their festivals and dances such as cultural carnivals, Obam, Obarike, Idang and Abu/Otawha
festivals. Obubra is multi-dialectal with major languages such as Mbembe, Isobo/Izikwo,
Yala, Ekuri, Nkukoli, etc (Wikipedia 2015).
The target population for this study was all SS-II graders in six (6) out of the fifteen
public secondary schools in Obubra Local Government Area, Cross River State. This
population was given as 647 and it was from this population or group that a sample of 230
(122 or 53.04%, male and 108 46.96% female) respondents was randomly drawn for the
study.
The representative sample of the study was 230 SS-II students randomly selected
from 6 (out of 15) secondary schools. The sample was drawn by simple random procedure
base on ratio and proportions since the spread of students was not homogenous in all sampled
schools.
The instrument used for data collection was a 15-items structured questionnaire,
designed, validated as well as tested for reliability by the researcher and his colleague –
‘both’ being professional measurement and evaluation experts, in faculty of education
CRUTECH, Calabar.
The questionnaire consisted of two parts, (A and B). Section A was designed to elicit
respondents personal data such as their school, sex and age, while Section B with 20
argumentative items was to elicit data from respondents on the 3 major independent variables
of teachers utilization of assignment, utilization of classroom test and utilization of project
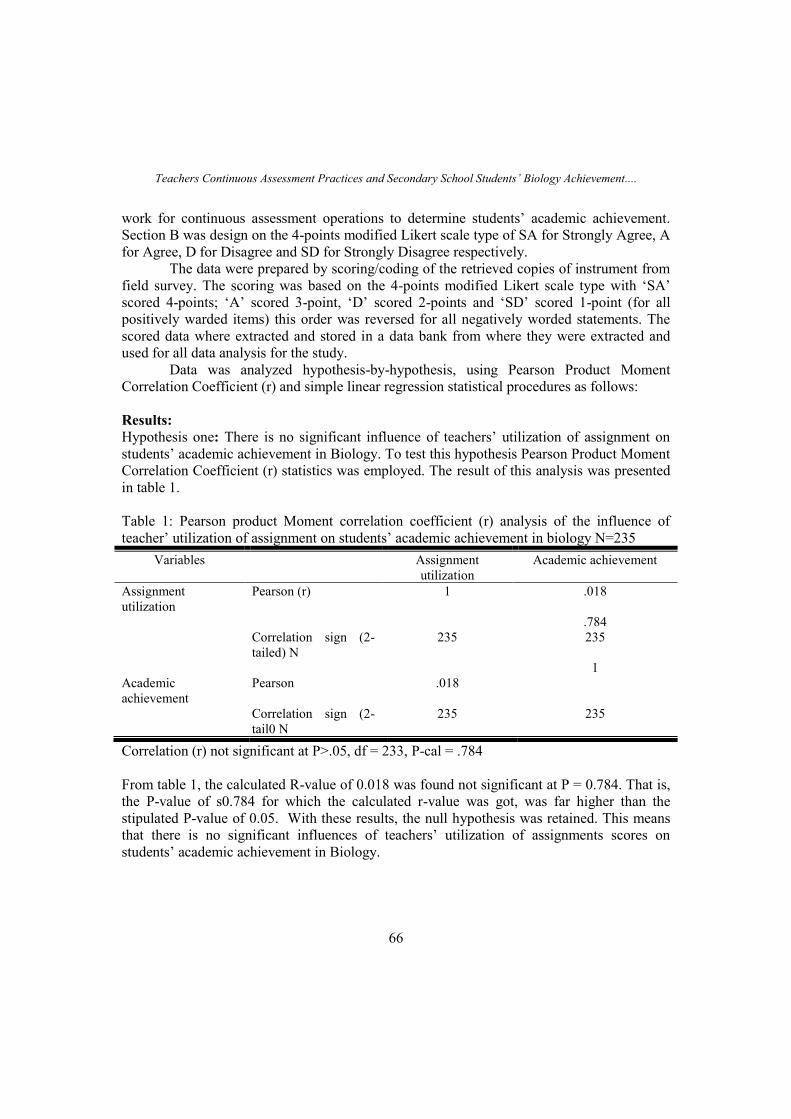
Teachers Continuous Assessment Practices and Secondary School Students’ Biology Achievement....
66
work for continuous assessment operations to determine students’ academic achievement.
Section B was design on the 4-points modified Likert scale type of SA for Strongly Agree, A
for Agree, D for Disagree and SD for Strongly Disagree respectively.
The data were prepared by scoring/coding of the retrieved copies of instrument from
field survey. The scoring was based on the 4-points modified Likert scale type with ‘SA’
scored 4-points; ‘A’ scored 3-point, ‘D’ scored 2-points and ‘SD’ scored 1-point (for all
positively warded items) this order was reversed for all negatively worded statements. The
scored data where extracted and stored in a data bank from where they were extracted and
used for all data analysis for the study.
Data was analyzed hypothesis-by-hypothesis, using Pearson Product Moment
Correlation Coefficient (r) and simple linear regression statistical procedures as follows:
Results:
Hypothesis one: There is no significant influence of teachers’ utilization of assignment on
students’ academic achievement in Biology. To test this hypothesis Pearson Product Moment
Correlation Coefficient (r) statistics was employed. The result of this analysis was presented
in table 1.
Table 1: Pearson product Moment correlation coefficient (r) analysis of the influence of
teacher’ utilization of assignment on students’ academic achievement in biology N=235
Variables Assignment
utilization
Academic achievement
Assignment
utilization
Pearson (r) 1 .018
.784
Correlation sign (2-
tailed) N
235 235
1
Academic
achievement
Pearson .018
Correlation sign (2-
tail0 N
235 235
Correlation (r) not significant at P>.05, df = 233, P-cal = .784
From table 1, the calculated R-value of 0.018 was found not significant at P = 0.784. That is,
the P-value of s0.784 for which the calculated r-value was got, was far higher than the
stipulated P-value of 0.05. With these results, the null hypothesis was retained. This means
that there is no significant influences of teachers’ utilization of assignments scores on
students’ academic achievement in Biology.
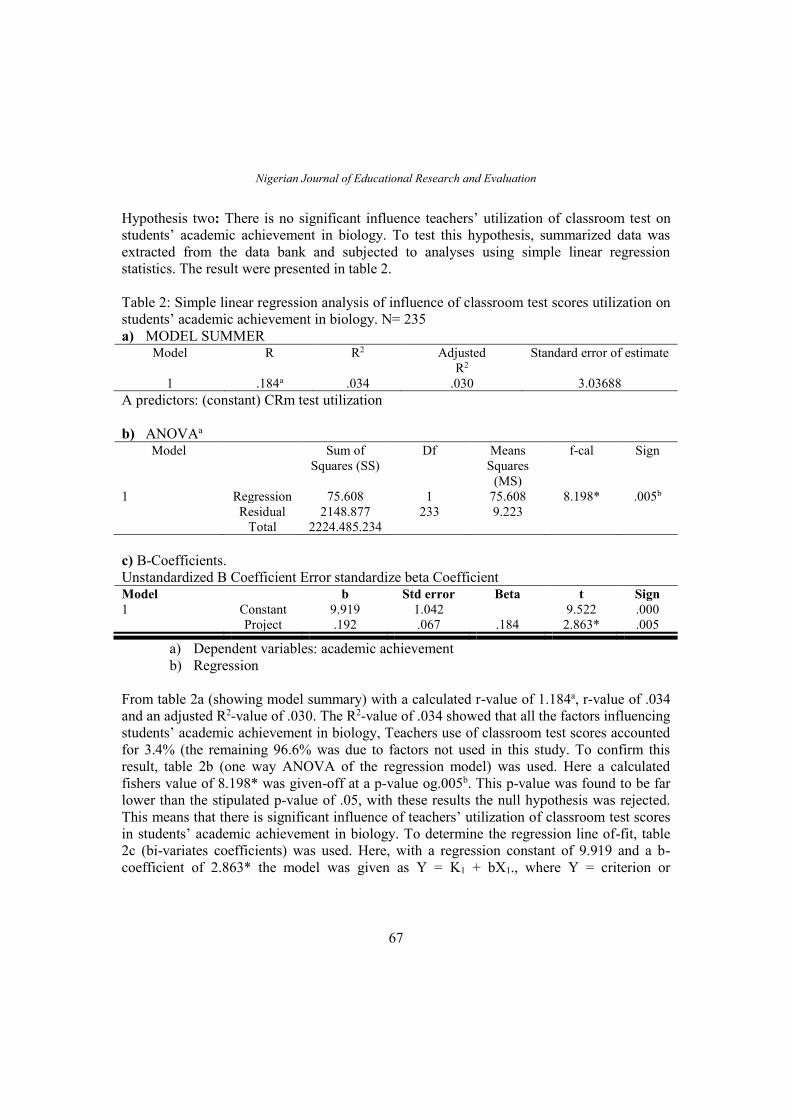
Nigerian Journal of Educational Research and Evaluation
67
Hypothesis two: There is no significant influence teachers’ utilization of classroom test on
students’ academic achievement in biology. To test this hypothesis, summarized data was
extracted from the data bank and subjected to analyses using simple linear regression
statistics. The result were presented in table 2.
Table 2: Simple linear regression analysis of influence of classroom test scores utilization on
students’ academic achievement in biology. N= 235
a) MODEL SUMMER Model R R2 Adjusted
R2
Standard error of estimate
1 .184a .034 .030 3.03688
A predictors: (constant) CRm test utilization
b) ANOVAa Model Sum of
Squares (SS)
Df Means
Squares
(MS)
f-cal Sign
1 Regression 75.608 1 75.608 8.198* .005b
Residual 2148.877 233 9.223
Total 2224.485.234
c) B-Coefficients.
Unstandardized B Coefficient Error standardize beta Coefficient Model b Std error Beta t Sign
1 Constant 9.919 1.042 9.522 .000
Project .192 .067 .184 2.863* .005
a) Dependent variables: academic achievement
b) Regression
From table 2a (showing model summary) with a calculated r-value of 1.184a, r-value of .034
and an adjusted R2-value of .030. The R2-value of .034 showed that all the factors influencing
students’ academic achievement in biology, Teachers use of classroom test scores accounted
for 3.4% (the remaining 96.6% was due to factors not used in this study. To confirm this
result, table 2b (one way ANOVA of the regression model) was used. Here a calculated
fishers value of 8.198* was given-off at a p-value og.005b. This p-value was found to be far
lower than the stipulated p-value of .05, with these results the null hypothesis was rejected.
This means that there is significant influence of teachers’ utilization of classroom test scores
in students’ academic achievement in biology. To determine the regression line of-fit, table
2c (bi-variates coefficients) was used. Here, with a regression constant of 9.919 and a b-
coefficient of 2.863* the model was given as Y = K1 + bX1., where Y = criterion or
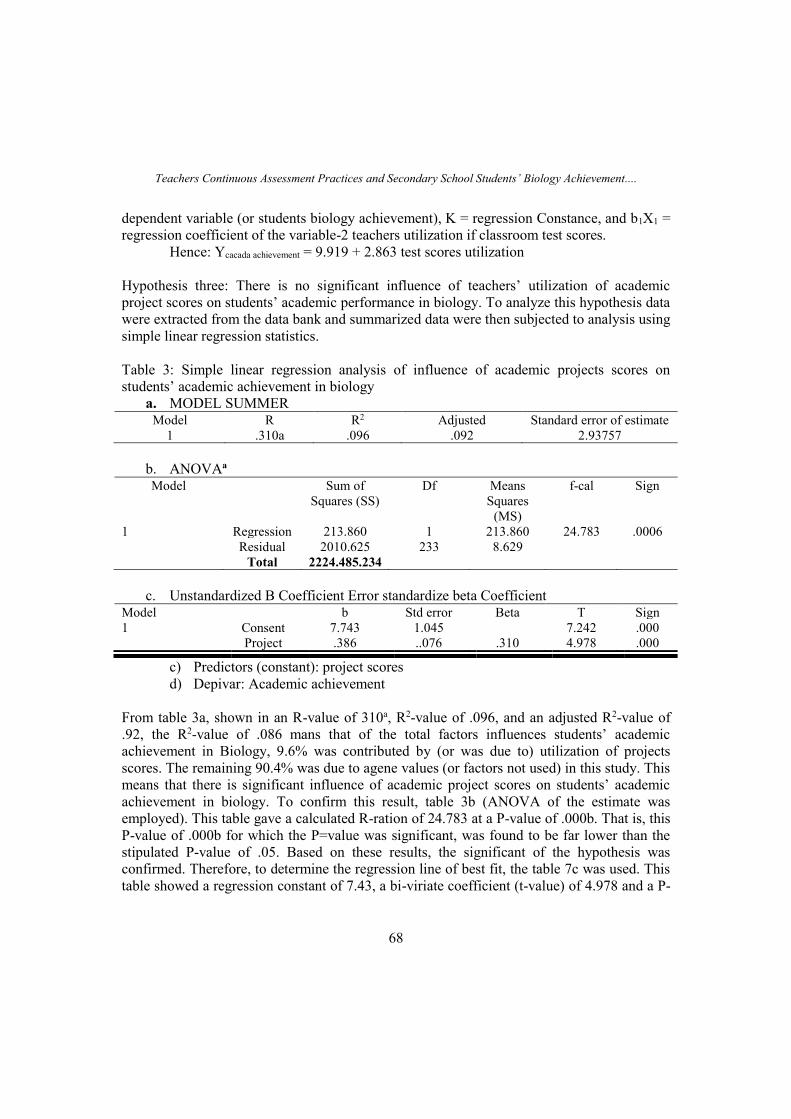
Teachers Continuous Assessment Practices and Secondary School Students’ Biology Achievement....
68
dependent variable (or students biology achievement), K = regression Constance, and b1X1 =
regression coefficient of the variable-2 teachers utilization if classroom test scores.
Hence: Ycacada achievement = 9.919 + 2.863 test scores utilization
Hypothesis three: There is no significant influence of teachers’ utilization of academic
project scores on students’ academic performance in biology. To analyze this hypothesis data
were extracted from the data bank and summarized data were then subjected to analysis using
simple linear regression statistics.
Table 3: Simple linear regression analysis of influence of academic projects scores on
students’ academic achievement in biology
a. MODEL SUMMER
Model R R2 Adjusted Standard error of estimate
1 .310a .096 .092 2.93757
b. ANOVAa Model Sum of
Squares (SS)
Df Means
Squares
(MS)
f-cal Sign
1 Regression 213.860 1 213.860 24.783 .0006
Residual 2010.625 233 8.629
Total 2224.485.234
c. Unstandardized B Coefficient Error standardize beta Coefficient Model b Std error Beta T Sign
1 Consent 7.743 1.045 7.242 .000
Project .386 ..076 .310 4.978 .000
c) Predictors (constant): project scores
d) Depivar: Academic achievement
From table 3a, shown in an R-value of 310a, R2-value of .096, and an adjusted R2-value of
.92, the R2-value of .086 mans that of the total factors influences students’ academic
achievement in Biology, 9.6% was contributed by (or was due to) utilization of projects
scores. The remaining 90.4% was due to agene values (or factors not used) in this study. This
means that there is significant influence of academic project scores on students’ academic
achievement in biology. To confirm this result, table 3b (ANOVA of the estimate was
employed). This table gave a calculated R-ration of 24.783 at a P-value of .000b. That is, this
P-value of .000b for which the P=value was significant, was found to be far lower than the
stipulated P-value of .05. Based on these results, the significant of the hypothesis was
confirmed. Therefore, to determine the regression line of best fit, the table 7c was used. This
table showed a regression constant of 7.43, a bi-viriate coefficient (t-value) of 4.978 and a P-
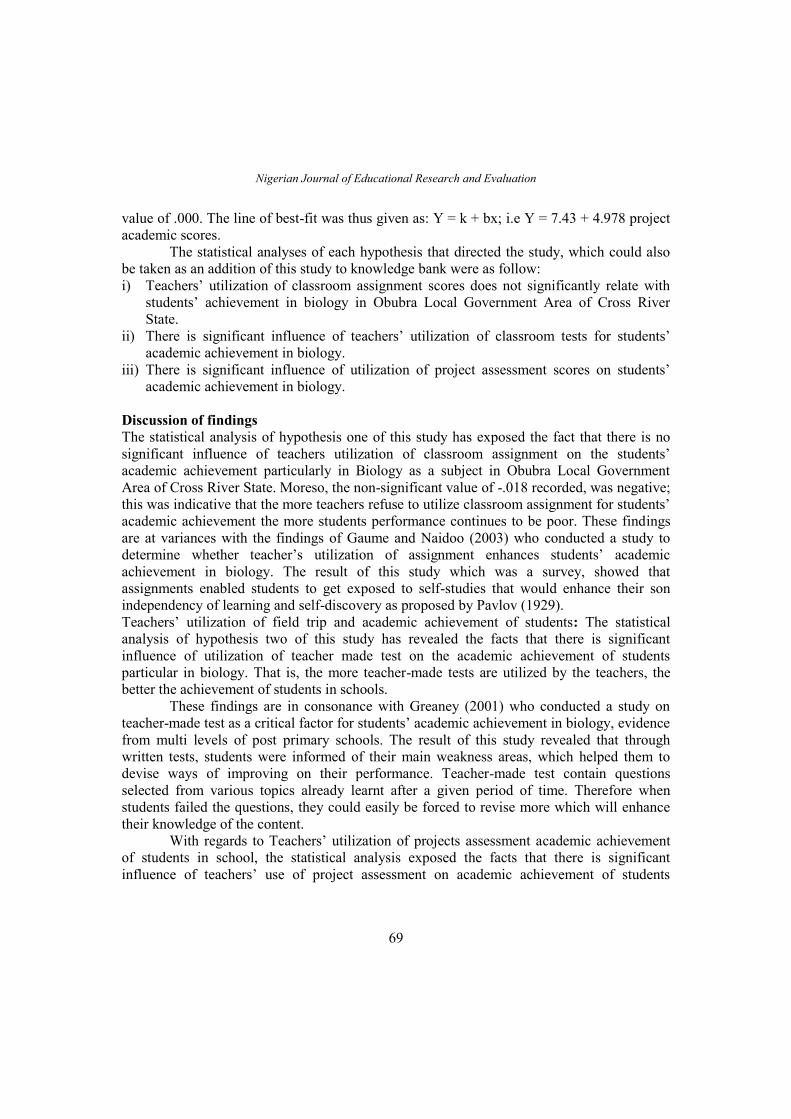
Nigerian Journal of Educational Research and Evaluation
69
value of .000. The line of best-fit was thus given as: Y = k + bx; i.e Y = 7.43 + 4.978 project
academic scores.
The statistical analyses of each hypothesis that directed the study, which could also
be taken as an addition of this study to knowledge bank were as follow:
i) Teachers’ utilization of classroom assignment scores does not significantly relate with
students’ achievement in biology in Obubra Local Government Area of Cross River
State.
ii) There is significant influence of teachers’ utilization of classroom tests for students’
academic achievement in biology.
iii) There is significant influence of utilization of project assessment scores on students’
academic achievement in biology.
Discussion of findings
The statistical analysis of hypothesis one of this study has exposed the fact that there is no
significant influence of teachers utilization of classroom assignment on the students’
academic achievement particularly in Biology as a subject in Obubra Local Government
Area of Cross River State. Moreso, the non-significant value of -.018 recorded, was negative;
this was indicative that the more teachers refuse to utilize classroom assignment for students’
academic achievement the more students performance continues to be poor. These findings
are at variances with the findings of Gaume and Naidoo (2003) who conducted a study to
determine whether teacher’s utilization of assignment enhances students’ academic
achievement in biology. The result of this study which was a survey, showed that
assignments enabled students to get exposed to self-studies that would enhance their son
independency of learning and self-discovery as proposed by Pavlov (1929).
Teachers’ utilization of field trip and academic achievement of students: The statistical
analysis of hypothesis two of this study has revealed the facts that there is significant
influence of utilization of teacher made test on the academic achievement of students
particular in biology. That is, the more teacher-made tests are utilized by the teachers, the
better the achievement of students in schools.
These findings are in consonance with Greaney (2001) who conducted a study on
teacher-made test as a critical factor for students’ academic achievement in biology, evidence
from multi levels of post primary schools. The result of this study revealed that through
written tests, students were informed of their main weakness areas, which helped them to
devise ways of improving on their performance. Teacher-made test contain questions
selected from various topics already learnt after a given period of time. Therefore when
students failed the questions, they could easily be forced to revise more which will enhance
their knowledge of the content.
With regards to Teachers’ utilization of projects assessment academic achievement
of students in school, the statistical analysis exposed the facts that there is significant
influence of teachers’ use of project assessment on academic achievement of students
Teachers Continuous Assessment Practices and Secondary School Students’ Biology Achievement....
70
particularly in biology. That is, the more teachers utilize the project assessment, the better the
academic achievement of students in this science subject.
These findings tend to be in agreement with Lewis (2009) who studied the
relationship between teachers’ utilization of projects assessment and students’ academic
achievement in biology. The results of the study revealed that the practice is rarely used and
most teachers have never used project to assess students in biology. This is because projects
are difficult to monitor due to limited time available during the term. This finding still
showed that teachers are always teaching to complete the syllabus and anything beyond that
may be useless to them. This implied that the limited times available in schools does not
allow the diversity of continuous assessment practice available for use to be realistically
practicalized. The researchable concluded that, in order to manage the efficiency within the
implementation of projects as a continuous assessment practice in secondary school, teachers
should use group works for students.
Conclusion of the study: On the basis of the statistical findings, the study concluded that;
teachers’ continuous assessment practices significantly influence secondary school students’
biology achievement in public secondary schools (only with respect to teachers’ utilization of
classroom test and project assessment scores but not with utilization of classroom
assignment) in Obubra local Government Area of Cross River State.
Recommendations among others, was that teachers’ must be motivated through trained-the-
trainers’ workshops, to enhance their modalities of utilizing classroom assignment for proper
determination of students achievement not only in biology but in all sciences related subjects
for effective evaluation of students’ science and technology knowledge advancement in
schools.
References
Akinbobola, A., & Afolabi, F. (2009). Constructivist practices through guided discovery
approach: The effect on students’ cognitive achievement in Nigerian Senior
Secondary School Physic. Bulgarian Journal of Science and Education Policy, 3(2),
233 – 252.
Aluko, S. A. (2012).
Anaf, Y. S. & Yamin, S. B. (2011). Difference and similarity of Continuous Assessment in
Malaysian and Nigerian Universities. Journals of education Practical. 2: 73 – 82.
Angela, k., & Harms, U. (2008). Acquiring knowledge about Biodiversity in a Museum are
Worksheets effective? Journal of Biological Education, 42 (4), 157 – 162.
Ashworth, J. & Evans, J. L. (2001). Modelling students subject choice at secondary and
Tertiary level: A cross section study. Journals of Economic Education, 32 (4) 311 –
320.
Nigerian Journal of Educational Research and Evaluation
71
Bamberger, Y. & Tal. T. (2008). Multiple outcomes of class visits to natural history
Museums: The students view. Journals of Science Education and Technology, 17 (3),
274- 284.
Bassey, S. W., Akpama, E., Ayang, E. E. & Obeten, I. (2015). An investigation into teachers
compliance with the best assessments practices in the Cross River Central Senatorial
District. African Journal of Education and Technology 2(1), 21 - 29
Cakiroglu, J. (2006). The effect of learning cycle approach on students’ Achievement in
Science. European Journal of Education Research. (22), 61 – 73.
Cooper, H. (1980). Synthesis of research on Homework. Educational Leadership,47, 85 – 91.
Cowley, K., Callanan, M., Jipson, J., Galco, J., Topping, k., &Shrager, J. (2001). Shared
scientific Thinking in everyday parent child activity. Science Education. 85(6), 712.
Isangidighi, A. J., Joshua, M. T., Asim, A., & Ekuri, E. E. (2004). Fundamentals of research
and Statistics in Education and Social Sciences. Calabar: University of Calabar
Press.
Isangidigi, A. J., (2012). Essentials of research and statistic in education and social sciences.
Etinwa& Associates.
Kisiel, J. (2006). An examination of field trip strategies and their implementation within a
natural history Museum. Science Educations, 90 (3), 434 – 452.
Maria, A. J. (2012). Academics Performance in terms of the Applied Assessment system.
European Journal of Education Respiration Assessment Evaluation, 18: 1-14.
NEST, (1991). Nigeria Threatened Environment. Ibadan NEST.
Pavlov, I. P. & Anrep, g. U. (2003). Conditioned Reflexes. Courier Corporation. Retrieved
03/07/17.
Pavlov, I. P. (1929). Classical Conditioning Theory, Oxford UK John Hopkins.
Pearse, S., & Tesi, R. (2004). Adults perception of the field trips taken within grades K-12:
Eight case studies in the New York Metropolitan Area Education, 125 (1), 30 – 40.
Wikipedia. (2015). Nkukoli language, Retrieved on 070/07/17 from
https://en.m.wikipedia.org/.../nkokoli
Yigzaw, A. (2013). High school English teachers’ and students’ Perception, attitudes and
actual practices if continuous assessment http://www.academicjournals.org/ERR, 8
(16) pp. 1489 – 1498.
Effects of Formative Assessment with Feedback on Junior Secondary School Students’....
72
EFFECTS OF FORMATIVE ASSESSMENT WITH FEEDBACK ON JUNIOR
SECONDARY SCHOOL STUDENTS’ ATTITUDE AND PERFORMANCE IN
MATHEMATICS IN BARKIN-LADI, PLATEAU STATE, NIGERIA
Geoginia Cyril Imo1
[email protected] (08032859893)
Hwere Mary Samuel 2
(08024212996)
1. Department of Educational Foundation Faculty of Education University of Jos
2. Government Girls Model Junior Secondary School Zaron, Barkin Ladi Local
Government Area, Plateau State.
Abstract
The study found out the effects of formative assessment with feedback on students’ attitude
and achievement as instructional strategy on Junior Secondary School students’ achievement
in Mathematics. Three research questions and a hypothesis guided the study. Researchers’
developed instruments titled Mathematics Achievement Test (MAT) and Mathematics
Attitudes Questionnaire (MAQ) were used to collect data for the study. Results from the study
revealed significant effects of treatment on students’ achievement in Mathematics. It also
revealed that attitude of students improved after administering treatment. However, no
significant effects of gender on achievement. The paper concluded with suggestions that all
school administrators should emphasis to teachers the need for the use of formative
assessment with feedback as instructional strategy to raising students’ motivation by giving
adequate feedback.
Keywords: Formative Assessment, Feedback, instructional strategies, improved attitude,
improved achievement.
Introduction
One does not need to tell any individual or the society about the importance of Mathematics
education in Nigerian educational System and the nation technological development. Obodo
(2001), Odumosu et al (2012), Ale (2012) to mention but a few viewed on the importance of
Mathematics to be a precise and logical language, the most serviceable science subject to all
discipline and field of human work and study, a system of concept of shape, size, quantity
and order used to describe device phenomena.
In spite all these importance accorded Mathematics in the society, majority of
Nigerian school children generally dread Mathematics to be complex, difficult and abstract
(Harbor-Peter 2001). Worse still, some teachers of Mathematics are either not convinced
themselves to let students know the benefits that could be derived from the study of
Mathematics beyond being a necessity for entry into high institutions. The implication of
Nigerian Journal of Educational Research and Evaluation
73
these is that examination malpractice would be on the increase and majority of these students
would always fail the subject each year and end up forfeiting the pursuit of many careers that
would have benefited them and the country better. More importantly, they would also be
losing in the basic knowledge, skills and habits that effective Mathematics learning is
expected to equip students with. Thus, frequent failure of Nigerian students in Mathematics
which is a core subject has been the concern of all stakeholders in the education industry
Olagunju, 2015). One of the major problems identified is that teachers often times give
assessment, but with inadequate or no feedback.
Gronlund and Linn as (cite in Ajogbeje, 2013) stipulated the uses of formative
assessment with feedback to include: Planning corrective action for overcoming learning
deficiencies, motivating learners and increasing retention and transfer of learning. Formative
assessment with feedback therefore has great impact and potential to transform learners and
indeed the entire educational system.
It does appear however that some of the strategies of formative assessment with
feedback have not been fully explored. Views and studies that in the time past show that
practices of formative assessment with feedback in our schools do not reflect the strategies as
outlined above. [ Hornby (2005), Crooks (2001), Nicol, 2009, Ajogbeje, 2012, OECD.
(2005), Adeniji, 2001, Mato and Dela Torre (2010), Abdul-Raheem (2010] of Primary
interest of this paper is the disheartening observation of stakeholders in the education
industry about the frequent failure of Nigeria students in Mathematics which is a core
subject, as a result, to exam malpractice or forfeiting career pursuit in students.
To achieve effective Mathematics teaching and learning, assessment is an essential
component. It affords the teachers and students opportunity to measure the extent to which
the stated objectives have been achieved or will be achieved. Assessment whether formative
(on the process) or summative (at the end of instruction), the interaction between teachers
and students as feedback tool is vital in teaching and learning quantitative subjects especially
Mathematics that topics are linked from simple to complex tasks. Ugodulunwa, (2008)
posits that educational assessment entails the process of gathering information on
performance of students, interpreting the information and using it to improve teaching and
learning process in school and national level.
Assessments are important whether formative or summative, they serve the
following purposes: motivating students, directing and enhancing learning, providing
feedback to students’ strengths, weaknesses and how they might improve as well as checking
whether learning outcomes are being achieved (Zou,2008). Bloom, Hasting and Madus (as
cited in Philas, 2012) opines that formative assessment with feedback is useful to both
students (as away of diagnosing students’ learning difficulties and the prescription of
alternative remedial measures) and to the teach (as means of locating the specific difficulties
that the students are experiencing with subject matter content) and forecast summative
assessment result. The above objective will be achieved if the learner and teacher get the
feedback on the outcome of assessment at the formative stage and use the information to play
respective legitimate roles towards improvement. However, the focus of this study is on the
Effects of Formative Assessment with Feedback on Junior Secondary School Students’....
74
learner since the learner is the central person in the whole process of teaching and learning.
Effort should be directed towards improving the learner.
Irons (2008) defined formative assessment as any task that creates feedback for
students about learning. To see further, formative feedback strategy is the notion of students
being given strategic guidance on how to improve their work that resides at the centre of
formative assessment practice. According to Clark (2011) formative assessment is central to
good instruction in several ways, focusing learning activities on key goals, providing students
with feedback so they can rework their ideas and deepen their understanding, helping
students develop Meta cognitive skills to critique their own learning products and processes,
and providing teachers with systematic information about students’ learning to guide future
instruction and improve achievement. The advantages of this practice will be beneficial to:
students, teachers, school counselors, school administrators, parents.
The main purpose of the study was to find out the effects of formative assessment with
feedback on students’ achievement in Mathematics. Specifically the study was to
1. Determine the level of achievement of students in Mathematics
2. Find out the effect of formative assessment in students’ achievement in Junior Secondary
School Mathematics
3. Find the effect of formative assessment on students’ attitude towards Mathematics
To guide the study three research questions were posed and a hypothesis stated
1. What is the level of students’ performance in Mathematics before exposure to
formative assessment with feedback?
2. What is the level of students’ performance in Mathematics after exposure to formative
assessment with feedback?
1. There is no significant difference between the pre-test and post-test Mathematics
performance mean scores of students in the experimental group.
Method
The study espouses a quasi-experimental design. The population for the study constituted all
JSS II students in 40 Junior Secondary Schools in Barkin- Ladi LGA, Plateau State. The
sample for this study was made of two (2) Junior Secondary Schools out of 21 selected
Secondary Schools in Barkin-Ladi LGA. Two instruments used for data collection in this
study were Mathematics Attitude Questionnaire (MAQ) and Mathematics Achievement Test
(MAT). The frequency counts, mean, standard deviations were used to answer the research
questions and a t-test for independent samples was used for testing the hypothesis. It was a
rating scale and marking scheme. The response type of the question was patterned in form of
modified four point Likert rating scale of Strongly Agree 4 points, Agree 3 points, Disagree 2
points and Strongly Disagree I point was used the scorning of items were scored (1) for
correct and (0) for wrong answers. The frequency counts, mean, standard deviation and a t-
Nigerian Journal of Educational Research and Evaluation
75
test for independent samples at 0.05 level of significance to determine the P-Value The mean
gain shows the difference between the Pre-test and Post-test scores.
Results
Table 1: Students’ Mathematics Performance before Exposure to Formative Assessment with
Feedback.
Number of students Mean Maths performance
score
SD
120 7.96 3.21
Table 2: Analysis showing the Mathematics performance means scores of students after
exposure to formative assessment with feedback.
Group Pre-test Mean Score Post-test Mean Score Mean Gain
Experimental 7.87 12.87 5.0
Control 8.00 9.75 1.75
Table 3: A ( correlated t-test Analysis for Pre-test and Post-test Mathematics performance
Mean Scores of Students in the Experimental Group.
Test N Mean SD df t P-value Remark
Pre-test 60 7.87 3.09
59
-25.324
.000
Significant
Post-test 60 12.87 3.19
P < 0.05
Discussion of Results
The findings of this study revealed that formative assessment with feedback has tremendous
impact on the attitude and performance of JSS II students in Mathematics. Three research
questions were raised and answered and a hypothesis tested. The researcher went further to
compare the students’ performance mean scores to get their mean gain score. The mean gain
scores revealed that the post-test of the experimental group gained more in performance than
their pre-test mean scores and the following findings were reached.
The table 1 above shows the mean and standard deviation of 7.96 out of 20 and 3.21
respectively of 120 students who were given a pre-test in Mathematics. This shows that the
performance of students before exposure to formative assessment with feedback was on the
average. The minimum score was 2 and maximum score of 14.
Analysis from the table 2 above shows that the mean gain of students in the
experimental group is 5.0 while that of the control group is 1.75. This implies that the
treatment was effective since the mean gain of the experimental group is greater than that of
the control group.
Effects of Formative Assessment with Feedback on Junior Secondary School Students’....
76
Table 3 above shows the t-test for the paired samples that the P-value of 0.000 is less
than 0.05 level of significance, by this result, the null hypothesis is rejected and the
alternative which states that there is a significant difference between the pre-test and post-test
Mathematics performance mean scores of students in the experimental group is retained. The
post-test mean scores 12.87 is higher than 7.87 for the pre-test. The statistically significant
difference in the students’ performance mean scores and standard deviations implies that
students who were exposed to formative assessment with feedback (experimental group)
outperformed those who were not exposed.
Having positive attitude towards Mathematics, leads to improved performance in
Mathematics. This therefore corroborate with the submission of Blair, Jones & Simpson in
Murphy, (2003). Adeniyi (2001) and Ojugo et’al (2003) that positive attitude towards
learning are associated with success, while unfavourable attitude cause backwardness and
retardation. The study goes on to reveal that formative assessment with feedback helps in
increasing positive attitude of students towards Mathematics which translated into high
achievement for students. Teachers therefore, need to understand the various dimensions of
attitudes so as to help the students build positive attitude towards learning.
Using formative assessment with feedback to teach students, leads to better
performance of students as findings in the study shows that there is no significant difference
in the performance of students in the control and experimental groups before they were
exposed to formative assessment with feedback. But after the treatment was administered, the
results revealed that there is a significant difference between the performance of students
who were exposed to the treatment and those who were not. Students who were exposed to
the treatment outperformed the students who were not exposed. The above findings is in line
with the findings of the following literature Irons, (2008), Ajogbeje & Folorunso (2012) and
Tahir, Tarig and Khalid (2012) who reported that formative assessment with feedback is an
important tool with great tendency of improving students’ performance when it is rightly
applied.
Since this method of assessment and instruction has been found to uncover
opportunities for instructional intervention and help in information delivery while there is
still time in the school year to improve students’ achievement, it’s the researchers’ judgment
that Mathematics teachers should adopt the formative assessment feedback strategies in
teaching the subject so as to help improve the learning of Mathematics.
Conclusion
The study discovered the following as the effect of formative assessment with feedback on
student attitude and performance in Mathematics:
1. Students in both experimental and control groups performed averagely before the
administration of treatment.
2. Students in the experimental group showed a more positive attitude to Mathematics
after treatment which entailed the effectiveness of formative assessment with
feedback.
Nigerian Journal of Educational Research and Evaluation
77
3. The treatment of formative assessment with feedback affects students positively since
treatment group outperformed higher than no treatment group
4. Both male and female students indicated high performance in Mathematics after
receiving treatment.
With the above, the following conclusions were made:
• Attitude of students towards the learning of Mathematics improved through the effective
use of formative assessment feedback strategy in teaching and learning process.
• Formative assessment with feedback as an instructional strategy has a great potential of
improving the performance of students who are exposed to it because the performance of
students in the experimental group greatly improved after they were exposed to the
treatment.
Recommendations
The following recommendations were made based on the findings of the study:
1. Mathematics teachers should adopt formative assessment strategy in teaching the
subject so as to help improve the learning of Mathematics that appears difficult to
students.
2. Teachers should always ensure that prompt feedback is given to students either orally
or in hard copies while students’ areas of weakness should be attended to through a
tutorial or remedial class.
3. Mathematics teachers should receive training programs to equip them with knowledge
and skills to enable them use formative assessment with feedback for their
Mathematics lessons.
References
Abdul-Raheem, B. O. (2010). Relative effect of problem-solving and Discussion Methods on
Secondary Schools Students’ Achievement in Social Studies. PhD. Thesis,
Unpublished . Ado-Ekiti, Nigeria; University of Ado-Ekiti.
Adeniji, J. T. (2001). West African Examination Council, reports on low candidature
subjects. STAN 41st annual conference national officers report. Ibadan.
Ajogbeje, O. J. (2012). Effect of Formative testing on Students’ Achievement in Junior
Secondary School Mathematics, European Screntific Journal, 8(8), 94-105.
Ajogbeje, O. J. & Folorunso, A.M. (2012). Effect of Feedback and Remediation on students’
Achievement in Junior Secondary School Mathematics. International Journal of
Education studies, 5(5), 153-162.
Ajogbeje, O. J. (2013). Effect of Formative Testing with Feedback on students Achievement
in Junior Secondary School Mathematics in Ondo state Nigeria: International
Journal of Education Researrch Vol 2, 08-20.
Effects of Formative Assessment with Feedback on Junior Secondary School Students’....
78
Clark, I. (2011). Formative assessment: Policy, Perspectives and practices. Florida Journal
of Educational Administration & policy, 4(2) 158-180.
Crooks, T. (2001). The validity of Formative Assessment, Paper presented to the British
Educational Research Association Annual Conference, University of Leeds, 13-15
September.
Harbor-Peters, V. F. A. (2001). Unmasking some aversive aspects of school Mathematics and
strategies for averting them. Inaugural lecture, University of Nigeria, Nsuks. Enugu:
Snap Press Ltd.
Hornby, W. (2005). Dogs, Stars, rolls royces and old double – decker buses: efficiency and
effectiveness in an assessment. in Quality Assurance Agency Scotland (Ed.)
Reflections on assessment volume 1. Mansfield: Quality Assurance Agency, 15- 28.
Irons, A. (2008). Enhancing Learning through formative assessment and feedback. London;
New York: Routledge.
Mato, M. & De la Torre, E. (2010). Evalucio’n de las actitudes hacia las malematicas y el
rendimento acade’ mico, PNA, Vol. 5, no. 1,197-208.
Murphy, J. (2003). Reculturing the profession of educational leadership: New blueprints.
Commission papers, national commission for the Advancement of Educational
Leadership Preparation.
Nicol, D. (2009). Quality enhancement themes: the first year experience – Transforming
assessment and feedback: enhancing integration and empowerment in the first year.
Mansfield: Quality Assurance Agency.
Obodo, G.C. (2010). Promoting Mathematics teaching and learning in schools. An essential
factor for universal basic education in Nigeria. “ Proceedings of the annual
conferences of Mathematics association of Nigeria” Abuja September 12.
Odumosu, M. O., Oluwayemi, M.O. & Olatunde, T.O. (2012). Mathematics as a tool in
Technological acquisition and Economical Development in transforming Nigeria to
attend vision 20;20;20 A Proceeding of Mathematical Association of Nigeria (MAN)
Annual National Conference , 199-207
OECD, (2005). Formative Assessment: Improving Learning in Secondary Classrooms,
OECD, Paris.
Ojugo, A. A; Ugboh, E; Onochie, C. C; Eboka, A. O; Yerokun, M. O. & Iyawa, I. J. B.
(2013). Effects of Formative Test and Attitudinal Types on Studennts’ Achievement
in Mathematics in Nigeria: African Educational Research Journal. Vol. 1(2), 113-
117.
Olagunju, A. M. (2015). Effect of Formative assessment on students’ academic achievement
in Mathematics in Senior Secondary School. International Journal of Education and
Research. Vol. 3 No. 10 October 2015 ISSN: 2411-5681.
Philas, O. Y. (2012). Teaching/Learning Resources and Academic performance in
Mathematics in Secondary School in Bondo District of Kenya; Asian Social. Vol.
No. 12, 126-132.
Nigerian Journal of Educational Research and Evaluation
79
Tashir, M; Tariq, H. & Khalid, M. (2012). Impact of Formative Assessment on academic
achievement of Secondary School students. International Journal of Business and
Social Science.Vol. 17(3).
Ugodulunwa, C. A. (2008). Fundamentals of Educational Measurements, Jos: Fab.
Educational Books Nig.
Zou, P. X. W. (2008). Designing effective assessment in postgraduate construction project
management studies. Journal for Education in the Built Environment, 4(2), 80-94.
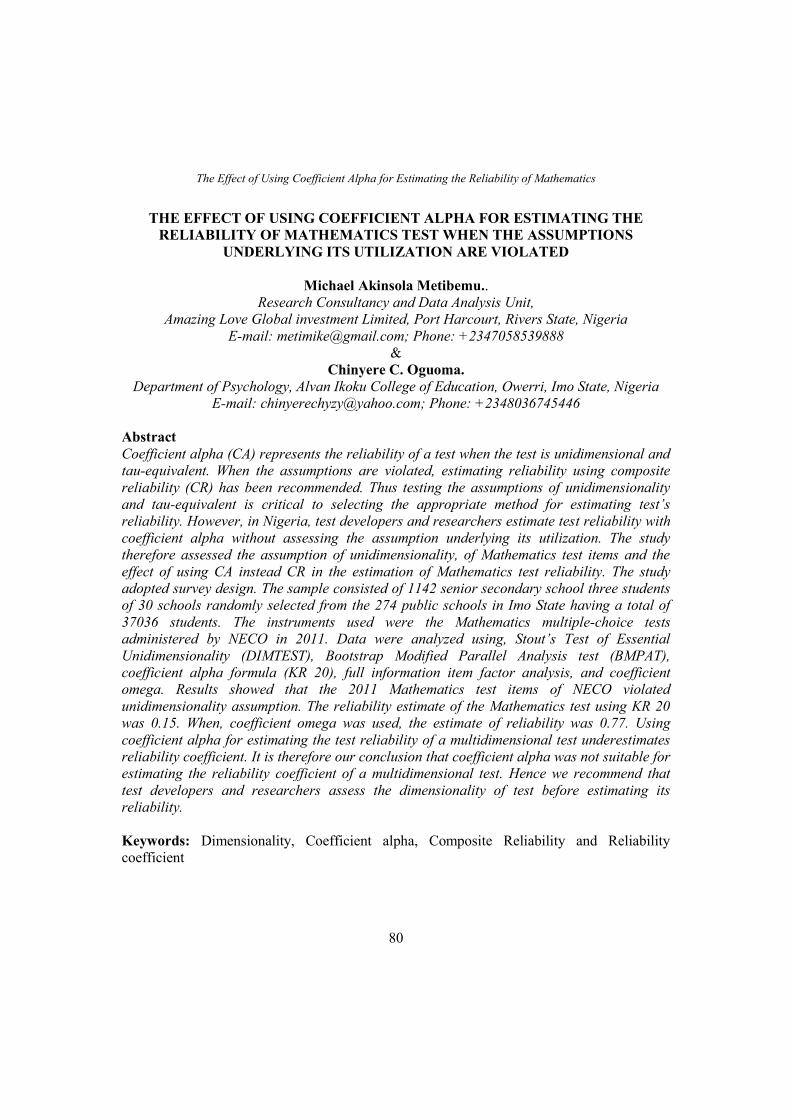
The Effect of Using Coefficient Alpha for Estimating the Reliability of Mathematics
80
THE EFFECT OF USING COEFFICIENT ALPHA FOR ESTIMATING THE
RELIABILITY OF MATHEMATICS TEST WHEN THE ASSUMPTIONS
UNDERLYING ITS UTILIZATION ARE VIOLATED
Michael Akinsola Metibemu..
Research Consultancy and Data Analysis Unit,
Amazing Love Global investment Limited, Port Harcourt, Rivers State, Nigeria
E-mail: [email protected]; Phone: +2347058539888
&
Chinyere C. Oguoma.
Department of Psychology, Alvan Ikoku College of Education, Owerri, Imo State, Nigeria
E-mail: [email protected]; Phone: +2348036745446
Abstract
Coefficient alpha (CA) represents the reliability of a test when the test is unidimensional and
tau-equivalent. When the assumptions are violated, estimating reliability using composite
reliability (CR) has been recommended. Thus testing the assumptions of unidimensionality
and tau-equivalent is critical to selecting the appropriate method for estimating test’s
reliability. However, in Nigeria, test developers and researchers estimate test reliability with
coefficient alpha without assessing the assumption underlying its utilization. The study
therefore assessed the assumption of unidimensionality, of Mathematics test items and the
effect of using CA instead CR in the estimation of Mathematics test reliability. The study
adopted survey design. The sample consisted of 1142 senior secondary school three students
of 30 schools randomly selected from the 274 public schools in Imo State having a total of
37036 students. The instruments used were the Mathematics multiple-choice tests
administered by NECO in 2011. Data were analyzed using, Stout’s Test of Essential
Unidimensionality (DIMTEST), Bootstrap Modified Parallel Analysis test (BMPAT),
coefficient alpha formula (KR 20), full information item factor analysis, and coefficient
omega. Results showed that the 2011 Mathematics test items of NECO violated
unidimensionality assumption. The reliability estimate of the Mathematics test using KR 20
was 0.15. When, coefficient omega was used, the estimate of reliability was 0.77. Using
coefficient alpha for estimating the test reliability of a multidimensional test underestimates
reliability coefficient. It is therefore our conclusion that coefficient alpha was not suitable for
estimating the reliability coefficient of a multidimensional test. Hence we recommend that
test developers and researchers assess the dimensionality of test before estimating its
reliability.
Keywords: Dimensionality, Coefficient alpha, Composite Reliability and Reliability
coefficient
Nigerian Journal of Educational Research and Evaluation
81
Introduction
In assessing students’ performance in school subjects, achievement tests are used. The
reliability of these achievement tests provides the measure used in assessing the precision of
the test scores obtained on the tests. Reliability is defined as the correlation between
observed total scores of two parallel tests or between test scores on two repeated
administrations (Spearman, 1904). In the same vein, Oosterwijk, Ark and Sijtsma, (2017)
state that reliability measures the degree to which test scores can be repeated under identical
test administration conditions, in which neither the examinee (with respect to the measured
attribute) nor the test (with respect to content) has changed. Test score reliability is
important for the following reasons: it provides a measure of the extent to which an
examinee’s score reflect random measurement error and; it’s a precursor to test validity
(Wells &Wollack, 2003). Thus assessing test score reliability is of utmost importance in
educational assessment.
In assessing test reliability several methods have been developed. Carmines &Zellar,
1979) listed four methods which include: the retest methods, the alternative-form method, the
split-halves method, and the internal consistency method. Some scholars postulate that there
are three types of coefficients of reliability: stability (which is test re-test method), alternate
forms and internal consistency (under which are the split-half technique, Spearman-Brown
prophecy method, Flanagan method, Kuder-Richardson (KR) method of rational equivalence,
Cronbach alpha, Composite reliability) (Thomas, Nelson and ,Silverman 2015; Miller &
Lovler, 2016; Dilorio2005)
The test retest method is described as one of the easiest ways to estimate the
reliability of empirical measurement. In the retest method, the same test is given to the same
people after a period of time (Carmines & Zellar (1979)). The scores from the first and
second administrations are then compared using correlation. This method of estimating
reliability allows the examination of the stability of test scores over time and provides an
estimate of test’s reliability/precision (Miller & Lovler, 2016). The rate of change of a
variable is important in determining the length of time between the administrations of the
tests. Most authors suggest a minimum of two weeks to reduce the effects of memory and no
more than one month to reduce the chance of change in the amount of the phenomenon
reported (Nunnally & Bernstein, 1994; Dilorio, 2005). The interval between the two
administrations may vary from a few hours to several years. The test-retest reliability will
decline as the interval between the two administrations lengthens (Miller &Lovler, 2016).
Thomas et al (2015) emphasize that the interval cannot be so long that actual changes in
ability, maturation and learning occur between the two administrations of the test. Intra class
correlation can be used to compute the coefficient of stability of the scores on the two tests.
Using ANOVA procedures, the tester can determine the amount of variance accounted for by
the separate days of testing, test trial differences, participant differences and error variance
(Thomas et al, 2015).
The alternate-forms or alternative-form method is used extensively in education and
is also referred to as parallel-form method or the equivalence-method (Thomas et al, 2015;
The Effect of Using Coefficient Alpha for Estimating the Reliability of Mathematics
82
Carmines & Zellar, 1979). The alternate-form involves examinees taking two whole-test
replications, each on a different occasion. The time interval between the two administrations
is usually shorter than the test retest reliability, but should be long enough to minimize
fatigue (Meyer, 2010). In addition, the alternate-form method differs from the test retest
method as it is an alternative form of test that is given on second administration and not the
same test as is the case with the test retest method (Carmines & Zellar, 1979). The two tests
administered in this method are intended to measure the same thing and the two tests
typically are at approximately the same level of difficulty. The scores on the two tests are
correlated to obtain a reliability coefficient (Thomas et al, 2015). The alternate-form method
is widely used with standardized tests (i.e. those of achievement and scholastic aptitude).
Thomas et al. Explaining the alternate-form method succinctly Webb, Shavelson & Haertel
(2006) state that designing an alternate-form reliability study involves creating two parallel
forms of the test, say Form 1 and Form 2, and giving the two forms of the test on the same
day. In this case, the correlation between scores on Forms 1 and 2 yields the test’s (either
form’s) reliability, also referred to as a coefficient of equivalence. This method is based on
comparison of forms and not occasions. It is therefore not a coefficient of stability but a
coefficient of equivalence. The primary source of error is test forms but other sources of error
like fatigue and learning are also at play. The coefficient shows the degree to which test
forms are substitutable. The alternate forms co-efficient is high when test forms are similar
and observed scores are not unfavorably affected by test-form specific content. On the other
hand, as the compositions and difficulty between the two forms diverge, alternate form co-
efficient decreases. The alternative test forms have been criticized as creating two test forms
can be cost prohibitive (Meyer 2010). Also, it is also practically difficult to construct two
tests that are parallel. It is often difficult to construct one form of a test talk less of two forms
that display the properties of parallel measurement (Carmines & Zellar, 1979).
The stability and alternate forms are fraught with weaknesses because of the factor of
memory and fatigue involved in repeated testing. Therefore, reliability is usually based on
single administration because it is rare to have either parallel tests or repeated testing (Sha &
Ackerman, 2017). Corroborating this view Oosterwijk, Ark and Sijtsma, (2017) state that
since, perfect repeatability of test is hampered by random influences beyond the test
administrator’s control, researchers usually collect item scores based on one test
administration and use methods to approximate reliability based on this single data set. The
test retest and alternate-forms reliability are logistically inconvenient. This is because its
either the same sample of people must be tested on two occasions or more than one form of a
test needs to be developed to find the reliability of a single form. The difficulties inherent in
the test retest and alternate forms led to the advent of the solution to calculate reliability of a
single form of a test has a long and illustrious history (Webb, Shavelson & Haertel, 2006;
Dilorio, 2005).
The internal consistency is the single administration method of reliability
assessment. Reliability coefficients can be obtained by several methods that are classified as
Nigerian Journal of Educational Research and Evaluation
83
internal consistency techniques. These methods are: split-half technique, flanagan method,
Cronbach alpha, Gutterman’s methods etc.
The split-half method has been widely used for written tests and occasionally in
performance tests that require numerous trials (Thomas et al, 2015). This method requires the
division of the administered test into two, and the two halves are then correlated. This
method has been considered controversial by several authors. This is because of the difficulty
in defining halves of a test- the first versus the last half? Odd-even halves?Random halves?
(Webb, Shavelson & Haertel, 2006; Carmines & Zellar, 1979). For example, there are twenty
possible ways for a six-item scale to be divided into two equal parts. The reliability estimates
for these twenty divisions are likely to vary, and in some cases these differences could be
large (Dilorio 2005). The method is also deemed unsatisfactory because fatigue may setting
in at the end of the test and easier questions can be placed in the first half. Dilorio (2005)
considered the split half method to be conceptually similar to the alternate form method as
each half of the instrument is considered to be one form of test is divided into two equal
parts.
The split half method tends to underestimate reliability (Jaeger, 1993) because the
correlation is between the two-halves of the test, the reliability coefficient represents only
half of the total test; that is, behavior is sampled only half as thoroughly (Thomas et al,
2015). This led to the development of a step-up procedure Spearman-Brown prophecy
formula regarded as the adjustment formula, which is used to estimate the reliability of the
entire test because the total test is based on twice the number of items (Thomas et al, 2015).
Dilorio 2005 also stated that because shorter tests (half of the test) generally have lower
internal consistency reliability than longer ones, an adjustment is needed to reflect the
reliability of the total instrument. The Spearman-Brown formula is used for this adjustment.
Jaeger (1993) emphasized that the split-half reliability coefficients when adjusted using the
Spearman-Brown prophecy formula might overestimate the true reliability of a measurement
procedure.
Flanagan method is a process for estimating reliability in which the test is split into
two halves, and the variances of the halves of the test are analysed in relation to the total
variance of the test (Thomas et al, 2015). Another alternative method to the split-half method
of estimating reliability is the Cronbach alpha. Cronbach’s α is the mostly widely used
reliability estimate (Sha & Ackerman, 2017; Sijtsma 2009 ). This is because it solves the
problems of deciding which two-part split is best for estimating reliability. Coefficient alpha
(eponymously referred to as Cronbach’s alpha) is the average of all possible split-half
Spearman-Brown reliability estimates (Cronbach, 1951) .In this approach, each item is
correlated with every other item on the instrument. Coefficient alpha is computed by taking
the average of the individual item-to-item correlations and adjusting for the number of items.
Its advantage as compared to split-half is that only one value of coefficient alpha can be
computed for an instrument. Coefficient alpha can be computed using either the correlation
or the variance-covariance matrix (Dilorio, 2005). This method of estimating reliability is
suitable for binary and polytomous items or a combination of both (Meyer, 2010). Kuder-
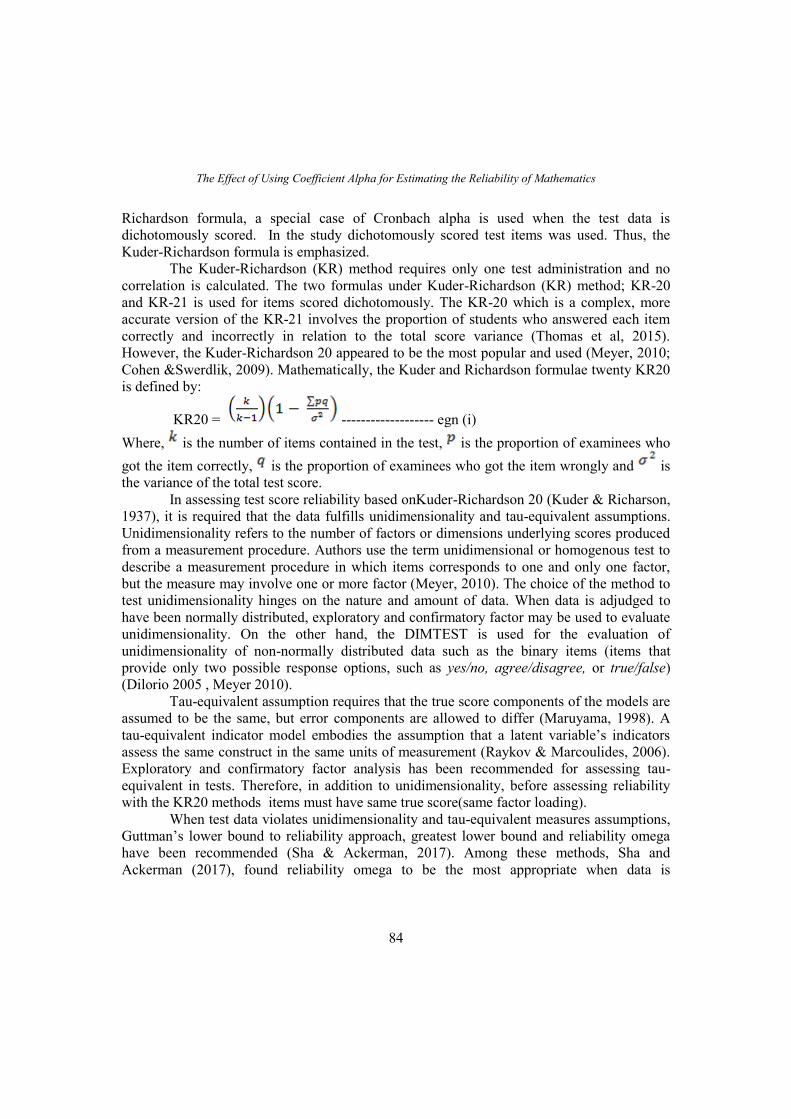
The Effect of Using Coefficient Alpha for Estimating the Reliability of Mathematics
84
Richardson formula, a special case of Cronbach alpha is used when the test data is
dichotomously scored. In the study dichotomously scored test items was used. Thus, the
Kuder-Richardson formula is emphasized.
The Kuder-Richardson (KR) method requires only one test administration and no
correlation is calculated. The two formulas under Kuder-Richardson (KR) method; KR-20
and KR-21 is used for items scored dichotomously. The KR-20 which is a complex, more
accurate version of the KR-21 involves the proportion of students who answered each item
correctly and incorrectly in relation to the total score variance (Thomas et al, 2015).
However, the Kuder-Richardson 20 appeared to be the most popular and used (Meyer, 2010;
Cohen &Swerdlik, 2009). Mathematically, the Kuder and Richardson formulae twenty KR20
is defined by:
KR20 = ------------------- egn (i)
Where, is the number of items contained in the test, is the proportion of examinees who
got the item correctly, is the proportion of examinees who got the item wrongly and is
the variance of the total test score.
In assessing test score reliability based onKuder-Richardson 20 (Kuder & Richarson,
1937), it is required that the data fulfills unidimensionality and tau-equivalent assumptions.
Unidimensionality refers to the number of factors or dimensions underlying scores produced
from a measurement procedure. Authors use the term unidimensional or homogenous test to
describe a measurement procedure in which items corresponds to one and only one factor,
but the measure may involve one or more factor (Meyer, 2010). The choice of the method to
test unidimensionality hinges on the nature and amount of data. When data is adjudged to
have been normally distributed, exploratory and confirmatory factor may be used to evaluate
unidimensionality. On the other hand, the DIMTEST is used for the evaluation of
unidimensionality of non-normally distributed data such as the binary items (items that
provide only two possible response options, such as yes/no, agree/disagree, or true/false)
(Dilorio 2005 , Meyer 2010).
Tau-equivalent assumption requires that the true score components of the models are
assumed to be the same, but error components are allowed to differ (Maruyama, 1998). A
tau-equivalent indicator model embodies the assumption that a latent variable’s indicators
assess the same construct in the same units of measurement (Raykov & Marcoulides, 2006).
Exploratory and confirmatory factor analysis has been recommended for assessing tau-
equivalent in tests. Therefore, in addition to unidimensionality, before assessing reliability
with the KR20 methods items must have same true score(same factor loading).
When test data violates unidimensionality and tau-equivalent measures assumptions,
Guttman’s lower bound to reliability approach, greatest lower bound and reliability omega
have been recommended (Sha & Ackerman, 2017). Among these methods, Sha and
Ackerman (2017), found reliability omega to be the most appropriate when data is
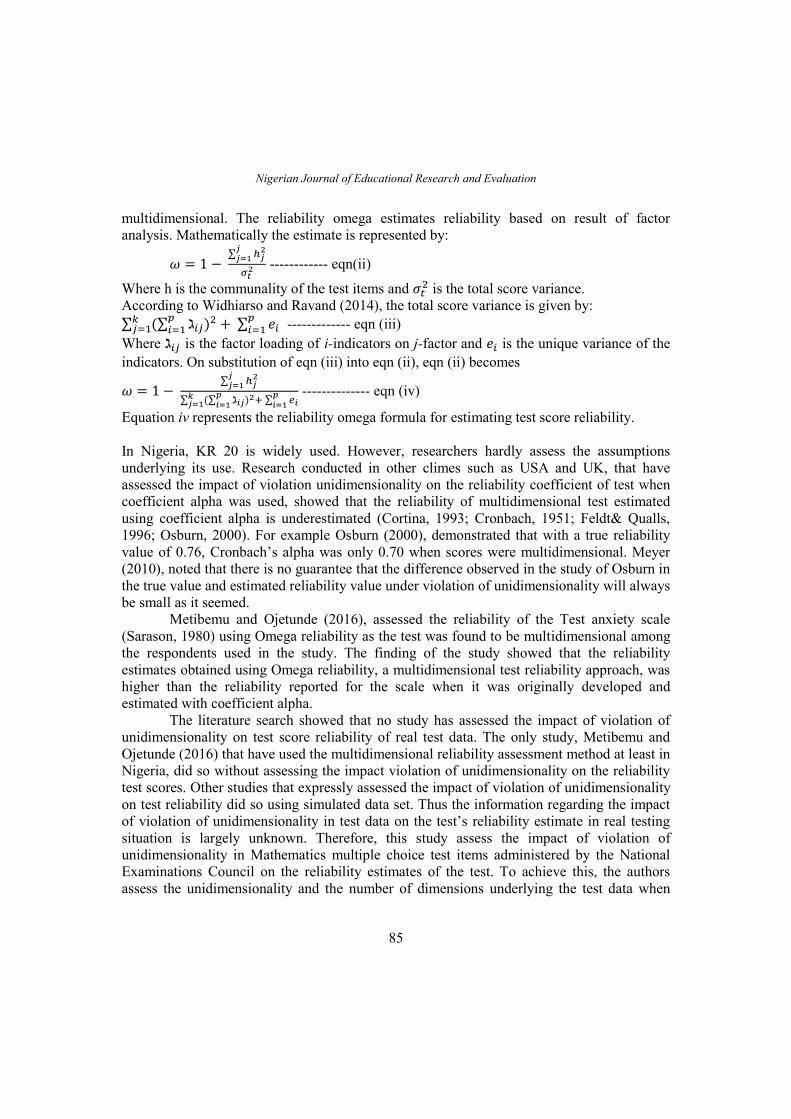
Nigerian Journal of Educational Research and Evaluation
85
multidimensional. The reliability omega estimates reliability based on result of factor
analysis. Mathematically the estimate is represented by:
𝜔 = 1 − ∑ ℎ𝑗
2𝑗𝑗=1
𝜎𝑡2 ------------ eqn(ii)
Where h is the communality of the test items and 𝜎𝑡2 is the total score variance.
According to Widhiarso and Ravand (2014), the total score variance is given by:
∑ (∑ ℷ𝑖𝑗𝑝𝑖=1 )2𝑘
𝑗=1 + ∑ 𝑒𝑖𝑝𝑖=1 ------------- eqn (iii)
Where ℷ𝑖𝑗 is the factor loading of i-indicators on j-factor and 𝑒𝑖 is the unique variance of the
indicators. On substitution of eqn (iii) into eqn (ii), eqn (ii) becomes
𝜔 = 1 − ∑ ℎ𝑗
2𝑗𝑗=1
∑ (∑ ℷ𝑖𝑗𝑝𝑖=1 )2𝑘
𝑗=1 + ∑ 𝑒𝑖𝑝𝑖=1
-------------- eqn (iv)
Equation iv represents the reliability omega formula for estimating test score reliability.
In Nigeria, KR 20 is widely used. However, researchers hardly assess the assumptions
underlying its use. Research conducted in other climes such as USA and UK, that have
assessed the impact of violation unidimensionality on the reliability coefficient of test when
coefficient alpha was used, showed that the reliability of multidimensional test estimated
using coefficient alpha is underestimated (Cortina, 1993; Cronbach, 1951; Feldt& Qualls,
1996; Osburn, 2000). For example Osburn (2000), demonstrated that with a true reliability
value of 0.76, Cronbach’s alpha was only 0.70 when scores were multidimensional. Meyer
(2010), noted that there is no guarantee that the difference observed in the study of Osburn in
the true value and estimated reliability value under violation of unidimensionality will always
be small as it seemed.
Metibemu and Ojetunde (2016), assessed the reliability of the Test anxiety scale
(Sarason, 1980) using Omega reliability as the test was found to be multidimensional among
the respondents used in the study. The finding of the study showed that the reliability
estimates obtained using Omega reliability, a multidimensional test reliability approach, was
higher than the reliability reported for the scale when it was originally developed and
estimated with coefficient alpha.
The literature search showed that no study has assessed the impact of violation of
unidimensionality on test score reliability of real test data. The only study, Metibemu and
Ojetunde (2016) that have used the multidimensional reliability assessment method at least in
Nigeria, did so without assessing the impact violation of unidimensionality on the reliability
test scores. Other studies that expressly assessed the impact of violation of unidimensionality
on test reliability did so using simulated data set. Thus the information regarding the impact
of violation of unidimensionality in test data on the test’s reliability estimate in real testing
situation is largely unknown. Therefore, this study assess the impact of violation of
unidimensionality in Mathematics multiple choice test items administered by the National
Examinations Council on the reliability estimates of the test. To achieve this, the authors
assess the unidimensionality and the number of dimensions underlying the test data when
The Effect of Using Coefficient Alpha for Estimating the Reliability of Mathematics
86
violation of unidimensionality is evident in the test data. Thereafter the reliability of the test
scores was estimated using KR20 formula and omega reliability based on the number of
factor underlying the test data.
Research question
1. How does the 2011 NECO Mathematics multiple choice test fulfill unidimensionality
assumption?
2. How many dimensions underlie the 2011 NECO Mathematics multiple choice test?
3. What is the reliability coefficient of 2011 NECO Mathematics multiple choice test under
KR20 formula?
4. What is the reliability coefficient of 2011 NECO Mathematics multiple choice test under
Omega reliability method of reliability?
Method
The study adopted survey design. The sample used consisted of 1142 senior secondary
school three students of 30 schools randomly selected from the 274 public schools in Imo
State having a total of 37036 students. Data was analyzed using, Stout’s Test of Essential
Unidimensionality and full information Item factor analysis. The instrument used for data
collection is the 2011 NECO Mathematics multiple choice test. Prior to the analysis of the
data, the responses of the examinees to the test items were marked. Correct answers attracted
a score of 1, while incorrect answers attracted a score of 0. Thereafter, the scored responses
were collated.
Results
Research question 1: Does the 2011 NECO Mathematics multiple choice test fulfill
unidimensionality assumption?
To answer this research question, the collated marked Mathematics test was subjected to the
Stout’s test of essential unidimensionality, a procedure implemented in DIMTEST (Stout,
2005).
Stout’s test of essential unidimensionality, implemented in DIMTEST 2.0 (Stout,
2005), was used to test the assumption of unidimensionality. Using a sample of 30% of the
examinees, items 3, 11, 12, 18, 22, 24, 30, 38, 40, 41, 45, 48, 49, 51, 57 and 60 were
empirically identified by the HCA/CCPROX cluster procedure as the cluster most likely to
form a secondary dimension. Using the remainder of the sample for the test of essential
unidimensionality under the null hypothesis that the responses are unidimensional (the
average covariance within groups = 0), so failure to reject the null hypothesis indicates that
the assumption of unidimensionality is tenable. Table 1 presents the result.
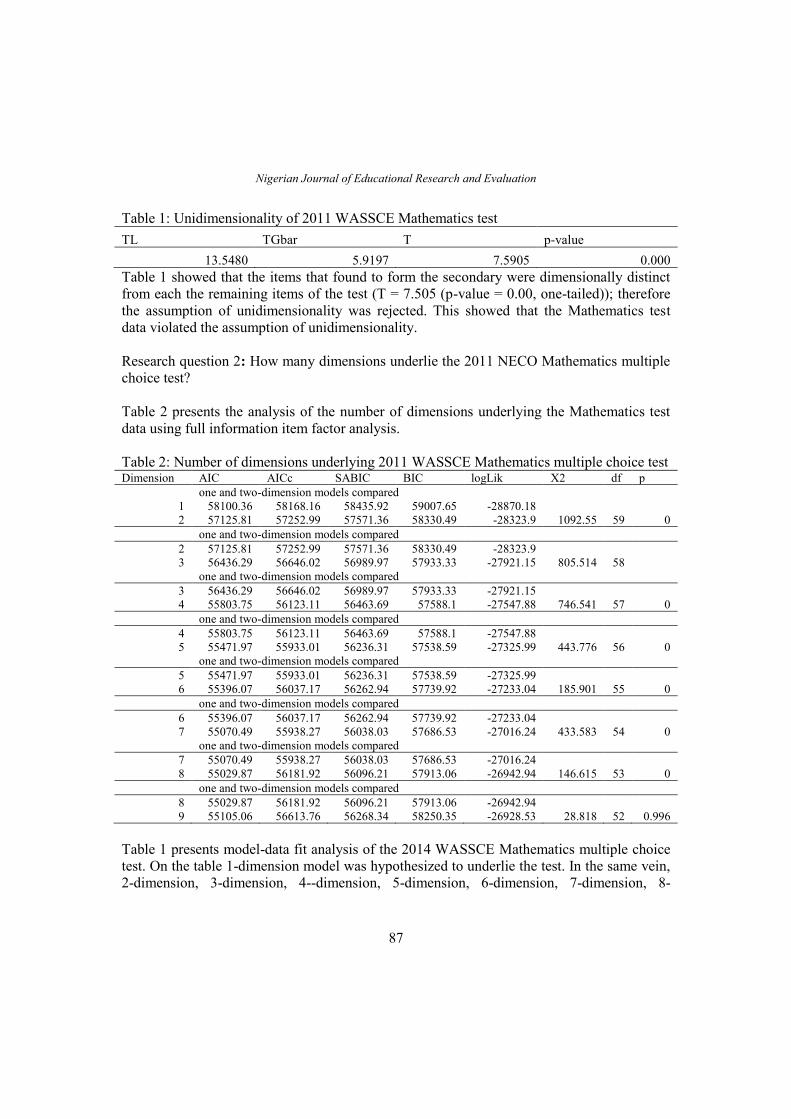
Nigerian Journal of Educational Research and Evaluation
87
Table 1: Unidimensionality of 2011 WASSCE Mathematics test
TL TGbar T p-value
13.5480 5.9197 7.5905 0.000
Table 1 showed that the items that found to form the secondary were dimensionally distinct
from each the remaining items of the test (T = 7.505 (p-value = 0.00, one-tailed)); therefore
the assumption of unidimensionality was rejected. This showed that the Mathematics test
data violated the assumption of unidimensionality.
Research question 2: How many dimensions underlie the 2011 NECO Mathematics multiple
choice test?
Table 2 presents the analysis of the number of dimensions underlying the Mathematics test
data using full information item factor analysis.
Table 2: Number of dimensions underlying 2011 WASSCE Mathematics multiple choice test Dimension AIC AICc SABIC BIC logLik X2 df p
one and two-dimension models compared
1 58100.36 58168.16 58435.92 59007.65 -28870.18 2 57125.81 57252.99 57571.36 58330.49 -28323.9 1092.55 59 0
one and two-dimension models compared
2 57125.81 57252.99 57571.36 58330.49 -28323.9 3 56436.29 56646.02 56989.97 57933.33 -27921.15 805.514 58
one and two-dimension models compared
3 56436.29 56646.02 56989.97 57933.33 -27921.15 4 55803.75 56123.11 56463.69 57588.1 -27547.88 746.541 57 0
one and two-dimension models compared
4 55803.75 56123.11 56463.69 57588.1 -27547.88 5 55471.97 55933.01 56236.31 57538.59 -27325.99 443.776 56 0
one and two-dimension models compared
5 55471.97 55933.01 56236.31 57538.59 -27325.99 6 55396.07 56037.17 56262.94 57739.92 -27233.04 185.901 55 0
one and two-dimension models compared
6 55396.07 56037.17 56262.94 57739.92 -27233.04 7 55070.49 55938.27 56038.03 57686.53 -27016.24 433.583 54 0
one and two-dimension models compared
7 55070.49 55938.27 56038.03 57686.53 -27016.24 8 55029.87 56181.92 56096.21 57913.06 -26942.94 146.615 53 0
one and two-dimension models compared
8 55029.87 56181.92 56096.21 57913.06 -26942.94 9 55105.06 56613.76 56268.34 58250.35 -26928.53 28.818 52 0.996
Table 1 presents model-data fit analysis of the 2014 WASSCE Mathematics multiple choice
test. On the table 1-dimension model was hypothesized to underlie the test. In the same vein,
2-dimension, 3-dimension, 4--dimension, 5-dimension, 6-dimension, 7-dimension, 8-
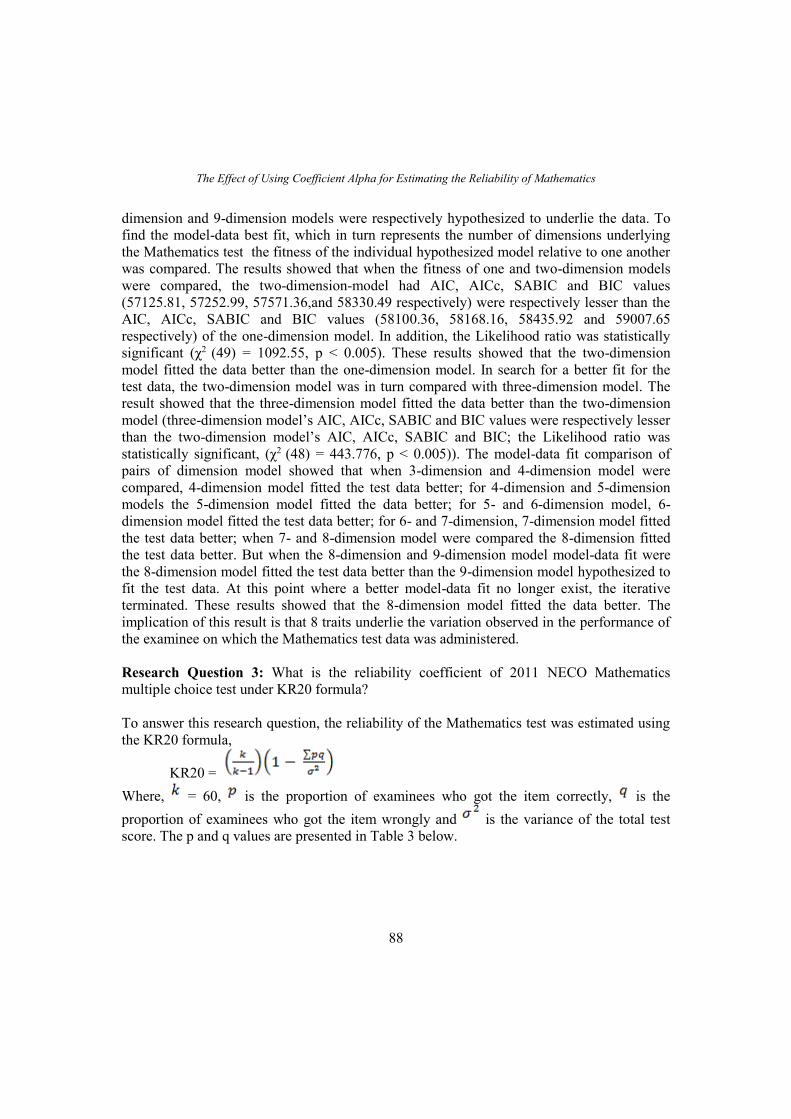
The Effect of Using Coefficient Alpha for Estimating the Reliability of Mathematics
88
dimension and 9-dimension models were respectively hypothesized to underlie the data. To
find the model-data best fit, which in turn represents the number of dimensions underlying
the Mathematics test the fitness of the individual hypothesized model relative to one another
was compared. The results showed that when the fitness of one and two-dimension models
were compared, the two-dimension-model had AIC, AICc, SABIC and BIC values
(57125.81, 57252.99, 57571.36,and 58330.49 respectively) were respectively lesser than the
AIC, AICc, SABIC and BIC values (58100.36, 58168.16, 58435.92 and 59007.65
respectively) of the one-dimension model. In addition, the Likelihood ratio was statistically
significant (χ2 (49) = 1092.55, p < 0.005). These results showed that the two-dimension
model fitted the data better than the one-dimension model. In search for a better fit for the
test data, the two-dimension model was in turn compared with three-dimension model. The
result showed that the three-dimension model fitted the data better than the two-dimension
model (three-dimension model’s AIC, AICc, SABIC and BIC values were respectively lesser
than the two-dimension model’s AIC, AICc, SABIC and BIC; the Likelihood ratio was
statistically significant, (χ2 (48) = 443.776, p < 0.005)). The model-data fit comparison of
pairs of dimension model showed that when 3-dimension and 4-dimension model were
compared, 4-dimension model fitted the test data better; for 4-dimension and 5-dimension
models the 5-dimension model fitted the data better; for 5- and 6-dimension model, 6-
dimension model fitted the test data better; for 6- and 7-dimension, 7-dimension model fitted
the test data better; when 7- and 8-dimension model were compared the 8-dimension fitted
the test data better. But when the 8-dimension and 9-dimension model model-data fit were
the 8-dimension model fitted the test data better than the 9-dimension model hypothesized to
fit the test data. At this point where a better model-data fit no longer exist, the iterative
terminated. These results showed that the 8-dimension model fitted the data better. The
implication of this result is that 8 traits underlie the variation observed in the performance of
the examinee on which the Mathematics test data was administered.
Research Question 3: What is the reliability coefficient of 2011 NECO Mathematics
multiple choice test under KR20 formula?
To answer this research question, the reliability of the Mathematics test was estimated using
the KR20 formula,
KR20 =
Where, = 60, is the proportion of examinees who got the item correctly, is the
proportion of examinees who got the item wrongly and is the variance of the total test
score. The p and q values are presented in Table 3 below.
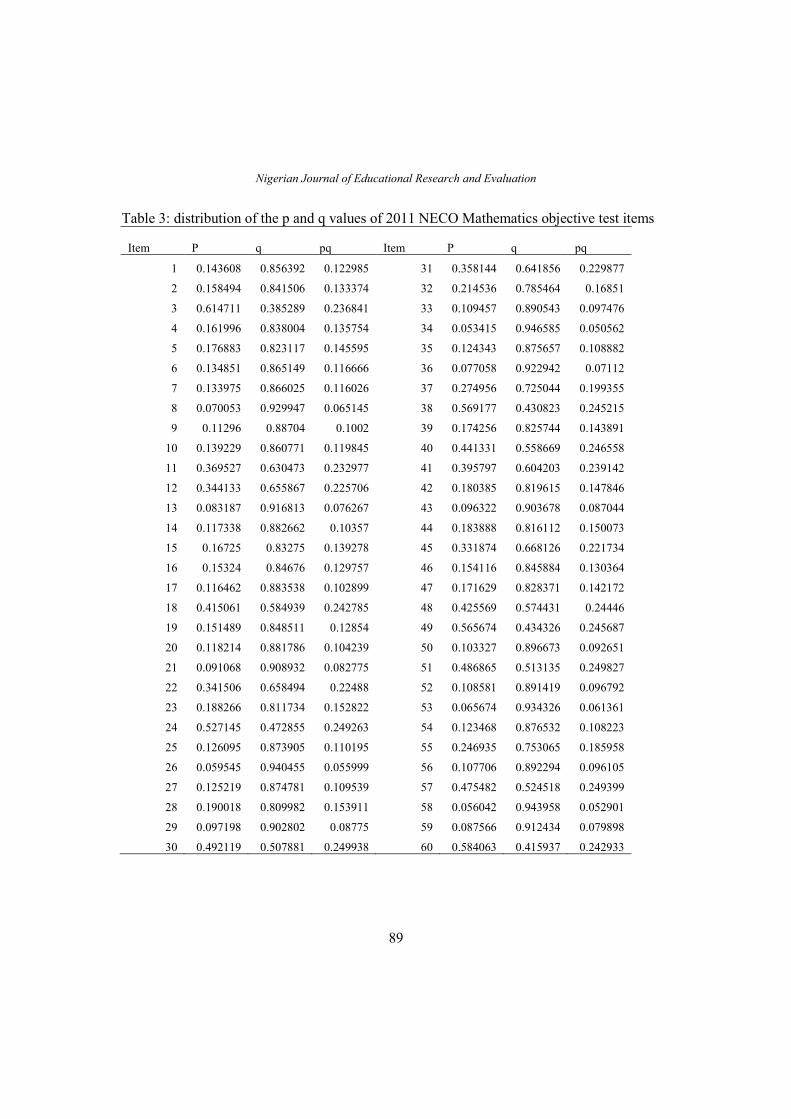
Nigerian Journal of Educational Research and Evaluation
89
Table 3: distribution of the p and q values of 2011 NECO Mathematics objective test items
Item P q pq Item P q pq
1 0.143608 0.856392 0.122985 31 0.358144 0.641856 0.229877
2 0.158494 0.841506 0.133374 32 0.214536 0.785464 0.16851
3 0.614711 0.385289 0.236841 33 0.109457 0.890543 0.097476
4 0.161996 0.838004 0.135754 34 0.053415 0.946585 0.050562
5 0.176883 0.823117 0.145595 35 0.124343 0.875657 0.108882
6 0.134851 0.865149 0.116666 36 0.077058 0.922942 0.07112
7 0.133975 0.866025 0.116026 37 0.274956 0.725044 0.199355
8 0.070053 0.929947 0.065145 38 0.569177 0.430823 0.245215
9 0.11296 0.88704 0.1002 39 0.174256 0.825744 0.143891
10 0.139229 0.860771 0.119845 40 0.441331 0.558669 0.246558
11 0.369527 0.630473 0.232977 41 0.395797 0.604203 0.239142
12 0.344133 0.655867 0.225706 42 0.180385 0.819615 0.147846
13 0.083187 0.916813 0.076267 43 0.096322 0.903678 0.087044
14 0.117338 0.882662 0.10357 44 0.183888 0.816112 0.150073
15 0.16725 0.83275 0.139278 45 0.331874 0.668126 0.221734
16 0.15324 0.84676 0.129757 46 0.154116 0.845884 0.130364
17 0.116462 0.883538 0.102899 47 0.171629 0.828371 0.142172
18 0.415061 0.584939 0.242785 48 0.425569 0.574431 0.24446
19 0.151489 0.848511 0.12854 49 0.565674 0.434326 0.245687
20 0.118214 0.881786 0.104239 50 0.103327 0.896673 0.092651
21 0.091068 0.908932 0.082775 51 0.486865 0.513135 0.249827
22 0.341506 0.658494 0.22488 52 0.108581 0.891419 0.096792
23 0.188266 0.811734 0.152822 53 0.065674 0.934326 0.061361
24 0.527145 0.472855 0.249263 54 0.123468 0.876532 0.108223
25 0.126095 0.873905 0.110195 55 0.246935 0.753065 0.185958
26 0.059545 0.940455 0.055999 56 0.107706 0.892294 0.096105
27 0.125219 0.874781 0.109539 57 0.475482 0.524518 0.249399
28 0.190018 0.809982 0.153911 58 0.056042 0.943958 0.052901
29 0.097198 0.902802 0.08775 59 0.087566 0.912434 0.079898
30 0.492119 0.507881 0.249938 60 0.584063 0.415937 0.242933
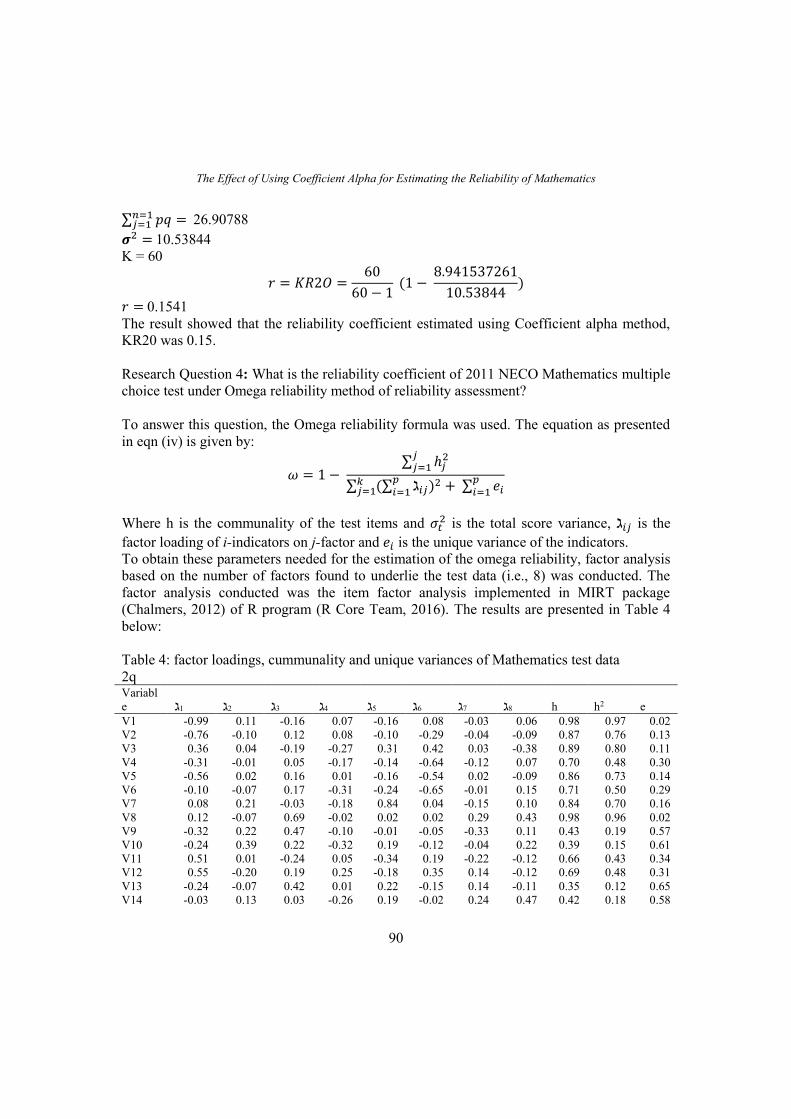
The Effect of Using Coefficient Alpha for Estimating the Reliability of Mathematics
90
∑ 𝑝𝑞 = 𝑛=1𝑗=1 26.90788
𝝈2 = 10.53844
K = 60
𝑟 = 𝐾𝑅2𝑂 =60
60 − 1 (1 −
8.941537261
10.53844)
𝑟 = 0.1541
The result showed that the reliability coefficient estimated using Coefficient alpha method,
KR20 was 0.15.
Research Question 4: What is the reliability coefficient of 2011 NECO Mathematics multiple
choice test under Omega reliability method of reliability assessment?
To answer this question, the Omega reliability formula was used. The equation as presented
in eqn (iv) is given by:
𝜔 = 1 − ∑ ℎ𝑗
2𝑗𝑗=1
∑ (∑ ℷ𝑖𝑗𝑝𝑖=1 )2𝑘
𝑗=1 + ∑ 𝑒𝑖𝑝𝑖=1
Where h is the communality of the test items and 𝜎𝑡2 is the total score variance, ℷ𝑖𝑗 is the
factor loading of i-indicators on j-factor and 𝑒𝑖 is the unique variance of the indicators.
To obtain these parameters needed for the estimation of the omega reliability, factor analysis
based on the number of factors found to underlie the test data (i.e., 8) was conducted. The
factor analysis conducted was the item factor analysis implemented in MIRT package
(Chalmers, 2012) of R program (R Core Team, 2016). The results are presented in Table 4
below:
Table 4: factor loadings, cummunality and unique variances of Mathematics test data
2q Variabl
e
ℷ1
ℷ2
ℷ3
ℷ4
ℷ5
ℷ6
ℷ7
ℷ8
h
h2
e
V1 -0.99 0.11 -0.16 0.07 -0.16 0.08 -0.03 0.06 0.98 0.97 0.02
V2 -0.76 -0.10 0.12 0.08 -0.10 -0.29 -0.04 -0.09 0.87 0.76 0.13
V3 0.36 0.04 -0.19 -0.27 0.31 0.42 0.03 -0.38 0.89 0.80 0.11
V4 -0.31 -0.01 0.05 -0.17 -0.14 -0.64 -0.12 0.07 0.70 0.48 0.30
V5 -0.56 0.02 0.16 0.01 -0.16 -0.54 0.02 -0.09 0.86 0.73 0.14
V6 -0.10 -0.07 0.17 -0.31 -0.24 -0.65 -0.01 0.15 0.71 0.50 0.29
V7 0.08 0.21 -0.03 -0.18 0.84 0.04 -0.15 0.10 0.84 0.70 0.16
V8 0.12 -0.07 0.69 -0.02 0.02 0.02 0.29 0.43 0.98 0.96 0.02
V9 -0.32 0.22 0.47 -0.10 -0.01 -0.05 -0.33 0.11 0.43 0.19 0.57
V10 -0.24 0.39 0.22 -0.32 0.19 -0.12 -0.04 0.22 0.39 0.15 0.61
V11 0.51 0.01 -0.24 0.05 -0.34 0.19 -0.22 -0.12 0.66 0.43 0.34
V12 0.55 -0.20 0.19 0.25 -0.18 0.35 0.14 -0.12 0.69 0.48 0.31
V13 -0.24 -0.07 0.42 0.01 0.22 -0.15 0.14 -0.11 0.35 0.12 0.65
V14 -0.03 0.13 0.03 -0.26 0.19 -0.02 0.24 0.47 0.42 0.18 0.58
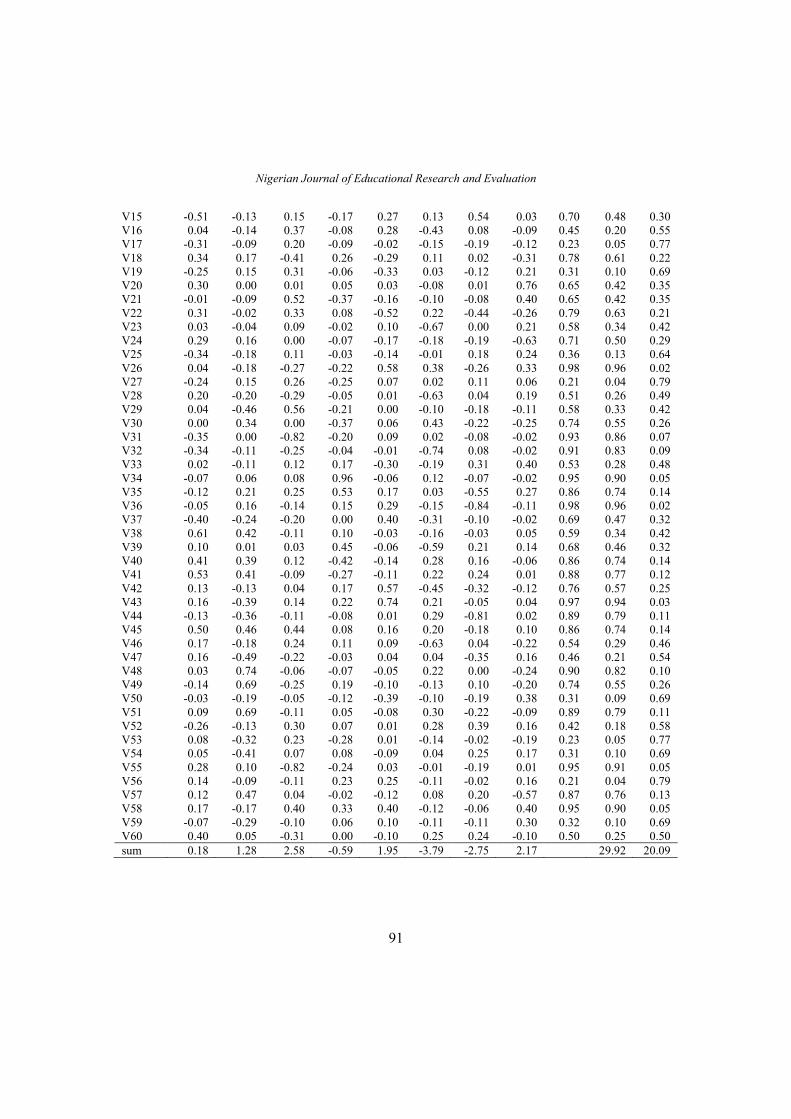
Nigerian Journal of Educational Research and Evaluation
91
V15 -0.51 -0.13 0.15 -0.17 0.27 0.13 0.54 0.03 0.70 0.48 0.30
V16 0.04 -0.14 0.37 -0.08 0.28 -0.43 0.08 -0.09 0.45 0.20 0.55
V17 -0.31 -0.09 0.20 -0.09 -0.02 -0.15 -0.19 -0.12 0.23 0.05 0.77
V18 0.34 0.17 -0.41 0.26 -0.29 0.11 0.02 -0.31 0.78 0.61 0.22
V19 -0.25 0.15 0.31 -0.06 -0.33 0.03 -0.12 0.21 0.31 0.10 0.69
V20 0.30 0.00 0.01 0.05 0.03 -0.08 0.01 0.76 0.65 0.42 0.35
V21 -0.01 -0.09 0.52 -0.37 -0.16 -0.10 -0.08 0.40 0.65 0.42 0.35
V22 0.31 -0.02 0.33 0.08 -0.52 0.22 -0.44 -0.26 0.79 0.63 0.21
V23 0.03 -0.04 0.09 -0.02 0.10 -0.67 0.00 0.21 0.58 0.34 0.42
V24 0.29 0.16 0.00 -0.07 -0.17 -0.18 -0.19 -0.63 0.71 0.50 0.29
V25 -0.34 -0.18 0.11 -0.03 -0.14 -0.01 0.18 0.24 0.36 0.13 0.64
V26 0.04 -0.18 -0.27 -0.22 0.58 0.38 -0.26 0.33 0.98 0.96 0.02
V27 -0.24 0.15 0.26 -0.25 0.07 0.02 0.11 0.06 0.21 0.04 0.79
V28 0.20 -0.20 -0.29 -0.05 0.01 -0.63 0.04 0.19 0.51 0.26 0.49
V29 0.04 -0.46 0.56 -0.21 0.00 -0.10 -0.18 -0.11 0.58 0.33 0.42
V30 0.00 0.34 0.00 -0.37 0.06 0.43 -0.22 -0.25 0.74 0.55 0.26
V31 -0.35 0.00 -0.82 -0.20 0.09 0.02 -0.08 -0.02 0.93 0.86 0.07
V32 -0.34 -0.11 -0.25 -0.04 -0.01 -0.74 0.08 -0.02 0.91 0.83 0.09
V33 0.02 -0.11 0.12 0.17 -0.30 -0.19 0.31 0.40 0.53 0.28 0.48
V34 -0.07 0.06 0.08 0.96 -0.06 0.12 -0.07 -0.02 0.95 0.90 0.05
V35 -0.12 0.21 0.25 0.53 0.17 0.03 -0.55 0.27 0.86 0.74 0.14
V36 -0.05 0.16 -0.14 0.15 0.29 -0.15 -0.84 -0.11 0.98 0.96 0.02
V37 -0.40 -0.24 -0.20 0.00 0.40 -0.31 -0.10 -0.02 0.69 0.47 0.32
V38 0.61 0.42 -0.11 0.10 -0.03 -0.16 -0.03 0.05 0.59 0.34 0.42
V39 0.10 0.01 0.03 0.45 -0.06 -0.59 0.21 0.14 0.68 0.46 0.32
V40 0.41 0.39 0.12 -0.42 -0.14 0.28 0.16 -0.06 0.86 0.74 0.14
V41 0.53 0.41 -0.09 -0.27 -0.11 0.22 0.24 0.01 0.88 0.77 0.12
V42 0.13 -0.13 0.04 0.17 0.57 -0.45 -0.32 -0.12 0.76 0.57 0.25
V43 0.16 -0.39 0.14 0.22 0.74 0.21 -0.05 0.04 0.97 0.94 0.03
V44 -0.13 -0.36 -0.11 -0.08 0.01 0.29 -0.81 0.02 0.89 0.79 0.11
V45 0.50 0.46 0.44 0.08 0.16 0.20 -0.18 0.10 0.86 0.74 0.14
V46 0.17 -0.18 0.24 0.11 0.09 -0.63 0.04 -0.22 0.54 0.29 0.46
V47 0.16 -0.49 -0.22 -0.03 0.04 0.04 -0.35 0.16 0.46 0.21 0.54
V48 0.03 0.74 -0.06 -0.07 -0.05 0.22 0.00 -0.24 0.90 0.82 0.10
V49 -0.14 0.69 -0.25 0.19 -0.10 -0.13 0.10 -0.20 0.74 0.55 0.26
V50 -0.03 -0.19 -0.05 -0.12 -0.39 -0.10 -0.19 0.38 0.31 0.09 0.69
V51 0.09 0.69 -0.11 0.05 -0.08 0.30 -0.22 -0.09 0.89 0.79 0.11
V52 -0.26 -0.13 0.30 0.07 0.01 0.28 0.39 0.16 0.42 0.18 0.58
V53 0.08 -0.32 0.23 -0.28 0.01 -0.14 -0.02 -0.19 0.23 0.05 0.77
V54 0.05 -0.41 0.07 0.08 -0.09 0.04 0.25 0.17 0.31 0.10 0.69
V55 0.28 0.10 -0.82 -0.24 0.03 -0.01 -0.19 0.01 0.95 0.91 0.05
V56 0.14 -0.09 -0.11 0.23 0.25 -0.11 -0.02 0.16 0.21 0.04 0.79
V57 0.12 0.47 0.04 -0.02 -0.12 0.08 0.20 -0.57 0.87 0.76 0.13
V58 0.17 -0.17 0.40 0.33 0.40 -0.12 -0.06 0.40 0.95 0.90 0.05
V59 -0.07 -0.29 -0.10 0.06 0.10 -0.11 -0.11 0.30 0.32 0.10 0.69
V60 0.40 0.05 -0.31 0.00 -0.10 0.25 0.24 -0.10 0.50 0.25 0.50
sum 0.18 1.28 2.58 -0.59 1.95 -3.79 -2.75 2.17 29.92 20.09
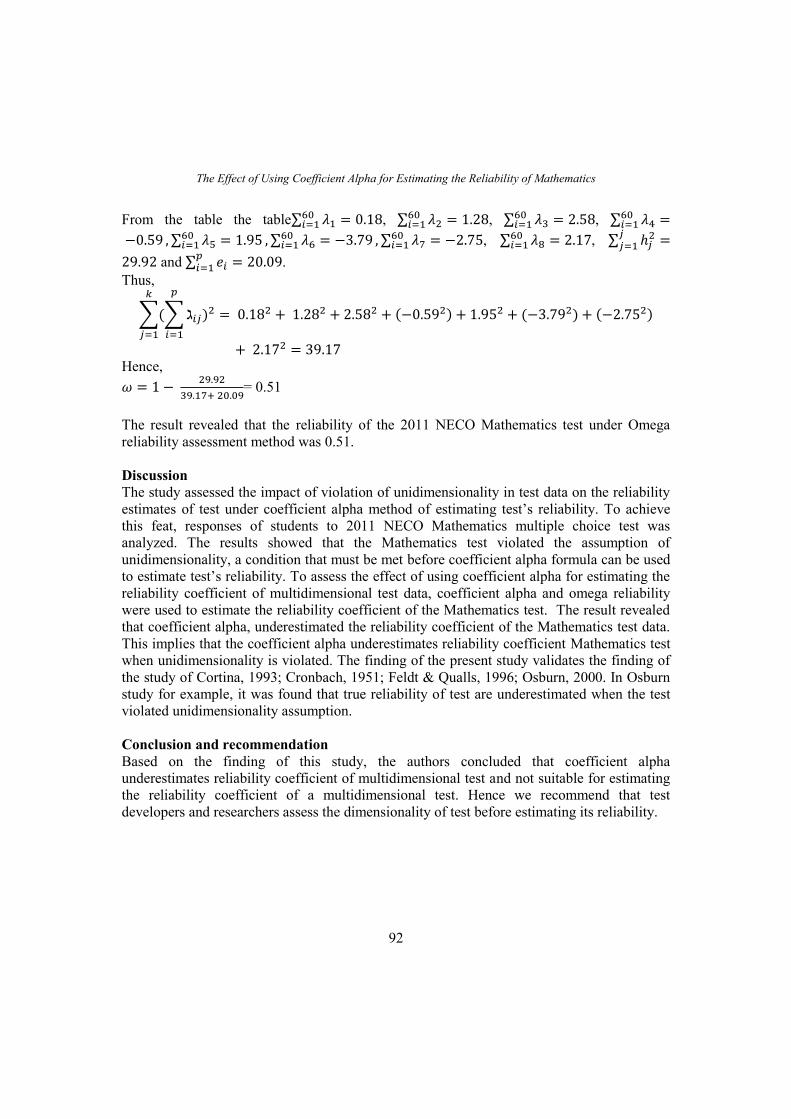
The Effect of Using Coefficient Alpha for Estimating the Reliability of Mathematics
92
From the table the table∑ 𝜆1 = 0.1860𝑖=1 , ∑ 𝜆2 = 1.2860
𝑖=1 , ∑ 𝜆3 = 2.5860𝑖=1 , ∑ 𝜆4 =60
𝑖=1
−0.59 , ∑ 𝜆5 = 1.9560𝑖=1 , ∑ 𝜆6 = −3.7960
𝑖=1 , ∑ 𝜆7 = −2.7560𝑖=1 , ∑ 𝜆8 = 2.1760
𝑖=1 , ∑ ℎ𝑗2𝑗
𝑗=1 =
29.92 and ∑ 𝑒𝑖𝑝𝑖=1 = 20.09.
Thus,
∑(∑ ℷ𝑖𝑗
𝑝
𝑖=1
)2
𝑘
𝑗=1
= 0.182 + 1.282 + 2.582 + (−0.592) + 1.952 + (−3.792) + (−2.752)
+ 2.172 = 39.17
Hence,
𝜔 = 1 − 29.92
39.17+ 20.09= 0.51
The result revealed that the reliability of the 2011 NECO Mathematics test under Omega
reliability assessment method was 0.51.
Discussion
The study assessed the impact of violation of unidimensionality in test data on the reliability
estimates of test under coefficient alpha method of estimating test’s reliability. To achieve
this feat, responses of students to 2011 NECO Mathematics multiple choice test was
analyzed. The results showed that the Mathematics test violated the assumption of
unidimensionality, a condition that must be met before coefficient alpha formula can be used
to estimate test’s reliability. To assess the effect of using coefficient alpha for estimating the
reliability coefficient of multidimensional test data, coefficient alpha and omega reliability
were used to estimate the reliability coefficient of the Mathematics test. The result revealed
that coefficient alpha, underestimated the reliability coefficient of the Mathematics test data.
This implies that the coefficient alpha underestimates reliability coefficient Mathematics test
when unidimensionality is violated. The finding of the present study validates the finding of
the study of Cortina, 1993; Cronbach, 1951; Feldt & Qualls, 1996; Osburn, 2000. In Osburn
study for example, it was found that true reliability of test are underestimated when the test
violated unidimensionality assumption.
Conclusion and recommendation
Based on the finding of this study, the authors concluded that coefficient alpha
underestimates reliability coefficient of multidimensional test and not suitable for estimating
the reliability coefficient of a multidimensional test. Hence we recommend that test
developers and researchers assess the dimensionality of test before estimating its reliability.
Nigerian Journal of Educational Research and Evaluation
93
References
Carmines, E.G & Zellar, R.A (1979).Reliability & Validity assessment.In Sulivian, J.L;
Niemi, R.G (Eds).Quantitative Application in the Social Sciences. 07.017: 9 – 71.
Cohen & Swerdlik, (2009). Psychological testing and assessment: An introduction to tests
and measurement. 7th ed. California: Mayfield Publishing House.
Di lorio, C.K. (2005).Measurement in Health Behaviour:Methods for Research and
Education San Francisco:Jossey-Bass
Jaeger, R.M. (1993).Statistics: A Spectators’ Sport. 2nd ed. Newbury Park:SAGE Publication
Kuder, G. F., & Richardson, M. W. (1937).The theory of the estimation of test
reliability.Psychometrika, 2(3), 151–160.
Maruyama, G.M. (1998). Basics of Structural Equation Modeling. 1st ed. Thousands Oak:
SAGE Publications Inc.
Meyer, P.J. (2010). Understanding Measurement: Reliability (Understanding Statistics).
Oxford: Oxford University Press
Miller, L.A.& Lovler,R.B. (2016). Foundations of Psychological Testing: A practical
approach. 5th Edition. Singapore: SAGE Publications
Nunnally, J. C., & Bernstein, I. H. (1994).Psychometric theory.New York: McGraw-Hill.
Oosterwijk, P.R., Ark, L.A. van der, &Sijtsma, K. (2017). Overestimation of reliability by
Guttman's λ4, λ5, and λ6 and the Greatest Lower Bound. In L.A. van der Ark, S.
Culpepper, J.A. Douglas, W.-C. Wang, & M. Wiberg (Eds.), Quantitative
psychology research: The 81th Annual Meeting of the Psychometric Society 2016.
New York: Springer. pp. 159-172
R Core Team (2016).R: A language and environment for statistical computing. R Foundation
for Statistical Computing,. Retrieved from https://www.R-project.org/ on 1st of July
2017
R. Philip Chalmers (2012). mirt: A Multidimensional Item Response Theory Package for the
R Environment. Journal of Statistical Software, 48.6:1-29. Retrieved from
http://www.jstatsoft.org/v48/i06/ from 1st of July 2017
Raykov, T. & Marcoulides,G.A.(2006). A first course in structural equation modeling.2nd
edition. Mahwah, NJ: Lawrence Erlbaum
Sha&Ackerman, (2017).The Performance of Five Reliability Estimates in Multidimensional
Test Situations In L.A. van der Ark, S. Culpepper, J.A. Douglas, W.-C. Wang, & M.
Wiberg (Eds.) Quantitative psychology research: The 81th Annual Meeting of the
Psychometric Society 2016 New York: Springer. (pp. 173 - 181).
Spearman, C. (1904).The proof and measurement of association between two things. Am. J.
Psychol. 15:72–101
Thomas,J.R., Nelson , J.K & Silverman, S.J. (2015). Research methods in physical activity.
United States: Human Kinetics
Webb,N.M., Shavelson, R.J. & Haertel, E.H. (2006) Reliability Coefficients and
Generalizability Theory. Handbook of Statistics, 26
The Effect of Using Coefficient Alpha for Estimating the Reliability of Mathematics
94
Wells, C. S. & Wollack, J. A. (2003).An Instructor’s Guide to Understanding Test
Reliability. Testing & Evaluation Services University of Wisconsin: Madison, WI
53706
Widharso, W. & Ravand, H. (2014).Estimating reliability coefficient for multidimensional
measures: A pedagogical illustration.Review of Psychology. 21.2: 111-121
Achieving Quality Problem-Solving in Junior Secondary School Mathematics through Formative....
95
ACHIEVING QUALITY PROBLEM-SOLVING IN JUNIOR SECONDARY
SCHOOL MATHEMATICS THROUGH FORMATIVE ASSESSMENT WITH
FEEDBACK
1Hwere Mary Samuel 2G.C. Imo & 3A.Y. Mustapha
[email protected] 08031857059
Government Girls’ Model Junior Secondary School, Zaron, Plateau State1
University of Jos Faculty Of Education (Department of Educational Foundations)2, 3
Abstract
Today, Junior Secondary Schools in Nigeria are facing challenges in Mathematics that
hinders effective learning which could enhance quality problem solving in Mathematics. This
paper argues the fact that to achieve quality problem-solving in Mathematics formative
assessment with feedback should be applied regularly in teaching and learning of
Mathematics in Junior Secondary School. Concepts of Problem solving in Mathematics and
formative assessment with feedback were discussed to seeing their meaning. The strategies of
problem solving in Mathematics were also seen to show the step by step procedures of
solving mathematical problems. This article proffered a framework of designing formative
assessment with feedback in Junior Secondary School Mathematics. Challenges were
identified which if not addressed, students would have difficulties in solving mathematical
problems that can cause anxiety. Finally a recommendation was given that could lead to
improving problem-solving in Junior Secondary School Mathematics.
Key Words: Problem-solving, Formative Assessment, Formative Assessment Feedback,
Junior Secondary School, Mathematics, Strategies.
Introduction
In Nigeria, cultivating the attitude of problem solving in school children is one of the
government top priorities. The forth goal of national policy on education states that problem
solving is the purpose of acquisition of appropriate skills and the development of mental,
physical, and social abilities and competencies as equipment for the individual to live and
contribute to the development of the society, (Federal Republic of Nigeria (FRN), 2004).
There are many definitions of problem solving in literature, but that given by Polya (1945)
will be sufficient for this discussion. According to him, problem solving is to find “A way
where no way is known, off-hand - - - - out of a difficult - - -around an obstacle”. He further
states that he knows that Mathematics is to solve problems. Problem solving is at the core of
learning in Mathematics. Personal classroom experience as a teacher and results of the
private examinations show that most learners are yet to acquire the vital problem solving
skills required for success in Mathematics and related disciplines.
Assessment is one of the critical components of teaching and learning process. It
affords the teacher opportunity to measure the extent to which the stated objectives have been
Nigerian Journal of Educational Research and Evaluation
96
achieved or will be achieved. Assessment whether on the process (formative) or at the end of
instruction (summative), the interaction between teacher and students as feedback tool is
vital in teaching and learning quantitative subjects especially Mathematics that topics are
linked from simple to more complex. Ugodulunwa, (2008) posits that educational assessment
entails the process of gathering information on performance of students, interpreting the
information and using it to improve teaching and learning process in school and national
level. According to Black and Williams (as cited in Yorke, 2003), formative assessment is
all those activities undertaken by teachers and/or by their students which provide information
to be used as feedback to modify the teaching and learning activities which they are engaged.
Knight (2001) and Yorke (2003) acknowledged that assessment and feedback are
inter-related and the effectiveness of each one relies on the other. Feedback becomes
formative when students are provided with scaffold instruction or thoughtful questioning that
serve as prompts for sustained and deeper discussion. This instructional approach closes the
gap between their current levels of understanding and the desired learning goals. Clark
(2011) asserted that students develop a deeper understanding of their learning when the
essential components of formative assessment with feedback are effectively incorporated as
central features of the formative assessment process.
Concept of Problem Solving in Mathematics
Naturally enough, problem solving is about solving problems. When one thinks about it, the
whole aim of education is to equip children to solve problems. But the researchers would
want to restrict the thinking to Mathematical problems. In Mathematics Curriculum
therefore, problem solving contributes to the generic skill of problem solving in the Nigeria
curriculum framework. Problem solving is a Mathematical process that consists of skills and
processes as stated by Farayola and Salaudeon (2009) to be a complex mental process that
involves visualizing, imagining, manipulating, abstracting, analyzing and associating ideas.
To do this, three words are useful to distinguish between them are “method”, answer” and
“solution”. By “method” we mean the means used to get an answer. This will generally
involve one or more problem solving strategies.
On the other hand, we use “answer” to mean a number, quantity or some other entity
that the problem is asking for. Finally, a “solution” is the whole process of solving a
problem, including the method of obtaining an answer itself. Method + answer = solution:
But to answer the question what is problem – solving? Or how do we do problem solving?
These will be seen in the framework.
Padgette (1991) defined problem solving as “goal directed cognitive learning process
that makes use of previously learned knowledge and cognitive strategies”. This view of
problem solving is not relying on previous knowledge only, but also a learning process
involving cognitive controls such as cognitive styles. That is, a proffered way an individual
processes information and Meta cognition (thinking and thinking). The characteristics of
problem solving were noted by him to be the “givens” as goals and “obstacles”. The givens
are the elements, their relations and the conditions that compose the initial stage of the
Achieving Quality Problem-Solving in Junior Secondary School Mathematics through Formative....
97
problem, the goal is a desirable scientific end and obstacles are the characteristics of the
problem solver and the situation that makes it difficult for the solver to know how to
transform the initial stage of the problem into the final stage. In order to solve problems
successfully, the problem solver needs to understand the content of the subject matter.
Concept of Formative Assessment with Feedback
Formative assessment is defined as any task that creates feedback for students about their
learning (Irons, 2008). The essence of using assessment and other evaluation instruments
during the instructional process is to guide, direct and monitor students’ learning and
progress towards attainment of course objectives.
The starting point for the work on formative assessment is the idea of providing
feedback (Clark, 2010). It is the notion of students being given strategic guidance on how to
improve their work that resides at the centre of formative assessment practice. Torrance and
Pryor (2001) reported that many teachers focus on praise as a form of feedback because of
the efficacy of behaviorist systems. Feedback has no effect in vacuum; to be powerful in its
effect there must be learning context to which feedback is addressed to achieve, Formative
feedback in itself will have the potential to make crucial effect on students’ learning. In
another study, MCLaughlin and Kelly (2012) admit that feedback is the reinforcement in
which students responses and teachers giving feedback occur closely at the same time. That
is, teachers must provide feedback during students’ responses to help them correct their
errors easily.
Formative assessment with feedback is described as verification and elaboration.
Bloom, Hasting and Madus (as cited in Philas, 2012) were of the opinion that formative
assessment is useful to both the students (as way of diagnosing students’ learning difficulties
and the prescription of alternative remedial measures, and to the teacher (as means of
locating the specific difficulties that the students are experiencing within subject matter
content and forecast summative assessment.
In view of the above, to have quality problem solving is mathematics, the writers
claim that formative assessment with feedback is a strong tool to enhance teaching – learning
process in Mathematics to serve as an aid of problem solving which is done in stages.
Strategies for Formative Assessment with Feedback
Formative assessment includes a variety of strategies such as observation, feedback, self –
assessment, peer –assessment, questioning and journalizing. However, there are some general
principles that contribute effective formative assessment which include the use of quality
assessment tools and the subsequent use of the information derived from these assessments to
improve instruction. To achieve quality problem solving in Mathematics, this study considers
the following strategies to be needful:
i. Dylan, (2010) posits observation as an important strategy where a teacher observes a
student’s level of engagement, academic and effective behavior. Observation is a
valuable tool in assessing students, but must be beyond a casual glance to see those
Nigerian Journal of Educational Research and Evaluation
98
students who are on task. Interacting with students as they complete the tasks reveals the
students’ grasp of the formation and provides for immediate feedback to correct
misunderstandings.
ii. “Teach smarter not harder” asserted in Stiggins et al, (2007) outlines seven strategies of
Assessment for learning target.
a. Where am I coming?
Strategy 1: Provide students with a clear and understandable vision of the learning
target.
Strategy 2: Use examples and models of strong and weak work.
b. Where am I now?
Strategy 3: Offer regular descriptive feedback.
Strategy 4: Teach students to self – assess and set goals.
c. How can I close the gap?
Strategy 5: Design lesson (assessment to focus on learning target or aspect of quality
at a time.
Strategy 6: Teach students focused revision.
Strategy 7: Engage students in self-reflections, and let them keep track of and share
their learning.
Where am I going?
Strategy 1: Provide a clear and understandable vision of the Learning Target.
Share with your students the learning target(s), objective(s), or goal(s) in advance of teaching
the lesson, giving the assignment, or doing the activity. Use language students will
understand and check to make sure they understand. Ask “why are we doing this activity”?
“What are we learning”? “Convert learning targets into student-friendly language by defining
key words in terms students understand”. Ask students what they think constitutes quality in
a product of performance learning target, then show how their thoughts match with the
scoring guide or rubric you will use to define quality. Provide students with scoring guides
written so they can understand them. Develop scoring criteria with them.
Strategy 2: Use examples and Models of Strong and weak
Use models of strong and weak work-anonymous student work, work from life beyond
school, and your own work. Begin with work that demonstrates strengths and weaknesses
related to problems students commonly experience, especially the problems that most
concern you. Ask students to analyze these examples for quality and then to justify their
judgments: Use only anonymous work. If you have been engaging students in analyzing
examples or models, they will be developing a vision of what the product or performance
looks like when its done well.
Model creating a product or performance yourself. Show students the true
beginnings, the problems you run into, and how you think through decisions, along the way.
Don’t hide the development and revision part, or students will think they are doing it wrong
Achieving Quality Problem-Solving in Junior Secondary School Mathematics through Formative....
99
when it is messy for them at the beginning, and they won’t know how to work through the
rough patches.
Where am I now?
Strategy 3: Offer Regular Descriptive Feedback:
Offer descriptive feedback instead of grades on work that is for practice. Descriptive
feedback should reflect student strengths and weaknesses with respect to the specific learning
target(s) they are trying to hit in a given assignment. Feedback is most effective when it
identifies what students are doing right, as well as what they need to work on next. One way
to think of this is “stars and stars” – What did the learner accomplish? What are the next
steps? All learners, especially struggling ones, need to know that they did something right,
and our job as teachers is to find it and label it for them, before launching into what they need
to improve.
Remember that learners don’t need to know everything that needs correcting, all at
once. Narrow your comments to the specific knowledge and skills emphasized in the current
assignment and attention to how much feedback learners can act on at one time. Don’t worry
that students can successfully act on at one time, independently, and then figure out what to
teach next based on the other problems in their work.
Providing students with descriptive feedback is a crucial part of increasing
achievement. Feedback helps students answer the question, “Where am I now?” with respect
to where do I need to be?” You are also modeling the kind of thinking you want students to
engage in when they self-assess.
Strategy 4: Teach students to self-Assess and set Goals.
Teaching students to self assess and set goals for learning is the second halves of helping
students answer the question, “Where am I now?” Self-assessment is a necessary part of
learning, not an add-on that we do if we have the time or the “right” students. Struggling
students are the right students, as much as any others. Self-assessment includes having
students do the following:
- Identify their own strengths and areas for improvement.
You can ask them to do this before they show their work to you for feedback giving
them prior thoughts of their own to “hang” it on your feedback will be more
meaningful and will make more sense
- Write in a response log at the end of class, recording key points they have learned
and questions they will still have.
- Using established criteria, select a work sample for their Portfolio that proves a
certain level of, explaining why piece qualifies.
- Offer descriptive feedback to classmates.
- Use your feedback, feedback from other students, or their own self-assessment to
identify what they need to work on and set goals for future learning.
Nigerian Journal of Educational Research and Evaluation
100
How can I close the gap?
Strategy 5: Design Lessons to Focus on One Aspect of Quality at a time:
If you are working on a learning target having more than one aspect of quality, we
recommend that you build competence one block at a time. For example, mathematics
problem solving requires choosing the right strategy as one component. A science
experiment lab report requires a statement of the hypothesis as one component. Writing
requires an introduction as one component. Look at the components of quality and then teach
them one part at a time, making sure that students understand that all of the parts ultimately
must come together. You can then offer feedback focused on the component you just taught,
which narrows the volume of feedback students need to act on at a given time and raises their
chances of success in doing so, again, especially for struggling learners. This is a time saver
for you, and more instructionally powerful for students.
Strategy 6: Teach Students focused Revision
Show students how you would revise an answer, product, or performance, and then
let them revise a similar example. Begin by choosing work that needs revision on Single
aspect of quality. Ask students to brainstorm advice for the (anonymous) author on how to
improve the work. The ask students, in pairs, to revise the work using their own advice. Ask
students to analyze your own work for quality and make suggestions for improvement.
Revise your work using their advice. Ask them to again review using their advice. Ask them
to again review it for quality. These exercises will prepare students to work on a current
product or performance of their own, revising for the aspect of quality being studied. You
can then give feedback on just that aspect.
Strategy 7: Engage Students in Self-Reflection, and let them keep Track of and share their
learning
Engage students in tracking, reflecting on, and communicating about their own progress. Any
activity that requires students to reflect on what they are learning and helps them develop
insights into themselves as learners. These kinds of activities give students the opportunity to
notice their own strengths, to see how far they have come, and to feel in control of the
conditions of their success. By reflecting on their learning, they deepen their understanding,
and will remember it longer. In addition, it is the learner, not the teacher, who is doing the
work.
Here are some things you can have students do:
- Write a process paper, detailing how they solve a problem or created a product or
performance. This analysis encourages them to think like professionals in your
discipline.
- Write a letter to their parents about a piece of work, explaining where they are now
with it and what they are trying to do next.
- Reflect on their growth. “I have become a better reader (solver) this year. I used to - -
- - -, but now I - - - -
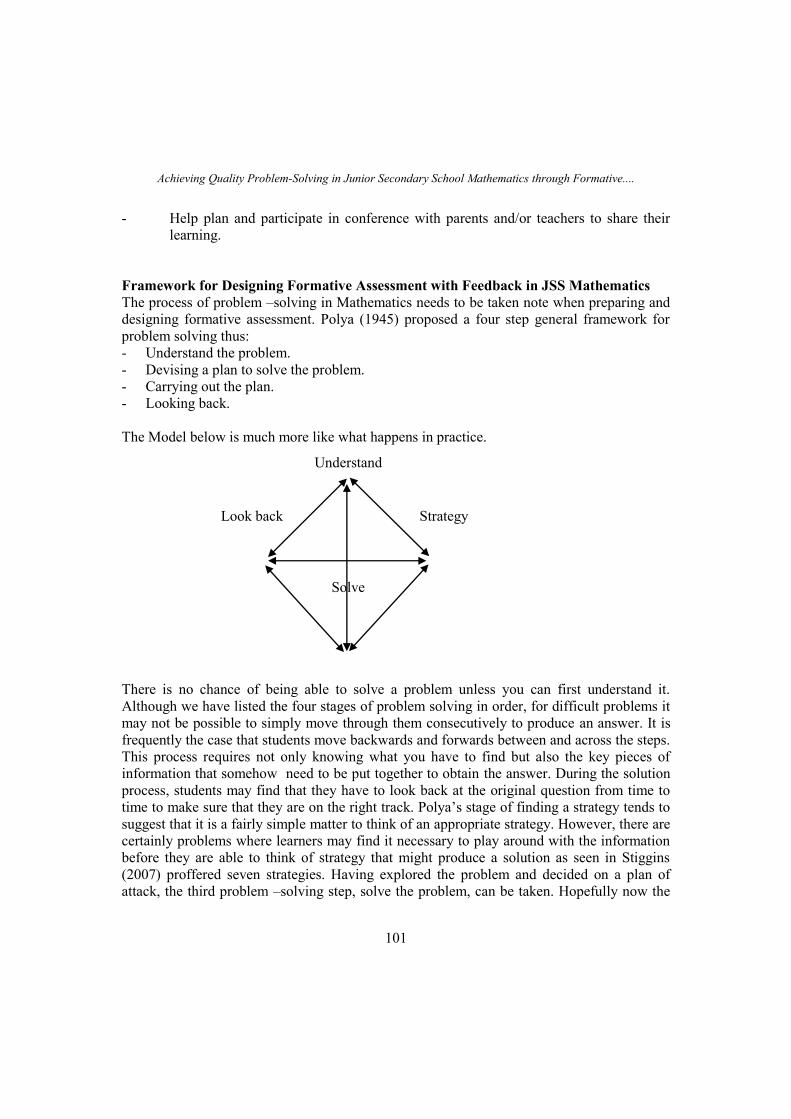
Achieving Quality Problem-Solving in Junior Secondary School Mathematics through Formative....
101
Understand
Look back Strategy
Solve
- Help plan and participate in conference with parents and/or teachers to share their
learning.
Framework for Designing Formative Assessment with Feedback in JSS Mathematics
The process of problem –solving in Mathematics needs to be taken note when preparing and
designing formative assessment. Polya (1945) proposed a four step general framework for
problem solving thus:
- Understand the problem.
- Devising a plan to solve the problem.
- Carrying out the plan.
- Looking back.
The Model below is much more like what happens in practice.
There is no chance of being able to solve a problem unless you can first understand it.
Although we have listed the four stages of problem solving in order, for difficult problems it
may not be possible to simply move through them consecutively to produce an answer. It is
frequently the case that students move backwards and forwards between and across the steps.
This process requires not only knowing what you have to find but also the key pieces of
information that somehow need to be put together to obtain the answer. During the solution
process, students may find that they have to look back at the original question from time to
time to make sure that they are on the right track. Polya’s stage of finding a strategy tends to
suggest that it is a fairly simple matter to think of an appropriate strategy. However, there are
certainly problems where learners may find it necessary to play around with the information
before they are able to think of strategy that might produce a solution as seen in Stiggins
(2007) proffered seven strategies. Having explored the problem and decided on a plan of
attack, the third problem –solving step, solve the problem, can be taken. Hopefully now the
Nigerian Journal of Educational Research and Evaluation
102
problem will be solved and an answer obtained. During this phase it is important for the
students to keep track of what they are doing. This is useful to show others what they have
done, and it is also helpful in finding errors should the right answer not found. At this point
many students, especially mathematically able ones, will stop.
But it is worth getting them into the habit of looking back over what they have done.
There are several good reasons for this. First of all it is good practice for them to check their
working and make sure that they have no made any errors. Second, it is vital to make sure
that the answer they obtained is in fact the answer to the problem and not to the problem that
they thought was being asked. Third, in looking back and thinking a little more about the
problem, students are often able to see another way of solving the problem. This new
solution may be a nicer solution than the original and may give more insight into what is
really going on.
Finally, the better students especially, may be able to generalize or extend the
problem. Generalizing a problem means creating a problem that has the original problem as a
special case.
Therefore, what is needed in the strategies which is very important if one must assist
the learners discover and learn from his mistakes during problem solving process the
assessment and feedback stage. The instructor should present students with open questions
and tasks, observing students and examining students’ work.
Challenges of Formative Assessment with Feedback
Formative assessment has been neglected in both public policy and everyday practice.
Teachers generally accept the concept of formative assessment, but they have difficulties in
putting it into practice. Students can with difficulty escape the effects of poor teaching, they
cannot escape the effects of poor assessment quality and develop better instruction delivery
methods (Hormby, 2005). Hence, assessment results which are not indicative of what
students expect or conceive of themselves, produce negative effect on their academic
performance. Students now seem to be more concerned with marks rather than what they
understood, this result is a mismatch between marks and learning outcomes (Yorke, 2005).
There is therefore, a tension between having to give marks to motivate students to complete
their work as opposed to educating students to receive feedback and act upon it. A study
found out that formative feedback was often negative and variable in quality. It found that
many students do not read and often misunderstand the feedback, and even when it is
understood it is rarely acted upon (Crook, 2001).
Another major challenge with formative assessment feedback is that, it becomes
difficult for teachers who take formative assessment seriously to maintain high quality of
feedback in a large class condition. It takes to active deep learning, develop critical and
transferable skills, thus, giving feedback can be very expensive and time consuming and not
automatically helpful or effective: it can de-motivate or be useless or too brief (Nicol, 2009).
Accordingly, it may well be that there are other aspects of the environment which influence
feedback effect of formative assessment. It is a common feature in most of our school
Achieving Quality Problem-Solving in Junior Secondary School Mathematics through Formative....
103
systems for students’ scripts to be stock piled in the teachers’ offices only to be dashed out or
destroyed after a period of time. In some cases, students are provided feedback of their
performances after they might have written the final assessment (summative) on the subject
infrastructure and inadequate equipment in schools, especially government owned schools
make the implementation process of formative assessment with feedback difficult to be
achieved.
New teachers joining the school in new academic year is another challenge to
formative assessment where some of the new teachers might not have the professional
knowledge and skills in school-based formative assessment with feedback. On the same vain,
Ajogbeje, (2012) grants one key factor which seems to contribute more to the problem of
poor students’ achievement in Mathematics is the essence of using assessment and other
evaluation instruments during the instructional process. Teachers who have mindset that the
purpose of assessment is to find ways or to find out what students don’t know and this might
mean designing assessment to ‘tap’ or ‘trick’ them. These teachers have great difficulty
accepting the validity of good assessment practices that aim to make the process, as
transparent as possible (Ross, 2005).
Conclusion
Quality- Problem solving in Mathematics is critical if Mathematics teachers are to stand the
test of formative assessment with feedback as a tool of assessment. The strategies are a
mirror to good assessment if well followed. Indeed, no assessment strategy can be complete
without the issue of regular feedback. The challenges which teachers encounter are so varied
that the most appropriate means to tackle them is the class size should be considered and
teachers given assessment with feedback appropriately.
Suggestion.
This work therefore, suggests that the Stiggins Strategies when incorporated into Polya’s
Model will help to achieve quality problem solving in Mathematics.
References
Ajogbeje, O. J. (2012). Effect of Formative Testing on Students’ Achievement in Junior
Secondary School Mathematics, European Scientific Journal, 8 (8), 94 – 105.
Clark, I. (2010). The development of project. Formative assessment strategies in UK schools,
current issues in education, 13(3). Retrieved from
http://eie.asu.edu./ojs/index.php/cieatasu/article/view/file/382/27
Clerk, I .(2011).Formative assessment : policy, perspectives and practices. Florida Journal of
educational Administration and policy, 4(2) 158-180.
Crooks, T. (2001). The validity of Formative Assessment, Paper presented to the British
Educational Research Association Annual Conference, University of Leeds, 13-15
September.
Nigerian Journal of Educational Research and Evaluation
104
Dylan, W. (2010). An integrative summary of the research literature and implications for a
new theory of formative assessment in Handbook of formative assessment, in
Handbook of formative Assessment Heidi L.
Farayola, P.L. & Salaudeen, K. A. (2009). Problem solving difficulties of pre-service NCE
teachers in Mathematics in Oyo State, Nigeria. Abacus.34 (1), 126-131.
Federal Republic of Nigeria (2004), National Policy 2004 Lagos: Federal Government Press.
Hormby, W. (2005). Dogs, Stars, rolls Royce and old double – decker: efficiency and
effectiveness in an assessment in Quality Assurance Agency Scotland (Ed.)
Reflections on assessment Volume 1. Mansfield: Quality Assurance Agency, 15 –
28.
Irons. A (2008). Enhancing learning through formative assessment and feedback. London;
New York: Routledge.
Knight, P. (2001). A briefing on key concepts: Formative and summative, criterion and non-
referenced assessment, assessment series No.7 York: LTSN Generic centre.
M.CLaughlin, A.C.M & Kelly, C.M. (2012). Different in feedback use for correct and
incorrect responses. Proceedings of Human Factor and Economics Society 26th
Annual Meeting, 56, 2427-2431.
Nicol, D. (2009). Quality enhancement themes: the first year experience – transforming
assessment and feedback: enhancing integration and empowerment in the first year.
Mansfield: Quality Assurance Agency.
Padgette, W.T. (1991).The long list and art of solving physics problem. Physics teacher
29(4), 238-239.
Philas, O.Y. (2012) Teaching/Learning Resources and Academic Performance in
Mathematics in Secondary School in Bondo District of Kenya; Asian Social. Vol.
No. 12, 126-132.
Polya, G. (1945). How to solve it. A new aspect of mathematics method. U.S.A, Princeton
University Press.
Ross, D.A. (2005). Streamlining assessment – how to make assessment more efficient and
more effective an overview in Quality Assurance Agency Scotland (Ed.) Reflections
on Assessment volume 1. Mansfield: Quality Assessment Agency.
Stiggins, R., Art, J., Chappuis, J. & Chappuis, S. (2007). Classroom Assessment for Students
Learning. Doing it Right using it well. New Jersey; Person Education INC.
Ugoduluwa, C.A. (2008). Fundamentals of educational measurements, Jos.Fab. Educational
Books Nigeria.
York, M. (2005). Formative assessment and student success in Quality Assurance. Agency
Scotland (Ed.) Reflections on assessment volume 2. Mansfield: Quality Assessment
Agency, 125-137.
Yorke M. (2003). Formative assessment in higher education: moves towards theory and the
enhancement of pedagogic practice. Higher Education, 45,477-501.
Experimental Study on Using Portfolio Assessment to Enhance Learning in Senior Secondary School....
105
EXPERIMENTAL STUDY ON USING PORTFOLIO ASSESSMENT TO ENHANCE
LEARNING IN SENIOR SECONDARY SCHOOL ECONOMICS IN IBADAN
NORTH, OYO STATE, NIGERIA
T. Godwin Atsua & A. O. U. Onuka
Institute of Education, University of Ibadan, Nigeria
[email protected] & [email protected]
Abstract
The use of some alternative assessment methods to evaluating students’ learning
achievement has gained popularity in education in the last two decades in Nigeria and else
in Africa. In particular, portfolio assessment methods give students opportunity to
participating in evaluating their own learning progress and keeping records of their best
works. These enable them to monitor their individual progress as well as make efforts to
remediate their weak areas of performance. Due to the absence of sufficient empirical
evidence in support of teachers using portfolio assessment methods to enhance teaching and
learning Economics, the study was undertaken to determine the extent to which portfolio
assessment can be used to engender the study of Economics by male and female students and
concomitantly their learning achievement in Ibadan North. Three hypotheses guided the
study. A pre-test post-test control group quasi-experimental design was adopted. The
population of the study was senior secondary school II Economics students. A simple random
sampling technique was used to select a sample of four senior secondary schools, whereby
two were used for the experimental while two served control group. An intact class of SSII
was used in each selected school. Four hundred and seventy seven students participated in
the study. The resulting data were analysed using ANCOVA. Findings revealed that portfolio
assessment helped in improving students’ achievement in Economics. Gender of students did
not significantly influence their achievement. It was recommended that teachers should
employ portfolio assessment technique in teaching in order to help improve achievement of
secondary school students in Economics.
Keywords: Portfolio, Assessment, Learning, Achievement, Economics
Introduction
One most significant area of teaching is assessment because it is an integral part of teaching
and learning. It takes into account learning styles, strengths and needs of learners in the
school. It promotes students learning in that it defines what learners take to be important,
how they spend much of their study time and in many ways how they value learning.
Therefore, promoting learning through assessment is one of the fundamental responsibilities
of teachers. This can be achieved through good assessment practice. Assessment that is
capable of supporting teaching and learning. Hence, assessment ought to be flexible and
Nigerian Journal of Educational Research and Evaluation
106
reflect learner’s achievement. This explains why schools are gradually replacing traditional
assessment methods with alternative assessment techniques.
In education, alternative assessment refers to assessment that is in direct contrast to
what is known as traditional testing, traditional assessment or standardized assessment.
Instead of traditional selected-response or constructed-response tests that look for discrete
facts or knowledge students recall in a standard way, alternative assessment allow students to
apply knowledge in alternative, novel ways. Conducting market survey to identify different
prices of goods and services in an Economics class, writing poetry in a language arts class,
performing in a play in a theatre class or a mock-trial in a Government class are alternative
assessments. These performances are assessed with rubrics which are also used to give
feedback to students and stakeholders.
The use of alternative assessment methods to evaluate students’ learning
achievement has gained popularity in education in the last two decades in Nigeria and else in
Africa. Some of the alternative assessment techniques that are gradually replacing traditional
assessment methods include: Portfolio assessment, hierarchical assessment, performance
assessment among others. Portfolio assessment in particular gives students opportunity to
participate in evaluating their own learning progress and to keep records of their best works
(Onuka & Atsua, 2016). It allows students to monitor their individual progress as well as
make efforts to remediate their weak areas of performance. A portfolio according to Atsua
(2017) is a container, folder, envelop, box or file that holds evidence of a student’s work
sample that show skills, ideas, interests and accomplishments in school. The use of portfolio
assessment as stated by Bryant and Timmins (2001) is a move toward authentic application
of task which students have greater control and clarity about their assessment obligations and
teachers can come to understand that assessment results are meaningful and useful for
improving instruction.
By definition, portfolio assessment is a systematic collection of students work
samples into a container, folder, envelop, box or file that exhibits efforts, progress and what
they have achieved in one or more areas in their field of study. The collection must include
student participation in selecting contents, the criteria for selection, the criteria for judging
merit and evidence of student self-reflection (Macmillan, 2007). This makes portfolio
assessment a collection of students’ work that is carefully selected by both the student and
the teacher for a specific reason which they can explain. According to de Valenzuela (2011),
portfolio assessment is a systematic, longitudinal collection of student work created in
response to specific instructional objectives and which is evaluated in relation to the same
criteria. This means that evaluation of portfolio assessment is done by measuring the
individual works and the portfolio as a whole against set criteria.
Portfolio creation is the responsibility of the learner, with teacher guidance and
support, and often with the involvement of peers and sometimes parents. Driessen, Overeem,
Tartwijk, van der Vleutenand Muijtjens(2006) stated that the strength of portfolio assessment
is derived from its ability to offer rich and authentic evidence of learners’ development and
achievements. This makes portfolio assessment highly suitable not only for monitoring, but
Experimental Study on Using Portfolio Assessment to Enhance Learning in Senior Secondary School....
107
also for assessing learners’ competence development. Marx (2001) asserted that portfolio-
based assessment is a means of individualized, student-centered evaluation that has the
potential to improve the complex task of student assessment, as well as to contribute to a
more positive attitude toward the educational process.
Ugodulunwa and Wakjissa (2015) explained that, portfolio assessment allows
students to present the best pieces of their work over time indicating progress and
achievements made, while teachers support through questioning and dialoguing with learners
(engaging learners) until mastery is attained. It collects best pieces of students’ work and
allows students to reflect on and self-assess their work through integrative learning as they
construct their own meaning, allowing flexibility in measuring students’ accomplishments,
with students judging the worth of their work for improvement of achievement levels. Davis
and Ponnamperuma (2005) stated that portfolio assessment enables students to self-evaluate
and builds their own knowledge as they produce their best pieces and related materials that
depict their efforts, accomplishments and achievements in different subject areas.
The overall purpose of portfolio assessment is to enable students demonstrate
learning progress to other stakeholders in education. The greatest value of portfolios
assessment is that students become active participants in the assessment and learning process.
Atsua (2017) explained that portfolio assessment is purposeful because it promotes students
learning, demonstrate, exhibit or provide evidence of achievement, improvement, the
student’s self-reflection and student’s growth. Gómez (1999) maintained that portfolios
provide a broader picture of student achievement than do tests alone, and can include a great
deal of information that shows what students know and can do on a variety of measures.
Murphy (1999) asserts that no system of assessment is as perfect as portfolio assessment,
because students are required to write, they can choose the topic, audience, responses in the
class, revision strategies, and so on. They can freely select from their works the pieces they
want to include in their portfolios. This makes portfolio assessment a strong element of self-
evaluation and feedback for students and teachers (Bryant & Timmins, 2001). This shows
that portfolio assessment may be used as a holistic process for evaluating course work and
for encouraging learner autonomy in Economics.
Assessment theories that explain the application of portfolio assessment seems
sparsely. However, the theory of constructivism have often times been used in this regard.
Developed by Jean Piaget and expanded by Vygotsky, constructivism theory suggests that
human beings generate and build their own knowledge and meaning from an interaction
between their ideas and experiences (Kristinsdottir, 2001). Constructivism sees the learner as
actively involved in creating new meanings, where teacher dialogues and helps learner to
make meaning out of learning content until mastery is attained. It is a student-centred
strategy which suggests that instruction and assessment should be built together such that in
planning for an instructional process, what should be assessed and how it should be assessed
should be planned alongside. Since portfolio assessment involves learners through active
participation during instruction, it shows that learning through portfolio assessment is
Nigerian Journal of Educational Research and Evaluation
108
student-centred which serves as an avenue for stimulating student reflection and
demonstration of focus and responsibility for learning in all disciplines.
Assessment theory that could explain the application of portfolio assessment in
school is the principles of assessment theory propounded by McAlpine (2002).According to
McAlpine, assessment must be understood, first of all, as a form of communication,
primarily between teacher and student and also between teachers on one hand and employers,
curriculum designers and policymakers on the other hand. According to McAlpine,
assessment is thus a social function, a communication link between the education system and
the wider society. Portfolio assessment provides that communication link between learners
and stakeholders in education. It provides evidence of students learning, demonstrate, exhibit
or confirm achievement, improvement, the student’s self-reflection, the process and the
student’s growth. Miller (2006) reaffirmed this position with evidence that candidates could
be assessed according to certain predetermined performance indicators and based on
evidence they produce, and presumes that a student will pass examination. Failure to pass is
seen as a fault of the learning process, not the individual.
McAlpine also explains convergent/divergent assessment. Convergent assessment
takes a predetermined thing and sets out to discover whether a learner knows, understands or
is able to do it. Divergent assessment is an open-ended process that aims to find out what the
learner can do. While on the surface convergent assessment seems naturally suited to
summative purposes and divergent to formative, in truth, which portfolio assessment fits into
both of them since it serves both formative and summative purposes.
The two theories situate assessment at the heart of instruction and made portfolio
assessment to take the form of a communication link between the education system and the
wider society on one hand and positioned the learner in between instruction and assessment
on the other hand allowing the learner to take responsibility of creating learning experiences.
It shows that instruction and assessment should be built together such that in planning for an
instructional process, what should be assessed and how it should be assessed should be
planned alongside by both the teacher and learner.
Researchers have at different levels of education attempted to provide evidence to
show how portfolio assessment encourages students learning. Empirical evidence abounds in
literature on the claim that portfolio assessment helps to improve instruction and student
learning (Reeves, 2004;Alsadaawi, 2008; Fan & Zhu, 2008; Shumei, 2009; Nezakatgoo,
2010). These studies have proven that portfolio assessment helps to improve learning and
performance. For example, Nezakatgoo (2010) study revealed that students whose work
were evaluated by a portfolio system (portfolio-based assessment) had improved in their
writing and gained higher scores in final examination when compared to those students
whose work were evaluated by traditional evaluation system (non-portfolio-based
assessment).The findings highlighted the fact that portfolio assessment could be used as a
complementary alternative along with traditional assessment to shed new light on the process
of writing. Chung (2012) study did not yield statistically significant results but did provide
some evidence for improvement in English as Second Language(ESL) academic writing
Experimental Study on Using Portfolio Assessment to Enhance Learning in Senior Secondary School....
109
courses. It seems that genre and topic familiarity could have influenced students’ writing
abilities because many international graduate students were assumed to have accustomed to
writing to specific audiences in their fields.
A study by Nezakatgoo (2011) found significant difference between the
performances of portfolio-based group and of non-portfolio-based group. This means that
students in portfolio-based group outperform students in non-portfolio-based group. The
number of errors in portfolio-based group under examination conditions was less than in non-
portfolio-based group.Ugodulunwa and Wakjissa (2015) findings on use of portfolio
assessment technique in teaching map sketching and location in secondary school Geography
revealed that portfolio assessment helped to improve students’ performance in map sketching
and location. The experimental group recorded higher mean gain scores of 33.32 as
against1.65 gain scores recorded by the control group. Results of t-test analysis revealed a
significant mean difference between the pre-test and post-test GAT mean scores of the
experimental group. Gender had no significant effect on the post-test GAT of the
experimental group. The study recommended that teachers and schools should employ
portfolio assessment technique in teaching to help improve performance in secondary school
Geography.
Portfolio assessment has been found to be an effective assessment instrument that is
capable of providing quality information about students learning in different subjects.
Literature however, has not provided sufficient evidence on the use of portfolio assessment in
Economics in secondary schools in Nigeria. Due to the absence of sufficient empirical
evidence in support of teachers using portfolio assessment methods to enhance teaching and
learning Economics in senior secondary schools in Nigeria, the study was undertaken to
determine the extent to which portfolio assessment can be used to engender the study of
Economics in senior secondary schools among students and concomitantly their learning
achievement in Ibadan North.
The following hypotheses guided the study:
Ho1: There is no significant main effect of treatments on students’ achievement in Economics
Ho2: There is no significant main effect of gender on students’ achievement in economics.
Ho3: There is no significant interaction effect of treatments and gender on students’
achievement in Economics.
Method
The design adopted for the study was a randomized pre and post-test control group quasi-
experimental design with a 3 X 2 X 2 factorial matrix. The layout of the design is shown as
follow:
Experimental Group 1 – O1 X1 O2
Experimental Group 2 – O1 X2 O2
Control Group – O1 X3 O2
Nigerian Journal of Educational Research and Evaluation
110
Where:
O1 = Pre-test achievement in Economics
O2 = Post-test achievement in Economics
X1 = group assessed with portfolio assessment
X2 = group assessed with portfolio assessment
X3 = control group
Table 1: Showing 3 X 2 X 2 Factorial Design Treatment Gender
Portfolio Assessment 1 Male Female
Portfolio Assessment 2 Male Female
Control group Male Female
The independent variables of the study treated at two levels were portfolio assessment and
the control group. The moderator variable that was controlled for in the course of the study
was gender. The dependent variable of the study was students’ achievement in Economics.
The target population of the study was senior secondary school II Economics students in
Ibadan North, Oyo State, Nigeria. A simple random sampling technique was used to select a
sample of four senior secondary schools, whereby two schools were used for the
experimental while two served as the control group. An intact class of SSII was used in each
selected school. Four hundred and seventy seven students participated in the study.
The instruments used for the study was Economics Achievement Test (EAT) and a
treatment package called Portfolio Assessment Enhancement Package (PAEP). Economics
Achievement Test (EAT) was constructed by the researchers. It consisted of 200 multiple
choice items covering the fourhigher levels of cognitive domain which include Applying,
Analysing, Evaluating and Creating. These items were based on the Senior Secondary School
Economics Curriculum for Nigerian studentsby the Nigerian Education Research and
Development Council (NERDC) (2008). The items were subjected to review for clarity of
words, ambiguity of items and also plausibility of the distracters. The information obtained
on each of the items was used to re-write those that required review. The EAT items were
then subjected to Item Response Theory parameter estimates for validation where their
difficulty level and discrimination indices checked based on the criterion set (P-value 0.3 –
0.8, d-value 0.3 – 0.9) for selection of items. Moreover, Rasch model approach was used to
determine unidimensionality of items, locally-independence, item Characteristics Curves
(ICC),how best the items fit into the 3PL model of IRT, Differential Item Function (DIF) and
items that survived as good items. The result obtained was considered as being trial tested
result where 50 items were finally selected for the final instrument. Test blue print was
prepared to facilitate the selection of test items that covered the topics from the contents
areas as contained in the subject’s curriculum. This was to ensure content validity of the
items. From the table of specification, fifty Economics test items were generated that
Experimental Study on Using Portfolio Assessment to Enhance Learning in Senior Secondary School....
111
constituted the final EAT for administration to the sampled schools. The reliability of the
EAT was established using Kuder Richardson 20 Formula (KR20) with r = .962.
The pre-experimental activity commenced with obtaining an official permission from
the school authority to use the schools for the study. The second stage was the recruitment of
Economics teachers from each school that served as research assistants. They were trained
for the experiment on how to use the treatment packages for two weeks. The training manual
was provided to all the research assistants. At the end of the training, pre-test was given
before the research assistants commenced the implementation of the treatment package in
their respective schools with the students.
The treatment lasted for six weeks and post-test was given immediately after
treatment. Participants in experimental groups were engaged in portfolio assessment on a
weekly basis. For every week a new topic was introduced. The students and the teacher
would collectively decide on the assessment tasks to be done for week. Students would then
execute the task with the teacher’s impute where necessary. Their work samples are collected
and kept in a portfolio. This was observed throughout the period that the experiment lasted.
Participants in control group were engaged in assessment from the same topics based on the
discretion of the teacher on a weekly basis but no portfolio was kept.
Table 2: Portfolio Assessment Treatment Package Week Topic Objectives Activity
1 Tools of Economic Analysis Students should be able to:
Show simple economic relationship with
tables, graphs and charts
i. To calculate measures of
dispersion e.g. range, mean
deviation, variance and standard deviation
2 Production Possibility
Curves
i. Define the PPC
ii. Show how to plot the graph from a possible data
From the products identified and
agreed on by the teacher and students
i. Draw the PPC on a graph sheet
ii. Calculate the AP and MP 3 Theory of Costs i. Distinguish between the difference
between the different cost concepts
(variable, fixed, total, average, marginal, short-run and long-run)
ii. Draw different cost curves
iii. Explain the relationship between costs and production
From the product identified in week
3, students to
i. distinguish among the different costs concepts
ii. draw the different cost
curves iii. explain the relationship between
costs and production
4 Concept of Demand and Supply
i. Explain the meaning of demand and supply and market equilibrium
ii. Explain factors affecting demand
and supply iii. Distinguish between factors causing
shift in demand and supply curves
and those causing movement along demand and supply curves
iv. Draw the demand and the schedule
curves to explain the changes
v. Explain the meaning of demand, supply & market
equilibrium
vi. Using local competitive products to explain factors
affecting demand and supply
of such products (products to be decided by the teacher and
students).
vii. Plot the demand and supply schedules and curves.
Nigerian Journal of Educational Research and Evaluation
112
5 Price Determination i. identify and explain the interaction between the forces of demand and
supply in determining the market
price ii. explain the effect of changes in
demand/supply on the equilibrium
price and quantity
From the products identified, students should go to a local market
and
i. price goods, obtain their prices at different levels of quantity
ii. Use the price and quantity at
different levels to plot equilibrium price and quantity
on demand and supply schedule
and curve 6 Portfolio Conferencing Students and the teacher to come
together and discuss and evaluate
samples of works done
Data collected frompre-test and post-test were analysed using Analysis of Covariance
(ANCOVA) using the pre-test scores as covariates. Scores of students obtained were
analysed to determine the effects of treatment and gender for pre-test, post-test and their
interactions. ANCOVA corrected for the initial differences in the dependent variables and
other extraneous factors, using the pre-test scores as covariate. Sidak Post Hoc test was
further conducted to determine the source of the significant main effect. All hypotheses were
tested at the 0.05 level of significance.
Results and Discussion
Ho1: There is no significant main effect of treatments onstudents’ achievement in Economics
Table 3: Summary of Analysis of Covariance (ANCOVA) Showing Tests of Between-
Subjects Effects Dependent Variable: Post-test
Variable Type III Sum of
Squares
df Mean
Square
F P-value Partial Eta
Squared
Corrected Model 896.314a 12 74.693 8.922 .000 .295 Intercept 2856.822 1 2856.822 341.254 .000 .571
Pre-test 280.335 1 280.335 33.487 .000 .116 Main Effects
Treatment 1
484.667
2
242.334
28.947
000
184
Gender .364 1 .364 .043 .835 .000 Treatment 2 49.258 1 49.258 5.884 .016 .022
2-Way Interaction Effects
Treatment 1 * Gender 15.188 2 7.594 907 405 007 Treatment 1 * Treatment 2 24.226 2 12.113 1.447 .237 .011
Gender * Treatment 2 .681 1 .681 .081 .776 .000
3-Way Interaction Effects Treatment1 * Gender * Treatment 2 7.777 2 3.888 .464 .629 .004
Error 2143.114 256 8.372
Total 49310.000 269 Corrected Total 3039.428 268
a. R Squared = .295 (Adjusted R Squared = .262)
Experimental Study on Using Portfolio Assessment to Enhance Learning in Senior Secondary School....
113
Table 3 shows that after adjusting for the covariance pre-test, the effect of treatment on
students’ achievement in Economics was statistically significant, (F(2,256) = 28.947, P < 0.05.
Consequently, the null Hypothesis was rejected. The Partial Eta Square (𝜂2)was .184 which
was considered to be large effect size. In order to determine which group differs significantly
among the treatment groups, Sidak Post-hoc analysis was conducted and the result is
presented in Tables 4 and 5.
Table 4: Estimated Marginal Means of Achievement by Treatment and Control Group Dependent Variable: Post-test
Treatments Mean Std. Error 95% Confidence Interval
Lower Bound Upper Bound
Treatment Group 1 14.610a .312 13.996 15.225 Treatment Group 2 13.030a .325 12.391 13.669
Control Group 11.210a .319 10.582 11.838
a. Covariates appearing in the model are evaluated at the following values: Pre-test = 7.43.
Table 5: Pairwise Comparison of Achievement by Treatments and Control Group
Dependent Variable: Post-test
(I)Treatments (J) Treatments Mean
Difference (I-J)
Std.
Error
Sig.b 95% Confidence Interval for
Differenceb
Lower Bound Upper Bound
Group 1 Group 2 1.581* .451 .002 .498 2.663
Control Group 3.400* .447 .000 2.326 4.475
Group 2 Group 1 -1.581* .451 .002 -2.663 -.498 Control Group 1.820* .454 .000 .727 2.912
Control Group Group 1 -3.400* .447 .000 -4.475 -2.326
Group 2 -1.820* .454 .000 -2.912 -.727
Based on estimated marginal means
*. The mean difference is significant at the .05 level. b. Adjustment for multiple comparisons: Sidak.
Table 4 revealed that Experimental Group I has the highest mean score of (�̅�= 14.610)
followed by participants in Experimental Group 2 with the mean score of (�̅�= 13.030) while
Control Group has the least mean score of (�̅�= 11.210). Table 5 confirmed the difference
between the two Experimental Groups and the Control Group with statistically significant
difference. The findings aligned with Nezakatgoo (2010) study whereportfolio-based
assessment showed improvement in writing and subsequent higher scores in final
examination when compared to those students whose work were evaluated by non-portfolio-
based assessment. The result however negates that of Chung (2012) where portfolio based
assessment could not yield statistically significant results but did provided some evidence of
improvement. The findings highlighted the fact that portfolio assessment could be used as an
alternative assessment to traditional assessment. This underscore Bryant and Timmins (2001)
assertion that portfolio assessment is a move toward authentic application of task which
students have greater control and clarity about their assessment obligations and teachers can
come to understand that assessment results are meaningful and useful for improving
instruction. The implication is that portfolio assessment is one of the best assessment method
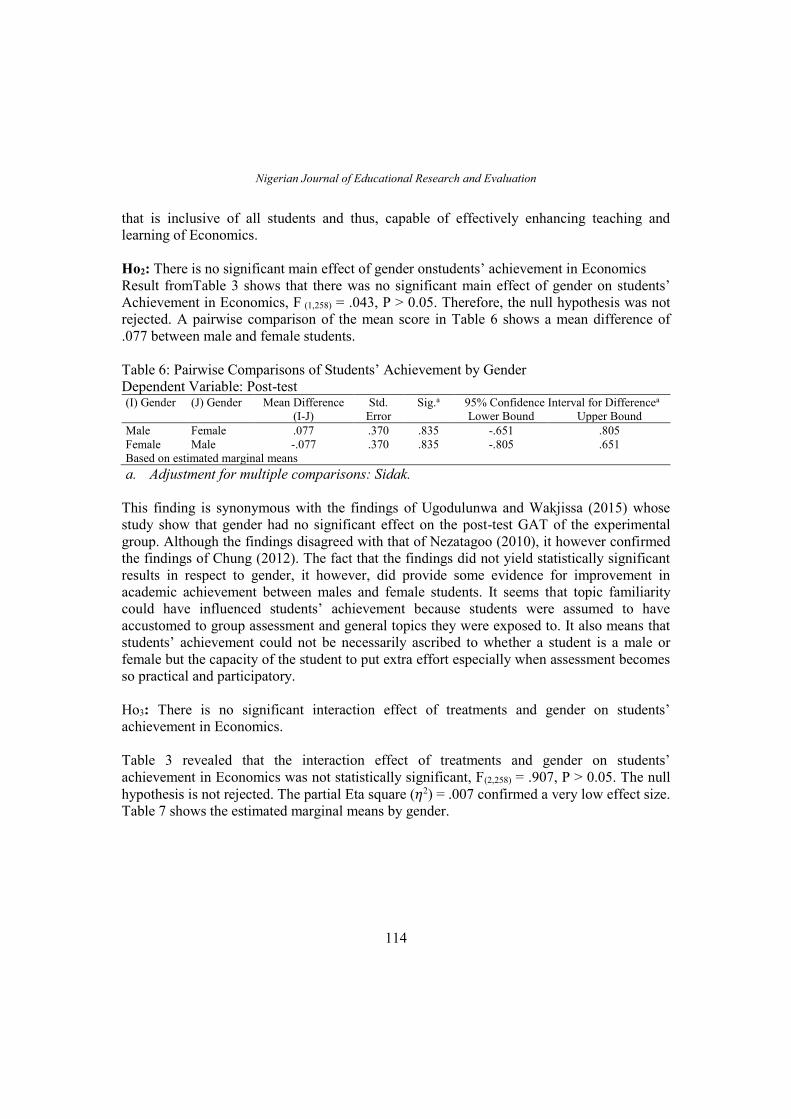
Nigerian Journal of Educational Research and Evaluation
114
that is inclusive of all students and thus, capable of effectively enhancing teaching and
learning of Economics.
Ho2: There is no significant main effect of gender onstudents’ achievement in Economics
Result fromTable 3 shows that there was no significant main effect of gender on students’
Achievement in Economics, F (1,258) = .043, P > 0.05. Therefore, the null hypothesis was not
rejected. A pairwise comparison of the mean score in Table 6 shows a mean difference of
.077 between male and female students.
Table 6: Pairwise Comparisons of Students’ Achievement by Gender
Dependent Variable: Post-test (I) Gender (J) Gender Mean Difference
(I-J)
Std.
Error
Sig.a 95% Confidence Interval for Differencea
Lower Bound Upper Bound
Male Female .077 .370 .835 -.651 .805
Female Male -.077 .370 .835 -.805 .651
Based on estimated marginal means
a. Adjustment for multiple comparisons: Sidak.
This finding is synonymous with the findings of Ugodulunwa and Wakjissa (2015) whose
study show that gender had no significant effect on the post-test GAT of the experimental
group. Although the findings disagreed with that of Nezatagoo (2010), it however confirmed
the findings of Chung (2012). The fact that the findings did not yield statistically significant
results in respect to gender, it however, did provide some evidence for improvement in
academic achievement between males and female students. It seems that topic familiarity
could have influenced students’ achievement because students were assumed to have
accustomed to group assessment and general topics they were exposed to. It also means that
students’ achievement could not be necessarily ascribed to whether a student is a male or
female but the capacity of the student to put extra effort especially when assessment becomes
so practical and participatory.
Ho3: There is no significant interaction effect of treatments and gender on students’
achievement in Economics.
Table 3 revealed that the interaction effect of treatments and gender on students’
achievement in Economics was not statistically significant, F(2,258) = .907, P > 0.05. The null
hypothesis is not rejected. The partial Eta square (𝜂2) = .007 confirmed a very low effect size.
Table 7 shows the estimated marginal means by gender.
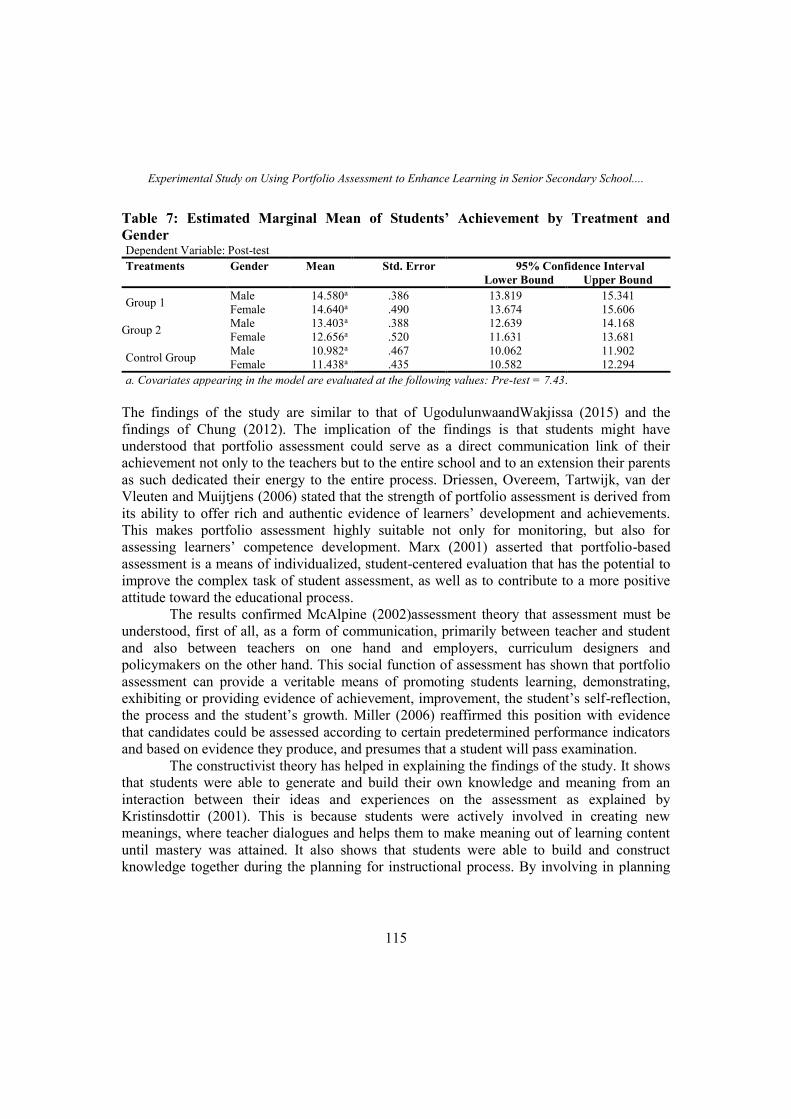
Experimental Study on Using Portfolio Assessment to Enhance Learning in Senior Secondary School....
115
Table 7: Estimated Marginal Mean of Students’ Achievement by Treatment and
Gender Dependent Variable: Post-test
Treatments Gender Mean Std. Error 95% Confidence Interval
Lower Bound Upper Bound
Group 1 Male 14.580a .386 13.819 15.341
Female 14.640a .490 13.674 15.606
Group 2 Male 13.403a .388 12.639 14.168
Female 12.656a .520 11.631 13.681
Control Group Male 10.982a .467 10.062 11.902
Female 11.438a .435 10.582 12.294
a. Covariates appearing in the model are evaluated at the following values: Pre-test = 7.43.
The findings of the study are similar to that of UgodulunwaandWakjissa (2015) and the
findings of Chung (2012). The implication of the findings is that students might have
understood that portfolio assessment could serve as a direct communication link of their
achievement not only to the teachers but to the entire school and to an extension their parents
as such dedicated their energy to the entire process. Driessen, Overeem, Tartwijk, van der
Vleuten and Muijtjens (2006) stated that the strength of portfolio assessment is derived from
its ability to offer rich and authentic evidence of learners’ development and achievements.
This makes portfolio assessment highly suitable not only for monitoring, but also for
assessing learners’ competence development. Marx (2001) asserted that portfolio-based
assessment is a means of individualized, student-centered evaluation that has the potential to
improve the complex task of student assessment, as well as to contribute to a more positive
attitude toward the educational process.
The results confirmed McAlpine (2002)assessment theory that assessment must be
understood, first of all, as a form of communication, primarily between teacher and student
and also between teachers on one hand and employers, curriculum designers and
policymakers on the other hand. This social function of assessment has shown that portfolio
assessment can provide a veritable means of promoting students learning, demonstrating,
exhibiting or providing evidence of achievement, improvement, the student’s self-reflection,
the process and the student’s growth. Miller (2006) reaffirmed this position with evidence
that candidates could be assessed according to certain predetermined performance indicators
and based on evidence they produce, and presumes that a student will pass examination.
The constructivist theory has helped in explaining the findings of the study. It shows
that students were able to generate and build their own knowledge and meaning from an
interaction between their ideas and experiences on the assessment as explained by
Kristinsdottir (2001). This is because students were actively involved in creating new
meanings, where teacher dialogues and helps them to make meaning out of learning content
until mastery was attained. It also shows that students were able to build and construct
knowledge together during the planning for instructional process. By involving in planning
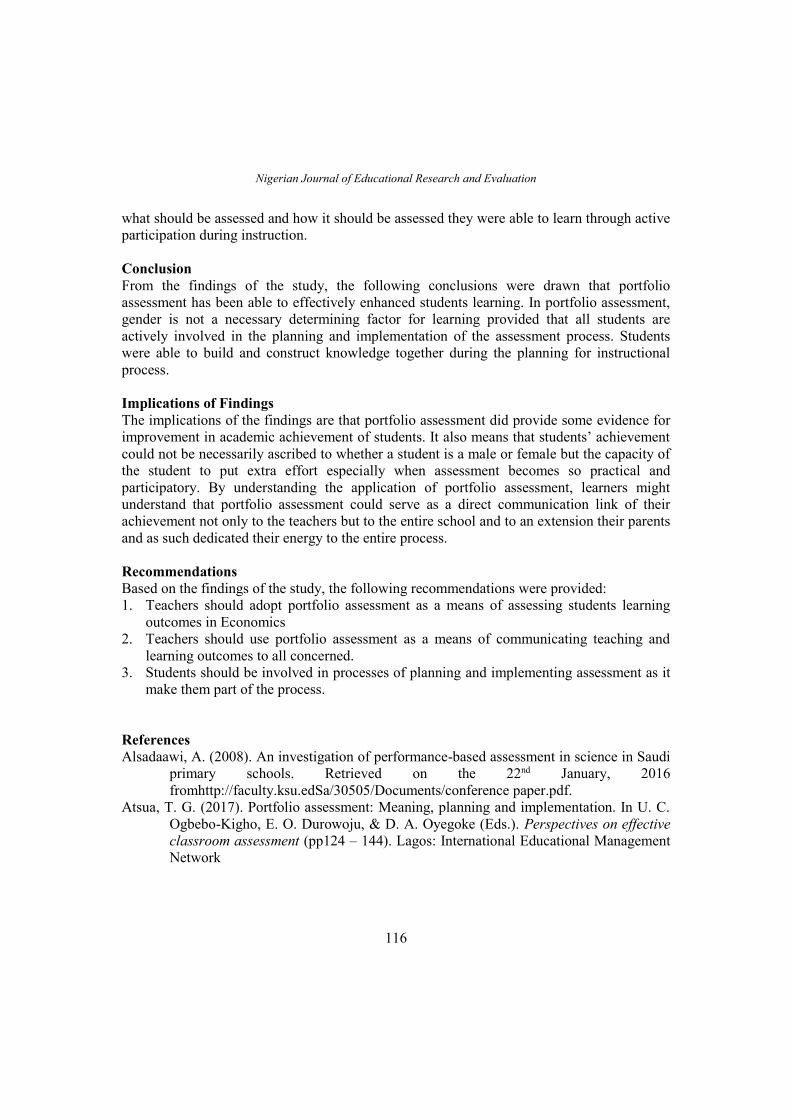
Nigerian Journal of Educational Research and Evaluation
116
what should be assessed and how it should be assessed they were able to learn through active
participation during instruction.
Conclusion
From the findings of the study, the following conclusions were drawn that portfolio
assessment has been able to effectively enhanced students learning. In portfolio assessment,
gender is not a necessary determining factor for learning provided that all students are
actively involved in the planning and implementation of the assessment process. Students
were able to build and construct knowledge together during the planning for instructional
process.
Implications of Findings
The implications of the findings are that portfolio assessment did provide some evidence for
improvement in academic achievement of students. It also means that students’ achievement
could not be necessarily ascribed to whether a student is a male or female but the capacity of
the student to put extra effort especially when assessment becomes so practical and
participatory. By understanding the application of portfolio assessment, learners might
understand that portfolio assessment could serve as a direct communication link of their
achievement not only to the teachers but to the entire school and to an extension their parents
and as such dedicated their energy to the entire process.
Recommendations
Based on the findings of the study, the following recommendations were provided:
1. Teachers should adopt portfolio assessment as a means of assessing students learning
outcomes in Economics
2. Teachers should use portfolio assessment as a means of communicating teaching and
learning outcomes to all concerned.
3. Students should be involved in processes of planning and implementing assessment as it
make them part of the process.
References
Alsadaawi, A. (2008). An investigation of performance-based assessment in science in Saudi
primary schools. Retrieved on the 22nd January, 2016
fromhttp://faculty.ksu.edSa/30505/Documents/conference paper.pdf.
Atsua, T. G. (2017). Portfolio assessment: Meaning, planning and implementation. In U. C.
Ogbebo-Kigho, E. O. Durowoju, & D. A. Oyegoke (Eds.). Perspectives on effective
classroom assessment (pp124 – 144). Lagos: International Educational Management
Network
Experimental Study on Using Portfolio Assessment to Enhance Learning in Senior Secondary School....
117
Bryant, S. L. & Timmins, A. A. (2002). Assessment: Instructional guide (2nd Ed.). Tai Po,
Hong Kong: Carves Books.
Chung, S. J. (2012). Portfolio assessment in ESL academic writing: Examining the effects of
reflection in the writing process. Master’s thesis Submitted to the Graduate College
of the University of Illinois at Urbana-Champaign.
Davis, M. H., Ponnamperuma, G. G. & Ker, J. S. (2009).Student perceptions of a portfolio
assessment process. Medical Education, 43(1),89 – 98. Retrieved on the 22nd
January, 2017 fromhttp://www.ncbi.nlm.nih.gov/entrez/eutils/elink.fcgi?
de Valenzuela, J. S. (2011). Portfolio assessment in the foreign language classroom. National
Standards for Foreign Language Learning NCLRC. Retrieved on the 16th February,
2016 from http://www.nclrc.org/portfolio/7-1.html.
Driessen, E. W., Overeem, K., Tartwijk, J., van der Vleuten, C. P. M. & Muijtjens, A. M. M.
(2006). Validity of portfolio assessment: Which qualities determine ratings? Medical
Education, 40, 862 – 866. doi:10.1111/j.1365-2929.2006.02550.x.
Fan, L. & Zhu, Y. (2008). Using performance assessment in secondary school mathematics:
An empirical studyin a Singapore classroom. Retrieved on the 22nd January, 2016
fromhttp://educationforatoz.com/images/_11_using_performance_Assessment_proof
reading_done_pdf.
Kristinsdottir, S. B. (2001). Constructivist theories. Retrieved on the 29th January, 2017 from
https://www.researchgate.net/publication/.
Marx, G. (2001). Educating children for tomorrow’s world. The Futurist, 35(2), 43 – 48.
McAlpine, M. (2002). The principles of assessment. University of Luton: CAA Centre.
Miller, M. (2006). Assessment: A literature review. Research and Information Bulletin, 19, 7
– 11. Available from www.sqa.org.uk.
Murphy, S. (1999). Assessing portfolio. In C. Cooper & L. Odell (Eds.), Evaluating writing
(pp. 114 – 136). Urbana, IL: National Council of Teachers of English.
Nezakatgoo, B. (2010). The effects of portfolio assessment on writing of EFL students.
English Language Teaching, 4(2), 231 – 242. doi:10.5539/elt.v4n2p231.
Nezakatgoo, B. (2011). Portfolio as a viable alternative in writing assessment. Journal of
Language Teaching and Research, 2(4), 747 – 756. doi:10.4304/jltr.2.4.747-756.
Onuka, A. O. U. &Atsua, T. G. (2016). Types and procedures of assessment used in the
Polytechnic Ibadan, Oyo State, Nigeria. Paper presented at the 11th Regional
Conference Organized by Higher Education Research Network Held at the Main
Auditorium NABTEB, Benin City, Edo State from 30th October – 4th November.
Reeves, D. B. (2004). Accountability for learning: How teachers and school leader can take
charge. UAS: ASCD.
Shumei, Z. (2009). Has portfolio assessment become common practice in EFL classrooms?
Empirical studies from China. Retrieved on the 22nd January, 2016
fromwww.ccsenet.org/journal/index.php/elt/Article/view/2375.
Nigerian Journal of Educational Research and Evaluation
118
Ugodulunwa, C. & Wakjissa, S. (2015). Use of portfolio assessment technique in teaching
map sketching and location in secondary school Geography in Jos ,Nigeria. Journal
of Education and Practice, 6(17), 23 – 32. Retrieved on the 2ndJanuary, 2016 from
www.iiste.org.
Students’ Evaluation of Open Book Assessment in Restoring Value to our Educational....
119
STUDENTS’ EVALUATION OF OPEN BOOK ASSESSMENT IN RESTORING
VALUE TO OUR EDUCATIONAL ASSESSMENT SYSTEM
Popoola S.F.
[email protected] 08033748805
Department of Educational Foundation, Faculty of Education, University of Jos.
Abstract
In the paper, open book assessment is being considered from students’ point of view as a
means of reducing examination malpractice that has negatively affected our educational
assessment system. The research design used was survey. The target population for this study
was the 300 level undergraduate education students of university of Jos estimated at 1200.
Random sampling technique was employed to sample 300 students. Data were collected
using structured questionnaire. The data was analysed using t-test statistics (SPSS version
17.0). The findings revealed that open book assessment can reduce examination malpractice
because it reduces examination tension in students, promotes active learning and extensive
reading, stops all forms of leakages of examination questions and develops confidence in
them towards examination. The researcher recommends that open book assessment should be
employed as a means of restoring value to our educational assessment system.
Key Words: open book assessment, students’ evaluation, examination malpractice and
restoring value.
Introduction
The Nigeria educational assessment system has lost its value long ago due to the negative
influence of examination fraud. Nigeria students have seen examination or assessment as a
force to be reckoned with because of its being used as a basis for promotion in educational
setting, for placement in courses, for qualifying for higher studies as well as for certification
which invariably becomes a basis for employment (Kolawole & Adekeye, 2007). Seeing that
their future prospects depend on certificates, students are bent on securing them by all means;
hence examination fraud has a very fertile ground to breed. The evil of this menace has
completely eroded the basis of certification by falsely conferring honor on those not due for
it. Examination fraud has brought in corruption into the educational assessment system and
devalued it.
An assessment or examination is intended to reveal a student’s ability in a given
course of study. Unfortunately, fraud in such assessments has defeated the purpose. Closed
book assessment which is mostly used in our educational assessment requires that students
rely upon memory to respond to specific items. Therefore, when students use unauthorized
means or methods for the purpose of obtaining a desired test score or grade, it becomes
unacceptable. This practice ranges from bringing and using notes for a closed book
assessment, copying from other people’s work, or even sending in a paid proxy. Most of our
Nigerian Journal of Educational Research and Evaluation
120
examinations are plagued with malpractice. Malpractice is a deliberate act of indiscipline
adopted by students or their privileged accomplices to secure undeserved success and
advantage before, during or after the administration of assessment or examination in
violation of established regulation (Oyekanmi in Popoola 2012).
Several means have been adopted to combat this ugly menace, all to no avail. For
example, the Federal Government Promulgated Decree 27 of 1973 and miscellaneous decree
20 of 1984, WAEC embarked on public campaign on effect of examination malpractice as
well as some other measures. Our method of assessment which is mostly open book has
equally fueled the fire of assessment fraud. In a bid to seek some measures of solution
therefore, the researcher considers an alternative of Open Book Assessment whereby a
student is allowed to use one or more supplementary tools such as reference book or others.
An open book exam allows students to consult some form of reference materials. Students
are allowed to review reference materials during the examination (Chan, 2009). The theory
on open book assessment is based on the view that changing the form of assessment changes
learning patterns (Thomas in Maharg, 1999). While a closed book exam places a premium on
accurate and extensive recall, an open book exam places the focus on higher level learning
(Gupta, 2007). Eilertsen and Vandermo in Akresh-Gonzales (2015) equally argued that an
open book examination encourages greater engagement and improves understanding of
course material than close-book examination.
This assessment technique is an alternative approach to the closed book evaluation
approach. It is an assessment where students are allowed to use relevant reference text
materials for consultation during examination within a given period of time (Satyanarayun
2014, Aduloju, Lornienge, Aodohemba (2016). This technique relieves students of the
assiduous task of memorization. Rather, it requires critical thinking to know which
information is relevant as a way of acquiring critical thinking skills for life-long learning that
is relevant to problem solving. Feller in Akresh-Gonzales (2015) suggested that the open
book examination is superior to that of closed book as it is more realistic, that is, it is similar
to problem solving situations students are likely to face outside of academia. According to
Philipsin Akresh-Gonzales (2015) students prefer open-book to closed book examination and
find them less stressful. Having the material or text as a reference source, a student can think
critically and creatively with a reduced burden. This can take his mind from engaging in
examination malpractice. In the same vein, (Amaechi and Akujiobi, 2013) opined that as we
approach 21st century, the goal and the mode of study have to change with the onset of the
Information Technology (IT) age. They equally confirmed that with this technology, students
no longer have to waste time on memorizing. Students need to move away from passive
reading of prescribed texts to the process of acquiring skills for life-long learning. This
requires ability to think critically and creatively as needed to achieve the goals of promoting
active learning. (Soh and Jack, 2014).
In the same vein, Weimer, 2013 asserted that in this age of technology, we need to be
purposely teaching students how to assess, organize and apply information and not to simply
memorize it.
Students’ Evaluation of Open Book Assessment in Restoring Value to our Educational....
121
Assessment is a learning tool to objectively rank student according to ability and to
enhance and enrich the learning environment over an extended learning period of time. Open
book assessment has fulfilled this requirement of an assessment and student-centered
approach to education as a technique that reduces the level of anxiety experienced by
students. This is thought to result in more comprehensive student’s examination preparation
and more consistent learning throughout the course of study, with students avoiding
“cramming” (Theophilides and Koutselini, 2000).
Furthermore, investigations into the effectiveness of open-book examinations have
shown that they reduce students’ test anxiety as well as the need to memorize factual
materials (Francis, 2006).
It is suggested that open-book tests, including challenging application questions that
relate directly to the course material, may help overcome the problem of cheating in
examination (Wikipedia, 2017).
Also within this technique, students could develop more confidence to face
examination and be dissuaded from examination fraud.
It is evident that educators perceive open-book examinations as providing the
opportunity to promote thinking rather than memorizing. Open book assessment evaluates
understanding rather than recall and memorization, thereby relating to higher order of
learning which are: application, analysis, synthesis and evaluation. Students need not
underestimate the necessary preparations for open book examination because the given time
may be limited.
It is hoped that this research work can be of immense benefit to various stakeholders in
educational system. In order to achieve this aim, the researcher set the following research
questions:
1. To what extent can Open Book Assessment be free from examination malpractice?
2. Will Open Book Assessment reduce examination anxiety in students?
3. Can Open Book Assessment encourage hard work in students?
4. Will Open Book Assessment reveal students’ true ability?
Method
The research design was survey. The target population for this study was the 300 level
undergraduate education students of university of Jos estimated at 1200. Random sampling
technique was employed to sample 300 students. Data were collected using structured
questionnaire. Likert’s five point scale was used to do the analysis. The data was analysed
using t-test statistics (SPSS version 17.0). The scale was scored as [ SA(5) A(4) U(3) D(2)
SD(1)] for the positive question and [ SA(1) A(2) U(3) D(4) SD(5)]. The mean of each
item was calculated to know whether it is higher than the criterion mean (3) and that shows
that the item measured is accepted.
A criterion for comparing the mean was obtained. That is:
5+4+3+2+1 15
5 = 5
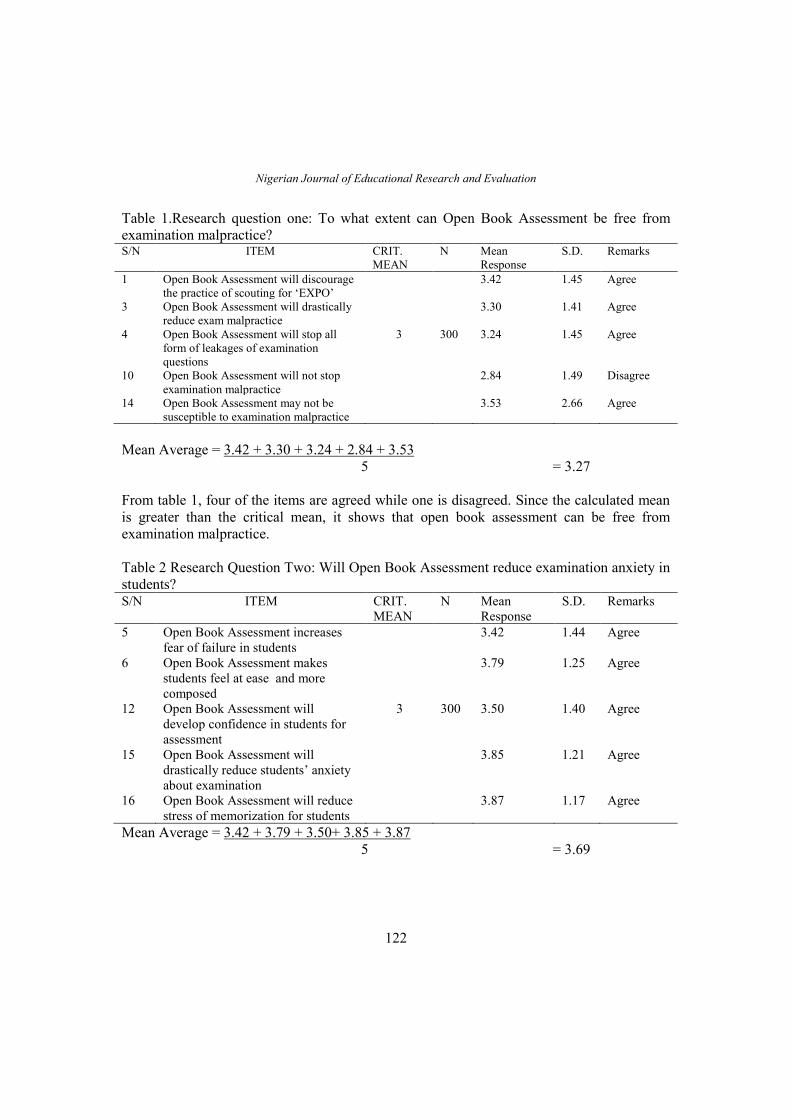
Nigerian Journal of Educational Research and Evaluation
122
Table 1.Research question one: To what extent can Open Book Assessment be free from
examination malpractice? S/N ITEM CRIT.
MEAN
N Mean
Response
S.D. Remarks
1 Open Book Assessment will discourage
the practice of scouting for ‘EXPO’
3.42 1.45 Agree
3 Open Book Assessment will drastically
reduce exam malpractice
3.30 1.41 Agree
4 Open Book Assessment will stop all
form of leakages of examination
questions
3 300 3.24 1.45 Agree
10 Open Book Assessment will not stop
examination malpractice
2.84 1.49 Disagree
14 Open Book Assessment may not be
susceptible to examination malpractice
3.53 2.66 Agree
Mean Average = 3.42 + 3.30 + 3.24 + 2.84 + 3.53
5 = 3.27
From table 1, four of the items are agreed while one is disagreed. Since the calculated mean
is greater than the critical mean, it shows that open book assessment can be free from
examination malpractice.
Table 2 Research Question Two: Will Open Book Assessment reduce examination anxiety in
students? S/N ITEM CRIT.
MEAN
N Mean
Response
S.D. Remarks
5 Open Book Assessment increases
fear of failure in students
3.42 1.44 Agree
6 Open Book Assessment makes
students feel at ease and more
composed
3.79 1.25 Agree
12 Open Book Assessment will
develop confidence in students for
assessment
3 300 3.50 1.40 Agree
15 Open Book Assessment will
drastically reduce students’ anxiety
about examination
3.85 1.21 Agree
16 Open Book Assessment will reduce
stress of memorization for students
3.87 1.17 Agree
Mean Average = 3.42 + 3.79 + 3.50+ 3.85 + 3.87
5 = 3.69
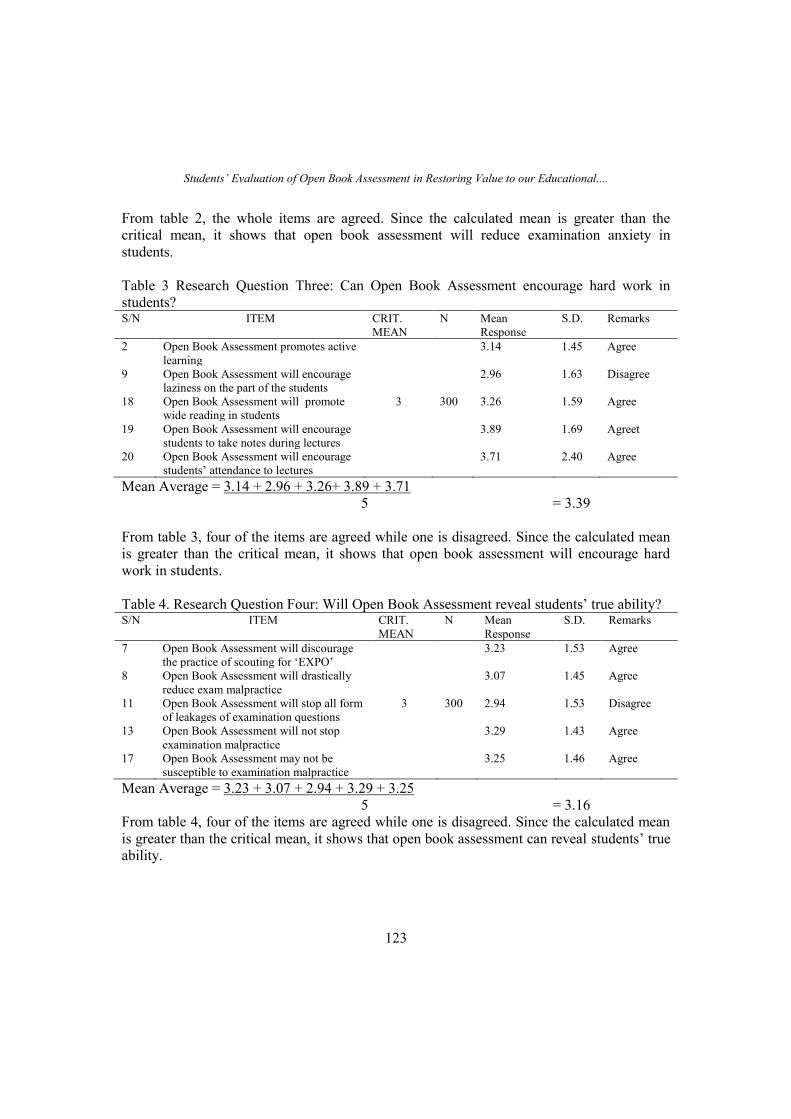
Students’ Evaluation of Open Book Assessment in Restoring Value to our Educational....
123
From table 2, the whole items are agreed. Since the calculated mean is greater than the
critical mean, it shows that open book assessment will reduce examination anxiety in
students.
Table 3 Research Question Three: Can Open Book Assessment encourage hard work in
students? S/N ITEM CRIT.
MEAN
N Mean
Response
S.D. Remarks
2 Open Book Assessment promotes active
learning
3.14 1.45 Agree
9 Open Book Assessment will encourage
laziness on the part of the students
2.96 1.63 Disagree
18 Open Book Assessment will promote
wide reading in students
3 300 3.26 1.59 Agree
19 Open Book Assessment will encourage
students to take notes during lectures
3.89 1.69 Agreet
20 Open Book Assessment will encourage
students’ attendance to lectures
3.71 2.40 Agree
Mean Average = 3.14 + 2.96 + 3.26+ 3.89 + 3.71
5 = 3.39
From table 3, four of the items are agreed while one is disagreed. Since the calculated mean
is greater than the critical mean, it shows that open book assessment will encourage hard
work in students.
Table 4. Research Question Four: Will Open Book Assessment reveal students’ true ability? S/N ITEM CRIT.
MEAN
N Mean
Response
S.D. Remarks
7 Open Book Assessment will discourage
the practice of scouting for ‘EXPO’
3.23 1.53 Agree
8 Open Book Assessment will drastically
reduce exam malpractice
3.07 1.45 Agree
11 Open Book Assessment will stop all form
of leakages of examination questions
3 300 2.94 1.53 Disagree
13 Open Book Assessment will not stop
examination malpractice
3.29 1.43 Agree
17 Open Book Assessment may not be
susceptible to examination malpractice
3.25 1.46 Agree
Mean Average = 3.23 + 3.07 + 2.94 + 3.29 + 3.25
5 = 3.16
From table 4, four of the items are agreed while one is disagreed. Since the calculated mean
is greater than the critical mean, it shows that open book assessment can reveal students’ true
ability.
Nigerian Journal of Educational Research and Evaluation
124
Conclusion
Findings from this research reveals that:
1. Open Book Assessment reveals students’ true ability because it drastically reduces
examination malpractice.
2. Open Book Assessment can encourage hard work in students because it promotes active
learning and extensive reading.
3. Open Book Assessment can be free from examination malpractice because it stops all
form of leakages of examination questions.
4. Open Book Assessment will reduce examination anxiety in students in the sense that it
develops confidence for examination and students feel at ease and more composed
(Francis 2006).
Recommendation
The researcher recommends that open book assessment should be employed as a means of
restoring value to our educational assessment system.
References
Aduloju, M.O., Iornienge, T.M. & Aondohemba, S.T. (2016).Emerging Trends in
Educational Research and Evaluation. ASSEREN Journal of Education. Vol. 1 no. 1,
31-40.
Akresh-Gonzales, J. (2015).Open-Book vs. Closed-Book Exams., retrieved from NEJM
Group, a division of the Massachusetts Medical Society. Copyright © 2017
Massachusetts Medical Society
Amaechi, C.T. & Akujobi, C.R. (2013). Constraints to 21st Century Technology
Development in Secondary Schools in Owerri Education Zone of Imo State. GIRD
International Journal of Science and Technology, 1(1), 24-31.
Chan C. (2009) Assessment: Open-book Examination, Assessment Resources@HKU,
University of Hong Kong. http://ar.cetl.hku.hk/am_obe.htm
Francis, J. (2006). A case for open book examinations. Educational Review Published online.
Gupta, M. (2007). Open-Book Examinations for assessing Higher Cognitive Abilities. IEEE
Microwave Magazine.http://www.waqtc.org/other/executive-2011-07-obe.pdf
Kolawole, S.A., Adekeye, R.B. (2007).Counseling Strategies for Curbing Examination
Malpractice among University Students. Conference Proceedings edited by
Ugodulunwa, C. & Mgboro, C.U. Official Publication of the Nigerian Society for
Educational Psychologists
Maharg, P. (1999). The Culture of Mnemosyne: Open-Book Assessment and the Theory and
Practice of Legal Education. vol. 6 no. 2
Popoola, S.F., (2012). Predictive Validity of University Matriculation Examination and Post
University Matriculation Examination Scores for Students Achievement in Federal
Universities of Northern Nigeria. Unpublished PhD. thesis
Students’ Evaluation of Open Book Assessment in Restoring Value to our Educational....
125
Satyanarayan, G. (2014). Open-Book Examination to Develop Thinking Skills in English.1-
BELIEVE ELT International Journal, 1(1), 1-6.
Soh, L.L., & Jack, C.C. (2014).The Impact of Open Book Examinations on Students
Learning. A Report to the School of Accountancy and Business, Nanyang
Technological University, Singapore.
Theophilides C. & Koutselini M. (2000).Study Behavior in the Close-Book and the Open-
Book Examination: A Comparative Analysis. Educational Research and Evaluation:
An International Journal on Theory and Practice, 6(4), 379 (Abstract only).
Weimer, M. (2013). Crib Sheets Help Students Prioritize and Organize Course Content.
Teaching Professor Blog, Faculty Focus. Wikipedia (2017)
The Effects of Formative Evaluation on Students Achievement and Interest in Secondary....
126
THE EFFECTS OF FORMATIVE EVALUATION ON STUDENTS ACHIEVEMENT
AND INTEREST IN SECONDARY SCHOOL GEOGRAPHY
Ame Festus Okechukwu
Department of Poly Work and Study
Institute of Management and Technology, Enugu
Email. [email protected] 08035356804
&
Ebuoh Casmir N.
Department of Science and Computer Education
Enugu State University of Science and Technology, Enugu.
E-mail: [email protected] 08037445718
Abstract
The study investigated the effect of formative evaluation with feedback as an instructional
strategies on senior secondary I students achievement and interest on geography map work
in Enugu state. The sample for the study consisted of 156 senior secondary I (SSI) students in
intact classes of three co-educational schools purposively selected from Igboeze North Local
Government Area of Enugu State. The study employed quasi – experimental design with
treatment at two levels namely: formative test with feedback and control group. The
treatment levels were crossed with gender (male and female). Five research instruments
namely formative test I, II and III and geography map work Achievement Test(GMAT) and
geography map work interest scale (GMIS) were constructed, validated and used for the
collection of all relevant data. The data collected were analyzed using mean, standard
deviation and paired t-test statistics. Results from the analysis showed that formative
evaluation has strong significant difference in the mean achievement- scores of students that
were exposed to it (21.20) while there was no significant difference in the mean achievement
scores of students who were not exposed to it (14.43). There were no significant effect of
gender on achievement and interest in geography. It was recommended that teachers be
encouraged to attend seminars, workshop and conferences regularly so as to acquire
necessary skills for construction and use of formative evaluation.
Keywords: formative, evaluation, test, assessment, interest, feedback, gender, map work and
achievement.
Introduction
Teaching and evaluating are the two most important responsibilities of every teacher in his
quest to bring about effective comprehension of whatever content that is taught and
learnt(Ame, 2013).They show students’ progress and ultimate level of performance in school.
Evaluation generally involves collection, collation, analysis and interpretation of data. The
search light of instructional evaluation focuses on both human and non-human components
Nigerian Journal of Educational Research and Evaluation
127
of teaching-learning outcomes and processes (Garrette, 2007). Evaluation includes both
quantitative and qualitative description of the learner’s behavior plus value judgment (Ebuoh,
2004). Evaluation, according to Idoko (2012) entails passing value judgment based on the
result of the preliminary processes associated with evaluation. The preliminary processes
associated with evaluation include test, measurement, and assessment which are often used
by some people as if they are synonymous with evaluation. They are correlates or
components or elements of evaluation.
A jogbeje (2013) opined that the utilization of formative testing in the teaching-
learning process involves breaking up the subject matter content into smaller hierarchical
units for instruction, specifying objective for each units, designing and administering
validated formative test, offering a group based remediation in areas where students are
deficient before moving to another units and then administration of summative test on
completion of all units. The essence of using various evaluation instruments like test,
assignment, project etc during instructional process is to guide, direct, and monitor students
learning and progress towards students’ attainment of course objectives. Teachers and
learners cannot perform optimally without the availability of adequate information on
students standing at any given time. Formative evaluation with feedback given periodically
as continuous assessment removes threatening effects of single evaluation (summative)
generally given at the end of course of study. Bandura (1981) submitted that feedback is the
information which a teacher provides a student about his/her performance on a particular task
or test. He further argued that when such information is provided, the student concerned
begins to have a better understanding of his/her capabilities and might begins to have a
different perception of himself or herself. studies have shown that feedback provides
reinforcement effect and correctional information on the learners. (Bardwell, 1981;Ajogbeje
(2012), Gronlund & Linn (1990)). Feedback following wrong responses has the greatest
positive effect (Katty, 2013). Bridgeman (1974) opined that feedback motivates the learners
intrinsically. Effect of feedback on students achievement and interest on geography students
in particular has been inconclusive.
Related to achievement as a variable is interest. Interest engenders academic
achievement and learning. Thus, there is a tendency of a positive correlation between the
level of achievement and level of interest in such subject. (Adikwu, 2005). Interest is a
feeling of curiosity or concern about something that makes the attention turn towards it. A
child who is interested in something pays attention to it or devotes time to it. Therefore the
failure by students to achieve or do well in a test could be attributed to lack of interest and
use of inappropriate evaluation method. It was for this purpose that this study was carried
out. The present study therefore investigated the effect of formative evaluation on students’
academic achievement and interest in senior secondary school geography in Igboeze North
Local Government Area of Enugu State.
The students' result in senior secondary school geography have been very poor
(WACE 2007 -2014). The frequent failure of Nigeria students in geography subject has been
the concern of all stakeholders in education industry (Moyosore, 2015; Adikwu, 2005,
The Effects of Formative Evaluation on Students Achievement and Interest in Secondary....
128
Ilesanmi, 2001). One of the major problems identified is poor evaluation methods adopted by
many geography teachers in senior secondary schools. This study investigated the effect of
formative evaluation on students’ achievement and interest in geography in senior secondary
school in Igboeze North Local government Area of Enugu state.
In order to address the problems inherent in the research, a hypothetical study was designed
to test the validity or otherwise of the following propositions.
1. There is no significant difference in the students’ mean achievement scores of an
experimental group that are exposed to formative evaluation and control group that are
exposed to summative evaluation.
2. There is no significant difference in the students’ mean interest score of an experimental
group and control group.
3. There is no significant gender difference in the achievement scores of geography
students that are exposed to formative evaluation.
4. There is no significant difference in the academic achievement of students in the
experimental and control groups in their post test-scores in geography.
Method
Quasi-experimental design was employed for the study. The purposive random sampling
technique was used to select three public schools out of thirty nine (39) in Igboeze North
local government area of Enugu state, Nigeria. The sample for the study consisted of 156 SSI
students from these three schools who were relatively beginners in geography subject. The
experimental group, that is, the formative evaluation with feedback, was exposed to
expository class teaching followed by a formative class evaluation 1,11,&111 with feedback
after each unit. The second group (non-formative evaluation or control group) was also
exposed to the expository class teaching without class evaluation and feedback after each
unit.
Five instruments namely formative evaluation I,II,& III, which were administered on
the respondents after the coverage of each selected topic during treatment. Geography
achievement test (GAT) and Geography interest scale (GIS) which served as pre-test and
post-test to the respondents on the topics covered during treatment were used to collect all
the relevant data for the study. The GAT, GIS, the formative evaluation I, II, and III were
received and vetted for face and content validities by three experienced geography teachers
and two experts in measurement and evaluation. Kuder Richardson formula 21(KR21) was
used to establish a reliability coefficient estimate of approximately 0.75 for GAT, 0.79 for
GIS, 0.84, 0.86, and 0.83 for the formative evaluation I, II, III respectively.
The Geography achievement test and Geography interest scale were administered to
both groups on the first day of the experiment as pre-test and the scripts were marked and
collated by the researcher. The GAT and the GIS were administered by the respective
geography teachers in the selected schools who were trained for the study. They used their
intact classes. The same GAT and GIS were re-administered to both groups at the end of the
experiment to test the effect of formative evaluation with feedback on the academic
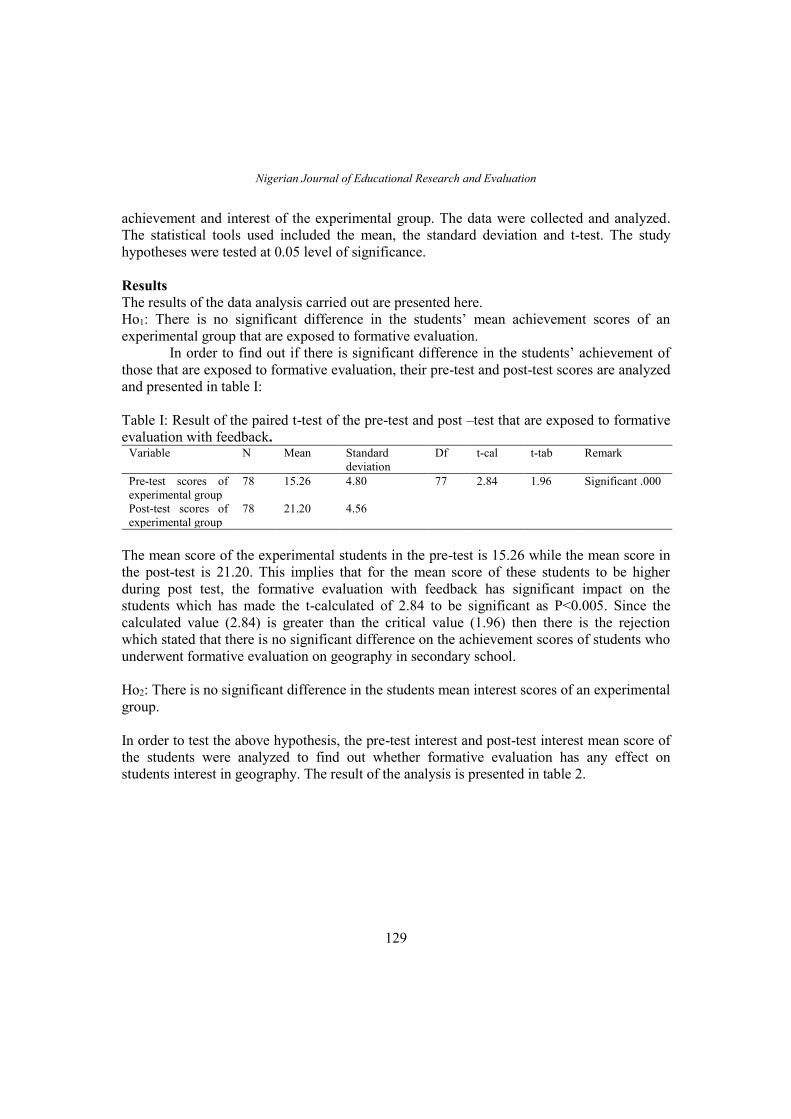
Nigerian Journal of Educational Research and Evaluation
129
achievement and interest of the experimental group. The data were collected and analyzed.
The statistical tools used included the mean, the standard deviation and t-test. The study
hypotheses were tested at 0.05 level of significance.
Results
The results of the data analysis carried out are presented here.
Ho1: There is no significant difference in the students’ mean achievement scores of an
experimental group that are exposed to formative evaluation.
In order to find out if there is significant difference in the students’ achievement of
those that are exposed to formative evaluation, their pre-test and post-test scores are analyzed
and presented in table I:
Table I: Result of the paired t-test of the pre-test and post –test that are exposed to formative
evaluation with feedback. Variable N Mean Standard
deviation
Df t-cal t-tab Remark
Pre-test scores of
experimental group
78 15.26 4.80 77 2.84 1.96 Significant .000
Post-test scores of
experimental group
78 21.20 4.56
The mean score of the experimental students in the pre-test is 15.26 while the mean score in
the post-test is 21.20. This implies that for the mean score of these students to be higher
during post test, the formative evaluation with feedback has significant impact on the
students which has made the t-calculated of 2.84 to be significant as P<0.005. Since the
calculated value (2.84) is greater than the critical value (1.96) then there is the rejection
which stated that there is no significant difference on the achievement scores of students who
underwent formative evaluation on geography in secondary school.
Ho2: There is no significant difference in the students mean interest scores of an experimental
group.
In order to test the above hypothesis, the pre-test interest and post-test interest mean score of
the students were analyzed to find out whether formative evaluation has any effect on
students interest in geography. The result of the analysis is presented in table 2.
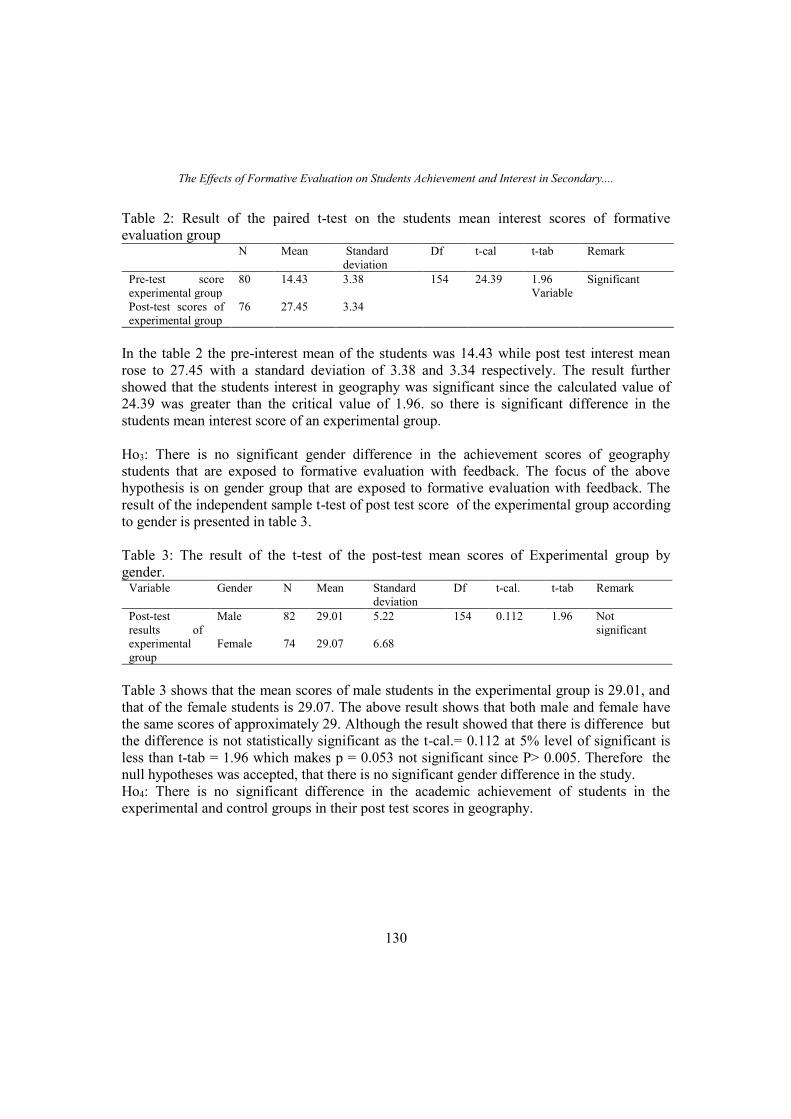
The Effects of Formative Evaluation on Students Achievement and Interest in Secondary....
130
Table 2: Result of the paired t-test on the students mean interest scores of formative
evaluation group N Mean Standard
deviation
Df t-cal t-tab Remark
Pre-test score
experimental group
80 14.43 3.38 154 24.39 1.96
Variable
Significant
Post-test scores of
experimental group
76 27.45 3.34
In the table 2 the pre-interest mean of the students was 14.43 while post test interest mean
rose to 27.45 with a standard deviation of 3.38 and 3.34 respectively. The result further
showed that the students interest in geography was significant since the calculated value of
24.39 was greater than the critical value of 1.96. so there is significant difference in the
students mean interest score of an experimental group.
Ho3: There is no significant gender difference in the achievement scores of geography
students that are exposed to formative evaluation with feedback. The focus of the above
hypothesis is on gender group that are exposed to formative evaluation with feedback. The
result of the independent sample t-test of post test score of the experimental group according
to gender is presented in table 3.
Table 3: The result of the t-test of the post-test mean scores of Experimental group by
gender. Variable Gender N Mean Standard
deviation
Df t-cal. t-tab Remark
Post-test
results of
experimental
group
Male 82 29.01 5.22 154 0.112 1.96 Not
significant
Female 74 29.07 6.68
Table 3 shows that the mean scores of male students in the experimental group is 29.01, and
that of the female students is 29.07. The above result shows that both male and female have
the same scores of approximately 29. Although the result showed that there is difference but
the difference is not statistically significant as the t-cal.= 0.112 at 5% level of significant is
less than t-tab = 1.96 which makes p = 0.053 not significant since P> 0.005. Therefore the
null hypotheses was accepted, that there is no significant gender difference in the study.
Ho4: There is no significant difference in the academic achievement of students in the
experimental and control groups in their post test scores in geography.
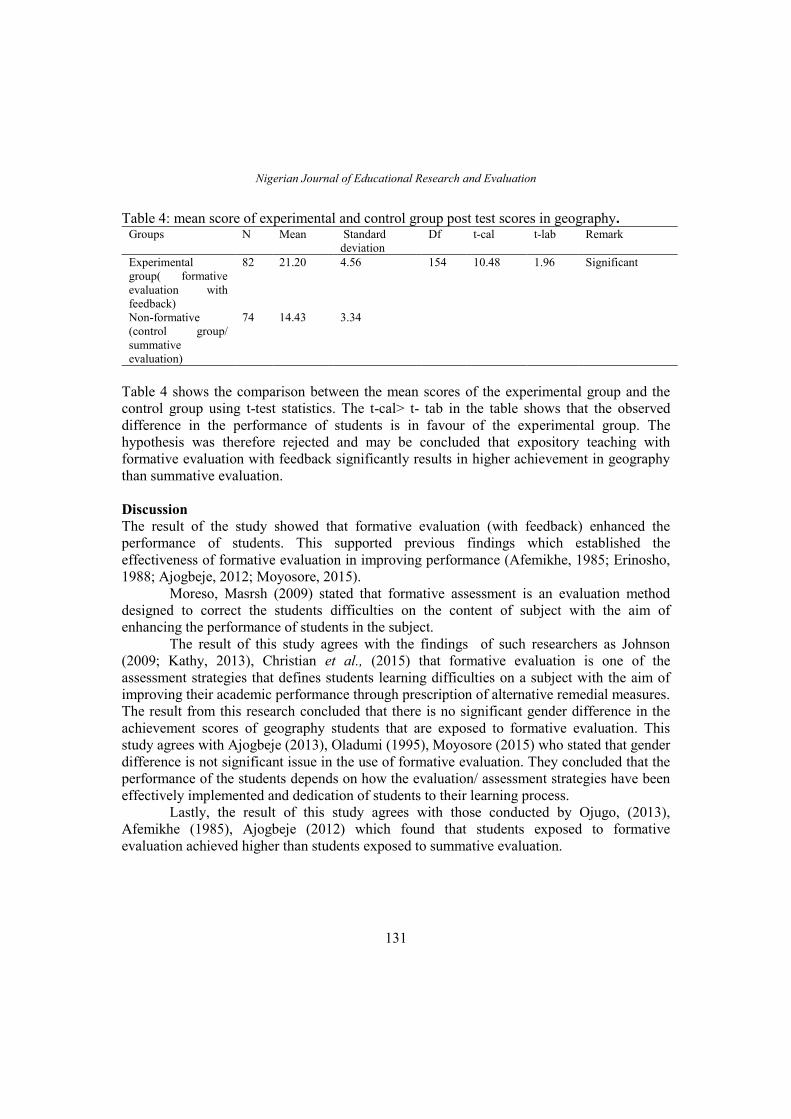
Nigerian Journal of Educational Research and Evaluation
131
Table 4: mean score of experimental and control group post test scores in geography. Groups N Mean Standard
deviation
Df t-cal t-lab Remark
Experimental
group( formative
evaluation with
feedback)
82 21.20 4.56 154 10.48 1.96 Significant
Non-formative
(control group/
summative
evaluation)
74 14.43 3.34
Table 4 shows the comparison between the mean scores of the experimental group and the
control group using t-test statistics. The t-cal> t- tab in the table shows that the observed
difference in the performance of students is in favour of the experimental group. The
hypothesis was therefore rejected and may be concluded that expository teaching with
formative evaluation with feedback significantly results in higher achievement in geography
than summative evaluation.
Discussion
The result of the study showed that formative evaluation (with feedback) enhanced the
performance of students. This supported previous findings which established the
effectiveness of formative evaluation in improving performance (Afemikhe, 1985; Erinosho,
1988; Ajogbeje, 2012; Moyosore, 2015).
Moreso, Masrsh (2009) stated that formative assessment is an evaluation method
designed to correct the students difficulties on the content of subject with the aim of
enhancing the performance of students in the subject.
The result of this study agrees with the findings of such researchers as Johnson
(2009; Kathy, 2013), Christian et al., (2015) that formative evaluation is one of the
assessment strategies that defines students learning difficulties on a subject with the aim of
improving their academic performance through prescription of alternative remedial measures.
The result from this research concluded that there is no significant gender difference in the
achievement scores of geography students that are exposed to formative evaluation. This
study agrees with Ajogbeje (2013), Oladumi (1995), Moyosore (2015) who stated that gender
difference is not significant issue in the use of formative evaluation. They concluded that the
performance of the students depends on how the evaluation/ assessment strategies have been
effectively implemented and dedication of students to their learning process.
Lastly, the result of this study agrees with those conducted by Ojugo, (2013),
Afemikhe (1985), Ajogbeje (2012) which found that students exposed to formative
evaluation achieved higher than students exposed to summative evaluation.
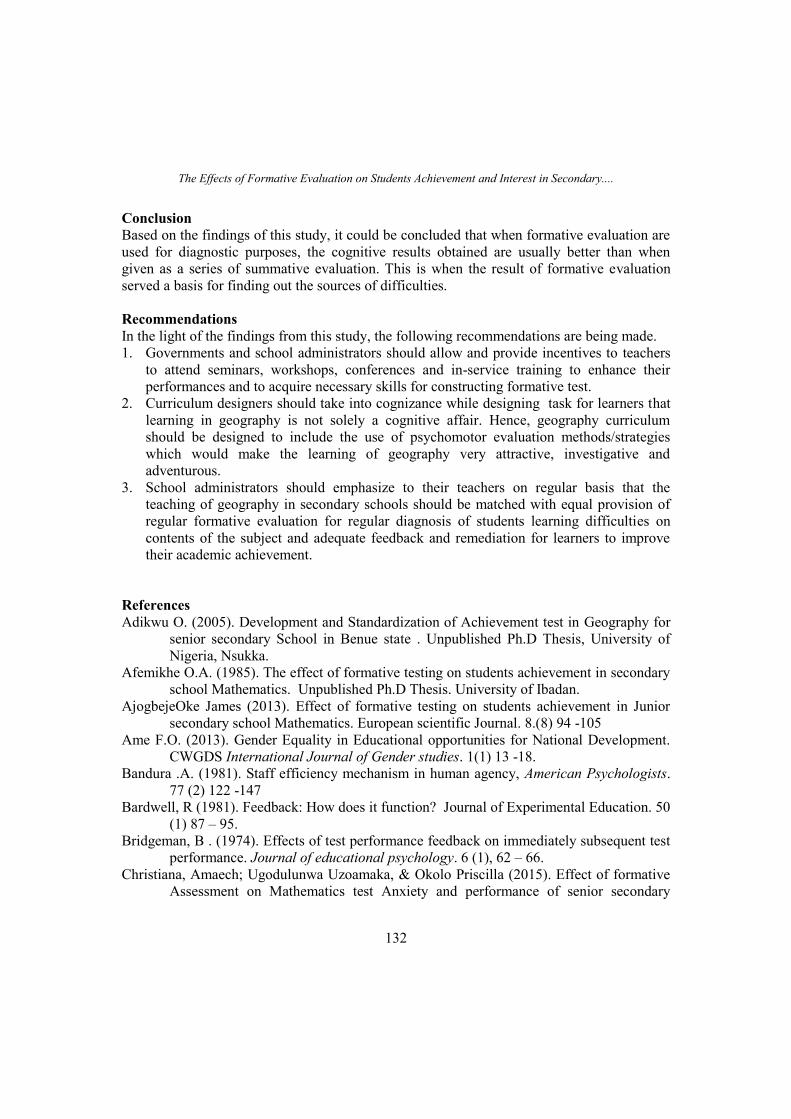
The Effects of Formative Evaluation on Students Achievement and Interest in Secondary....
132
Conclusion
Based on the findings of this study, it could be concluded that when formative evaluation are
used for diagnostic purposes, the cognitive results obtained are usually better than when
given as a series of summative evaluation. This is when the result of formative evaluation
served a basis for finding out the sources of difficulties.
Recommendations
In the light of the findings from this study, the following recommendations are being made.
1. Governments and school administrators should allow and provide incentives to teachers
to attend seminars, workshops, conferences and in-service training to enhance their
performances and to acquire necessary skills for constructing formative test.
2. Curriculum designers should take into cognizance while designing task for learners that
learning in geography is not solely a cognitive affair. Hence, geography curriculum
should be designed to include the use of psychomotor evaluation methods/strategies
which would make the learning of geography very attractive, investigative and
adventurous.
3. School administrators should emphasize to their teachers on regular basis that the
teaching of geography in secondary schools should be matched with equal provision of
regular formative evaluation for regular diagnosis of students learning difficulties on
contents of the subject and adequate feedback and remediation for learners to improve
their academic achievement.
References
Adikwu O. (2005). Development and Standardization of Achievement test in Geography for
senior secondary School in Benue state . Unpublished Ph.D Thesis, University of
Nigeria, Nsukka.
Afemikhe O.A. (1985). The effect of formative testing on students achievement in secondary
school Mathematics. Unpublished Ph.D Thesis. University of Ibadan.
AjogbejeOke James (2013). Effect of formative testing on students achievement in Junior
secondary school Mathematics. European scientific Journal. 8.(8) 94 -105
Ame F.O. (2013). Gender Equality in Educational opportunities for National Development.
CWGDS International Journal of Gender studies. 1(1) 13 -18.
Bandura .A. (1981). Staff efficiency mechanism in human agency, American Psychologists.
77 (2) 122 -147
Bardwell, R (1981). Feedback: How does it function? Journal of Experimental Education. 50
(1) 87 – 95.
Bridgeman, B . (1974). Effects of test performance feedback on immediately subsequent test
performance. Journal of educational psychology. 6 (1), 62 – 66.
Christiana, Amaech; Ugodulunwa Uzoamaka, & Okolo Priscilla (2015). Effect of formative
Assessment on Mathematics test Anxiety and performance of senior secondary
Nigerian Journal of Educational Research and Evaluation
133
school students in Jos. Nigeria. Journal of research and Method in education. 5(2)
38 -47.
Ebuoh .C. N (2004). Educational Measurement and Evaluation for effective teaching and
learning. Enugu: Sky Printing Press.
Erinosho, S.Y. (1988). The effect of formative evaluation on the performance of students in
physics. Unpublished Ph.D Thesis. University of Ibadan, Ibadan.
Garret, H. E. (2007). Statistics in Psychology and Education. New Delhi: Paragon
International Publishers.
Gronlund .N.E & Linn R.L. (1990). Measurement and Evaluation in teaching (6th edition).
New York, Macmillan.
Idoko C.C (2010). Science Education and Instruction: A practical Approach Enugu: Cheston
Agency Press ltd.
Illesanmi, J. (2001). Elementary Geography for Nursery and Primary schools. Oshogbo:
Graphical Nigeria publishers.
Johnson, D.W & Johnson R.T. (2002). Meaningful Assessment. A manageable and
cooperative process. Boston: Allyn and Bacon
Kathy Dyer (2013). Essay Assessment technique for Measuring in teaching and Learning. the
Education blog. www.nwea.org. 1-22 essay formative assessment.
Marsh, C.J. (2007). A critical Analysis of the use of formative Assessment in school
Education research and policy Practice 1(6). 25 – 29.
Moyosore O.A (2015). The effect of formative Assessment on students’ Achievement in
secondary school mathematics. International Journal for Educational
Research.45(12).116-122.
Ojugo, A. A. (2013). Effect of formative test and attitudinal types on students’ Achievement
in mathematics in Nigeria. African Educational Research Journal. 1(2). 113 -117.
Oladunni, M. O. (1995). Effects mathematics language and problem solving strategies on
achievement of students in mathematics. Journal of Educational Research and
Evaluation.
WAEC (2007). Chief examiners Report. Lagos: Nigeria. Megavous (WA) Ltd.
Usage of Dice in the Teaching and Learning of Probability in Senior Secondary Two in Jos....
134
USAGE OF DICE IN THE TEACHING AND LEARNING OF PROBABILITY IN
SENIOR SECONDARY TWO IN JOS-NORTH LOCAL GOVERNMENT AREA OF
PLATEAU STATE.
Obadare-Akpata Oluwatoyin C. & Osazuwa Christopher
Email: [email protected]
07037199498, 07034226462
Department of Science and Technology Education, University of Jos
Abstract
The study investigated the usage of dice in the teaching and learning of probability in senior
secondary schools in Jos-North Local Government Area of Plateau state. The research
design was quasi-experimental pretest-posttest control group design. The sample size was
one hundred and thirty (130) students from a population of eight thousand, one hundred and
eighty-three for 2016/2017 academic session from ninety-nine public and private co-
educational senior secondary schools in Jos-North Local Government Area. The use of dice
was applicable in teaching the experimental group while withheld in the control group. Mean
and Standard deviation were used for the research questions while ANCOVA was used in
testing the hypotheses at 5% level of significance. Results indicated that the usage of dice
was effective in enhancing students’ achievement on probability as it was found that the
experimental group with mean of 60.76 outperformed the control group with mean of 42.73.
Therefore, there is significant difference in the mean achievement score of students taught
probability using dice and those taught without dice. Furthermore, female students with
mean of 62.19 performed higher than their male counterparts with mean of 59.03 in the
experimental group. However, the analyses for the two hypotheses for both school type and
gender showed there is no significant difference in the mean achievement scores of students
in probability taught using dice.
Keywords: Dice, Probability, Gender and School type.
Introduction
There is a branch of Applied Mathematics called statistics which plays a central role
especially in every field of human activity. It helps in describing measurements more
precisely. The large number of statistical methods are probability, averages, dispersions, etc.
(Gurunet, n.d). Therefore, Probability is part of most secondary school Mathematics curricula
and it is also a component of many science curricula. The language of probability is also part
of everyday discourse, used increasingly to create eye-catching headlines and sound-bites.
For all sorts of reasons, therefore, students need to engage in the study of probability at
school. However, the problems associated with the teaching and learning of probability are
well-documented by Moore (1997) while Pratt (2011) corroborated it. A number of reasons
for this include difficulty with proportional reasoning and interpreting verbal statements of
Nigerian Journal of Educational Research and Evaluation
135
problems, conflicts between the analysis of probability in the Mathematics lesson and
experience in real life, and premature exposure to seemingly abstract areas. Teacher’s
knowledge may also be an issue, since not all teachers would have studied probability during
their own school education (Papaieronymou, 2009).
Probability has come to gain importance as a content area that students need to have
experience with in order to be well-informed citizens since its study “can raise the level of
sophistication at which a person interprets what he sees in ordinary life, in which theorems
are scarce and uncertainty is everywhere” (Cambridge Conference on School Mathematics,
1963, p.70 as cited in Jones, 2004).
Although there have been calls for an increased attention on probability in the school
curriculum, one of the problems encountered is the inadequate preparation of teachers in
probability (Penas, 1987; Conference Board of the Mathematical Sciences (CBMS), 2001).
Furthermore, Batanero, Godino and Roa (2004) suggested that educators need to provide
better initial training for teachers so as to attend to students’ difficulties and misconceptions
in probability.
Comparative study of Public versus Private schools and their effectiveness has been
the topic of a large number of studies. Several studies have been conducted in all over the
world to compare the various features of Public and Private schools. Researchers and
research bodies, for instance, Alderman, Orazem and Paterno (2001), U.S. Department of
Education (2012) to make the sense of superiority of either by focusing on different measures
of performance. Below are their findings:
Reports by National Assessment of Educational Progress (NAEP) which is
representative at national level for the assessment of American’s students’ knowledge in
various subject areas, that, Private schools performed better than Public schools in all major
subject areas including Mathematics and Science (U.S. Department of Education 2012).
Some findings show that Private school has an advantage of better performance as
compared to Public school. In the case of household choice for Public and Private schools in
Pakistan, parents prefer Private schooling, even poorest parents send their children to Private
schools (Alderman, Orazem & Paterno, 2001). Overall performance of Private schools in the
world for provision of education outshines in the majority of cases (Coulson, 2009).
A study which was conducted in Kenya to find out the determinant of emergent of
private education in Africa, where the private primary schools increased 4.6 %. - 11.5% from
2004 to 2007 after the introduction of free primary education policy (FPE) by the Kenyan
government in 2003, the public schools are crowded. The pupil - teacher ratio increased in
Public schools, this caused parents to react by transferring their children to Private schools.
High teacher-pupil ratio in Public schools is the probability of the emergence of Private
schools (Nishimura & Yamano, 2013). Private schools are not out performed in developed
countries even in poor areas of developing countries. A survey was conducted in a poor area
of Lagos State, Nigeria and it was found that 75% children were enrolled in Private schools,
while the teaching activities were higher in Private schools as compared to Public schools
(Tooley, Dixon & Olaniyan, 2005).
Usage of Dice in the Teaching and Learning of Probability in Senior Secondary Two in Jos....
136
The issue of low achievement with under representation of female children in Mathematics
has been the focus of many Mathematics educators and the womenfolk of some countries in
the recent times. Maduabum (2000) authenticates this point saying “The under representation
of girls and women in Science, Technology and Mathematics (STM) education has been a
worldwide phenomenon and a point of focus in recent researches in science education” (p.
25). This implies that there is low participation of female students in Mathematics compared
to their male counterparts generally. Maduabum substantiates this statement which showed
that there were still far fewer females than males in Nigerian Universities by year and sex,
faculty and sex, and level of courses and sex despite the fact that women constitute 50% of
Nigeria’s population. Similarly, Olagunju (2001) expresses the same view that in most
mathematics-related fields (scientific courses), there tends to be more males than females.
Durojaye, Ajie and Aiyebusi (2006) stated that “Girls and boys start off equal in
Mathematics and science performance in school, they appear to do equally well in both
subjects in elementary school. The same girls begin to lose interest in Mathematics and
science around the age of twelve. These girls then drop out of mathematical classes often
closing the doors on many career opportunities” (p. 313). This observation touches on the
fact that the low participation and performance of students at the higher level of
mathematical classes is obvious but may not be due to inability to cope naturally as their
male counterparts.
Grootenboer and Hemmings (2007) in a review noted that historically, the
achievement of girls in Mathematics, across a range of different contexts, was lower than that
of boys. Glenmon and Callahan in Fennema (2009) stated categorically that boys will
achieve higher than girls on tests dealing with mathematical reasoning while girls will
achieve higher than boys on test of computational ability. Caygill and Kirkham comment on
the distinct performance areas of girls compared with boys from their own studies as thus:
While there were no overall differences in mean Mathematics achievement between girls and
boys, there were some distinct differences in terms of content domains. On average, girls had
higher scores in data display, while boys had higher scores in number. Boys and girls
performed similarly on the geometric shape and measures domain and over the cognitive
domain (p. 1).
Therefore, the effective use of instructional materials is of the essence in the teaching
and learning of Mathematics, and also requires a lot of creativity as well as sound knowledge
in its operations. Hence, for students to understand and internalize the concept of probability
the teacher should have mastery of the concept and then how to use the appropriate
instructional materials. This instructional material will not only improve the technical quality
of teaching but also enrich the content quality of learning (Ajayi & Ema, 2006). The
researcher shall consider dice as an example of instructional material. Since teacher is a
major player in determining effective use of instructional material on students’ achievement
of probability in secondary schools, it is necessary to note in the words of Odili (2006) on the
role of Mathematics teacher in respect of the foregoing; that considering the pedagogical
aspect of the problems, one can see that almost all schools in spite of the much talked-about
Nigerian Journal of Educational Research and Evaluation
137
modern approach, the traditional classroom approach still prevails. He added that it is a
common defect in our educational set up that most of the subject teachers are not adequately
qualified in the subjects concerned. And hence, there is a serious lack of mathematical
instructions in our schools.
In a more specific term, to be able to teach effectively this concept of probability in
secondary schools, teachers of Mathematics should have the apt knowledge of using dice.
The teacher should bear in mind that this instructional material should have some artistic and
scientific appeal to the students and to appear real to them; this would help to avoid the
concept from being abstract thereby enabling the learner to understand and conceptualize it.
Students will not only learn effectively if this instructional material under consideration is
properly harnessed, they will also retain this concept for a longer period.
Students’ performance in Probability poses some concern and raises some obvious
questions: What would be the fate of science and technology education that depends to great
extent in Mathematics for its development? And what model will be effective for probability
in Mathematics instruction? It has been noted that though students underperform in this topic
under study, most fingers are pointed at the Mathematics teachers. The lack of using
instructional materials such as non-usage of dice to demystify this concept and lack of initial
training for teachers offering courses at the college level specific to probability are some
challenges encountered by students while schooling. Furthermore, The National Examination
Council (NECO) Chief examiners’ report on probability between 2005 and 2012 noted the
following problems students encountered: Many students could not decipher the questions
properly to know what was given. Generally, candidates perform below average in this
question on probability. Majority of the students attempted the questions without accuracy.
Most students could not understand some basic terms used in probability. Many candidates
found the interpretation of “at least” and “at most” difficult as these are common terms used
in probability. One of the problems students found was to look at the different fact as
identical. They lack the logical approach to the questions. Most candidates have not grasped
the basic concept of probability; hence, the questions were poorly attempted. The candidates
found this question a difficult one and as a result only 20% attempted the question. This
implies that students lack proper understanding of probability which makes them avoid it in
examination (NECO, 2005-2012). Therefore, the table below gave in a glance students’
percentage failure in Mathematics between 2005 and 2012.
Table 1: WAEC results displaying percentage failure in Mathematics from 2006-2012
(WAEC, 2012)
Year : 2006 2007 2008 2009 2010 2011 2012
% Failure: 58.88 53.15 66.91 74.01 60.43 69.30 61.19
Usage of Dice in the Teaching and Learning of Probability in Senior Secondary Two in Jos....
138
Thus findings indicated that probability has a place in nation building and daily usage of
individuals in the society. Therefore, from this backdrop and in a bid to correct this anomaly
that the researchers are undertaking this study on usage of dice in teaching and learning of
probability in senior secondary two in Jos-North Local Government Area of Plateau State.
The study is designed to find out the usage of dice in the teaching and learning of
probability in Senior Secondary II. Specifically, the study is geared towards finding out the
following:
1. To find out whether the use of dice will enhance students’ achievement in probability.
2. To determine whether gender has effect on students’ achievement in probability when
taught using dice.
3. To determine if there exist any difference between students’ achievement and school
type when taught using dice.
The following research questions are formulated to guide the researcher:
1. To what extent does the use of dice enhance students’ achievement in probability when
taught using dice and those taught without it?
2. To what extent does the use of dice influence male and female students’ achievement in
probability?
3. How do students in Public schools perform when taught probability using dice compared
to their counterpart in Private schools?
The following null hypotheses are formulated and will be tested at 5% level of significance:
HO1: There is no significant difference between the mean achievement scores of
students in probability using dice and those taught without it.
HO2: There is no significant difference between the mean achievement scores of
male and female students in probability taught using dice.
HO3: There is no significant difference between the mean achievement scores of
students in the Public schools and those in the Private schools taught using dice.
Method
The research design for this study was quasi-experimental pretest-posttest control group
design. In this design, the treatment was only assigned to the experimental intact classes that
were randomly selected from the secondary schools in Jos-North local government area of
Plateau State.
The target population of the study consisted of all the SS II students in Jos-North
Local Government Area of Plateau State. The students’ population is eight thousand, one
hundred and eighty-three for 2016/2017 academic session from ninety-nine co-educational
schools. There are twenty-one Public schools and seventy-eight Private schools (Educational
Resource Centre, Plateau State).
Four schools were randomly selected, that is, two schools from Public schools and
two from Private schools was randomly selected according to the proportion. The sample size
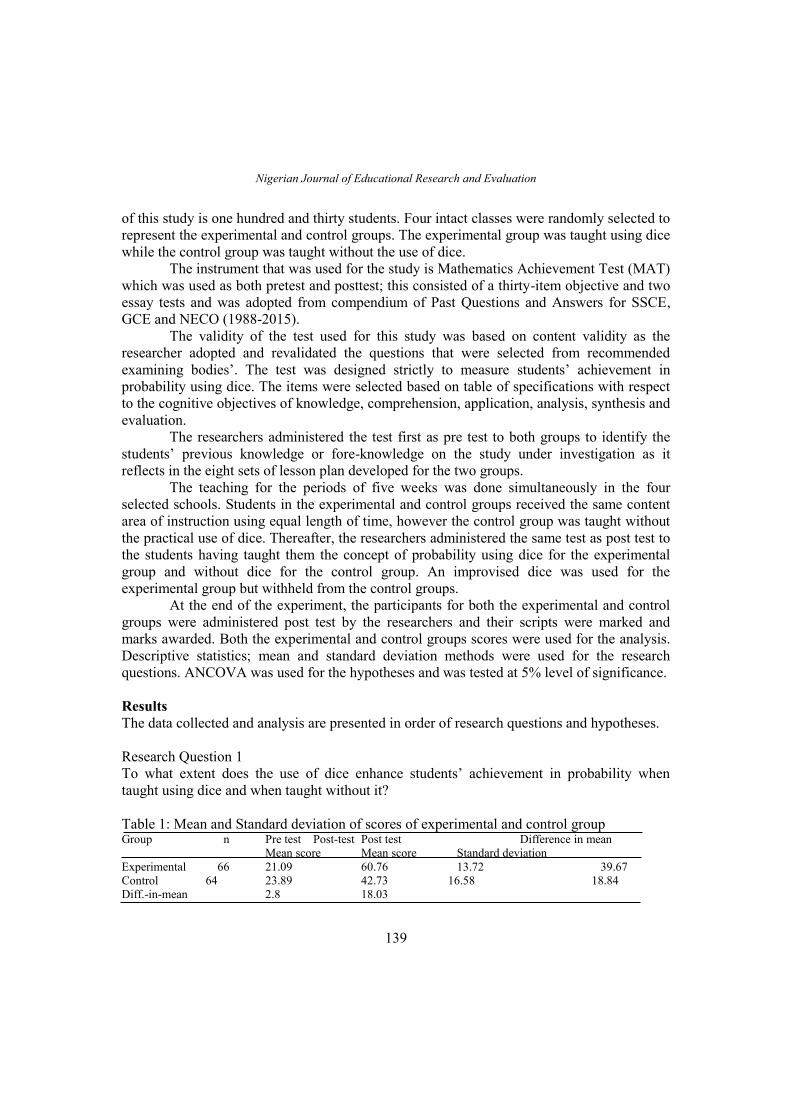
Nigerian Journal of Educational Research and Evaluation
139
of this study is one hundred and thirty students. Four intact classes were randomly selected to
represent the experimental and control groups. The experimental group was taught using dice
while the control group was taught without the use of dice.
The instrument that was used for the study is Mathematics Achievement Test (MAT)
which was used as both pretest and posttest; this consisted of a thirty-item objective and two
essay tests and was adopted from compendium of Past Questions and Answers for SSCE,
GCE and NECO (1988-2015).
The validity of the test used for this study was based on content validity as the
researcher adopted and revalidated the questions that were selected from recommended
examining bodies’. The test was designed strictly to measure students’ achievement in
probability using dice. The items were selected based on table of specifications with respect
to the cognitive objectives of knowledge, comprehension, application, analysis, synthesis and
evaluation.
The researchers administered the test first as pre test to both groups to identify the
students’ previous knowledge or fore-knowledge on the study under investigation as it
reflects in the eight sets of lesson plan developed for the two groups.
The teaching for the periods of five weeks was done simultaneously in the four
selected schools. Students in the experimental and control groups received the same content
area of instruction using equal length of time, however the control group was taught without
the practical use of dice. Thereafter, the researchers administered the same test as post test to
the students having taught them the concept of probability using dice for the experimental
group and without dice for the control group. An improvised dice was used for the
experimental group but withheld from the control groups.
At the end of the experiment, the participants for both the experimental and control
groups were administered post test by the researchers and their scripts were marked and
marks awarded. Both the experimental and control groups scores were used for the analysis.
Descriptive statistics; mean and standard deviation methods were used for the research
questions. ANCOVA was used for the hypotheses and was tested at 5% level of significance.
Results
The data collected and analysis are presented in order of research questions and hypotheses.
Research Question 1
To what extent does the use of dice enhance students’ achievement in probability when
taught using dice and when taught without it?
Table 1: Mean and Standard deviation of scores of experimental and control group Group n Pre test Post-test Post test Difference in mean
Mean score Mean score Standard deviation
Experimental 66 21.09 60.76 13.72 39.67
Control 64 23.89 42.73 16.58 18.84
Diff.-in-mean 2.8 18.03
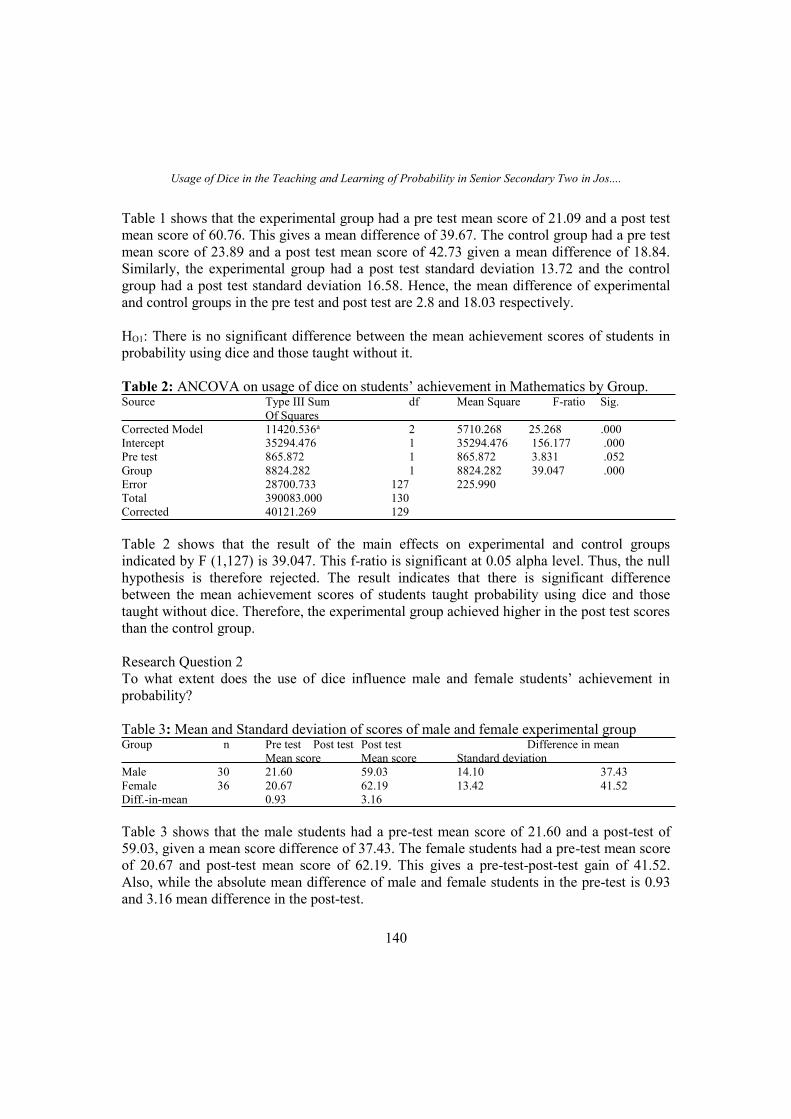
Usage of Dice in the Teaching and Learning of Probability in Senior Secondary Two in Jos....
140
Table 1 shows that the experimental group had a pre test mean score of 21.09 and a post test
mean score of 60.76. This gives a mean difference of 39.67. The control group had a pre test
mean score of 23.89 and a post test mean score of 42.73 given a mean difference of 18.84.
Similarly, the experimental group had a post test standard deviation 13.72 and the control
group had a post test standard deviation 16.58. Hence, the mean difference of experimental
and control groups in the pre test and post test are 2.8 and 18.03 respectively.
HO1: There is no significant difference between the mean achievement scores of students in
probability using dice and those taught without it.
Table 2: ANCOVA on usage of dice on students’ achievement in Mathematics by Group. Source Type III Sum df Mean Square F-ratio Sig.
Of Squares
Corrected Model 11420.536a 2 5710.268 25.268 .000
Intercept 35294.476 1 35294.476 156.177 .000
Pre test 865.872 1 865.872 3.831 .052
Group 8824.282 1 8824.282 39.047 .000
Error 28700.733 127 225.990
Total 390083.000 130
Corrected 40121.269 129
Table 2 shows that the result of the main effects on experimental and control groups
indicated by F (1,127) is 39.047. This f-ratio is significant at 0.05 alpha level. Thus, the null
hypothesis is therefore rejected. The result indicates that there is significant difference
between the mean achievement scores of students taught probability using dice and those
taught without dice. Therefore, the experimental group achieved higher in the post test scores
than the control group.
Research Question 2
To what extent does the use of dice influence male and female students’ achievement in
probability?
Table 3: Mean and Standard deviation of scores of male and female experimental group Group n Pre test Post test Post test Difference in mean
Mean score Mean score Standard deviation
Male 30 21.60 59.03 14.10 37.43
Female 36 20.67 62.19 13.42 41.52
Diff.-in-mean 0.93 3.16
Table 3 shows that the male students had a pre-test mean score of 21.60 and a post-test of
59.03, given a mean score difference of 37.43. The female students had a pre-test mean score
of 20.67 and post-test mean score of 62.19. This gives a pre-test-post-test gain of 41.52.
Also, while the absolute mean difference of male and female students in the pre-test is 0.93
and 3.16 mean difference in the post-test.
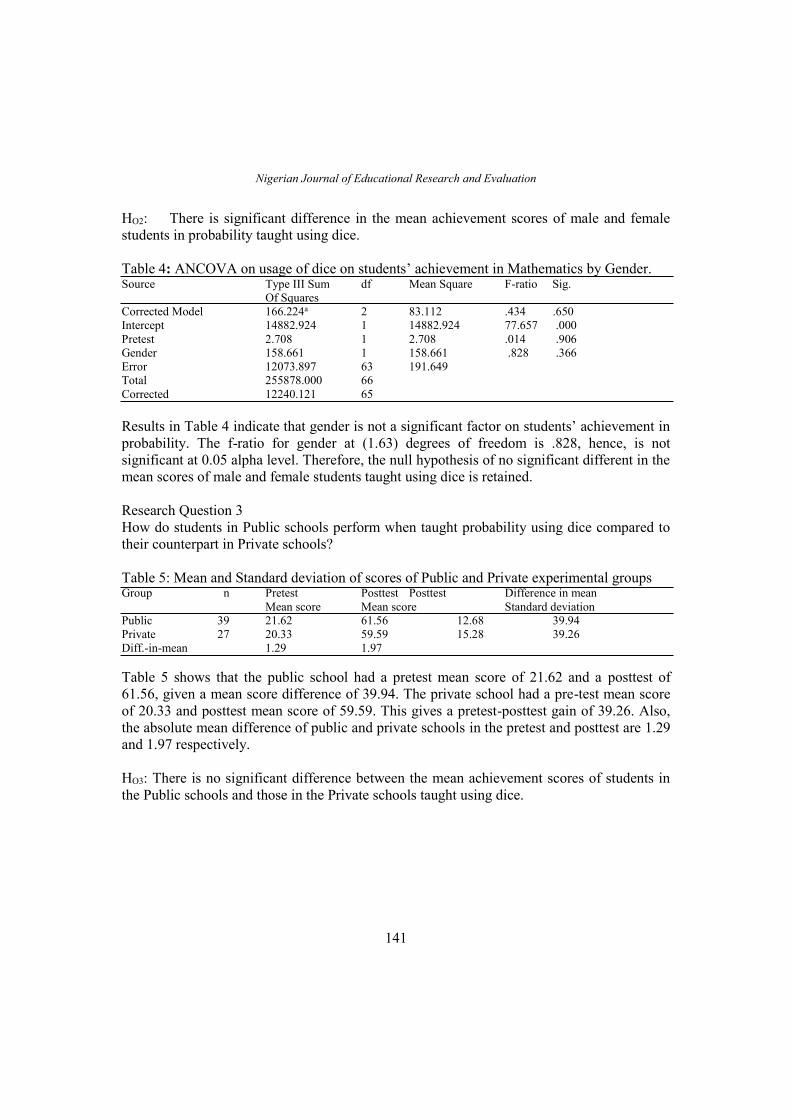
Nigerian Journal of Educational Research and Evaluation
141
HO2: There is significant difference in the mean achievement scores of male and female
students in probability taught using dice.
Table 4: ANCOVA on usage of dice on students’ achievement in Mathematics by Gender. Source Type III Sum df Mean Square F-ratio Sig.
Of Squares
Corrected Model 166.224a 2 83.112 .434 .650
Intercept 14882.924 1 14882.924 77.657 .000
Pretest 2.708 1 2.708 .014 .906
Gender 158.661 1 158.661 .828 .366
Error 12073.897 63 191.649
Total 255878.000 66
Corrected 12240.121 65
Results in Table 4 indicate that gender is not a significant factor on students’ achievement in
probability. The f-ratio for gender at (1.63) degrees of freedom is .828, hence, is not
significant at 0.05 alpha level. Therefore, the null hypothesis of no significant different in the
mean scores of male and female students taught using dice is retained.
Research Question 3
How do students in Public schools perform when taught probability using dice compared to
their counterpart in Private schools?
Table 5: Mean and Standard deviation of scores of Public and Private experimental groups Group n Pretest Posttest Posttest Difference in mean
Mean score Mean score Standard deviation
Public 39 21.62 61.56 12.68 39.94
Private 27 20.33 59.59 15.28 39.26
Diff.-in-mean 1.29 1.97
Table 5 shows that the public school had a pretest mean score of 21.62 and a posttest of
61.56, given a mean score difference of 39.94. The private school had a pre-test mean score
of 20.33 and posttest mean score of 59.59. This gives a pretest-posttest gain of 39.26. Also,
the absolute mean difference of public and private schools in the pretest and posttest are 1.29
and 1.97 respectively.
HO3: There is no significant difference between the mean achievement scores of students in
the Public schools and those in the Private schools taught using dice.
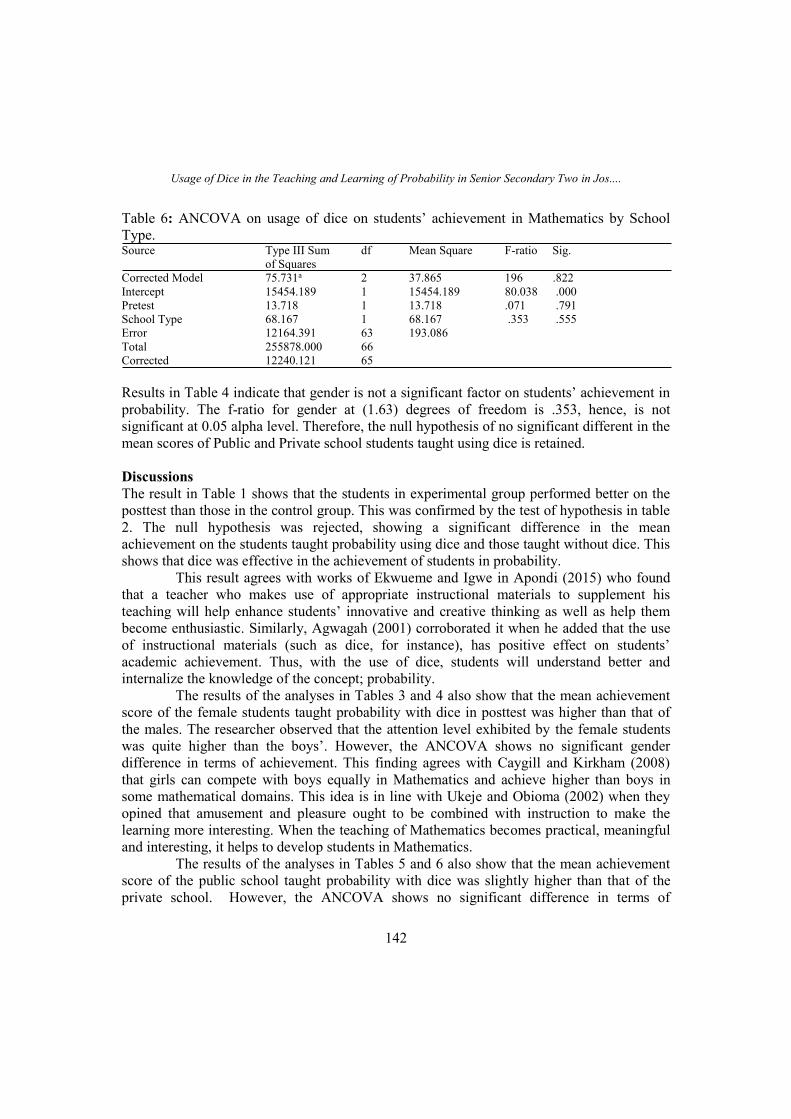
Usage of Dice in the Teaching and Learning of Probability in Senior Secondary Two in Jos....
142
Table 6: ANCOVA on usage of dice on students’ achievement in Mathematics by School
Type. Source Type III Sum df Mean Square F-ratio Sig.
of Squares
Corrected Model 75.731a 2 37.865 196 .822
Intercept 15454.189 1 15454.189 80.038 .000
Pretest 13.718 1 13.718 .071 .791
School Type 68.167 1 68.167 .353 .555
Error 12164.391 63 193.086
Total 255878.000 66
Corrected 12240.121 65
Results in Table 4 indicate that gender is not a significant factor on students’ achievement in
probability. The f-ratio for gender at (1.63) degrees of freedom is .353, hence, is not
significant at 0.05 alpha level. Therefore, the null hypothesis of no significant different in the
mean scores of Public and Private school students taught using dice is retained.
Discussions
The result in Table 1 shows that the students in experimental group performed better on the
posttest than those in the control group. This was confirmed by the test of hypothesis in table
2. The null hypothesis was rejected, showing a significant difference in the mean
achievement on the students taught probability using dice and those taught without dice. This
shows that dice was effective in the achievement of students in probability.
This result agrees with works of Ekwueme and Igwe in Apondi (2015) who found
that a teacher who makes use of appropriate instructional materials to supplement his
teaching will help enhance students’ innovative and creative thinking as well as help them
become enthusiastic. Similarly, Agwagah (2001) corroborated it when he added that the use
of instructional materials (such as dice, for instance), has positive effect on students’
academic achievement. Thus, with the use of dice, students will understand better and
internalize the knowledge of the concept; probability.
The results of the analyses in Tables 3 and 4 also show that the mean achievement
score of the female students taught probability with dice in posttest was higher than that of
the males. The researcher observed that the attention level exhibited by the female students
was quite higher than the boys’. However, the ANCOVA shows no significant gender
difference in terms of achievement. This finding agrees with Caygill and Kirkham (2008)
that girls can compete with boys equally in Mathematics and achieve higher than boys in
some mathematical domains. This idea is in line with Ukeje and Obioma (2002) when they
opined that amusement and pleasure ought to be combined with instruction to make the
learning more interesting. When the teaching of Mathematics becomes practical, meaningful
and interesting, it helps to develop students in Mathematics.
The results of the analyses in Tables 5 and 6 also show that the mean achievement
score of the public school taught probability with dice was slightly higher than that of the
private school. However, the ANCOVA shows no significant difference in terms of
Nigerian Journal of Educational Research and Evaluation
143
achievement. This confirmed the contributions of Lubienski, Lubienski and Crane (2009)
who said that public schools perform just as well if not better than private schools. Hence,
this finding indicated that the type of school classified as public or private did not make any
difference on students’ academic achievement. In addition to this, the researcher found that
when these schools (public and private) are exposed to similar academic treatment or
condition like the one used in this study where they were exposed to same style of teaching
using the same instrument and materials, there may be no significant difference in their
academic achievement.
The role of instructional materials in teaching cannot be overemphasized. Some
teachers teach without any instructional materials. The students are, then, bored and perform
poorly since they do not understand the concepts being taught by the teachers. The use of
dice even in playing ludo game, for instance, will make the students to be actively involved
in the daily lessons as they will be interested also in learning Mathematics as a game. It is a
fact that behind every successful Mathematics lesson is a good teacher. Effective teaching
implies productive, result-oriented, purposeful, qualitative, meaningful and realistic teaching.
The essence of being an effective teacher according to Amoo (2000) lies in knowing what do
to foster students’ learning. This implies that an effective teacher develops mathematical
ideas and skills in students so that they can be used for personal needs, further study and for
everyday life.
Therefore, the Mathematics teachers should ensure that new materials are related to
relevant ideas in the existing cognitive structure on a substantive basis. The teacher should
also build positive attitude, interest and problem solving skills in the students that are broader
in application than knowledge for its own sake. In order to achieve this, Mathematics
teachers could teach Mathematics in application-oriented form using constructional materials
such as dice whose materials are readily available in the child’s environment or within the
reach of the child.
Conclusion
Based on the findings from this study on the usage of dice in the teaching and learning of
probability in senior secondary schools, it follows that:
1. The attitude of teachers towards teaching mathematical concepts should be a major point
of emphasis and thus should be redressed.
2. The state of indiscipline and high rate of corruption are quite alarming among secondary
schools owners and principals and as a result, they hardly make instructional materials
available for use in their various schools hence, no motivation for the students to learn.
Also, most teachers are underpaid in many private schools while late payment of salaries
in public schools has discouraged many teachers into going extra mile to improvise
instructional materials for their students.
3. The type of school classified as public or private did not make much difference on
students’ academic achievement on probability. In addition to this, the researcher found
that when these schools (public and private) are exposed to similar treatment or condition
Usage of Dice in the Teaching and Learning of Probability in Senior Secondary Two in Jos....
144
like the one used in this study, there may be no significant difference in their academic
achievement.
Recommendations
Based on the findings, the following recommendations are made:
1. Mathematics teachers as curriculum implementers should be trained and have refresher
training by the National Mathematics Centre (NMC), Mathematics Association of
Nigeria (MAN) and any other relevant body on different ways of using appropriate
instructional materials and improvising when the need arises in teaching Mathematics .
This will enable teachers to be well informed on innovations in their respective fields
since learning is dynamic. Furthermore, this body should also intensify their level of
follow-up programme on Mathematics teachers.
2. An instrument that is both diagnostic and prognostic like the Mathematics Achievement
Motivation Scale (MAMS) for Senior Secondary Schools in Nigeria that was constructed
and validated by Obadare-Akpata O.C. in 2015 if well implemented will go a long way
in determining the assessment of the students in order to discover their major challenges
and offer applicable solution in the teaching/learning system.
3. Ministry of education should come up with a special Mathematics Educators Task Force
(METAF) whose sole responsibility is to monitor and ensure that Mathematics teachers
across board are truly carrying out their expected duty. This, if genuinely executed, will
help unseat most Mathematics teachers from their complacency.
References
Agwagah, U.N.V. (2001). Teaching number bases. In V. F. Harbor-Peters (ed). Mathematics
language for new millennium: Implications for the society. Proceeding of Science
Teachers’ Association of Nigeria, 125-127
Ajayi, D.T. & Ema, E. (2006). Education Technology Methods, materials, Machines. SEEYE
PRINTS 82/13 Bauchi Road, Jos
Alderman,H., Orazem, P. F. & Paterno, E. M. (2001), “School Quality, School Cost, and the
Public/Private School Choices of Low-Income Households in Pakistan”, Journal Of
Human Resource, 36, 304-326.
Amoo, S. A. (2002). Analysis of problem encountered in teaching and learning Mathematics
in secondary schools. Abacus of mathematical association of Nigeria (MAN). Vol.
127: 16-20.
Apondi, J.A. (2015). Impact of Instructional materials on academic achievement in
Mathematics in public primary schools in Siaya county, Kenya
Batanero, C., Godino, J. D., & Roa, R. (2004). Training teachers to teach probability. Journal
of Statistics Education, 12(1).
Caygill, R. & Kirkham, S. (2008). Mathematics: Trends in year five mathematics
achievement 1994-2006. Mathematics Achievement by Gender-Education Count.
Nigerian Journal of Educational Research and Evaluation
145
Retrieved January 29, 2017 from http://www.educationcounts.govt.nz/publications
/series/257/tinss.
Conference Board of the Mathematical Sciences. (2001). The Mathematical Education of
Teachers. Providence, RI: American Mathematical Society.
Coulson, A. J. (2009), “Comparing Public, Private, and Market Schools: The International
Evidence”, Journal of School Choice, 3(1), 31–54.
Durojaye, N.O., Ajie, I.J. & Aiyebusi, S.M. (2006). Improving the participation and
performance of female students in mathematics. International Journal of Research in
Education 2006, 3 (2), 313-315.
Fennema,E. (2009). Mathematics Learning and the sexes: A review. Journal for Research in
Mathematics Education,5,2-3. Retrieved January 29, 2017 from
http://www.jstor.org/pss/748949.
Grootenboer,I. & Hemmings, B. (2007). Mathematics Performance and the role played by
Affective and Background Factor. Mathematics Education Research Journal 2007,
19(3), 3-20.
Gurunet(n.d). The importance of Statistics in Mathematics. Retrieved on February 21, 2017
from www.answer.com
Jones, D. L. (2004). Probability in middle grades mathematics textbooks: An examination of
historical trends, 1957-2004. Unpublished doctoral dissertation, University of
Missouri, Columbia.
Lubienski, S., Lubienski, C. & Crane, C. (2009). ‘Public Schools Outperformed Private
Schools in Mathematics’, Publication of College of Education, Illinois University,
USA.
Maduabum,M.A. (2000). Gender Disparity in Science, Technology and Mathematics (STM)
University Education; Nigeria in International Perspectives. Journal of Education
Studies, 6,25-27.
Moore, D. S. (1997). Probability and Statistics in the Core Curriculum. Confronting the Core
Curriculum, 93-98. Retrieved February 27, 2016 from
http://www.stat.purdue.edu/~dsmoore/articles/StatInCore.pdf
National Examination Council (NECO, 2005-2012). Chief Examiners’ Report.
Nishimura, M & Yamano,T (2013), “Emerging Private Education In Africa: Determinants
of School Choice in Rural Kenya”, World Development, 43(2013), 266–275.
Obadare-Akpata O.C. (2015) Construction and Validation of Mathematics Achievement
Motivation Scale (MAMS) for Senior Secondary Schools in Nigeria (unpublished
doctoral thesis), University of Lagos, Akoka, Nigeria.
Odili, G.A. (2006). Mathematics in Nigeria Secondary Schools: A Teaching Perspective.
Port-Harcourt. Rex Charles & Patrick Limited.
Olagunju, S.O. (2001). Sex Age and Performance in Mathematics. Abacus 26(1), 8-14.
Oshadumi, J.A. (2003). Impact of Instructional Materials on Students’ Academic
Achievement in Agricultural Science at Secondary Schools in Okene LGA, Kogi
State, Unpublished M.Sc. (ED) thesis, University of Ado Ekiti, (UNAD), Nigeria.
Usage of Dice in the Teaching and Learning of Probability in Senior Secondary Two in Jos....
146
Papaieronymou, I. (2009). Recommended Knowledge of Probability for Secondary
Mathematics Teachers. Proceedings from Proceedings of CERME 6, Lyon, France.
Pratt, D. (2011). Re-connecting probability and reasoning about data in secondary school
teaching. Proceedings from 58th World Statistics Congress of the International
Statistical Institute.
Penas, L. M. (1987). Probability and Statistics in Midwest high schools in American
Statistical Association 1987 Proceedings of the Section on Statistical Education, (p.
122). Alexandria, VA: American Statistical Association.
Tooley, J., Dixon, P. & Olaniyan, O. (2005), “Private and Public Schooling In Low-Income
Areas of Lagos State, Nigeria, A Census and Comparative Survey”, International
Journal of Educational Research, 43, (3), 125–146.
Ukeje, B.O. & Obioma, G.O. (2002). Mathematics Games for Primary and Secondary
schools, Abuja: National Mathematics Centre, Sheda, Nigeria.
U.S. Department of Education (2012), “Student Achievement in Private Schools”, National
Assessment to Educational Progress, NCES 2006.
West African Examination Council (WAEC, 2012). Mathematics Chief Examiners’ Report
Yaba:
Relative Effects of Mediated Instructional Techniques on Senior Secondary School Students’....
147
RELATIVE EFFECTS OF MEDIATED INSTRUCTIONAL TECHNIQUES ON
SENIOR SECONDARY SCHOOL STUDENTS’ ACHIEVEMENT IN
VOCABULARY IN KWARA STATE, NIGERIA
Mohammed, Bola Sidikat
Kwara State Teaching Service Commission, Ilorin
[email protected]; 08062424568
& Ogunwole, Opeyemi
Kwara State Teaching Service Commission, Ilorin
[email protected]; 07060416643
Abstract
This study investigated the effects of mediated instructional techniques on Secondary School
Students’ achievement in English Vocabulary in Kwara State, Nigeria. Quasi-experimental
design was adopted for the study. A sample of 239 Senior Secondary One (SS1) Students’
from public co-educational secondary schools in Kwara State was used for the study. Four
major groups were involved in the study; three experimental groups and one control group.
The instrument for data collection was a forty (40) item English Vocabulary Achievement
Test (EVAT) adapted from SSCE was used for the collection of data. The reliability
coefficient of the instrument of 0.72 was obtained using Pearson Product Moment
Correlation Co-efficient. Six hypotheses generated for this study were tested at 0.05 levels of
significance. Data collected were analyzed using Analysis of Covariance (ANCOVA). The
findings of the study showed that the mediated instructional technique was effective in
enhancing students’ vocabulary achievement. There was a significant difference in the
vocabulary achievement of students in the experimental and control groups while at gender
and ability levels there was a significant difference in the vocabulary achievement of male
and female students. It was recommended that English vocabulary should be taught using
new innovation of mediated instructional techniques to improve the teaching and learning of
English language in secondary schools
Keywords: Relative Mediated, Techniques, Achievement, Vocabulary.
Introduction
Vocabulary is an essential part of the English language curriculum. It plays a significant role
in the understanding of the language skills. Without the knowledge of vocabulary it will be
difficult for man to speak, read or write. This is because vocabulary takes the students
through one important factor that contributes to using English language or any language
effectively. Vocabulary is central to any language acquisition and learning which is required
for thought and expression of feeling. The students’ inability to select and use the appropriate
words in every given situations like speech, composition writing, answering comprehension
Nigerian Journal of Educational Research and Evaluation
148
and summary questions, or selecting the best option to given items in English objective tests
unveil students’ words knowledge. Poor academic achievement in English language at both
internal and external examination could be attributed to many factors among which are
inappropriate teaching methods, dearth of instruction materials Ayodele (1983) and lawal
(1987) wrong spellings of words, concord and poor usage, The Chief Examiner reports
(2013) decried the poor performance of students in the mechanical accuracy.
…very few of the candidates scored marks under the mechanical accuracy.
Examples of errors discovered in the mechanical accuracy area are: their for there,
loose for lose, wrong concord; this days, wrong tense usage: since we leave school.
English language teaching is rather a difficult and complex process that requires careful and
diligent work. Educators in the field of language teaching have over the years been trying to
find ways to make language learning enjoyable and attractive for the students. Developing an
extensive vocabulary is a challenge faced by many students of English language, both native
speakers and students of English as a second or foreign language. While some develop an
extensive knowledge in vocabulary, however, many have difficulty in using the words
accurately in their speech and writing or lack the ability to translate the definition of the word
into a usable part of their lexicon. This impacts negatively on personal growth because
vocabulary knowledge contributes greatly to the ability to express oneself effectively, a trait
that is highly sought after in today’s job market (Zuiker, 2012).
Insufficient vocabulary knowledge is a critical problem for many students,
particularly, English language learners (Silverman, 2009). Students need to know a wide
range of words to understand the text they will encounter in school. Many English language
learners who come to school with limited or non-English language background find that
vocabulary is their most frequently encountered obstacle in attempting to access information
from classroom tests (Silverman, 2009).
The core of any language involves the sound system, the syntax, and the vocabulary.
Adeniyi (2006), but of paramount importance is the vocabulary. It is through vocabulary that
sentences can be conveyed and made meaningful. This is in line with an adage which says
“without grammar very little can be conveyed; without vocabulary nothing can be conveyed”
(Wilkins, 1972).
The foregoing indicates the centrality of vocabulary to language acquisition, learning,
teaching and communication. The study of language as it is now is the paramount concern in
linguistics today. However, in the study of vocabulary in particular, etymology still plays a
key part. It is considered useful for learners and users of the words to have some awareness
of the origin and evolution of the words they use. Such knowledge is supposed to enhance
the retention of words and precision in their use (Inyang, 2004).
A good knowledge of vocabulary induces and sustains good retention. Students’
ability to use appropriate words, terms and expressions in a given context reveals the levels
of vocabulary acquisition. The ability to select and use the appropriate words in every given
Relative Effects of Mediated Instructional Techniques on Senior Secondary School Students’....
149
situations like writing an essay/letter, answering comprehension and summary questions, or
selecting the best option to given items in English objective tests unveil the knowledge of
words. For instance vocabulary learning is often used with strategies such as words lists or
paired associations in which new words are presented with their translations (Kim and
Gilman, 2008). Games, and interesting stories helped language teachers to achieve this aim
through many years and they still do (Kilickaya, 2011).
In making teaching and learning of vocabulary much more effective and attractive,
teachers must be ready to be abreast with innovations in teaching. Mediated instructional
techniques involve the use of multimedia instruction. It involves multimedia presentations
such as pictures, texts, animation and sounds that are intended to foster learning. It is used
with the aim of promoting learning. The case for mediated instructional learning rests on the
premise that learners can better understand an explanation when it is presented in animation
forms than when it is presented in words alone, (Mayer, 2009).
For hundreds of years, verbal messages such as lectures and printed lessons (i.e.
reading) have been the primary means of explaining ideas to learners. Although, verbal
learning offers a powerful tool for humans, an alternative to purely verbal presentation in
which students learn from words, animation, text and pictures. Recent advances in graphic
technology have prompted new efforts to understand, a potential that is called the promise of
mediated learning (Mayer, 2009).
Mediated instruction could also be seen as the presentation of material using both
words and pictures with the intention of promoting learning. By pictures, it means, the
material is presented in pictures, such as illustrations, graphs, photos, maps or dynamic
graphics such as animation (Baddeley, 1992). In view of the above learning is more
accurately called dual-mode, dual-format, dual-code or dual-channel learning (Mayer, 2009).
The case for mediated instructional technique is based on the idea that instructional
messages should be designed in light of how human mind works. It is assumed that humans
have two information processing systems-one for verbal material and the other for visual
material (Mayer, 2009). When materials are presented only in the verbal, it is believed that
the potential for contribution of capacity to process material in the visual mode is being
ignored.
Furthermore, Mayer (2009) notes that the conception of learning has charged from
being able to remember and repeat to being able to find and use it. Similarly Branford,
Brown and Cocking (1999) note that in the last 30 years, “…views of how effective learning
proceeds have shifted from the benefits of diligent drill-and-practice to focus on students’
understanding and application of knowledge”. In short, the knowledge construction view
offers a more useful conception of learning when the goal is to help people to understand and
to be able to use what they have learned.
Information-delivery view is when different presentation formats-such as words,
pictures and animation are vehicles for presenting the same information. A basic premise of
this view is that information is an objective commodity that can be transported from the
outside world to inside the human mind. This delivery can be made by words or by pictures,
Nigerian Journal of Educational Research and Evaluation
150
but the results in the same-information are stored in a great ware house that we call long-term
memory. The presented words allow the learner to add more information to his or her
memory, so that cause-and-effect chain can be added to memory (Mayer, 2009).
Mayer, Fennel, Farmer and Campbell (2004) have argued that there are two paths for
fostering meaningful learning in mediated learning environments:
a. Designing ways that reduce the learners cognitive load, thus freeing the learner to
engage in active cognitive processing and,
b. Designing mediated messages in ways that increase the learners’ motivational
commitment to active cognitive processing. Although cognitive consideration have
received priority attention in research on mediated learning (Mayer, 2005; Mayer and
Moreno, 2003; Pass, Renki and Sweller, 2003; Sweller, 1999), progress in designing
computer-based learning environment also can be made by attending to social
consideration that affect the learner’s motivation to engage in cognitive processing
(Mayer, 2009).
There are three assumptions underlying cognitive theory of learning. These are dual
channels, limited capacity and active processing.
1. Dual-Channel Assumption is that humans’ posses separate information processing
channels for visually represented materials and auditorially represented material. The
dual-channel assumption is summarized in the table on page (66 project). The top
frame shows the auditory/verbal channel highlighted and the bottom frame shows
visual/pictorial frame highlighted. When information is presented to the eyes (such
as animated), people begin by processing that information in the visual channel.
When information is presented to the ears (such as narration or non-verbal sounds)
people begin processing that information in the auditory channel. The concept of
separate information-processing channels has a long history in cognitive psychology
and currently is most closely associated with Paivio’s dual-coding theory (Clark and
Paivio, 1991; Paivio, 1986-2006) and Baddeley’s model of working memory
(Badedeley; 1992, 1999).
2. Limited-Capacity Assumption: The second assumption is that humans are limited in
the amount of information that can be processed in each channel at one time. When
an animation is presented, the learner is able to hold only a few images in working
memory at any one time, reflecting portions of the presented material rather than an
exact copy of the presented material. When a narration is presented, the learner is
able to hold only a few words in the working memory at any one time, reflecting
parties of the presented text rather than a verbal recording. The conception of limited
capacity in consciousness has a long history in psychology, and some modern
examples are Baddeley’s (1992, 1999) theory of working memory and Sweller’s
(1999, 2005; Chandler and Sweller’s, 1991) cognitive load theory, (Mayer, 2008).
Relative Effects of Mediated Instructional Techniques on Senior Secondary School Students’....
151
3. Active Processing Assumption: The third assumption is that humans are actively
engaged in cognitive processing in order to construct a coherent mental
representation of their experiences. These active cognitive process include paying
attention, organizing incoming information and integrating incoming information
with other knowledge. In short, humans are active processors who seek to make
sense of common view of humans as passive processors who seek to add as much
information as possible to memory. That is, as tape recorders which file copies of
their experiences in memory to be retrieved later (Mayer, 2008).
Gender is a factor that could have effect on students’ achievement in vocabulary because
several theoretical and empirical studies have been conducted on gender issues and mediated
instructional techniques generally. Furthermore, research findings on human brains reveal
that female brains are much stronger in the left hemisphere which rules language (Tunla,
2006). As a result, they do better when they are tested for language ability and speech
articulation than their male counterparts. Adeniyi (2006) observes that some gender
differences in second language learning are socio-culturally bound because it is more
acceptable in some cultures and sub-cultures than in others for men and women to
communicate freely and casually with each other at work and in social situation. She had
earlier argued that syntax develops out of conversation and that conversation provided the
input that learners used for building spelling and syntactic structures in vocabulary.
From the above observations, it is evident that the effect of gender on the
achievement of students in vocabulary plays an important role in the learning of English
vocabulary and in the use of mediated instructional techniques. Therefore, consideration and
equal opportunities should be given to both the male and female groups in the preparation of
mediated software packages (Tunla, 2006).
Students’ performance is a factor that may influence the use of mediated
instructional technique in English language vocabulary. Good (1973) defines performance as
scores obtained by students in an aptitude or achievement test and generally accepted as
official level of attainment of scholarly excellence. Abiri (1988) declares that students’
academic performance have significant relationships with variables like language of
instructions, quality of teachers and instructional techniques.
Olawuyi (2012) opines that many teachers make the subject very dull and boring as a
result of bad approach, method and techniques of teaching. She also posits that students’
negative attitude affects their performance and also of the opinion that students’ poor
performance is connected with social, psychological and health factors. More so, only few
instructional materials are available.
In this study, performance and achievement of the students in the pre-test and post-
test of the English Vocabulary Achievement Test (EVAT) would be seen as capable of
influencing the general achievement of the students.
The poor performance of students in English language in both the internal and
external examinations in Nigerian secondary schools is a major problem that is noticed by the
Nigerian Journal of Educational Research and Evaluation
152
stakeholders in the education sector. This problem is attributed to a lot of things among
which are instructional techniques. Ayodele (1983) and Lawal (1987) observed the following
as contributing factors to the poor performance of students in examinations as inappropriate
method and techniques of teaching, dearth of instructional materials and size of the class
among others. Several research efforts have been conducted on the use of mediated
instructions, such as Fakomogbon (1997), Yusuf (1997), Kinsey (1989) among others.
However, little or nothing has been done in the area of mediated instructional technique for
the teaching of vocabulary in Kwara State, part of the gap of this research is what the present
study intents to fill. Therefore, it is worth investigating the effectiveness of mediated
instructional techniques on students’ achievement in vocabulary in Kwara State, Nigeria.
The purpose of the study is to investigate the relative effects of mediated
instructional technique on secondary school students’ achievement in vocabulary in Kwara
State, Nigeria. It aimed to investigate the relative effects of the students’ general achievement
in vocabulary. Specifically, the study investigated the relative effects of animated
instructional technique on the students’ achievement in the five vocabulary aspects of
pronunciation, spelling, word-formation, grammar and meaning; to investigate the effect of
still-pictures instructional technique on the students’ achievement in the five vocabulary
aspects, to investigate the effect the combination of animation and still-pictures instructional
technique, effect of gender on the students achievement in the five vocabulary aspects and to
investigate the effects of ability levels of students’ achievement in the five vocabulary
aspects.
HO1: There is no significant difference in the achievement of students exposed to
the mediated instructional technique and the Conventional Instructional
Techniques (CIT) in the five vocabulary aspects.
HO2: There is no significant difference in the achievement of students exposed to
the still-picture instructional techniques and the CIT in the five vocabulary
aspects.
HO3: There is no significant difference in achievement of students exposed to
animated instructional technique and the Conventional Instructional
Technique (CIT) in the five vocabulary aspects.
HO4: There is no significant difference in the achievement of students exposed to
the combination of animated and still-pictures instructional techniques and
the CIT in the five vocabulary aspects.
HO5: There is no significant difference in the achievement of male and female
students exposed to the mediated instructional technique and the CIT in the
five vocabulary aspects.
HO6: There is no significant difference in the achievement of high, medium and
low scorers exposed to the mediated instructional technique in the five
vocabulary aspects.
Relative Effects of Mediated Instructional Techniques on Senior Secondary School Students’....
153
Methods
This is a quasi-experimental study with pre-test, post-test, non-randomized and non-
equivalent control group design. The study consisted of 239 students from Senior Secondary
Schools in Ilorin, Nigeria.
The study adopted a factorial design of 4 x 2 x 3 x 5 to test the null hypotheses. An
intact class was used for each of the group, that is the experimental groups and the control
group. There are three experimental groups (i.e. Animated, still-pictures and combination of
still-pictures and animated), and one control group.
This is illustrated in table 2
Table 2: Schematized Factorial Design of 3 x 2 x 3 x 5 S/N Independent Variables Moderator Variables Dependent Variable
1. Animated Instructional
Technique (AIT).
Gender Ability Level
Male/Female High, Medium, Low
Vocabulary Aspect
Pronunciation
2. Still-pictures Instructional
Techniques (SIT).
Male/Female High, Medium, Low Spelling
3. Combination of (SAIT) Male/Female High, Medium, Low Word-Formation
4. Conventional Instructional
Technique (CIT)
Male/Female High, Medium, Low Grammar
Meaning
In carrying out the study, the researcher developed English Vocabulary Achievement Test
(EVAT). The test was adapted from WAEC (SSCE) English language. It was used as pre-test
to find out the ability of the students before exposing them to the mediated instructional
techniques. The test comprises Fifty (50) multiple-choice items. The post-test was
administered on the students after exposing them to the mediated instructional techniques to
know the effects of the instructions on the students’ achievement. All the six (6) research
hypotheses were tested using analysis of co-variance at 0.05 level of significant. For the
reliability of the instrument, it was subjected to a test-re-test technique using Pearson Product
Moment Correlation Co-efficient. It was found to be 0.715 which is found reliable. The test
was validated by English language experts. Their suggestions were taken into consideration
and necessary corrections were made before applying the test. The software programme for
the mediated techniques was designed by animation and graphic expert using FLV (Flash
Video Version). This was validated by education technology experts from the Education
Technology Department, University of Ilorin, Ilorin, Nigeria.
Results
The analysis of the data collected and the results are reported. The first hypothesis was used
to investigate the general achievement of students exposed to the mediated instructional
techniques in each of the five vocabulary aspect. The result is indicated on the table 3
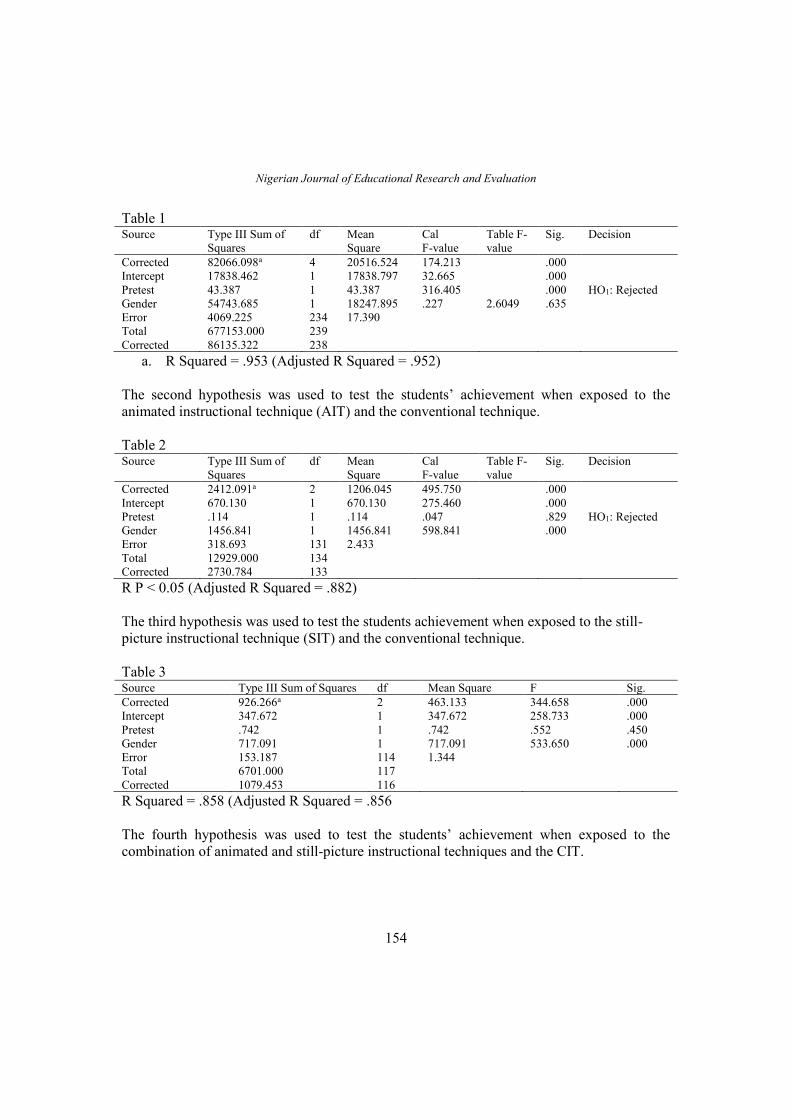
Nigerian Journal of Educational Research and Evaluation
154
Table 1 Source Type III Sum of
Squares
df Mean
Square
Cal
F-value
Table F-
value
Sig. Decision
Corrected
Intercept
Pretest
Gender
Error
Total
Corrected
82066.098a
17838.462
43.387
54743.685
4069.225
677153.000
86135.322
4
1
1
1
234
239
238
20516.524
17838.797
43.387
18247.895
17.390
174.213
32.665
316.405
.227
2.6049
.000
.000
.000
.635
HO1: Rejected
a. R Squared = .953 (Adjusted R Squared = .952)
The second hypothesis was used to test the students’ achievement when exposed to the
animated instructional technique (AIT) and the conventional technique.
Table 2 Source Type III Sum of
Squares
df Mean
Square
Cal
F-value
Table F-
value
Sig. Decision
Corrected
Intercept
Pretest
Gender
Error
Total
Corrected
2412.091a
670.130
.114
1456.841
318.693
12929.000
2730.784
2
1
1
1
131
134
133
1206.045
670.130
.114
1456.841
2.433
495.750
275.460
.047
598.841
.000
.000
.829
.000
HO1: Rejected
R P < 0.05 (Adjusted R Squared = .882)
The third hypothesis was used to test the students achievement when exposed to the still-
picture instructional technique (SIT) and the conventional technique.
Table 3 Source Type III Sum of Squares df Mean Square F Sig.
Corrected
Intercept
Pretest
Gender
Error
Total
Corrected
926.266a
347.672
.742
717.091
153.187
6701.000
1079.453
2
1
1
1
114
117
116
463.133
347.672
.742
717.091
1.344
344.658
258.733
.552
533.650
.000
.000
.450
.000
R Squared = .858 (Adjusted R Squared = .856
The fourth hypothesis was used to test the students’ achievement when exposed to the
combination of animated and still-picture instructional techniques and the CIT.
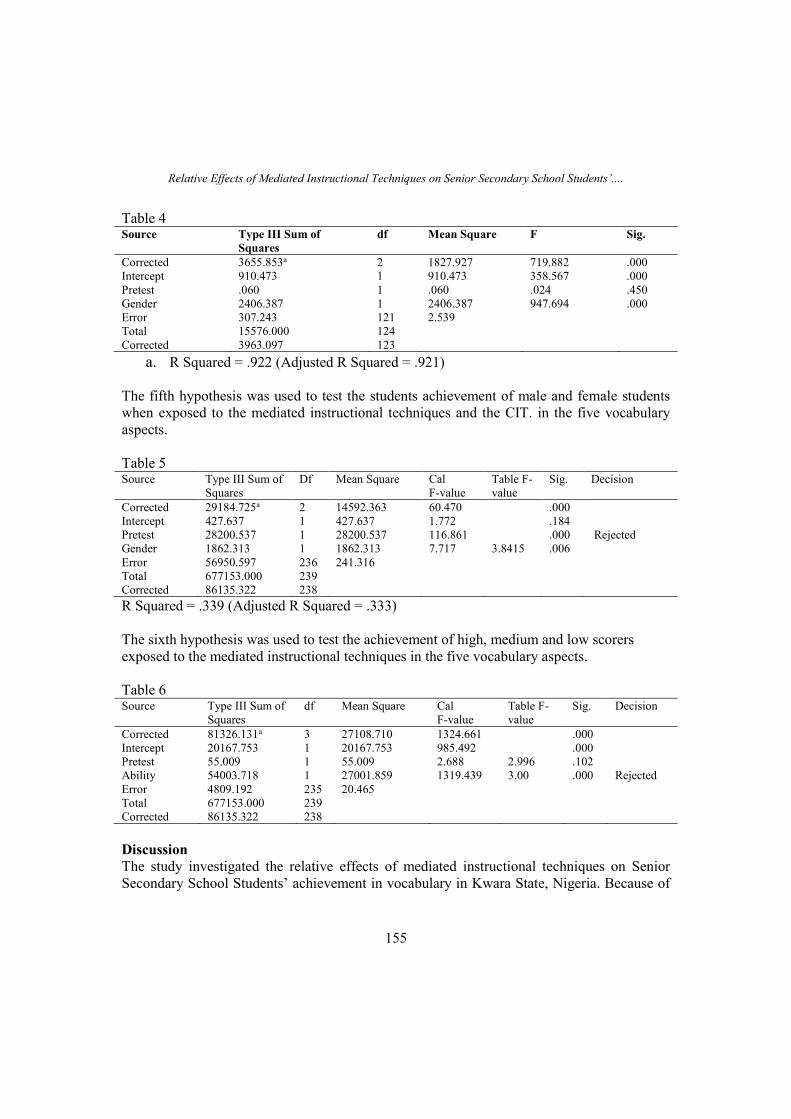
Relative Effects of Mediated Instructional Techniques on Senior Secondary School Students’....
155
Table 4 Source Type III Sum of
Squares
df Mean Square F Sig.
Corrected
Intercept
Pretest
Gender
Error
Total
Corrected
3655.853a
910.473
.060
2406.387
307.243
15576.000
3963.097
2
1
1
1
121
124
123
1827.927
910.473
.060
2406.387
2.539
719.882
358.567
.024
947.694
.000
.000
.450
.000
a. R Squared = .922 (Adjusted R Squared = .921)
The fifth hypothesis was used to test the students achievement of male and female students
when exposed to the mediated instructional techniques and the CIT. in the five vocabulary
aspects.
Table 5 Source Type III Sum of
Squares
Df Mean Square Cal
F-value
Table F-
value
Sig. Decision
Corrected
Intercept
Pretest
Gender
Error
Total
Corrected
29184.725a
427.637
28200.537
1862.313
56950.597
677153.000
86135.322
2
1
1
1
236
239
238
14592.363
427.637
28200.537
1862.313
241.316
60.470
1.772
116.861
7.717
3.8415
.000
.184
.000
.006
Rejected
R Squared = .339 (Adjusted R Squared = .333)
The sixth hypothesis was used to test the achievement of high, medium and low scorers
exposed to the mediated instructional techniques in the five vocabulary aspects.
Table 6 Source Type III Sum of
Squares
df Mean Square Cal
F-value
Table F-
value
Sig. Decision
Corrected
Intercept
Pretest
Ability
Error
Total
Corrected
81326.131a
20167.753
55.009
54003.718
4809.192
677153.000
86135.322
3
1
1
1
235
239
238
27108.710
20167.753
55.009
27001.859
20.465
1324.661
985.492
2.688
1319.439
2.996
3.00
.000
.000
.102
.000
Rejected
Discussion
The study investigated the relative effects of mediated instructional techniques on Senior
Secondary School Students’ achievement in vocabulary in Kwara State, Nigeria. Because of
Nigerian Journal of Educational Research and Evaluation
156
the difficult, involved in the learning of the second language (English language), most
students find it rather tasking to acquire the proficiency needed in English language.
Two hundred and thirty-nine (239) students, made up of four groups (i.e. AIT, SIT,
SAIT and CIT) were engaged for the study. Hypothesis one was used to investigate the
difference in the general achievement of the students exposed to the mediated instructional
techniques and the CIT in each of the five vocabulary aspects. The data were subjected to
analysis at co-variance (ANCOVA) at 0.05 level of significance and the hypothesis was
rejected. This is in support at Mayer (2009), that the case for mediated instructional learning
rests in the premise that learners understand an explanation when it is presented in words and
pictures better than when it is presented in words alone.
Hypothesis two was used to investigate students’ achievement when exposed the
still-picture instructional technique and CIT in the five vocabulary aspects. The data were
subjected to analysis of co-variance (ANCOVA) at 0.05 level of significance, the hypothesis
was rejected.
The finding is in support of Norman (1993) that technology can make us smart. He
refers to tools that aid the mind as cognitive artifacts: “anything invented by human for the
purpose of improving the thought or actions as artifacts” (p.15).
The third hypothesis was used to investigate the students’ achievement in animated
instructional techniques and CIT in the five vocabulary aspects. The data collected were
subjected to analysis of co-variance (ANCOVA) at 0.05 level of significance. The finding is
in support of Oberg (2011) that keyword method has been referenced as an effective tool in
learning vocabulary because it involves deep mental processing. Also Zuiker (2012)
concludes that innovative method that linguzz employ is the combining definitions with
visuals and real-world examples to reinforce the new words the students have just learned.
The fourth hypothesis was used to investigate the students’ achievement in the
combination of still-picture and animated instructional techniques and CIT in the five
vocabulary aspects. The data collected were subjected to analysis of co-variance (ANCOVA)
at 0.05 level of significance and the hypothesis was rejected. The finding is in support of
Mayer, Fennel, Farmer and Campbell (2004) that there are two paths for fostering
meaningful learning in mediated learning environment: first by designing ways that reduce
learners’ cognitive load and secondly by designing mediated messages in ways that increases
the learners’ motivational commitment to active cognitive processing.
Hypothesis five and six were used to investigate the achievements of male and
female students and achievement of high, medium and low scorers exposed to the mediated
instructional techniques and CIT in the five vocabulary aspects. The data collected were
subjected to analysis at co-variance (ANCOVA) at 0.05 level of significance and the
hypotheses were rejected. The findings are in support of Adeniyi (2006) that some gender
differences in second language learning are socio-culturally bound. The finding negates the
study of Tunla (2006) that research finding on human brain reveals that female brains are
much stronger in the left hemisphere which rules language, as a result, they perform better
when they are tested for language ability and speech articulation than their male counterparts.
Relative Effects of Mediated Instructional Techniques on Senior Secondary School Students’....
157
On the ability levels, the finding indicated that the high ability level students achieved better
than other levels. This is in support of Abiri (1988) that students’ academic performance has
significant relationships with variables like language of instructions, quality of teachers and
the instructional techniques.
Conclusions and Recommendations
Findings from this study revealed the importance of mediated instructional techniques to the
teaching and learning of English vocabulary to the Secondary Schools Students (SSS1) as
indicated by Mayer (2009), that humans possess separate information processing channels for
visually represented material. Also, he asserts that when information is presented to the eyes
(such as animated and still-picture) students begin by processing that information in the
visual channel. When information is presented to the ears, students begin processing that
information in the auditory channel (Mayer, 2009).
The finding is also in support of Jocklova (2009) that “it counts as general
methodological knowledge that in learning languages, students should perceive the input
through as many channels as possible. Therefore, it is important to include a variety of
stimuli in teaching”.
The finding is also in support of Baddeleys (1992, 1999) theory of working memory and
Sweller’s (1999, 2005) cognitive load theory which says when a narration is presented, the
learner is able to hold only few words in the working memory at any one time rather than a
verbation recording.
In view of these the study recommended that English language teacher should
include mediated instructional techniques alongside conventional instructional technique in
the teaching of vocabulary in specific, and English language and other subjects in general.
Computer literacy programmes should be made compulsory for all teachers and education
managers. Computer software and hardware must be made available and at affordable prices
in schools. Teacher trainers, curriculum developers and publishers should also be duely
informed on the issue of computer and language teaching. Also, there should be constant
electricity supply in order to give room for the use of computer hardware.
The Universities and Colleges of Education that are in charge of teacher training
might need to modify their teacher training programme to re-orientate trainee teachers.
Software packages for the teaching of vocabulary and other aspects of English language are
very paramount. Above all, it is recommended that such software packages should be
learner-centred and friendly. This will help to guide, sensitize, arouse and sustain the interest
of the students during the course of learning.
Visual are highly effective in the transfer of knowledge. A 1982 study by Levies and
Lentz, comparing a text only learning environment to a text and illustrated one, found that
approximately 87% preferred text and visuals over just text alone (Zuiker, 2012). One recent
article on the subject describes the evidently limit less capacity of long-term memory to store
concepts, and then point to studies that seem to indicate that visuals have a direct route to
Nigerian Journal of Educational Research and Evaluation
158
long-time memory, each image storing its own information as a coherent ‘chunk’ or concept
(Zuiker, 2012).
References
Abiri, J. (1988). Relationship between Teachers’ Qualification, experience and students’
performance in selected subjects, (an Unpublished M.Ed. Thesis). University of
Ilorin, Ilorin.
Adeniyi, F. O. (2006a). Comparative Effects of Multisensory and Meta cognitive
Instructional Approaches on English Vocabulary Achievement of the under-
Achieving Nigerian Secondary School Students. An Unpublished Ph.D. Thesis,
University of Ilorin, Ilorin, Nigeria.
Adeniyi, F. O. (2006a). Comparative Effects of Multisensory and Meta cognitive
Instructional Approaches on English Vocabulary Achievement of the under-
Achieving Nigerian Secondary School Students. An Unpublished Ph.D. Thesis,
University of Ilorin, Ilorin, Nigeria.
Adeniyi, F.O. (2006b). The English Structure and Teaching Methodologies: Ilorin, Haytee
Press.
Adeniyi, F.O. (2006b). The English Structure and Teaching Methodologies: Ilorin, Haytee
Press.
Ayodele, S.A. (1983.). Teaching Structure in Situations. Journal of English Language
Teaching in Nigeria.
Baddeley, A.D. (1992). Working Memory. Science. 255, 556-559.
Baddeley, A.D. (1992). Working Memory. Science. 255, 556-559.
Baddeley, A.D. (1999). Human Memory. Boston: Allyn & Bacch.
Branfords, J.D., Brown, A.L., & Cocking, R.R., (Eds.). (1999). How people learn.
Washington: D.C National Academic Press.
Chandler, P., & Sweller, J. (1991). Cognitive loads theory and the forest of instruction.
Cognition and instruction, 8, 293 – 332
Clark, J.M. & Paivio ,A. (1991). Dual Coding theory and educational psychology. Review 3,
149-210.
Good, C.V. (1973). Dictionary of Education New York: McGrew Hill Book Company. 3rd
Ed.
Joklova, K. (2009). Using pictures in teaching vocabulary: Bacholars
thesis.http://is.muni.Cz/th/123676edf_b/bachelor_Thesis_using_pictures_in_teaching
_vocabulary.pdf.Retrieved from Informachi System Masarykovy University. Jan.
2013
Kim, D., & Gilman, D.A (2008).Effects of text, audio, and graphic aids in mediated
instruction for vocabulary learning. Education technology & Society, 11 (3), 114-
126.
Relative Effects of Mediated Instructional Techniques on Senior Secondary School Students’....
159
Lawal, R.A. (1987).An analytical study of the reading habits of same secondary students in
Oyo Town, Literacy and Reading in Nigeria.
Mayer, R.E. (2005a). Principles of mediated learning based and social cues; personalization,
voice and image principles. In R.E. Meyer (Ed).The Cambridge hand books of
mediated learning (pp. 201-212). New York: Cambridge university press.
Mayer, R.E. (2008) Applying the science of learning: Evidence-based principles of mediated
instruction. America Psychology 63, (8) 760 769.
Mayer, R.E. (2009). Mediated learning. Cambridge: University Press.
Mayer, R.E. Fennoll, S., Farmer, L., & Campell, J.(2004). Personalization effect in mediated
learning student learn well when wards are in conversational stile rather than formal
styled. Formal educational psychology, 96, 386 – 395.
Mayer. R.E. & Moreno, R. (2002). Nine ways to reduce cognitive loads in mediated learning.
Educational psychologist, 38, 43 – 52.
Olawuyi, D.F. (2013). Effects of crossword puzzle game on secondary school students
performance in English language vocabulary in Omu-Aran, Kwara State. (An
Unpublished M.Ed. Thesis) University of Ilorin, Ilorin.
Silverman, R. (2009). The Effects of mediated – Enhanced instruction on the vocabulary of
English-language learners and non-English language Learners in pre-kindergarten
through second grade. Journal of Educational Psychology 2009, Vol. 101, No 2,
305-314.
Tunla, M. (2006).Girls and Boys like read and write different texts. Scandinavian Journal of
Education Research 50 No. 2
Wilkins, D.A. (1972). Linguistics and language teaching. London: Edward Arnold
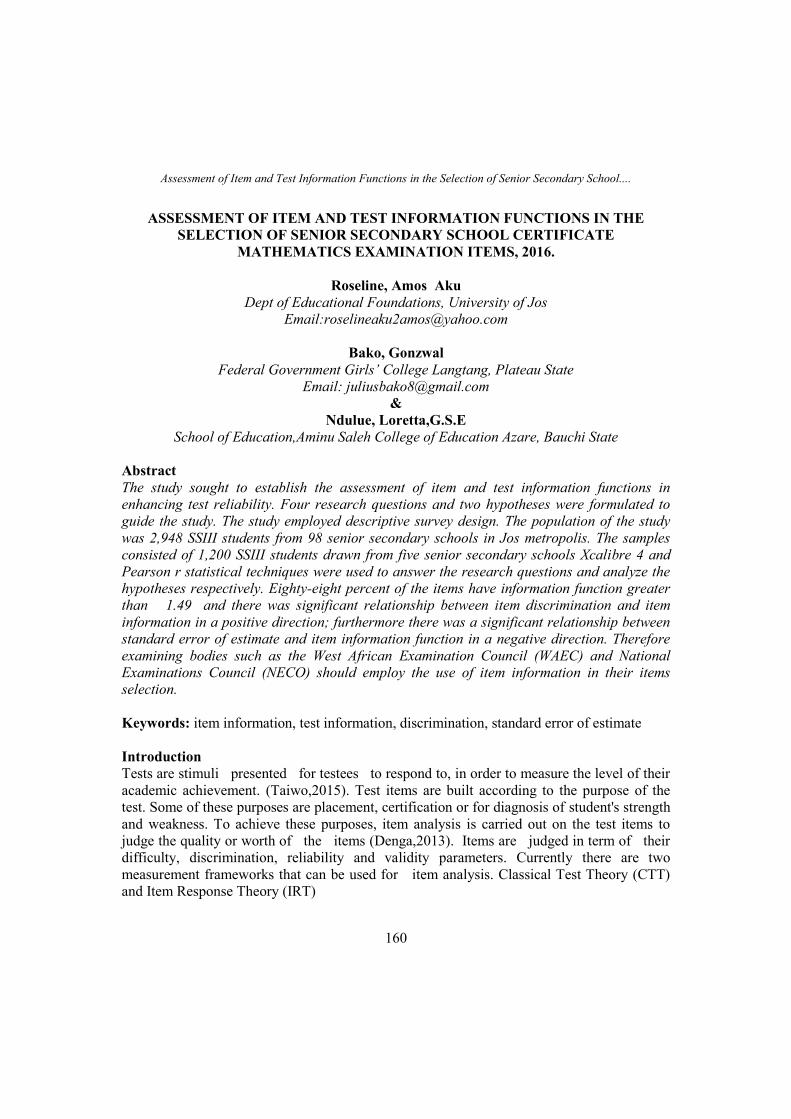
Assessment of Item and Test Information Functions in the Selection of Senior Secondary School....
160
ASSESSMENT OF ITEM AND TEST INFORMATION FUNCTIONS IN THE
SELECTION OF SENIOR SECONDARY SCHOOL CERTIFICATE
MATHEMATICS EXAMINATION ITEMS, 2016.
Roseline, Amos Aku
Dept of Educational Foundations, University of Jos
Email:[email protected]
Bako, Gonzwal
Federal Government Girls’ College Langtang, Plateau State
Email: [email protected]
&
Ndulue, Loretta,G.S.E
School of Education,Aminu Saleh College of Education Azare, Bauchi State
Abstract
The study sought to establish the assessment of item and test information functions in
enhancing test reliability. Four research questions and two hypotheses were formulated to
guide the study. The study employed descriptive survey design. The population of the study
was 2,948 SSIII students from 98 senior secondary schools in Jos metropolis. The samples
consisted of 1,200 SSIII students drawn from five senior secondary schools Xcalibre 4 and
Pearson r statistical techniques were used to answer the research questions and analyze the
hypotheses respectively. Eighty-eight percent of the items have information function greater
than 1.49 and there was significant relationship between item discrimination and item
information in a positive direction; furthermore there was a significant relationship between
standard error of estimate and item information function in a negative direction. Therefore
examining bodies such as the West African Examination Council (WAEC) and National
Examinations Council (NECO) should employ the use of item information in their items
selection.
Keywords: item information, test information, discrimination, standard error of estimate
Introduction
Tests are stimuli presented for testees to respond to, in order to measure the level of their
academic achievement. (Taiwo,2015). Test items are built according to the purpose of the
test. Some of these purposes are placement, certification or for diagnosis of student's strength
and weakness. To achieve these purposes, item analysis is carried out on the test items to
judge the quality or worth of the items (Denga,2013). Items are judged in term of their
difficulty, discrimination, reliability and validity parameters. Currently there are two
measurement frameworks that can be used for item analysis. Classical Test Theory (CTT)
and Item Response Theory (IRT)
Nigerian Journal of Educational Research and Evaluation
161
Classical Test Theory expresses examinee observed test score (X) in terms of true score
(T) and error score (E) (X= T+E). CTT views item difficulty as the proportion of examinees
who answer an item correctly which is also referred to as the item P- value; it ranges from 0
to 1. Item with P- value of 1 indicates that the item is easy, that is, every examinee got the
item correctly. While item discrimination is the difference between the percentage of high
performers and low performers. It determines how efficient an item is discriminating
between those who know the correct answer to the item and those who do not know it. The
indices of item discrimination range from -1 to 1 (Chong,2016).
Reliability is the consistency of the test in measuring what it purports to measure.
Methods of estimating reliability are: test- retest, split- halve, equivalence andCronbach
Alpha. Parallel form of reliability is used to ascertain the equivalence of a parallel test, while
test re-test is used to measure the stability of tests.Reliability coefficient represents the
whole test, that is, all items have the same reliability, irrespective of the contribution of each
item to the test. Hence items selection depends on the whole testand consequently high
standard error of estimate, which is the imprecision in theitem parameterestimation (Taiwo,
2015). Additionally, validity describes the degree to which a test measures what it purports
to measure, in other words, the test is only valid to the extent to which it measures those
things it sets out to measure.
Examinee’s score using CTT depends on a particular test that is, easy items produce
high scores while item that are difficult will produce low score, while the characteristics of
the items depend on group of examinees, that is, higher item parameters for high ability
students and low items parameters for low ability examinees resulting to inconsistencies in
item parameters hence poor reliability (Obinne (2011),Ojerinde (2013), &Adegoke (2013).To
overcome this shortcoming, psychometricians recommended the use of alternative
measurement framework known as Item Response Theory (IRT).
Item Response Theory assumes that for an examinee to response correctly to an
item he/she must possess some amount of ability known as theta (θ) which is not directly
observable. The relationship between an examinee and the probability of answering an item
correctly is specified by a monotonically increasing function known as Item Characteristics
Curve (ICC).
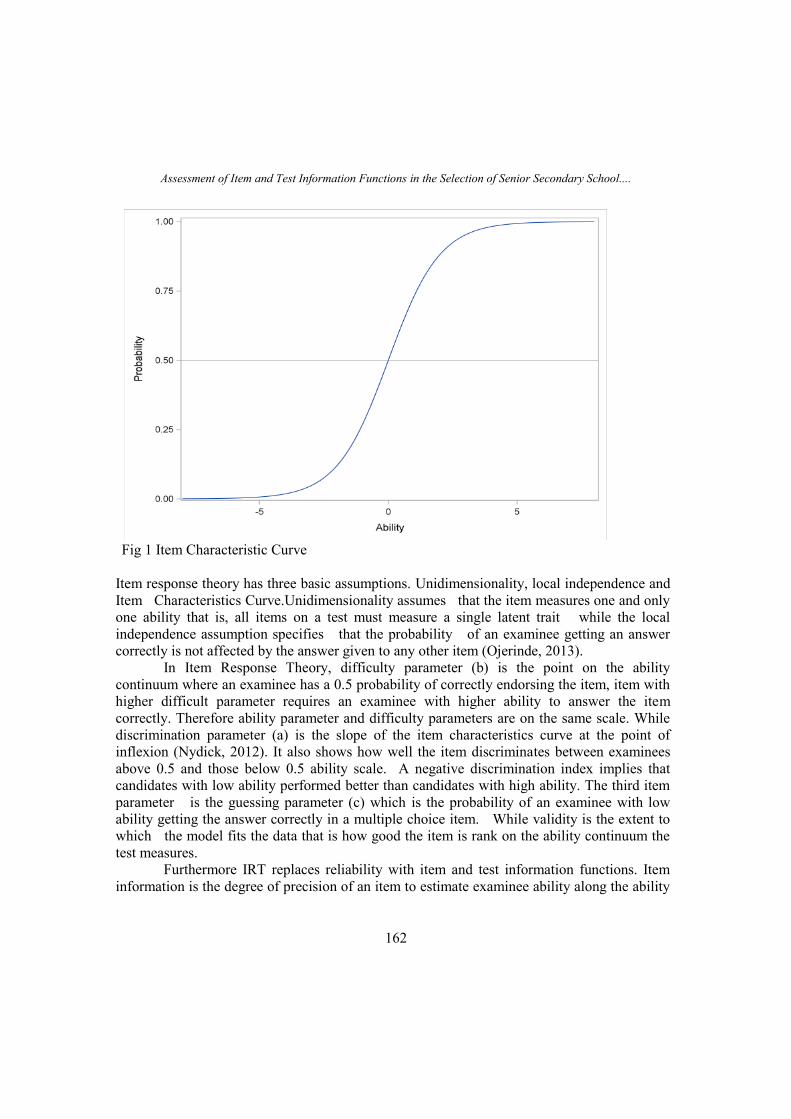
Assessment of Item and Test Information Functions in the Selection of Senior Secondary School....
162
Fig 1 Item Characteristic Curve
Item response theory has three basic assumptions. Unidimensionality, local independence and
Item Characteristics Curve.Unidimensionality assumes that the item measures one and only
one ability that is, all items on a test must measure a single latent trait while the local
independence assumption specifies that the probability of an examinee getting an answer
correctly is not affected by the answer given to any other item (Ojerinde, 2013).
In Item Response Theory, difficulty parameter (b) is the point on the ability
continuum where an examinee has a 0.5 probability of correctly endorsing the item, item with
higher difficult parameter requires an examinee with higher ability to answer the item
correctly. Therefore ability parameter and difficulty parameters are on the same scale. While
discrimination parameter (a) is the slope of the item characteristics curve at the point of
inflexion (Nydick, 2012). It also shows how well the item discriminates between examinees
above 0.5 and those below 0.5 ability scale. A negative discrimination index implies that
candidates with low ability performed better than candidates with high ability. The third item
parameter is the guessing parameter (c) which is the probability of an examinee with low
ability getting the answer correctly in a multiple choice item. While validity is the extent to
which the model fits the data that is how good the item is rank on the ability continuum the
test measures.
Furthermore IRT replaces reliability with item and test information functions. Item
information is the degree of precision of an item to estimate examinee ability along the ability
Nigerian Journal of Educational Research and Evaluation
163
continuum while test information is the summation of all the items information function
(Mamum, 2013). Test information largely depends on item parameters, the higher the item
parameter the more information provided by the test. Hence there is the need for test
developers to use item and test information functions in order to assess items that are reliable.
The formula for item information for three parameter model is given as
𝐼 (𝜃) = a2[𝑄1 (𝜃)
𝑃1 (𝜃)] [
𝑃1(𝜃)− 𝐶2
1− 𝐶2 ] Equation 1 (Mamun, 2013)
Where a = discrimination parameter
c = guessing parameter
P (θ) = probability of answering the item correctly
θ= ability level (theta)
Maximum information is provided at an ability level slightly higher than its b parameter.
Formula for test information is
T(θ) = ⅀I(θ) Equation 2.
Where I(θ) is as earlier defined
Consequently item with higher discrimination parameter contribute more information which
peaks at the maximum value of the item information curve (Daiban, 2009). While item with
low discrimination parameter has a flatter curve, indicating less information within a wider
range of ability, item with higher guessing parameter provides less information. Ronald and
Russel (2010) recommended that item with high discriminations but moderate difficulty and
lower guessing parameters are better at assessing test items.
The amount of information provides by the item is inversely related to standard error
of estimate. Obinne (2011) added that the higher the item discrimination the greater the
information provided by the item at a given level of theta and inversely the smaller the
standard error of estimate. In addition a smaller standard of error of estimate is associated
with items with b value close to examinee’s ability. Item and test information values from 1.5
to 3.5 is moderate while values from 0.0 to 1.49 is regarded as poor (Zieba,2013).
In spite of the benefits provided by item and test information functions, findings by
Adegoke (2013) and Taiwo (2015) revealed that examination bodies in Nigeria are yet to
employ itin assessing and selection of quality items. Therefore the purpose of this study is
to apply item and test information function in assessing test items in order to improve
reliability and precision of test items in the selection of appropriate items to enhance
students’ performance, grading and certification in mathematics.
Consequently, the following research questions are raised to guide the study
1. How many items of SSCE WAEC 2016 Mathematics possess maximum item
information?
2. What is the mean of item information of SSCE WAEC 2016 Mathematics?
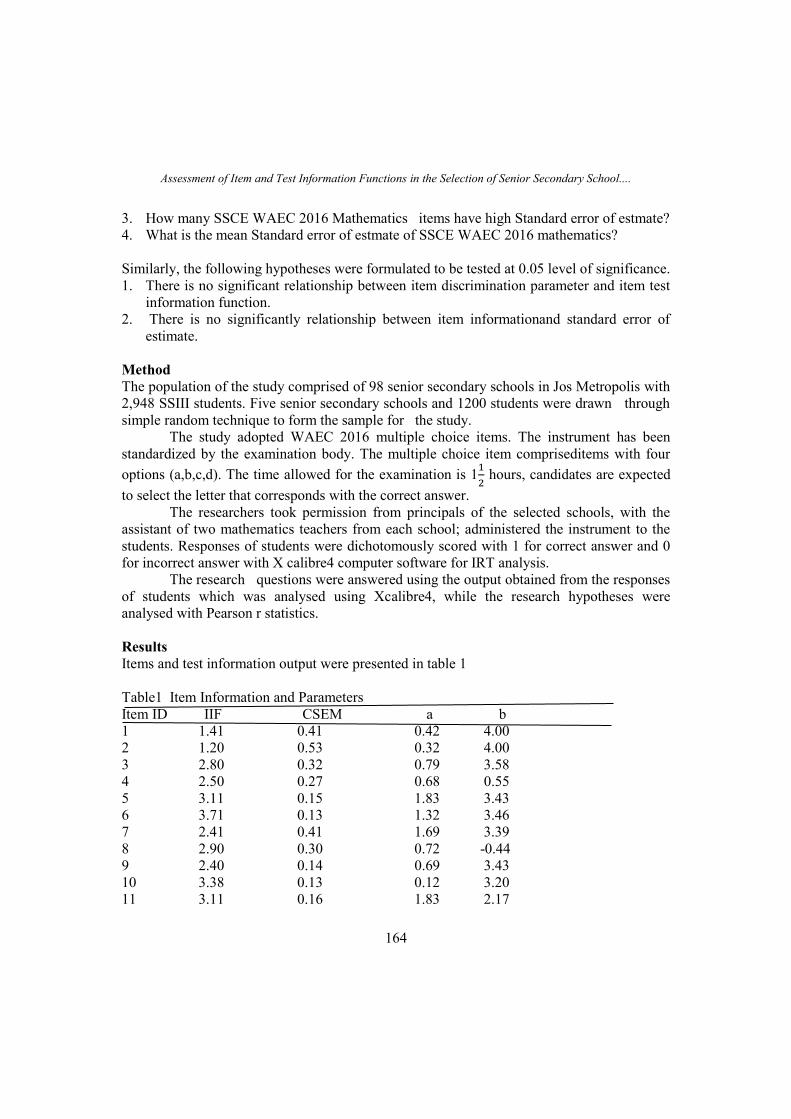
Assessment of Item and Test Information Functions in the Selection of Senior Secondary School....
164
3. How many SSCE WAEC 2016 Mathematics items have high Standard error of estmate?
4. What is the mean Standard error of estmate of SSCE WAEC 2016 mathematics?
Similarly, the following hypotheses were formulated to be tested at 0.05 level of significance.
1. There is no significant relationship between item discrimination parameter and item test
information function.
2. There is no significantly relationship between item informationand standard error of
estimate.
Method
The population of the study comprised of 98 senior secondary schools in Jos Metropolis with
2,948 SSIII students. Five senior secondary schools and 1200 students were drawn through
simple random technique to form the sample for the study.
The study adopted WAEC 2016 multiple choice items. The instrument has been
standardized by the examination body. The multiple choice item compriseditems with four
options (a,b,c,d). The time allowed for the examination is 11
2 hours, candidates are expected
to select the letter that corresponds with the correct answer.
The researchers took permission from principals of the selected schools, with the
assistant of two mathematics teachers from each school; administered the instrument to the
students. Responses of students were dichotomously scored with 1 for correct answer and 0
for incorrect answer with X calibre4 computer software for IRT analysis.
The research questions were answered using the output obtained from the responses
of students which was analysed using Xcalibre4, while the research hypotheses were
analysed with Pearson r statistics.
Results
Items and test information output were presented in table 1
Table1 Item Information and Parameters
Item ID IIF CSEM a b
1 1.41 0.41 0.42 4.00
2 1.20 0.53 0.32 4.00
3 2.80 0.32 0.79 3.58
4 2.50 0.27 0.68 0.55
5 3.11 0.15 1.83 3.43
6 3.71 0.13 1.32 3.46
7 2.41 0.41 1.69 3.39
8 2.90 0.30 0.72 -0.44
9 2.40 0.14 0.69 3.43
10 3.38 0.13 0.12 3.20
11 3.11 0.16 1.83 2.17
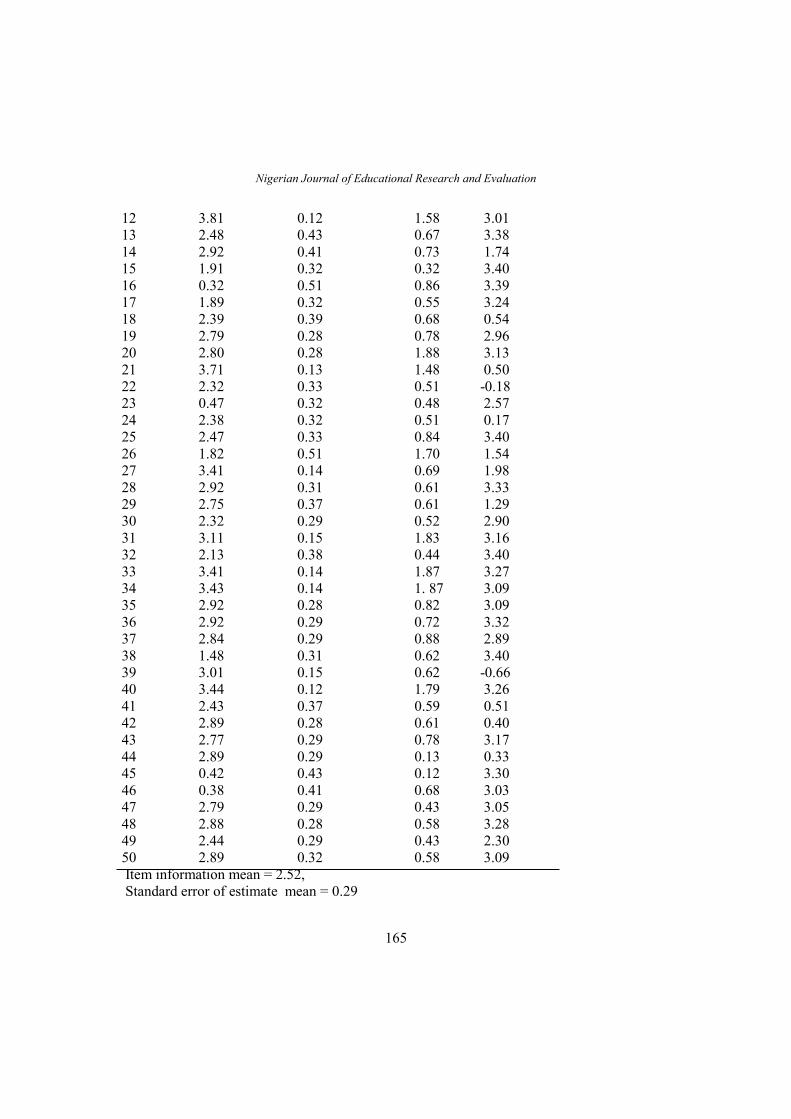
Nigerian Journal of Educational Research and Evaluation
165
12 3.81 0.12 1.58 3.01
13 2.48 0.43 0.67 3.38
14 2.92 0.41 0.73 1.74
15 1.91 0.32 0.32 3.40
16 0.32 0.51 0.86 3.39
17 1.89 0.32 0.55 3.24
18 2.39 0.39 0.68 0.54
19 2.79 0.28 0.78 2.96
20 2.80 0.28 1.88 3.13
21 3.71 0.13 1.48 0.50
22 2.32 0.33 0.51 -0.18
23 0.47 0.32 0.48 2.57
24 2.38 0.32 0.51 0.17
25 2.47 0.33 0.84 3.40
26 1.82 0.51 1.70 1.54
27 3.41 0.14 0.69 1.98
28 2.92 0.31 0.61 3.33
29 2.75 0.37 0.61 1.29
30 2.32 0.29 0.52 2.90
31 3.11 0.15 1.83 3.16
32 2.13 0.38 0.44 3.40
33 3.41 0.14 1.87 3.27
34 3.43 0.14 1. 87 3.09
35 2.92 0.28 0.82 3.09
36 2.92 0.29 0.72 3.32
37 2.84 0.29 0.88 2.89
38 1.48 0.31 0.62 3.40
39 3.01 0.15 0.62 -0.66
40 3.44 0.12 1.79 3.26
41 2.43 0.37 0.59 0.51
42 2.89 0.28 0.61 0.40
43 2.77 0.29 0.78 3.17
44 2.89 0.29 0.13 0.33
45 0.42 0.43 0.12 3.30
46 0.38 0.41 0.68 3.03
47 2.79 0.29 0.43 3.05
48 2.88 0.28 0.58 3.28
49 2.44 0.29 0.43 2.30
50 2.89 0.32 0.58 3.09
Item information mean = 2.52,
Standard error of estimate mean = 0.29
Assessment of Item and Test Information Functions in the Selection of Senior Secondary School....
166
Research questions 1 and 3
Research question1 sought to know number of items that have high information, while
research question 3 sought to know the number of items that have high standard error of
estmate. 6 items have low information values between 0.0 and 1.49, these items are
1,2,16,38,45 and 46 representing 12% of the items. While 44 (88%) items have item
information function from moderate to high items, these are items
3,4,5,6,7,8,9,10,11,12,13,14,15,17,18,19,20,21,22,23,24,25,26,27,28,29,30,31,32,33,34,35,36
,37,39,41,42,43,44,47,48,49,50.
In the same vein, 6 (12%) items have high standard error of estmate, they are
items1,2,16,38,45 and 46 . While 44 (88%) items have low standard error of estmate. These
are items
3,4,5,6,7,8,9,10,11,12,13,14,15,17,18,19,20,21,22,23,24,25,26,27,28,29,30,31,32,33,34,35,36
,37,39,41,42,43,44,47,48,49,50.
Similarly 7 items have poor discrimination parameters (0.0 - 0.49), these are items
1,2,24,32,44,45 and 49 representing 14% of the items. 43 (86%) items have moderate
discrimination parameters between (0.50 - 1.89). These are items
3,4,5,6,7,8,9,10,11,12,13,14,15,17,18,19,20,21,22,23,24,25,26,27,28,29,30,31,32,33,34,35,36
,37,39,41,42,43,44,47,48 and 50.
Research questions 2 and 4
Research question 2 sought to know the mean of item information while research question 4
sought to know the mean of the standard error of estimate.From table 1 the mean of the
item information was 2.52 while the mean of the standard error of estimate was 0.29.
Hypothesis One
The Pearson r statistics indicated that there is a strong, positive correlation between the item
information and item discrimination parameter, r(48) =0.89 and p<0.5.indicating that there
was a significant relationship between item information and discrimination parameter.
Hypothesis 2
The valueof Pearson r indicated a negative correlation between the item information and
standard errors of estimate,r (48)= -0.89 and p<0.05. Showing that there was a strong
correlation between item information ad standard error of estimate but in a negative
direction.
Discussion
The purpose of the study was to apply item and test information in assessing the quality of
items for SSCE WAEC mathematics 2016 items. The results of the finding showed that
Nigerian Journal of Educational Research and Evaluation
167
SSCE WAEC 2016 have their item information ranging from 0.32 to 3.44 with amean of
2.52 indicating that 88% of the items possessed high information. The standard error of
estimate ranged from 0.12 to 0.53 with an average of 0.29 indicating that 88% had low
standard error of estmate while difficulty parameter ranged from 0.12 to 1.87.
This showed that the higher the item information the lower the standard error of
estimate,
This is in agreement with earlier findings by Obinne (2011) and Adegoke (2014).
The results of the Pearson r correlation indicated that there was a significant relationship
between item information and item discrimination parameter in a positive direction with
r(48)= 0.89, p<0.05, in the same vein there was a significance relationship between item
information and standard error of estimate but in a negative direction, r(48) = -0.89 and
p<0.05 indicating that item with higher information gives low standard error of estimate,
this is consistent with earlier finding by Moghadamzadeh (2011).Henceitems with low item
information function will be identify and reconstructed. While items with high information
function will help to guide the teachers in item selection for assessing students.
Conclusion
The study sought to apply item and test information in the assessment of items in order to
improve test reliability and by implication students’ performance in mathematics. The major
findings are that item with high information produce low standard error of estmate while
items with high discriminating parameter yield higher items information which in turn
produce item with high reliability. The implication is that examination bodies in Nigeria in
particular and Africa in general should employ item and test information in their item
selection to minimize errors associated with estimation of examinees’ ability, this will
eliminate wrong classification and certification of candidates. Furthermore teachers should
be encouraged through training and retraining to imbibe the practice of constructing items
with high information functions.
Referrences
Amasingha,K.J.,&Ibebietei, O.T. (2014). Item Response Theory : The way forward to
objectivity in Educational Measurement in the school system. WillberforceIsland:
Niger Delta university
Adegoke, B.A. (2014). The role of item analysis in detecting all improving faculty
Physicsobjective test item.Journal of Educational Practice,5(4), 125-130.
Chong,H.Y.(2016). A Simple Guide to Item Response Theory(IRT) and Rasch
Modeling.Retrieved from http//www.ceative_wisdom.com
Daiban, S.A. (2009). The examinationof the psychometric quality of the common educational
proficiency assessment English test,(PhD thesis). Middle Tennesse State University.
Assessment of Item and Test Information Functions in the Selection of Senior Secondary School....
168
Mamun, A.N.Q. (2013).A comparative study of classical test theory and item response
theory, in relation to various approaches of evaluating the validity and reliability of
research tools. Journal of Research Report,10(4),342-351.
Moghadamzadeh, A. (2011). A comparison the information functions of the item and test in
one, two and three parametric model or item response theory (IRT). Journal of
Social and Behavioural Sciences,29(11), 112-120.
Nydick,S.W. (2012). IRT parameter estimation: Marginal Maximum Likelihood in IRT.
Journal of Psychology of Education,7(3),68-90.
Obinne, A.D.E. (2011). A psychometric analysis of two major examinations in Nigeria:
Standard error of measurement. International Journal or Education Science, 3(2),
88-120.
Taiwo, A.R. (2015). Introduction or item response theory (IRT) models in the development
and validation of College mathematics in attaining quality education for national
values. International Journalof Research, 2(4).Available online.
http//international.journalofresearch.org.
Violence Against Children in Northern Nigeria: An Appraisal
169
VIOLENCE AGAINST CHILDREN IN NORTHERN NIGERIA:
AN APPRAISAL
Ahmed Tanimu Mahmoud,
Department of Social Sciences, Nahda University, Khartoum-Sudan
[email protected]: +249997585970
Hassan Bukar Adam
Department of Psychology, Federal College of Education, Kano
[email protected]:+234 806 264 9386
&
Suleiman Mohammed Saye
Dean of Social and Management Science, Nigeria Police Academy, Wudil, Kano
+2348029720506: [email protected]
Abstract
This paper is an attempt to look at the roles of violence against children in school
environments of Nigeria. In doing this, the paper gives a brief insight into the concepts of
violence against children in Nigeria. The paper highlights issues in violence against children
in school environments, causal factors, effects and damages of violence in school. Lastly the
paper offers some recommendations towards getting the National Assembly to legislate the
creation of special bills for the protections of children in school environments.
Keywords: Children, Environment, School, Violence
Introduction
Education is the backbone of country's progress and perhaps a means to human
empowerment and national progress. It is a powerful tool for socio-economic transformation
and social thinking. The school environment enables the children to be self-reliant and
efficient by developing a new idea for the development of the society. The school
environment must be of quality in order to train pupils or students who would be self-reliant
and dependent thinkers (Alabi and Okemakinde, 2010).The children should be taught some
hand crafts or some manual skills by which they may be supported but manual labour should
also be incorporated to assist everyone learn to use their hands and be self sufficient (Alabi
and Okemankinde, 2010).
Conceptual Framework
Meaning of Violence
The definition for violence against children includes the physical, emotional mistreatment,
sexual abuse, neglect and negligent treatment of children as well as exploitation (sexual
Nigerian Journal of Educational Research and Evaluation
170
exploitation and child labour). It is a complex issue that occurs in many different settings.
The factors surrounding child violence, abuse and neglect as well as effective prevention and
response strategies differ according to the child age, the setting and the relationships between
the child victim and the perpetrator (WHO & ICOMP, 2006).
Meaning of School
School can be defined as an institution for educating children or any institution at which
instruction is given in a particular discipline.
A school is an institution designed to provide learning spaces and learning environments for
the teaching of students (or "pupils") under the direction of teachers (Wikipedia, 2017).
Issues in Violence against Children: The School Environment
Considering the strategic importance of education to the society, Nigerian educational system
is not expected to be in shambles. But it has been argued that, the standard of Nigerian
educational system is either falling or has fallen (Suleiman, 2003). People in the academic,
employers of labour, business and others have joined in the argument on the unsatisfactory
standard of the Nigerian educational system (Aver, 2013). This is reflected more specifically
in the areas of structure, curriculum content and context as well as the methods of imparting
knowledge by the teachers in Nigerian schools (Orban, 2014). These challenges are pervasive
syndrome in the country’s educational settings. As such erosion of values and norms, lack of
good governance, bad and inconsistent policy implementation as well as overdue emphasis
on certification. Boko Haram insurgency has made the Nigerian educational system lost its
glory (Orban, 2014).
On the 29th September, 2013 Boko Haram stormed students dormitories at a College
of Agriculture in the town of Gaijb, in the northern Yobe state opening fire on sleeping
students and killing 40 (Abubakar, 2013). Book Haram has destroyed 209 schools in Yobe.
In Borno state, Governor Kashim Shetima confessed that in August 2013 alone, the Islamist
rebels had destroyed 825 classrooms (Abubakar, 2013). In May 2013, about 15,000 children
were out of school in Borno state (Abubakar, 2013).
In a report, Amnesty International said that at least 70 teachers and more than 100
school children and students have been killed or wounded. “The attacks have generally
crippled the educational environments in some parts of Nigeria. There is a lot of fear among
pupils, teachers and parents. Teachers are not only targeted in schools, but also at home.
Parents are afraid to send their children to school because they fear that their children may
not return home alive and so on. On the 14th day of April 2014, Boko Haram abducted about
276 girls of Government Secondary School, Chibok who were to take their WAEC
Examination (Soriwei, 2014). UNICEF Representative in Nigeria Jean Gough observed
during the “Day of African Child” that due to security challenges numerous children
currently have no access to schools in parts of the North and particularly the North East
(Alokor, 2014).
Violence Against Children in Northern Nigeria: An Appraisal
171
Like the testimony of children, parents, teachers and others during the Children’s
Forums and Regional Consultations held as part of a study suggests that extreme violence in
schools needs to be studied more thoroughly. A study in Jamaica found that 61% of students
had witnessed acts of violence at school, 29% of those acts had caused injuries, and that
many children felt unsafe in schools. In Jamaica, the homicide rate was 55 per 100,000 in
2004, and 25% of those arrested for all violent crimes were school-aged children, mainly
boys. Most of those crimes took place away from schools; however, a separate study has
concluded that crimes that did occur in schools were due to factors in wider Jamaican
society, suggesting the need for comprehensive solutions.
Effects and Damages of Violence in School Environment
In recent times Boko Haram resorted attacking schools as soft targets following Military
operations launched on the 14th day of May 2013 (Soriwei, 2014). Soriwei (2014) further
maintained that about 30 pupils were killed in Yobe as Boko Haram wages war against
Nigerian school children. Secondary schools are closed down in Yobe, following Boko
Haram attacks on children in the area. Denying the children their other fundamental human
rights and effectively denying the children their right to quality education and effectively
denying them all other fundamental human rights and shrink them the chances of succeeding
generations particularly the chances of the child to develop to their fullest potentials of
human being.
Folbiya Adetayo and Idowu with News Agency of Nigeria (2014) reported that Boko
Haram Islamists killed 43 people when they attacked the Federal Government College in
Buni Yadi, Gujba Local Government Area, Yobe state. The sect locked the hostels and set it
on fire, thereafter shooting slitting the throats of those who tried to climb out of the window.
Some students were burnt alive. The report further indicated that 40 houses, hostels,
classrooms and staff quarters were burnt in the school. Sahara Reporters (2014) reported 8
deaths in bombing at school of Hygiene in Kano. According to that report eight people died
in the explosion that occurred at the school of Hygiene in Kano on Monday afternoon. It
further maintained that, the number of fatalities is expected to rise with an undermined
number of injuries at the site. The blast occurred as students were struggling to meet
registration deadline for the new academic session (Sahara Reporters, 2014).
A report by Amnesty International in Abubakar (2013) asserted that at least 70
teachers and more than 100 school children and students have been killed or wounded by
Boko Haram. The attacks have generally crippled the education system in North Eastern
Nigeria. There is a lot of fear among students, teachers and parents; teachers are now not
only targeted in schools, but also at home. Teachers are now killed even at home with their
children (Abubakar, 2013). Parents are afraid to send their children to school because they
fear that their children may not return home successfully. As such violence in school
environment often has life-long effects for social functioning which gave rooms to economic
and social underdevelopment in the society.
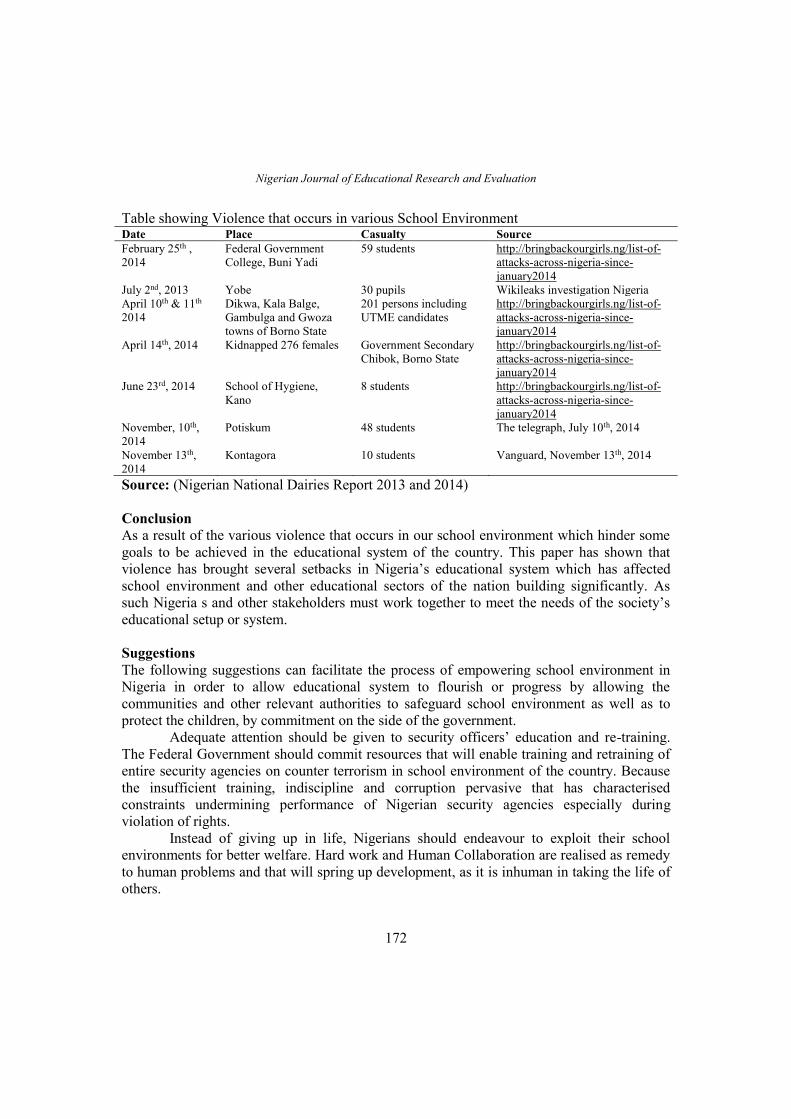
Nigerian Journal of Educational Research and Evaluation
172
Table showing Violence that occurs in various School Environment Date Place Casualty Source
February 25th ,
2014
Federal Government
College, Buni Yadi
59 students http://bringbackourgirls.ng/list-of-
attacks-across-nigeria-since-
january2014
July 2nd, 2013 Yobe 30 pupils Wikileaks investigation Nigeria
April 10th & 11th
2014
Dikwa, Kala Balge,
Gambulga and Gwoza
towns of Borno State
201 persons including
UTME candidates
http://bringbackourgirls.ng/list-of-
attacks-across-nigeria-since-
january2014
April 14th, 2014 Kidnapped 276 females Government Secondary
Chibok, Borno State
http://bringbackourgirls.ng/list-of-
attacks-across-nigeria-since-
january2014
June 23rd, 2014 School of Hygiene,
Kano
8 students http://bringbackourgirls.ng/list-of-
attacks-across-nigeria-since-
january2014
November, 10th,
2014
Potiskum 48 students The telegraph, July 10th, 2014
November 13th,
2014
Kontagora 10 students Vanguard, November 13th, 2014
Source: (Nigerian National Dairies Report 2013 and 2014)
Conclusion
As a result of the various violence that occurs in our school environment which hinder some
goals to be achieved in the educational system of the country. This paper has shown that
violence has brought several setbacks in Nigeria’s educational system which has affected
school environment and other educational sectors of the nation building significantly. As
such Nigeria s and other stakeholders must work together to meet the needs of the society’s
educational setup or system.
Suggestions
The following suggestions can facilitate the process of empowering school environment in
Nigeria in order to allow educational system to flourish or progress by allowing the
communities and other relevant authorities to safeguard school environment as well as to
protect the children, by commitment on the side of the government.
Adequate attention should be given to security officers’ education and re-training.
The Federal Government should commit resources that will enable training and retraining of
entire security agencies on counter terrorism in school environment of the country. Because
the insufficient training, indiscipline and corruption pervasive that has characterised
constraints undermining performance of Nigerian security agencies especially during
violation of rights.
Instead of giving up in life, Nigerians should endeavour to exploit their school
environments for better welfare. Hard work and Human Collaboration are realised as remedy
to human problems and that will spring up development, as it is inhuman in taking the life of
others.
Violence Against Children in Northern Nigeria: An Appraisal
173
Concretize the efforts of professionalism and other stakeholders to work together towards
getting the National Assembly to legislate the creation of special fund for the maintenance
and protection of school environment as well as severe punishment to anyone caught as a
actor of the violence incidence.
References:
Abubakar, M.H. (2013). Boko Haram Violence takes Toll on Education, School Destruction
in the Wake of Boko Haram Attack, IRIN October 4th, 2013.
Alabi, A.O. & Okemakinde, T. (2010). Effective Planning as a Factor of Educational Reform
and Innovation in Nigeria, Current Research Journal of Social sciences, December,
20, 2010; 2(6): Pp. 316-321.
Alokor, F. (2014). Girls Enrolment Drops in North East Schools-UNICEF Punch, JUNE 15th,
2014.
Aver, T.T. (2013). The Sociological Consequences of Emphasis on Paper Qualification in
Nigeria, African Dynamics Social and Science Research, Makurdi, at Mihad
Publishers, 2(2) Pp. 98-106.
Collins, R. (1985). Benue State: Pupils Learn under Makeshift Fatty Structures, Tree and
Sandy Floors. Power Steering Magazines, Kaduna State, Powerhouse Publishing
Ltd. Pp. 43-45. www.Powersteeringmagazine.com June, 2014.
Foibiyi, O. Adetayo, O. & Idowu, K. With News of Nigeria Reports (2014). Boko Haram
kills 43 School Children; The Punch, February 26, 2014.
Madashir, I. & Musa, I. (2014). School Send Away Students Over Abduction Threat.
DailyTrust Thursday, May 29th, 2014.
Orban, H. (2014). Easy Targets: Violence against Children Worldwide. New York: Human
Rights Watch.
Soriwei, V. (2014). Violence and Children with Disabilities. Vol. 24, 1: 2-19. New York:
Rehabilitation International/ UNICEF. http://www.rehabinternational.org/publication
s/10_24.htm.
Suleiman, A. O. (2003) Crisis of Morality Among Youths. Enugu: Computer Edge
Publishers.
WHO & IPSCAN. (2006). Prevention of child maltreatment: A guide to taking action and
generating evidence. Geneva: WHO.