star rating system and evaluation - Quality of Care Network
45
STAR RATING SYSTEM AND EVALUATION A MIXED METHODS ANALYSIS OF TANZANIA’S NATIONAL HEALTH FACILITY QUALITY ASSESSMENT SYSTEM SANAM RODER-DEWAN, MD, DRPH TALHIYA YAHYA, MD, MPH
-
Upload
khangminh22 -
Category
Documents
-
view
3 -
download
0
Transcript of star rating system and evaluation - Quality of Care Network

STAR RATING SYSTEM AND EVALUATIONA MIXED METHODS ANALYSIS OF TANZANIA’S NATIONAL HEALTH FACILITY QUALITY ASSESSMENT SYSTEM
SANAM RODER-DEWAN, MD, DRPH
TALHIYA YAHYA, MD, MPH

STUDY TEAM – ACADEMIA AND POLICY WORKING TOGETHER
Principal Investigator: Sanam Roder-DeWan, MD, DrPH (UNICEF Tanzania)
Co-principal Investigator: Donat Shamba, MSc (Ifakara Health Institute)
Research Scientists
Anna Gage, MSc (Harvard Chan School of Public Health)
Mary Ramesh, MPH (Ifakara Health Institute)
Magreat Somba, MA (Ifakara Health Institute)
Policy and program advisors
Eliudi Eliakimu, MD, MPH (MOH)
Talhiya Yahya, MD, MPH (MOH)
Mohammed Mohammed, MD, MPH, MSc (World Bank)
Study coordinator
Heller Rajab, BAC (Ifakara Health Institute)

STAR RATING SYSTEMTALHIYA YAHYA, MD, MPH
BACKGROUND
Ministry of Health Initiative started in 2014 during Big Results Now Initiative
System was designed to be aligned with key health system initiatives
Four workstreams
Human resources
Commodities
RMNCH
Performance management
Conducted twice to-date (2015/16 and 2017/18)
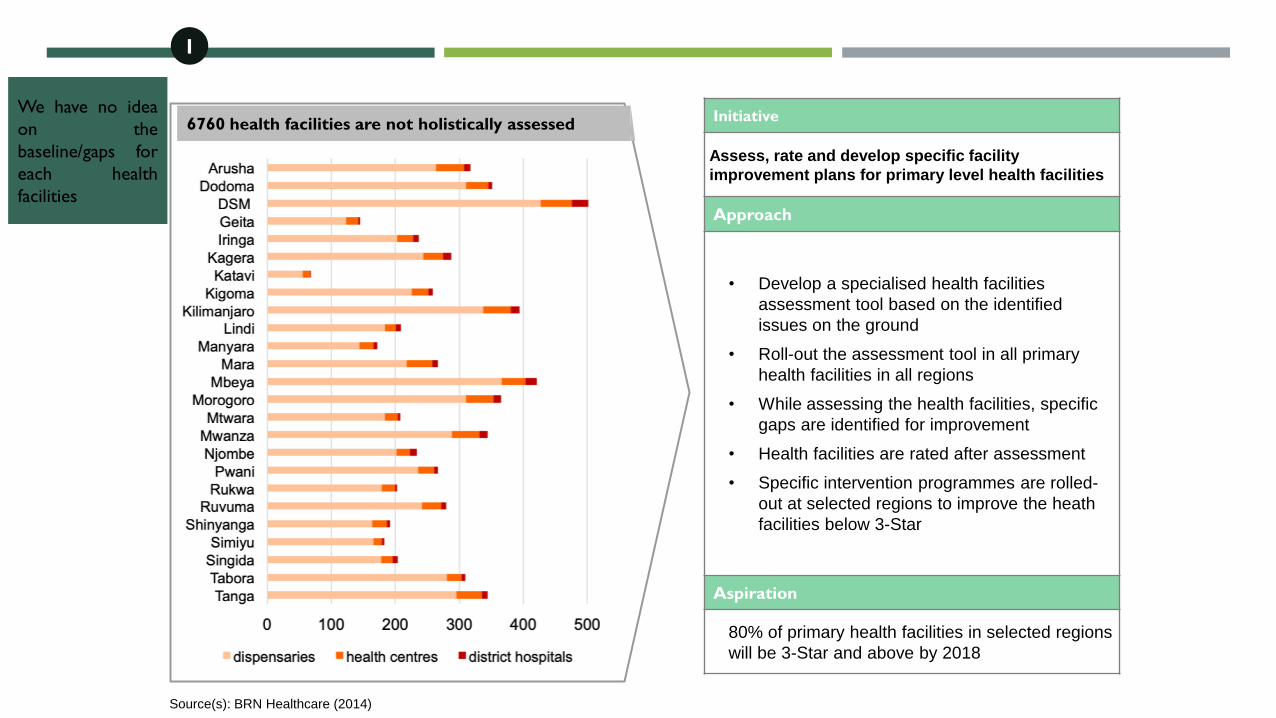
Initiative
Assess, rate and develop specific facility
improvement plans for primary level health facilities
Approach
• Develop a specialised health facilities
assessment tool based on the identified
issues on the ground
• Roll-out the assessment tool in all primary
health facilities in all regions
• While assessing the health facilities, specific
gaps are identified for improvement
• Health facilities are rated after assessment
• Specific intervention programmes are rolled-
out at selected regions to improve the heath
facilities below 3-Star
Aspiration
80% of primary health facilities in selected regions
will be 3-Star and above by 2018
6760 health facilities are not holistically assessedWe have no idea
on the
baseline/gaps for
each health
facilities
1
Source(s): BRN Healthcare (2014)
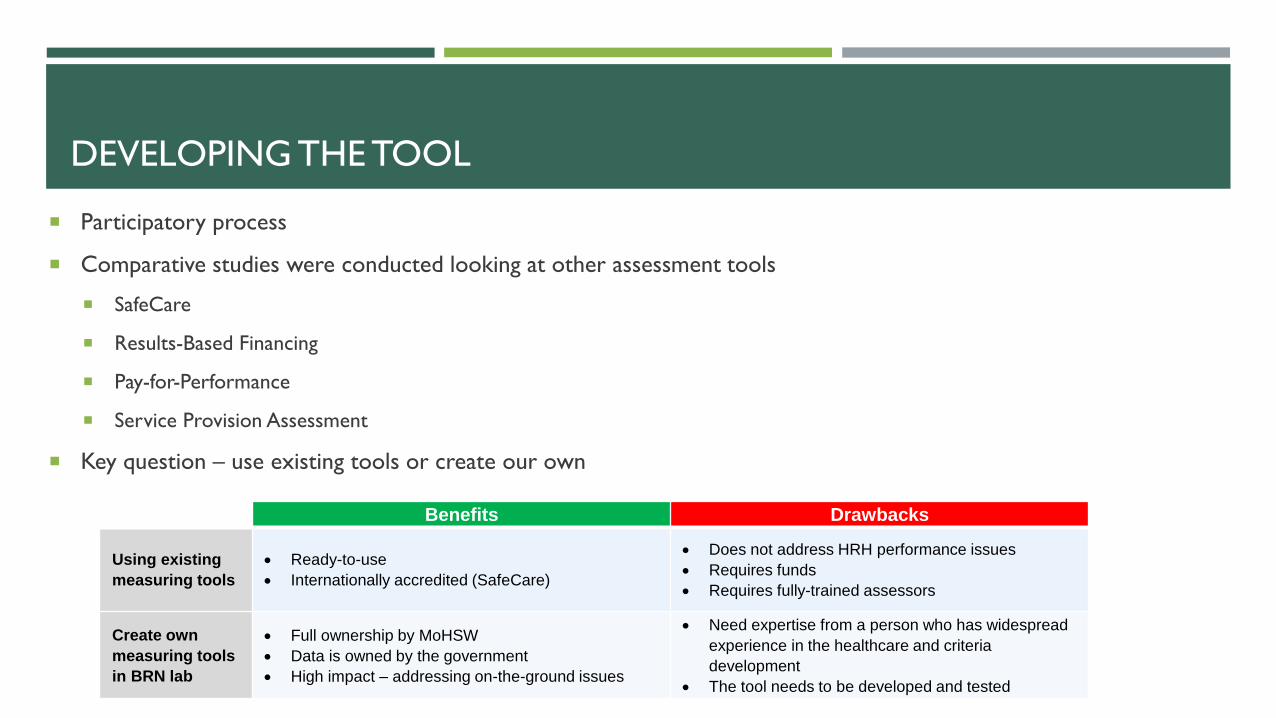
DEVELOPING THE TOOL
Participatory process
Comparative studies were conducted looking at other assessment tools
SafeCare
Results-Based Financing
Pay-for-Performance
Service Provision Assessment
Key question – use existing tools or create our own
Benefits Drawbacks
Using existing
measuring tools
• Ready-to-use
• Internationally accredited (SafeCare)
• Does not address HRH performance issues
• Requires funds
• Requires fully-trained assessors
Create own
measuring tools
in BRN lab
• Full ownership by MoHSW
• Data is owned by the government
• High impact – addressing on-the-ground issues
• Need expertise from a person who has widespread
experience in the healthcare and criteria
development
• The tool needs to be developed and tested

2. Health Facility
Management
(12 indicators)
8. Social accountability
(7 indicators)
6. Handling of
emergencies/referral
(7 indicators)
3. Use of facility data for
service improvements
(6 indicators)
7. Client Focus
(4 indicators)
9. Facility infrastructure
(14 indicators)
4. Staff Performance
Management
(5 indicators)
5. Organisation of
services
(8 indicators)
10. Infection Prevention and
Control
(11 indicators)
11. Clinical Services
(13 indicators)
12. Clinical Support
Services
(20 indicators)
ASSESSMENT AREAS

Minimum Score in
Four Domains
0-Star
0-19%
1-Star
20-39%
*
2-Star
40-59%
**
3-Star
60-79%
***
4-Star
80-89%
****
5-Star
90-100%
*****
SCORING

National Team
(HSIQAS)
(to cover 24 regions and 3 municipals of Dar es Salaam Region)
1. MoHSW (DCS, DPS, DHR)
2. Muhimbili National Hospital
3. National Institute for Medical Research
4. Medial Store Department
5. Tanzania Food and Drug Authority
RegionalTeam
(6 per council)
Council Team
6 assessors/LGA
(assessors to jointly assess district hospitals)
2 assessors/disp & HCs
Team A Team B Team C
2 assessors/disp & HCs 2 assessors/disp & HCs
MULTI-LEVEL
ASSESSMENT PROCESS
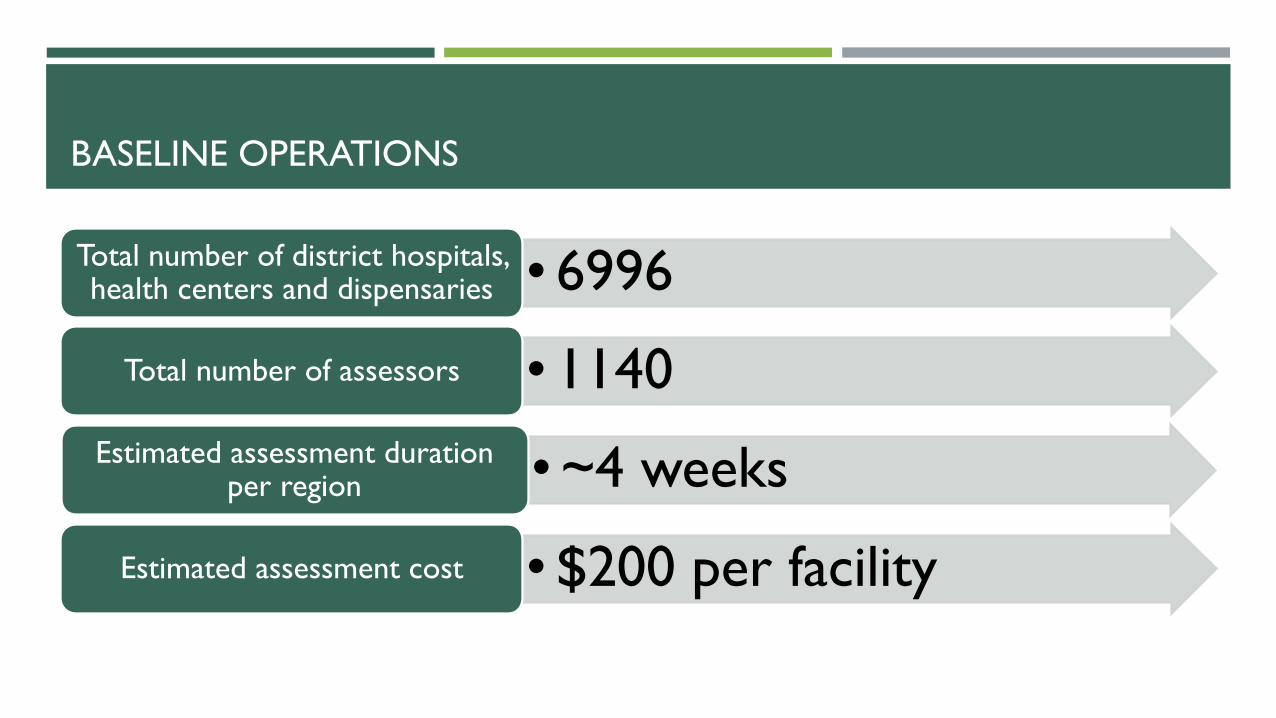
BASELINE OPERATIONS
• 6996Total number of district hospitals, health centers and dispensaries
• 1140Total number of assessors
• ~4 weeksEstimated assessment duration per region
• $200 per facilityEstimated assessment cost

EVALUATION FINDINGS

RESEARCH QUESTIONS
1. What factors are associated with variation in facility capacity to improve?
2. What are the mechanisms through which facility-level quality improvement occurs using the Star Rating
System?
3. How does the Star Rating instrument perform as a quality measurement tool?
#2
#1#3

CONCEPTUAL FRAMEWORK
High Quality Health Systems Framework
Kruk et al 2018 High Quality Health Systems in the Sustainable Development Goals era: time for a revolution
A high quality health system is one
that optimizes health care in a given
context by consistently delivering care
that improves or maintains health
outcomes, by being valued and trusted
by all people, and by responding to
changing population needs

DATA SOURCES AND QUALITY CONSTRUCTS
Clinical observations
Provider surveys
Provider interviews
Facility audits
Clinical observations
Patient exit interviews
Facility audit
Provider surveys
Provider interviews
Facility audit
Provider surveys
Provider interviews
Patient pre-visit interviews
Patient exit interviews
Facility audit Facility audit
Provider surveys
Patient pre-visit interviews
Patient exit interviews
Facility audit
Provider surveys
Provider interviews
6 data
collection
modalities

QUANTITATIVE DATA
1. Star Rating Data Set
2 rounds of data collection (2015/16 and 2017/18)
All primary care facilities on the mainland excluding Dar es Salaam
N=5595 facilities
2. Evaluation Data Set
All regions on mainland
47 districts
280 facilities
609 provider interviews
1,275 client interviews and observation
Pre-visit
interview
Observation
Exit interview
3. Additional survey data
Service provision assessments
2016
DHS 2015
World Pop 2015
Geographic data
Open street map
Natural earth
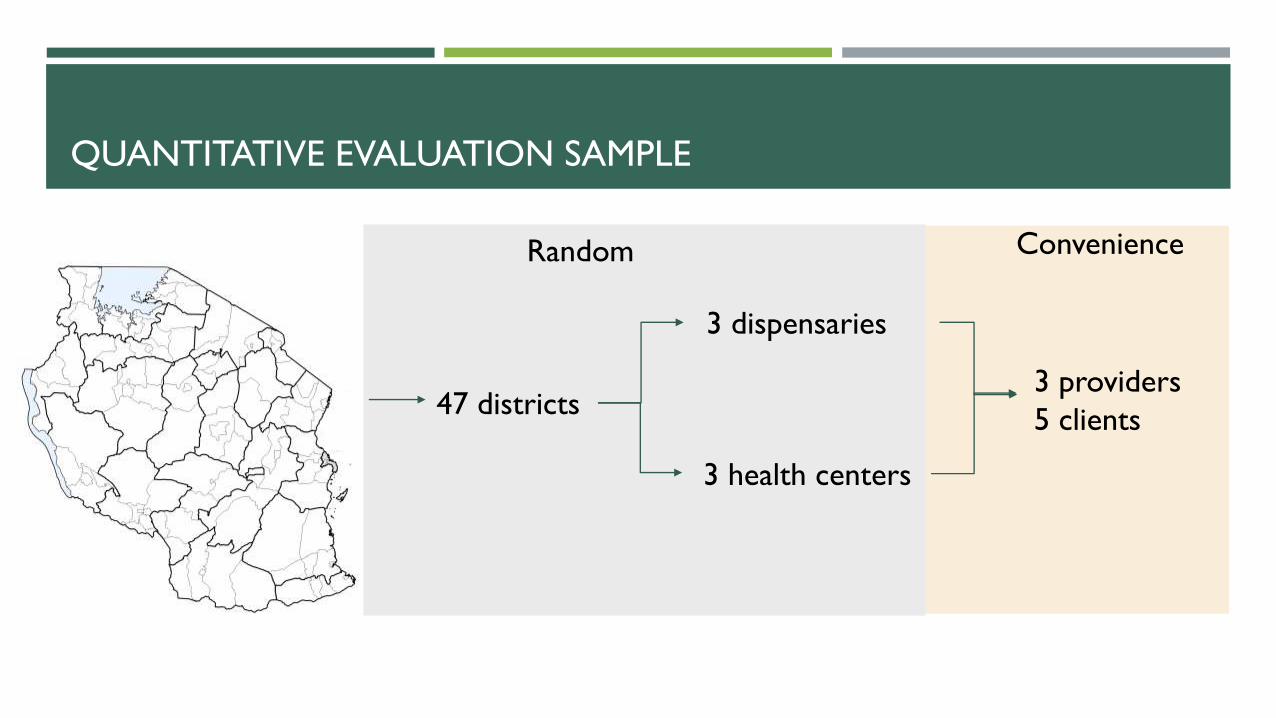
QUANTITATIVE EVALUATION SAMPLE
47 districts
3 dispensaries
3 health centers
3 providers
5 clients
Random Convenience

QUALITATIVE EVALUATION SAMPLE
Most improved Least improved
Southern Highland Lake Zone Southern Highland Lake Zone
Dispensary Health
center
Dispensary Health
center
Dispensary Health
center
Dispensary Health
center
N=3 N=3 N=4 N=3 N=4 N=4 N=3 N=3
Most improved = 2 or 3 star change
Least improved = 0 or -1 star changeN=27

MIXED METHODS
Quantitative
Descriptive statistics
Multivariable regression
Geospatial methods
Qualitative
Thematic content analysis of interviews using grounded theory
Open coding until saturation of codes
Mixed
Simultaneous collection and convergent analysis
Multi-disciplinary discussion of results → local theory of improvement
Code
Organize
ConsolidatePurge
Read
Least
improved
Most
improved
RESEARCHER BIAS
Facilities know their weaknesses
Changes to system are primary drivers of improvement: funding, workforce
Participation vs. top-down programming
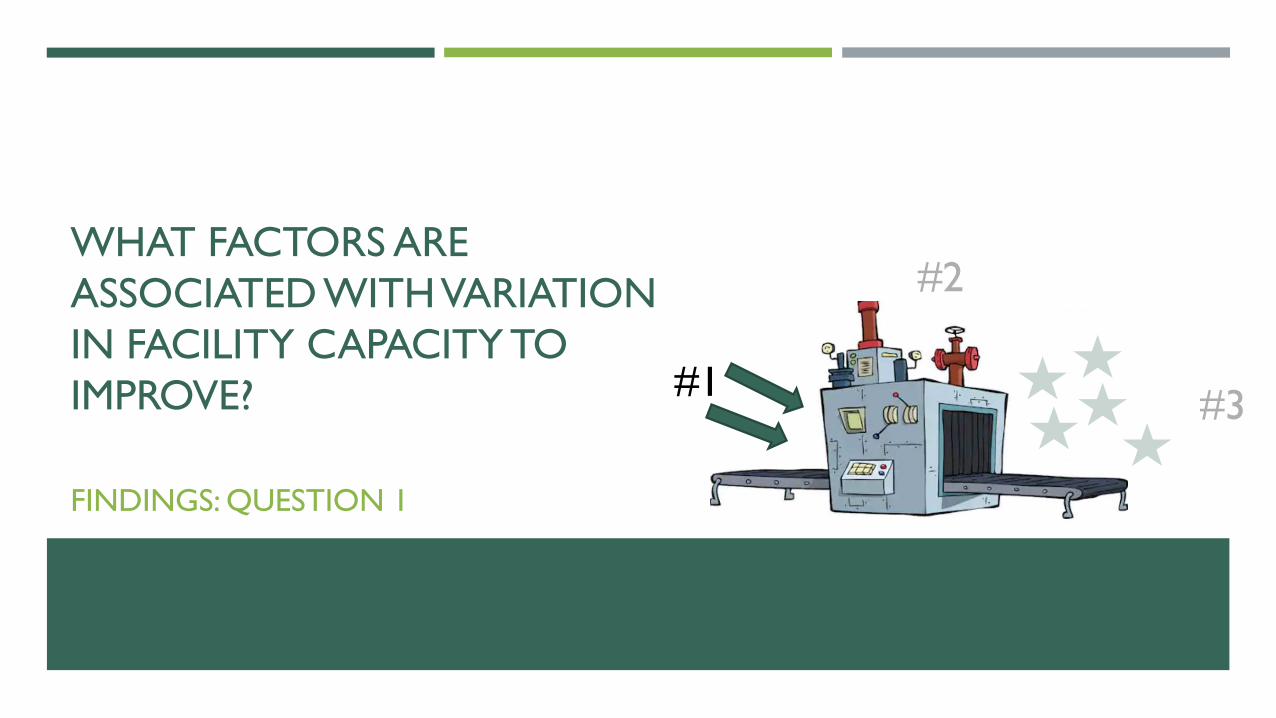
WHAT FACTORS ARE
ASSOCIATED WITH VARIATION
IN FACILITY CAPACITY TO
IMPROVE?
FINDINGS: QUESTION 1
#2
#1#3

STAR RATING ASSESSMENT RESULTS
72% of facilities improved
27% improved by 2+ stars
45% improved by one star
28% same or lower score
Mean Star Rating scores in country, N=5807
Baseline Reassessment Change
Star rating (0-5) 0.78 1.76 0.98
Overall score (0-100) 37 56 19
Domain A. Facility management and
staff performance34 56 22
Domain B. Fulfilment of service
charters and accountability36 58 22
Domain C. Safe and conducive
facilities35 54 19
Domain D. Quality of care and
services43 56 13

IMPROVEMENT IN FACILITY SUBGROUPS
• No difference in facility type
• Public facilities improved more than private
for-profit and non-profit facilities, but also
had lower baseline
• Strong baseline effect
N=5595

GEOGRAPHIC FACTORS

GEOGRAPHIC FACTORS – A LOCAL EFFECT
• Greatest improvements (averages up to 1.75 stars)
• Lake Zone (except Mara)
• Pwani region
• Least improvement
• Southern Highlands Zone (except Mbeya)
• 11% of the total variation in ability to improve was due to
differences between regions
• 14% was due to differences between districts within regions
• Beyond administrative boundaries, there is a local neighborhood
effect where facilities near improving facilities also improved

POTENTIAL IMPLEMENTATION FACTORS
Patient needs and resources
Cosmopolitanism
Peer pressure
External policies and incentives
Structural environment
Structural characteristics
Networks and communication
Culture
Outer
setting
Inner
setting
Space/
Proximity
Council
administration
Facility
improvement

IMPLEMENTATION FACTORS ASSOCIATED WITH IMPROVEMENT
Coef. 95% CI
Sum of people within 5 km radius of facility (ln) 0.8 (0.4,1.2)
Institutional delivery percent in council 1.7 (-6.1,9.5)
Female primary education percent in council 3.8 (-8,15.6)
Healthcare decisions percent in council -8.7 (-22.9,5.6)
Number of facilities in council 0.0 (-0.1,0)
Distance to major road (ln) -0.1 (-0.2,0.1)
Distance to large city (10 kms) 0.1 (-0.1,0.2)
Percentile rank at baseline 3.6 (0.5,6.7)
RBF Participation 6.0 (4.3,7.6)
RBF ineligibility due to low baseline 11.0 (9.2,12.9)
Ownership (Public ref.)
Private -4.2 (-5.5,-2.9)
Non-profit -2.1 (-3.3,-1)
Level (Dispensary ref.)
Health center 3.0 (2,4)
Primary hospital 7.3 (5.4,9.3)
Baseline performance -10.0 (-11.6,-8.4)
• Multivariable regression using change in
Star Rating Score (0-100) as the outcome
• Population density associated with
improvement
• Facilities with RBF improved by 6 points more
than non-RBF facilities, but facilities that were
ineligible for RBF because they scored zero at
baseline improved by 11 points
• Public facilities improved more than private for-
or non-profit facilities
• Hospitals and health centers improved more
than dispensaries
• Strong baseline effect: most of the
improvement came from very low performing
facilities
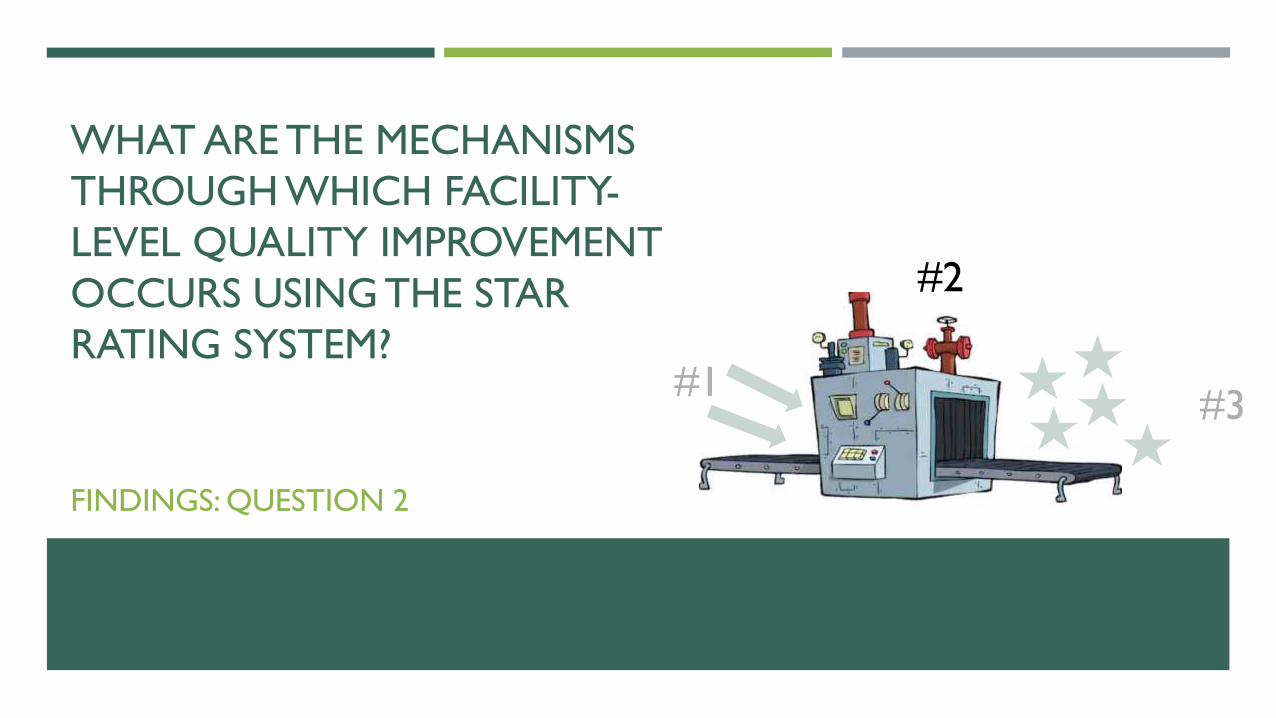
WHAT ARE THE MECHANISMS
THROUGH WHICH FACILITY-
LEVEL QUALITY IMPROVEMENT
OCCURS USING THE STAR
RATING SYSTEM?
FINDINGS: QUESTION 2
#2
#1#3

THREE CORE MECHANISMS
1. Accountability
2. Learning
3. Group identity and benchmarking

MECHANISM 1: ACCOUNTABILITY
Internal accountability
Having a common language
Data
Hierarchy is important - Coming from MOH
CHMT involvement
External accountability
Health Facility Governing Board
Suggestion boxes (mixed results)
“Sweet language”
Quality->utilization->funds
Government
FacilityCommunity

MECHANISM 2: LEARNING
Respondents learn from the assessment
process
Learn about weaknesses
Learn about how to deliver high quality care
Stay current
Make up for gaps in pre-service education
…not everything I deal with in the facility I was taught in school. Other
things I was not taught…When assessing they will find weakness where
by in my point of view I thought it was a normal thing but them they see
[no]. (Ibaba)
At first, as I told you, we didn’t know a lot of things but after they came
we knew we needed to have a lot of things. Like when serving a
customer we never paid attention to how long to we need to attend to
one customer but after the assessment we were told it was important
to use time when attending a customer, so per day we watch the
average we used to serve how many clients. (Kisale)
Another thing that I thought was good about star rating was how they
used guidelines to inspect, there were things that I realize that day I was
suppose to have just by the question they ask. (Ngulugulu)

MECHANISM 3: GROUP IDENTITY AND BENCHMARKING
Because the aim is to emphasize people, especially us the
provider in the facilities that we have a lower rank, we should
feel jealous. Why should your fellow get 2 stars while you
have one, or why he has 3 you have 2? (Mwengemshindo)
…being one of the providers in the facility you are among
the reasons of the facility to perform well or you might be
among the reasons for the facility’s down fall. (Bweri)
With BRN you know what you are supposed to do, the
system has inspired providers, even creating competition
among facilities. (Tenende)
So they will be the one to celebrate, they even ate
pilau….they danced, they had a lot to drink, so it helped
them. (Bweri)
Providers identify with their own facility and
compete with other facilities
Respondents report knowing the star rating results of
neighboring facilities
Facilities that have scored higher motivate respondents
to improve

QUALITY ACTIONS
1. Advocacy
II. Self-checking
III. Collaboration
For instance, in 2017/2018 it was seen that we don’t have administrative
building and the Matron office is in the ward. It was suggested that, the council
together with the region will take this information to the Ministry if possible
we should get the administrative building also paediatric ward should be
improved. (Murangi)
...so you will just know, that day they came they asked these questions, so when
you are about to do something that involves that question asked you will do it
with caution since you know you are doing it to help improve star ratings.
(Bweri)
The first thing was collaboration of providers because if there was no
collaboration then none of these could have been possible. So what happened
was after getting that report we sat all the providers and noted all that was
written in the work plan (Kisale)

MOST - LEAST
Divergent
Bureaucracy
No ownership over improvement
Supervision not happening
Don’t know about stars or baseline
Convergent
No control over human resources
Funding as an enabler
Code
Organize
ConsolidatePurge
Read
Least
improved
Most
improved
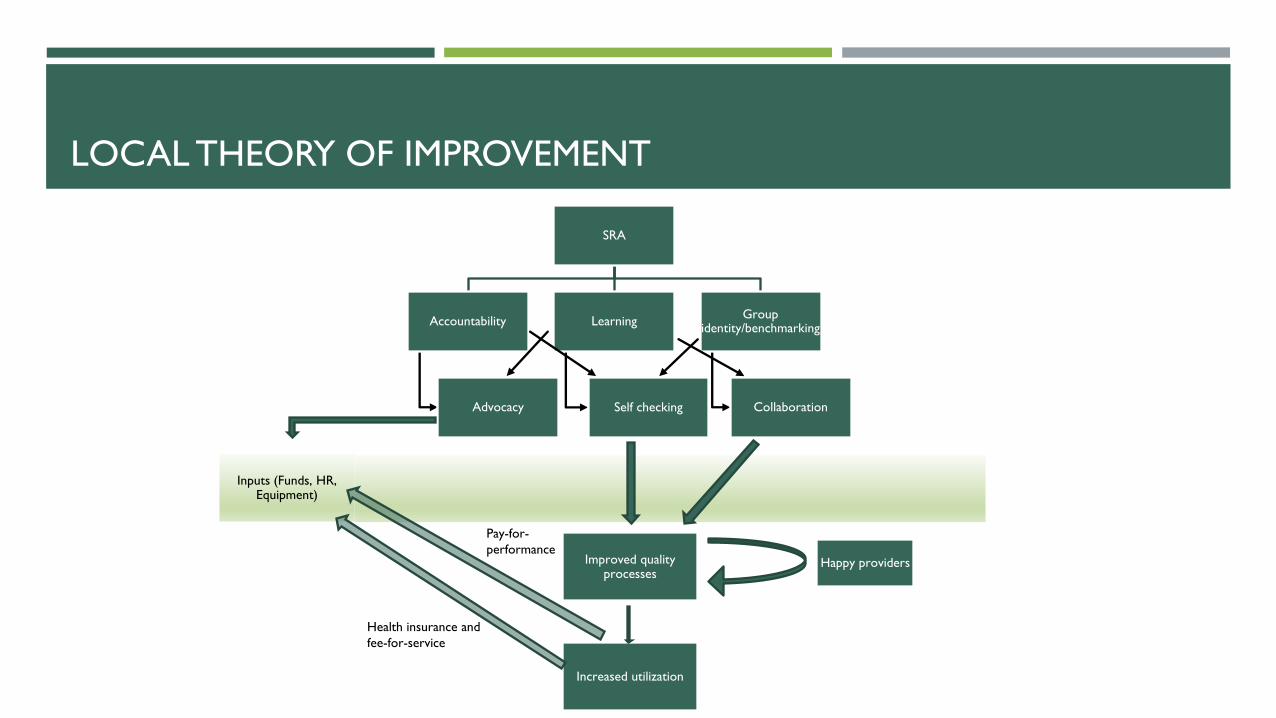
LOCAL THEORY OF IMPROVEMENT
SRA
Accountability
Advocacy
Learning
Self checking
Group identity/benchmarking
Collaboration
Improved quality processes
Increased utilization
Happy providers
Inputs (Funds, HR, Equipment)
Health insurance and
fee-for-service
Pay-for-
performance

HOW DOES THE STAR
RATING INSTRUMENT
PERFORM AS A QUALITY
MEASUREMENT TOOL?
FINDINGS: QUESTION 3
#2
#1#3

HOW DOES THE STAR RATING MAP TO OTHER QUALITY
MEASURES?
Good medical
practice
User
experience
Basic
infrastructure
and equipment
Diagnostic and
treatment accuracy
Management
index
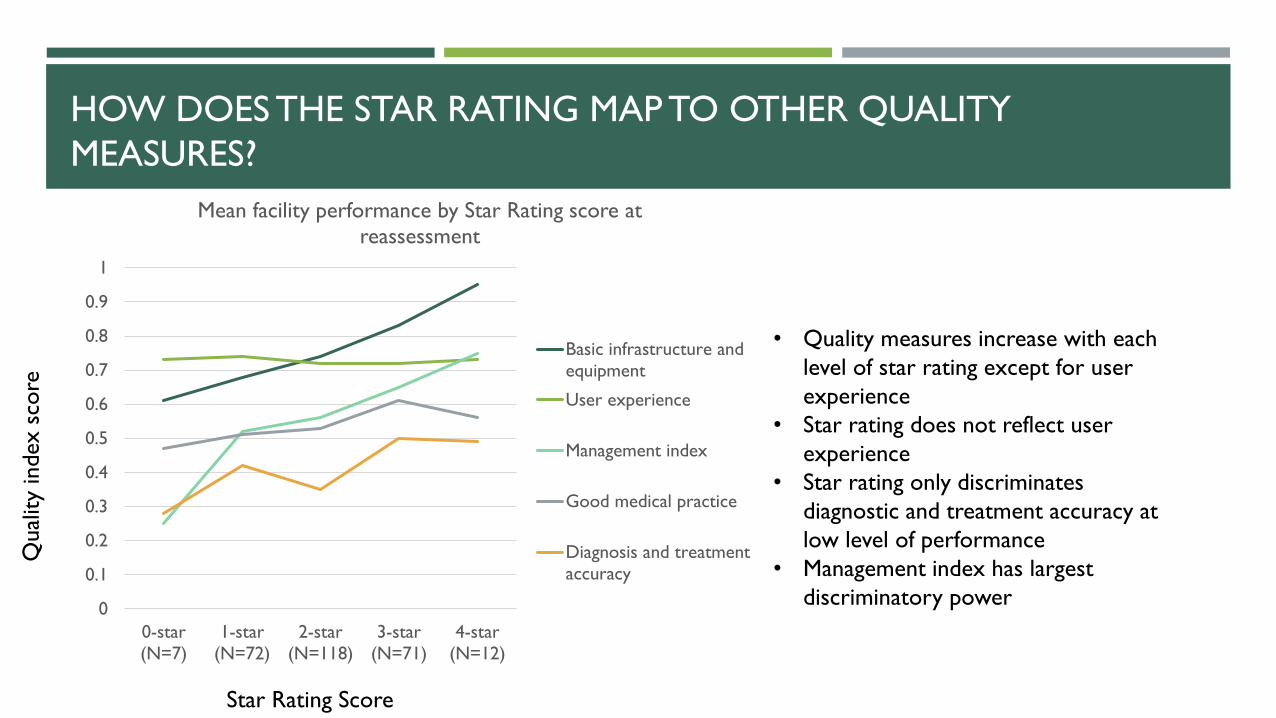
HOW DOES THE STAR RATING MAP TO OTHER QUALITY
MEASURES?
• Quality measures increase with each
level of star rating except for user
experience
• Star rating does not reflect user
experience
• Star rating only discriminates
diagnostic and treatment accuracy at
low level of performance
• Management index has largest
discriminatory power 0
0.1
0.2
0.3
0.4
0.5
0.6
0.7
0.8
0.9
1
0-star
(N=7)
1-star
(N=72)
2-star
(N=118)
3-star
(N=71)
4-star
(N=12)
Mean facility performance by Star Rating score at
reassessment
Basic infrastructure and
equipment
User experience
Management index
Good medical practice
Diagnosis and treatment
accuracy
Star Rating Score
Qual
ity
index s
core

HOW DOES THE STAR RATING MAP TO OTHER QUALITY
MEASURES?
Multivariable regression using reassessment star
rating as the outcome, controlling for facility type,
ownership, location and expectation
Beta 95% CI
Basic infrastructure and
equipment0.98 (0.28,1.68)
Management index 0.48 (0.07,0.90)
Diagnosis and treatment
accuracy0.27 (-0.32,0.86)
Good medical practice 0.89 (0.15,1.62)
User experience -0.17 (-0.93,0.60)
Basic infrastructure and equipment, management and
good medical practice are associated with the star
rating
Good medical practice is not directly measured by
Star Rating, but the totality of measures included in
Star Rating are associated with good medical practice
The management index was poorly correlated with
domain A on management (.18)
Diagnostic and treatment accuracy and user
experience are not captured by the Star Rating

HOW DOES THE STAR RATING MAP TO OTHER QUALITY
MEASURES?
Good medical
practice
User
experience
Basic
infrastructure
and equipment
Diagnostic and
treatment accuracy
Management
index
User
experience

INFRASTRUCTURE DOES NOT EQUAL QUALITY
Antenatal care Family planning Sick child care
Infrastructure
Obse
rved c
linic
al q
ual
ity
Leslie H, Zen S, Kruk M 2017. Association between infrastructure and observed quality of care in 4 healthcare services: A cross-sectional study of 4,300 facilities in 8 countries. Plos Medicine
RESEARCH QUESTION 3: HOW DOES THE STAR RATING INSTRUMENT
PERFORM AS A QUALITY MEASUREMENT TOOL?
This is not just a
quality
measurement
tool!
Yes and No!

CONCLUSIONS
#2
#1#3

This evaluation suggests that the Star Rating Assessment is supporting
primary care facilities to improve quality in Tanzania
Targeted revisions to the instrument could make it even better
The assessment should be integrated into other quality programs

NEXT STEPS
Revising and piloting new tool
Assess tertiary hospitals
Next assessment soon
Digital (offline)

ACKNOWLEDGMENTS
Jeremy Veillard
Margaret E. Kruk and Lab
Peter Abdul DeWan
Data Collectors
Adelina Herman
Pamela Sao