Evaluation of pavement damage due to new tire designs
74
EVALUATION OF PAVEMENT DAMAGE DUE TO NEW TIRE DESIGNS Prepared By Imad L. Al-Qadi Hao Wang University of Illinois at Urbana-Champaign Research Report ICT-09-048 A report of the findings of ICT-R59 Evaluation of Pavement Damage Due to New Tire Designs Illinois Center for Transportation May 2009 CIVIL ENGINEERING STUDIES Illinois Center for Transportation Series No. 09-048 UILU-ENG-2009-2019 ISSN: 0197-9191
Transcript of Evaluation of pavement damage due to new tire designs
EVALUATION OF PAVEMENT DAMAGE DUE TO NEW TIRE DESIGNS
Prepared By
Imad L. Al-Qadi Hao Wang
University of Illinois at Urbana-Champaign
Research Report ICT-09-048
A report of the findings of
ICT-R59 Evaluation of Pavement Damage Due to New Tire Designs
Illinois Center for Transportation
May 2009
CIVIL ENGINEERING STUDIES Illinois Center for Transportation Series No. 09-048
UILU-ENG-2009-2019 ISSN: 0197-9191
Technical Report Documentation Page
1. Report No.
FHWA-ICT-09-048
2. Government Accession No. 3. Recipient's Catalog No.
4. Title and Subtitle
Evaluation of Pavement Damage Due to New Tire Design
5. Report Date
May 2009 6. Performing Organization Code
8. Performing Organization Report N o. 7. Author(s)
Imad L. Al-Qadi, Hao Wang
ICT-09-048 UILU-ENG-2009-2019
9. Performing Organization Name and Address
Illinois Center for Transportation Department of Civil and Environmental Engineering University of Illinois at Urbana-Champaign 205 N. Mathews Ave., MC-250 Urbana, IL 61801
10. Work Unit ( TRAIS)
11. Contract or Grant No.
ICT-R59 13. Type of Report and Period Covered
12. Sponsoring Agency Name and Address
Illinois Department of Transportation Bureau of Materials and Physical Research 126 East Ash Street Springfield, IL 62704-4766
14. Sponsoring Agency Code
15. Supplementary Notes
Study was conducted in cooperation with the U.S. Department of Transportation, Federal Highway Administration.
16. Abstract
The objective of this study is to evaluate pavement damage due to new tire designs using accelerated pavement testing (APT) and finite element (FE) modeling. Three tire configurations were investigated in this study, including the newly developed wide-base tire (455/55R22.5), an older generation of wide-base tire (425/65R22.5), and the conventional dual-tire configuration. Four full-depth flexible pavement sections with three various hot-mix-asphalt (HMA) thicknesses (6, 10 and 16.5 in. [152, 254, and 420 mm]) were exposed to APT. The measured tensile strains at the bottom of the HMA were compared under various tire loading conditions. A three-dimensional (3D) FE model was successfully developed to predict the pavement responses caused by various tire configurations and validated by field measurements. The developed 3D FE model incorporates the measured 3D tire-pavement contact stresses, HMA linear viscoelasticity, continuous moving load, and implicit dynamic analysis.
Results of pavement damage analysis indicate that the wide-base 455 tire causes greater fatigue damage and subgrade rutting than the conventional dual-tire assembly does when carrying the same load. However, the relative damage ratios between various configurations at the same load decrease as the pavement thickness increases. On the other hand, the wide-base 455 tire causes less top-down cracking, “near-surface” cracking, and HMA rutting damage than the conventional dual-tire assembly does. Generally, the results show that using a wide-base 455 tire results in the least amount of pavement damage for an interstate road, slightly greater damage for a primary road, and more damage for a local road.
17. Key Words
18. Distribution Statement
No restrictions. This document is available to the public through the National Technical Information Service, Springfield, Virginia 22161.
19. Security Classif. (of this report)
Unclassified
20. Security Classif. (of this page)
Unclassified
21. No. of Pages
22. Price
Form DOT F 1700.7 (8-72) Reproduction of completed page authorized
i
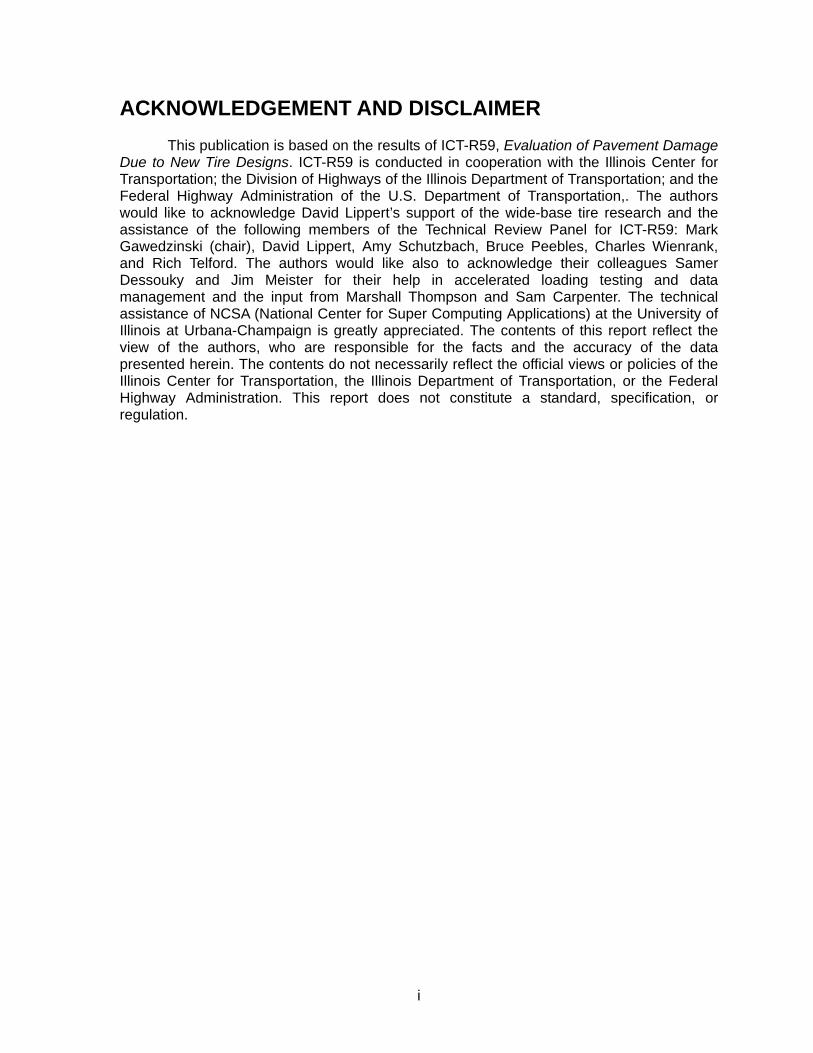
ACKNOWLEDGEMENT AND DISCLAIMER This publication is based on the results of ICT-R59, Evaluation of Pavement Damage
Due to New Tire Designs. ICT-R59 is conducted in cooperation with the Illinois Center for Transportation; the Division of Highways of the Illinois Department of Transportation; and the Federal Highway Administration of the U.S. Department of Transportation,. The authors would like to acknowledge David Lippert’s support of the wide-base tire research and the assistance of the following members of the Technical Review Panel for ICT-R59: Mark Gawedzinski (chair), David Lippert, Amy Schutzbach, Bruce Peebles, Charles Wienrank, and Rich Telford. The authors would like also to acknowledge their colleagues Samer Dessouky and Jim Meister for their help in accelerated loading testing and data management and the input from Marshall Thompson and Sam Carpenter. The technical assistance of NCSA (National Center for Super Computing Applications) at the University of Illinois at Urbana-Champaign is greatly appreciated. The contents of this report reflect the view of the authors, who are responsible for the facts and the accuracy of the data presented herein. The contents do not necessarily reflect the official views or policies of the Illinois Center for Transportation, the Illinois Department of Transportation, or the Federal Highway Administration. This report does not constitute a standard, specification, or regulation.
ii
EXECUTIVE SUMMARY Although wide-base tires offer potential benefits to the trucking industry, these tires
have also been associated with a potential increase in pavement damage compared to dual-tire assemblies. Because trucking agencies should not gain economic advantage at the cost of increased road repairs, the benefits of wide-base tires to the trucking industry should be balanced with the potential increased costs to pavement agencies. To achieve this balance, it is necessary to accurately quantify the damage induced by wide-base tires and dual tire assemblies.
The objective of this study is to evaluate pavement damage from new tire designs using accelerated pavement testing (APT) and finite element (FE) modeling. Three tire configurations were investigated, including the newly developed wide-base tire (455/55R22.5), an older generation of wide-base tire (425/65R22.5), and the conventional dual-tire configuration. In this study, four full-depth flexible pavement sections with three different hot-mix asphalt (HMA) thicknesses (6, 10 and 16.5 in. [152, 254, and 420 mm]) were exposed to APT. The measured tensile strains at the bottom of the HMA were compared under various tire loading conditions. A three-dimensional (3-D) FE model was successfully developed to predict the pavement responses caused by various tire configurations and was validated by field measurements. The 3-D FE model developed incorporates the measured 3-D tire–pavement contact stresses, HMA linear viscoelasticity, continuous moving load, and implicit dynamic analysis.
Results of the experimental program indicate that the new generation of wide-base tires (455/50R22.5) causes much less fatigue damage than the first generation of wide-base tires (425/60R22.5). The average peak longitudinal tensile strain ratios between the wide-base tire and dual-tire assembly are 1.25 for wide-base 425 and 1.16 for wide-base 455. In addition, the pressure differential in dual tires induces higher longitudinal strain for experimental flexible pavement, compared with the longitudinal tensile strains under dual-tire assembly with equal tire pressure. This effect is more significant in thin pavement sections. As would be expected, longitudinal strain increases almost linearly with load and decreases as speed increases. The effect of load on fatigue life is expressed as an exponential function. The damage exponents were found to be in the range of 1.7 to 3.3 for full-depth flexible pavement, depending on pavement thickness and tire configuration. In addition, the effect of tire pressure on the longitudinal strains under HMA is negligible for the pavement structures tested in this study.
The FE analysis had several noteworthy findings. Most important, longitudinal tensile strain at the bottom of the HMA is a critical response in thin and medium-thickness HMA layers; while the critical response in a thick HMA layer is the vertical shear strain at 3 to 4 in. (76 to 100 mm) below the HMA surface. The latter is responsible for “near-surface” fatigue cracking, as well as HMA primary rutting. Top-down cracking could result from the local vertical shear strain in the upper 1 in. (25 mm) of the HMA, where the effect of tire–pavement tangential stresses are the highest.
The analysis results show that the wide-base 455 tire causes higher longitudinal tensile strain at the bottom of the HMA and compressive strain at the top of subgrade, where those responses are highly affected by the total wheel load and contact area. The differences in strains between the two tire configurations diminish as the pavement depth increases. On the other hand, the wide-base 455 tire causes less vertical shear strains and compressive strains near the surface than does the dual-tire assembly loading, regardless of HMA thicknesses. This is probably due to the more uniform vertical contact stress and less transverse tangential stress induced by the wide-base 455 tire, compared to the dual-tire assembly.
iii
The results of pavement damage analysis, using current transform functions, indicate that the wide-base 455 tire causes greater fatigue damage and subgrade rutting than the conventional dual-tire assembly does when carrying the same load. However, the relative damage ratios (DRs) between various tire configurations decrease as the pavement thickness increases. The relative fatigue damage potential caused by the wide-base tire in thin pavements could be reduced when considering the wandering effect and possible pressure differential in dual tires. On the other hand, the wide-base 455 tire causes less top-down cracking, near-surface cracking, and HMA rutting damage than does the conventional dual-tire assembly. This suggests that the new wide-base 455 tire causes less damage near the pavement surface, while it causes greater damage at a deeper pavement depth.
A combined damage ratio was used to consider the overall effect of different failure mechanisms and to estimate the pavement repair costs associated with wide-base tires and an overweight axle load. In general, the results show that using the wide-base 455 tire results in less pavement repair costs for an interstate road, slightly greater costs for a primary road, and greater costs for a local road. As expected, the overweight axle load causes greater pavement repair costs, especially on a local road. These estimated costs provide state pavement agencies a basis for implementing appropriate load regulations and road pricing of trucking operations.
iv
TABLE OF CONTENTS
ACKNOWLEDGEMENT AND DISCLAIMER ........................................... i
EXECUTIVE SUMMARY ......................................................................... ii
TABLE OF CONTENTS ......................................................................... iv
CHAPTER 1 INTRODUCTION ................................................................ 1
1.1 BACKGROUND ................................................................................................................ 1
1.2 OBJECTIVE AND SCOPE ................................................................................................ 2
CHAPTER 2 LITERATURE REVIEW ...................................................... 4
2.1 PAVEMENT FAILURE MECHANISMS ............................................................................. 4
2.2 ACCELERATED PAVEMENT TESTING .......................................................................... 4
2.3 MECHANISTIC ANALYSIS OF PAVEMENT RESPONSE ............................................... 5
2.4 IMPACT OF WIDE-BASE TIRES ON FLEXIBLE PAVEMENT DAMAGE ........................ 9
2.5 SUMMARY ...................................................................................................................... 12
CHAPTER 3 EXPERIMENTAL PROGRAM .......................................... 13
3.1 TEST SECTIONS ............................................................................................................ 13
3.2 PAVEMENT INSTRUMENTATION ................................................................................. 13
3.3 ACCELERATED PAVEMENT TESTING ........................................................................ 14
3.4 RESULTS AND ANALYSIS ............................................................................................ 16
3.5 SUMMARY ...................................................................................................................... 24
CHAPTER 4 FLEXIBLE PAVEMENT MODELING ................................ 25
v
4.1 MATERIAL CHARACTERIZATION ................................................................................. 25
4.2 DEVELOPMENT OF A 3D FE MODEL ........................................................................... 31
4.3 PAVEMENT RESPONSE ANALYSIS ............................................................................. 36
4.4 PAVEMENT RESPONSES UNDER DIFFERENT TIRE CONFIGURATIONS ............... 43
4.5 SUMMARY ...................................................................................................................... 47
CHAPTER 5 PAVEMENT DAMAGE QUANTIFICATION ...................... 48
5.1 PAVEMENT DAMAGE MODELS .................................................................................... 48
5.2 PAVEMENT DAMAGE RATIO ........................................................................................ 50
5.3 SIMPLIFIED PAVEMENT COST ANALYSIS .................................................................. 55
5.4 SUMMARY ...................................................................................................................... 56
CHAPTER 6 CONCLUSIONS AND RECOMMENDATIONS ................ 57
6.1 CONCLUSIONS .............................................................................................................. 57
6.2 RECOMMENDATIONS ................................................................................................... 58
REFERENCES ...................................................................................... 59

1
CHAPTER 1 INTRODUCTION 1.1 BACKGROUND
In 1998, trucks moved 71% of the total tonnage and 80% of the total value of the U.S. shipments, excluding commodities transported by pipeline (U.S. Department of Transportation, 2005). The impact on the road infrastructure of trucking operations is substantial, especially the load-related damage in pavements. As no slowdown in freight transportation growth is expected in the near future, it is imperative that innovative technologies that can improve the efficiency of trucking operations be introduced to ensure continuous growth of the economy. However, the continuous growth of trucking operations should not occur at the expense of the road infrastructure, in terms of significantly increased damage.
One of the new technologies supported by the trucking industry is the use of wide-base tires to replace the conventional dual-tire assembly. Compared to conventional dual tires, wide-base tires offer the trucking industry significant economic advantages such as improved fuel efficiency, increased hauling capacity, reduced tire cost and repair, and superior ride and comfort (Al-Qadi and Elseifi, 2007). However, the first generation of wide-base tires (385/65R22.5 and 425/65R22.5) in the early 1980s were found to cause a significant increase in pavement damage compared to dual-tire assemblies. This has led many transportation agencies to discourage their use. The first generations of wide-base tires are still in the market, but they are mainly used for specific steer axle service in applications such as construction, mining, concrete trucks, logging, and equipment (U.S. Environmental Protection Agency, 2004).
After more than two decades of research sponsored by the tire industry and by state pavement agencies, a new generation of wide-base tire (445/50R22.5 and 455/55R22.5) was recently introduced that could reduce pavement damage and offer other safety and cost-savings benefits. With the advent of this new generation, wide-base tires have become increasingly wider than their predecessors, and their structure and design have been improved. They now provide a load distribution comparable to dual-tire assembly and possess capabilities for improved dynamic damping (Al-Qadi et al., 2005).
Wide-base tires have been used successfully on trucks in Europe since the early 1980s. In 1997, around 65% of trailers and semi-trailer tires in Germany used wide-base tires (COST 334, 2001). Although it is expected to take several years to build acceptance and confidence in this new technology in the U.S., the use of the new generation of wide-base tires has been growing exponentially in recent years, especially for gross vehicle weight-sensitive applications. These tires currently represent approximately 5% of the 17.5 million tires sold each year in the U.S., but their market share is expected to grow continuously as the transportation industry becomes comfortable with the technology, manufacturers develop new tire types for various truck applications, and over-the-road availability improves (Ang-Olson and Schroeer, 2002). Many truck manufacturers are also entering this emerging market by offering tractors and trailers specially designed for wide-base tires. It should be noted that some wide-base tire designs do not require any changes in truck axles. The associated growth in the U.S. market share of wide-base tires in trucking applications should be accompanied by the research necessary to ensure that all aspects of these new technologies are thoroughly evaluated, including impacts on the road infrastructure. A challenge associated with using wide-base tires is the accurate quantification of pavement damage induced by these tires. An optimum understanding of pavement damage due to various tire configurations could be achieved by measuring the in-situ pavement responses complemented by advanced modeling. Previous research has
2
attempted to use the linear layered elastic theory to predict pavement damage caused by various tire configurations. The layered theory assumes a uniform stress distribution that is only a function of the load and a circular contact area, but improvements in the new generation of wide-base tires cannot be quantified using this simple method. Thus, a more advanced modeling approach that may consider the tire–pavement interaction is required to more accurately predict pavement responses. An analysis technique such as the finite element method (FEM) provides the needed versatility and flexibility to accurately simulate realistic tire loading.
The accurate quantification of pavement damage due to various tire configurations would provide many benefits to state pavement agencies. First, state departments of transportation (DOTs) would be able to predict the impact of various tire configurations on the road infrastructure and could therefore implement accurate load regulations and fee charges for trucking operations. Second, pavement designers will be able to identify the exact requirements to carry the expected future traffic load and preserve the road infrastructure at an acceptable level of service. This will ultimately lead to better prediction of pavement response to various tire configurations, and hence, better pavement performance, as well as the appropriate allocation of available funds based on the predicted level of performance.
1.2 OBJECTIVE AND SCOPE
The objective of this study is to evaluate pavement damage from new tire designs using accelerated pavement testing (APT) and FEM. Three tire configurations were investigated in this study, including the newly-developed wide-base tire (455/55R22.5), an older generation of wide-base tire (425/65R22.5), and the conventional dual-tire configuration (11R22.5).
In this study, four full-depth flexible pavement sections with three different hot-mix asphalt (HMA) thicknesses (6, 10 and 16.5 in. [152, 254, and 420 mm]) were exposed to APT. The measured tensile strains at the bottom of the HMA were compared under various tire loading conditions. The field measurements were also used to establish a benchmark for predicting pavement responses and to validate the FE model that was developed. The developed three-dimensional (3-D) FE model incorporates the measured 3-D tire–pavement contact stresses, HMA linear viscoelasticity, continuous moving load, and implicit dynamic analysis. The critical pavement responses of the test pavement structures under various tire loading conditions were calculated and compared, including tensile strain, shear strain, and compressive strain. The impact of wide-base tire and dual-tire assembly on various pavement failure mechanisms is presented in this report.
To accomplish the objective of this study, the research approach included conducting APT experiments on full-depth flexible pavement test sections, data analysis, and pavement damage quantification. In addition, FEM to simulate pavement loading was developed and validated using the APT results.
This report is divided into six chapters: • The first chapter introduces the research background and objective. • The second chapter presents an overview of the pavement failure
mechanism, a mechanistic analysis of pavement response, and a summary of previous field and theoretical studies on wide-base tires.
• The third chapter presents the accelerated pavement testing program and data analysis results.
• The fourth chapter describes the development of a 3-D FE model and pavement response analysis.

3
• The fifth chapter presents the quantification of pavement damage and a simplified cost analysis associated with the wide-base tire and overweight axle load.
• The last chapter presents the study’s conclusions and recommendations.

4
CHAPTER 2 LITERATURE REVIEW 2.1 PAVEMENT FAILURE MECHANISMS
Pavement failure may occur as a result of the environment, repeated traffic loading, deficient construction, and/or poor maintenance strategies. The two main load-associated distresses with flexible pavements are rutting and fatigue cracking. Fatigue cracking is caused by repeated axle load applications, usually lower than the strength of the paving material. Fatigue cracking usually starts at the bottom of the HMA layers, which represents the location of the greatest tensile strain in the case of fully bonded conditions between the different HMA layers. Fatigue cracking may also start at the bottom of the individual HMA layers if poor bonding conditions exist.
Rutting is the permanent deformation occurring in the pavement structure, including HMA (primary) rutting and subgrade (secondary) rutting. Subgrade rutting is a longitudinal wheel-path depression that occurs when the subgrade exhibits permanent deformation or lateral migration due to loading. In this case, the pavement settles into the subgrade ruts, causing surface depressions in the wheel path. Hot-mix asphalt rutting includes two types of deformation: volume reduction caused by traffic densification, and permanent movement at a constant volume caused by shear flow. HMA rutting is mainly caused by shear flow for well-constructed pavement, especially at high temperature and slow speed.
In addition, many field studies have proven that surface cracking is the major cracking mechanism in thick flexible pavement, including perpetual pavement. The cracking could initiate at the pavement surface and propagate downward (top-down cracking), or initiate at a shallow depth in the pavement structure and propagate upward or downward or both (near-surface cracking). Field investigation has shown that surface cracking can be transverse cracking within the wheel path or longitudinal cracking in the vicinity of the wheel path. Several factors have been proposed as the causes of top-down cracking (TDC). These include load-induced factors (high tensile or shear stresses or strains or both at the edges of truck tires or between truck tires), material factors (low fracture energies, HMA aging, and longitudinal segregation during construction); and temperature-induced factors (extreme cooling rates) (Baladi et al., 2002).
The high tensile or shear stresses and strains induced by tires at the pavement surface are the most well-recognized load factor that contributes to the surface cracking mechanism. It was found that the pavement structure has little effect on the reduction of tensile stresses around the tire–pavement contact area, and that the major influencing factor is the distribution of the contact stresses around the tire (Myers et al., 1998). It has also been reported that load-induced shear strains at the edge of the wheels in the vertical plane are higher than the horizontal strains, and are thought to be the major cause of top-down or near-surface cracking initiation and propagation (Bensalem et al., 2000; Al-Qadi et al., 2008a).
2.2 ACCELERATED PAVEMENT TESTING
Accelerated pavement testing (APT) provides an acceptable solution between real field pavement loading and laboratory tests for evaluating the effect of truck loading parameters on pavement damage. APT compresses many years of pavement load-related deterioration into just a few months or weeks of testing. During the accelerated pavement testing, the pavement response to loading can be measured using pavement instrumentation. The parameters that can be measured include strains, stresses, deflections, moisture, temperature, and so forth. In-situ measurements of these parameters allow for the development of accurate performance models and the calibration of mechanistic pavement design approaches.
5
Recently, various accelerated pavement testing projects have been conducted to measure realistic pavement responses: Penn State Test Track (Tabatabaee et al., 1992), MnRoad (Baker et al., 1994), WesTrack (WesTrack Team, 2002), and the Virginia Smart Road (Al-Qadi et al., 2004). However, the main focus of each of these projects was somewhat different. For instance, the Penn State project focused on determining layer moduli and evaluating mechanistic distress models, while the initial interest of the MnRoad was assessing existing pavement design models and developing new transfer functions. The WesTrack project team’s interest was evaluation of HMA performance, as opposed to pavement design evaluation. The Virginia Smart Road’s main objectives were to calibrate falling weight deflectometer (FWD) measurements, evaluate different SuperPave™ mix performances and durability, calibrate and optimize ground penetrating radar (GPR) for measuring layer thicknesses, and detect flaws in pavements, as well as measuring the response of different pavement designs to various loading characteristics.
2.3 MECHANISTIC ANALYSIS OF PAVEMENT RESPONSE 2.3.1 Multilayer Elastic Theory versus Finite Element Method
The layered elastic theory is the tool used most often to calculate flexible pavement response to truck loading. This is mainly due to its simplicity and to the fact that pavement engineers have been exposed to it since the 1940s. In 1943, Burmister developed a closed-form solution for a two-layered, linearly elastic, half-space problem, which was later extended to a three-layer system (Huang, 1993). Since then, and with advances in computer technology, the theory has been extended to deal with multilayer systems, and accordingly, a large number of computer programs have been developed such as KENPAVE, ELSYM, EVERSTRESS, and BISAR.
In the conventional flexible pavement design method using layered elastic theory, tire loading is assumed as stationary uniform vertical stress equal to tire inflation pressure within a circular contact area. This assumption is inconsistent with realistic tire–pavement loading conditions. The effect of this assumption on resulting pavement responses is minimal when considering the responses further from the surface, but the resulting errors can be very high near the pavement surface.
In comparison to the relatively simple layered elastic theory, the Finite Element Method (FEM) can be a complex and costly analysis tool. However, the application of FE techniques permits more accurate simulation of complex material properties and realistic tire loading. This method can consider almost all controlling parameters (three-dimensional tire–pavement imprint loading, discontinuities such as cracks and shoulder joints, viscoelastic and nonlinear elastic material properties, infinite and stiff foundations, system damping, quasi-static or dynamic analysis, crack propagation, and so forth). During the last decade, FE techniques have been used successfully to simulate different pavement problems that could not be modeled using the simpler multi-layer elastic theory (Zaghloul and White, 1993; Elseifi et al., 2006).
2.3.2 Tire–Pavement Interaction
The performance of flexible pavements is directly dependent on the magnitude and frequency of the applied wheel loads. These loads are transferred to the pavement structure through vehicles’ tires. Thus, the proper understanding of the interaction between tires and pavements is required for the analysis of the resulting stresses and strains in the pavement.
2.3.2.1 Contact Area
Two important factors should be considered regarding the tire–pavement interaction mechanism: contact area and contact stress. Many researchers used the circular or
6
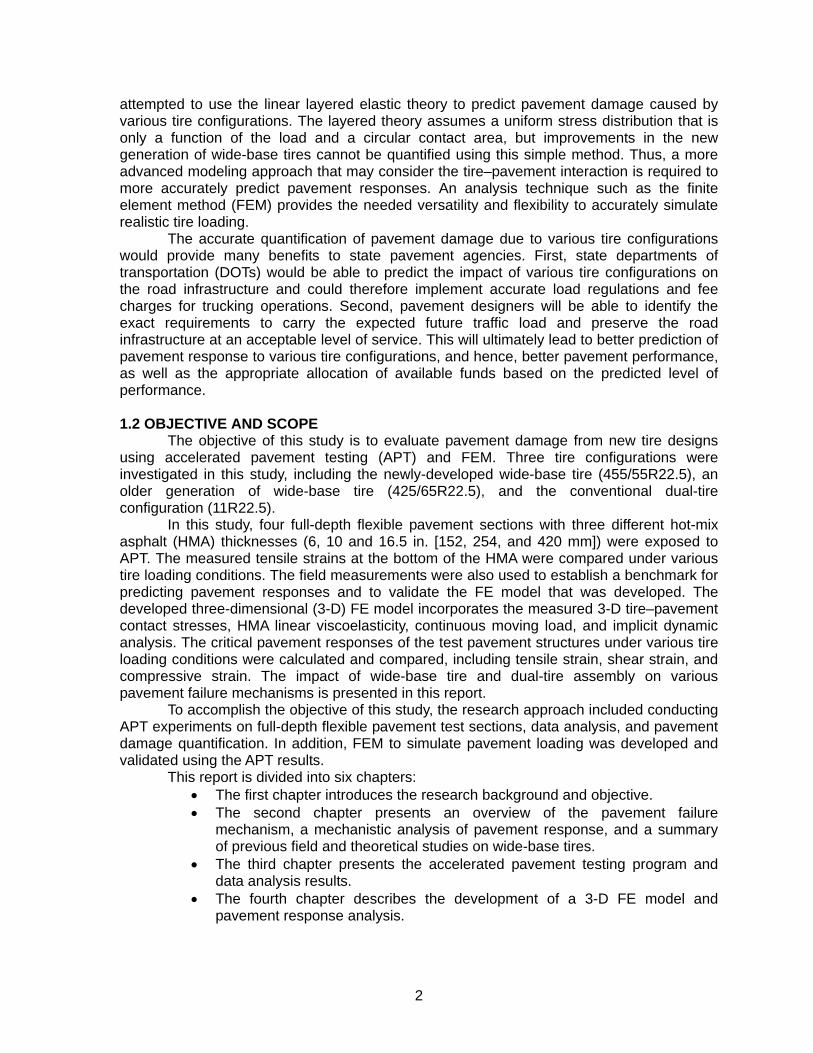
equivalent rectangular contact area in the pavement loading analysis (Huang, 1993). However, the contact area of a truck tire is in reality closer to a rectangular than a circular shape. It was also found that the length of the contact area depended primarily on the applied load, while the width remained almost constant. The gross contact area increased as the tire load increased, while the effect of the inflation pressure was not so significant (Tielking and Roberts, 1987; Weissman, 1999).
Figure 1 shows an example of measured tire imprint for a wide-base 445 tire (Al-Qadi et al., 2005). The rectangular contact area of each rib is clearly observed. Thus, both the circular and equivalent rectangular contact areas overestimate the net contact area without considering either the tread pattern of the tire or the localized stress distribution under each tire rib.
Figure 1. Tire imprints for a wide-base 445 tire.
2.3.2.2 Contact Stress
The tire loading is usually assumed to be only vertical loading on pavement surface. In reality, when a tire loading is applied to a pavement surface, three contact stress components are generated under each tire rib: vertical, transverse, and longitudinal. The vertical contact stresses are nonuniformly distributed due to the bending stiffness within the tire structure. The restricted inward movement of the tire ribs causes transverse stresses to develop, while the longitudinal stresses are primarily controlled by the tire–pavement friction forces (Tielking and Robert, 1987).
Marshek et al. (1986) first attempted to measure the distribution of the vertical contact stresses of a bias-ply tire using pressure-sensitive films. They found that the distributions were not uniform, and that the vertical pressures exceeded the inflation pressure in some areas. Ford and Yap (1990) measured the contact stresses for a slow-rolling tire over a strain gage transducer embedded in the flat road bed with the use of a specially instrumented flat bed machine. They found that at a constant load, the tire inflation pressure variation primarily affected the contact stresses in the central region of the contact area. In contrast, at a constant inflation pressure, the tire load variation explicitly influenced the contact stresses in the outer regions of the contact area.
De Beer and Fisher (1997) performed a comprehensive measurement of tire contact stresses using the Vehicle-Road Surface Pressure Transducer Array (VRSPTA); the data were later used by many researchers to predict pavement responses. The VPSPTA consists mainly of an array of tri-axial strain gauge steel pins fixed to a steel base plate, together with additional non-instrumented supporting pins, fixed flush with the road surface. This system is designed to take measurements at wheel speeds from 0.6 mph (1 km/h) up to 15 mph (25 km/h), and loads up to 45 kips (200 kN) (vertical) and 4.5 kips (20 kN) (horizontal). The following general equation was proposed to estimate three components of the contact stresses, where, K1, K2, and K3 are regression coefficients that are always positive numbers.
Contact stress = K1 + K2 × (inflation pressure) + K3 × (load) (1)
7
Myers et al. (1999) reported that the radial tire caused higher transverse stress than the bias ply tire, and the wide-base tire (Bridgestone M844) had the highest vertical and transverse stresses. They also found that the bias ply tire had the highest vertical stress at the shoulders of the tire; while the radial tire had the maximum contact stress at the center of the contact area which could be as high as 2.3 times the inflation pressure. Douglas et al. (2000) found that vertical contact stresses under the tire were extremely non-uniform when the load was heavy and the inflation pressure was low, and that longitudinal contact stresses at the trailing edge of the tire contact patch were significantly greater when the inflation pressure was low.
2.3.3 Effect of 3-D Contact Stresses on Pavement Responses
Previous researchers have shown that 3-D tire–pavement contact stresses significantly affect pavement responses. The actual tire-pavement contact stresses induce greater or smaller pavement responses, compared to the conventional uniform contact stress distribution, depending on tire loading conditions, material properties, pavement structures, and the type of response for comparison.
De Beer et al. (2002) found that pavement responses of thin HMA pavements were sensitive to vertical load shape and distribution. Siddharthan et al. (2002) found a significant difference between the responses computed with the uniform and non-uniform tire–pavement contact stress distributions. The difference is in the range of 6 to 30%, depending on many factors, such as the type of response, pavement structure (thin or thick), and tire type (dual or wide base). Romanoschi and Metcalf (2001), and Al-Qadi and Yoo (2007) reported that the surface tangential contact stresses might greatly affect pavement responses near the surface layer of HMA, and the effect diminishes as the depth increases. Park et al. (2005a) concluded that the predicted pavement fatigue life under the modified uniform load assumption (using measured tire contact area) shows better agreement with the predicted fatigue life under measured tire contact stresses, compared to the conventional uniform load assumption. Machemehl et al. (2005) found that the conventional uniform load assumption underestimated pavement responses at low tire pressures and overestimated pavement responses at high tire pressures. Prozzi and Luo (2005) found that the tensile strains in the HMA layer under actual contact stress were quite different from those under uniform contact stress.
The load-induced interfacial 3-D contact stresses between tire and pavement have been recognized as one of the main causes of the near-surface pavement damage, such as top-down cracking, near-surface cracking, and HMA rutting. The 3-D tire contact stresses result in a complex stress state near the pavement surface and increased potential for pavement damage.
Myers et al. (1998) concluded that the tensile stress under the treads of the loaded tire at the pavement surface induced by the shear stress of radial tires was responsible for causing top-down cracking. Groenendijk (1998) found that the combined influence of the non-uniform tensile contact stress and the aging of the HMA at the surface could result in critical tensile stress at the surface rather than the bottom of the HMA. Park et al. (2005b) found that the non-uniform contact stresses caused highly localized strains that could initiate rutting at the flexible pavement surface. The shear and vertical permanent strains became more concentrated as load and the non-uniformity increases. Drakos et al. (2001) and Novak et al. (2003) concluded that the 3-D tire-pavement contact stresses increased the HMA instability rutting potential. Al-Qadi et al. (2008a) found that the shear strain at the tire edge caused by 3-D tire contact stresses was an alternative parameter responsible for top-down cracking and/or near-surface cracking in thick pavement, including perpetual pavement.
8
2.3.4 Dynamic Analysis of Pavement Responses The load applied by a moving vehicle is the sum of the static load and a continuously
changing dynamic tire force. The dynamic tire force is the result of the vehicle’s response to longitudinal unevenness (roughness) of the road surface. Road profile, vehicle speed, vehicle mass, vehicle suspension system and tire parameters are the principal factors that affect the dynamic tire force. It is documented that structural dynamic response or dynamic amplification depends on the ratio of external loading frequency to natural frequency of the structure. Although few researchers have studied the natural frequency of pavement structure, the range of natural frequency is 6 to 14 Hz for the flexible pavement and 20 to 58 Hz for rigid pavement (Darestani et al., 2006; Uddin and Garza, 2003). Thus, dynamic analysis is important for pavement responses under some loading conditions. In addition, traffic loading on a highway is a dynamic phenomenon that involves the repeated application of moving wheel loads. The loading time changes at various pavement depths, and the principal stresses rotate in the pavement under a moving wheel load. It is of utmost importance to consider the effect of moving wheel load in the dynamic analysis of pavement responses.
Dynamic models of pavement structure vary in complexity according to the structure analyzed (finite beam, infinite plate, elastic or viscoelastic Winkler foundation, or viscoelastic layers) and the loading (stationary, moving, constant, harmonic, random). The solutions vary from closed-form expression using Fourier and Laplace transforms to numerical algorithms using direct-time integration methods, numerical convolution, and the method of complex response.
A comprehensive survey of the dynamic analysis of continuous supported beams and plates under a moving load using various classical approaches was made by Fryba (1972). Hardy and Cebon (1993) used a well-known convolution integral to study the pavement response to a moving load if the pavement response under impact loading was known a priori. A computer program (SAPSI) was developed by Monismith and his coworkers (Sousa et al., 1988) and used to compute the dynamic response of a viscoelastic layered system subjected to stationary circular load. A similar approach was used by Papagiannakis et al. (1996), and Sebaaly and Mamlouk (1989). The major limitation of this approach is the axisymmetric and stationary loading assumption. Siddharthan et al. (1998) used a continuum, finite-layer model to evaluate the pavement responses subjected to a moving surface load, and concluded that the dynamic effects of moving loads on pavement strain responses were important and should not be ignored. In this model, the pavement consists of many elastic or viscoelastic layers and the complex load condition is decomposed to many single harmonic pressure distributions.
Three-dimensional FE models have also been proposed for dynamic pavement analysis. Lourens (1992) showed that the stresses and deflections in the pavement structure differed substantially for static and dynamic loads. Zaghloul and White (1993) studied the dynamic response of flexible pavement and found close agreement between the results from ABAQUS and field measurements at three different speeds. Uddin et al. (1994) analyzed the dynamic deflection of cracked and uncracked pavements under falling weight deflectometer load using ABAQUS. Jooster and Lourens (1998) found that the effect of transient pavement analysis was equally important as the effect of non-uniform tire inflation pressure and viscoelastic effects. The relative differences between the responses from the static and dynamic models depend on the evaluation position and material stiffness. Sadd et al. (2005) analyzed the dynamic pavement responses using elastoplastic base and subgrade properties, and found that the deflection under the dynamic load condition was less than its corresponding value obtained from the static analysis. They concluded that this result was to be expected, since in the dynamic analysis, inertial, dissipative, and internal forces absorb the work done by externally applied forces. Yoo and Al-Qadi (2007) found that the dynamic

9
transient analysis induces greater strain responses and residual stresses, especially at high speed and low temperature.
2.4 IMPACT OF WIDE-BASE TIRES ON FLEXIBLE PAVEMENT DAMAGE 2.4.1 Early and New Generation of Wide-base Tires
Attempts to use wide-base tires instead of conventional dual-tire assembly started in the early 1980s in Europe and in Canada. The early generation of wide-base tires (385 and 425) significantly increases the contact stresses on the pavement surface due to a smaller contact area compared to dual-tire assemblies. In addition, the early generation of wide-base tires requires a high inflation pressure—115 to 130 psi (790 to 900 kPa), to carry a 34- kip (151-kN) tandem-axle load. Not surprisingly, then, the first generations of wide-base tires were found to cause a significant increase in pavement damage compared to dual-tire assemblies (Bonaquist, 1992).
Recent advances in tire technology have led to the design of wide-base tires with wider ribs and improved tire structure design. This new generation of wide-base tire (445 and 455) is 15 to 18% wider than the conventional one, respectively, and is optimized for a tandem axle load of 34 kips (151 kN) at a nominal inflation pressure of 100 psi (690 kPa). This new design results in a wider and flatter transverse profile, which provides a more uniform pressure distribution. Figure 2 compares the new generation of wide-base tire to a conventional wide-base tire and to a single tire commonly used in dual-tire assemblies. Figure 3 shows the average contact stress at the pavement surface for the maximum allowable loading conditions in the United States for various tire sizes. As shown in Figure 3, the new generation of wide-base tires (445/50R22.5 and 455/55R22.5) results in a load distribution comparable to dual tires. Conventional wide-base tires, on the other hand, result in significantly greater contact stresses at the pavement surface; a 27% increase in the average contact stresses than that of dual tires.
(a) (b)
Figure 2. Comparison (a) between the new-generation and conventional wide-base tire (b) and to a single tire commonly used in dual-tire assembly.

10
102 106 103 99
130 128
0
30
60
90
120
150
Dua
l Driv
e(2
75/8
0R22
.5)
Dua
l Ste
er(2
75/8
0R22
.5)
New
Wid
e-ba
se(4
45/5
0R22
.5)
New
Wid
e-ba
se(4
55/5
5R22
.5)
Old
Wid
e-ba
se(3
85/6
5R22
.5)
New
Wid
e-ba
se(4
25/6
5R22
.5)
Tire Dimensions
Ave
rage
Con
tact
Stre
ss (p
si)
Figure 3. Average vertical contact stress at pavement surface for maximum loading
conditions in the U.S. for various tire sizes. 2.4.2 Experimental Studies
Due to expense, field testing involving trucks equipped with wide-base tires has rarely been performed. However, to evaluate the effect of truck loading parameters on pavement damage, APT provides an acceptable middle ground between real pavement loading in the field and laboratory tests. During field testing or APT, the pavement responses under various tire loading can be measured using pavement instrumentations, including strains, stresses, and deflections. In-situ measurements of these parameters allow for the comparison of pavement responses and long-term performance under various tire configurations. Table 1 summarizes the field testing and APT related to wide-base tire research.
These studies have shown variability in their results given the difference in pavement designs, the distresses considered, vehicle speeds, tire configurations, and loading conditions. In addition, field measurements are an inevitable source of errors because of variable environmental conditions during testing and the lateral offset of the tire from the instruments. Previous research results indicate that the damage caused by wide-base tire is strongly dependent on the tire type (width and structure). In general, the pavement damage, caused by wide-base tires, decreases as the tire width increases. The first generation of wide-base tire (385 and 425) was found to cause 1.5 to 2.0 times more rut depth and 2.0 to 4.0 times more fatigue cracking than a dual-tire assembly when carrying the same load. The new generation of wide-base tires (445 and 455) was found to cause significantly less pavement damage compared to the first generation of wide-base tires.
2.4.3 Theoretical Studies
Most analyses of pavement subjected to wide-base tire loading are based on either multilayer elastic theory (MLE) or FEM. In general, in using MLE or FEM, tensile strains and

11
compressive strains are calculated and the relative damage between wide-base tire and dual-tire assembly are evaluated. Table 2 presents an outline of these analysis methods used in previous research.
Although the analytical approaches have been different, most of the research on the wide-base tire has basically used the static uniform tire loading assumption applied on a circular contact area. This is inconsistent with the dynamic transient moving load experienced in the field, and could result in an erroneous pavement response calculation. Some researchers have used circular loaded areas and a constant radial shear stress distribution with radial symmetry. However, this method does not conform to the realistic tire loading condition. The contact area under truck tire loading is in reality closer to rectangular than circular. The circular contact area does not consider the tread pattern of the tire, or the localized stress distribution under each tire rib (non-uniform vertical stress and transverse tangential stress). These localized 3-D tire contact stresses could result in a complex stress state near the pavement surface and increases in the potential for pavement damage, including top-down cracking, near-surface cracking, and HMA rutting., It is therefore necessary to incorporate the accurate contact stress distributions into the pavement response analysis, especially when the objective is to quantify the pavement damage caused by various tire configurations.
Table 1. Field Testing and APT for Wide-Base Tire Research
Source Tire Pavement structure
Instrumentation and/or measurements
Huhtala et al. (1989)
355/75R22.5 385/65R22.5 445/65R22.5
3-in. and 6-in. HMA
Strain gauge
Sebaaly and Tabatabaee
(1989)
385/65R22.5 425/65R22.5
6-in. and 10-in. HMA
Strain gauge Surface deflections
Bonaquist (1992) 425/65R22.5 3.5-in. and 7.0-in. HMA
Strain gauge Rutting depth
Akram et al. (1992)
425/65R22.5 1.5-in. and 7.0-in. HMA
Multiple depth deflectometer
COST 334 (2001) 385/45R22.5495/45R22.5
Variable HMA thicknesses
(4-in. to 19-in.)
Strain gauge Rutting depth
Al-Qadi et al. (2002)
445/50R22.5455/55R22.5
7.4-in. HMA with cement- treated base
Strain gauge Pressure cell
Pierre et al. (2003) 385/65R22.5 455/55R22.5
4-in. HMA Fiber-optic strain gauges, Multilevel
deflectometer Priest et al. (2005) 445/50R22.5 7-in. HMA Strain gauge
Pressure cell

12
Table 2. Mechanistic Analysis Methods Used for Wide-Base Tire Research Source Tire Analysis Tool Contact Stresses Loading
Deacon (1969)
Single tire of dual-tire assembly MLE
Circular Uniform Vertical
Static
Hallin et al. (1983)
Tire widths of 10, 15, and 18 in.
MLE FEM
Circular Uniform Vertical
Static
Perdomo and Nokes (1993)
16R22.5 18R22.5
MLE (CIRCLY)
Circular Nonuniform Shear stress
Static
Gillespie et al. (1993)
Single 11R22.5, 215/75R17.5 etc.
MLE (VESYSDYN)
Circular Uniform Vertical
Static
COST 334 (2001)
385/45R22.5 495/45R22.5
MLE FEM
Square Uniform Vertical
Static
Al-Qadi et al. (2002)
445/50R22.5 and 455/55R22.5 FEM
Square Trapezoidal
Vertical Static
Siddharthan et al. (2002) 425/65R22.5 Finite-Layer
(3D Move) Circular
Nonuniform Shear stress
Dynamic
Kim et al. (2005) 425/65R22.5 FEM
Square Uniform and Trapezoidal
Static Dynamic
Al-Qadi et al. (2008a) 455/55R22.5 FEM
Moving load and 3D contact stresses
Dynamic
2.5 SUMMARY
Evaluation of pavement damage caused by various tire configurations may be based on either experimental or theoretical approaches, or on a combination of both. Considerable variability has been observed in the results of previous studies, given the differences in pavement design, the distresses considered, and the speed, tire configurations, and loading conditions. Also, field measurements are an inevitable source of errors because of variable environmental conditions during testing and the lateral offset of the tire from the instruments. Previous research has indicated that the damage caused by the wide-base tire is strongly dependent on the tire type (geometry and structure). In general, the pavement damage caused by the wide-base tire decreases as the tire width increases.
Although theoretical calculations using the layered elastic theory are relatively inexpensive and simple, the reliability of the results is questionable due to the use of several assumptions. For example, uniform pressure distribution and circular contact area are assumptions that barely resemble reality, especially when the objective is to quantify the pavement damage caused by different tire configurations. Thus, a detailed modeling approach that can consider accurate tire–pavement interaction is essential to improving the accuracy of pavement damage prediction.

13
CHAPTER 3 EXPERIMENTAL PROGRAM
3.1 TEST SECTIONS The experimental program made use of existing HMA test sections built as part of an
extended-life pavement project (Carpenter, 2008). These sections included various full-depth HMA pavement designs that are widely encountered on high-priority routes. The full-depth asphalt pavement is composed of HMA layers directly over a lime-stabilized subgrade. The test sections included three HMA thicknesses: 6, 10, and 16.5 in. (152, 254, and 420 mm). Figure 4 shows the layout and cross sections of the test sections.
12'
65'30'30'65'30'30'65'65'50' 40'
4"
2"
4"
2.5"
3.5"
2.25"2.25"
2"
12"
Figure 4. General layout of the full-depth HMA pavement test sections.
The HMA was prepared in accordance with the Superpave™ volumetric design procedure. The laboratory mix–design criterion is based on 90 gyrations to achieve 4% air void (2.5% for rich bottom binder course); N85 for Stone Matrix Asphalt (SMA). Three asphalt binders were used in the HMA layers: a PG 64-22 for standard binder and rich bottom binder courses, an SBS PG 70-22 for polymer-modified binder courses and dense graded surface, and an SBS PG 76-28 for SMA surface course. The asphalt contents of the standard and polymer-modified binder and rich bottom binder courses are 4.5% and 5.1%, respectively; while the dense-graded and SMA asphalt content is 5.4%. No liquid anti-strips were used in any mixture. The aggregate used in all mixes is limestone; however, steel slag was used as coarse aggregate in SMA. The subgrade is lime-stabilized to address the high water content existing in the natural soil. 3.2 PAVEMENT INSTRUMENTATION
One of the most critical responses considered in flexible pavements is the horizontal strain at the bottom of the HMA layer. Longitudinal and transverse strain measurements were obtained at the stabilized subgrade–HMA interface using an H-shape strain gauge. The strain gauge has a 120 Ohm resistance with a gauge factor of 2 and can measure up to
14
2000 microstrains. Three strain gauges were placed along the centerline of each test section, at approximately the center of the section. Two of the gauges were placed laterally, and the third was placed longitudinally. These gauges were embedded in a thin layer of polymer-modified mix that was scalped to produce a sand-sized mix.
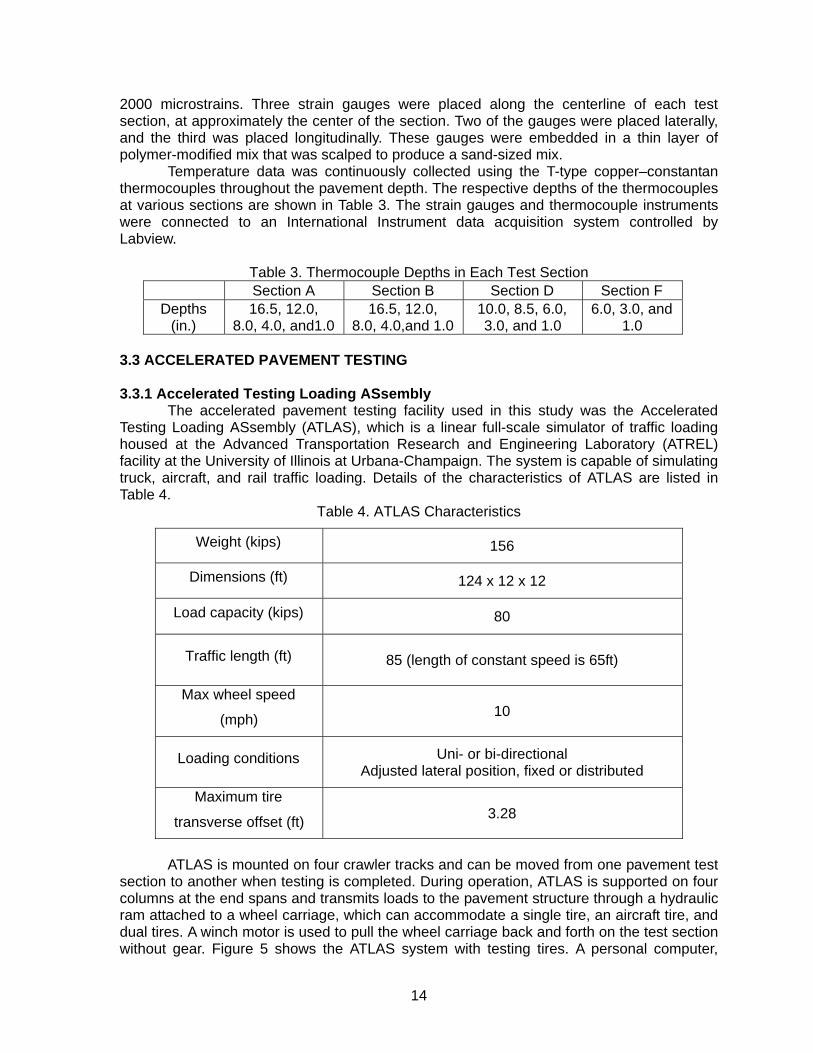
Temperature data was continuously collected using the T-type copper–constantan thermocouples throughout the pavement depth. The respective depths of the thermocouples at various sections are shown in Table 3. The strain gauges and thermocouple instruments were connected to an International Instrument data acquisition system controlled by Labview.
Table 3. Thermocouple Depths in Each Test Section Section A Section B Section D Section F
Depths (in.)
16.5, 12.0, 8.0, 4.0, and1.0
16.5, 12.0,8.0, 4.0,and 1.0
10.0, 8.5, 6.0, 3.0, and 1.0
6.0, 3.0, and 1.0
3.3 ACCELERATED PAVEMENT TESTING 3.3.1 Accelerated Testing Loading ASsembly
The accelerated pavement testing facility used in this study was the Accelerated Testing Loading ASsembly (ATLAS), which is a linear full-scale simulator of traffic loading housed at the Advanced Transportation Research and Engineering Laboratory (ATREL) facility at the University of Illinois at Urbana-Champaign. The system is capable of simulating truck, aircraft, and rail traffic loading. Details of the characteristics of ATLAS are listed in Table 4.
Table 4. ATLAS Characteristics
Weight (kips) 156
Dimensions (ft) 124 x 12 x 12
Load capacity (kips) 80
Traffic length (ft) 85 (length of constant speed is 65ft)
Max wheel speed
(mph) 10
Loading conditions Uni- or bi-directional Adjusted lateral position, fixed or distributed
Maximum tire
transverse offset (ft) 3.28
ATLAS is mounted on four crawler tracks and can be moved from one pavement test
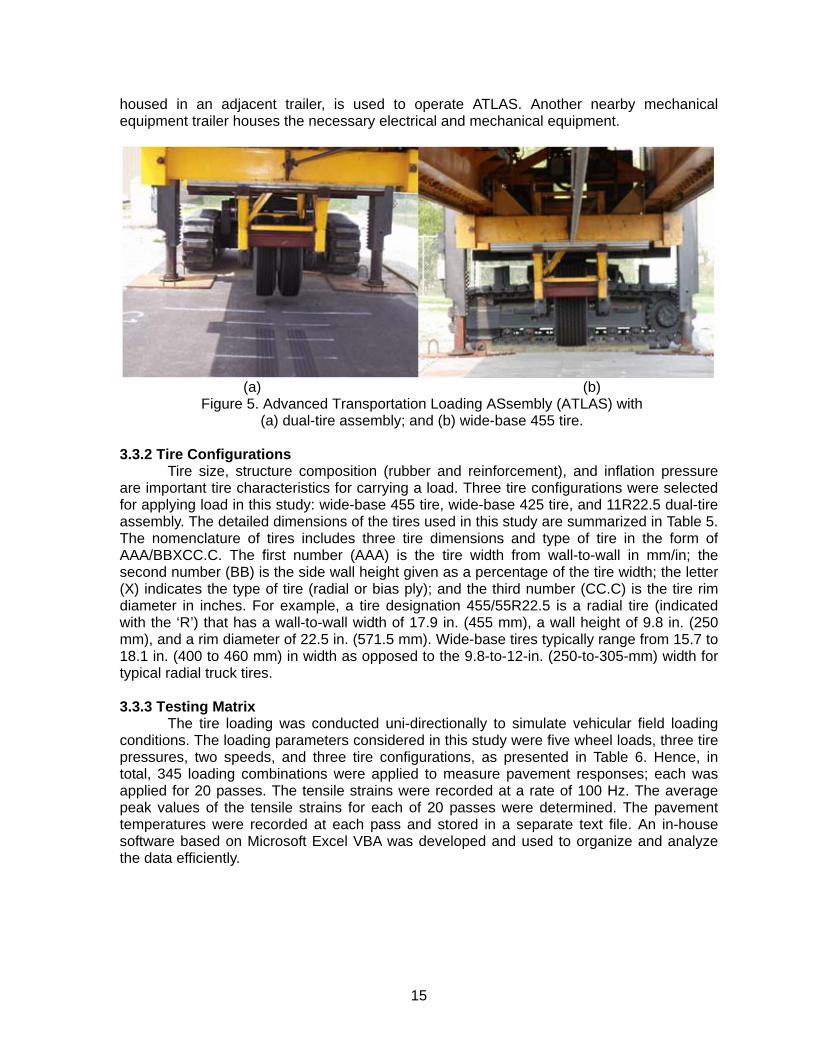
section to another when testing is completed. During operation, ATLAS is supported on four columns at the end spans and transmits loads to the pavement structure through a hydraulic ram attached to a wheel carriage, which can accommodate a single tire, an aircraft tire, and dual tires. A winch motor is used to pull the wheel carriage back and forth on the test section without gear. Figure 5 shows the ATLAS system with testing tires. A personal computer,
15
housed in an adjacent trailer, is used to operate ATLAS. Another nearby mechanical equipment trailer houses the necessary electrical and mechanical equipment.
(a) (b)
Figure 5. Advanced Transportation Loading ASsembly (ATLAS) with (a) dual-tire assembly; and (b) wide-base 455 tire.
3.3.2 Tire Configurations
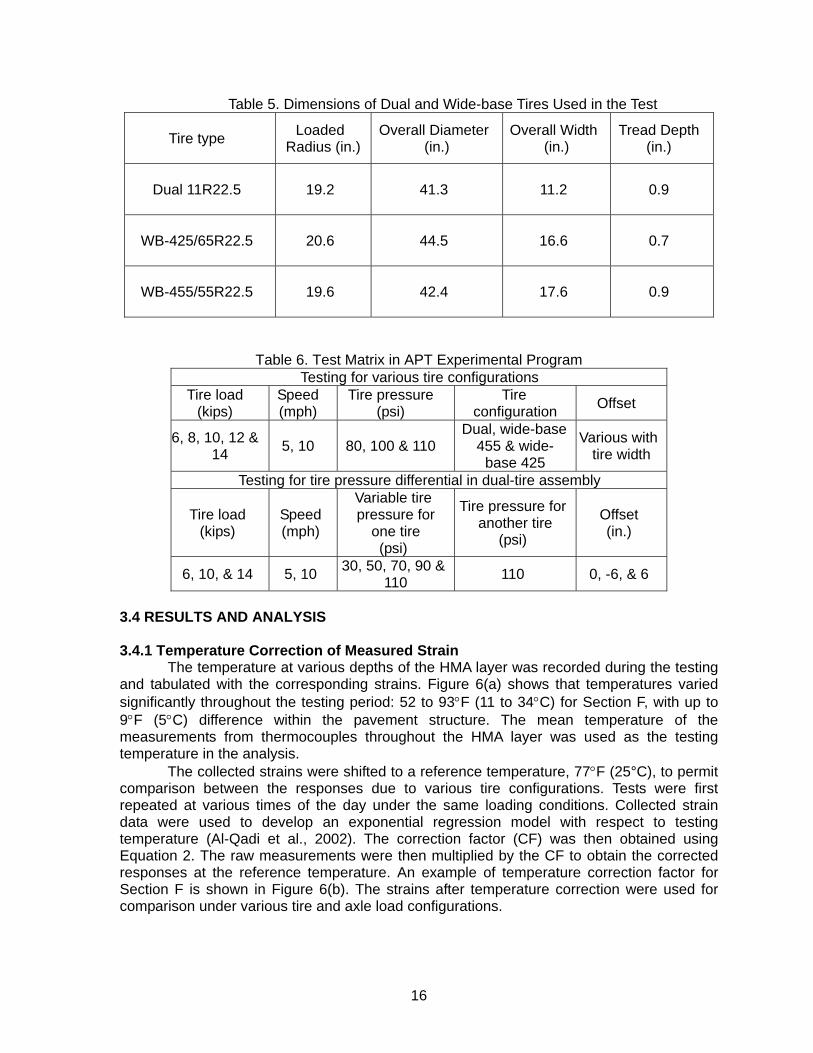
Tire size, structure composition (rubber and reinforcement), and inflation pressure are important tire characteristics for carrying a load. Three tire configurations were selected for applying load in this study: wide-base 455 tire, wide-base 425 tire, and 11R22.5 dual-tire assembly. The detailed dimensions of the tires used in this study are summarized in Table 5. The nomenclature of tires includes three tire dimensions and type of tire in the form of AAA/BBXCC.C. The first number (AAA) is the tire width from wall-to-wall in mm/in; the second number (BB) is the side wall height given as a percentage of the tire width; the letter (X) indicates the type of tire (radial or bias ply); and the third number (CC.C) is the tire rim diameter in inches. For example, a tire designation 455/55R22.5 is a radial tire (indicated with the ‘R’) that has a wall-to-wall width of 17.9 in. (455 mm), a wall height of 9.8 in. (250 mm), and a rim diameter of 22.5 in. (571.5 mm). Wide-base tires typically range from 15.7 to 18.1 in. (400 to 460 mm) in width as opposed to the 9.8-to-12-in. (250-to-305-mm) width for typical radial truck tires.
3.3.3 Testing Matrix
The tire loading was conducted uni-directionally to simulate vehicular field loading conditions. The loading parameters considered in this study were five wheel loads, three tire pressures, two speeds, and three tire configurations, as presented in Table 6. Hence, in total, 345 loading combinations were applied to measure pavement responses; each was applied for 20 passes. The tensile strains were recorded at a rate of 100 Hz. The average peak values of the tensile strains for each of 20 passes were determined. The pavement temperatures were recorded at each pass and stored in a separate text file. An in-house software based on Microsoft Excel VBA was developed and used to organize and analyze the data efficiently.
16
Table 5. Dimensions of Dual and Wide-base Tires Used in the Test
Tire type Loaded Radius (in.)
Overall Diameter (in.)
Overall Width (in.)
Tread Depth (in.)
Dual 11R22.5 19.2 41.3 11.2 0.9
WB-425/65R22.5 20.6 44.5 16.6 0.7
WB-455/55R22.5 19.6 42.4 17.6 0.9
Table 6. Test Matrix in APT Experimental Program Testing for various tire configurations
Tire load (kips)
Speed (mph)
Tire pressure (psi)
Tire configuration Offset
6, 8, 10, 12 & 14 5, 10 80, 100 & 110
Dual, wide-base 455 & wide-
base 425
Various with tire width
Testing for tire pressure differential in dual-tire assembly
Tire load (kips)
Speed (mph)
Variable tire pressure for
one tire (psi)
Tire pressure for another tire
(psi)
Offset (in.)
6, 10, & 14 5, 10 30, 50, 70, 90 & 110 110 0, -6, & 6
3.4 RESULTS AND ANALYSIS 3.4.1 Temperature Correction of Measured Strain
The temperature at various depths of the HMA layer was recorded during the testing and tabulated with the corresponding strains. Figure 6(a) shows that temperatures varied significantly throughout the testing period: 52 to 93°F (11 to 34°C) for Section F, with up to 9°F (5°C) difference within the pavement structure. The mean temperature of the measurements from thermocouples throughout the HMA layer was used as the testing temperature in the analysis.
The collected strains were shifted to a reference temperature, 77°F (25°C), to permit comparison between the responses due to various tire configurations. Tests were first repeated at various times of the day under the same loading conditions. Collected strain data were used to develop an exponential regression model with respect to testing temperature (Al-Qadi et al., 2002). The correction factor (CF) was then obtained using Equation 2. The raw measurements were then multiplied by the CF to obtain the corrected responses at the reference temperature. An example of temperature correction factor for Section F is shown in Figure 6(b). The strains after temperature correction were used for comparison under various tire and axle load configurations.

17
etemperaturtestingatresponseFetemperaturreferenceatresponseFactorCorrection
o
)77( = (2)
(a)
CF = exp -0.0372(T-77)R2 = 0.99
0
1
2
3
40 50 60 70 80 90
Temperature (°F)
Cor
rect
ion
Fact
or
(b)
Figure 6. (a) Temperature profile through the HMA layer; and (b) temperature correction factor for Section F.
3.4.2 Dynamic Strain Responses
The measured dynamic longitudinal and transverse strain pulses at the bottom of the HMA layer for dual-tire assembly at Section D (10 mph [16 km/h] speed, 8 kips [35.5 kN] load, and 100 psi [690 kPa] inflation pressure at 77oF [25°C]) are shown in Figure 7. The strain pulse clearly demonstrates the viscoelastic behavior of HMA: relaxation with time and asymmetry of the response.

18
As expected, the longitudinal strain was composed of a compressive part followed by a tensile part. This may be explained as follows: When the tire moves toward the longitudinal strain gauge, tension results directly beneath the tire and compresses at the gauge location due to bending and compression shear resulting from the wheel traction with HMA surface. Hence, compression strain is developed at the strain gauge location. When the tire is directly above the strain gauge, bending tension takes place with no shear. As the tire moves away from the gauge, compression bending and shear tension due to surface–tire traction results, which may be balanced to zero. On the other hand, the transverse strain is composed of only a tensile part. The tension increases when the tire approaches the transverse strain gauge, which means more load was distributed on the gauge location. Thus, a relatively longer tensile time period is spent during the transverse strain compared to the longitudinal strain.
-40
-20
0
20
40
60
80
100
1.5 2 2.5 3 3.5
Time (sec)
Stra
in a
t Sec
tion
D (m
icro
)
Transverse Strain
Longitudinal Strain
Figure 7. Measured transverse and longitudinal strains at the bottom of the HMA layer at
Section D under one tire center of dual-tire assembly. The maximum strain, which is defined as the difference between the peak response
and zero, was calculated under various loading conditions. As expected, the maximum longitudinal and transverse tensile strains are located directly under the center of a single wide-base tire. However, for a dual-tire assembly, the maximum transverse tensile strain is located under one tire center, and the longitudinal tensile stain under the center of a dual-tire assembly is similar to that under one tire center.
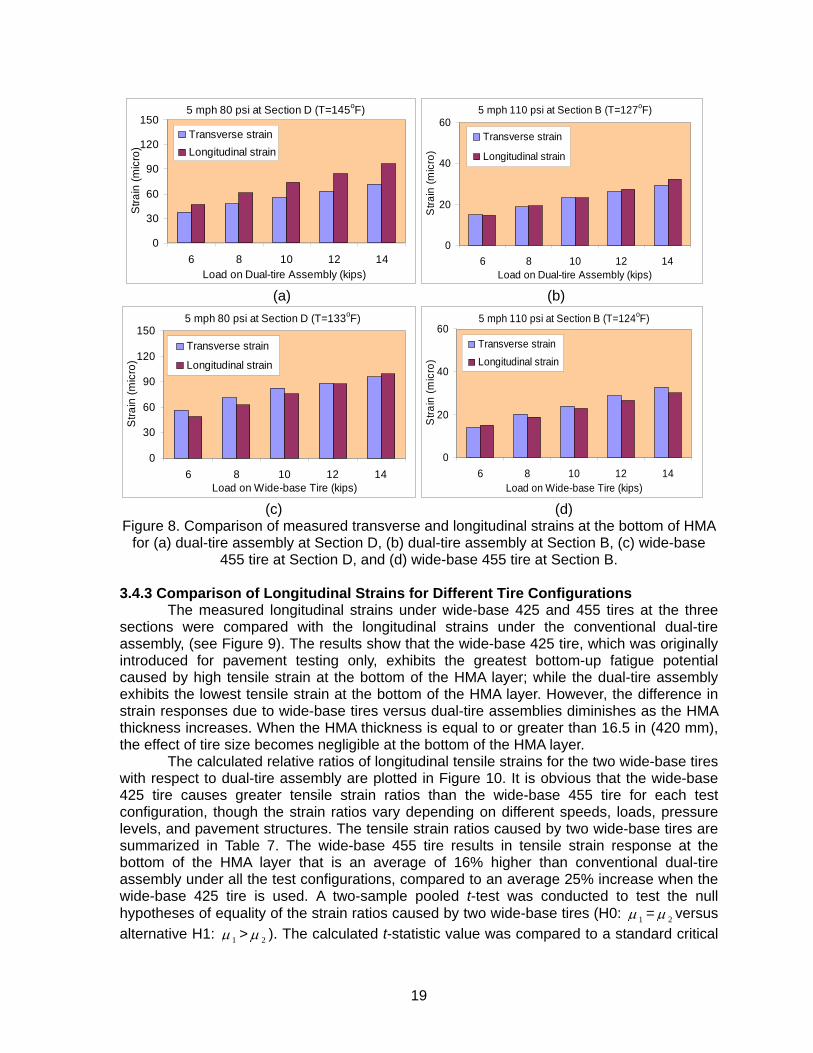
The measured maximum transverse and longitudinal tensile strains at Sections D and B (the transverse strain gauges were not functional at testing for Section F) are shown in Figures 8(a), (b), (c), and (d), respectively, for dual-tire assembly and wide-base 455 tires. It is clearly shown that the longitudinal strains are greater than the transverse strains under the dual-tire assembly. The difference diminishes as the pavement thickness increases. This is consistent with previous findings (Al-Qadi et al., 2002). For the wide-base tire, the transverse strains are similar to, or a little greater than, the longitudinal strains due to the single tire loading. In addition, the longitudinal strain is less affected than the transverse strain by the relative distance between the tire center and strain gauge location; hence, the longitudinal strain was selected as the critical strain for bottom-up fatigue cracking.
19
5 mph 80 psi at Section D (T=145oF)
0
30
60
90
120
150
6 8 10 12 14Load on Dual-tire Assembly (kips)
Stra
in (m
icro
)Transverse strainLongitudinal strain
5 mph 110 psi at Section B (T=127oF)
0
20
40
60
6 8 10 12 14Load on Dual-tire Assembly (kips)
Stra
in (m
icro
)
Transverse strain
Longitudinal strain
(a) (b)
5 mph 80 psi at Section D (T=133oF)
0
30
60
90
120
150
6 8 10 12 14Load on Wide-base Tire (kips)
Stra
in (m
icro
)
Transverse strain
Longitudinal strain
5 mph 110 psi at Section B (T=124oF)
0
20
40
60
6 8 10 12 14Load on Wide-base Tire (kips)
Stra
in (m
icro
)
Transverse strainLongitudinal strain
(c) (d)
Figure 8. Comparison of measured transverse and longitudinal strains at the bottom of HMA for (a) dual-tire assembly at Section D, (b) dual-tire assembly at Section B, (c) wide-base
455 tire at Section D, and (d) wide-base 455 tire at Section B. 3.4.3 Comparison of Longitudinal Strains for Different Tire Configurations
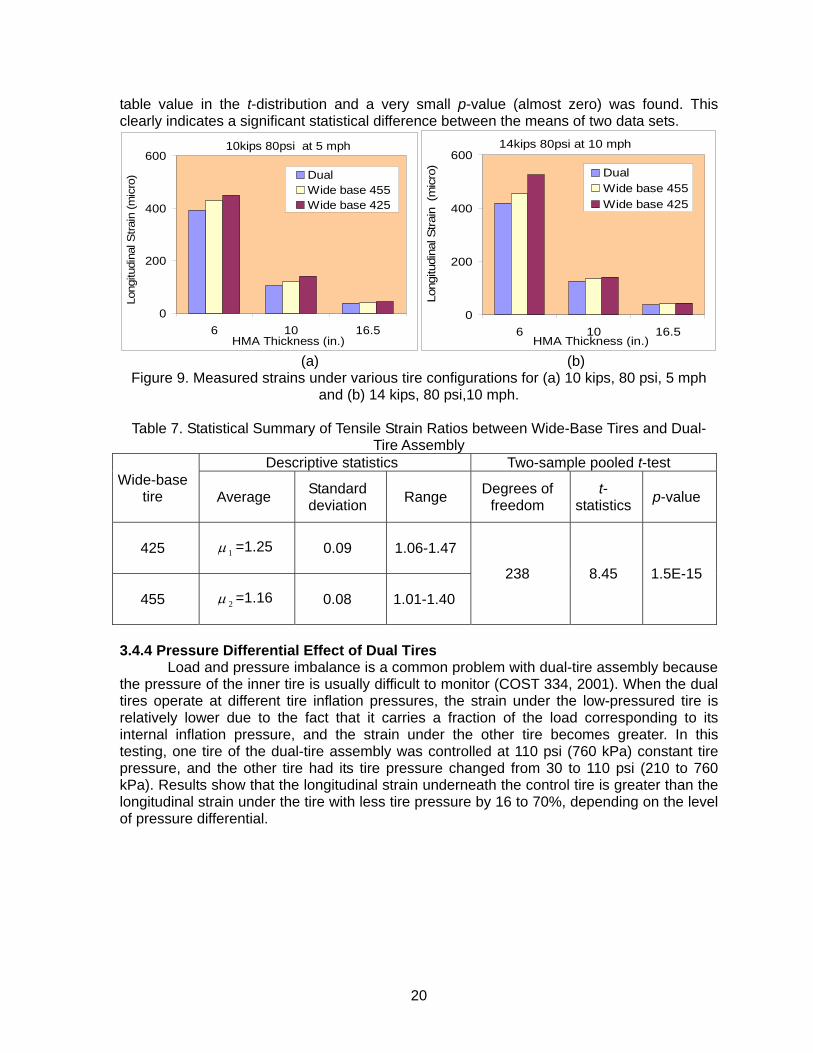
The measured longitudinal strains under wide-base 425 and 455 tires at the three sections were compared with the longitudinal strains under the conventional dual-tire assembly, (see Figure 9). The results show that the wide-base 425 tire, which was originally introduced for pavement testing only, exhibits the greatest bottom-up fatigue potential caused by high tensile strain at the bottom of the HMA layer; while the dual-tire assembly exhibits the lowest tensile strain at the bottom of the HMA layer. However, the difference in strain responses due to wide-base tires versus dual-tire assemblies diminishes as the HMA thickness increases. When the HMA thickness is equal to or greater than 16.5 in (420 mm), the effect of tire size becomes negligible at the bottom of the HMA layer.
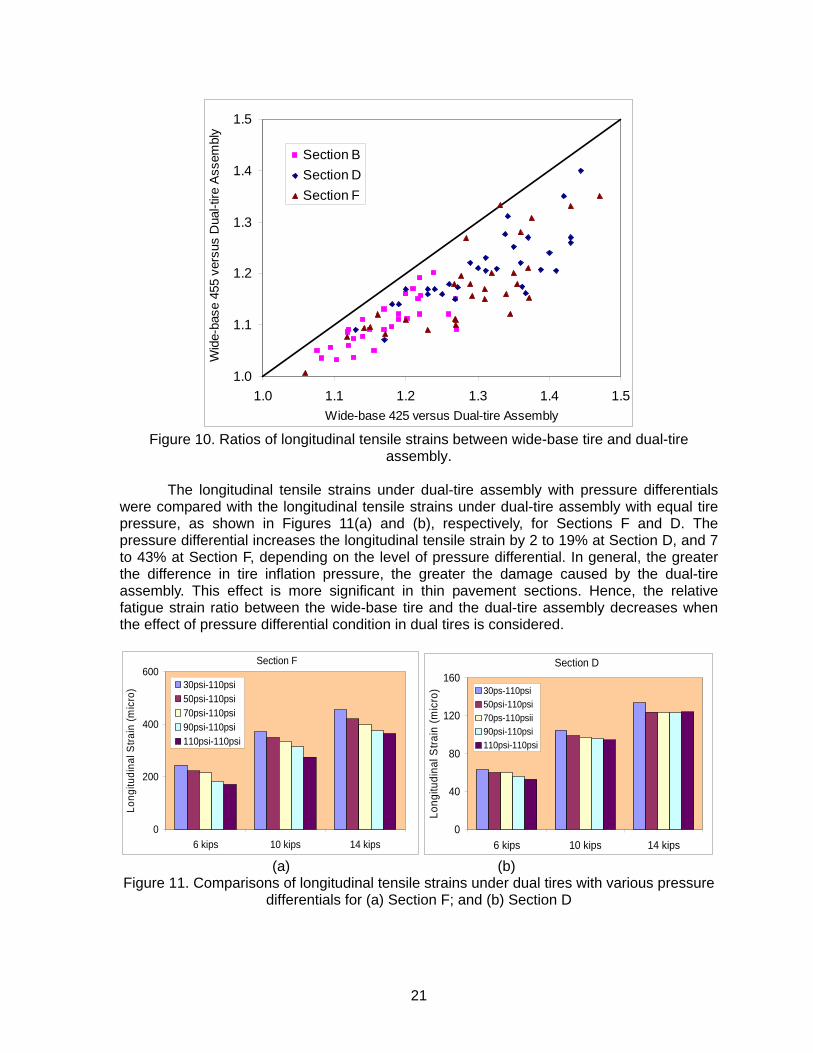
The calculated relative ratios of longitudinal tensile strains for the two wide-base tires with respect to dual-tire assembly are plotted in Figure 10. It is obvious that the wide-base 425 tire causes greater tensile strain ratios than the wide-base 455 tire for each test configuration, though the strain ratios vary depending on different speeds, loads, pressure levels, and pavement structures. The tensile strain ratios caused by two wide-base tires are summarized in Table 7. The wide-base 455 tire results in tensile strain response at the bottom of the HMA layer that is an average of 16% higher than conventional dual-tire assembly under all the test configurations, compared to an average 25% increase when the wide-base 425 tire is used. A two-sample pooled t-test was conducted to test the null hypotheses of equality of the strain ratios caused by two wide-base tires (H0: 1μ = 2μ versus alternative H1: 1μ > 2μ ). The calculated t-statistic value was compared to a standard critical
20
table value in the t-distribution and a very small p-value (almost zero) was found. This clearly indicates a significant statistical difference between the means of two data sets.
10kips 80psi at 5 mph
0
200
400
600
6 10 16.5HMA Thickness (in.)
Long
itudi
nal S
train
(mic
ro) Dual
Wide base 455Wide base 425
14kips 80psi at 10 mph
0
200
400
600
6 10 16.5HMA Thickness (in.)
Long
itudi
nal S
train
(m
icro
) DualWide base 455Wide base 425
(a) (b)
Figure 9. Measured strains under various tire configurations for (a) 10 kips, 80 psi, 5 mph and (b) 14 kips, 80 psi,10 mph.
Table 7. Statistical Summary of Tensile Strain Ratios between Wide-Base Tires and Dual-
Tire Assembly
Wide-base tire
Descriptive statistics Two-sample pooled t-test
Average Standard deviation Range Degrees of
freedom t-
statistics p-value
425 1μ =1.25 0.09 1.06-1.47
238 8.45 1.5E-15
455 2μ =1.16 0.08 1.01-1.40
3.4.4 Pressure Differential Effect of Dual Tires
Load and pressure imbalance is a common problem with dual-tire assembly because the pressure of the inner tire is usually difficult to monitor (COST 334, 2001). When the dual tires operate at different tire inflation pressures, the strain under the low-pressured tire is relatively lower due to the fact that it carries a fraction of the load corresponding to its internal inflation pressure, and the strain under the other tire becomes greater. In this testing, one tire of the dual-tire assembly was controlled at 110 psi (760 kPa) constant tire pressure, and the other tire had its tire pressure changed from 30 to 110 psi (210 to 760 kPa). Results show that the longitudinal strain underneath the control tire is greater than the longitudinal strain under the tire with less tire pressure by 16 to 70%, depending on the level of pressure differential.
21
1.0
1.1
1.2
1.3
1.4
1.5
1.0 1.1 1.2 1.3 1.4 1.5Wide-base 425 versus Dual-tire Assembly
Wid
e-ba
se 4
55 v
ersu
s D
ual-t
ire A
ssem
bly
Section BSection DSection F
Figure 10. Ratios of longitudinal tensile strains between wide-base tire and dual-tire
assembly. The longitudinal tensile strains under dual-tire assembly with pressure differentials
were compared with the longitudinal tensile strains under dual-tire assembly with equal tire pressure, as shown in Figures 11(a) and (b), respectively, for Sections F and D. The pressure differential increases the longitudinal tensile strain by 2 to 19% at Section D, and 7 to 43% at Section F, depending on the level of pressure differential. In general, the greater the difference in tire inflation pressure, the greater the damage caused by the dual-tire assembly. This effect is more significant in thin pavement sections. Hence, the relative fatigue strain ratio between the wide-base tire and the dual-tire assembly decreases when the effect of pressure differential condition in dual tires is considered.
Section F
0
200
400
600
6 kips 10 kips 14 kips
Long
itudi
nal S
train
(mic
ro) 30psi-110psi
50psi-110psi70psi-110psi90psi-110psi110psi-110psi
Section D
0
40
80
120
160
6 kips 10 kips 14 kips
Long
itudi
nal S
train
(mic
ro) 30ps-110psi
50psi-110psi70ps-110psii90psi-110psi110psi-110psi
(a) (b) Figure 11. Comparisons of longitudinal tensile strains under dual tires with various pressure
differentials for (a) Section F; and (b) Section D

22
3.4.5 Effect of Wheel Load Highway traffic consists of an array of vehicles with various weights and axle
configurations. The measured strain response under different wheel loads from 6 to 14 kips (26.6 to 62.2 kN) at 5 mph (8 km/h) and 110 psi (760 kPa) tire pressure for Section F are plotted in Figure 12. As would be expected, the longitudinal strain responses increase linearly with the load regardless of tire configurations.
5 mph 110 psi at Section F
0
200
400
600
6 kips 8 kips 10 kips 12 kips 14 kips
Long
itudi
nal S
train
(mic
ro)
Dual-tire AssemblyWide-base 455Wide-base 425
y = 27.3x + 35.4
y = 28.6x + 66.0y = 34.7x + 59.9
0
200
400
600
5 10 15 20Load (kips)
Long
itudi
nal S
train
(mic
ro)
Dual-tire assemblyWide-base 455Wide-base 425
(a) (b)
Figure 12. Measured strains under different wheel loads at Section F The effect of overweight truck loading was evaluated using the load equivalence
factor (LEF) in terms of the damage it causes. The load damage exponent (n) was calculated as the exponent between the ratio of damage life and the ratio of load magnitudes, Equation 3 (Chen et al., 2006).
n
ijji PPNNLEF )/(/ == (3) where, LEF = load equivalency factor for the fatigue damage;
iP = magnitude of load;
iN = number of loads with magnitude iP to cause failure; and n = load damage exponent for the specific structure distress. The measured longitudinal tensile strains at the bottom of the HMA layer under
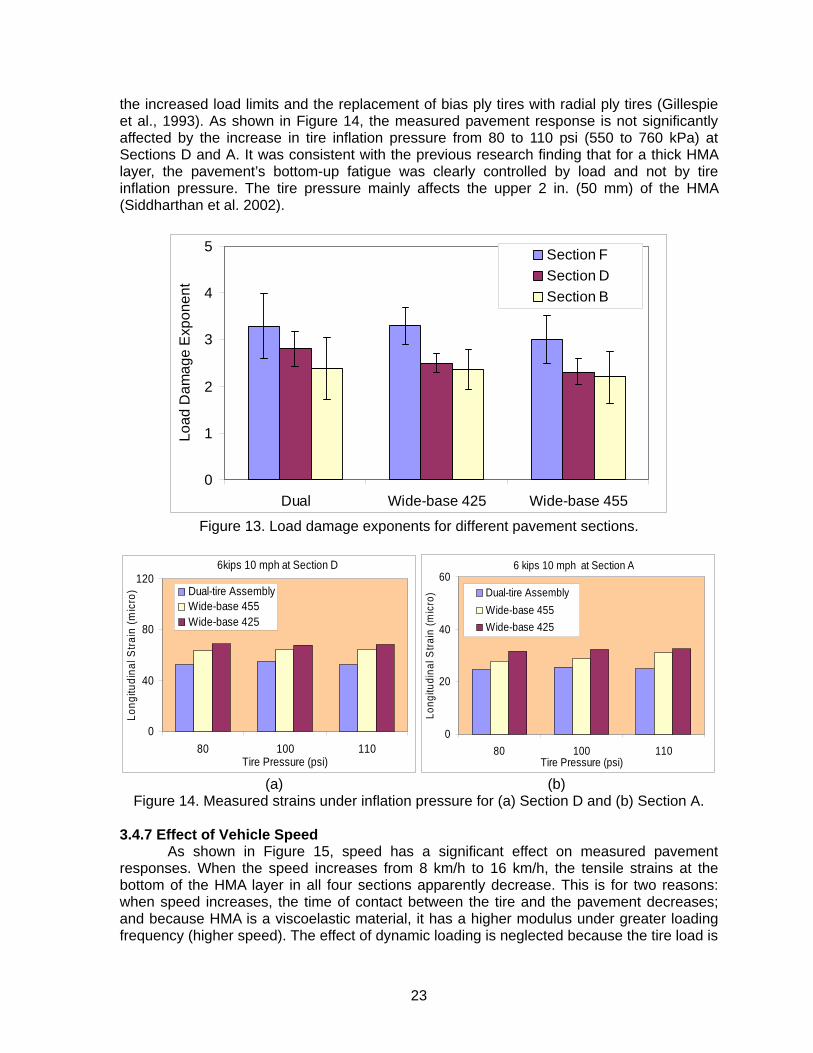
various axle load levels were incorporated into the fatigue equation used in the proposed AASHTO 2002 mechanistic-empirical pavement design guide (MEPDG) (ARA, 2004). The calculated load damage exponents for dual-tire assembly and wide-base tires were compared in Figure 13 for various HMA thicknesses. The average load damage constants for various loads with respect to the reference load (10 kips [44.4 kN]) are presented; the error bar indicates the standard deviation of these load damage exponents. The range of load damage exponents is 1.77 to 3.29 for all sections. Generally, the load damage exponents decrease as pavement thickness increases. This suggests that if the axle load is increased by 10%, the fatigue damage would increase by 18% for Section A and 37% for Section F. The wide-base 455 tire was also found to have smaller load damage exponents than the dual-tire assembly.
3.4.6 Effect of Tire Pressure
Currently, concern is growing over the increase in tire pressures that are believed to contribute to the increase in pavement damage. Since the AASHO Road Test, the average inflation pressure has been increased from 80 to 110 psi (550 to 760 kPa) to accommodate
23
the increased load limits and the replacement of bias ply tires with radial ply tires (Gillespie et al., 1993). As shown in Figure 14, the measured pavement response is not significantly affected by the increase in tire inflation pressure from 80 to 110 psi (550 to 760 kPa) at Sections D and A. It was consistent with the previous research finding that for a thick HMA layer, the pavement’s bottom-up fatigue was clearly controlled by load and not by tire inflation pressure. The tire pressure mainly affects the upper 2 in. (50 mm) of the HMA (Siddharthan et al. 2002).
0
1
2
3
4
5
Dual Wide-base 425 Wide-base 455
Load
Dam
age
Exp
onen
t
Section FSection DSection B
Figure 13. Load damage exponents for different pavement sections.
6kips 10 mph at Section D
0
40
80
120
80 100 110Tire Pressure (psi)
Long
itudi
nal S
train
(mic
ro) Dual-tire Assembly
Wide-base 455Wide-base 425
6 kips 10 mph at Section A
0
20
40
60
80 100 110Tire Pressure (psi)
Long
itudi
nal S
train
(mic
ro) Dual-tire Assembly
Wide-base 455Wide-base 425
(a) (b)
Figure 14. Measured strains under inflation pressure for (a) Section D and (b) Section A. 3.4.7 Effect of Vehicle Speed
As shown in Figure 15, speed has a significant effect on measured pavement responses. When the speed increases from 8 km/h to 16 km/h, the tensile strains at the bottom of the HMA layer in all four sections apparently decrease. This is for two reasons: when speed increases, the time of contact between the tire and the pavement decreases; and because HMA is a viscoelastic material, it has a higher modulus under greater loading frequency (higher speed). The effect of dynamic loading is neglected because the tire load is
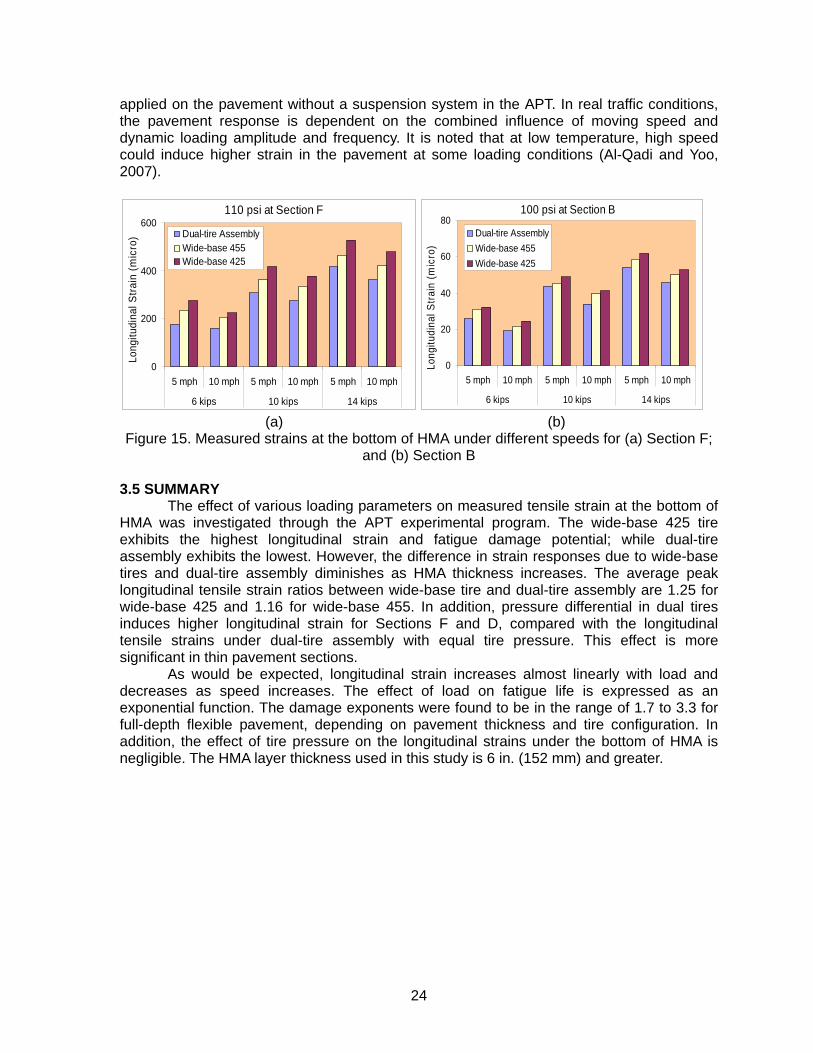
24
applied on the pavement without a suspension system in the APT. In real traffic conditions, the pavement response is dependent on the combined influence of moving speed and dynamic loading amplitude and frequency. It is noted that at low temperature, high speed could induce higher strain in the pavement at some loading conditions (Al-Qadi and Yoo, 2007).
110 psi at Section F
0
200
400
600
5 mph 10 mph 5 mph 10 mph 5 mph 10 mph
6 kips 10 kips 14 kips
Long
itudi
nal S
train
(mic
ro) Dual-tire Assembly
Wide-base 455Wide-base 425
100 psi at Section B
0
20
40
60
80
5 mph 10 mph 5 mph 10 mph 5 mph 10 mph
6 kips 10 kips 14 kips
Long
itudi
nal S
train
(mic
ro)
Dual-tire AssemblyWide-base 455Wide-base 425
(a) (b)
Figure 15. Measured strains at the bottom of HMA under different speeds for (a) Section F; and (b) Section B
3.5 SUMMARY
The effect of various loading parameters on measured tensile strain at the bottom of HMA was investigated through the APT experimental program. The wide-base 425 tire exhibits the highest longitudinal strain and fatigue damage potential; while dual-tire assembly exhibits the lowest. However, the difference in strain responses due to wide-base tires and dual-tire assembly diminishes as HMA thickness increases. The average peak longitudinal tensile strain ratios between wide-base tire and dual-tire assembly are 1.25 for wide-base 425 and 1.16 for wide-base 455. In addition, pressure differential in dual tires induces higher longitudinal strain for Sections F and D, compared with the longitudinal tensile strains under dual-tire assembly with equal tire pressure. This effect is more significant in thin pavement sections.
As would be expected, longitudinal strain increases almost linearly with load and decreases as speed increases. The effect of load on fatigue life is expressed as an exponential function. The damage exponents were found to be in the range of 1.7 to 3.3 for full-depth flexible pavement, depending on pavement thickness and tire configuration. In addition, the effect of tire pressure on the longitudinal strains under the bottom of HMA is negligible. The HMA layer thickness used in this study is 6 in. (152 mm) and greater.

25
CHAPTER 4 FLEXIBLE PAVEMENT MODELING
4.1 MATERIAL CHARACTERIZATION To accurately predict pavement response, proper material characterization is also
needed. Hot-mix asphalt behaves as a viscoelastic material, since its response to induced loading or deformation depends on temperature and loading time. The stress–strain relationship is formulated as an hereditary integral and can be solved either analytically or numerically (Ferry, 1980). The linear viscoelastic constitutive model under one-dimensional loading condition is shown in Equation 4.
ττετσ d
ddtEt
t
∫ ∞−−= )()( (4)
where, ε =strain history, E(t) = relaxation modulus, D(t) = creep compliance, t = time, and τ = integral variable. The HMA viscoelasticity can be measured using the time-dependent creep test, or
the frequency-dependent complex modulus test. Different laboratory setups are available for conducting these tests: uni-axial, tri-axial, or indirect tensile (IDT). The indirect tensile setup was used to allow testing thin HMA layer cores taken from the field. The dimensions of indirect tensile specimens were 6 in. (152 mm) in diameter by 2 in. (51 mm) in height. These specimens were cut from the field cores taken from the full-depth pavement sections. It was reported that the tensile stress state in the perpendicular diametrical direction of a cylindrical IDT specimen is close to field stress condition at the bottom of an HMA layer (Buttlar and Roque, 1994).
4.1.1 HMA Creep Compliance Test
The creep tests were performed at five temperatures (5, 23, 41, 59, and 77°F [-15, -5, 5, 15, and 25°C]) for 100 s using the indirect tensile setup (IDT) (see Figure 16). Stress/strain levels applied to the specimens were kept low enough to ensure minimum damage during the entire testing period, and therefore, linear viscoelastic behavior. The strains and the creep compliance [D(t)] are computed based on the measured deformation using the AASHTO method T322. Master creep curves were then constructed by horizontally shifting the creep curves at various temperatures to the creep curve at the reference temperature of 77°F (25°C), [see Figures 17(a), (b) and (c)]. The results show a sufficiently overlapped region between adjacent creep compliance curves. It is noted that the slope of the middle, linear portion of the creep master curve is an indicator of how much time-dependency the mixture has. For example, a constant creep compliance with a slope equal to zero means that the material is purely elastic.
Ferry (1980) showed that there is an exact relationship between the creep compliance and relaxation modulus by using the convolution integral in Equation 5. When an analytical form of a viscoelastic material is not available and only data points determined in the laboratory exist, the integral can be solved numerically. However, the numerical method requires significantly tedious and cumbersome work. For this reason, researchers have proposed several approximate methods to convert linear viscoelastic properties to each other. An approximate method can be used if both the creep compliance and relaxation modulus are modeled using a power law analytical form, as shown on Equation 6. In

26
practical terms, lab-determined data are not exactly represented by the power law function. However, if the data does not perfectly follow a power model, but if the functions behave smoothly, Equation 6 still works well. In this case, the local slope of the power model can be determined using Equation 7 (Park and Kim, 1999).
0( ) ( )
tE t D d tτ τ τ− =∫ for t>0 (5)
s in( ) ( ) nE t D tn
ππ
= (6)
tdtDdn
log)(log
= (7)
where, ntEtE −= 1)( is relaxation modulus, and ntDtD 1)( = is creep compliance.
(a) (b)
Y
Xxxσ
yyσ
tension
compression
(c) (d)
Figure 16. Indirect tensile test: (a) cores taken from field; (b) prepared specimens for test; (c) IDT set-up for testing; and (d) schematic stress state in the IDT test.

27
Dense Graded Course
1E-07
1E-06
1E-05
1E-041E-07 1E-05 1E-03 1E-01 1E+01 1E+03
Reduced Time (sec)
Cre
ep C
ompl
ianc
e (1
/psi
)
5 23 41 53 77
(a)
Standard Binder Course
1E-07
1E-06
1E-05
1E-04
1E-031E-07 1E-05 1E-03 1E-01 1E+01 1E+03
Reduced Time (sec)
Cre
ep C
ompl
ianc
e (1
/psi
)
5 23 41 53 77
(b)
Polymer Modified Course
1E-07
1E-06
1E-05
1E-04
1E-031E-06 1E-04 1E-02 1E+00 1E+02
Reduced Time (sec)
Cre
ep C
ompl
ianc
e (1
/psi
)
5 23 41 53 71
(c)
Figure 17. Measured creep compliance for (a) dense-graded course; (b) standard-binder course; and (c) polymer-modified course.

28
The relaxation moduli were calculated from the measured creep compliance using Equations 6 and 7. The bulk (K) and shear (G) relaxation moduli were calculated assuming the constant Poisson’s ratio and fitted into the Prony series as a Generalized Maxwell Solid (Equations 8 and 9). The fitted Prony series parameters are shown in Table 8.
∑=
−−=N
1i
/i0 ))e-(1G1(GG(t) it τ (8)
∑=
−−=N
1i
/i0 ))e-(1K1(KK(t) it τ (9)
where, G = shear modulus; K = bulk modulus; t = reduced relaxation time;
0G and 0K = instantaneous elastic modulus; and
iG , iK , and iτ = Prony series parameters.
Table 8. Prony Series Parameters for Generalized Maxwell Model
i Dense Graded Standard Binder Polymer Modified
Gi Ki τi Gi Ki τi Gi Ki τi
1 3.66E-01 3.66E-01 1.13E-04 4.52E-01 4.52E-01 1.13E-04 3.88E-01 3.88E-01 1.13E-04
2 2.70E-01 2.70E-01 3.14E-03 2.78E-01 2.78E-01 3.14E-03 3.15E-01 3.15E-01 3.14E-03
3 1.34E-01 1.34E-01 1.30E-02 1.48E-01 1.48E-01 1.30E-02 8.21E-02 8.21E-02 1.30E-02
4 1.61E-01 1.61E-01 1.64E-01 1.08E-01 1.08E-01 1.84E-01 1.73E-01 1.73E-01 1.64E-01
5 4.75E-02 4.75E-02 2.09E+00 7.46E-03 7.46E-03 2.29E+00 2.51E-02 2.51E-02 2.09E+00
6 1.95E-02 1.95E-02 3.77E+01 4.36E-03 4.36E-03 2.57E+01 1.07E-02 1.07E-02 3.77E+01
4.1.2 HMA Complex Modulus Test
The complex modulus tests were conducted at three temperatures (14, 41, and 77°F [-10, 5, and 25°C]) and seven loading frequencies (0.01, 0.1, 0.5, 1, 5, 10, and 25 Hz) using indirect tensile setup (IDT). The reduced testing at high temperature can be compensated for by the test at low frequency (0.01 Hz) based on the concept of time–temperature superposition. The complex modulus was calculated based on the linear viscoelastic solution of the IDT test derived by Kim et al. (2004). The sigmoidal function in the proposed MEPDG was used to describe the complex modulus master curve, Equation 10 (ARA, 2004). The maximum limiting modulus was estimated from the HMA volumetric properties [void in mineral aggregate (VMA) and voids filled with asphalt (VFA)] using the Hirsch model and a limiting binder modulus of 145 ksi (1 GPa) (Bonaquist and Christensen, 2005). The least square error technique available in the solver module in Excel was used to obtain the fitting parameters by minimizing the residual errors that were generated by fitting the complex modulus data to the predicted values. The time–temperature shift factors were also calculated automatically in the fitting process.
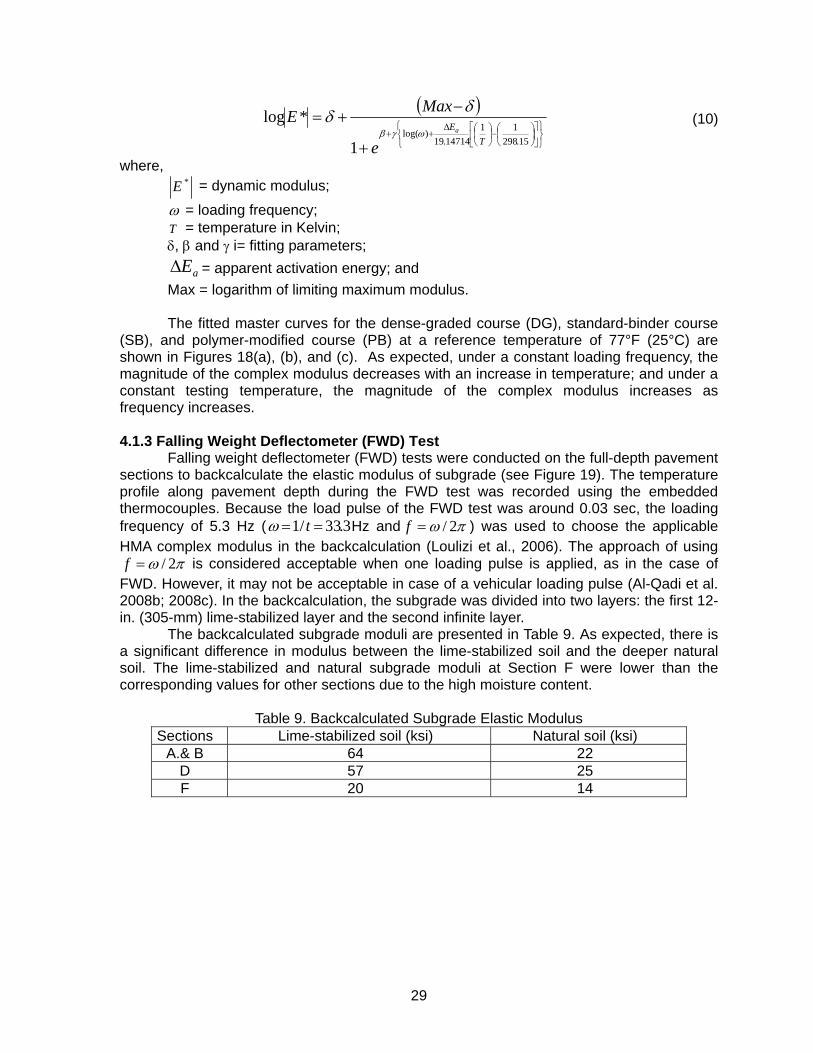
29
( )
⎭⎬⎫
⎩⎨⎧
⎥⎦
⎤⎢⎣
⎡⎟⎠⎞
⎜⎝⎛−⎟
⎠⎞
⎜⎝⎛Δ
++
+
−+=
15.29811
14714.19)log(
1
*logT
Ea
e
MaxEωγβ
δδ (10)
where, *E
= dynamic modulus;
ω = loading frequency; T = temperature in Kelvin; δ, β and γ i= fitting parameters;
aEΔ = apparent activation energy; and Max = logarithm of limiting maximum modulus. The fitted master curves for the dense-graded course (DG), standard-binder course
(SB), and polymer-modified course (PB) at a reference temperature of 77°F (25°C) are shown in Figures 18(a), (b), and (c). As expected, under a constant loading frequency, the magnitude of the complex modulus decreases with an increase in temperature; and under a constant testing temperature, the magnitude of the complex modulus increases as frequency increases.
4.1.3 Falling Weight Deflectometer (FWD) Test
Falling weight deflectometer (FWD) tests were conducted on the full-depth pavement sections to backcalculate the elastic modulus of subgrade (see Figure 19). The temperature profile along pavement depth during the FWD test was recorded using the embedded thermocouples. Because the load pulse of the FWD test was around 0.03 sec, the loading frequency of 5.3 Hz ( 3.33/1 == tω Hz and πω 2/=f ) was used to choose the applicable HMA complex modulus in the backcalculation (Loulizi et al., 2006). The approach of using
πω 2/=f is considered acceptable when one loading pulse is applied, as in the case of FWD. However, it may not be acceptable in case of a vehicular loading pulse (Al-Qadi et al. 2008b; 2008c). In the backcalculation, the subgrade was divided into two layers: the first 12-in. (305-mm) lime-stabilized layer and the second infinite layer.
The backcalculated subgrade moduli are presented in Table 9. As expected, there is a significant difference in modulus between the lime-stabilized soil and the deeper natural soil. The lime-stabilized and natural subgrade moduli at Section F were lower than the corresponding values for other sections due to the high moisture content.
Table 9. Backcalculated Subgrade Elastic Modulus
Sections Lime-stabilized soil (ksi) Natural soil (ksi) A.& B 64 22
D 57 25 F 20 14

30
1
10
100
1000
10000
1.E-02 1.E+00 1.E+02 1.E+04 1.E+06 1.E+08
Reduced Frequency (Hz)
Den
se G
rade
d C
ours
e E
*( k
si)
144177Fit
y = -0.07x + 5.3487R2 = 0.9987
-2
0
2
4
6
0 20 40 60 80 100Temperature (oF)
Log
(Shi
ft Fa
ctor
)
(a)
1
10
100
1000
10000
1.E-02 1.E+00 1.E+02 1.E+04 1.E+06 1.E+08Reduced Frequency (Hz)
Sta
ndar
d B
inde
r Cou
rse
E* (
ksi)
144177Fit
y = -0.0949x + 7.2507R2 = 0.9987
-2
0
2
4
6
0 20 40 60 80 100Temperature (oF)
Log
(Shi
ft Fa
ctor
)
(b)
10
100
1000
10000
1.E-02 1.E+00 1.E+02 1.E+04 1.E+06 1.E+08Reduced Frequency (Hz)
Pol
ymer
Mod
ified
Cou
rse
E* (
ksi)
144177Fit
y = -0.0855x + 6.5298R2 = 0.9987
-2
0
2
4
6
0 20 40 60 80 100Temperature (oF)
Log
(Shi
ft Fa
ctor
)
(c)
Figure 18. Measured and fitted complex modulus curves: (a) dense-graded course; (b) standard-binder course; and (c) polymer-modified course.
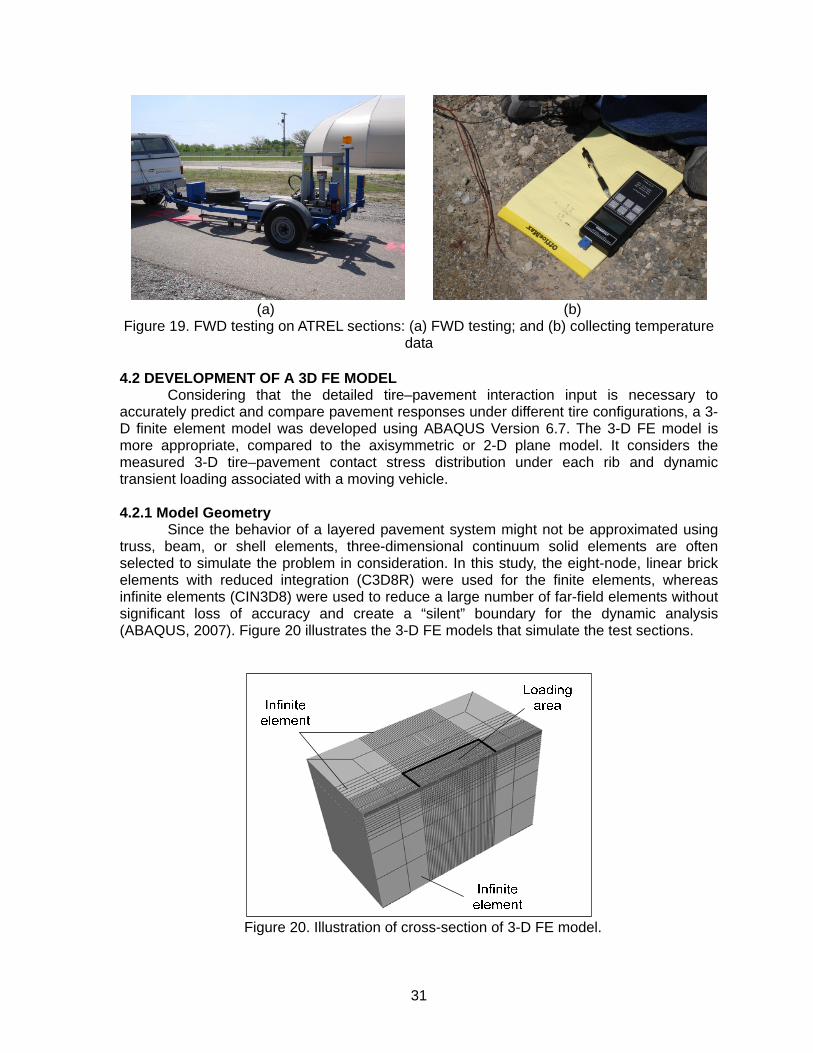
31
(a) (b) Figure 19. FWD testing on ATREL sections: (a) FWD testing; and (b) collecting temperature
data
4.2 DEVELOPMENT OF A 3D FE MODEL Considering that the detailed tire–pavement interaction input is necessary to
accurately predict and compare pavement responses under different tire configurations, a 3-D finite element model was developed using ABAQUS Version 6.7. The 3-D FE model is more appropriate, compared to the axisymmetric or 2-D plane model. It considers the measured 3-D tire–pavement contact stress distribution under each rib and dynamic transient loading associated with a moving vehicle. 4.2.1 Model Geometry
Since the behavior of a layered pavement system might not be approximated using truss, beam, or shell elements, three-dimensional continuum solid elements are often selected to simulate the problem in consideration. In this study, the eight-node, linear brick elements with reduced integration (C3D8R) were used for the finite elements, whereas infinite elements (CIN3D8) were used to reduce a large number of far-field elements without significant loss of accuracy and create a “silent” boundary for the dynamic analysis (ABAQUS, 2007). Figure 20 illustrates the 3-D FE models that simulate the test sections.
Figure 20. Illustration of cross-section of 3-D FE model.
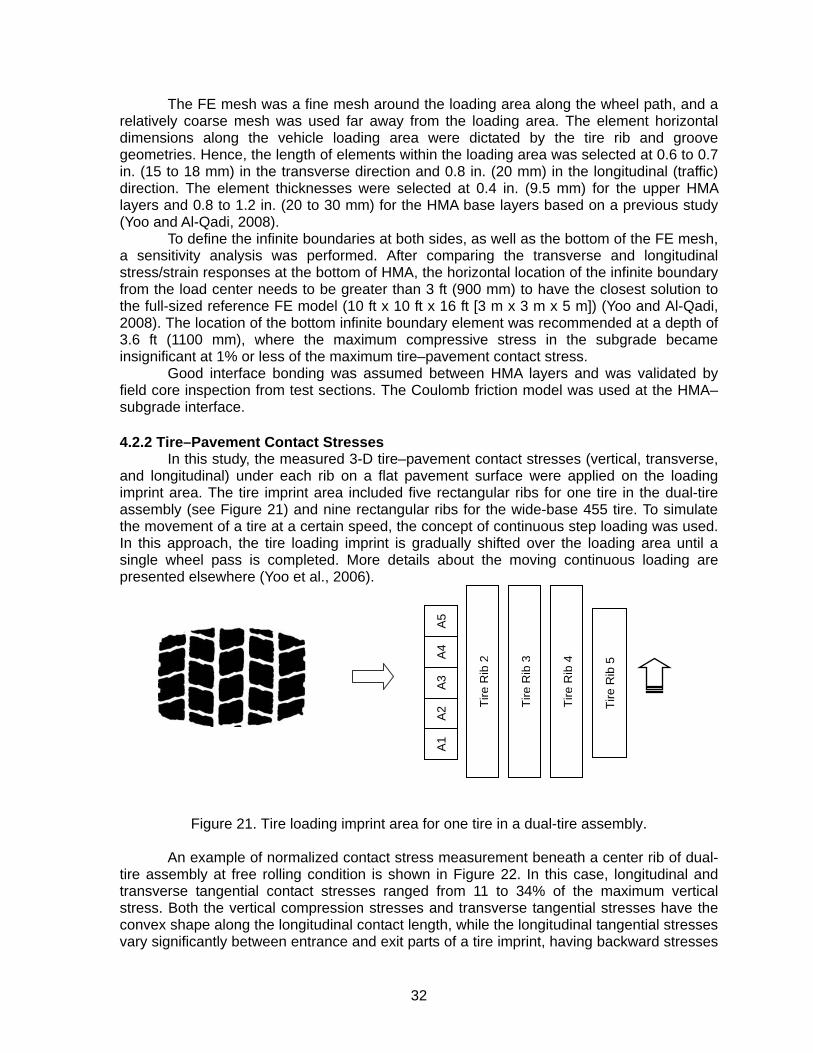
32
The FE mesh was a fine mesh around the loading area along the wheel path, and a relatively coarse mesh was used far away from the loading area. The element horizontal dimensions along the vehicle loading area were dictated by the tire rib and groove geometries. Hence, the length of elements within the loading area was selected at 0.6 to 0.7 in. (15 to 18 mm) in the transverse direction and 0.8 in. (20 mm) in the longitudinal (traffic) direction. The element thicknesses were selected at 0.4 in. (9.5 mm) for the upper HMA layers and 0.8 to 1.2 in. (20 to 30 mm) for the HMA base layers based on a previous study (Yoo and Al-Qadi, 2008).
To define the infinite boundaries at both sides, as well as the bottom of the FE mesh, a sensitivity analysis was performed. After comparing the transverse and longitudinal stress/strain responses at the bottom of HMA, the horizontal location of the infinite boundary from the load center needs to be greater than 3 ft (900 mm) to have the closest solution to the full-sized reference FE model (10 ft x 10 ft x 16 ft [3 m x 3 m x 5 m]) (Yoo and Al-Qadi, 2008). The location of the bottom infinite boundary element was recommended at a depth of 3.6 ft (1100 mm), where the maximum compressive stress in the subgrade became insignificant at 1% or less of the maximum tire–pavement contact stress.
Good interface bonding was assumed between HMA layers and was validated by field core inspection from test sections. The Coulomb friction model was used at the HMA–subgrade interface.
4.2.2 Tire–Pavement Contact Stresses
In this study, the measured 3-D tire–pavement contact stresses (vertical, transverse, and longitudinal) under each rib on a flat pavement surface were applied on the loading imprint area. The tire imprint area included five rectangular ribs for one tire in the dual-tire assembly (see Figure 21) and nine rectangular ribs for the wide-base 455 tire. To simulate the movement of a tire at a certain speed, the concept of continuous step loading was used. In this approach, the tire loading imprint is gradually shifted over the loading area until a single wheel pass is completed. More details about the moving continuous loading are presented elsewhere (Yoo et al., 2006).
Figure 21. Tire loading imprint area for one tire in a dual-tire assembly.
An example of normalized contact stress measurement beneath a center rib of dual-
tire assembly at free rolling condition is shown in Figure 22. In this case, longitudinal and transverse tangential contact stresses ranged from 11 to 34% of the maximum vertical stress. Both the vertical compression stresses and transverse tangential stresses have the convex shape along the longitudinal contact length, while the longitudinal tangential stresses vary significantly between entrance and exit parts of a tire imprint, having backward stresses
A3
Tire
Rib
2
Tire
Rib
3
Tire
Rib
4
Tire
Rib
5
A1
A2
A4
A5
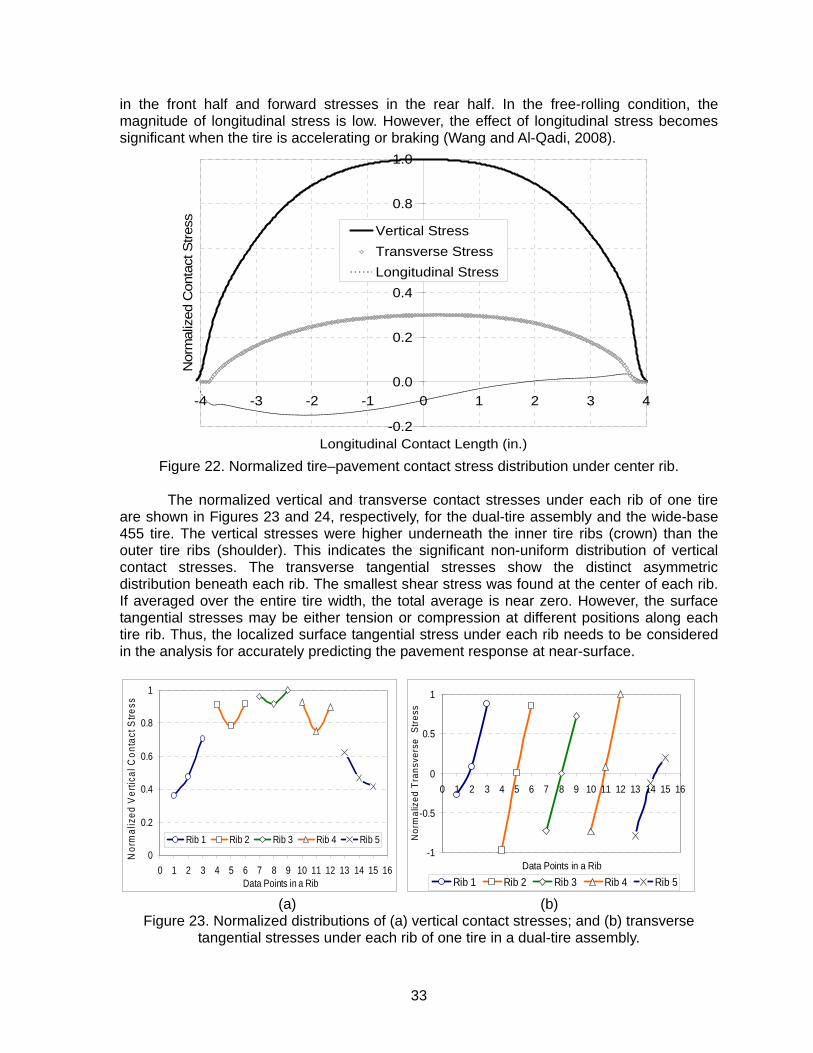
33
in the front half and forward stresses in the rear half. In the free-rolling condition, the magnitude of longitudinal stress is low. However, the effect of longitudinal stress becomes significant when the tire is accelerating or braking (Wang and Al-Qadi, 2008).
-0.2
0.0
0.2
0.4
0.6
0.8
1.0
-4 -3 -2 -1 0 1 2 3 4
Longitudinal Contact Length (in.)
Nor
mal
ized
Con
tact
Stre
ss Vertical StressTransverse StressLongitudinal Stress
Figure 22. Normalized tire–pavement contact stress distribution under center rib.
The normalized vertical and transverse contact stresses under each rib of one tire
are shown in Figures 23 and 24, respectively, for the dual-tire assembly and the wide-base 455 tire. The vertical stresses were higher underneath the inner tire ribs (crown) than the outer tire ribs (shoulder). This indicates the significant non-uniform distribution of vertical contact stresses. The transverse tangential stresses show the distinct asymmetric distribution beneath each rib. The smallest shear stress was found at the center of each rib. If averaged over the entire tire width, the total average is near zero. However, the surface tangential stresses may be either tension or compression at different positions along each tire rib. Thus, the localized surface tangential stress under each rib needs to be considered in the analysis for accurately predicting the pavement response at near-surface.
0
0.2
0.4
0.6
0.8
1
0 1 2 3 4 5 6 7 8 9 10 11 12 13 14 15 16Data Points in a Rib
Nor
mal
ized
Ver
tical
Con
tact
Stre
ss
Rib 1 Rib 2 Rib 3 Rib 4 Rib 5
-1
-0.5
0
0.5
1
0 1 2 3 4 5 6 7 8 9 10 11 12 13 14 15 16
Data Points in a Rib
Nor
mal
ized
Tra
nsve
rse
Stre
ss
Rib 1 Rib 2 Rib 3 Rib 4 Rib 5 (a) (b)
Figure 23. Normalized distributions of (a) vertical contact stresses; and (b) transverse tangential stresses under each rib of one tire in a dual-tire assembly.
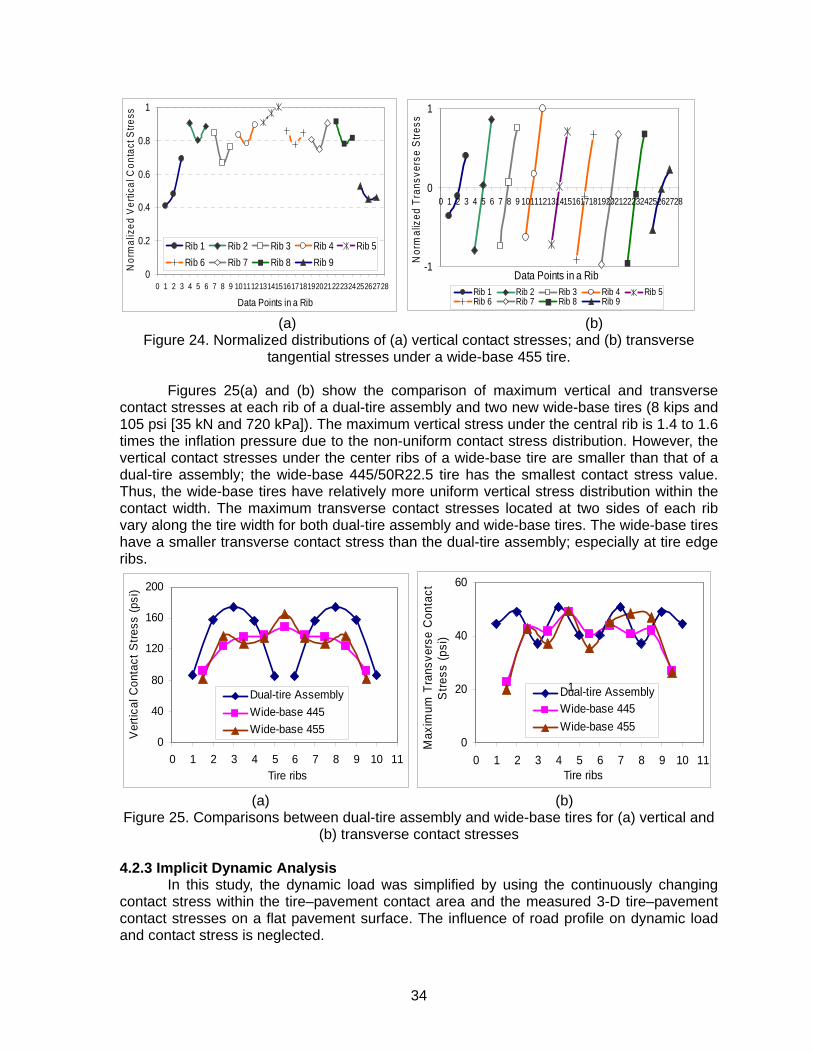
34
0
0.2
0.4
0.6
0.8
1
0 1 2 3 4 5 6 7 8 9 10111213141516171819202122232425262728
Data Points in a Rib
Nor
mal
ized
Ver
tical
Con
tact
Stre
ss
Rib 1 Rib 2 Rib 3 Rib 4 Rib 5Rib 6 Rib 7 Rib 8 Rib 9
-1
0
1
0 1 2 3 4 5 6 7 8 9 10111213141516171819202122232425262728
Data Points in a Rib
Nor
mal
ized
Tra
nsve
rse
Stre
ss
Rib 1 Rib 2 Rib 3 Rib 4 Rib 5Rib 6 Rib 7 Rib 8 Rib 9
(a) (b)
Figure 24. Normalized distributions of (a) vertical contact stresses; and (b) transverse tangential stresses under a wide-base 455 tire.
Figures 25(a) and (b) show the comparison of maximum vertical and transverse
contact stresses at each rib of a dual-tire assembly and two new wide-base tires (8 kips and 105 psi [35 kN and 720 kPa]). The maximum vertical stress under the central rib is 1.4 to 1.6 times the inflation pressure due to the non-uniform contact stress distribution. However, the vertical contact stresses under the center ribs of a wide-base tire are smaller than that of a dual-tire assembly; the wide-base 445/50R22.5 tire has the smallest contact stress value. Thus, the wide-base tires have relatively more uniform vertical stress distribution within the contact width. The maximum transverse contact stresses located at two sides of each rib vary along the tire width for both dual-tire assembly and wide-base tires. The wide-base tires have a smaller transverse contact stress than the dual-tire assembly; especially at tire edge ribs.
0
40
80
120
160
200
0 1 2 3 4 5 6 7 8 9 10 11Tire ribs
Ver
tical
Con
tact
Stre
ss (p
si)
Dual-tire AssemblyWide-base 445Wide-base 455
0
20
40
60
0 1 2 3 4 5 6 7 8 9 10 11Tire ribs
Max
imum
Tra
nsve
rse
Con
tact
Stre
ss (p
si)
Dual-tire AssemblyWide-base 445Wide-base 455
1
(a) (b)
Figure 25. Comparisons between dual-tire assembly and wide-base tires for (a) vertical and (b) transverse contact stresses
4.2.3 Implicit Dynamic Analysis
In this study, the dynamic load was simplified by using the continuously changing contact stress within the tire–pavement contact area and the measured 3-D tire–pavement contact stresses on a flat pavement surface. The influence of road profile on dynamic load and contact stress is neglected.
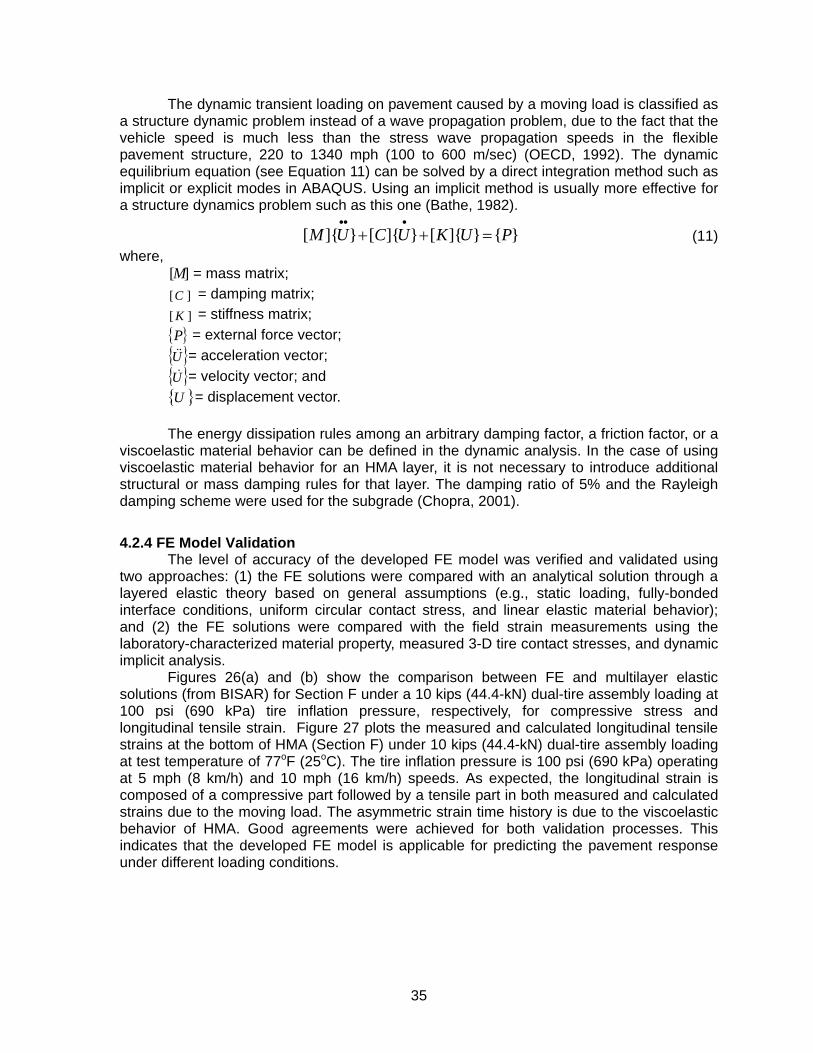
35
The dynamic transient loading on pavement caused by a moving load is classified as a structure dynamic problem instead of a wave propagation problem, due to the fact that the vehicle speed is much less than the stress wave propagation speeds in the flexible pavement structure, 220 to 1340 mph (100 to 600 m/sec) (OECD, 1992). The dynamic equilibrium equation (see Equation 11) can be solved by a direct integration method such as implicit or explicit modes in ABAQUS. Using an implicit method is usually more effective for a structure dynamics problem such as this one (Bathe, 1982).
[ ]{ } [ ]{ } [ ]{ } { }M U C U K U P•• •
+ + = (11) where, ][M = mass matrix;
][C = damping matrix;
][ K = stiffness matrix; { }P = external force vector; { }U&& = acceleration vector; { }U& = velocity vector; and { }U = displacement vector. The energy dissipation rules among an arbitrary damping factor, a friction factor, or a
viscoelastic material behavior can be defined in the dynamic analysis. In the case of using viscoelastic material behavior for an HMA layer, it is not necessary to introduce additional structural or mass damping rules for that layer. The damping ratio of 5% and the Rayleigh damping scheme were used for the subgrade (Chopra, 2001).
4.2.4 FE Model Validation The level of accuracy of the developed FE model was verified and validated using
two approaches: (1) the FE solutions were compared with an analytical solution through a layered elastic theory based on general assumptions (e.g., static loading, fully-bonded interface conditions, uniform circular contact stress, and linear elastic material behavior); and (2) the FE solutions were compared with the field strain measurements using the laboratory-characterized material property, measured 3-D tire contact stresses, and dynamic implicit analysis.
Figures 26(a) and (b) show the comparison between FE and multilayer elastic solutions (from BISAR) for Section F under a 10 kips (44.4-kN) dual-tire assembly loading at 100 psi (690 kPa) tire inflation pressure, respectively, for compressive stress and longitudinal tensile strain. Figure 27 plots the measured and calculated longitudinal tensile strains at the bottom of HMA (Section F) under 10 kips (44.4-kN) dual-tire assembly loading at test temperature of 77oF (25oC). The tire inflation pressure is 100 psi (690 kPa) operating at 5 mph (8 km/h) and 10 mph (16 km/h) speeds. As expected, the longitudinal strain is composed of a compressive part followed by a tensile part in both measured and calculated strains due to the moving load. The asymmetric strain time history is due to the viscoelastic behavior of HMA. Good agreements were achieved for both validation processes. This indicates that the developed FE model is applicable for predicting the pavement response under different loading conditions.
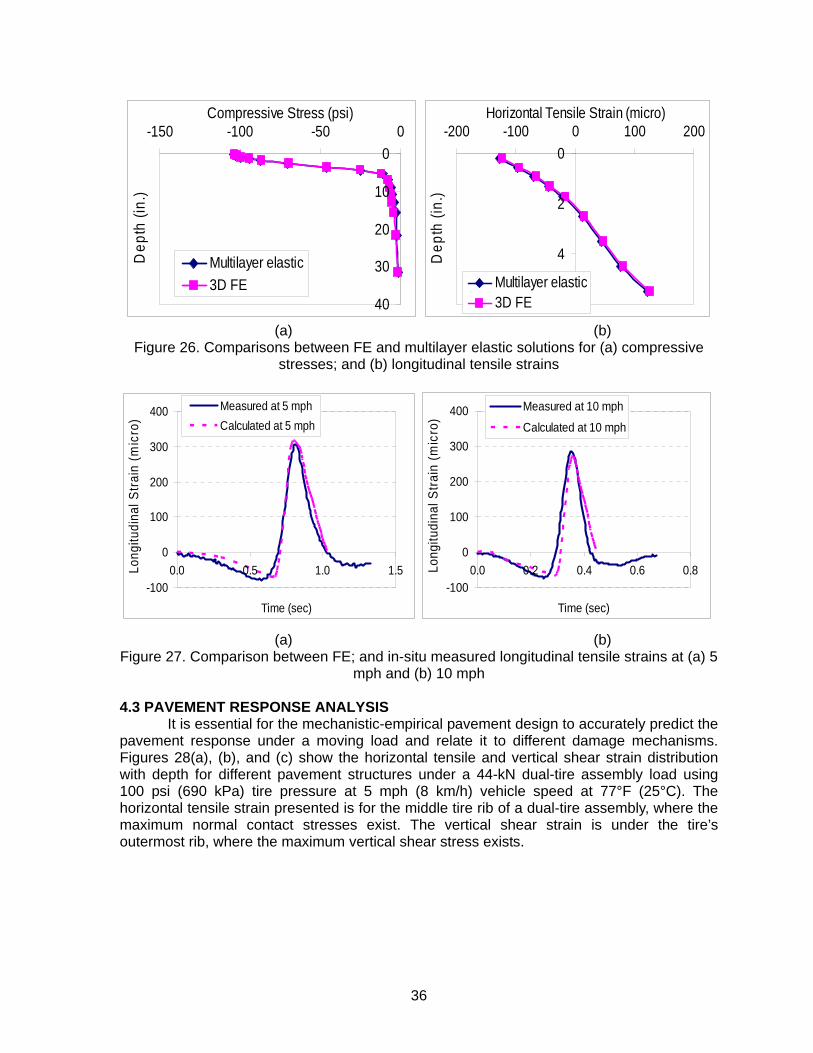
36
0
10
20
30
40
-150 -100 -50 0Compressive Stress (psi)
Dep
th (i
n.)
Multilayer elastic3D FE
0
2
4
6
-200 -100 0 100 200Horizontal Tensile Strain (micro)
Dep
th (i
n.)
Multilayer elastic3D FE
(a) (b)
Figure 26. Comparisons between FE and multilayer elastic solutions for (a) compressive stresses; and (b) longitudinal tensile strains
-100
0
100
200
300
400
0.0 0.5 1.0 1.5
Time (sec)
Long
itudi
nal S
train
(mic
ro)
Measured at 5 mphCalculated at 5 mph
-100
0
100
200
300
400
0.0 0.2 0.4 0.6 0.8
Time (sec)
Long
itudi
nal S
train
(mic
ro)
Measured at 10 mph
Calculated at 10 mph
(a) (b)
Figure 27. Comparison between FE; and in-situ measured longitudinal tensile strains at (a) 5 mph and (b) 10 mph
4.3 PAVEMENT RESPONSE ANALYSIS
It is essential for the mechanistic-empirical pavement design to accurately predict the pavement response under a moving load and relate it to different damage mechanisms. Figures 28(a), (b), and (c) show the horizontal tensile and vertical shear strain distribution with depth for different pavement structures under a 44-kN dual-tire assembly load using 100 psi (690 kPa) tire pressure at 5 mph (8 km/h) vehicle speed at 77°F (25°C). The horizontal tensile strain presented is for the middle tire rib of a dual-tire assembly, where the maximum normal contact stresses exist. The vertical shear strain is under the tire’s outermost rib, where the maximum vertical shear stress exists.
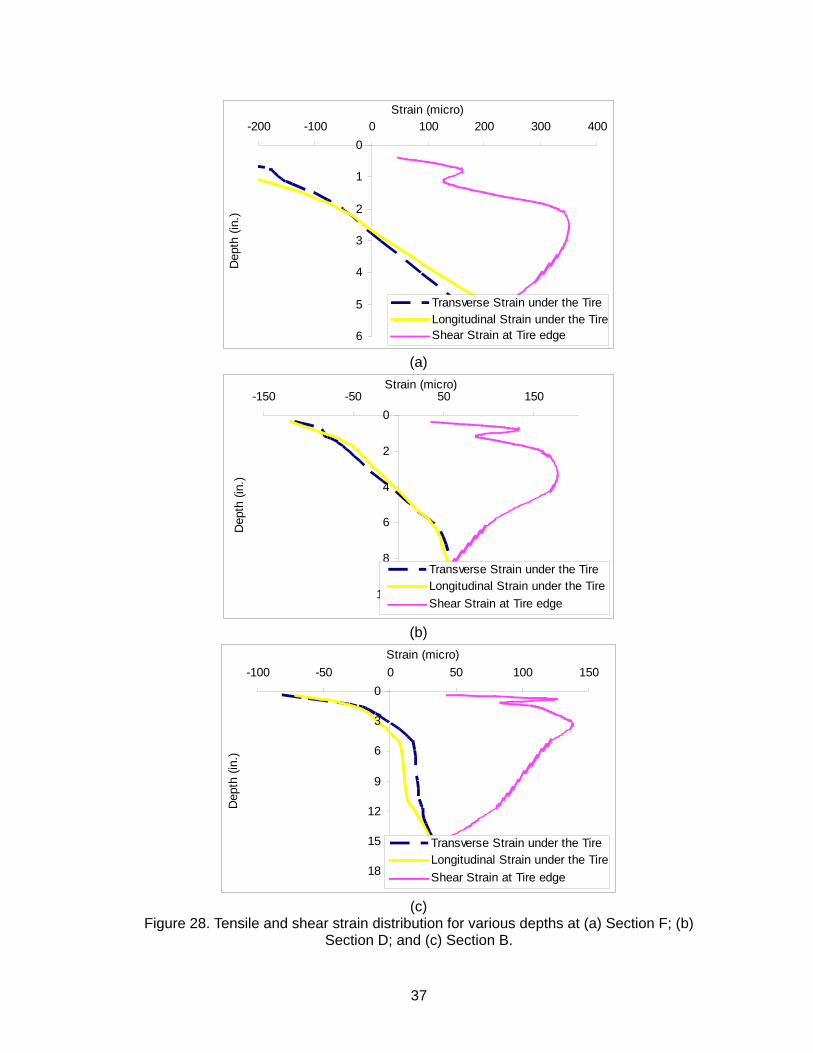
37
0
1
2
3
4
5
6
-200 -100 0 100 200 300 400Strain (micro)
Dep
th (i
n.)
Transverse Strain under the TireLongitudinal Strain under the TireShear Strain at Tire edge
(a)
0
2
4
6
8
10
-150 -50 50 150Strain (micro)
Dep
th (i
n.)
Transverse Strain under the TireLongitudinal Strain under the TireShear Strain at Tire edge
(b)
0
3
6
9
12
15
18
-100 -50 0 50 100 150Strain (micro)
Dep
th (i
n.)
Transverse Strain under the TireLongitudinal Strain under the TireShear Strain at Tire edge
(c)
Figure 28. Tensile and shear strain distribution for various depths at (a) Section F; (b) Section D; and (c) Section B.
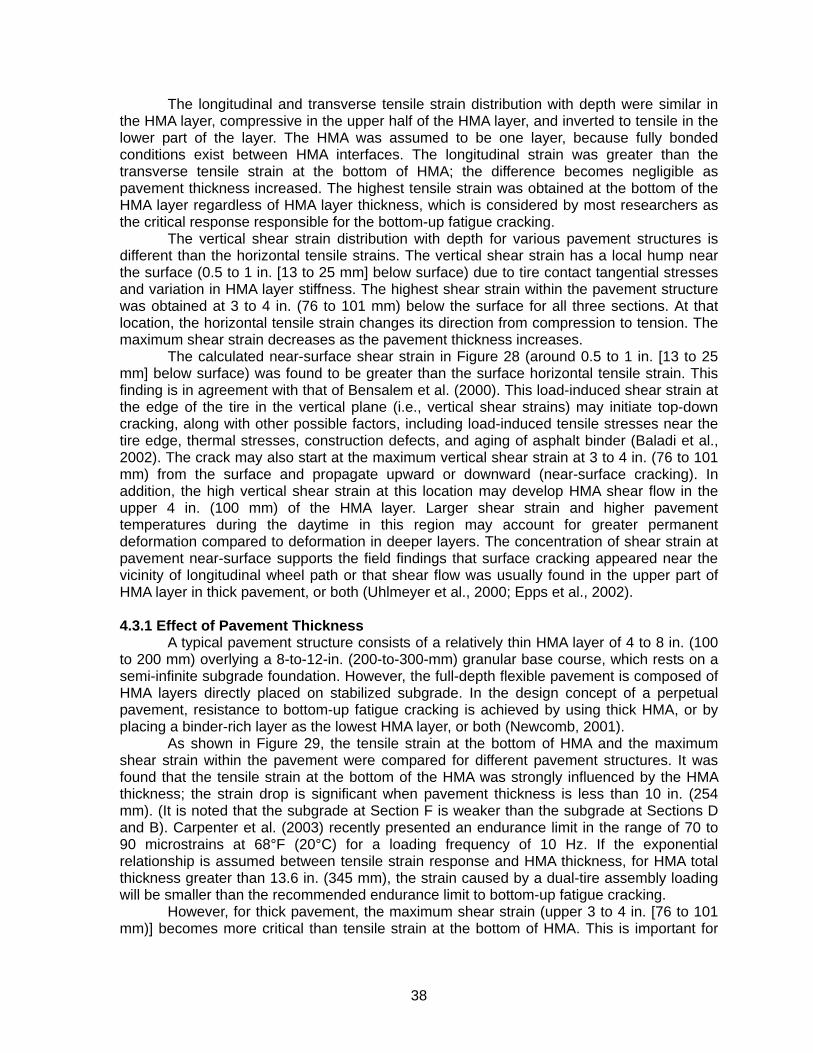
38
The longitudinal and transverse tensile strain distribution with depth were similar in the HMA layer, compressive in the upper half of the HMA layer, and inverted to tensile in the lower part of the layer. The HMA was assumed to be one layer, because fully bonded conditions exist between HMA interfaces. The longitudinal strain was greater than the transverse tensile strain at the bottom of HMA; the difference becomes negligible as pavement thickness increased. The highest tensile strain was obtained at the bottom of the HMA layer regardless of HMA layer thickness, which is considered by most researchers as the critical response responsible for the bottom-up fatigue cracking.
The vertical shear strain distribution with depth for various pavement structures is different than the horizontal tensile strains. The vertical shear strain has a local hump near the surface (0.5 to 1 in. [13 to 25 mm] below surface) due to tire contact tangential stresses and variation in HMA layer stiffness. The highest shear strain within the pavement structure was obtained at 3 to 4 in. (76 to 101 mm) below the surface for all three sections. At that location, the horizontal tensile strain changes its direction from compression to tension. The maximum shear strain decreases as the pavement thickness increases.
The calculated near-surface shear strain in Figure 28 (around 0.5 to 1 in. [13 to 25 mm] below surface) was found to be greater than the surface horizontal tensile strain. This finding is in agreement with that of Bensalem et al. (2000). This load-induced shear strain at the edge of the tire in the vertical plane (i.e., vertical shear strains) may initiate top-down cracking, along with other possible factors, including load-induced tensile stresses near the tire edge, thermal stresses, construction defects, and aging of asphalt binder (Baladi et al., 2002). The crack may also start at the maximum vertical shear strain at 3 to 4 in. (76 to 101 mm) from the surface and propagate upward or downward (near-surface cracking). In addition, the high vertical shear strain at this location may develop HMA shear flow in the upper 4 in. (100 mm) of the HMA layer. Larger shear strain and higher pavement temperatures during the daytime in this region may account for greater permanent deformation compared to deformation in deeper layers. The concentration of shear strain at pavement near-surface supports the field findings that surface cracking appeared near the vicinity of longitudinal wheel path or that shear flow was usually found in the upper part of HMA layer in thick pavement, or both (Uhlmeyer et al., 2000; Epps et al., 2002).
4.3.1 Effect of Pavement Thickness
A typical pavement structure consists of a relatively thin HMA layer of 4 to 8 in. (100 to 200 mm) overlying a 8-to-12-in. (200-to-300-mm) granular base course, which rests on a semi-infinite subgrade foundation. However, the full-depth flexible pavement is composed of HMA layers directly placed on stabilized subgrade. In the design concept of a perpetual pavement, resistance to bottom-up fatigue cracking is achieved by using thick HMA, or by placing a binder-rich layer as the lowest HMA layer, or both (Newcomb, 2001).
As shown in Figure 29, the tensile strain at the bottom of HMA and the maximum shear strain within the pavement were compared for different pavement structures. It was found that the tensile strain at the bottom of the HMA was strongly influenced by the HMA thickness; the strain drop is significant when pavement thickness is less than 10 in. (254 mm). (It is noted that the subgrade at Section F is weaker than the subgrade at Sections D and B). Carpenter et al. (2003) recently presented an endurance limit in the range of 70 to 90 microstrains at 68°F (20°C) for a loading frequency of 10 Hz. If the exponential relationship is assumed between tensile strain response and HMA thickness, for HMA total thickness greater than 13.6 in. (345 mm), the strain caused by a dual-tire assembly loading will be smaller than the recommended endurance limit to bottom-up fatigue cracking.
However, for thick pavement, the maximum shear strain (upper 3 to 4 in. [76 to 101 mm)] becomes more critical than tensile strain at the bottom of HMA. This is important for
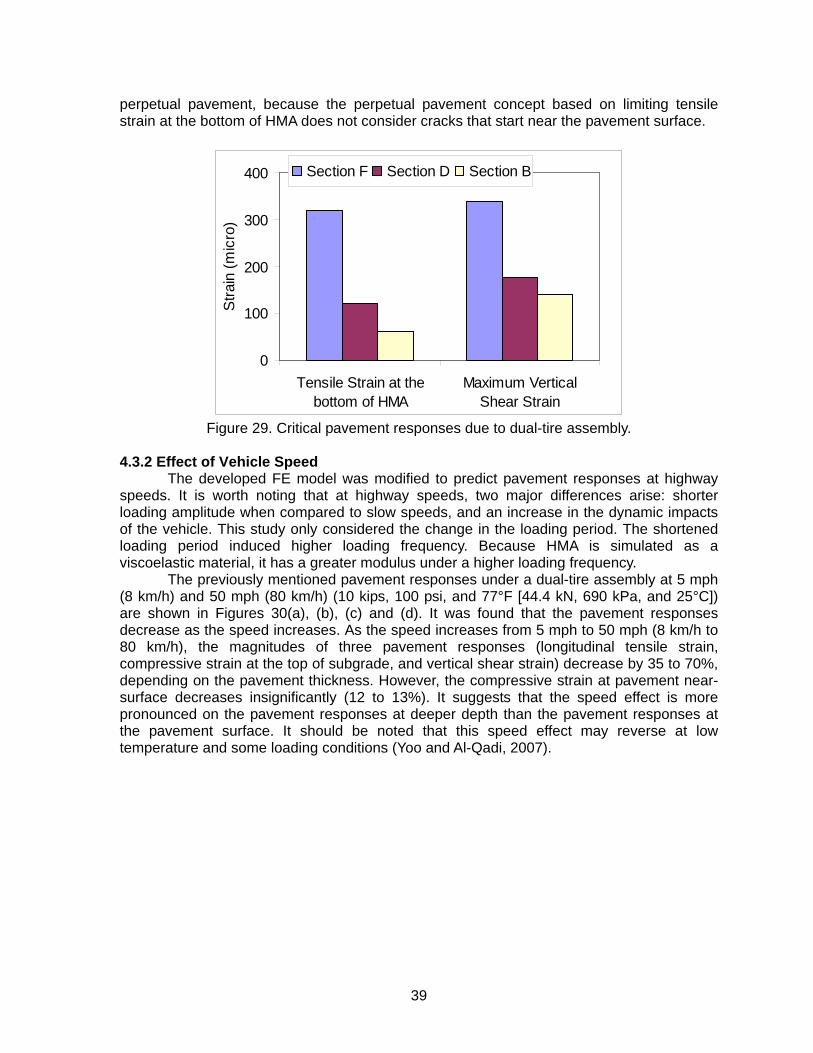
39
perpetual pavement, because the perpetual pavement concept based on limiting tensile strain at the bottom of HMA does not consider cracks that start near the pavement surface.
0
100
200
300
400
Tensile Strain at thebottom of HMA
Maximum VerticalShear Strain
Stra
in (m
icro
)
Section F Section D Section B
Figure 29. Critical pavement responses due to dual-tire assembly.
4.3.2 Effect of Vehicle Speed
The developed FE model was modified to predict pavement responses at highway speeds. It is worth noting that at highway speeds, two major differences arise: shorter loading amplitude when compared to slow speeds, and an increase in the dynamic impacts of the vehicle. This study only considered the change in the loading period. The shortened loading period induced higher loading frequency. Because HMA is simulated as a viscoelastic material, it has a greater modulus under a higher loading frequency.
The previously mentioned pavement responses under a dual-tire assembly at 5 mph (8 km/h) and 50 mph (80 km/h) (10 kips, 100 psi, and 77°F [44.4 kN, 690 kPa, and 25°C]) are shown in Figures 30(a), (b), (c) and (d). It was found that the pavement responses decrease as the speed increases. As the speed increases from 5 mph to 50 mph (8 km/h to 80 km/h), the magnitudes of three pavement responses (longitudinal tensile strain, compressive strain at the top of subgrade, and vertical shear strain) decrease by 35 to 70%, depending on the pavement thickness. However, the compressive strain at pavement near-surface decreases insignificantly (12 to 13%). It suggests that the speed effect is more pronounced on the pavement responses at deeper depth than the pavement responses at the pavement surface. It should be noted that this speed effect may reverse at low temperature and some loading conditions (Yoo and Al-Qadi, 2007).
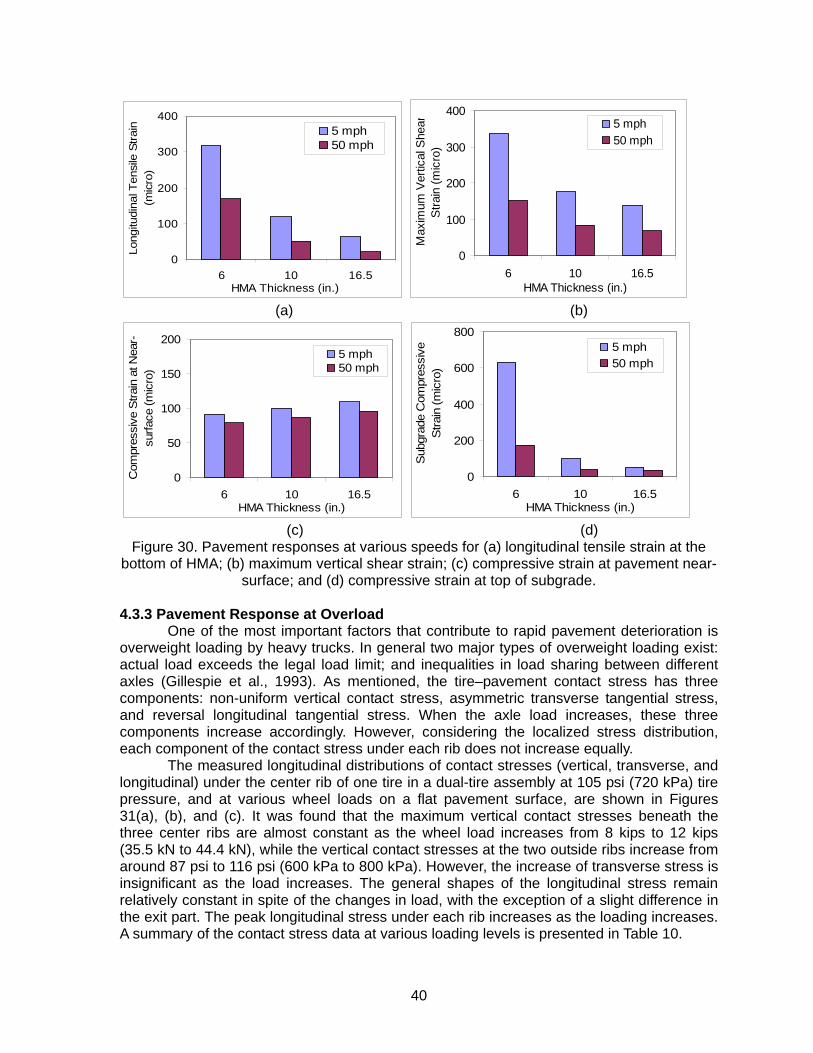
40
0
100
200
300
400
6 10 16.5HMA Thickness (in.)
Long
itudi
nal T
ensi
le S
train
(m
icro
)5 mph50 mph
0
100
200
300
400
6 10 16.5HMA Thickness (in.)
Max
imum
Ver
tical
She
arS
train
(mic
ro)
5 mph50 mph
(a) (b)
0
50
100
150
200
6 10 16.5HMA Thickness (in.)
Com
pres
sive
Stra
in a
t Nea
r-su
rface
(mic
ro)
5 mph50 mph
0
200
400
600
800
6 10 16.5HMA Thickness (in.)
Sub
grad
e C
ompr
essi
ve
Stra
in (m
icro
)
5 mph50 mph
(c) (d)
Figure 30. Pavement responses at various speeds for (a) longitudinal tensile strain at the bottom of HMA; (b) maximum vertical shear strain; (c) compressive strain at pavement near-
surface; and (d) compressive strain at top of subgrade. 4.3.3 Pavement Response at Overload
One of the most important factors that contribute to rapid pavement deterioration is overweight loading by heavy trucks. In general two major types of overweight loading exist: actual load exceeds the legal load limit; and inequalities in load sharing between different axles (Gillespie et al., 1993). As mentioned, the tire–pavement contact stress has three components: non-uniform vertical contact stress, asymmetric transverse tangential stress, and reversal longitudinal tangential stress. When the axle load increases, these three components increase accordingly. However, considering the localized stress distribution, each component of the contact stress under each rib does not increase equally.
The measured longitudinal distributions of contact stresses (vertical, transverse, and longitudinal) under the center rib of one tire in a dual-tire assembly at 105 psi (720 kPa) tire pressure, and at various wheel loads on a flat pavement surface, are shown in Figures 31(a), (b), and (c). It was found that the maximum vertical contact stresses beneath the three center ribs are almost constant as the wheel load increases from 8 kips to 12 kips (35.5 kN to 44.4 kN), while the vertical contact stresses at the two outside ribs increase from around 87 psi to 116 psi (600 kPa to 800 kPa). However, the increase of transverse stress is insignificant as the load increases. The general shapes of the longitudinal stress remain relatively constant in spite of the changes in load, with the exception of a slight difference in the exit part. The peak longitudinal stress under each rib increases as the loading increases. A summary of the contact stress data at various loading levels is presented in Table 10.
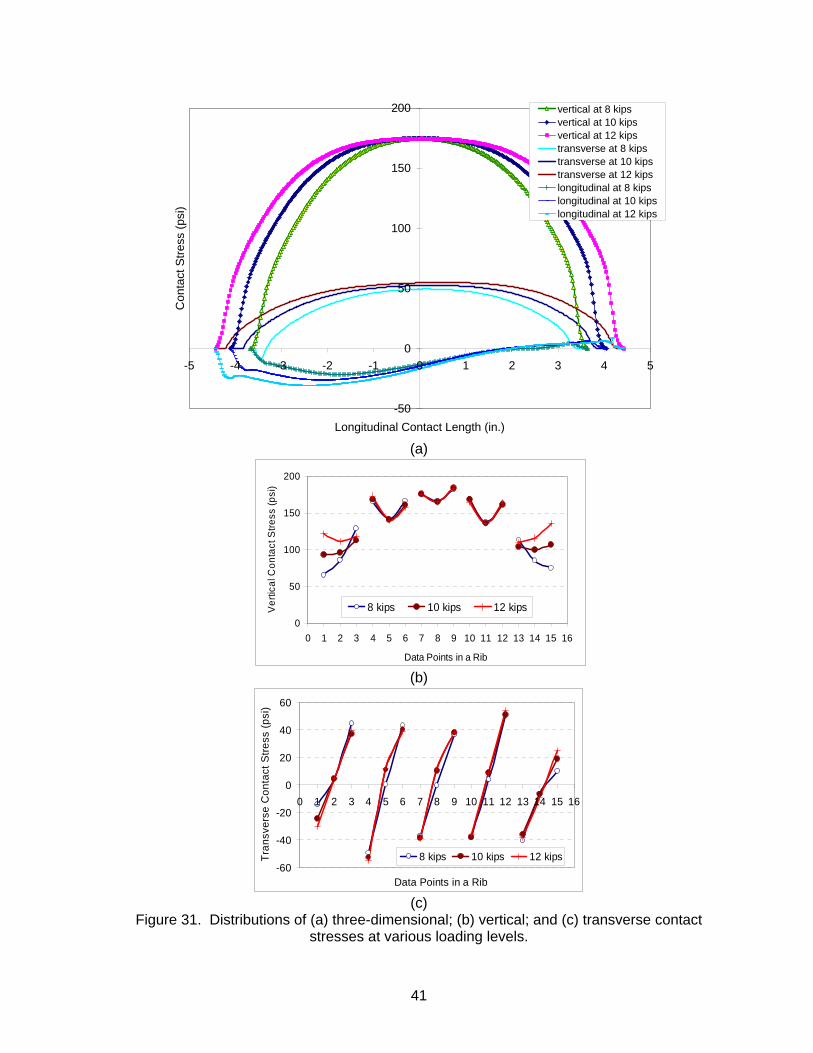
41
-50
0
50
100
150
200
-5 -4 -3 -2 -1 0 1 2 3 4 5
Longitudinal Contact Length (in.)
Con
tact
Stre
ss (p
si)
vertical at 8 kipsvertical at 10 kipsvertical at 12 kipstransverse at 8 kipstransverse at 10 kipstransverse at 12 kipslongitudinal at 8 kipslongitudinal at 10 kipslongitudinal at 12 kips
(a)
0
50
100
150
200
0 1 2 3 4 5 6 7 8 9 10 11 12 13 14 15 16
Data Points in a Rib
Ver
tical
Con
tact
Stre
ss (p
si)
8 kips 10 kips 12 kips
(b)
-60
-40
-20
0
20
40
60
0 1 2 3 4 5 6 7 8 9 10 11 12 13 14 15 16
Data Points in a Rib
Tran
sver
se C
onta
ct S
tress
(psi
)
8 kips 10 kips 12 kips
(c)
Figure 31. Distributions of (a) three-dimensional; (b) vertical; and (c) transverse contact stresses at various loading levels.

42
Table 10. Summary of Contact Stresses at Various Loading Levels
Load (kips)
Contact area (in.2)
Average stress (psi)
Peak stresses (psi) Vertical stress
Transverse stress
Longitudinal stress
8 78.6 101 175 51 21 10 95.2 105 175 53 28 12 106.3 113 175 54 32
The calculated pavement responses (longitudinal strain, vertical shear strain at near-
surface, compressive strain at near-surface, and compressive strain at the top of subgrade) for various loads (100 psi, 5 mph, and 77°F [690 kPa, 8k m/h, and 25°C]) are shown in Figures 32(a), (b), (c), and (d). In general, the pavement responses increase as the axle load increases, and the relationship between load and response is close to linear. As the load increases from 8 kips to 12 kips (35.5 kN to 53.3 kN), the vertical shear strain, longitudinal tensile strain at the bottom of HMA, and compressive strain at the top of subgrade increase by about 31 to 51%, depending on pavement thicknesses. However, the compressive strain at pavement near-surface increases by 17 to 24% as the load increases by 40%. This is due to the fact that the compressive strain at near-surface is mainly controlled by the localized tire vertical contact stress. As the load increases, the vertical contact stress under center ribs increases insignificantly.
0
200
400
600
6 10 16.5HMA Thickness (in.)
Long
itudi
nal S
train
(mic
ro) 8 kips
10 kips12 kips
0
200
400
600
6 10 16.5HMA Thickness (in.)
Max
imum
Ver
tical
She
ar S
trai
n (m
icro
)
8 kips10 kips12 kips
(a) (b)
0
100
200
300
6 10 16.5HMA Thickness (in.)
Com
pres
sive
Stra
in a
t Nea
r-S
urfa
ce (m
icro
)
8 kips10 kips12 kips
0
300
600
900
6 10 16.5HMA Thickness (in.)
Sub
grad
e C
ompr
essi
ve S
train
(mic
ro)
8 kips10 kips12 kips
(c) (d)
Figure 32. Pavement responses at different loads for (a) longitudinal tensile strain at the bottom of HMA; (b) maximum vertical shear strain; (c) compressive strain at pavement near-
surface; and (d) compressive strain at top of subgrade.
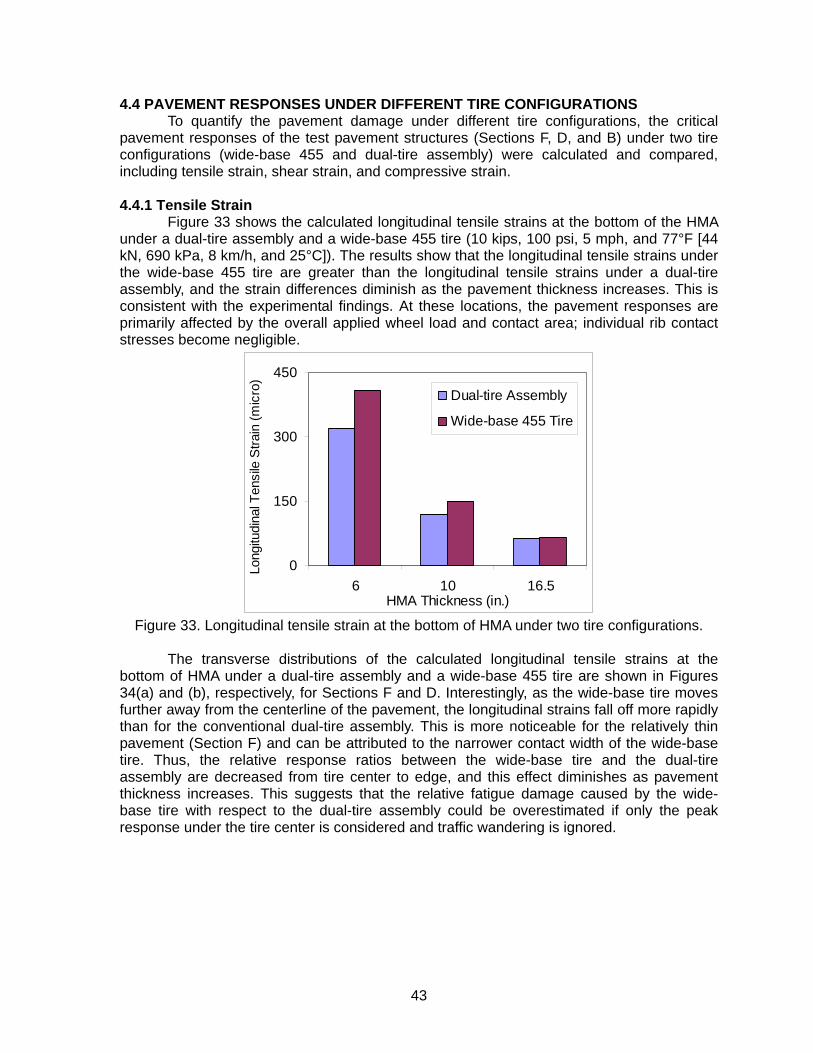
43
4.4 PAVEMENT RESPONSES UNDER DIFFERENT TIRE CONFIGURATIONS To quantify the pavement damage under different tire configurations, the critical
pavement responses of the test pavement structures (Sections F, D, and B) under two tire configurations (wide-base 455 and dual-tire assembly) were calculated and compared, including tensile strain, shear strain, and compressive strain. 4.4.1 Tensile Strain
Figure 33 shows the calculated longitudinal tensile strains at the bottom of the HMA under a dual-tire assembly and a wide-base 455 tire (10 kips, 100 psi, 5 mph, and 77°F [44 kN, 690 kPa, 8 km/h, and 25°C]). The results show that the longitudinal tensile strains under the wide-base 455 tire are greater than the longitudinal tensile strains under a dual-tire assembly, and the strain differences diminish as the pavement thickness increases. This is consistent with the experimental findings. At these locations, the pavement responses are primarily affected by the overall applied wheel load and contact area; individual rib contact stresses become negligible.
0
150
300
450
6 10 16.5HMA Thickness (in.)
Long
itudi
nal T
ensi
le S
train
(mic
ro)
Dual-tire Assembly
Wide-base 455 Tire
Figure 33. Longitudinal tensile strain at the bottom of HMA under two tire configurations.
The transverse distributions of the calculated longitudinal tensile strains at the
bottom of HMA under a dual-tire assembly and a wide-base 455 tire are shown in Figures 34(a) and (b), respectively, for Sections F and D. Interestingly, as the wide-base tire moves further away from the centerline of the pavement, the longitudinal strains fall off more rapidly than for the conventional dual-tire assembly. This is more noticeable for the relatively thin pavement (Section F) and can be attributed to the narrower contact width of the wide-base tire. Thus, the relative response ratios between the wide-base tire and the dual-tire assembly are decreased from tire center to edge, and this effect diminishes as pavement thickness increases. This suggests that the relative fatigue damage caused by the wide-base tire with respect to the dual-tire assembly could be overestimated if only the peak response under the tire center is considered and traffic wandering is ignored.
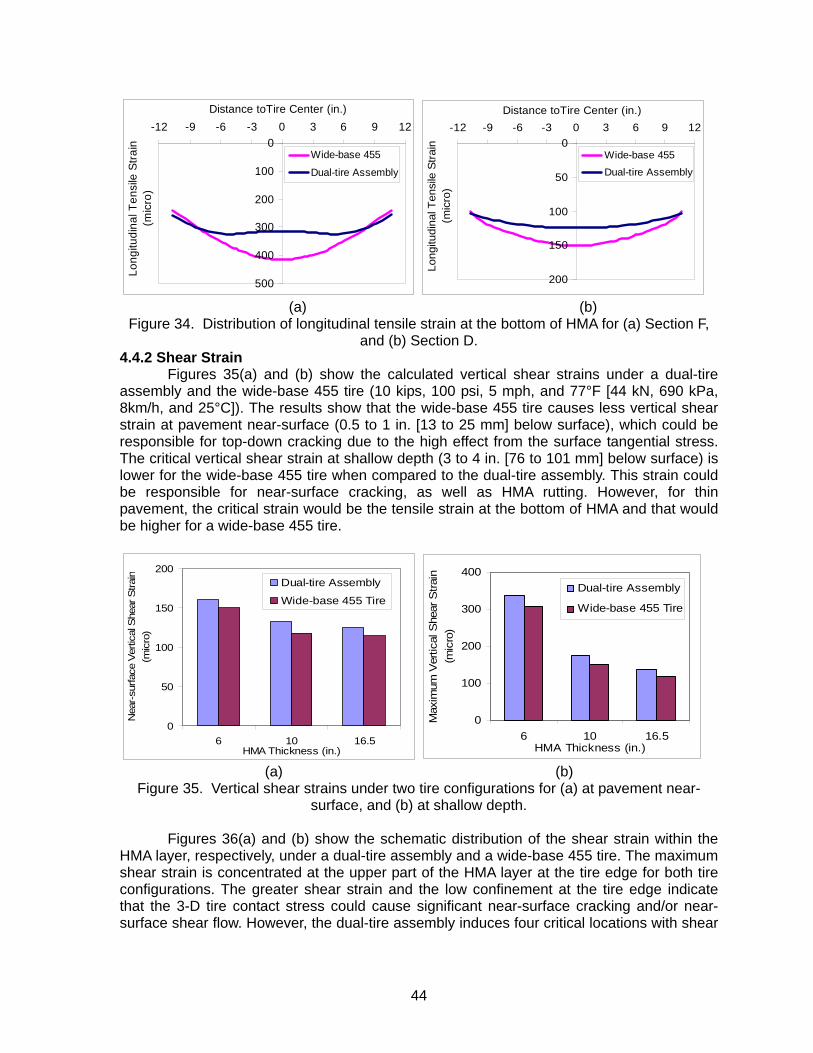
44
0
100
200
300
400
500
-12 -9 -6 -3 0 3 6 9 12Distance toTire Center (in.)
Long
itudi
nal T
ensi
le S
train
(m
icro
)Wide-base 455
Dual-tire Assembly
0
50
100
150
200
-12 -9 -6 -3 0 3 6 9 12Distance toTire Center (in.)
Long
itudi
nal T
ensi
le S
train
(m
icro
)
Wide-base 455
Dual-tire Assembly
(a) (b)
Figure 34. Distribution of longitudinal tensile strain at the bottom of HMA for (a) Section F, and (b) Section D.
4.4.2 Shear Strain Figures 35(a) and (b) show the calculated vertical shear strains under a dual-tire
assembly and the wide-base 455 tire (10 kips, 100 psi, 5 mph, and 77°F [44 kN, 690 kPa, 8km/h, and 25°C]). The results show that the wide-base 455 tire causes less vertical shear strain at pavement near-surface (0.5 to 1 in. [13 to 25 mm] below surface), which could be responsible for top-down cracking due to the high effect from the surface tangential stress. The critical vertical shear strain at shallow depth (3 to 4 in. [76 to 101 mm] below surface) is lower for the wide-base 455 tire when compared to the dual-tire assembly. This strain could be responsible for near-surface cracking, as well as HMA rutting. However, for thin pavement, the critical strain would be the tensile strain at the bottom of HMA and that would be higher for a wide-base 455 tire.
0
50
100
150
200
6 10 16.5HMA Thickness (in.)
Nea
r-su
rface
Ver
tical
She
ar S
train
(m
icro
)
Dual-tire Assembly
Wide-base 455 Tire
0
100
200
300
400
6 10 16.5HMA Thickness (in.)
Max
imum
Ver
tical
She
ar S
train
(m
icro
)
Dual-tire Assembly
Wide-base 455 Tire
(a) (b)
Figure 35. Vertical shear strains under two tire configurations for (a) at pavement near-surface, and (b) at shallow depth.
Figures 36(a) and (b) show the schematic distribution of the shear strain within the
HMA layer, respectively, under a dual-tire assembly and a wide-base 455 tire. The maximum shear strain is concentrated at the upper part of the HMA layer at the tire edge for both tire configurations. The greater shear strain and the low confinement at the tire edge indicate that the 3-D tire contact stress could cause significant near-surface cracking and/or near-surface shear flow. However, the dual-tire assembly induces four critical locations with shear

45
strain concentration at both edges of two tires, while the wide-base tire causes only two critical locations at both edges of one tire.
An outward shear flow trend away from the tire center is clearly observed under a 3-D contact stress loading condition. It is also noted that the high shear strain concentration is found under the tire ribs very close to pavement surface. This is probably due to the effect of transverse surface tangential stress at the two sides of each rib, and could be the primary cause of top-down cracking.
(a)
(b)
Figure 36. Schematic distribution of shear strain within HMA under (a) dual-tire assembly and (b) wide-base 455.
(Darker colors [red or blue] represent greater shear strain)
4.4.3 Compressive Strain Figures 37(a) and (b) show the calculated compressive strains at pavement near-
surface and at the top of the subgrade under a dual-tire assembly and a wide-base 455 tire (10 kips, 100 psi, 5 mph, and 77°F [44 kN, 690 kPa, 8 km/h, and 25°C]). The results show that the wide-base 455 tire causes greater compressive strain at the top of the subgrade than the dual-tire assembly. As the pavement thickness increases, the strain difference between the dual-tire assembly and the wide-base 455 tire diminishes. However, the compressive strain at pavement near-surface is less for the wide-base 455 tire because of the effect of tangential stresses, as well as the lower-middle rib contact stresses for the wide-base 455 tire.
0
50
100
150
6 10 16.5HMA Thickness (in.)
Com
pres
sive
Stra
in a
t Nea
r-S
urfa
ce (m
icro
)
Dual-tire Assembly
Wide-base 455Ti
0
200
400
600
800
1000
6 10 16.5HMA Thickness (in.)
Sub
grad
e C
ompr
essi
ve
Stra
in (
mic
ro)
Dual-tire Assembly
Wide-base 455Ti
(a) (b)
Figure 37. Compressive strains under two tire configurations for (a) at pavement near-surface; and (b) at top of subgrade.
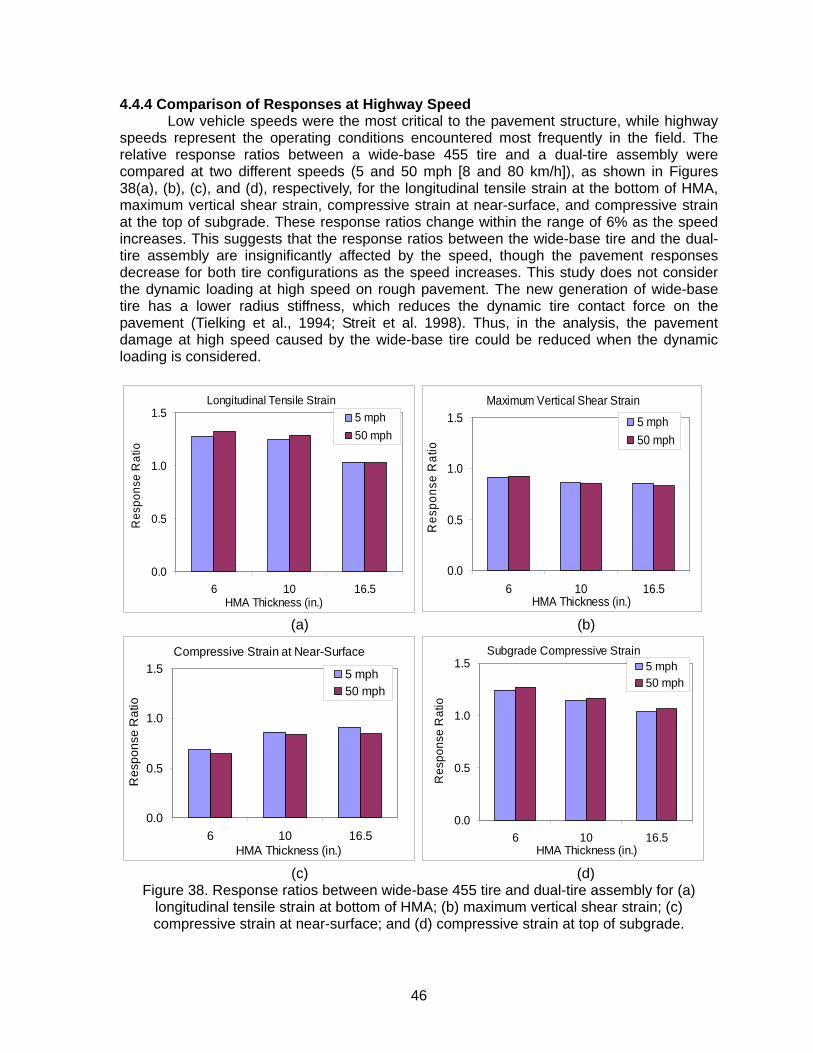
46
4.4.4 Comparison of Responses at Highway Speed Low vehicle speeds were the most critical to the pavement structure, while highway
speeds represent the operating conditions encountered most frequently in the field. The relative response ratios between a wide-base 455 tire and a dual-tire assembly were compared at two different speeds (5 and 50 mph [8 and 80 km/h]), as shown in Figures 38(a), (b), (c), and (d), respectively, for the longitudinal tensile strain at the bottom of HMA, maximum vertical shear strain, compressive strain at near-surface, and compressive strain at the top of subgrade. These response ratios change within the range of 6% as the speed increases. This suggests that the response ratios between the wide-base tire and the dual-tire assembly are insignificantly affected by the speed, though the pavement responses decrease for both tire configurations as the speed increases. This study does not consider the dynamic loading at high speed on rough pavement. The new generation of wide-base tire has a lower radius stiffness, which reduces the dynamic tire contact force on the pavement (Tielking et al., 1994; Streit et al. 1998). Thus, in the analysis, the pavement damage at high speed caused by the wide-base tire could be reduced when the dynamic loading is considered.
Longitudinal Tensile Strain
0.0
0.5
1.0
1.5
6 10 16.5HMA Thickness (in.)
Res
pons
e R
atio
5 mph50 mph
Maximum Vertical Shear Strain
0.0
0.5
1.0
1.5
6 10 16.5HMA Thickness (in.)
Res
pons
e R
atio
5 mph50 mph
(a) (b)
Compressive Strain at Near-Surface
0.0
0.5
1.0
1.5
6 10 16.5HMA Thickness (in.)
Res
pons
e R
atio
5 mph50 mph
Subgrade Compressive Strain
0.0
0.5
1.0
1.5
6 10 16.5HMA Thickness (in.)
Res
pons
e R
atio
5 mph50 mph
(c) (d)
Figure 38. Response ratios between wide-base 455 tire and dual-tire assembly for (a) longitudinal tensile strain at bottom of HMA; (b) maximum vertical shear strain; (c) compressive strain at near-surface; and (d) compressive strain at top of subgrade.
47
4.5 SUMMARY A 3-D FE model was developed to predict the pavement responses caused by
various tire configurations. The developed 3-D FE model incorporates the measured 3-D tire–pavement contact stress, HMA linear viscoelasticity, continuous moving load, and implicit dynamic analysis. The critical pavement responses of the test pavement structures at various tire loading conditions were calculated and compared, including tensile strain, shear strain, and compressive strain.
The analysis produced several noteworthy conclusions. Most important, longitudinal tensile strain at the bottom of HMA is a critical response in thin and medium-thickness HMA layers, while the critical response in thick HMA layer is the vertical shear strain at 3 to 4 in (76 to 100 mm) below the HMA surface. The latter is responsible for near-surface fatigue cracking, as well as HMA primary rutting. Top-down cracking could result from the local vertical shear strain in the upper 1 in. (25 mm) of the HMA where the effect of tire–pavement tangential stresses is the highest. In addition, the speed and load effect is more pronounced on the pavement responses at a deeper depth than the pavement responses at the pavement surface.
The analysis produced some findings about wide-based tires, including that the wide-base tire caused higher longitudinal tensile strain at the bottom of HMA and compressive strain at the top of subgrade, where those responses are highly affected by the total wheel load. The differences in strains between the two tire configurations diminish as the pavement depth increases. On the other hand, the wide-base tire caused less vertical shear and compressive strains near the surface than that of a dual-tire assembly loading, regardless of HMA thicknesses. Although the pavement responses decrease as speed increases, the response ratio between the dual-tire assembly and wide-base tire is not significantly influenced by speed.

48
CHAPTER 5 PAVEMENT DAMAGE QUANTIFICATION 5.1 PAVEMENT DAMAGE MODELS
Pavement damage may result from load-induced or non-load-associated causes such as repeated impulsive traffic loading, environment, deficient construction, or lack of proper maintenance strategies. Load-induced pavement damage is the main focus of this study. Hence, five general failure mechanisms caused by various tire configurations were considered for flexible pavement: fatigue cracking, HMA rutting (primary rutting), subgrade rutting (secondary rutting), top-down cracking, and near-surface cracking.
5.1.1 Fatigue Cracking
Fatigue cracking is generally known to be caused by the accumulation of longitudinal or horizontal strains at the bottom of an HMA layer, which is generally caused by repeated heavy axle loads. Several models are available to predict fatigue cracking from the tensile strain at the bottom of HMA. The proposed AASHTO 2002 MEPDG (ARA, 2004) determines the number of allowable load applications for fatigue cracking as follows:
281.1
9492.3'1
1)1(00432.0 ⎟⎠⎞
⎜⎝⎛⋅⋅⋅=
ECkN
tf ε
(12)
MC 10= (13)
⎟⎟⎠
⎞⎜⎜⎝
⎛−
+= 69.084.4
ba
b
VVVM (14)
( )ache
k∗−+
+=
49.302.11
1
1003602.0000398.0
1' (15)
where,
fN = number of 18-kip equivalent single axle loads (ESAL);
tε = tensile strain at the bottom of HMA; E = resilient modulus of HMA (psi);
ach = HMA thickness (in.);
aV = air void (%); and
bV = effective binder content by volume (%).
5.1.2 Top-Down Cracking and Near-Surface Cracking Top-down cracking has recently been recognized as longitudinal and/or transverse
cracks that appear at the pavement surface. The proposed AASHTO 2002 MEPDG (ARA, 2004) uses the same transfer function as fatigue cracking for top-down cracking, while it has a different definition of the correction factor of '
1k , as follows:

49
281.1
9492.3'1
1)1(00432.0 ⎟⎠⎞
⎜⎝⎛⋅⋅⋅=
ECkN
tf ε
(16)
MC 10= (17)
⎟⎟⎠
⎞⎜⎜⎝
⎛−
+= 69.084.4
ba
b
VVVM (18)
( )ache
k∗−+
+=
8186.2676.15
1
11201.0
1' (19)
where,
fN = number of 18-kip equivalent single axle loads (ESAL);
tε = tensile strain at pavement surface ; E = resilient modulus of HMA (psi);
ach = HMA thickness (in.);
aV = air void (%); and
bV = effective binder content by volume (%). It is noted that Equations 16 through 19 were originally derived for tensile strain at
pavement surface, and these equations were used here for shear strain to calculate the relative damage ratios caused by various tire configurations for top-down cracking and near-surface cracking. The exact relationship between shear strain and top-down cracking and/or near-surface cracking damage requires further investigation.
5.1.3 HMA (Primary) Rutting
Primary rutting is the unrecoverable depression in the wheel-path caused by permanent deformation of HMA in hot weather or under slow-moving vehicles. The general form of HMA rutting comes from the statistical analysis of repeated-load permanent deformation tests in the laboratory. The following transfer function is suggested by the AASHTO 2002 MEPDG (ARA, 2004).
( ) ( )Tlog02755.2Nlog4262.074938.3log rr
p ++−=⎟⎟⎠
⎞⎜⎜⎝
⎛εε
(20)
where,
εp =accumulative permanent strain at the surface fixed at 0.6 in. (15mm); εr = recoverable strain; Nr = number of repetitions corresponding to pε ; and T = pavement temperature (°C). Equation (20) may be re-written as follows (Prophète, 2003):
74.1
xvr
r 10h15N ⎟⎟
⎠
⎞⎜⎜⎝
⎛ε
= (21)
where,
x = -3.74938 + 2.02755 log (T);

50
T = temperature; h = HMA thickness (mm); and
vrε = vertical recoverable strain.
5.1.4 Subgrade (Secondary) Rutting Subgrade rutting is a longitudinal wheel-path depression that occurs when the
subgrade exhibits permanent deformation caused by mostly shear strain due to repetitive traffic loading. In this case, the vertical compressive strain at the top of the subgrade is related to subgrade rutting (secondary rutting) of the pavement. The Asphalt Institute (1982) proposed a rutting damage model based on roadbed soil strain with the maximum threshold of 0.5 in. (12.5 mm) rutting on top of subgrade, as follows:
9 4.4771.365 10 ( )f vN ε− −= × (22) where,
fN = allowable load repetitions, and
vε = maximum vertical compressive strain on top of the subgrade.
5.1.5 IDOT Pavement Design Equation The IDOT’s mechanistic-empirical design procedure for conventional flexible
pavement (HMA and granular material) and full-depth flexible pavement is based on resilient soil and material testing procedures, the ILLI-PAVE structural model, and the design algorithms developed from an extensive ILLI-PAVE database. In this design procedure, an alternative format of HMA fatigue equation is used, as shown in Equation 23 (Carpenter, 2007).
0.4
9 11065.2N⎟⎟⎟⎟
⎠
⎞
⎜⎜⎜⎜
⎝
⎛−×=
tε
(23)
where,
N = number of 18-kip equivalent single-axle loads (ESAL); and tε = tensile strain at the bottom of HMA layer.
In addition, HMA rutting is considered by material selection and HMA design
procedure. Granular base rutting is controlled by establishing a minimum thickness of HMA layer to limit the stress state in the granular layer to a level that will not produce unacceptable rutting. Subgrade rutting potential is controlled by limiting the subgrade stress ratio (the ratio of subgrade deviator stress at top of subgrade to subgrade unconfined compressive strength) to acceptable levels (Alvarez and Thompson, 1998).
5.2 PAVEMENT DAMAGE RATIO
The damage ratio for various tire configurations with respect to a 10-kip (44.4-kN) dual-tire assembly is calculated as follows:
NNDR ref /= (24) where,
DR = damage ratio of tire loading with respect to a reference load for the considered failure mechanism (fatigue cracking, near-surface cracking, top-down cracking, primary rutting, and secondary rutting);

51
Nref = allowable number of loading repetitions to failure for a reference load (dual-tire assembly at 10-kip (44.4-kN) load); and N = allowable number of loading repetitions to failure for specific tire loading.
5.2.1 Damage Ratio for Fatigue Cracking The fatigue damage ratios caused by various tire configurations with respect to a 10-
kip (44.4-kN) dual-tire assembly were calculated using the field strain measurements in the APT and Equation 23, as shown in Table 11. The results show that the wide-base 425 tire induces the greatest fatigue damage among the three tire configurations, while the dual-tire assembly exhibits the lowest. It is evident that the new generation of 455 wide-base tire causes less damage than the old-generation 425 wide-base tire, regardless of pavement structure and load levels. As mentioned in the pavement response analysis, the damage ratios were calculated using the peak longitudinal strain. The relative fatigue damage potential caused by the wide-base tire in thin pavements could be reduced when considering the wandering effect and possible pressure differential in dual tires.
Table 11. Damage Ratios for Fatigue Cracking Using Field Strain Measurements
Load (kips)
16.5-in. HMA 10-in. HMA 6-in. HMA
Dual W 425 W455 Dual W 425 W455 Dual W 425 W455
6 0.24 0.48 0.41 0.19 0.82 0.62 0.19 0.75 0.61
8 0.59 1.01 0.74 0.51 1.75 1.28 0.55 1.50 1.42
10 1.00 1.58 1.19 1.00 3.20 2.22 1.00 2.74 2.54
12 1.48 2.55 1.95 1.63 4.90 3.27 2.03 5.35 4.03
14 2.16 4.19 3.25 2.31 7.28 4.74 3.25 7.77 5.93
5.2.2 Damage Ratio for Different Failure Mechanisms Using the calculated pavement responses from the FE model and the previously
mentioned damage transfer functions (Equations 12 through 22), Tables 12 to 16 present the calculated damage ratios caused by different tire configurations with respect to a 10-kip (44.4-kN) dual-tire assembly (100 psi, 5 mph, and 77oF [690 kPa, 8 km/h, and 25oC]), for respectively, fatigue cracking, top-down cracking, near-surface cracking, HMA rutting, and subgrade rutting. It was found that the wide-base 455 tire caused greater fatigue damage and subgrade rutting than the conventional dual-tire assembly when carrying the same load. However, the relative damage ratios between the two tire configurations decreased as the pavement thickness increased. On the other hand, the wide-base 455 tire caused less HMA rutting, top-down cracking, and near-surface cracking damage than the conventional dual-tire assembly. This suggests that the new wide-base 455 tire performs better at pavement near-surface, while it causes greater damage at a deeper pavement depth.

52
Table 12. Damage Ratios for Fatigue Cracking
Load (kips)
HMA Thickness
(in.)
Dual-tire Assembly Wide-Base 455 Tire
Tensile Strain Damage Ratio Tensile Strain Damage
Ratio
8 6 265 0.49 345 1.38 10 102 0.53 128 1.29
16.5 54 0.54 57 0.67
10 6 318 1.00 406 2.62 10 120 1.00 150 2.41
16.5 63 1.00 65 1.13
12 6 380 2.02 466 4.52 10 139 1.79 168 3.78
16.5 71 1.60 72 1.69
Table 13. Damage Ratios for Top-down Cracking
Load (kips)
HMA Thickness
(in.)
Dual-tire Assembly Wide-Base 455 Tire Shear Strain at
Near-surface Damage
Ratio Shear Strain at
Near-surface Damage
Ratio
8 6 139 0.57 129 0.43 10 94 0.26 83 0.16
16.5 86 0.23 73 0.12
10 6 160 1.00 150 0.78 10 132 1.00 118 0.64
16.5 125 1.00 114 0.70
12 6 193 2.10 185 1.77 10 146 1.49 127 0.86
16.5 136 1.40 125 1.00
Table 14. Damage Ratios for Near-Surface Cracking
Load (kips)
HMA Thickness
(in.)
Dual-tire Assembly Wide-Base 455 Tire Critical Shear
Strain Damage
Ratio Critical Shear
Strain Damage
Ratio
8 6 283 0.50 259 0.35 10 136 0.36 108 0.15
16.5 112 0.44 88 0.17
10 6 337 1.00 310 0.72 10 176 1.00 152 0.56
16.5 138 1.00 118 0.54
12 6 384 1.67 355 1.23 10 205 1.83 178 1.05
16.5 162 1.88 138 1.00
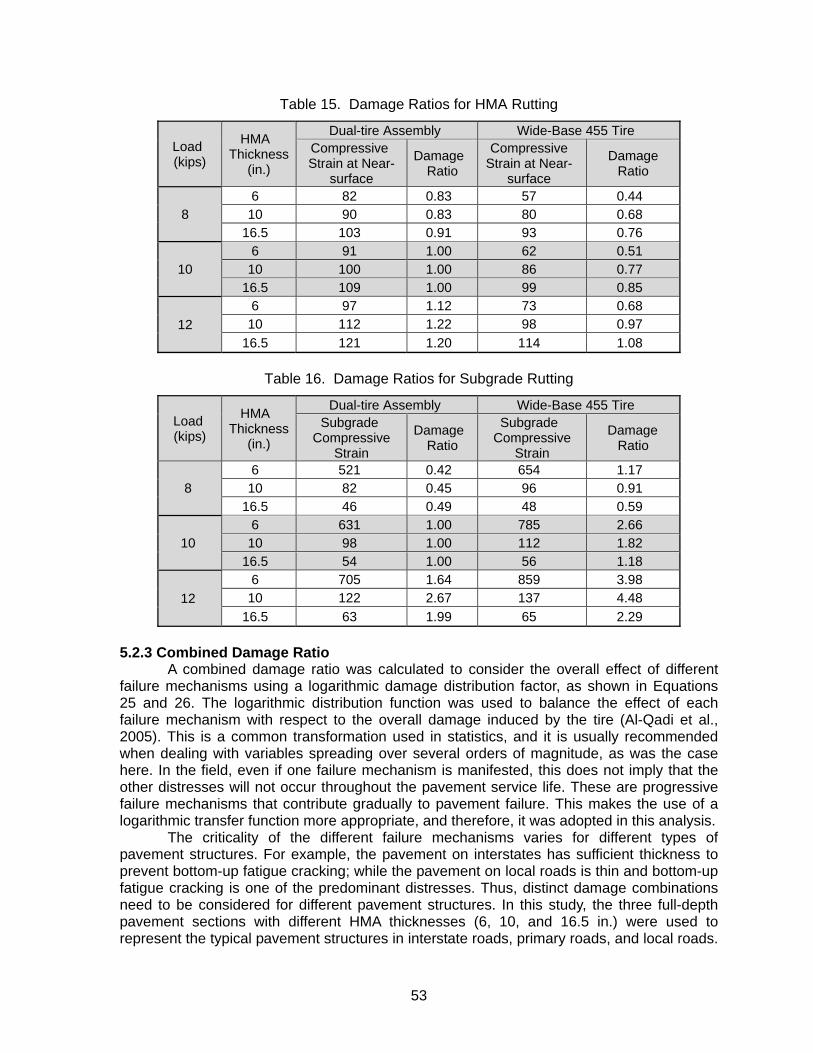
53
Table 15. Damage Ratios for HMA Rutting
Load (kips)
HMA Thickness
(in.)
Dual-tire Assembly Wide-Base 455 Tire Compressive Strain at Near-
surface
Damage Ratio
Compressive Strain at Near-
surface
Damage Ratio
8 6 82 0.83 57 0.44 10 90 0.83 80 0.68
16.5 103 0.91 93 0.76
10 6 91 1.00 62 0.51 10 100 1.00 86 0.77
16.5 109 1.00 99 0.85
12 6 97 1.12 73 0.68 10 112 1.22 98 0.97
16.5 121 1.20 114 1.08
Table 16. Damage Ratios for Subgrade Rutting
Load (kips)
HMA Thickness
(in.)
Dual-tire Assembly Wide-Base 455 Tire Subgrade
Compressive Strain
Damage Ratio
Subgrade Compressive
Strain
Damage Ratio
8 6 521 0.42 654 1.17 10 82 0.45 96 0.91
16.5 46 0.49 48 0.59
10 6 631 1.00 785 2.66 10 98 1.00 112 1.82
16.5 54 1.00 56 1.18
12 6 705 1.64 859 3.98 10 122 2.67 137 4.48
16.5 63 1.99 65 2.29
5.2.3 Combined Damage Ratio A combined damage ratio was calculated to consider the overall effect of different
failure mechanisms using a logarithmic damage distribution factor, as shown in Equations 25 and 26. The logarithmic distribution function was used to balance the effect of each failure mechanism with respect to the overall damage induced by the tire (Al-Qadi et al., 2005). This is a common transformation used in statistics, and it is usually recommended when dealing with variables spreading over several orders of magnitude, as was the case here. In the field, even if one failure mechanism is manifested, this does not imply that the other distresses will not occur throughout the pavement service life. These are progressive failure mechanisms that contribute gradually to pavement failure. This makes the use of a logarithmic transfer function more appropriate, and therefore, it was adopted in this analysis.
The criticality of the different failure mechanisms varies for different types of pavement structures. For example, the pavement on interstates has sufficient thickness to prevent bottom-up fatigue cracking; while the pavement on local roads is thin and bottom-up fatigue cracking is one of the predominant distresses. Thus, distinct damage combinations need to be considered for different pavement structures. In this study, the three full-depth pavement sections with different HMA thicknesses (6, 10, and 16.5 in.) were used to represent the typical pavement structures in interstate roads, primary roads, and local roads.
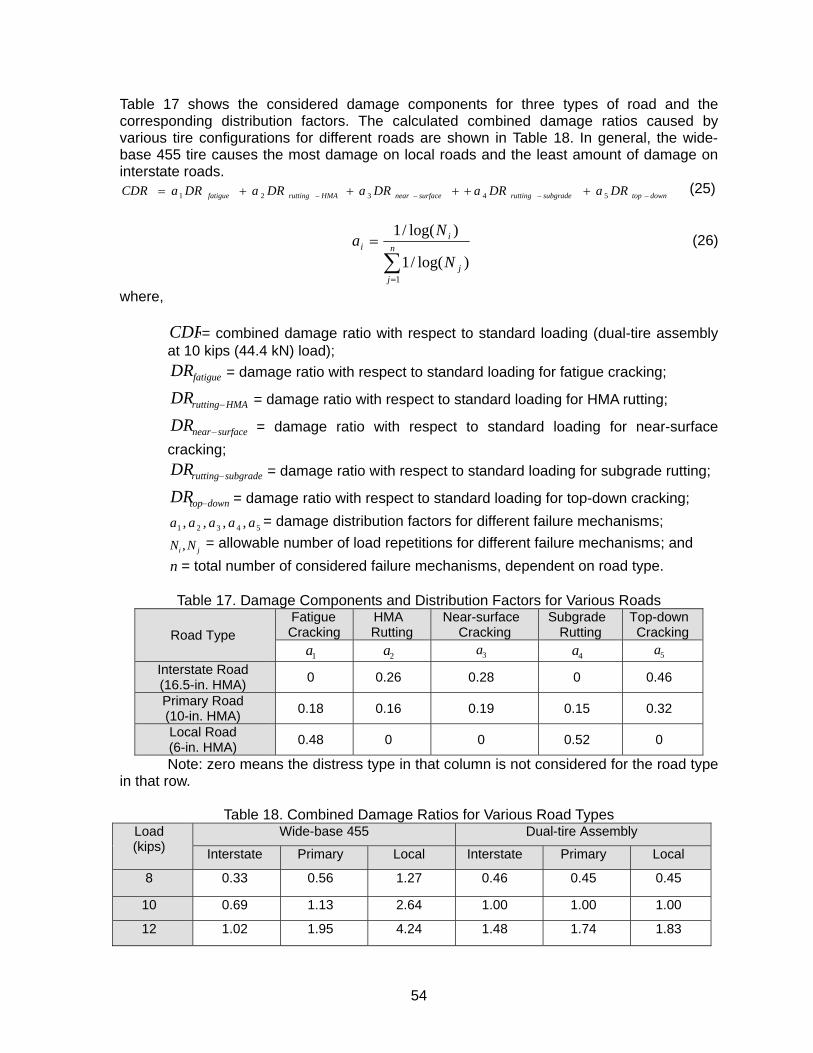
54
Table 17 shows the considered damage components for three types of road and the corresponding distribution factors. The calculated combined damage ratios caused by various tire configurations for different roads are shown in Table 18. In general, the wide-base 455 tire causes the most damage on local roads and the least amount of damage on interstate roads.
downtopsubgraderuttingsurfacenearHMAruttingfatigue DRaDRaDRaDRaDRaCDR −−−− +++++= 54321 (25)
∑=
= n
jj
ii
N
Na
1)log(/1
)log(/1 (26)
where, CDR= combined damage ratio with respect to standard loading (dual-tire assembly at 10 kips (44.4 kN) load);
fatigueDR = damage ratio with respect to standard loading for fatigue cracking;
HMAruttingDR − = damage ratio with respect to standard loading for HMA rutting;
surfacenearDR − = damage ratio with respect to standard loading for near-surface cracking;
subgraderuttingDR − = damage ratio with respect to standard loading for subgrade rutting;
downtopDR − = damage ratio with respect to standard loading for top-down cracking;
54321 ,,,, aaaaa = damage distribution factors for different failure mechanisms;
ji NN , = allowable number of load repetitions for different failure mechanisms; and n = total number of considered failure mechanisms, dependent on road type.
Table 17. Damage Components and Distribution Factors for Various Roads
Road Type Fatigue Cracking
HMA Rutting
Near-surface Cracking
Subgrade Rutting
Top-down Cracking
1a 2a 3a 4a 5aInterstate Road (16.5-in. HMA) 0 0.26 0.28 0 0.46
Primary Road (10-in. HMA) 0.18 0.16 0.19 0.15 0.32
Local Road (6-in. HMA) 0.48 0 0 0.52 0
Note: zero means the distress type in that column is not considered for the road type in that row.
Table 18. Combined Damage Ratios for Various Road Types
Load (kips)
Wide-base 455 Dual-tire Assembly
Interstate Primary Local Interstate Primary Local
8 0.33 0.56 1.27 0.46 0.45 0.45
10 0.69 1.13 2.64 1.00 1.00 1.00
12 1.02 1.95 4.24 1.48 1.74 1.83
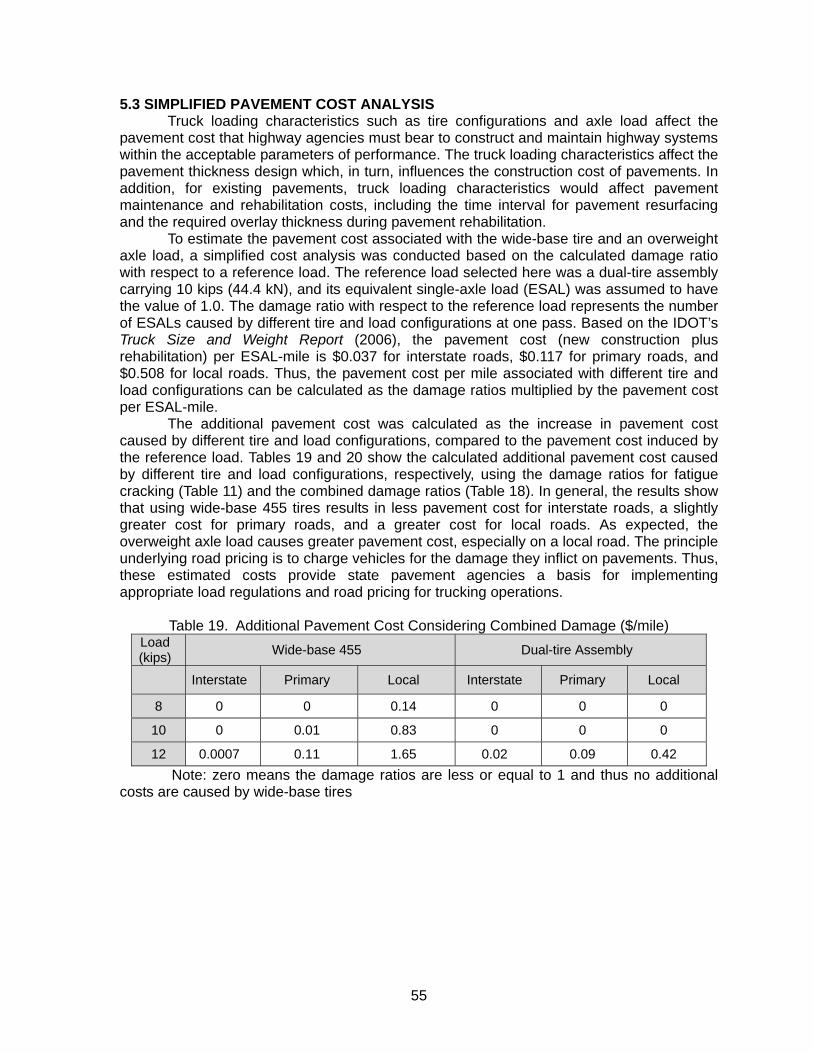
55
5.3 SIMPLIFIED PAVEMENT COST ANALYSIS Truck loading characteristics such as tire configurations and axle load affect the
pavement cost that highway agencies must bear to construct and maintain highway systems within the acceptable parameters of performance. The truck loading characteristics affect the pavement thickness design which, in turn, influences the construction cost of pavements. In addition, for existing pavements, truck loading characteristics would affect pavement maintenance and rehabilitation costs, including the time interval for pavement resurfacing and the required overlay thickness during pavement rehabilitation.
To estimate the pavement cost associated with the wide-base tire and an overweight axle load, a simplified cost analysis was conducted based on the calculated damage ratio with respect to a reference load. The reference load selected here was a dual-tire assembly carrying 10 kips (44.4 kN), and its equivalent single-axle load (ESAL) was assumed to have the value of 1.0. The damage ratio with respect to the reference load represents the number of ESALs caused by different tire and load configurations at one pass. Based on the IDOT’s Truck Size and Weight Report (2006), the pavement cost (new construction plus rehabilitation) per ESAL-mile is $0.037 for interstate roads, $0.117 for primary roads, and $0.508 for local roads. Thus, the pavement cost per mile associated with different tire and load configurations can be calculated as the damage ratios multiplied by the pavement cost per ESAL-mile.
The additional pavement cost was calculated as the increase in pavement cost caused by different tire and load configurations, compared to the pavement cost induced by the reference load. Tables 19 and 20 show the calculated additional pavement cost caused by different tire and load configurations, respectively, using the damage ratios for fatigue cracking (Table 11) and the combined damage ratios (Table 18). In general, the results show that using wide-base 455 tires results in less pavement cost for interstate roads, a slightly greater cost for primary roads, and a greater cost for local roads. As expected, the overweight axle load causes greater pavement cost, especially on a local road. The principle underlying road pricing is to charge vehicles for the damage they inflict on pavements. Thus, these estimated costs provide state pavement agencies a basis for implementing appropriate load regulations and road pricing for trucking operations.
Table 19. Additional Pavement Cost Considering Combined Damage ($/mile)
Load (kips) Wide-base 455 Dual-tire Assembly
Interstate Primary Local Interstate Primary Local
8 0 0 0.14 0 0 0
10 0 0.01 0.83 0 0 0
12 0.0007 0.11 1.65 0.02 0.09 0.42 Note: zero means the damage ratios are less or equal to 1 and thus no additional
costs are caused by wide-base tires
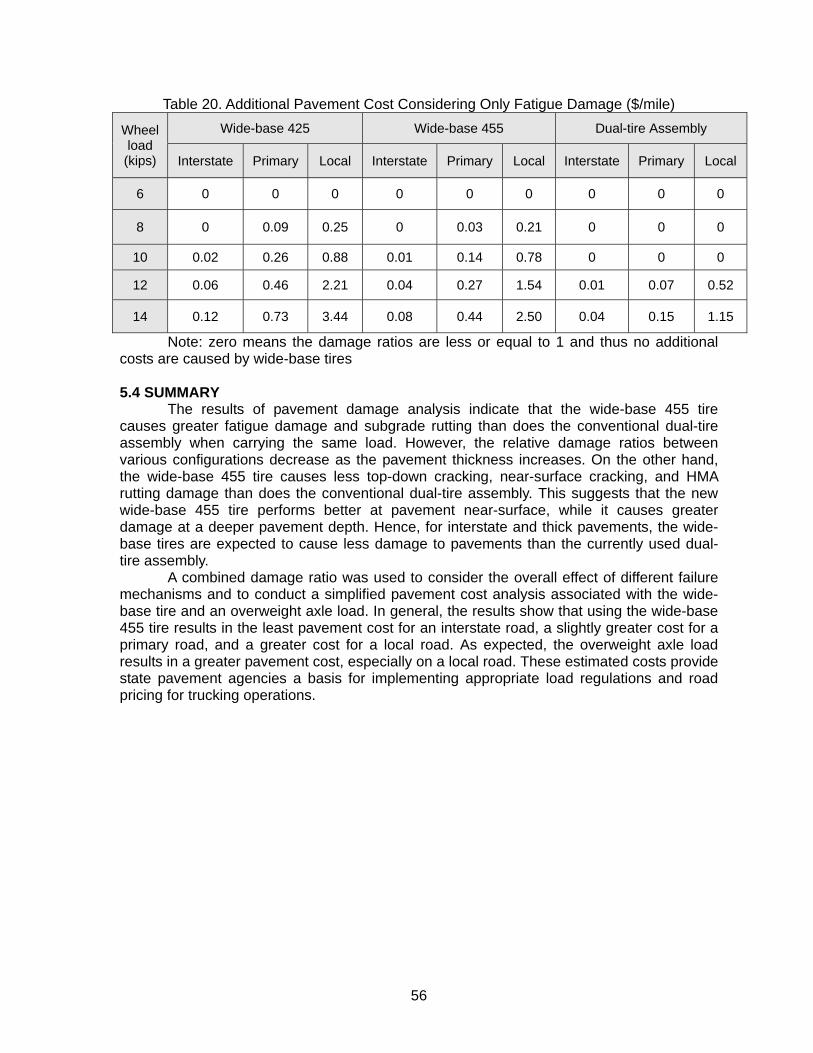
56
Table 20. Additional Pavement Cost Considering Only Fatigue Damage ($/mile)
Wheel load (kips)
Wide-base 425 Wide-base 455 Dual-tire Assembly
Interstate Primary Local Interstate Primary Local Interstate Primary Local
6 0 0 0 0 0 0 0 0 0
8 0 0.09 0.25 0 0.03 0.21 0 0 0
10 0.02 0.26 0.88 0.01 0.14 0.78 0 0 0
12 0.06 0.46 2.21 0.04 0.27 1.54 0.01 0.07 0.52
14 0.12 0.73 3.44 0.08 0.44 2.50 0.04 0.15 1.15
Note: zero means the damage ratios are less or equal to 1 and thus no additional costs are caused by wide-base tires
5.4 SUMMARY
The results of pavement damage analysis indicate that the wide-base 455 tire causes greater fatigue damage and subgrade rutting than does the conventional dual-tire assembly when carrying the same load. However, the relative damage ratios between various configurations decrease as the pavement thickness increases. On the other hand, the wide-base 455 tire causes less top-down cracking, near-surface cracking, and HMA rutting damage than does the conventional dual-tire assembly. This suggests that the new wide-base 455 tire performs better at pavement near-surface, while it causes greater damage at a deeper pavement depth. Hence, for interstate and thick pavements, the wide-base tires are expected to cause less damage to pavements than the currently used dual-tire assembly.
A combined damage ratio was used to consider the overall effect of different failure mechanisms and to conduct a simplified pavement cost analysis associated with the wide-base tire and an overweight axle load. In general, the results show that using the wide-base 455 tire results in the least pavement cost for an interstate road, a slightly greater cost for a primary road, and a greater cost for a local road. As expected, the overweight axle load results in a greater pavement cost, especially on a local road. These estimated costs provide state pavement agencies a basis for implementing appropriate load regulations and road pricing for trucking operations.

57
CHAPTER 6 CONCLUSIONS AND RECOMMENDATIONS 6.1 CONCLUSIONS
The objective of this study was to evaluate pavement damage caused by new tire designs using accelerated pavement testing (APT) and finite element modeling (FEM). Three tire configurations were investigated in this study, including the newly developed wide-base tire (455/55R22.5), an older generation of wide-base tire (425/65R22.5), and the conventional dual-tire assembly. Results of the experimental program indicate that the new generation of wide-base 455 tire causes much less fatigue damage than the first generation of wide-base 425 tire. The average peak longitudinal tensile strain ratios between the wide-base tire and the dual-tire assembly are 1.25 for the wide-base 425 tire and 1.16 for the wide-base 455 tire. In addition, the pressure differential in a dual-tire assembly induces higher longitudinal strains in thin and medium-thickness HMA layers, compared to the longitudinal tensile strains caused by a dual-tire assembly with equal tire pressure.
A 3-D FE model was developed to predict the pavement responses caused by various tire configurations, and was validated by field measurements. The developed 3-D FE model incorporates the measured 3-D tire-pavement contact stresses, HMA linear viscoelasticity, continuous moving load, and implicit dynamic analysis. The FE analysis produced several noteworthy conclusions. Most important, longitudinal tensile strain at the bottom of the HMA is a critical response in thin and medium-thickness HMA layers, while the critical response in thick HMA layer is the vertical shear strain at 3 to 4 in. (76 to100 mm) below the HMA surface. The latter is responsible for near-surface fatigue cracking, as well as HMA primary rutting. Top-down cracking could result from the local vertical shear strain in the upper 1 in. (25 mm) of the HMA where the effects of tire–pavement tangential stresses are the highest.
Results of pavement response and damage analysis indicate that the wide-base 455 tire causes greater fatigue damage and subgrade rutting than does the conventional dual-tire assembly when carrying the same load. However, the relative damage ratios between various configurations decrease as the pavement thickness increases. The relative fatigue damage potential caused by the wide-base tire in thin pavements could be reduced when considering the wandering effect and possible pressure differential in dual tires. On the other hand, the wide-base 455 tire causes less top-down cracking, near-surface cracking, and HMA rutting damage than does the conventional dual-tire assembly. This suggests that the new wide-base 455 tire causes less damage near the pavement surface, while it causes greater damage at a deeper pavement depth.
A combined damage ratio was used to consider the overall effect of different failure mechanisms and to conduct a simplified pavement cost analysis associated with the wide-base tire and an overweight axle load. In general, the results show that using the wide-base 455 tire results in the lowest pavement cost for an interstate road, a slightly greater cost for a primary road, and the highest cost for a local road. As expected, the use of an overweight axle load results in greater pavement cost, especially on a local road. These estimated costs provide state pavement agencies a basis for implementing appropriate load regulations and road pricing for trucking operations.
58
6.2 RECOMMENDATIONS Due to the absence of accurate models, state pavement agencies have usually
adopted an overly-conservative approach to predicting pavement damage based on empirical design models to assess pavement damage associated with various tire configurations. With the growth in the market share of wide-base tires in trucking applications, there is an urgent need to provide state pavement agencies with accurate pavement damage quantification associated with wide-base tires and overweight axle loads. This study resulted in the following recommendations:
• The mechanistic-empirical method is recommended for pavement damage
quantification associated with wide-base tires and overweight axle loads, instead of the traditional empirical method. Especially, the accurate tire–pavement interaction (contact area and stress) is essential to evaluate the pavement damage caused by different tire configurations.
• The use of the new generation of wide-base tire does not result in a cost increase for interstate roads, considering that the deterioration of thick pavement structure is mainly affected by pavement damage at near-surface.
• The increased pavement cost by the new generation of wide-base tires on primary and local roads can be compensated for by adjusting current load regulations or road pricing to achieve a balance between economic benefit for the trucking industry and pavement repair cost for pavement agencies.
• The design of new tires and the further development of existing tires should be guided by the accurate quantification of pavement damage.
• The effect of wandering and dual-tire pressure differential should be considered in the cost analysis.
59
REFERENCES ABAQUS, (2007), ABAQUS Analysis User’s Manual, Version 6.7, Habbit, Karlsson &
Sorenson, Inc, Pawtucket, RI. ARA, Inc., ERES Division, (2004), Development of the 2002 Guide for the Design of New
and Rehabilitated Pavements, NCHRP 1-37A, Transportation Research Board, Washington, DC.
Akram, T., T. Scullion, R. E. Smith, and E. G. Fernando, (1992), Estimating Damage Effects
of Dual versus Wide Base Tires with Multidepth Deflectometers, Transportation Research Record, No. 1355, TRB, National Research Council, Washington, DC, pp. 59-66.
Al-Qadi, I. L., A. Loulizi, I. Janajreh, and T.E. Freeman, (2002), Pavement Response to Dual
and New Wide-Base Tires at the Same Tire Pressure, Transportation Research Record: Journal of the Transportation Research Board, No. 1806, Transportation Research Board of the National Academies, Washington, DC, pp. 38-47.
Al-Qadi, I. L., A. Loulizi, M. Elseifi, and S. Lahouar, (2004), The Virginia Smart Road: The
Impact of Pavement Instrumentation on Understanding Pavement Performance, Journal of the Association of Asphalt Pavement Technologists, vol. 73, pp. 427-465.
Al-Qadi, I. L., M. A. Elseifi, and P. J. Yoo, (2005), Characterization of Pavement Damage
Due to Different Tire Configurations, Journal of the Association of Asphalt Paving Technologists, vol. 84, pp. 921-962.
Al-Qadi, I. L., and M. A. Elseifi, (2007), State-of-the-Practice of the New Generation of Wide-
Base Tire and Its Impact on Trucking Operations, Transportation Research Record: Journal of the Transportation Research Board, No. 2008, Transportation Research Board of the National Academies, Washington, DC, pp. 100-109.
Al-Qadi, I. L. and P. J. Yoo, (2007), Effect of Surface Tangential Contact Stress on Flexible
Pavement Response, Journal of the Association of Asphalt Paving Technologists, Vol. 76, pp. 663-692.
Al-Qadi, I. L., H. Wang, P. J. Yoo, and S. H. Dessouky, (2008a), Dynamic Analysis and In-
Situ Validation of Perpetual Pavement Response to Vehicular Loading, Transportation Research Record: Journal of the Transportation Research Board, No. 2087, Transportation Research Board of the National Academies, Washington, DC, pp. 29-39.
Al-Qadi, I. L., W. Xie, and M. A. Elseifi, (2008b) Frequency Determination from Vehicular
Loading Time Pulse to Predict Appropriate Complex Modulus in MEPDG, Journal of the Association of Asphalt Paving Technologists, Vol 77, pp. 739-772.
Al-Qadi, I. L., M. A. Elseifi, P. J. Yoo, S. H. Dessouky, N. H. Gibson, T. P. Harman, J.
D’Angelo, and K. A. Petros, (2008c) Accuracy of Current Complex Modulus Selection Procedure from Vehicular Load Pulse in NCHRP 1-37a Design Guide, Transportation Research Record: Journal of the Transportation Research Board, No.
60
2087, Transportation Research Board of the National Academies, Washington, DC, pp. 81-90.
Alvarez, C. and M. R. Thompson, (1998), Mechanistic-Empirical Evaluation of the Mn/Road
Mainline Flexible Pavement Sections, Project IHR 535 report, University of Illinois, Urbana-Champaign.
American Association of State Highway and Transportation Officials, (2003), Designation
T322-03, Standard Method of Test for Determining the Creep Compliance and Strength of Hot-Mix Asphalt (HMA) Using the Indirect Tensile Test Device. Standard Specifications for Transportation Materials and Methods of Sampling and Testing, Part 2B: Tests, 22nd ed., AASHTO, Washington, DC.
Ang-Olson, J., and W. Schroeer, (2002), Energy Efficiency Strategies for Freight Trucking:
Potential Impact on Fuel Use and Greenhouse Gas Emission, Transportation Research Record: Journal of the Transportation Research Board, No. 1815, Transportation Research Board of the National Academies, Washington, DC, pp. 11-18.
Asphalt Institute, (1982), Research and Development of the Asphalt Institute’sThickness
Design Manual (MS-1), Research report 82-1, 9th ed., College Park, MD. Baladi G. Y., S. Michael, and T. Svasdisant, (2002), Determining the Causes of Top-down
Cracking in Bituminous Pavements, Final report for Michigan Department of Transportation, Department of Civil and Environmental Engineering, Michigan State University, East Lansing, MI.
Baker, H. B., M. R. Buth, and D. A. Van Deusen, (1994), Minnesota Road Research Project:
Load Response Instrumentation Installation and Testing Procedures. Final report, No. MN/PR-94/01, Minnesota Department of Transportation, St. Paul, MN.
Bathe, K. J., (1982), Finite Element Procedures in Engineering Analysis, Prentice-Hall, NJ. Bensalem, A., A. J. Broen, M. E. Nunn, D. B. Merrill, and W. G. Lloyd, (2000), Finite Element
Modeling of Fully Flexible Pavements: Surface Cracking and Wheel Interaction,” Proceedings of the 2nd International Symposium on 3D Finite Element For Pavement Analysis, Design, and Research, Charleston, West Virginia, pp. 103-121.
Bonaquist, R., (1992), An Assessment of The Increased Damage Potential of Widebase
Single Tires, Proceedings of 7th International Conference on Asphalt Pavements, vol. 3, International Society for Asphalt Pavements, Lino Lakes, MN, pp 1-16.
Bonaquist, R., and D. W. Christensen, (2005), A Practical Procedure for Developing
Dynamic Modulus Master Curves for Pavement Structural Design, Transportation Research Record: Journal of the Transportation Research Board, No. 1929, Transportation Research Board of the National Academies, Washington, DC, pp. 208-217.
Buttlar, W. and R. Roque, (1994), Development and Evaluation of the Strategic Highway
Research Program Measurement and Analysis System for Indirect Tensile Testing at

61
Low Temperatures, Transportation Research Record No. 1454, TRB, National Research Council, Washington, DC, pp. 163-171.
Carpenter S. H. (2007), Fatigue Performance of IDOT Mixtures, Research report FHWA-
ICT-07-007, Illinois Center for Transportation, University of Illinois, Urbana-Champaign, IL.
Carpenter S. H. (2008), Extended Life Hot-Mix Asphalt Pavement (ELHMAP) Test Sections
at ATREL, Research report FHWA-ICT-08-017, Illinois Center for Transportation, University of Illinois, Urbana-Champaign, IL.
Carpenter, S. H., K. A. Ghuzlan, and S. Shen, (2003), A Fatigue Endurance Limit for
Highway and Airport Pavements, Transportation Research Record: Journal of the Transportation Research Board, No. 1832, Transportation Research Board of the National Academies, Washington, DC, pp. 131-138.
Chen D. H., E. R. Cortez, F. Zhou, W. Yang, and K. Petros, (2006), Analysis of Overload
Damages in Thin Flexible Pavements, Presented at 85th Annual Meeting of the Transportation Research Board, Washington, DC, January 22-26.
Chopra, A. K., (2001), Dynamics of Structures, 2nd ed., Prentice Hall, Upper Saddle River,
NJ. COST 334, (2001), Effects of Wide Single Tires and Dual Tires, Final report of the Action
(Version 29), European Cooperation in the Field of Scientific and Technical Research, Brussels, Belgium.
Darestani, M. Y., P. T. David, N. Andreas, and B. Daksh, (2006), Dynamic Response of
Concrete Pavements under Vehicular Loads, Proceedings of IABSE Symposium - Response to Tomorrow's Challenges in Structural Engineering, Budapest, Hungary, pp. 104-105.
Deacon, J. A., (1969), Load Equivalency in Flexible Pavements,Journal of Association of
Asphalt Paving Technologists, vol. 38, pp. 465-491. De Beer, M., and C. Fisher, (1997), Contact Stresses of Pneumatic Tires Measured with the
Vehicle-Road Surface Pressure Transducer Array (VRSPTA) System for the University of California at Berkeley (UCB) and the Nevada Automotive Test Center (NATC), UCPRC-RR-1997-01,Transportek, CSIR, Pretoria, South Africa.
De Beer, M., C. Fisher, and F. J. Jooste, (2002), Evaluation of Non-uniform Tire Contact
Stresses on Thin Asphalt Pavements, Proceedings of 9th International Conference on Asphalt Pavements (ICAP 2002), Copenhagen, Denmark.
Douglas, R. A., W. D. H. Woodward, and A. R. Woodside, (2000), Road Contact Stresses
and Forces under Tires with Low Inflation Pressure,” Canadian Journal of Civil Engineering, vol. 27, pp. 1248-1258.
Drakos, C., R. Roque, and B. Birgisson, (2001), Effects of Measured Tire Contact Stresses
on Near Surface Rutting,” Transportation Research Record: Journal of the

62
Transportation Research Board, No. 1764, TRB, National Research Council, Washington, DC, pp. 59-69.
Elseifi, M. A., I. L. Al-Qadi, and P. J. Yoo, (2006), Viscoelastic Modeling and Field Validation
of Flexible Pavements, Journal of Engineering Mechanics, vol. 132, no. 2, ASCE, pp. 172-178.
Epps, J. A., A. Hand, S. Seeds, T. Scholz, S. Alavi, C. Ashmore, C. L. Monismith, J. A.
Deacon, J. T. Harvey and R. B. Leahy, (2002), Recommended Performance-Related Specifications for Hot-Mix Asphalt Construction, NCHRP Report 455, TRB, National Research Council, Washington, DC.
Ferry, J. D., (1980), Viscoelastic Properties of Polymers, 3rd ed., Wiley & Sons, New York. Ford, T. L. and P. Yap, (1990), Truck Tire/Pavement Interface, Proc., The Promise of New
Technology in the Automotive Industry: XXIII FISITA Congress, Torino, Italy, pp.333-340.
Fryba, L., (1972), Vibration of Solids and Structures under Moving Loads, Noordhoff Int.
Publ., Noordhoff, The Netherlands. Gillespie, T. D., S. M. Karimihas, D. Cebon, M. W. Sayers, M. A. Nasim, W. Hansen, and N.
Ehsan, (1993), Effects of Heavy-Vehicle Characteristics on Pavement Response and Performance, CHRP Report 353, TRB, National Research Council, Washington, DC.
Groenendijk, J., (1998), Accelerated Testing and Surface Cracking of Asphaltic Concrete Pavements, PhD dissertation, Department of Civil Engineering, Delft University of Technology, The Netherlands.
Hallin, J. P., J. Sharma and J. P. Mahoney, (1983), Development of Rigid and Flexible
Pavement Load Equivalency Factors for Various Widths of Single Tires, Transportation Research Record No. 949, TRB, National Research Council, Washington, DC, pp. 4-13.
Hardy, M. S. A., and D. Cebon, (1993), Response of Continuous Pavements to Moving
Dynamic Loads, Journal of Engineering Mechanics, vol. 119, no. 9, ASCE, pp. 1762-1780.
Huang, Y. H., (1993), Pavement Analysis and Design, 1st ed., Prentice Hall, NJ. Huhtala, M. J., Philajamaki, and M. Pienimaki, (1989), Effects of Tires and Tire Pressures on
Road Pavements, Transportation Research Record No. 1227, TRB, National Research Council, pp. 107-114.
Illinois Department of Transportation, (2006), Truck Size and Weight Report, Illinois
Department of Transportation, Springfield, IL. Jooster, F. J. and J. P. Lourens, (1998), Appropriate Models for Estimating Stresses and
Strains in Asphalt Layers, Technical report CR-98/060, Division for Roads and Transport Technology, SCIR, Pretoria, South Africa.
63
Kim, D., R. Salgado, and A.G. Altschaeffl, (2005), Effects of Supersingle Tire Loadings on Pavements, Journal of Transportation Engineering, vol. 131, no. 10, ASCE, pp. 732–743.
Kim, Y. R., S. Youngguk, K. Mark, and M. Mostafa, (2004), Dynamic Modulus Testing of
Asphalt Concrete in Indirect Tension Mode, Transportation Research Record: Journal of the Transportation Research Board, No. 1891, Transportation Research Board of the National Academies, Washington, DC, pp. 163-173.
Lourens, J. P., (1992), Nonlinear Dynamic Analysis and Design of Road Pavements, RR
90/030, Department of Transport, Pretoria, South Africa. Loulizi, A., G. W. Flintsch, I. L. Al-Qadi, and D. W. Mokarem, (2006), Comparing Resilient
Modulus and Dynamic Modulus of Hot-Mix Asphalt as Material Properties for Flexible Pavement Design, Transportation Research Record: Journal of the Transportation Reseach Board, No.1970, Transportation Research Board of the National Academies, Washington, DC, pp. 161-170.
Machemehl, R. B., F. Wang, and J. A. Prozzi, (2005), Analytical Study of Effects of Truck
Tire Pressure on Pavements with Measured Tire–Pavement Contact Stress Data, Transportation Research Record: Journal of the Transportation Research Board, No. 1919, Transportation Research Board of the National Academies, Washington, DC, pp. 111-120.
Marshek, K. M., H. H. Chen, R. B. Conell, and R. W. Hudson, (1986), Experimental
Determination of Pressure Distribution of Truck Tire-Pavement Contact, Transportation Research Record, No. 1070, TRB, National Research Council, Washington, DC, pp. 9-14.
Myers, L., R. Roque and B. Ruth, (1998), Mechanisms of Surface-Initiated Longitudinal
Wheel Path Cracks in High-type Bituminous Pavements, Journal of Association of Asphalt Paving Technologists, vol. 67, pp. 401-419.
Myers, L. A., R. Roque, B. E. Ruth, and C. Drakos, (1999), Measurement of Contact
Stresses for Different Truck Tire Types to Evaluate Their Influence on Near-Surface Cracking and Rutting,” Transportation Research Record: Journal of the Transportation Reseach Board, No. 1655, TRB, National Research Council, Washington, DC, pp. 175-184.
Newcomb, D. E., M. Buncher, and I. J. Huddleston, (2001), Concepts of Perpetual
Pavement, Transportation Research Circular No. 503, Perpetual Bituminous Pavements,. TRB, National Research Council, Washington, DC, pp. 4–11.
Novak, M, B. Birgisson, R. Roque, “Tire Contact Stresses and Their Effects on Instability
Rutting of Asphalt Mixture Pavements: Three-dimensional Finite Element Analysis,” Transportation Research Record: Journal of the Transportation Research Board, No. 1853, Transportation Research Board of the National Academies, Washington, DC, 2003, pp. 150-156.
64
Organization for Economic Co-Operation and Development, (1992), Dynamic Loading of Pavements, OECD report, OECD, Paris, France.
Papagiannakis, A. T., N. Amoah, and R. Taha, (1996), Formulation for Viscoelastic
Response of Pavements Under Moving Dynamic Loads, Journal of Transportation Engineering, vol. 122, no. 2, ASCE, pp. 140-145.
Park, D., A. E. Martin, and E. Masad, (2005a), Effects of Nonuniform Tire Contact Stresses
on Pavement Response, Journal of Transportation Engineering, vol. 131, no. 11, ASCE, pp. 873-879.
Park, D, E. Fernando, and J. Leidy, (2005b), Evaluation of Predicted Pavement Response
with Measured Tire Contact Stresses, Transportation Research Record: Journal of the Transportation Research Board, No. 1919, Transportation Research Board of the National Academies, Washington, DC, pp 160-170.
Park, S. W. and Y. R. Kim, (1999), Interconversion between Relaxation Modulus and Creep
Compliance for Viscoelastic Solids, Journal of Materials in Civil Engineering, vol. 11, no. 1, ASCE, pp. 76-82.
Perdomo, D. and B. Nokes, (1993), Theoretical Analysis of the Effects of Wide-Base Tires
on Flexible Pavements Using Circly, Transportation Research Record, No. 1388, TRB, National Research Council, Washington, DC, pp. 108-119.
Pierre, P., G. Dore, and L. Vagile, (2003), Characterization and Evaluation of Tire-roadway
Interface Stresses, GCT-03-03. Ministry of Transport, University of Laval, Quebec, Canada.
Priest, A. L., D. H. Timm, and W. E. Barrett, (2005), Mechanistic Comparison of Wide-base
Single vs. Standard Dual Tire Configurations, Final report, National Center for Asphalt Technology (NCAT), Auburn, AL.
Prophète, F., (2003), Effets de différents types de pneu sur les chaussées, (In French)
Project No. 5.2R456.1, Ministry of Transportation, Direction du Laboratoire des Chaussées, Quebec City, Canada.
Prozzi, J. A. and R. Luo, (2005), Quantification of the Joint Effect of Wheel Load and Tire
Inflation Pressure on Pavement Response, Transportation Research Record: Journal of the Transportation Research Board, No. 1919, Transportation Research Board of the National Academies, Washington, DC, pp. 134-141.
Romanoschi, S. A. and J. B. Metcalf, (2001), Characterization of Asphalt Concrete Layer
Interfaces. Transportation Research Record: Journal of the Transportation Research Board, No. 1778, TRB, National Research Council, Washington DC, pp. 132-139.
Saad, B., H. Mitri, and H. Poorooshasb, (2005), Three-Dimensional Dynamic Analysis of
Flexible Conventional Pavement Foundation, Journal of Transportation Engineering, vol. 131, no. 6, ASCE, pp. 460-469.

65
Sebaaly, P. E. and M. S. Mamlouk, (1989), Prediction of Pavement Response to Actual Traffic Loading, Presented at 66th Annual Meeting of the Transportation Research Board, Washington DC.
Sebaaly, P., and N. Tabatabaee, (1989), Effect of Tire Pressure and Type on Response of
Flexible Pavement, Transportation Research Record, No. 1227, TRB, National Research Council, Washington, DC, pp. 115-127.
Siddharthan, R. V., N. Krishnamenon, M. El-Mously, and P. E. Sebaaly, (2002), Investigation
of Tire Contact Stress Distributions on Pavement Response, Journal of Transportation Engineering, vol. 128, no. 2, ASCE, pp. 136-144.
Siddharthan, R. V., J. Yao, and P. E. Sebaaly, (1998), Pavement Strain from Moving
Dynamic 3D Load Distribution,” Journal of Transportation Engineering, vol. 124, no. 6, ASCE, pp. 557-566.
Sousa, J. B., J. Lysmer, S. S. Chen, and C. L. Monismith, (1988), Effects of Dynamic Loads
on Performance of Asphalt Concrete Pavements, Transportation Research Record, No. 1207, TRB, National Research Council, Washington, DC, pp. 145-168.
Streit, D. A, B. T. Kulakowski, P. E. Sebaaly, and R. J. Wollyung, (1998), Road Simulator
Study of Heavy Vehicle Wheel Forces, FHWA-RD-98-019, Federal Highway Administration, U.S. Department of Transportation, Washington, DC.
Tabatabaee, N., I. L. Al-Qadi, and P. E. Sebaaly, (1992), Field Evaluation of Pavement
Instrumentation Methods, Journal of Testing and Evaluation, vol. 20, no. 2, ASTM, pp. 144-151.
Tielking, J. T. and F. L. Roberts, (1987), Tire Contact Pressure and Its Effect on Pavement
Strain, Journal of Transportation Engineering, vol. 113, no. 1, ASCE, pp. 56-71. Uddin, W., D. Zhang, and F. Fernandez, (1994), Finite Element Simulation of Pavement
Discontinuities and Dynamic Load Response, Transportation Research Record, No. 1448, TRB, National Research Council, Washington, DC, pp. 100-106.
Uddin, W. and S. Garza, (2003), 3D-FE Modeling and Simulation of Airfield Pavements
Subjected to FWD Impact Load Pulse and Wheel Loads, Proceedings of 2003 Airfield Pavement Specialty Conference, ASCE, Las Vegas, NV , pp. 304-315.
Uhlmeyer, J. S., K. Willoughby, L. M. Pierce, and J. P. Mahoney, (2000), Top-Down
Cracking in Washington State Asphalt Concrete Wearing Courses, Transportation Research Record, No. 1730, TRB, National Research Council, Washington, DC, pp. 110-116.
U.S. Department of Transportation, (2005), Freight Facts and Figures, Report no. FHWA-
HOP-05-071, Federal Highway Administration, USDOT, Washington, DC. U.S. Environmental Protection Agency, (2004), A Glance at Clean Freight Strategies –
Single Wide-Based Tires. Report no. EPA 420-F-04-004, Washington, DC.
66
Wang, H. and I. L. Al-Qadi, (2008), Surface-related Pavement Damage Due to Various Tire Rolling Conditions, Proceedings of International ISAP Symposium on Asphalt Pavements and Environment, ISAP 2008, Zurich, Switzerland, pp. 667-678.
Weissman, S. L., (1999), Influence of Tire–Pavement Contact Stress Distribution on
Development of Distress Mechanisms in Pavements, Transportation Research Record: Journal of the Transportation Research Board, No. 1655, TRB, National Research Council, Washington, DC, pp. 161-167.
WesTrack Team, (2002), Recommended Performance-Related Specification for Hot-Mix
Asphalt Construction: Results of the WesTrack Project, NCHRP report 455, Transportation Research Board of the National Academies, Washington, DC.
Yoo, P. J., I. L. Al–Qadi, M. A. Elseifi, and I. Janajreh, (2006), Flexible Pavement Responses
to Different Loading Amplitudes Considering Layer Interface Condition and Lateral Shear Forces, The International Journal of Pavement Engineering, vol. 7, pp. 73-86.
Yoo, P. J. and I. L. Al-Qadi, (2007), Effect of Transient Dynamic Loading on Flexible
Pavements, Transportation Research Record: Journal of the Transportation Research Board, No. 1990, Transportation Research Board of the National Academies, Washington, DC, pp. 129-140.
Yoo, P. J. and I. L. Al-Qadi, (2008), The Truth and Myth of Fatigue Cracking Potential in Hot-
Mix Asphalt: Numerical Analysis and Validation, Journal of Association of Asphalt Paving Technologists, Vol 77, pp. 549-590
Zaghloul, S. and T. White, (1993), Use of a Three-Dimensional Dynamic Finite Element
Program for Analysis of Flexible Pavement, Transportation Research Record: Journal of the Transportation Research Board, No. 1388, Transportation Research Board, Washington, D.C., pp. 60-69.