Evaluation of humoral and cellular immune responses against HSV1 using genetic immunization by...
11
Evaluation of the humoral and cellular immune response to different antigens of Corynebacterium pseudotuberculosis in Caninde ´ goats and their potential protection against caseous lymphadenitis L.F. Moura-Costa * , R.C. Bahia, R. Carminati, V.L.C. Vale, B.J.A. Paule, R.W. Portela, S.M. Freire, I. Nascimento, R. Schaer, L.M.S. Barreto, R. Meyer Departamento de Biointerac ¸a ˜o – Instituto de Cie ˆncias da Sau ´de – Universidade Federal da Bahia, Av. Reitor Miguel Calmon, S/N - Vale do Canela, CEP 40140-100, Salvador-BA, Brazil Received 6 December 2007; received in revised form 6 May 2008; accepted 26 June 2008 Abstract Corynebacterium pseudotuberculosis is the etiologic agent of caseous lymphadenitis, a disease that affects goats and sheep, and can cause severe economic losses. In this study, four different antigenic extracts were obtained from the attenuated strain T1, which was isolated in the state of Bahia (Brazil). Forty-four Caninde ´ breed goats were divided in five groups, each receiving a different antigen solution and saline buffer as a control. The humoral response was monitored through the identification of specific IgG by indirect ELISA and Western Blotting, and the production of IFN-g was followed in order to observe the activation of cellular response. After twelve weeks of antigen inoculation, the animals were challenged with 2 10 5 CFU of a wild strain, also isolated in Bahia, and necropsy was performed on all animals twelve weeks afterwards. It was observed that the attenuated bacteria gave a protection of 33.3%, in addition to the weak humoral response elicited. Animals inoculated with secreted antigen associated with Freund’s incomplete adjuvant and oligodeoxynucleotide containing unmethylated CpG dinucleotides (CpG ODN) showed a strong humoral response, but this inoculation could not prevent the spread of challenge bacteria in the majority of animals. These results demonstrate the immunogenic potential of the attenuated T1 strain in the development of a vaccine against caseous lymphadenitis in goats. # 2008 Elsevier B.V. All rights reserved. Keywords: Caseous lymphadenitis; Goats; C. pseudotuberculosis; CpG ODN; Vaccine 1. Introduction Caseous lymphadenitis is an infectious disease that affects small ruminants, particularly goats and sheep. The bacteria Corynebacterium pseudotuberculosis is the causative agent of the pathology (Batey, 1986; Brown and Olander, 1987; Williamson, 2001). The major clinical feature of this disease is the development of granulomas in peripheral and internal lymph nodes, containing necrotic tissue. In goats, other organs can be www.elsevier.com/locate/vetimm Available online at www.sciencedirect.com Veterinary Immunology and Immunopathology 126 (2008) 131–141 Abbreviations: TPP, three phase partitioning; FIA, Freund’s incomplete adjuvant; BHI, brain and heart infusion; ODN, oligodeox- ynucleotides. * Corresponding author. Tel.: +55 71 3283 8899; fax: +55 71 3283 8899. E-mail addresses: [email protected], [email protected] (L.F. Moura-Costa). 0165-2427/$ – see front matter # 2008 Elsevier B.V. All rights reserved. doi:10.1016/j.vetimm.2008.06.013
Transcript of Evaluation of humoral and cellular immune responses against HSV1 using genetic immunization by...
Evaluation of the humoral and cellular immune response
to different antigens of Corynebacterium pseudotuberculosis
in Caninde goats and their potential protection against
caseous lymphadenitis
L.F. Moura-Costa *, R.C. Bahia, R. Carminati, V.L.C. Vale, B.J.A. Paule,R.W. Portela, S.M. Freire, I. Nascimento, R. Schaer, L.M.S. Barreto, R. Meyer
Departamento de Biointeracao – Instituto de Ciencias da Saude – Universidade Federal da Bahia,
Av. Reitor Miguel Calmon, S/N - Vale do Canela, CEP 40140-100, Salvador-BA, Brazil
Received 6 December 2007; received in revised form 6 May 2008; accepted 26 June 2008
Abstract
Corynebacterium pseudotuberculosis is the etiologic agent of caseous lymphadenitis, a disease that affects goats and sheep, and
can cause severe economic losses. In this study, four different antigenic extracts were obtained from the attenuated strain T1, which
was isolated in the state of Bahia (Brazil). Forty-four Caninde breed goats were divided in five groups, each receiving a different
antigen solution and saline buffer as a control. The humoral response was monitored through the identification of specific IgG by
indirect ELISA and Western Blotting, and the production of IFN-g was followed in order to observe the activation of cellular
response. After twelve weeks of antigen inoculation, the animals were challenged with 2 � 105 CFU of a wild strain, also isolated in
Bahia, and necropsy was performed on all animals twelve weeks afterwards. It was observed that the attenuated bacteria gave a
protection of 33.3%, in addition to the weak humoral response elicited. Animals inoculated with secreted antigen associated with
Freund’s incomplete adjuvant and oligodeoxynucleotide containing unmethylated CpG dinucleotides (CpG ODN) showed a strong
humoral response, but this inoculation could not prevent the spread of challenge bacteria in the majority of animals. These results
demonstrate the immunogenic potential of the attenuated T1 strain in the development of a vaccine against caseous lymphadenitis in
goats.
# 2008 Elsevier B.V. All rights reserved.
Keywords: Caseous lymphadenitis; Goats; C. pseudotuberculosis; CpG ODN; Vaccine
www.elsevier.com/locate/vetimm
Available online at www.sciencedirect.com
Veterinary Immunology and Immunopathology 126 (2008) 131–141
Abbreviations: TPP, three phase partitioning; FIA, Freund’s
incomplete adjuvant; BHI, brain and heart infusion; ODN, oligodeox-
ynucleotides.
* Corresponding author. Tel.: +55 71 3283 8899;
fax: +55 71 3283 8899.
E-mail addresses: [email protected], [email protected]
(L.F. Moura-Costa).
0165-2427/$ – see front matter # 2008 Elsevier B.V. All rights reserved.
doi:10.1016/j.vetimm.2008.06.013
1. Introduction
Caseous lymphadenitis is an infectious disease that
affects small ruminants, particularly goats and sheep.
The bacteria Corynebacterium pseudotuberculosis is
the causative agent of the pathology (Batey, 1986;
Brown and Olander, 1987; Williamson, 2001). The
major clinical feature of this disease is the development
of granulomas in peripheral and internal lymph nodes,
containing necrotic tissue. In goats, other organs can be

L.F. Moura-Costa et al. / Veterinary Immunology and Immunopathology 126 (2008) 131–141132
affected, such as lungs and liver. The disease exists
worldwide (Sting et al., 1998; Pepin et al., 1999; Paule
et al., 2003), and the bacteria can affect other species,
like horses, bovines, but it rarely affects humans (Peel
et al., 1997; Mills et al., 1997). C. pseudotuberculosis
released from superficial abscesses persists in environ-
ment for a longtime and may become a source of
contamination for the other animals in herd (Pepin et al.,
1999). In the northeast region of Brazil, there is a high
prevalence of the disease in goats, causing elevated
economic losses, due to a reduction in weight gain and
milk production, as well as problems in the commer-
cialization of products derived from animal meat
(Unanian et al., 1985; Brown and Olander, 1987;
Brown et al., 1987).
Therapeutic treatment of the disease is not effective,
as the pathogen has an intracellular location, and the
distribution of drugs inside of the granuloma is poor.
The puncture of the peripheral affected lymph nodes is
the only viable treatment, but it can cause the spread of
the bacteria in the environment, therefore elevating the
risk of contamination (Nairn and Robertson, 1974). The
internal granulomas are difficult to diagnose and may be
a source of contamination for other animals (Ellis et al.,
1987).
Several experimental trials have been developed in
order to achieve a reliable vaccine to control the disease
in sheep and goats. Different antigen preparations have
been employed, such as formalin-killed bacterin,
bacterial cellular wall and phospholipase D toxoid
(Cameron et al., 1972; Brogden et al., 1984, 1996;
Brown et al., 1986; Eggleton et al., 1991). An
association of bacterin and formalin inactivated
exotoxin was also tested, resulting in partial immunity
characterized by fewer affected lymph nodes in each
animal and fewer animals presenting with disease
(Piontkowski and Shivvers, 1998).
In this study we used 44 Caninde breed goats from
the state of Bahia in Brazil. Caninde is a naturalized
Brazilian breed from northeastern Brazil and the
experimental animals were from the same flock of
purebreds. We tested the protective capacity and
protection of crude C. pseudotuberculosis culture
supernatant associated to FIA. In addition, we assessed
the capacity of CpG ODN to improve the immune
response and the protection against challenge of an
antigen obtained through concentration of crude culture
supernatant. Finally, we observed the capacity of a
living attenuated strain to protect against challenge with
a wild strain. The C. pseudotuberculosis T1 strain used
in this experiment was isolated from a goat’s lymph
node, in the state of Bahia (Paule et al., 2004a). It is
considered a natural, attenuated strain due to a weak
synergistic hemolytic activity when co-cultivated with
Rhodococcus equi and the absence of pathologies when
susceptible BALB/c mice were inoculated with the
strain (Vale et al., unpublished data), and is considered
as an alternative in the development of a vaccine against
caseous lymphadenitis.
2. Methodology
2.1. Bacterial strains
Two different strains of C. pseudotuberculosis were
employed in this experiment. The strain T1, had its
identification confirmed by Gram staining, colony
morphology, synergistic hemolytic activity with CAMP
factor of Rhodococcus equi, urease and catalase
production. A commercial kit to perform a more
reliable identification was also used (API Coryne -
BioMerieux). The pathogenic strain, employed as a
challenge to vaccinated animals, was named VD57, and
had a similar identification process as the attenuated
strain. This pathogenic strain was isolated from a goat in
the city of Juazeiro, Bahia State, Brazil.
2.2. Antigens
2.2.1. Secreted antigen
The C. pseudotuberculosis T1 strain was cultivated
in Brain Heart Infusion (BHI) broth at 37 8C for 72 h.
The culture was centrifuged for 30 min at 10,000 � g.
Supernatant was filtered through a 0.22 mm membrane
filter. This supernatant was kept at �20 8C until use.
The amount of protein was determined by Lowry’s
modified method (Bio-Rad). The protein concentration
determined was 6.2 mg/ml. This antigen was used in
Group 1.
2.2.2. Secreted antigen concentrated using three
phase partitioning method (TPP)
This antigen was obtained as previously described
(Paule et al., 2004a), with some modifications. Briefly,
the secreted antigen was prepared from culture super-
natant saturated with 30% ammonium sulfate pH 4.0
(HCl) and n-butanol, under slow agitation at room
temperature. The sample was homogenized, kept
undisturbed for 60 min, and centrifuged for 10 min at
1350 � g at 4 8C. The resulting interface was dissolved
in small volumes of 20 mM Tris buffer pH 7.4 (500 ml
of buffer to 5 ml of supernatant extract) followed by
dialysis in 50 mM phosphate buffer pH 7.4 for 48 h.
Antigen was concentrated by ultra filtration with a

L.F. Moura-Costa et al. / Veterinary Immunology and Immunopathology 126 (2008) 131–141 133
10 kDa membrane (Millipore, USA) and filtered
through a 0.22 mm membrane filter. This supernatant
was kept at�20 8C until use. The amount of protein was
determined by Lowry’s modified method (Bio-Rad).
This antigen was used in Groups 3 and 4.
2.2.3. Somatic antigen
The T1 C. pseudotuberculosis strain was cultivated
in Brain Heart Infusion broth at 37 8C for 72 h. The
culture was centrifuged for 30 min at 3000 � g and
4 8C. The bacterial pellet was washed twice in PBS. It
was homogenized in PBS (1:5) and sonicated at 60 Hz,
using five cycles of 60 s each (Branson Sonifier 450).
The sample was centrifuged for 30 min at 10,000 � g/
4 8C, and the supernatant was frozen at �20 8C until
use. This antigen was used in immunoblotting.
2.2.4. Attenuated bacteria
The T1 C. pseudotuberculosis strain was cultivated
in BHI broth for 72 h, and after this period, the bacterial
concentration was adjusted to 2 � 106 CFU/ml with
sterile PBS, and inoculated in animals from Group 2.
2.2.5. CpG ODN
A synthetic ODN containing unmethylated CpG
dinucleotides (RW Genes, Brazil), with the following
sequence TCGTCGTTGTCGTTTTGTCGTT (CpG
motifs are underlined), was used in this study, which
was previously used in sheep (Ioannou et al., 2002;
Nichani et al., 2004).
2.3. Animals and experimental groups
Forty-four Caninde breed goats, age ranging from
eight to ten months, were used as an experimental
model. These animals were tested before the experiment
for the presence of specific IgG against C. pseudotu-
berculosis (as described by Carminati et al., 2003) and
caprine arthritis-encephalitis virus using a commercial
kit (Biovetech). They were divided in five experimental
groups, all of them receiving different subcutaneous
doses of various antigens. Three groups received a
vaccine booster with the same antigen preparation four
weeks after the first dose. Goats were not segregated by
groups, and they were maintained together for pastur-
ing. Animals were fed with alfalfa hay, concentrated
food and water ad libitum.
Group 1 (G1) (n = 9; three females and six males)
immunized with 0.5 ml of C. pseudotuberculosis strain
T1 culture supernatant formulated with 0.5 ml of
Freund’s incomplete adjuvant (Sigma–Aldrich). This
supernatant was obtained from a Brain Heart Infusion
broth culture, cultivated at 37 8C for 72 h. Animals
received vaccine booster four weeks later.
Group 2 (G2) (n = 9; three females and six males)
inoculated with 1 ml of a suspension of 2 � 106 CFU/
ml T1 strain bacteria in sterile phosphate buffer saline.
This group did not receive a vaccine booster.
Group 3 (G3) (n = 9; two females and seven males)
were immunized with a solution of 100 mg of C.
pseudotuberculosis T1 strain culture supernatant con-
centrated by TPP methodology in conjunction with
250 mg of CpG TCGTCGTTGTCGTTTTGTCGTT
(Nichani et al., 2004) and 0.5 ml of FIA and sterile
PBS in a total volume of 1 ml. Four weeks later, goats
were re-immunized with the same formulation.
Group 4 (G4) (n = 10; three females and seven
males) were inoculated with the 1 ml of the same
solution employed in Group 3 without FIA. A four-
week interval was allowed between the first and second
immunizations.
Group 5 (G5) (n = 7; one female and six males)
represented the control of the experiment, and were
only inoculated with 1 ml of sterile PBS and did not
receive a second inoculation.
Blood samples were collected at each week post-
immunization day.
2.4. Experimental challenge
All animals from experimental groups were chal-
lenged with C. pseudotuberculosis wild strain (VD57)
after twelve weeks from the first dose of the vaccinal
inoculum. The infection was carried out through a
double inoculation of 1 � 105 CFU C. pseudotubercu-
losis in the inguinal region (intradermally on the right
side, and trickle on scarified skin on the left side).
2.5. Indirect ELISA for detection of specific IgG
against C. pseudotuberculosis
The indirect ELISA assay for the identification of C.
pseudotuberculosis specific immunoglobulins in goats
was performed as described before (Carminati et al.,
2003; Paule et al., 2003). Briefly, EIA plates (Costar)
were sensitized with 100 ml per well of C. pseudotu-
berculosis strain T1 supernatant diluted 1:100 in 0.05 M
carbonate-bicarbonate buffer, pH 9.6, and incubated at
4 8C overnight. After two washes with PBS Tween
0.05% (PBST), plates were blocked with 200 ml per
well of 5% dry skimmed powder milk in PBST for 2 h at
37 8C. After this, 100 ml/well of sera samples diluted
1:100 in 1% dry skimmed powder milk PBS-T were
added and incubated 1 h at 37 8C. Plates were then

L.F. Moura-Costa et al. / Veterinary Immunology and Immunopathology 126 (2008) 131–141134
washed with PBS-T, and incubated with rabbit anti-goat
IgG peroxydase conjugated (Sigma Cat. No. A-5420)
1:40,000 in PBS-T 1% dry skimmed powder milk for
45 min at 37 8C. After five additional washes, plates
were developed with orthopenylenediamine (OPD) and
results were read at 490 nm.
2.6. Interferon-gamma quantification
The quantification of IFN-g in blood cultures was
performed in samples collected from the experimental
animal groups as previously described (Paule et al., 2003;
Meyer et al., 2005), employing Bovigam Kit (CSL,
Australia), with some modifications. Briefly, 2 h after
collection, heparinized blood was incubated at 37 8C for
48 h in a humidified atmosphere of 5% CO2 in a 24 well
culture tray with 20 mg of secreted antigen in chemically
defined medium (Moura-Costa et al., 2002), 5 ml of
pokeweed mitogen as positive control, or PBS as negative
control. After this period, blood was centrifuged and
IFN-g was quantified in plasma employing a sandwich
ELISA (Bovigam). OD results were converted to IFN-g
indices as describe by Paule et al. (2003):
IFN-g indices
¼ OD sample� OD negative control
OD positive control� OD negative control:
2.7. Immunoblotting
An immunoblotting methodology was developed in
order to determine C. pseudotuberculosis antigens
recognized by specific immunoglobulins produced by
the animals in days 14, 21 and 84 after immunization,
and 14, 21 and 84 after challenge. A sonicated antigen
from T1 strain cultivated in BHI broth, at 37 8C for 48 h,
was separated by a discontinuous SDS-PAGE system
with a 4% stacking gel and a 10% running gel. Proteins
were transferred to a nitrocellulose membrane. This
membrane was blocked overnight at 4 8C with dry
skimmed milk 5% diluted in 0.05% PBS-T. Afterwards,
an incubation with serum samples diluted 1:50 in PBS-
T containing 1% of dry skimmed powder milk was
performed at 37 8C for 1 h. After five washes with PBS-
T 0.05%, a rabbit anti-goat IgG horseradish peroxydase
conjugated (Sigma Cat. No. A-5420) diluted 1:100 in
PBS-T was added and incubated for 1 h at 37 8C. After
five additional washes, the membrane was developed
with a solution of 0.3% 4-chloro-1-naphtol diluted 1:5
in PBS and 10 ml of hydrogen peroxide. The reaction
was then interrupted and membranes scanned.
2.8. Post-mortem examination
Twenty-four weeks after the beginning of the
experiment, all animals were sacrificed and analyzed
for occurrence of typical caseous lymphadenitis lesions.
Every abdominal and thoracic organ was screened, but
special attention was given to lungs, liver, spleen and
lymph nodes. The tissues that presented lesions
compatible with C. pseudotuberculosis infection were
collected in sterile vials and flasks with 10% formalin.
The tissues were embedded in paraffin, allowing the
confection of histology slides, and stained with
hematoxylin–eosin method.
2.9. Bacterial identification
Tissue samples aseptically collected in necropsy
were disrupted in PBS and plated onto BHI blood Agar,
and the bacterial identification was made by analysis of
colony morphology, Gram stain, catalase and urease
activity, carbohydrate fermentation (glucose, lactose,
sucrose and mannose) and synergistic hemolytic
activity with CAMP factor of Rhodococcus equi.
2.10. Statistical analysis
The results of the ELISA for quantification of IFN-g
and determination of specific IgG against C. pseudo-
tuberculosis were screened by variance analysis, and
when statistical significance was found, the mean
correlation was made by Tukey test, for significant
statistical differences when p < 0.05. The results from
the post-mortem examination were treated by Pearson’s
Chi-square test.
3. Results
3.1. Indirect ELISA for C. pseudotuberculosis
specific IgG determination
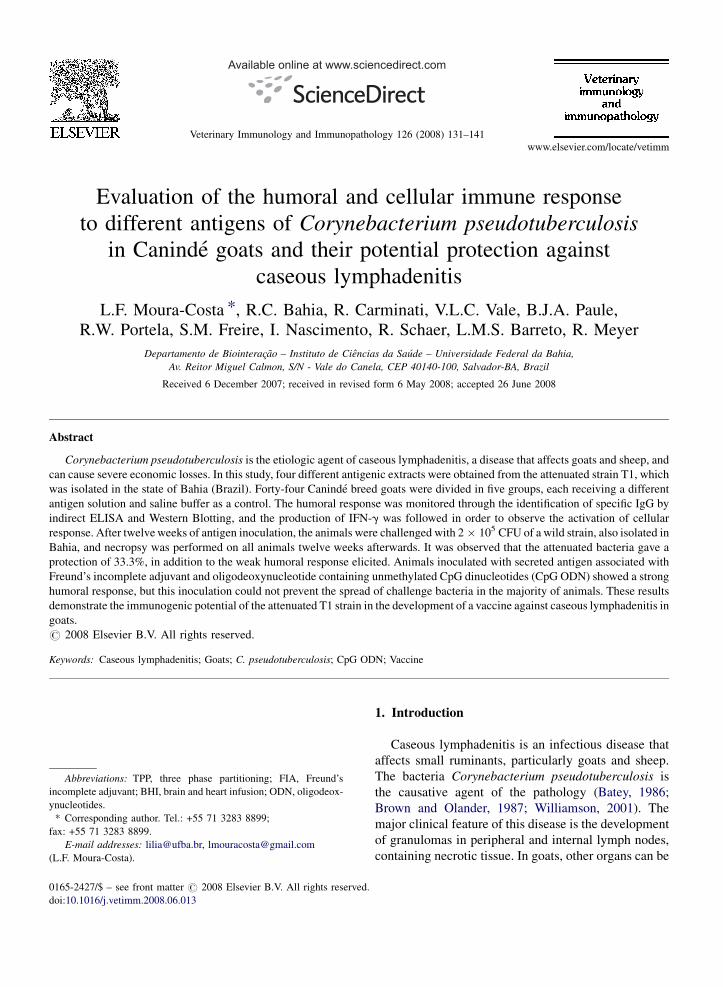
Means of optical densities (O.D.) by group are
represented in Fig. 1. It was possible to detect a
significant difference ( p < 0.05) between the means of
Groups 1 and 3 relative to the other groups. Group 4
presented an intermediary result, as Groups 2 and 5
showed the lowest levels of IgG, without a statistical
difference between them.
Means of optical density after the challenge with the
wild strain are shown in Fig. 2. Groups 1 and 3 presented
the highest means, without statistical difference between
them, however Group 5 presented, as expected, the
lowest OD, when compared to another groups.
L.F. Moura-Costa et al. / Veterinary Immunology and Immunopathology 126 (2008) 131–141 135
Fig. 1. Mean and standard error (OD490 nm) of humoral response to C. pseudotuberculosis excreted-secreted antigens of groups after immunization.
Group 1 supernatant in BHI broth + FIA; Group 2 live T1 strain; Group 3 supernatant concentrated by TPP method + FIA + CpG; Group 4
supernatant concentrated by TPP method + CpG without FIA; Group 5 PBS (control). Groups 1, 3 and 4 were re-immunized 28 days after first
immunization.
Fig. 2. Mean and standard error of OD490 nm (IgG ELISA) per group after challenge (day 0) with a wild strain (2 � 105 CFU). Group 1 supernatant in
BHI broth + FIA; Group 2 live T1 strain; Group 3 supernatant concentrated by TPP method + FIA + CpG; Group 4 supernatant concentrated by TPP
method + CpG without FIA; Group 5 PBS (control).
Tables 1 and 2 show the OD means in four defined
moments of the study. It was possible to observe that the
humoral response in Groups 1 and 3 was higher than
other groups, in the post-immunization period, during
the post-challenge time, these groups still had intense
production of IgG. Groups 2 and 4 had weak OD results,
but higher than that found in the control group (G5).
ANOVA and Tukey statistical tests were employed to
analyze the ELISA results.
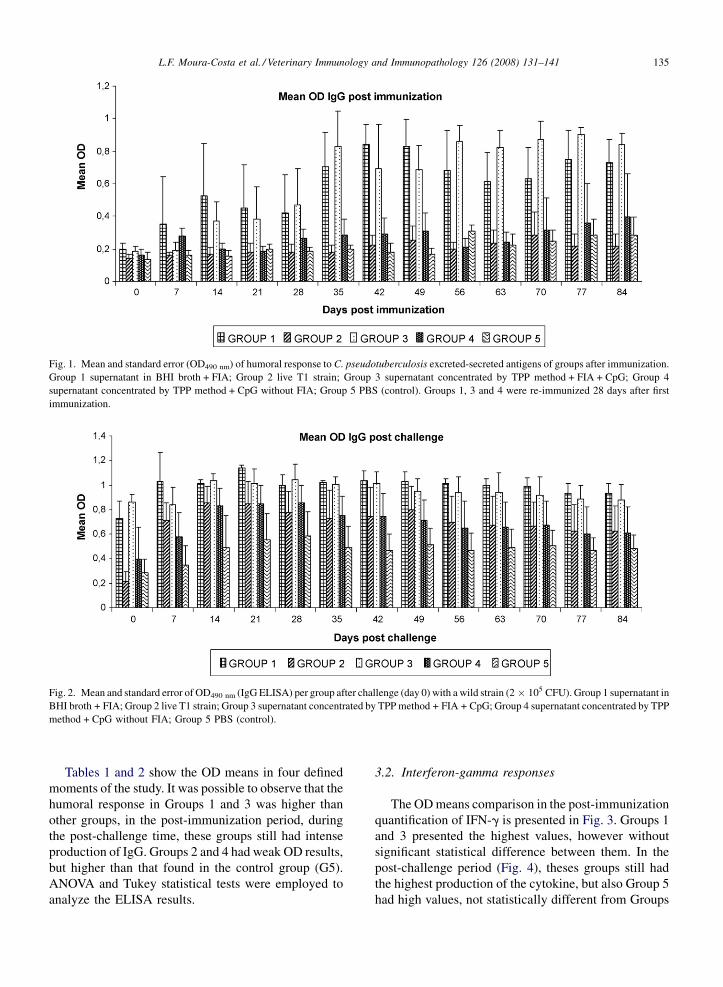
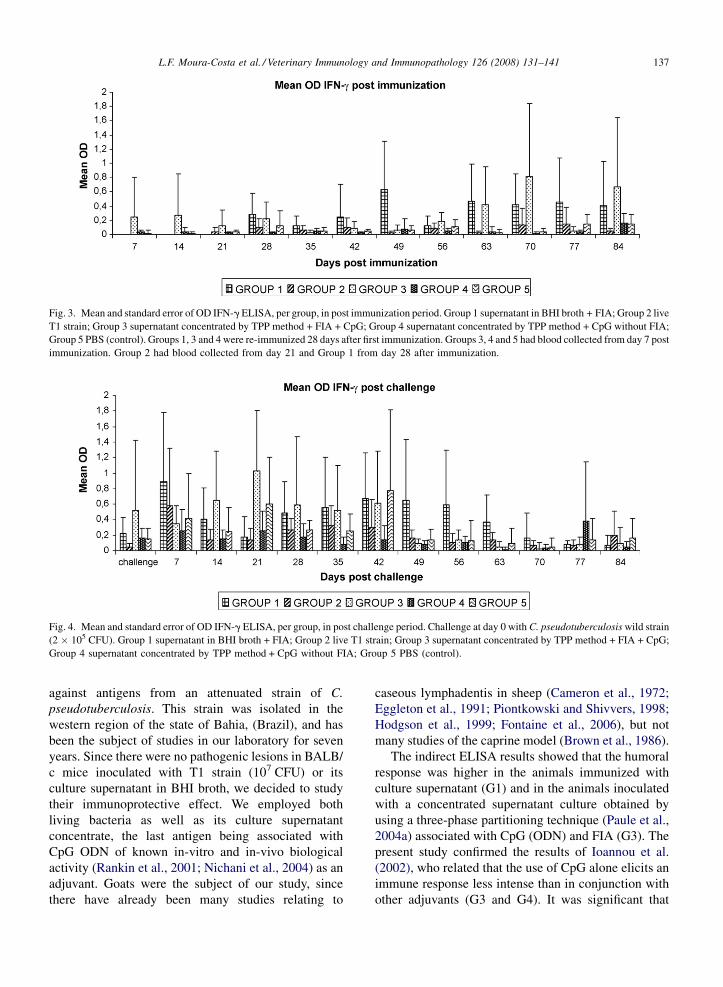
3.2. Interferon-gamma responses
The OD means comparison in the post-immunization
quantification of IFN-g is presented in Fig. 3. Groups 1
and 3 presented the highest values, however without
significant statistical difference between them. In the
post-challenge period (Fig. 4), theses groups still had
the highest production of the cytokine, but also Group 5
had high values, not statistically different from Groups

L.F. Moura-Costa et al. / Veterinary Immunology and Immunopathology 126 (2008) 131–141136
Table 1
Optical densities (OD) means found in C. pseudotuberculosis specific
IgG ELISA at 21th and 42th days post immunization (PI)
GROUP OD means at 21th PI OD means at 42th PI
G1 0.4537a 0.8382c
G2 0.1819b 0.2198d
G3 0.3858a,b 0.6909c
G4 0.1855b 0.2926d
G5 0.1985b 0.2057d
Statistical analysis was made using ANOVA and Tukey tests
( p < 0.05). Different superscript letters stands for significant statis-
tical differences among groups.a Group 1 showed statistically significant difference compared to all
other groups ( p < 0.05) except group 3.b There is no statistically significant difference between Group 3 and
the other groups ( p < 0.05).c,d Groups 1 and 3 showed statistically
significant difference compared to the other groups, but there is no
difference between each other ( p < 0.05).
Table 2
Optical densities (OD) means found in C. pseudotuberculosis specific
IgG ELISA at 21th and 42th days post challenge (PC)
GROUP OD means at 21th PC OD means at 42th PC
G1 1.1411a 1.0398d
G2 0.8478b 0.7468e
G3 1.0121a,b 1.0115d
G4 0.8479b 0.7404e
G5 0.5506c 0.4684f
Statistical analysis was made using ANOVA and Tukey tests
( p < 0.05). Different superscript letters stands for significant statis-
tical differences among groups.a Group 1 showed statistically significant difference compared to the
other groups ( p < 0.05).b There is no statistically significant difference between Group 3 and
Groups 2 and 4 ( p < 0.05).d,e,fGroups 1 and 3 showed statistically
significant difference compared to the other groups, but there is no
difference between each other ( p < 0.05).
1 and 3. On the other hand, there were no significant
differences between Groups 5 and 2, when compared to
Group 4 results.
3.3. Immunoblotting
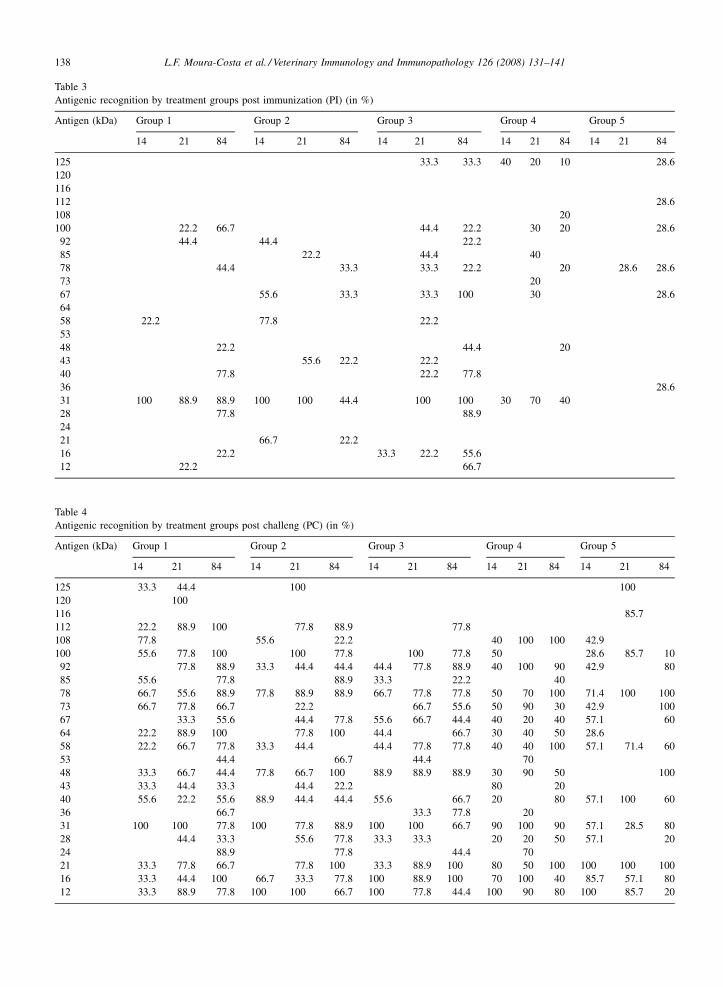
The immunoblotting analyses, as shown in Tables 3
and 4, demonstrated that there was a less intense
recognition of C. pseudotuberculosis antigens imme-
diately after the immunization, and the number of
recognized protein bands grew in the five groups with
time. After the challenge, it could be demonstrated that
twenty-four antigens had been well-recognized; ranging
from 12 to 125 kDa. The most frequently recognized
antigens on the fourteenth day after immunization had
the molecular weight of 31 kDa (in all groups except
control) and 67 kDa that was recognized by Groups 1, 2,
4 and the control group. In the twenty-first day after
immunization, there was an increase in the detection of
the 31 kDa band in the immunized groups, which also
occurred in the proteins with 58, 67, 85 and 100 kDa. In
the fourteenth day after challenge, all groups presented
recognition of nine antigens: 12, 16, 21, 31, 40, 58, 78,
92 e 108 kDa. The 48 kDa antigen was only recognized
by the immunized groups. The 31 kDa antigen was
recognized by 100% of Groups 1, 2 and 3 animals, 90%
from Groups 4 and 57.1% from the control group. The
number of recognized antigens and their intensity
increased until the eighty-fourth day after challenge.
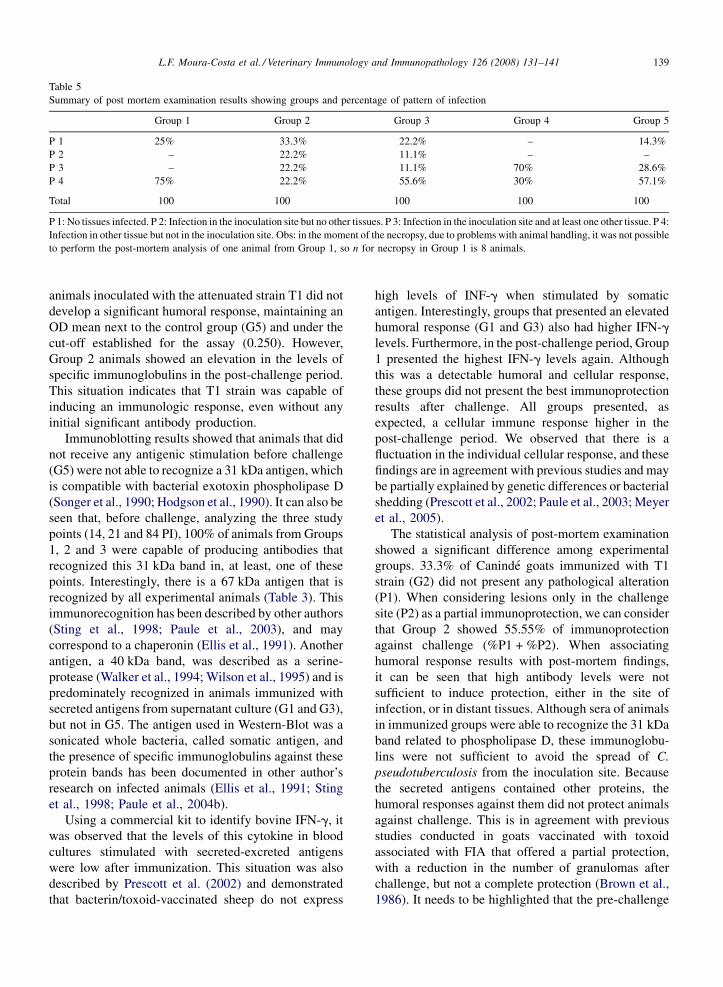
3.4. Post-mortem examination
Four patterns of lesions were considered in the
necropsy examination: the first (P1) stands for the
complete absence of infected tissues, the second (P2)
represents animals with lesions only in the site of
challenge, the third (P3) represents infection in the site of
challenge and in another tissue, and the last pattern (P4) is
characterized by the absence of infection in the site of
challenge, but presenting lesions in other tissues. These
results are shown in Table 5. Twenty-five percent of G1
group did not present lesions (P1) and 75% showed
pathologic lesions in other tissues (P4). In Group 2,
33.3% of all animals did not present any lesions (P1), and
there was 22.2% in each of the other lesion patterns.
22.2% of experimental animals from Group 3 did not
have any lesions (P1), 11.1% showed lesions only in the
challenge site (P2), 11.1% showed lesions in the bacteria
inoculation region and in other tissue (P3) and 55.6% had
lesions in organs distant from the inoculation area (P4). In
the Group 4 animals, 70% presented the pattern 3 of
lesions, and 30% the pattern 4. Finally, the Group 5, our
control group, surprisingly had 14.3% with no patholo-
gical findings, but 28.6% presented the lesion pattern 3
and 57.1% with pattern 4. Chi-square test showed a
significant statistical difference ( p = 0.047) among the
immunization schedules and the lesion patterns. All
lesions found in necropsy had positive results for the
presence of C. pseudotuberculosis in bacterial identifica-
tion, by previously described biochemical assays. There
was strong evidence that the mean percentage (by
variance analysis) of tissues infected was smaller in
Group 2 than in the other groups.
4. Discussion
This study was conducted with the aim to evaluate
the humoral and cellular response in Caninde goats
L.F. Moura-Costa et al. / Veterinary Immunology and Immunopathology 126 (2008) 131–141 137
Fig. 3. Mean and standard error of OD IFN-g ELISA, per group, in post immunization period. Group 1 supernatant in BHI broth + FIA; Group 2 live
T1 strain; Group 3 supernatant concentrated by TPP method + FIA + CpG; Group 4 supernatant concentrated by TPP method + CpG without FIA;
Group 5 PBS (control). Groups 1, 3 and 4 were re-immunized 28 days after first immunization. Groups 3, 4 and 5 had blood collected from day 7 post
immunization. Group 2 had blood collected from day 21 and Group 1 from day 28 after immunization.
Fig. 4. Mean and standard error of OD IFN-g ELISA, per group, in post challenge period. Challenge at day 0 with C. pseudotuberculosis wild strain
(2 � 105 CFU). Group 1 supernatant in BHI broth + FIA; Group 2 live T1 strain; Group 3 supernatant concentrated by TPP method + FIA + CpG;
Group 4 supernatant concentrated by TPP method + CpG without FIA; Group 5 PBS (control).
against antigens from an attenuated strain of C.
pseudotuberculosis. This strain was isolated in the
western region of the state of Bahia, (Brazil), and has
been the subject of studies in our laboratory for seven
years. Since there were no pathogenic lesions in BALB/
c mice inoculated with T1 strain (107 CFU) or its
culture supernatant in BHI broth, we decided to study
their immunoprotective effect. We employed both
living bacteria as well as its culture supernatant
concentrate, the last antigen being associated with
CpG ODN of known in-vitro and in-vivo biological
activity (Rankin et al., 2001; Nichani et al., 2004) as an
adjuvant. Goats were the subject of our study, since
there have already been many studies relating to
caseous lymphadentis in sheep (Cameron et al., 1972;
Eggleton et al., 1991; Piontkowski and Shivvers, 1998;
Hodgson et al., 1999; Fontaine et al., 2006), but not
many studies of the caprine model (Brown et al., 1986).
The indirect ELISA results showed that the humoral
response was higher in the animals immunized with
culture supernatant (G1) and in the animals inoculated
with a concentrated supernatant culture obtained by
using a three-phase partitioning technique (Paule et al.,
2004a) associated with CpG (ODN) and FIA (G3). The
present study confirmed the results of Ioannou et al.
(2002), who related that the use of CpG alone elicits an
immune response less intense than in conjunction with
other adjuvants (G3 and G4). It was significant that
L.F. Moura-Costa et al. / Veterinary Immunology and Immunopathology 126 (2008) 131–141138
Table 3
Antigenic recognition by treatment groups post immunization (PI) (in %)
Antigen (kDa) Group 1 Group 2 Group 3 Group 4 Group 5
14 21 84 14 21 84 14 21 84 14 21 84 14 21 84
125 33.3 33.3 40 20 10 28.6
120
116
112 28.6
108 20
100 22.2 66.7 44.4 22.2 30 20 28.6
92 44.4 44.4 22.2
85 22.2 44.4 40
78 44.4 33.3 33.3 22.2 20 28.6 28.6
73 20
67 55.6 33.3 33.3 100 30 28.6
64
58 22.2 77.8 22.2
53
48 22.2 44.4 20
43 55.6 22.2 22.2
40 77.8 22.2 77.8
36 28.6
31 100 88.9 88.9 100 100 44.4 100 100 30 70 40
28 77.8 88.9
24
21 66.7 22.2
16 22.2 33.3 22.2 55.6
12 22.2 66.7
Table 4
Antigenic recognition by treatment groups post challeng (PC) (in %)
Antigen (kDa) Group 1 Group 2 Group 3 Group 4 Group 5
14 21 84 14 21 84 14 21 84 14 21 84 14 21 84
125 33.3 44.4 100 100
120 100
116 85.7
112 22.2 88.9 100 77.8 88.9 77.8
108 77.8 55.6 22.2 40 100 100 42.9
100 55.6 77.8 100 100 77.8 100 77.8 50 28.6 85.7 10
92 77.8 88.9 33.3 44.4 44.4 44.4 77.8 88.9 40 100 90 42.9 80
85 55.6 77.8 88.9 33.3 22.2 40
78 66.7 55.6 88.9 77.8 88.9 88.9 66.7 77.8 77.8 50 70 100 71.4 100 100
73 66.7 77.8 66.7 22.2 66.7 55.6 50 90 30 42.9 100
67 33.3 55.6 44.4 77.8 55.6 66.7 44.4 40 20 40 57.1 60
64 22.2 88.9 100 77.8 100 44.4 66.7 30 40 50 28.6
58 22.2 66.7 77.8 33.3 44.4 44.4 77.8 77.8 40 40 100 57.1 71.4 60
53 44.4 66.7 44.4 70
48 33.3 66.7 44.4 77.8 66.7 100 88.9 88.9 88.9 30 90 50 100
43 33.3 44.4 33.3 44.4 22.2 80 20
40 55.6 22.2 55.6 88.9 44.4 44.4 55.6 66.7 20 80 57.1 100 60
36 66.7 33.3 77.8 20
31 100 100 77.8 100 77.8 88.9 100 100 66.7 90 100 90 57.1 28.5 80
28 44.4 33.3 55.6 77.8 33.3 33.3 20 20 50 57.1 20
24 88.9 77.8 44.4 70
21 33.3 77.8 66.7 77.8 100 33.3 88.9 100 80 50 100 100 100 100
16 33.3 44.4 100 66.7 33.3 77.8 100 88.9 100 70 100 40 85.7 57.1 80
12 33.3 88.9 77.8 100 100 66.7 100 77.8 44.4 100 90 80 100 85.7 20
L.F. Moura-Costa et al. / Veterinary Immunology and Immunopathology 126 (2008) 131–141 139
Table 5
Summary of post mortem examination results showing groups and percentage of pattern of infection
Group 1 Group 2 Group 3 Group 4 Group 5
P 1 25% 33.3% 22.2% – 14.3%
P 2 – 22.2% 11.1% – –
P 3 – 22.2% 11.1% 70% 28.6%
P 4 75% 22.2% 55.6% 30% 57.1%
Total 100 100 100 100 100
P 1: No tissues infected. P 2: Infection in the inoculation site but no other tissues. P 3: Infection in the inoculation site and at least one other tissue. P 4:
Infection in other tissue but not in the inoculation site. Obs: in the moment of the necropsy, due to problems with animal handling, it was not possible
to perform the post-mortem analysis of one animal from Group 1, so n for necropsy in Group 1 is 8 animals.
animals inoculated with the attenuated strain T1 did not
develop a significant humoral response, maintaining an
OD mean next to the control group (G5) and under the
cut-off established for the assay (0.250). However,
Group 2 animals showed an elevation in the levels of
specific immunoglobulins in the post-challenge period.
This situation indicates that T1 strain was capable of
inducing an immunologic response, even without any
initial significant antibody production.
Immunoblotting results showed that animals that did
not receive any antigenic stimulation before challenge
(G5) were not able to recognize a 31 kDa antigen, which
is compatible with bacterial exotoxin phospholipase D
(Songer et al., 1990; Hodgson et al., 1990). It can also be
seen that, before challenge, analyzing the three study
points (14, 21 and 84 PI), 100% of animals from Groups
1, 2 and 3 were capable of producing antibodies that
recognized this 31 kDa band in, at least, one of these
points. Interestingly, there is a 67 kDa antigen that is
recognized by all experimental animals (Table 3). This
immunorecognition has been described by other authors
(Sting et al., 1998; Paule et al., 2003), and may
correspond to a chaperonin (Ellis et al., 1991). Another
antigen, a 40 kDa band, was described as a serine-
protease (Walker et al., 1994; Wilson et al., 1995) and is
predominately recognized in animals immunized with
secreted antigens from supernatant culture (G1 and G3),
but not in G5. The antigen used in Western-Blot was a
sonicated whole bacteria, called somatic antigen, and
the presence of specific immunoglobulins against these
protein bands has been documented in other author’s
research on infected animals (Ellis et al., 1991; Sting
et al., 1998; Paule et al., 2004b).
Using a commercial kit to identify bovine IFN-g, it
was observed that the levels of this cytokine in blood
cultures stimulated with secreted-excreted antigens
were low after immunization. This situation was also
described by Prescott et al. (2002) and demonstrated
that bacterin/toxoid-vaccinated sheep do not express
high levels of INF-g when stimulated by somatic
antigen. Interestingly, groups that presented an elevated
humoral response (G1 and G3) also had higher IFN-g
levels. Furthermore, in the post-challenge period, Group
1 presented the highest IFN-g levels again. Although
this was a detectable humoral and cellular response,
these groups did not present the best immunoprotection
results after challenge. All groups presented, as
expected, a cellular immune response higher in the
post-challenge period. We observed that there is a
fluctuation in the individual cellular response, and these
findings are in agreement with previous studies and may
be partially explained by genetic differences or bacterial
shedding (Prescott et al., 2002; Paule et al., 2003; Meyer
et al., 2005).
The statistical analysis of post-mortem examination
showed a significant difference among experimental
groups. 33.3% of Caninde goats immunized with T1
strain (G2) did not present any pathological alteration
(P1). When considering lesions only in the challenge
site (P2) as a partial immunoprotection, we can consider
that Group 2 showed 55.55% of immunoprotection
against challenge (%P1 + %P2). When associating
humoral response results with post-mortem findings,
it can be seen that high antibody levels were not
sufficient to induce protection, either in the site of
infection, or in distant tissues. Although sera of animals
in immunized groups were able to recognize the 31 kDa
band related to phospholipase D, these immunoglobu-
lins were not sufficient to avoid the spread of C.
pseudotuberculosis from the inoculation site. Because
the secreted antigens contained other proteins, the
humoral responses against them did not protect animals
against challenge. This is in agreement with previous
studies conducted in goats vaccinated with toxoid
associated with FIA that offered a partial protection,
with a reduction in the number of granulomas after
challenge, but not a complete protection (Brown et al.,
1986). It needs to be highlighted that the pre-challenge

L.F. Moura-Costa et al. / Veterinary Immunology and Immunopathology 126 (2008) 131–141140
titre of antibody against phospholipase D is not
sufficient to confer protection (Hodgson et al., 1999).
We could not find any pathological lesion in one animal
from the control group (G5). This situation also occurs
in other vaccine trials (Eggleton et al., 1991; Hodgson
et al., 1999) where some animals challenged with C.
pseudotuberculosis did not developed typical lesions of
the disease.
Interestingly, the group inoculated with the atte-
nuated strain (G2) showed the best results in
immunoprotection, among all groups. There were no
local or systemic reactions to the 2 � 106 CFU
inoculum, and no booster was administered. In
addition to the initial weak antibody production, there
was a significant humoral response after challenge,
suggesting that the inoculated dose had primed the
animals. Simmons et al. (1998), observed that sheep
vaccinated with attenuated mutants of C. pseudotu-
berculosis were not able to clear the bacteria from the
lymph node draining the inoculation site. Considering
that attenuated T1 strain can persist for a long time in
the inoculation in site, it is possible that the
immunogenic stimulus may have persisted, activating
the cellular and humoral response more efficiently.
Many studies have demonstrated the importance of the
cellular immune response against C. pseudotubercu-
losis (Pepin et al., 1997; Hodgson et al., 1999).
Although our experiments did not demonstrate an
expressive cellular response in the animals inoculated
with T1 strain after immunization, efforts have been
undertaken in order to establish a better stimulating
antigen and a Real Time PCR, in order to follow
cytokine kinetic production. In addition to its
immunoprotection, the T1 attenuated strain can be
seen as a promising option, due to the low cost and
protective characteristics of a single dose.
5. Conclusions
The use of a culture supernatant associated with FIA,
and TPP concentrated secreted proteins combined with
CpG and FIA, stimulated a strong humoral response, but
without robust disease prevention. Immunization with
TPP antigenic solution associated with CpG, but
without FIA, did not cause a reliable protection and
was statistically equal to the control group. From the
four antigenic preparations, the attenuated strain
showed the best results, however with a low humoral
response. It will be necessary to adjust the challenge
dose and utilize a more efficient method of studying the
cellular response in future research to have a better
understanding of this potential vaccine strain
Acknowledgements
The authors are sincerely grateful to the technical staff
of the LABIMUNO/ICS for their assistance. We also
thank Sr. Joaozito Andrade for the supply of Caninde
goats and Dr. Arthur Hage for supply of T1 strain used in
this experiment. This study was supported by Laboratory
of Immunology of Health Sciences Institute of Federal
University of Bahia (Laboratorio de Imunologia do
Instituto de Ciencias da Saude da Universidade Federal
da Bahia - LABIMUNO/ICS/UFBA) and by the
Scientific and Technological Development Fund (Fundo
de Desenvolvimento Cientıfico e Tecnologico - FUN-
DECI) of Banco do Nordeste do Brasil S. A. (BNB).
References
Batey, R.G., 1986. Pathogenesis of caseous lymphadenitis in sheep
and goats. Aust. Vet. J. 63, 269–272.
Brogden, K.A., Cutlip, R.C., Lehmkuhl, H.D., 1984. Comparison of
protection induced in lambs by Corynebacterium pseudotuber-
culosis whole cell and cell wall vaccines. Am. J. Vet. Res. 45,
2393–2395.
Brogden, K.A., Glenn, J.S., East, N., Audibert, F., 1996. A Coryne-
bacterium pseudotuberculosis bacterin with muramyl dipeptide
induces antibody titers, increases the time of onset, and decreases
naturally occurring external abscesses in sheep and goats. Small
Rumin. Res. 19, 161–168.
Brown, C.C., Olander, H.J., Biberstein, E.L., Morse, S.M., 1986. Use
of a toxoid vaccine to protect goats against intradermal challenge
exposure to Corynebacterium pseudotuberculosis. Am. J. Vet.
Res. 47, 1116–1119.
Brown, C.C., Olander, H.J., 1987. Caseous lymphadenitis of goats and
sheep: a review. Vet. Bull. 57, 1–12.
Brown, C.C., Olander, H.J., Alves, F.C., 1987. Synergistic hemolysis-
inhibition titers associated with caseous lymphadenitis in a slaugh-
terhouse survey of goats and sheep in northeastern Brazil. Can. J.
Vet. Res. 51, 46–49.
Cameron, C.M., Minnaar, J.L., Engelbrecht, M.M., Purdom, M.R.,
1972. Immune response of merino sheep to inactivated Coryne-
bacterium pseudotuberculosis vaccine. Onderstepoort J. Vet. Res.
1, 11–24.
Carminati, R., Bahia, R., Moura-Costa, L.F., Paule, B.J.A., Vale, V.L.,
Regis, L., Freire, S.M., Nascimento, I., Schaer, R., Meyer, R.,
2003. Determinacao da sensibilidade e da especificidade de um
teste de ELISA indireto para o diagnostico de linfadenite caseosa
em caprinos. R. Ci. Med. Biol. 2, 88–93.
Eggleton, D.G., Middleton, H.D., Doidge, D.G., Minty, D.W., 1991.
Immunization against ovine caseous lymphadenitis: comparison
with of Corynebacterium pseudotuberculosis vaccines with and
without bacterial cells. Aust. Vet. J. 68, 317–319.
Ellis, T.M., Sutherland, S.S., Wilkinson, F.C., Mercy, A.R., Paton,
M.W., 1987. The role of Corynebacterium pseudotuberculosis
lung lesions in the transmission of this bacterium to other sheep.
Austr. Vet. J. 64, 261–263.
Ellis, J.A., Hawk, D.A., Mills, K.W., Pratt, D.L., 1991. Antigen
specificity of antibody responses to Corynebacterium pseudotu-
berculosis in naturally infected sheep with caseous lymphadenitis.
Vet. Immunol. Immunopathol. 28, 289–301.

L.F. Moura-Costa et al. / Veterinary Immunology and Immunopathology 126 (2008) 131–141 141
Fontaine, M.C., Baird, G., Connor, K.M., Rudge, K., Sales, J.,
Donachie, W., 2006. Vaccination confers significant protection
of sheep against infection with a virulent United Kingdom strain of
Corynebacterium pseudotuberculosis. Vaccine 24, 5986–5996.
Hodgson, A.L., Bird, P., Nisbet, I.T., 1990. Cloning, nucleotide
sequence, and expression in Escherichia coli of the phospholipase
D gene from Corynebacterium pseudotuberculosis. J. Bacteriol.
172, 1256–1261.
Hodgson, A.L.M., Carter, K., Tachedjian, M., Krywult, J., Corner,
L.A., McColl, M., Cameron, A., 1999. Efficacy of an ovine
caseous lymphadenitis vaccine formulated using a genetically
inactive form of the Corynebacterium pseudotuberculosis phos-
pholipase D. Vaccine 17, 802–808.
Ioannou, X.P., Gomis, S.M., Karvonen, B., Hecker, R., Babiuk, L.A.,
Hurk, S.D.L., 2002. CpG-containing oligodeoxynucleotides, in
combination with conventional adjuvants, enhance the magnitude
and change the bias of the immune responses to a herpesvirus
glycoprotein. Vaccine 21, 127–137.
Meyer, R., Regis, L., Vale, V., Paule, B., Carminati, R., Bahia, R.,
Moura-Costa, L., Schaer, R., Nascimento, I., Freire, S., 2005. In
vitro IFN-gamma production by goat blood cells after stimulation
with somatic and secreted Corynebacterium pseudotuberculosis
antigens. Vet. Immunol. Immunopathol. 107, 249–254.
Mills, A.E., Mitchell, R.D., Lim, E.K., 1997. Corynebacterium pseu-
dotuberculosis is a cause of human necrotising granulomatous
lymphadenitis. Pathology 29, 231–233.
Moura-Costa, L.F., Paule, B.J.A., Freire, S.M., Nascimento, I., Schaer,
R., Regis, L.F., Vale, V.L.C., Matos, D.P., Bahia, R.C., Carminati,
R., Meyer, R., 2002. Meio sintetico quimicamente definido para o
cultivo de Corynebacterium pseudotuberculosis. Rev. Bras. Saude
Prod. Anim. 3, 1–8.
Nairn, M.E., Robertson, J.P., 1974. Corynebacterium pseudotubercu-
losis infection of sheep: role of skin and dipping fluids. Aust. Vet.
J. 50, 537–542.
Nichani, A.K., Mena, A., Popowych, Y., Dent, D., Townsend, H.G.G.,
Mutwiri, G.K., Hecker, R., Babiuk, L.A., Griebel, P.J., 2004. In
vivo immunostimulatory effects of CpG oligodeoxynucleotide in
cattle and sheep. Vet. Immunol. Immunopathol. 98, 17–29.
Paule, B.J.A., Azevedo, V., Regis, L.F., Carminati, R., Bahia, R.C.,
Vale, V.L.C., Moura-Costa, L.F., Freire, S.M., Nascimento, I.,
Schaer, R., Goes, A.M., Meyer, R., 2003. Experimental Coryne-
bacterium pseudotuberculosis primary infection in goats: kinetics
of IgG and interferon production, IgG avidity and antigen recog-
nition by Western Blotting. Vet. Immunol. Immunopathol. 96,
129–139.
Paule, B.J.A., Meyer, R., Moura-Costa, L.F., Bahia, R.C., Carminati,
R., Regis, L.F., Vale, V.L.C., Freire, S.M., Nascimento, I., Schaer,
R., Azevedo, V., 2004a. Three phase partitioning as an efficient
method for extraction/concentration of immunoreactive excreted-
secreted proteins of Corynebacterium pseudotuberculosis. Prot.
Express. Purif. 34, 311–316.
Paule, B.J.A., Azevedo, V., Moura-Costa, L.F., Freire, S.M., Regis,
L.F., Vale, V.L.C., Bahia, R.C., Carminati, R., Nascimento, I.,
Meyer, R., 2004b. SDS-PAGE and Western blot analysis of
somatic and extracellular antigens of Corynebacterium pseudo-
tuberculosis. R. Ci. Med. Biol. 3, 44–52.
Peel, M.M., Palmer, G.G., Stacpoole, A.M., Kerr, T.G., 1997.
Human lymphadenitis due to Corynebacterium pseudotubercu-
losis: report of tem cases from Australia and review. Clin. Infect.
Dis. 2, 185–191.
Pepin, M., Seow, H.F., Corner, L., Rothel, J.S., Hodgson, A.L.M.,
Wood, P.R., 1997. Cytokine gene expression in sheep following
experimental infection with various strains of Corynebacterium
pseudotuberculosis differing in virulence. Vet. Res. 28, 149–163.
Pepin, M., Sanchis, R., Paton, M., 1999. La lymphadenite caseeuse des
ovins et des caprins. Point Vet. 30, 33–40.
Piontkowski, M.D., Shivvers, D.W., 1998. Evaluation of a commercial
available vaccine against Corynebacterium pseudotuberculosis for
use in sheep. J. Am. Vet. Med. Assoc. 212, 1765–1768.
Prescott, J.F., Menzies, P.I., Hwang, Y.T., 2002. An interferongamma
assay for diagnosis of Corynebacterium pseudotuberculosis infec-
tion in adult sheep from a research flock. Vet. Microbiol. 88, 287–
297.
Rankin, R., Pontarollo, R., Ioannou, X., Krieg, A.M., Hecker, R.,
Babiuk, L.A., Hurk, S.D.L., 2001. CpG motif identification for
veterinary and laboratory species demonstrates that sequence
recognition is highly conserved. Antisense Nucleic Acid Drug
Dev. 11, 333–340.
Simmons, C.P., Dunstan, S.J., Tachedjian, M., Krywult, J., Hodgson,
A.L.M., Strugnell, R.A., 1998. Vaccine potential of attenuated
mutants of Corynebacterium pseudotuberculosis in sheep. Infect.
Immun. 66, 474–479.
Songer, J.G., Iandolo, J.J., Libby, S.J., Cuevas, W.A., 1990. Cloning
and expression of the phospholipase D gene of Corynebacterium
pseudotuberculosis in Escherichia coli. Infect. Immun. 1,
131–136.
Sting, R., Steng, G., Spengler, D., 1998. Serological studies on
Corynebacterium pseudotuberculosis infections in goats using
Enzyme-linked Immunosorbent Assay. J. Vet. Med. 45, 209–216.
Unanian, M.M., Feliciano-Silva, A.E.D., Pant, K.P., 1985. Abscesses
and caseous lymphadenitis in goats in tropical semi-arid north-east
Brazil. Trop. Anim. Health. Prod. 17, 57–62.
Walker, J., Jackson, H.J., Eggleton, D.G., Meeusen, E.N., Wilson,
M.J., Brandon, M.R., 1994. Identification of a novel antigen from
Corynebacterium pseudotuberculosis that protects sheep against
caseous lymphadenitis. Infect. Immun. 62, 2562–2567.
Williamson, L.H., 2001. Caseous lymphadenitis in small ruminants.
Vet. Clin. North. Am. Food Anim. Pract. 2, 359–371.
Wilson, M.J., Brandon, M.R., Walker, J., 1995. Molecular and bio-
chemical characterization of a protective 40-Kilodalton antigen
from Corynebacterium pseudotuberculosis. Infect. Immun. 63,
206–211.