Evaluation of Global Daily Reference ET Using Oklahoma’s Environmental Monitoring...
13
Water Resour Manage (2011) 25:1601–1613 DOI 10.1007/s11269-010-9763-0 Evaluation of Global Daily Reference ET Using Oklahoma’s Environmental Monitoring Network—MESONET Wenjuan Liu · Yang Hong · Sadiq Khan · Mingbin Huang · Trevor Grout · Pradeep Adhikari Received: 14 January 2010 / Accepted: 6 December 2010 / Published online: 15 January 2011 © Springer Science+Business Media B.V. 2011 Abstract The objective of this study is to evaluate the potential utility of the USGS Global Data Assimilation System (GDAS) 1-degree, daily reference Evapotran- spiration (ET 0 ) products by comparing them with observed Oklahoma mesonet daily ET 0 over a 2 year period (2005–2006). The comparison showed a close match between the two independent ET 0 products, with bias within a range of 10% for most of the sites and the overall bias of −2.80%. The temporal patterns are strongly correlated, with a correlation coefficient above 0.9 for all groups. In summary, we conclude that (1) the consistent low bias shows the original GDAS ET 0 products have high potentials to be used in land surface modeling; (2) the high temporal correlations demonstrate the capability of GDAS ET 0 to represent the major atmospheric processes that control the daily variation of surface hydrology; (3) The temporal W. Liu · M. Huang College of Resource and Environment, Northwest A&F University, Yangling, Shaanxi Province 712100, China W. Liu · Y. Hong (B ) · S. Khan · T. Grout · P. Adhikari School of Civil Engineering and Environmental Science, University of Oklahoma, Norman, OK, USA e-mail: [email protected] W. Liu · Y. Hong · S. Khan · T. Grout · P. Adhikari Center for Natural Hazard and Disaster Research, National Weather Center, Norman, OK, USA W. Liu Institution of Earth Environment, Chinese Academy of Sciences, Xi’an, Shaanxi Province 710075, China M. Huang State Key Laboratory of Soil Erosion and Dryland farming on the Loess Plateau, Institute of Soil and Water Conservation, Chinese Academy of Sciences & Ministry of Water Resources, Yangling, Shaanxi 712100, China
Transcript of Evaluation of Global Daily Reference ET Using Oklahoma’s Environmental Monitoring...
Water Resour Manage (2011) 25:1601–1613DOI 10.1007/s11269-010-9763-0
Evaluation of Global Daily Reference ETUsing Oklahoma’s Environmental MonitoringNetwork—MESONET
Wenjuan Liu · Yang Hong · Sadiq Khan ·Mingbin Huang · Trevor Grout · Pradeep Adhikari
Received: 14 January 2010 / Accepted: 6 December 2010 /Published online: 15 January 2011© Springer Science+Business Media B.V. 2011
Abstract The objective of this study is to evaluate the potential utility of the USGSGlobal Data Assimilation System (GDAS) 1-degree, daily reference Evapotran-spiration (ET0) products by comparing them with observed Oklahoma mesonetdaily ET0 over a 2 year period (2005–2006). The comparison showed a close matchbetween the two independent ET0 products, with bias within a range of 10% formost of the sites and the overall bias of −2.80%. The temporal patterns are stronglycorrelated, with a correlation coefficient above 0.9 for all groups. In summary, weconclude that (1) the consistent low bias shows the original GDAS ET0 products havehigh potentials to be used in land surface modeling; (2) the high temporal correlationsdemonstrate the capability of GDAS ET0 to represent the major atmosphericprocesses that control the daily variation of surface hydrology; (3) The temporal
W. Liu · M. HuangCollege of Resource and Environment, Northwest A&F University, Yangling,Shaanxi Province 712100, China
W. Liu · Y. Hong (B) · S. Khan · T. Grout · P. AdhikariSchool of Civil Engineering and Environmental Science, University of Oklahoma,Norman, OK, USAe-mail: [email protected]
W. Liu · Y. Hong · S. Khan · T. Grout · P. AdhikariCenter for Natural Hazard and Disaster Research, National Weather Center, Norman, OK, USA
W. LiuInstitution of Earth Environment, Chinese Academy of Sciences, Xi’an,Shaanxi Province 710075, China
M. HuangState Key Laboratory of Soil Erosion and Dryland farming on the Loess Plateau,Institute of Soil and Water Conservation, Chinese Academy of Sciences &Ministry of Water Resources, Yangling, Shaanxi 712100, China
1602 W. Liu et al.
and spatial correspondences in trend between independent datasets (GDAS andMESONET) were good. The finding in Oklahoma, a different hydro-climate regionfrom a similar regional study conducted in California by Senay et al. (J Am WaterRes Assoc 44(4):969–979, 2008), reconfirms the reliability and potential of usingGDAS reference ET for regional energy balance and water resources managementin many parts of the world.
Keywords Evapotranspiration (ET) · Reference ET · GDAS ·Oklahoma MESONET
1 Introduction
As one of the major components of the hydrologic cycle, land surface evapotranspira-tion (ET) represents the transport of water into the atmosphere from surfaces includ-ing soil (evaporation, E) and vegetation (transpiration, T) (Chauhan and Shrivastava2009). The process of evaporation and transpiration occurs simultaneously for veg-etated areas. For example, for small crops water is lost mainly by soil evaporation,but for well developed crops transpiration becomes the dominating process (Allenet al. 1998). In arid and semi-arid regions, ET is the major source of water depletion.Therefore, quantification of ET is critical for various disciplines especially to thoseinvolved in hydrologic budgeting, water resources planning, agricultural irrigation,and ecological system risk management (Allen 2007; Sabziparvar et al. 2010)
Penman (1956) originally defined potential ET as the amount of water transpiredper unit time by a short green crop, completely shading the ground, of uniform heightand never short of water. This method takes into account a comprehensive range ofmeteorological factors such as radiation intensity, temperature, humidity, and windwith a number of simplifying assumptions (Krishnan and Kushwaha 1971). PotentialET is gradually being replaced with Reference ET (ET0) to conform to standardterminology (Allen et al. 1994a, b), particularly in the field of water resourcesmanagement and irrigation applications according to Senay et al. (2008). The conceptof reference ET (ET0) makes it relatively easy to transfer the calibrated crop-specific coefficients to new study areas (Senay et al. 2008). For further explanationon evapotranspiration and applications, the readers are referred to Penman (1956),Jensen et al. (1990), Shuttleworth (1992), Nokes (1995) and Senay et al. (2008).
Recently, due to the increasing availability of hydrometeorological remote sensingproducts covering the entire globe, the task of estimation of ET0 at large scales hasbecome feasible due to affordable computational costs. A multi-year, global ET0
estimate database at daily 1-degree spatiotemporal resolution has been calculatedfrom the National Oceanic and Atmospheric Administration (NOAA) Global DataAssimilation System (GDAS) (GDAS 2008) (http://earlywarning.usgs.gov/Global/index.php) using global-scale meteorological datasets.
The central objective of this study is to evaluate the potential utility of the GDASET0 products in regional water resource research by comparing with ET0 datafrom the Oklahoma Regional Mesoscale Meteorological Observational Network(MESONET). This study evaluated the performance of GDAS in estimating ET0 inthe South Great Plains climatologic zone by comparing in-situ ET0 calculated fromMESONET.
Evaluation of Global Daily Reference ET 1603
2 Study Area and Methodology
2.1 Study Area
The study area is located in central Oklahoma, USA (Fig. 1). Oklahoma typically hasirrigated agriculture, rain-fed agriculture, wetlands, and riparian vegetation, all ofwhich transmit water into the atmosphere through the ET process. It has a semi-aridclimate with annual precipitation of about 870 mm. The agriculture predominantlyrelies on irrigation. Figure 1 also shows the topography of the state of Oklahoma anda daily GDAS ET0 distribution at 1-degree spatial resolution on a randomly selectedday of October 20th 2007.
2.2 ET Models
2.2.1 MESONET ET Model
The Oklahoma MESONET, established in January 1994, measures a wealth ofatmospheric and hydrologic variables including solar radiation, humidity, temper-ature, wind speed and direction, and soil moisture to aid in operational weatherforecasting and environmental research across the state (Brock et al. 1995; OklahomaMesonet 2008; http://www.mesonet.org). The MESONET network consists of 120
(a)
(c)(b)
Fig. 1 Study area and GDAS ET0 data: a the Oklahoma 120 MESONET stations (dots) groupedunder 11 GDAS ID groups (triangles) with at least four MESONET stations within each group forthis study; b the relative flat of Oklahoma topography, particularly over the study area; and c thedaily 1-degree GDAS ET0 data on October 20th 2007 over continental USA
1604 W. Liu et al.
automated stations across the state of the Oklahoma, at least one station in eachof Oklahoma’s 77 counties. At each site, measurements are taken with a set ofinstruments (the set consists of a lightning rod, a solar panel, a battery, a radiotransmitter, a special micro-computer called a data logger and rain gauge) locatedon or near a 10-m-tall tower. Certain instruments are located at every Mesonetsite to measure the standard-primary variables. These variables and sensors are asfollows: RM Young Wind Monitor for wind speed; Thermometrics Air Temperaturefor Air Temperature; Vaisala Barometer for Pressure; and Campbell Scientific 229-L for Delta. The measurements are packaged into observations every 5 min. Thenthe observations are transmitted to the Oklahoma Climatological Survey (OCS)at the University of Oklahoma (OU), where the observed data are processed andverified for their quality and made public. It only takes 5 to 10 min from the timethe measurements are made until they become available to the public. The facility isavailable 24 h per day, year-round for processing and quality control.
Among many retrieval algorithms and derived products, the MESONET ET modelis essentially a weather-based tool that estimates potential water loss through thecombined processes of evaporation (from soil) and plant transpiration (Sutherlandet al. 2005). The reference ET model is based on the standardized Penman-Monteithreference evapotranspiration equation recommended by the American Society ofCivil Engineers (ASCE) and the computational procedures found in Allen et al.(1994a, b). The ASCE Standardized Reference ET equation is given in Eq. 1 as(Jensen et al. 1990):
Reference ET = 0.408(Rn − G) + γ CnT+273 u2 (es − ea)
+ γ (1 + Cdu2)(1)
Where:
Reference ET Standardized reference evapotranspiration (mm day−1)Rn Calculated net radiation at the crop surface (MJ m−2 day−1for daily
time steps)G Soil heat flux density at the soil surface (MJ m−2 day−1for daily time
steps)T Mean daily or hourly air temperature at 1.5 to 2.5-m height (C),u2 Mean daily or hourly wind speed at 2-m height (m s−1),es Saturation vapor pressure at 1.5 to 2.5-m height (kPa), for daily
computation, the value is the average of es at maximum and min-imum air temperature,
ea Mean actual vapor pressure at 1.5 to 2.5-m height (kPa), Delta, the slope of the saturation vapor pressure-temperature curve
(kPa C−1),γ Psychrometric constant (kPa C−1),Cn Numerator constant that changes with reference type and calcula-
tion time stepCd Denominator constant that changes with reference type and calcu-
lation time step.
In this study, all 5-min weather variables observed from the MESONET are accumu-lated to hourly time scales, in order to compute the reference ET. Then site-basedET0 is calculated hourly from MESONET stations and accumulated to daily ET0 for
Evaluation of Global Daily Reference ET 1605
a 2 year period (2005–2006). The 2 years of MESONET ET0 datasets were chosen tocorrespond with the availability of a complete daily dataset from GDAS ET0. A totalof 72 MESONET sites, located in Oklahoma, are grouped into 11 GDAS ID groupswith at least 4 MESONET stations within each group for the analysis (Fig. 1).
2.2.2 Global Data Assimilation System (GDAS) ET Model
The three steps used to compute the daily GDAS ET0 are summarized in Fig. 2 andbriefly described below (Senay et al. 2008).
Step one: Acquire raw dataThe NOAA produces GDAS analysis field files every 6 h in GriddedBinary (GRIB) format. The GDAS fields that are used as input to
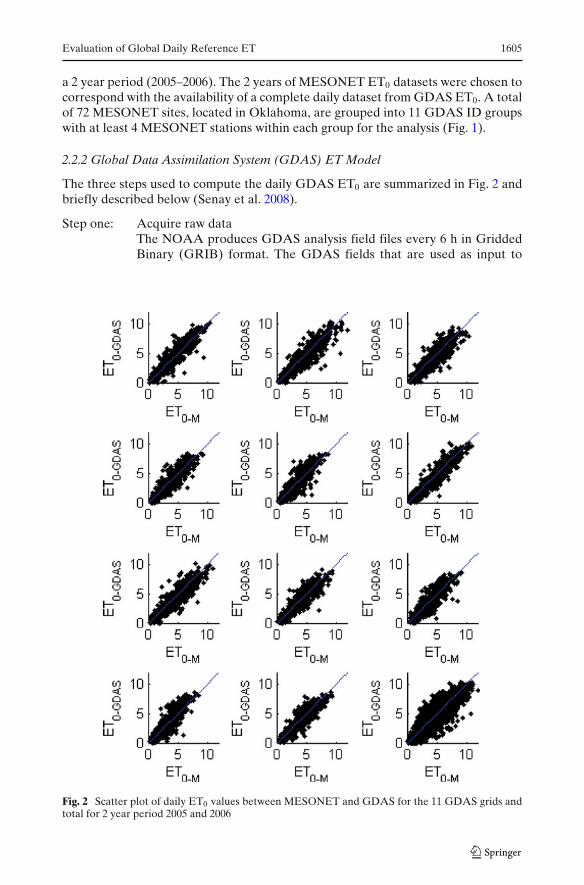
Fig. 2 Scatter plot of daily ET0 values between MESONET and GDAS for the 11 GDAS grids andtotal for 2 year period 2005 and 2006
1606 W. Liu et al.
the reference ET calculation include: air temperature, atmosphericpressure, wind speed, relative humidity, and solar radiation (long wave,short wave, outgoing, and incoming). Some of these data are down-loadable from http://earlywarning.usgs.gov/Global/dwnglobalpet.php(GDAS 2008).
Step two: Extract input parameters to calculate 6-h ET0
After the eight files for each day (two files for each 6-h period) havebeen retrieved, the weather parameters (radiation, air temperature,wind speed, relative humidity, and pressure) for 6-h ET0 calculationare extracted from the GRIB formatted files. Six-hour reference ETwas calculated using the relation given by Shuttleworth (1992) for ref-erence crop evaporation. The FAO publication 56 is used to normalizethe 6-hourly reference ET calculations (Allen et al. 1998), similar toEq. 1 but accumulated from an hourly time step. Afterwards they areconverted to ARC/INFO GRID (ESRI 2004) format for the intendedaccumulation time period.
Step three: Accumulate 6-h ET0 to daily ET0
Afterward, the four six-hourly ET0 grids are then accumulated to ob-tain the daily total. A day is defined as beginning at 00 hours GMT. Thedaily ET0 values are scaled up (i.e. multiplied) by a factor of 100 to pre-serve the precision to 0.01 mm [FEWS NET: http://earlywarning.usgs.gov/Global/ET0readme.php]. The grids produced are in geographic co-ordinate systems having a ground resolution of 1 and an extent of−180 to +180 longitude by −90 to +90 latitude.
In order to subset the GDAS ET0 to Oklahoma region, the geographic coordinatesof MESONET sites (Fig. 1) were used to extract the daily ET0 pixel values from theGDAS grids. The data was extracted using ModelBuilder and Python in ArcGIS.Because one GDAS grid box contains more than one MESONET site, we averagedthe values of all MESONET sites within a single GDAS grid. Afterward, 11 GDASgrids that contained at least four MESONET sites each were identified and assignedunique GDAS IDs. The maximum number of MESONET sites in a single GDASgrid was 8 (see GDAS_IDs-3,-4,-7) (Fig. 1).
2.3 Evaluation Indices
For the evaluation, we employed commonly used performance indicators: relativebias, absolute bias, root mean square error, and correlation coefficient for each ofthe 2 years and the 2 years combined.
Relative Bias (Bias) It is a measure of total volume difference between two timeseries. The relative bias between MESONET and GDAS was then calculated inEq. 2 as:
Relative .bias (% ) =
N∑
i=1ET0GDASi −
N∑
i=1ET0Mi
N∑
i=1ET0Mi
× 100 (2)
Evaluation of Global Daily Reference ET 1607
Where ET0GDASi is the GDAS Reference ET, ET0Mi is MESONET reference ET
Absolute Bias It is a measure of the timing difference between the two time seriesbesides the volume difference. For example, if the percent bias measure between twotime series is small and at the same time, the absolute percent bias measure is large,then one can say the two time series have close total volume but their timing arenot as close. A good agreement between the two requires that both percent bias andabsolute percent bias are small. The absolute percent bias, shown in Eq. 3, is alwaysgreater than or equal to percent bias.
Abs. bias (% ) =
N∑
i=1|ET0GDASi − ET0Mi|2
N∑
i=1ET0Mi
× 100 (3)
Root Mean Square Error (RMSE) Here we adopted relative RMSE, Eq. 4, thatmeasures the relative error of magnitude as a percentage (%) of observations (i.e.MESONET in this study).
RMSE (% ) =
√N∑
i=1
(ET0GDASi−ET0Mi
)2
N
ET0Mi× 100 (4)
Correlation Coef f icient (R) The correlation coefficient (R), Eq. 5, is used to assessthe relation between MESONET and GDAS ET0 values.
R =
N∑
i=1
(ET0GDASi − ET0GDAS
)·
N∑
i=1
(ET0Mi − ET0M
)
√N∑
i=1
(ET0GDASi − ET0GDAS
)2 ·N∑
i=1
(ET0Mi − ET0M
2.
(5)
Where ET0GDASi is the GDAS Reference ET, ET0Mi is MESONET reference ET.And ET0M ET0GDAS are the mean of MESONET and GDAS ET0, respec-
tively. Correlation statistics were also calculated to test the correlations betweenMESONET ET0 and GDAS ET0 at differently aggregated time intervals (1-, 2-, 3-,4-, 5-, 10-, and 15-day moving averages) for all sites.
3 Results and Discussions
3.1 GDAS ET0 Evaluation
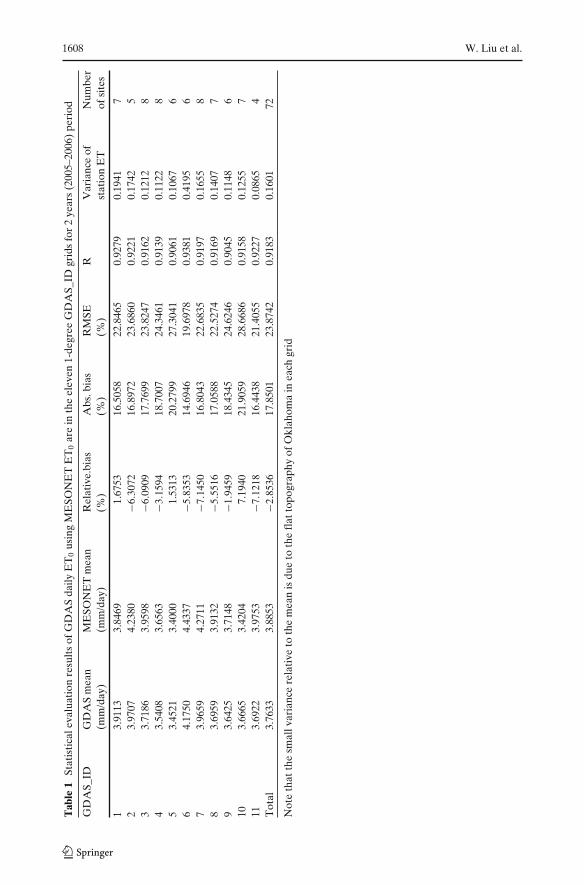
In this study, comparison between MESONET ET0 and GDAS ET0 was conductedprimarily at a daily time scale. Table 1 presents a summary of the statistics for the2 years (2005 and 2006) of daily ET0 comparison. The relative bias values in all groupsare within the range of −7.12% to 7.19%. The lowest relative bias is 1.53%, observedin GDAS_ID group Five. The lowest absolute bias is 14.69%, observed in GDAS_IDgroup six. R for all groups are above 0.9. The maximum R obtained is about 0.94 in
1608 W. Liu et al.
Tab
le1
Stat
isti
cale
valu
atio
nre
sult
sof
GD
AS
daily
ET
0us
ing
ME
SON
ET
ET
0ar
ein
the
elev
en1-
degr
eeG
DA
S_ID
grid
sfo
r2
year
s(2
005–
2006
)pe
riod
GD
AS_
IDG
DA
Sm
ean
ME
SON
ET
mea
nR
elat
ive.
bias
Abs
.bia
sR
MSE
RV
aria
nce
ofN
umbe
r(m
m/d
ay)
(mm
/day
)(%
)(%
)(%
)st
atio
nE
Tof
site
s
13.
9113
3.84
691.
6753
16.5
058
22.8
465
0.92
790.
1941
72
3.97
074.
2380
−6.3
072
16.8
972
23.6
860
0.92
210.
1742
53
3.71
863.
9598
−6.0
909
17.7
699
23.8
247
0.91
620.
1212
84
3.54
083.
6563
−3.1
594
18.7
007
24.3
461
0.91
390.
1122
85
3.45
213.
4000
1.53
1320
.279
927
.304
10.
9061
0.10
676
64.
1750
4.43
37−5
.835
314
.694
619
.697
80.
9381
0.41
956
73.
9659
4.27
11−7
.145
016
.804
322
.683
50.
9197
0.16
558
83.
6959
3.91
32−5
.551
617
.058
822
.527
40.
9169
0.14
077
93.
6425
3.71
48−1
.945
918
.434
524
.624
60.
9045
0.11
486
103.
6665
3.42
047.
1940
21.9
059
28.6
686
0.91
580.
1255
711
3.69
223.
9753
−7.1
218
16.4
438
21.4
055
0.92
270.
0865
4T
otal
3.76
333.
8853
−2.8
536
17.8
501
23.8
742
0.91
830.
1601
72
Not
eth
atth
esm
allv
aria
nce
rela
tive
toth
em
ean
isdu
eto
the
flat
topo
grap
hyof
Okl
ahom
ain
each
grid
Evaluation of Global Daily Reference ET 1609
GDAS_ID group six. The RMSEs from all GDAS_ID locations are within 28.67%and GDAS_ID-6 gave the best result among all sites (RMSE = 19.70%). As shown inFig. 2, GDAS ET0 and MESONET ET0 have shown strong linear correlations amongthe 11 groups and the total for the year 2005 and 2006. However, the variationsamong the 11 groups shown in Table 1 and Fig. 2 can probably be attributed to themicro-climate difference within the Southern Great Plain (Brotzge and Richardson2003).
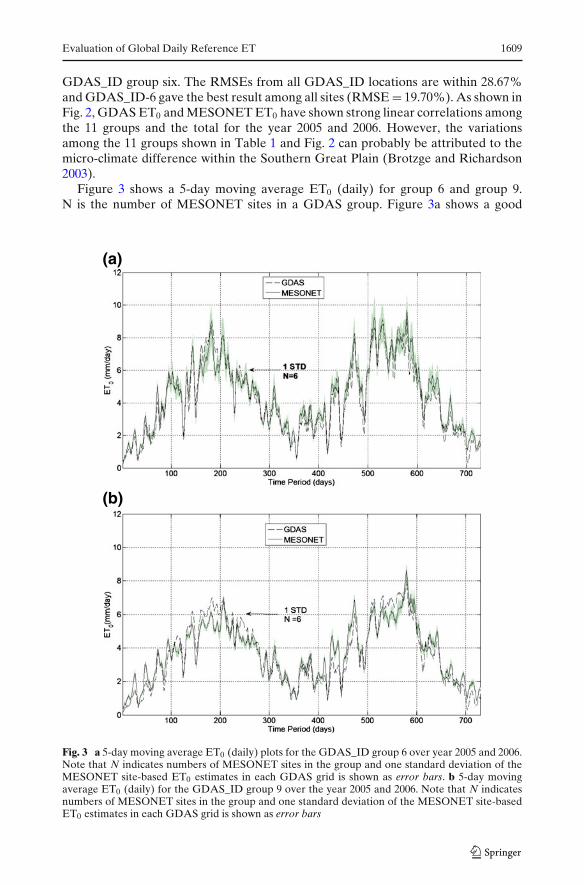
Figure 3 shows a 5-day moving average ET0 (daily) for group 6 and group 9.N is the number of MESONET sites in a GDAS group. Figure 3a shows a good
(a)
(b)
Fig. 3 a 5-day moving average ET0 (daily) plots for the GDAS_ID group 6 over year 2005 and 2006.Note that N indicates numbers of MESONET sites in the group and one standard deviation of theMESONET site-based ET0 estimates in each GDAS grid is shown as error bars. b 5-day movingaverage ET0 (daily) for the GDAS_ID group 9 over the year 2005 and 2006. Note that N indicatesnumbers of MESONET sites in the group and one standard deviation of the MESONET site-basedET0 estimates in each GDAS grid is shown as error bars
1610 W. Liu et al.
Tab
le2
Cor
rela
tion
coef
fici
entb
etw
een
ME
SON
ET
daily
ET
0an
dG
DA
Sda
ilyE
T0
atdi
ffer
enta
ggre
gati
onti
mes
for
2005
and
2006
Agg
rega
tion
01
23
45
1015
peri
od(d
ays)
GD
AS_
ID1
0.92
790.
9481
0.95
650.
9613
0.96
450.
9667
0.97
230.
9749
20.
9221
0.94
660.
9565
0.96
270.
9665
0.96
850.
9734
0.97
553
0.91
620.
9410
0.95
130.
9571
0.96
090.
9632
0.96
910.
9710
40.
9139
0.94
110.
9518
0.95
770.
9616
0.96
430.
9718
0.97
475
0.90
610.
9381
0.95
050.
9610
0.96
090.
9640
0.97
200.
9753
60.
9381
0.96
090.
9693
0.97
320.
9755
0.97
700.
9819
0.98
447
0.91
970.
9470
0.95
760.
9628
0.96
580.
9673
0.97
180.
9744
80.
9169
0.94
180.
9511
0.95
610.
9593
0.96
120.
9657
0.96
809
0.90
450.
9329
0.94
440.
9510
0.95
520.
9580
0.96
490.
9681
100.
9158
0.94
310.
9540
0.96
030.
9645
0.96
730.
9749
0.97
8311
0.92
270.
9481
0.95
780.
9627
0.96
540.
9675
0.97
290.
9758
Tot
al0.
9183
0.94
420.
9544
0.96
030.
9635
0.96
570.
9717
0.97
44
Evaluation of Global Daily Reference ET 1611
association between MESONET and GDAS ET0 for GDAS group ID:6; the onestandard deviation of daily ET0 from the six MESONET sites is shown as error barsat each day. From this group however, we can see that the magnitude of the standarddeviation of MESONET sites varies seasonally. The maximum standard deviationsoccurred in the summer months, the 11 groups, good temporal correlations aregenerally observed even if there are some differences in the statistical parametersamong the groups. Figure 3b shows a association between MESONET and GDASET0 for GDAS group ID 9. According to Table 2 group ID 9 gave the worstcorrelation coefficient among all groups. In general, Fig. 3 indicates that the absolutedifferences and magnitude of the standard deviation of MESONET sites showseasonal patterns, higher in summer and lower in other seasons; however, thenormalized one standard deviation shows no, or insignificant, seasonal pattern.
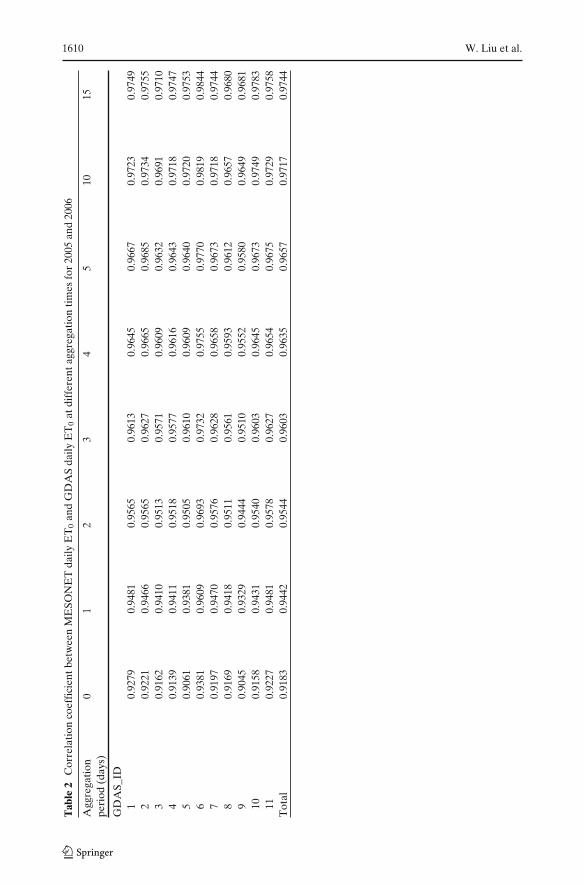
Table 2 shows the correlation coefficient between MESONET ET0 and GDASET0 at different moving average time steps, from zero-day moving averaging to15 days (0, 1, 2, 3, 4, 5, 10, and 15 days) for all sites in 2005 and 2006. For example,the correlation coefficients in GDAS_ID-6 are very high, ranging from 0.94 on zero-day to 0.98 for a 15-day average aggregation. It is also observed that the correlationhas shown an increasing trend as the aggregation period increases. The incrementhas been very high from 0-day to 1-day aggregation (from 0.9381 to 0.9609 or by0.0228). The smallest change (<0.0015) is observed from 4-day to 5-day aggregationfrom among the 4-day through 15-day aggregation periods. We observed similarresults among the other groups. This justifies the use of the 5-day aggregation for thedisplay of temporal charts in Fig. 3 without losing any information on the correlationcomposition.
As shown in Table 2, the correlation coefficients between GDAS ET0 andMESONET ET0 at 5-day aggregation for both 11 groups and all 72 sites are morethan 0.95, although their annual ET0 difference varies (Table 1). This indicatesthat despite a quantitative difference in some of the sites, the temporal patternsbetween GDAS ET0 and MESONET ET0 are strongly correlated. This demonstratesthe capability of GDAS ET0 to represent the major atmospheric processes thatcontribute to daily variations of important hydrological aspects.
4 Summary and Conclusions
The central objective of this study is to evaluate the utility of the operationalUSGS/EROS GDAS 1-degree daily ET0 product in regional water resource re-search. For the evaluation we used the Oklahoma MESONET’s daily ET0 datafor 2005–2006. It showed that most of the 11 groups (i.e., 72 MESONET sites)demonstrated a close match between the two independent datasets (GDAS andMESONET) during the 2 years, with relative bias within a range of 10% and totalrelative bias averaged −2.8%. The consistent low relative bias shows that GDASET0 products have a very high potential to be used in climate modeling particularlyfor macro-scale land surface and regional climate modeling. Furthermore, despitesite difference, the temporal patterns between GDAS ET0 and MESONET ET0
are strongly correlated, with a correlation coefficient more than 0.9 for all groups.This demonstrates the capability of GDAS ET0 to represent the major atmosphericprocesses that contribute to daily variations of important hydrological parameters.
1612 W. Liu et al.
In summary, we conclude that (1) the consistent low relative bias shows theoriginal 1-degree GDAS ET0 products have a high potential to be used in climatemodeling, particularly for macro-scale land surface and regional climate modeling;(2) the high temporal correlations demonstrate the capability of GDAS ET0 torepresent the major atmospheric processes that control the daily variation of surfacehydrology. The finding in Oklahoma, a different hydro-climate region from a similarstudy conducted in California by Senay et al. (2008), reconfirms the reliability andpotential of using GDAS reference ET for regional energy balance (thermal data-based) and water balance (soil moisture-based) management in many parts of theworld. On a side note, for practical purposes, various ET modeling techniquesestimate actual ET as a fraction of ET0 based on the soil–water content and vege-tation conditions (Senay et al. 2007, 2008). Therefore, the availability of global dailyGDAS ET0 product as an operational model undoubtedly provides an opportunity ofestimating actual ET on a global basis; however more thorough evaluation of GDASET0 at other hydro-climate regions are recommended for extensive usage of suchproducts worldwide.
Acknowledgements This work was financed by the United State Geological Survey and OklahomaWater Resources Research Institute. Partial funding for the first author is also provided by StateScholar Council, Ministry of Education of China. The authors also would like to extend theirappreciation to Oklahoma MESONET for providing meteorological data required for the study.
References
Allen RG (2007) Satellite-based energy balance for mapping evapotranspiration with internal-ized calibration (METRIC). Appl J Irrig Drain Eng 133(4):395–406. doi:10.1061/(ASCE)0733-9437133:4(395)
Allen RG, Smith M, Perrier A, Pereira LS (1994a) An update for the definition of referenceevapotranspiration. ICID Bull 43(2):1–34
Allen RG, Smith M, Perrier A, Pereira LS (1994b) An update for the calculation of referenceevapotranspiration. ICID Bull 43(2):35–92
Allen RG, Pereira L, Raes D, Smith M (1998) Crop evapotranspiration-guidelines for computingcrop water requirements. Food and Agriculture Organization of the United Nations, Rome,p 290. FAO publication 56 ISBN 92-5-104219-5
Brock FV, Crawford KC, Elliott RL, Cuperus GW, Stadler SJ, Johnson HL, Eilts MD (1995) TheOklahoma Mesonet: a technical overview. J Atmos Ocean Technol 12:5–19
Brotzge JA, Richardson SJ (2003) Spatial and temporal correlation among Oklahoma Mesonet andOASIS surface-layer measurements. J Appl Meteorol 42(5–19). Am Meteorol Soc
Chauhan S, Shrivastava RK (2009) Performance evaluation of reference evapotranspiration estima-tion using climate based methods and artificial neural networks. Water Resour Manag 23:825–837
ESRI (Environmental Systems Research Institute) (2004) ArcGIS 9.0. Users manual. EnvironmentalSystems Research Institute, Redlands, California
GDAS: http://earlywarning.usgs.gov/Global/ET0readme.php. Assessed 20–30 October 2008Jensen ME, Burman RD, Allen RG (1990) Evapotranspiration and irrigation water requirements.
American Society of Civil Engineers, New York, p 332Krishnan A, Kushwaha RS (1971) A critical study of evaporation by Penman’s method during the
growing season of vegetation in the arid zone of India. Arch Meteorol Geophys Bioklimatol B19:267–276
Nokes SE (1995) Evapotranspiration (chap 4). In: Ward AD, Elliot WJ (eds) Environmental hydrol-ogy. Lewis Publishers, Boca Raton, pp 91–131
Oklahoma Mesonet: http://www.mesonet.org. Accessed 3–10 November 2008Penman HL (1956) Evaporation: an introductory survey. Neth J Agric Sci 1:9–29, 87–97, 151–153

Evaluation of Global Daily Reference ET 1613
Sabziparvar AA, Tabari H, Aeini A, Ghafouri M (2010) Evaluation of class a pan coefficient modelsfor estimation of reference crop evapotranspiration in cold semi-arid and warm arid climates.Water Resour Manag 24:909–920
Senay GB, Budde M, Verdin JP, Melesse AM (2007) A coupled remote sensing and simplifiedsurface energy balance approach to estimate actual evapotranspiration from irrigated fields.Sensors 7(6):979–1000
Senay GB, Verdin JP, Lietzow R, Melesse AM (2008) Global daily reference evapotranspirationmodeling and evaluation. J Am Water Res Assoc 44(4):969–979. ISSN 1093-474X CODENJWRAF5 2008
Shuttleworth WJ (1992) Evaporation. In: Maidment DR (ed) Handbook of hydrology. McGraw-Hill,New York
Sutherland A, Carlson JD, Kizer M (2005) Evapotranspiration product description OklahomaMesonet, Oklahoma State University, University of Oklahoma