EVALUATION OF ESC AND SUV ROLL STABILITY CONTROL
26
VSRG RESEARCH PROGRAM: EVALUATION OF ESC AND SUV ROLL STABILITY CONTROL MICHAEL KEALL STUART NEWSTEAD JULY, 2021 (RELEASED AUGUST, 2021) REPORT NO. 357
-
Upload
khangminh22 -
Category
Documents
-
view
0 -
download
0
Transcript of EVALUATION OF ESC AND SUV ROLL STABILITY CONTROL

VSRG RESEARCH PROGRAM: EVALUATION OF
ESC AND SUV ROLL STABILITY CONTROL
MICHAEL KEALL
STUART NEWSTEAD
JULY, 2021
(RELEASED AUGUST, 2021)
REPORT NO. 357

EVALUATION OF ESC AND SUV ROLL STABILITY CONTROL | ii

MONASH UNIVERSITY ACCIDENT RESEARCH CENTRE | iii
Project Sponsored By

EVALUATION OF ESC AND SUV ROLL STABILITY CONTROL | iv
MONASH UNIVERSITY ACCIDENT RESEARCH CENTRE REPORT DOCUMENTATION PAGE
Report No. Report Date Release Date ISBN ISSN Pages
357 July 2021 August 2021 978-1-925413-27-4 1835-4815 (On-Line) 24
Title: VSRG RESEARCH PROGRAM: EVALUATION OF ESC AND SUV ROLL STABILITY CONTROL
Sub-title: POST-ESC VEHICLE ROLLOVER RISK FOR AUSTRALASIAN SUVs, COMMERCIAL VANS AND UTILITY VEHICLES RELATIVE
TO OTHER VEHICLE TYPES AND EVALUATION OF THE EFFECTIVENESS OF VEHICLE ROLL STABILITY
Author(s) Type of Report & Period Covered
Keall, M., & Newstead, S. Final Report; 2008 to 2017
Sponsoring Organisations - This project was funded as contract research by the following organisations:
Transport for New South Wales, New South Wales State Insurance Regulatory Authority, Royal Automobile Club of Victoria, NRMA Motoring and
Services, Victorian Department of Transport (VicRoads), Royal Automobile Club of Western Australia, Transport Accident Commission, New Zealand
Transport Agency, Queensland Department of Transport and Main Roads, Royal Automobile Club of Queensland, Royal Automobile Association of
South Australia, South Australian Department of Infrastructure and Transport , Accident Compensation Corporation New Zealand, the Australian
Government Department of Infrastructure, Transport, Regional Development and Communications, and the Road Safety Commission of Western
Australia.
Abstract:
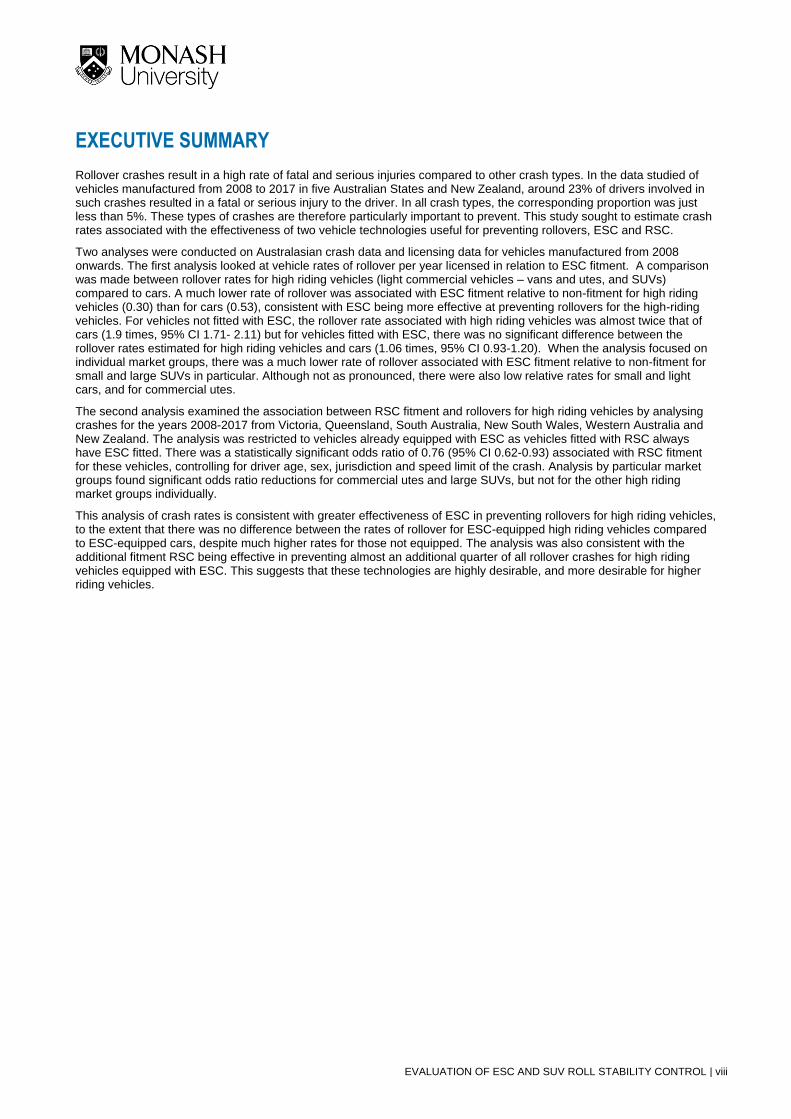
Rollover crashes result in a high rate of fatal and serious injuries compared to other crash types. In the data studied of vehicles
manufactured from 2008 to 2017 in five Australian States and New Zealand, around 23% of drivers involved in such crashes resulted
in a fatal or serious injury to the driver. In all crash types, the corresponding proportion was just less than 5%. These types of crashes
are therefore particularly important to prevent. This study sought to estimate crash rates associated with the effectiveness of two
vehicle technologies useful for preventing rollovers, ESC and RSC.
Two analyses were conducted on Australasian crash data and licensing data for vehicles manufactured from 2008 onwards. The
first analysis looked at vehicle rates of rollover per year licensed in relation to ESC fitment. A comparison was made between rollover
rates for high riding vehicles (light commercial vehicles – vans and utes, and SUVs) compared to cars. A much lower rate of rollover
was associated with ESC fitment relative to non-fitment for high riding vehicles (0.30) than for cars (0.53), consistent with ESC being
more effective at preventing rollovers for the high-riding vehicles. For vehicles not fitted with ESC, the rollover rate associated with
high riding vehicles was almost twice that of cars (1.9 times, 95% CI 1.71- 2.11) but for vehicles fitted with ESC, there was no significant
difference between the rollover rates estimated for high riding vehicles and cars (1.06 times, 95% CI 0.93-1.20). When the analysis
focused on individual market groups, there was a much lower rate of rollover associated with ESC fitment relative to non-fitment for
small and large SUVs in particular. Although not as pronounced, there were also low relative rates for small and light cars, and for
commercial utes.
The second analysis examined the association between RSC fitment and rollovers for high riding vehicles by analysing crashes
for the years 2008-2017 from Victoria, Queensland, South Australia, New South Wales, Western Australia and New Zealand. The
analysis was restricted to vehicles already equipped with ESC as vehicles fitted with RSC always have ESC fitted. There was a
statistically significant odds ratio of 0.76 (95% CI 0.62-0.93) associated with RSC fitment for these vehicles, controlling for driver age,
sex, jurisdiction and speed limit of the crash. Analysis by particular market groups found significant odds ratio reductions for commercial
utes and large SUVs, but not for the other high riding market groups individually.
This analysis of crash rates is consistent with greater effectiveness of ESC in preventing rollovers for high riding vehicles, to the
extent that there was no difference between the rates of rollover for ESC-equipped high riding vehicles compared to ESC-equipped
cars, despite much higher rates for those not equipped. The analysis was also consistent with the additional fitment RSC being effective
in preventing almost an additional quarter of all rollover crashes for high riding vehicles equipped with ESC. This suggests that these
technologies are highly desirable, and more desirable for higher riding vehicles.
Key words:
Road safety, ESC, electronic stability control, RSC, rollover stability control
Disclaimer:
This report is disseminated in the interest of information exchange. The views expressed here are those of the authors, and not necessarily those of Monash University.
Reproduction of this page is authorised Monash University Accident Research Centre Building 70, Monash University Victoria 3800, Australia. Telephone: +61 3 9905 4371, Fax: +61 3 9905 4363

MONASH UNIVERSITY ACCIDENT RESEARCH CENTRE | v
PREFACE
Project Manager / Team Leader:
Associate Professor Stuart Newstead
MUARC Research Team:
Associate Professor Stuart Newstead
Michael Keall
Contributorship Statement
Associate Professor Stuart Newstead: Project oversight and review of analysis design
Michael Keall: Statistical design, analysis design, analysis and report
Ethics Statement
Ethics approval was not required for this project.
Acknowledgements
The sourcing, assembly and coding of police-reported crash datasets and RedBook vehicle safety equipment data were performed by Linda Watson and Casey Rampollard.

EVALUATION OF ESC AND SUV ROLL STABILITY CONTROL | vi
CONTENTS
EXECUTIVE SUMMARY................................................................................................................................................... viii
1. BACKGROUND AND PROJECT AIMS ...................................................................................................................... 9
1.1 Objectives and scope ..................................................................................................................9
2. METHODS AND DATA ............................................................................................................................................ 10
2.1 Licensed vehicle fleet data ........................................................................................................ 10
2.2 Crash data ................................................................................................................................. 10
3. RESULTS ................................................................................................................................................................. 13
3.1 Rollover rate and ESC fitment ................................................................................................... 13
3.2 Rollover rate and RSC fitment ................................................................................................... 18
4. DISCUSSION ........................................................................................................................................................... 21
5. CONCLUSIONS ....................................................................................................................................................... 22
6. LIMITATIONS ........................................................................................................................................................... 23
7. REFERENCES ......................................................................................................................................................... 24

MONASH UNIVERSITY ACCIDENT RESEARCH CENTRE | vii
FIGURES
Figure 1: Number of licensed vehicle years for years 2007-2016 for vehicles manufactured 2008 onwards in NZ, NSW, Victoria and Western Australia, by ESC fitment status (yes or no) and year of manufacture ............ 15
Figure 2: Rollover crash involvement rate per licensed vehicle year in NZ, NSW, Victoria and Western Australia according to ESC fitment status (no or yes) and vehicle year of manufacture: data from matched registration (2007-2016) and crash data (2008-2017) ................................................................................. 16
Figure 3: Rollover crash involvement rate per licensed vehicle year in NZ, NSW, Victoria and Western Australia according to ESC fitment status (no or yes) and vehicle market group: data from matched registration (2007-2016) and crash data (2008-2017) .................................................................................................... 16
Figure 4: Adjusted relative rates of rollover per licensed vehicle year (NZ, NSW, Victoria and Western Australia data) associated with ESC fitment for each market group, controlling for town class, jurisdiction, year of manufacture ................................................................................................................................................ 18
Figure 5: Estimated odds ratios associated with the factors specified (at levels of other factors with which they interact) associated with rollovers as a proportion of all crashes ................................................................. 20
TABLES
Table 1: Crash data (2008-2017) for vehicles manufactured 2008 onwards from Victoria, Queensland, South Australia, New South Wales, Western Australia and New Zealand ............................................................. 13
Table 2: Matched registration (2007-2016) and crash data (2008-2017) for vehicles manufactured 2008 onwards in NZ, NSW, Victoria and Western Australia, with rates of crashes and of rollovers per registered vehicle year and per reported crash ................................................................................................................................ 14
Table 3: Matched registration (2007-2016) and crash data (2008-2017) for vehicles manufactured 2008 onwards and equipped with ESC in NZ, NSW, Victoria and Western Australia, with rates of crashes and of rollovers per registered vehicle year and per reported crash ..................................................................................... 17
Table 4: Adjusted relative rates of rollover per licensed vehicle year (NZ, NSW, Victoria and Western Australia data) associated with high riding vehicles, cars, ESC fitment and non-fitment controlling for town class, jurisdiction, year of manufacture .................................................................................................................. 17
Table 5: Numbers of crashes and rate of rollovers per crash type in the years 2008-2017 for Victoria, Queensland, South Australia, New South Wales, Western Australia and New Zealand, involving high riding vehicles fitted with ESC according to RSC fitment by market group and crash type ................................................. 19
Table 6: Estimated odds ratios associated with the factors specified (at levels of other factors with which they interact) associated with rollovers as a proportion of all crashes. Last row is average effect across all high riding vehicles combined ............................................................................................................................. 20
EVALUATION OF ESC AND SUV ROLL STABILITY CONTROL | viii
EXECUTIVE SUMMARY
Rollover crashes result in a high rate of fatal and serious injuries compared to other crash types. In the data studied of vehicles manufactured from 2008 to 2017 in five Australian States and New Zealand, around 23% of drivers involved in such crashes resulted in a fatal or serious injury to the driver. In all crash types, the corresponding proportion was just less than 5%. These types of crashes are therefore particularly important to prevent. This study sought to estimate crash rates associated with the effectiveness of two vehicle technologies useful for preventing rollovers, ESC and RSC.
Two analyses were conducted on Australasian crash data and licensing data for vehicles manufactured from 2008 onwards. The first analysis looked at vehicle rates of rollover per year licensed in relation to ESC fitment. A comparison was made between rollover rates for high riding vehicles (light commercial vehicles – vans and utes, and SUVs) compared to cars. A much lower rate of rollover was associated with ESC fitment relative to non-fitment for high riding vehicles (0.30) than for cars (0.53), consistent with ESC being more effective at preventing rollovers for the high-riding vehicles. For vehicles not fitted with ESC, the rollover rate associated with high riding vehicles was almost twice that of cars (1.9 times, 95% CI 1.71- 2.11) but for vehicles fitted with ESC, there was no significant difference between the rollover rates estimated for high riding vehicles and cars (1.06 times, 95% CI 0.93-1.20). When the analysis focused on individual market groups, there was a much lower rate of rollover associated with ESC fitment relative to non-fitment for small and large SUVs in particular. Although not as pronounced, there were also low relative rates for small and light cars, and for commercial utes.
The second analysis examined the association between RSC fitment and rollovers for high riding vehicles by analysing crashes for the years 2008-2017 from Victoria, Queensland, South Australia, New South Wales, Western Australia and New Zealand. The analysis was restricted to vehicles already equipped with ESC as vehicles fitted with RSC always have ESC fitted. There was a statistically significant odds ratio of 0.76 (95% CI 0.62-0.93) associated with RSC fitment for these vehicles, controlling for driver age, sex, jurisdiction and speed limit of the crash. Analysis by particular market groups found significant odds ratio reductions for commercial utes and large SUVs, but not for the other high riding market groups individually.
This analysis of crash rates is consistent with greater effectiveness of ESC in preventing rollovers for high riding vehicles, to the extent that there was no difference between the rates of rollover for ESC-equipped high riding vehicles compared to ESC-equipped cars, despite much higher rates for those not equipped. The analysis was also consistent with the additional fitment RSC being effective in preventing almost an additional quarter of all rollover crashes for high riding vehicles equipped with ESC. This suggests that these technologies are highly desirable, and more desirable for higher riding vehicles.

MONASH UNIVERSITY ACCIDENT RESEARCH CENTRE | 9
1. BACKGROUND AND PROJECT AIMS
Work completed under the Vehicle Safety Research Group (VSRG) research program some years ago estimated the relative risk of rollover in a crash of high riding vehicles, primarily 4WD Utilities and SUVs, compared to regular passenger vehicles. It identified significantly higher rollover risk for high riding vehicles, and particularly for those driven by young drivers or older females (Keall and Newstead, 2007). An evaluation of the effectiveness of Electronic Stability Control (ESC) also completed under the VSRG research program showed the benefits of this technology in reducing rollover crashes, and particularly those involving high riding vehicles and resulting in serious injury (Keall and Newstead, 2009a). Other studies, including meta-analyses that synthesised multiple studies’ findings, have found very large reductions in rates of rollover crashes associated with ESC fitment of between 50% and 60% (Høye, 2011). Although these studies have shown that ESC is highly effective, none so far has estimated whether ESC fitment results in rollover risk for high riding vehicles that is similar to regular passenger vehicles. In-depth study evidence suggests that high riding vehicles are still more susceptible to rollover in crashes due to tripping over road infrastructure or through impact by other vehicles. No wider assessment of the crash population has been undertaken to verify this.
A further new technology to mitigate rollover in crashes that is being fitted to high riding vehicles is Roll Stability Control (RSC). RSC is an extension of ESC technology that detects imminent rollover of the vehicle and applies braking and engine deceleration as an attempt to prevent the rollover event. To date the effectiveness of RSC in mitigating rollover in crashes in Australasia has not been evaluated.
1.1 Objectives and scope
The analysis has two main objectives related to high riding vehicles (SUVs, vans and utes) and their rollover risk:
1. To see whether rollover rates are still higher for high riding vehicles with ESC compared to cars equipped with ESC;
2. To see whether RSC has an additional benefit in preventing rollovers for high riding vehicles already equipped with ESC. Note that RSC has a very low fitment rate for cars, so its effectiveness for cars cannot be tested at present.

EVALUATION OF ESC AND SUV ROLL STABILITY CONTROL | 10
2. METHODS AND DATA
2.1 Licensed vehicle fleet data
New South Wales (registration data 2007-2016); New Zealand (registration data 2010-2016); Western Australia (registration data 2013-2016); and Victoria (registration data 2007-2016).
A vehicle was considered part of the licensed fleet for a given year if it was licensed as at the time of the snapshot (e.g. 31 December of that year). A match was made to crash data using the registration plate details of the vehicle. Personalised plates can be traded, so they are not unique to a vehicle. Although such plates are relatively rare, they do provide a potential source of mismatching. Therefore, the match was made of a given crashed vehicle with the corresponding plate number licensed in the year prior to the crash, which would have avoided the majority of mismatches arising from the transferring of plates.
Previous analysis has identified different crash rates between areas with different levels of urbanisation (Keall and Newstead, 2016). To account for this potentially confounding factor in the comparison of crash rates, the address information for the registered owner of licensed vehicles from each jurisdiction was classified into four areas: metropolitan (the main city for the jurisdiction, e.g., Sydney for NSW); larger urban; smaller urban; rural. For Australia, this was done according to the Australian Bureau of Statistics classification of postcodes (ABS, 2012), with both urban classifications being for “Major Cities of Australia”, smaller urban being postcodes classified as “Inner Regional Australia” and remaining postcodes classed as rural; for New Zealand, the population size of the city or other population centre was used to form equivalent groupings.
As annual crash risk was being estimated for objective 1, each vehicle is potentially represented in the dataset analysed multiple times if it is licensed for more than one year. Unlicensed vehicles are therefore out of the scope of the analysis, as are vehicles that were licensed for the first time during a given year and then unlicensed later that year, even if they crashed in the intervening period. Although a small proportion of vehicles on the road are unlicensed, it is likely that they may be driven in a manner that is not representative of the licensed fleet, so their exclusion makes sense from an estimation perspective.
2.2 Crash data
Crash data from five Australian states, Victoria, Queensland, South Australia, New South Wales and Western Australia, along with data from New Zealand were used from the years 2008 to 2017. There are a number of key variables for modelling vehicle rollover risk based on each of the six jurisdictions’ crash data sets: year of crash; speed limit at crash location (<=75km/h, >75km/h); year of vehicle manufacture; vehicle market group; driver age (<26 years old; 26-59 years old; age 60 plus); driver gender.
The definition of rollovers as a crash type varies between jurisdictions. When analysing crash data, a rollover can be defined to occur when a vehicle impacts the ground or road surface with its side or top. For the Victorian and Queensland crash data, a variable is available that coded the first impact type or major impact point on the vehicle: for Victoria, whether the top or roof of the vehicle was the point of initial impact and for Queensland, whether the top or roof of the vehicle was the point of major impact. For NSW, the first impact code is defined as “rollover”. For South Australia, crash type is coded as “rollover”. For Western Australia, a variable that signalled a non-collision accident type was used to identify a rollover. For New Zealand, a rollover is defined if there was damage to the top (roof) of the vehicle or the degree of damage was stated as due to the vehicle overturning. Sometimes rollovers are identified as having occurred in conjunction with a collision with another vehicle or fixed object.
2.2.1 Classification of vehicles
Vehicles were classified according to technology fitment according to: VRSG codes matched to Redbook information in the case of Australian data; vehicle-specific Rightcar data in the case of NZ data. A vehicle was only be classified as having the technology if all variants were thus equipped according to Redbook.

MONASH UNIVERSITY ACCIDENT RESEARCH CENTRE | 11
2.2.2 Modelling risk of rollover
Separate models were fitted for the two main objectives (i) to estimate rollover rate in relation to ESC fitment for high riding vehicles relative to other vehicles and (ii) to estimate rollover risk for high riding vehicles fitted with ESC in relation to the additional fitment of RSC.
2.2.3 Rollover rate and ESC fitment models
To estimate the rates of rollover for high riding vehicles and cars associated with ESC fitment, while controlling for year on manufacture, town class, jurisdiction, a Poisson model was fitted to counts of rollovers with an offset set to the log of the number of licensed vehicle years for the vehicles specified:
Rollover= town class + jurisdiction + vehicle type + year of manufacture +
town class* jurisdiction + esc + esc*vehicle type (1)
The “*” signifies an interaction between two factors. The data used to fit the models (matched crash and licensing data) are summarised in Table 2.
A similar model was fitted to look at the associations between ESC and rollover rates comparing different market groups, but with market group replacing vehicle type.
Rollover rate and RSC fitment models
Induced exposure relative risk estimates were formed as follows. Let the crashes of interest be rollover
crashes under conditions/driver group/vehicle type j, a count of which can be represented as jr , with jc the
count of the comparison crashes for the same conditions/driver group/vehicle type j. Then, crude relative risk for conditions/driver group/vehicle type j relative to conditions/driver group/vehicle type 0 is estimated by:
0
0
cr
c
r
j
j
(2)
Logistic regression is used to model the odds of the occurrence of an event, the event defined to be a rollover crash. A data set that consists of vehicles involved in rollover crashes and vehicles involved in the comparison crashes will yield estimates of relative risk using this approach (Keall and Newstead, 2009b).
The SAS procedure LOGISTIC (SAS Institute, 1998) was used to model the risk of rollover. The variables listed above will be modelled as explanatory variables, as well as statistically significant first-order interactions of these variables
Rollover= jurisdiction + market group + speed limit area + driver sex +
Vehicle year of manufacture + driver age + RSC + driver sex*age +
jurisdiction * speed limit area + market group * RSC (3)
Only high riding vehicles were included, as cars have very low fitment rates of RSC currently. In relation to equation (2), comparison vehicle type c is all ESC-equipped high riding vehicles without RSC fitted. The

EVALUATION OF ESC AND SUV ROLL STABILITY CONTROL | 12
vehicle type of interest, r, will be those equipped with both ESC and RSC. Two sets of comparison crashes were used to represent exposure of the vehicle: collisions where the vehicle was impacted by another vehicle to the side or rear of the vehicle; all crashes.
As there will be differences in the rates of rollover crashes between jurisdictions arising from coding and definitional differences between the jurisdictions, the analysis also controlled for such differences by including appropriate terms in the models fitted.

MONASH UNIVERSITY ACCIDENT RESEARCH CENTRE | 13
3. RESULTS
Table 1 summarises all the crash data from the six jurisdictions studied to show the prevalence of rollovers and the severity of injuries suffered by drivers involved in rollovers. Rollover rates were generally higher for the high riding vehicles in the lower half of the table. Rollovers account for a much higher proportion of fatal and serious injuries to drivers than to the crash population generally, indicative of the harmful nature of rollover crashes. The last column shows the proportion of rollover-involved drivers who were fatally and seriously injured. This proportion was generally higher for the high riding vehicles (an average 25% across these vehicles) compared to cars (19%). This figure was particularly high for commercial utes. The high figure for people movers has a large degree of uncertainty around it as there were only eight rollover crashes in the data studied.
TABLE 1: CRASH DATA (2008-2017) FOR VEHICLES MANUFACTURED 2008 ONWARDS FROM VICTORIA, QUEENSLAND, SOUTH AUSTRALIA, NEW SOUTH WALES, WESTERN AUSTRALIA AND NEW ZEALAND
Market group Crash-involved drivers
Rollovers
% crash-involved drivers in rollovers
F&S injured drivers
F&S injured drivers rollovers
% F&S injured drivers in rollovers
Proportion of rollovers
where driver F&S
Large car 41,283 265 0.6% 1,423 28 2.0% 11%
Medium car 43,845 199 0.5% 1,722 29 1.7% 15%
People Mover 4,251 26 0.6% 165 8 4.8% 31%
Small car 99,458 574 0.6% 5,183 107 2.1% 19%
Light car 59,345 603 1.0% 4,042 141 3.5% 23%
TOTAL CARS 248,182 1,667 0.7% 12,535 313 2.5% 19%
Commercial - Ute 58,290 1,766 3.0% 3,189 469 14.7% 27%
Commercial - Van 12,249 195 1.6% 505 38 7.5% 19%
SUV - Small 13,620 127 0.9% 771 27 3.5% 21%
SUV - Large 22,875 661 2.9% 946 154 16.3% 23%
SUV - Medium 49,922 313 0.6% 1,994 73 3.7% 23%
TOTAL HIGH RIDING 156,956 3,062 2.0% 7,405 761 10.3% 25%
TOTAL ALL 405,138 4,729 1.2% 19,940 1,074 5.4% 23%
3.1 Rollover rate and ESC fitment
Table 2 shows the data for the first analysis of rollover rates per licensed vehicle per year licensed. A 2008 vehicle licensed as part of one of the fleets studied for the entire 10-year period contributes 10 licensed years. As explained above, the town class refers to the level of urbanisation of the area where the vehicle was licensed. The rollover rate increases with decreasing levels of urbanisation, which reflects the sorts of roads the vehicle is driven on. Crash rates per year by year of manufacture of the vehicle generally increase for later model vehicles, which reflects generally higher kilometres driven by newer vehicles (Keall and Frith, 2006). The different rollover rates per jurisdiction are mainly due to differences in the way that a crash could be defined as a rollover from crash data, as stated above. The vehicles are grouped in Table 2 by market group and then according to whether they were SUVs and commercial vehicles (“High riding” vehicles) or cars.

EVALUATION OF ESC AND SUV ROLL STABILITY CONTROL | 14
TABLE 2: MATCHED REGISTRATION (2007-2016) AND CRASH DATA (2008-2017) FOR VEHICLES MANUFACTURED 2008 ONWARDS IN NZ, NSW, VICTORIA AND WESTERN AUSTRALIA, WITH RATES OF CRASHES AND OF ROLLOVERS PER REGISTERED VEHICLE YEAR AND PER REPORTED CRASH
Classification Category Registration years
Crashes Rollovers
Crash rate per vehicle per year
Rollover rate per vehicle per year
Rollovers per crash
Town class Metropolitan 13,606,212 125,336 917 0.92% 0.0067% 0.7% Larger urban 4,307,629 52,235 465 1.21% 0.0108% 0.9%
Smaller urban 5,472,408 32,043 554 0.59% 0.0101% 1.7%
Rural 4,255,643 25,570 805 0.60% 0.0189% 3.1%
Year of manufacture
2008 5,717,335 48,947 753 0.86% 0.0132% 1.5%
2009 4,417,178 36,434 469 0.82% 0.0106% 1.3%
2010 4,423,707 36,884 439 0.83% 0.0099% 1.2%
2011 3,507,828 28,679 356 0.82% 0.0101% 1.2%
2012 3,320,493 27,631 246 0.83% 0.0074% 0.9%
2013 2,825,873 24,182 198 0.86% 0.0070% 0.8%
2014 1,830,887 16,644 152 0.91% 0.0083% 0.9%
2015 1,157,852 11,081 88 0.96% 0.0076% 0.8%
2016 440,739 4,702 40 1.07% 0.0091% 0.9%
Jurisdiction NSW 10,765,217 106,918 1,703 0.99% 0.0158% 1.6%
NZ 2,848,790 7,397 196 0.26% 0.0069% 2.6%
VIC 10,894,846 46,599 416 0.43% 0.0038% 0.9%
WA 3,133,039 74,270 426 2.37% 0.0136% 0.6%
Market group Large car 2,547,108 23,458 210 0.92% 0.0082% 0.9%
Medium car 3,289,103 26,455 148 0.80% 0.0045% 0.6%
People Mover 321,342 2,659 17 0.83% 0.0053% 0.6%
Small car 6,683,055 58,367 428 0.87% 0.0064% 0.7%
Light car 3,431,740 34,377 380 1.00% 0.0111% 1.1%
TOTAL CARS 16,272,348 145,316 1,183 0.89% 0.0073% 0.8%
Commercial - Ute
3,525,113 31,871 871 0.90% 0.0247% 2.7%
Commercial - Van
675,594 6,636 106 0.98% 0.0157% 1.6%
SUV - Small 1,166,481 8,187 74 0.70% 0.0063% 0.9%
SUV - Large 2,019,197 13,331 315 0.66% 0.0156% 2.4%
SUV - Medium 3,983,159 29,843 192 0.75% 0.0048% 0.6%
TOTAL HIGH RIDING
11,369,544 89,868 1,558 0.79% 0.0137% 1.7%
ESC fitted no 10,111,103 90,581 1,732 0.90% 0.0171% 1.9%
yes 17,530,789 144,603 1,009 0.82% 0.0058% 0.7%
Overall TOTAL ALL 27,641,892 235,184 2,741 0.85% 0.0099% 1.2%

MONASH UNIVERSITY ACCIDENT RESEARCH CENTRE | 15
Although the number of crashes presented here is an underestimate of total crashes, because matches could not always be made with registration data, comparisons of crash rates between market groups show how crash involvement patterns differ. Although the high riding vehicles had a somewhat lower crash rate per vehicle overall, there was quite a range of rates, from only 0.66% for Large SUVs to the highest rate of the high riding market groups of 0.98% for commercial utes. Rollover rates per registered vehicle year or as a proportion of all crashes appear higher overall for the high riding vehicles, but these were mainly due to high rates for commercial utes and vans, and large (but not small or medium) SUVs. For cars, the 95% confidence interval for the rollover rate of 0.0073% was 0.0069% to 0.0077%; for high riding vehicles, the 95% confidence interval for the rollover rate of 0.0137% was 0.013% to 0.0144%. A chi-square test showed a highly significant difference between these rates (P<.0001).
Figure 1: Number of licensed vehicle years for years 2007-2016 for vehicles manufactured 2008 onwards in NZ, NSW, Victoria and Western Australia, by ESC fitment status (yes or no) and year of manufacture
Figure 1 displays the numbers of licensed vehicle years for the licensed vehicle fleets studied by year of manufacture and whether ESC was fitted to the vehicle or not. This indicates that the proportion of vehicles with ESC has increased steeply with increasing year of manufacture.
Figure 2 shows comparisons of rollover crash involvement rates by year of manufacture and according to ESC fitment status (no or yes). Rates are presented per licensed vehicle year in NZ, NSW, Victoria and Western Australia using matched registration (2007-2016) and crash data (2008-2017). This shows considerably higher rollover rates for vehicles not equipped with ESC.
-
500,000
1,000,000
1,500,000
2,000,000
2,500,000
3,000,000
3,500,000
4,000,000
4,500,000
2008 2009 2010 2011 2012 2013 2014 2015 2016
no yes

EVALUATION OF ESC AND SUV ROLL STABILITY CONTROL | 16
Figure 2: Rollover crash involvement rate per licensed vehicle year in NZ, NSW, Victoria and Western Australia according to ESC fitment status (no or yes) and vehicle year of manufacture: data from matched registration (2007-2016) and crash data (2008-2017)
Figure 3 uses the same data as Figure 2 but this time by market groups and then by ESC fitment status within market groups. This shows contrasting rates of rollover by ESC fitment, particularly for utes, along with small and large SUVs. For these three market groups particularly, there were very high rollover rates for vehicles not equipped with ESC and considerably lower rates (most notably for the two SUV market groups) for those equipped with ESC.
Figure 3: Rollover crash involvement rate per licensed vehicle year in NZ, NSW, Victoria and Western Australia according to ESC fitment status (no or yes) and vehicle market group: data from matched registration (2007-2016) and crash data (2008-2017)
Table 3 provides a comparison of crash rates by matched registration and crash data for vehicles manufactured 2008 onwards for those equipped with ESC in NZ, NSW, Victoria and Western Australia. As there were relatively few rollovers in the data analysed, confidence intervals for the rollover rates (not shown in Table 3) were correspondingly wide.
0.000%
0.005%
0.010%
0.015%
0.020%
0.025%
2008 2009 2010 2011 2012 2013 2014 2015 2016
no yes
0.000%
0.005%
0.010%
0.015%
0.020%
0.025%
0.030%
0.035%
no yes

MONASH UNIVERSITY ACCIDENT RESEARCH CENTRE | 17
TABLE 3: MATCHED REGISTRATION (2007-2016) AND CRASH DATA (2008-2017) FOR VEHICLES MANUFACTURED 2008 ONWARDS AND EQUIPPED WITH ESC IN NZ, NSW, VICTORIA AND WESTERN AUSTRALIA, WITH RATES OF CRASHES AND OF ROLLOVERS PER REGISTERED VEHICLE YEAR AND PER REPORTED CRASH
Market group Registration
years Crashes Rollovers
Crash rate per vehicle
per year
Rollover rate per
vehicle per year
Rollovers per crash
Large car 1,554,179 13,289 129 0.86% 0.0083% 1.0%
Medium car 3,178,411 25,690 140 0.81% 0.0044% 0.5%
People Mover 141,127 1,141 9 0.81% 0.0064% 0.8%
Small car 4,603,388 40,922 224 0.89% 0.0049% 0.5%
Light car 1,465,421 14,737 101 1.01% 0.0069% 0.7%
TOTAL CARS 10,942,526 95,779 603 0.88% 0.0055% 0.6%
Commercial - Ute 643,375 5,979 96 0.93% 0.0149% 1.6%
Commercial - Van 159,342 1,344 18 0.84% 0.0113% 1.3%
SUV - Small 1,010,021 6,803 40 0.67% 0.0040% 0.6%
SUV - Large 1,278,992 8,345 85 0.65% 0.0066% 1.0%
SUV - Medium 3,496,541 26,355 167 0.75% 0.0048% 0.6%
TOTAL HIGH RIDING 6,588,271 48,826 406 0.74% 0.0062% 0.8%
TOTAL ALL 17,530,797 144,605 1,009 0.82% 0.0058% 0.7%
As rollover rates vary considerably between jurisdictions and town classes in particular, a model was fitted as described in equation (1) to estimate adjusted relative rollover rates per licensed vehicle year, controlling for town class, jurisdiction and year of manufacture. The main results are shown in Table 4, which show a much lower rate of rollover associated with ESC fitment relative to non-fitment for high riding vehicles (0.3) than for cars (0.53). For vehicles not fitted with ESC, the rollover rate associated with high riding vehicles was almost twice that of cars (1.9 times) but for vehicles fitted with ESC, there was no significant difference between the rollover rates estimated for high riding vehicles and cars.
TABLE 4: ADJUSTED RELATIVE RATES OF ROLLOVER PER LICENSED VEHICLE YEAR (NZ, NSW, VICTORIA AND WESTERN AUSTRALIA DATA) ASSOCIATED WITH HIGH RIDING VEHICLES, CARS, ESC FITMENT AND NON-FITMENT CONTROLLING FOR TOWN CLASS, JURISDICTION, YEAR OF MANUFACTURE
Vehicle classification Comparison Relative rate (95% ci)
High riding ESC vs no ESC 0.30 (0.26, 0.34)
Car ESC vs no ESC 0.53 (0.47, 0.60)
ESC not fitted High riding vs car 1.90 (1.71, 2.11)
ESC fitted High riding vs car 1.06 (0.93, 1.20)
To look at market group-specific associations between ESC fitment and rollover rates, a model was fitted as described in equation (1), but with market group replacing vehicle type. The main results are shown in Figure 4, which show a much lower rate of rollover associated with ESC fitment relative to non-fitment for small and large SUVs in particular, but also for small and light cars, and for commercial utes. No statistically significant reduction in rollover rate associated with ESC fitment was found for large or medium cars, people movers, commercial vans or medium SUVs.

EVALUATION OF ESC AND SUV ROLL STABILITY CONTROL | 18
Figure 4: Adjusted relative rates of rollover per licensed vehicle year (NZ, NSW, Victoria and Western Australia data) associated with ESC fitment for each market group, controlling for town class, jurisdiction, year of manufacture
3.2 Rollover rate and RSC fitment
To examine the effectiveness of RSC, the analysis focused on high riding vehicles that already had ESC fitted. Rather than look at rollover rates per vehicle, this analysis considered rollover risk where risk was defined using induced exposure methods – a set of non-rollover crashes were used to provide an estimate of exposure (Keall and Newstead, 2009b).
There are driver and environmental factors that contribute to rollover risk, most importantly vehicle speed and driver age and sex. The advantage of the induced exposure approach used to estimate associations between rollover rates and RSC fitment was that such factors could be controlled for to some extent. In our data, we could control for vehicle speed only by the speed limit area where the crash occurred.
Table 5 shows the number of crashes and rate of rollovers per crash type involving high riding vehicles fitted with ESC according to RSC fitment by market group. Crash types shown are rollovers (the crash type of interest) and two comparison crash types: “multi side rear” crashes, where the vehicle in question is impacted by another vehicle in the rear or the side, and all crashes.
Note that considerably more crashes are available than in the previous analysis of crash data matched to registration data shown in Table 3. There are two reasons for this: (i) the number of jurisdictions’ data analysed was expanded; (ii) crashes were counted irrespective of whether a match could be made to licensed vehicle records.
0
0.5
1
1.5
2
2.5
3
3.5
4
4.5
Rel
ativ
e ra
te
Market group

MONASH UNIVERSITY ACCIDENT RESEARCH CENTRE | 19
TABLE 5: NUMBERS OF CRASHES AND RATE OF ROLLOVERS PER CRASH TYPE IN THE YEARS 2008-2017 FOR VICTORIA, QUEENSLAND, SOUTH AUSTRALIA, NEW SOUTH WALES, WESTERN AUSTRALIA AND NEW ZEALAND, INVOLVING HIGH RIDING VEHICLES FITTED WITH ESC ACCORDING TO RSC FITMENT BY MARKET GROUP AND CRASH TYPE
Market group
Non-RSC RSC Rollovers/
multi Rollovers/ all
Rollover Multi side
rear All
crashes Rollover
Multi side rear
All crashes
Non-RSC
RSC Non-RSC
RSC
Commercial - Ute
1,715 15,935 54,282 51 1,207 4,008 10.8% 4.2% 3.2% 1.3%
Commercial - Van
194 3,818 12,049 1 63 200 5.1% 1.6% 1.6% 0.5%
SUV - Small 119 3,950 11,655 8 647 1,965 3.0% 1.2% 1.0% 0.4%
SUV - Large 648 5,683 18,136 13 1,706 4,739 11.4% 0.8% 3.6% 0.3%
SUV - Medium 234 14,616 37,855 79 4,697 12,067 1.6% 1.7% 0.6% 0.7%
TOTAL 2,910 44,002 133,977 152 8,320 22,979 6.6% 1.8% 2.2% 0.7%
The crash rates shown in the right-hand side of Table 5 imply an association between RSC fitment and lower rates of rollover. This association was quantified by fitting a statistical model that had the additional benefit of controlling for potentially confounding variables and of providing confidence intervals indicating the level of uncertainty around the estimated associations.
The logistic model described in equation (3) produced estimated odds ratios as shown in Figure 5 and Table 6. Statistically significant odds ratios are those whose confidence intervals do no overlap with 1 (representing no difference between the levels of the factors compared).These include elevated odds ratios for: female drivers compared to male drivers within the age group 60 plus; drivers aged 60 plus compared to drivers aged 26-59 within the group of female drivers; drivers aged up to 25 compared to drivers aged 26-59 for both male and female drivers. Statistically significant reduced odds ratios were associated with: drivers aged 60 plus compared to drivers aged up to 25 within the group of male drivers; RSC fitment compared to non-fitment for commercial utes (CU); RSC fitment compared to non-fitment for large SUVs (SUVL). Table 6 has one additional estimate, the odds ratio for high riding vehicles overall (all market groups combined) with RSC compared to those without. This shows a statistically significant lowered odds ratio (a 24% reduction).
This last estimate was generated by a model specified as in equation (3) but without the interaction term RSC*market group. The estimated odds ratio of rollover associated with RSC fitment compared to non-fitment is effectively a weighted average across all the market groups represented in Figure 5.
Although not shown in the graph or table, the strongest association with rollover odds was with the speed limit area (75km/h plus compared to lower speed limit areas). The estimated odds ratios for rollover ranged between around 12 (for Queensland and South Australia) to around 3 (for Victoria).

EVALUATION OF ESC AND SUV ROLL STABILITY CONTROL | 20
Figure 5: Estimated odds ratios associated with the factors specified (at levels of other factors with which they interact) associated with rollovers as a proportion of all crashes
TABLE 6: ESTIMATED ODDS RATIOS ASSOCIATED WITH THE FACTORS SPECIFIED (AT LEVELS OF OTHER FACTORS WITH WHICH THEY INTERACT) ASSOCIATED WITH ROLLOVERS AS A PROPORTION OF ALL CRASHES. LAST ROW IS AVERAGE EFFECT ACROSS ALL HIGH RIDING VEHICLES COMBINED
Odds Ratio Estimate 95% Confidence Limits
Driver sex FEMALE vs MALE at age 26-59 0.915 0.733 1.144
Driver sex FEMALE vs MALE at age 60 plus 2.262 1.485 3.447
Driver sex FEMALE vs MALE at age UPTO 25 0.923 0.618 1.38
Driver age 26-59 vs 60 plus at sex FEMALE 0.398 0.28 0.566
Driver age 26-59 vs UP TO 25 at sex FEMALE 0.486 0.336 0.702
Driver age 60 plus vs UP TO 25 at sex FEMALE 1.221 0.779 1.913
Driver age 26-59 vs 60 plus at sex MALE 0.984 0.72 1.344
Driver age 26-59 vs UP TO 25 at sex MALE 0.49 0.379 0.634
Driver age 60 plus vs UP TO 25 at sex MALE 0.498 0.346 0.717
RSC fitted vs not fitted for commercial utes 0.699 0.495 0.986
RSC fitted vs not fitted for commercial vans 0.736 0.097 5.614
RSC fitted vs not fitted for large SUVs 0.269 0.147 0.493
RSC fitted vs not fitted for medium SUVs 1.222 0.903 1.654
RSC fitted vs not fitted for small SUVs 0.919 0.411 2.056
RSC fitted vs not fitted (average – all high riding) 0.761 0.621 0.934

MONASH UNIVERSITY ACCIDENT RESEARCH CENTRE | 21
4. DISCUSSION
Rollover crashes result in a high rate of fatal and serious injuries compared to other crash types. In the data studied of vehicles manufactured from 2008 to 2017 in five Australian States and New Zealand, around 23% of drivers involved in such crashes resulted in a fatal or serious injury to the driver. In all crash types, the corresponding proportion was just less than 5%. These types of crashes are therefore particularly important to prevent. This study sought to estimate crash rates associated with the effectiveness of two vehicle technologies useful for preventing rollovers, ESC and RSC.
Two analyses were conducted on Australasian crash data and licensing data for vehicles manufactured from 2008 onwards. The first analysis looked at vehicle rates of rollover per year licensed in relation to ESC fitment. A comparison was made between rollover rates for high riding vehicles (light commercial vehicles – vans and utes, and SUVs) compared to cars. A much lower rate of rollover was associated with ESC fitment relative to non-fitment for high riding vehicles (0.30) than for cars (0.53), consistent with ESC being more effective at preventing rollovers for the high riding vehicles. For vehicles not fitted with ESC, the rollover rate associated with high riding vehicles was almost twice that of cars (1.9 times, 95% CI 1.71- 2.11)
but for vehicles fitted with ESC, there was no significant difference between the rollover rates estimated for high riding vehicles and cars (1.06 times, 95% CI 0.93-1.20). When the analysis focused on individual market groups, there was a much lower rate of rollover associated with ESC fitment relative to non-fitment for small and large SUVs in particular. Although not as pronounced, there were also low relative rates for small and light cars, and for commercial utes.
The second analysis examined the association between RSC fitment and the odds of rollovers for high riding vehicles by analysing crashes for the years 2008-2017 from Victoria, Queensland, South Australia, New South Wales, Western Australia and New Zealand. The analysis was restricted to vehicles already equipped with ESC as vehicles fitted with RSC always have ESC fitted. There was a statistically significant odds ratio of 0.76 (95% CI 0.62-0.93) associated with RSC fitment for these vehicles, controlling for driver age, sex, jurisdiction and speed limit of the crash. Analysis by particular market groups found significant odds ratio reductions for commercial utes and large SUVs, but not for the other high riding market groups individually.
There are various potential explanations behind these different crash rates and odds estimated. Different market groups have exposure to different driving conditions that in turn convey different types of rollover risk. ESC is effective when the driver actively steers the vehicle despite loss of traction. ESC will therefore be ineffective when the driver’s reactions are severely impaired (affected by alcohol or fatigue, for example).
RSC reduces the risk of a rollover by sensing impending rollover with a gyroscopic sensor and then employing the ESC system to brake one or more wheels, combined with a reduction in engine power. RSC is not useful for preventing rollover when the vehicle is “tripped”, such as when the vehicle hits the curb or a ditch. Higher riding vehicles are more likely to encounter situations where RSC is useful than cars because of their higher centre of gravity relative to the width of the wheel base. Our results suggest that RSC may be most useful for utes and large SUVs, which may be related to their elevated liability to rollover when cornering. Other factors that can lead to lowered rollover rates consistent with effectiveness include the technology itself (as there will be differences between manufacturers) and the sorts of exposures typical for the vehicle. Note that the crash data analysed were for public roads, so off-road crashes were outside the scope of this study.
Finally, potential vehicle buyers may wish to make decisions around vehicle purchases related to how the vehicle (and its safety features) may address their particular risk profile. First, the injury outcomes from a rollover crash are much more severe than for crashes generally, so RSC in high riding vehicles appears to be very desirable based on its association with lower rollover rates found here. Second, the safety benefits are particularly associated with its fitment in large SUVs and commercial utes, the latter market group being very popular of late in both Australia and New Zealand. Third, some driver groups appear to be particularly prone to rollover when driving high riding vehicles. These are younger drivers aged 25 and under and female drivers aged 60 plus. For this latter group, this was the only age group where there were different rates between the sexes. This corresponds to an indicative finding reported using Australasian data from more than a decade prior to the data analysed here (Keall et al, 2006).

EVALUATION OF ESC AND SUV ROLL STABILITY CONTROL | 22
5. CONCLUSIONS
This analysis of crash rates is consistent with greater effectiveness of ESC in preventing rollovers for high
riding vehicles, to the extent that there was no difference between the rates of rollover for ESC-equipped
high riding vehicles compared to ESC-equipped cars, despite much higher rates for those not equipped. The
analysis was also consistent with the additional fitment RSC being effective in preventing almost an
additional quarter of all rollover crashes for high riding vehicles equipped with ESC. This suggests that these
technologies are highly desirable, and more desirable for higher riding vehicles.

MONASH UNIVERSITY ACCIDENT RESEARCH CENTRE | 23
6. LIMITATIONS
The first analysis reported here, which estimated rates of rollover per licensed vehicle, analysed only a subset of the total crashes available because matches could not always be made with registration data. Nevertheless, the conclusions should be relatively unaffected as the accuracy of recording of registration plate details should not have been different for different market groups or vehicles with different safety features.
The number of rollover crashes available to be analysed meant that the analysis sometimes lacked adequate power, particularly for the rarer market groups. Lack of significant differences according to ESC or RSC fitment status for particular market groups should not be interpreted as necessarily indicating that ESC or RSC was ineffective in preventing rollover.

EVALUATION OF ESC AND SUV ROLL STABILITY CONTROL | 24
7. REFERENCES
ABS (2012) Postcode 2012 to Remoteness Area 2011. In Australian Bureau of Statistics (ed), Canberra. Høye A (2011) The effects of Electronic Stability Control (ESC) on crashes—An update, Accident Analysis &
Prevention 43:pp. 1148-1159. Keall MD, Frith WJ (2006) Characteristics and risks of drivers with low annual distance driven, Traffic Injury
Prevention, 7:pp. 248-255. Keall MD, Newstead S (2007) Four-wheel Drive Vehicle Crash Involvement Risk, Rollover Risk and Injury
Rate in Comparison to Other Passenger Vehicles: Estimates Based on Australian and New Zealand Crash Data and on New Zealand Motor Vehicle Register Data. Monash University Accident Research Centre, Melbourne.
Keall MD, Newstead S (2009a) Induced Exposure Estimates of Rollover Risk for Different Types of
Passenger Vehicles, Traffic Injury Prevention 10:pp. 30-36. Keall MD, Newstead S (2009b) Selection of Comparison Crash Types for Quasi-Induced Exposure Risk
Estimation, Traffic Injury Prevention 10:pp. 23-29. Keall MD, Newstead S (2016) Development of a method to rate the primary safety of vehicles using linked
New Zealand crash and vehicle licensing data, Traffic injury prevention 17:pp. 151-158. Keall MD, Newstead SV, Watson L (2006) Four-wheel drive vehicle crash involvement patterns. RACV,
Melbourne. SAS Institute (1998) SAS/STAT software: Changes and enhancements through release 8.02. SAS Institute
Inc., Cary, NC, USA.

MONASH UNIVERSITY ACCIDENT RESEARCH CENTRE | 25

EVALUATION OF ESC AND SUV ROLL STABILITY CONTROL | 26
Further information
Associate Professor Stuart Newstead Monash University Accident Research Centre
21 Alliance Lane
Monash University Clayton Campus
Victoria 3800 Australia T: +61 (0)3 9905 4364 E: [email protected] monash.edu.au
CRICOS provider: Monash University 00008C