Energy Supply Committee – ESC - MalaysiaStock.Biz
284
The Energy Supply Committee (ESC) is the highest management forum with the authority to endorse and approve all power system development plans and proposals for TNB in Peninsular Malaysia prior to submission to the Board of Directors. The ESC also makes decisions on major operational issues affecting the Company’s core business as well as matters related to the expedition of on-going generation, transmission and primary distribution development projects in Peninsular Malaysia. The ESC held three (3) meetings in the Financial Year ended 31 August 2012. 1 4 2 5 3 6 Composition: 1. Datuk Wira Ir. Azman bin Mohd President/Chief Executive Officer 2. Fazlur Rahman bin Zainuddin Chief Financial Officer/ Vice President, Group Finance 3. Zainudin bin Ibrahim Vice President, Generation 4. Datuk Rozimi bin Remeli Vice President, Transmission 5. Datuk Ir. Baharin bin Din Vice President, Distribution 6. Datin Roslina binti Zainal Vice President, Planning 91 KEEPING THE LIGHTS ON Leadership Annual Report 2012 Energy Supply Committee – ESC
-
Upload
khangminh22 -
Category
Documents
-
view
3 -
download
0
Transcript of Energy Supply Committee – ESC - MalaysiaStock.Biz

The Energy Supply Committee (ESC) is the highest management
forum with the authority to endorse and approve all power system
development plans and proposals for TNB in Peninsular Malaysia
prior to submission to the Board of Directors. The ESC also makes
decisions on major operational issues affecting the Company’s core
business as well as matters related to the expedition of on-going
generation, transmission and primary distribution development
projects in Peninsular Malaysia.
The ESC held three (3) meetings in the Financial Year ended
31 August 2012.
1
4
2
5
3
6
Composition:
1. Datuk Wira Ir. Azman bin Mohd
President/Chief Executive Officer
2. Fazlur Rahman bin Zainuddin
Chief Financial Officer/
Vice President, Group Finance
3. Zainudin bin Ibrahim
Vice President, Generation
4. Datuk Rozimi bin Remeli
Vice President, Transmission
5. Datuk Ir. Baharin bin Din
Vice President, Distribution
6. Datin Roslina binti Zainal
Vice President, Planning
91
KEEPING THE LIGHTS ON
Lead
ersh
ip
Annual Report 2012
Energy SupplyCommittee – ESC

Composition:
1. Datuk Wira Ir. Azman bin Mohd
President/Chief Executive Officer
3. Dato’ Ir. Mohd Nazri bin Shahruddin
Vice President, New Business & Major Projects
5. Datuk Rozimi bin Remeli
Vice President, Transmission
2. Fazlur Rahman bin Zainuddin
Chief Financial Officer/Vice President, Group Finance
4. Zainudin bin Ibrahim
Vice President, Generation
6. Datuk Ir. Baharin bin Din
Vice President, Distribution
1
4
2
5
3
6
The Group Execut ive Manage m e nt
Committee (GEMC), headed by the President/
Chief Executive Officer, assumes the
responsibility for the daily management of
the Company’s business and operations,
strategic planning, resource management
and risk assessment. The GEMC oversees
and manages issues to ensure that the
Company’s obligations are fulfilled and the
expectations of the shareholders and other
stakeholders are met.
The GEMC also del iberates on the
achievements of the Divis ions’ Key
Performance Indicators (KPIs) and the
challenges faced in achieving these KPls.
The KPIs are then reviewed and realigned
with the targets set for the year.
The GEMC generally meets on a monthly
basis and as and when the need arises.
The GEMC held 14 meetings in the Financial
Year ended 31 August 2012.
92
TENAGA NASIONAL BERHAD (200866-W)
Lead
ersh
ip
Annual Report 2012
Group Executive Management Committee – GEMC

7
10
8
11
9
12
7. Dato’ Muhammad Razif bin Abdul Rahman
Vice President, Human Resource
9. Kamaruddin bin Mahmood
Chief Information Officer
11. Dato’ Roslan bin Ab Rahman
Chief Corporate Officer
8. Datin Roslina binti Zainal
Vice President, Planning
10. Ir. Nor Azmi bin Ramli
Chief Procurement Officer
12. Norazni binti Mohd Isa
Company Secretary
93
KEEPING THE LIGHTS ON
Lead
ersh
ip
Annual Report 2012
Group Executive Management Committee – GEMC

Composition:
1. Datuk Wira Ir. Azman bin Mohd
President/Chief Executive Officer
2. Fazlur Rahman bin Zainuddin
Chief Financial Officer/Vice President, Group Finance
3. Dato’ Ir. Mohd Nazri bin Shahruddin
Vice President, New Business & Major Projects
4. Zainudin bin Ibrahim
Vice President, Generation
5. Datuk Rozimi bin Remeli
Vice President, Transmission
6. Datuk Ir. Baharin bin Din
Vice President, Distribution
94
TENAGA NASIONAL BERHAD (200866-W)
Lead
ersh
ip
Annual Report 2012
1
4
2
5
3
6
Profile of Management Team

7. Dato’ Muhammad Razif bin Abdul Rahman
Vice President, Human Resource
8. Datin Roslina binti Zainal
Vice President, Planning
9. Kamaruddin bin Mahmood
Chief Information Officer
10. Ir. Nor Azmi bin Ramli
Chief Procurement Officer
11. Dato’ Roslan bin Ab Rahman
Chief Corporate Officer
12. Norazni binti Mohd Isa
Company Secretary
95
KEEPING THE LIGHTS ON
Lead
ersh
ip
Annual Report 2012
7
10
8
11
9
12
Profile of Management Team

1 Datuk Wira Ir. Azman bin Mohd
President/Chief Executive Officer
Datuk Wira Ir. Azman bin Mohd, 55, has
held several key positions in TNB since
joining the organisation 31 years ago.
Starting his career as a District Office
electrical engineer, he gradually acquired
positions of greater responsibility, holding
posts such as District Manager, State
General Manager and General Manager of
Strategic Management & Organisation
Development at the company headquarters
before being appointed as Senior General
Manager of Operational Region 2 in 2006.
On 14 November 2008, he was made Vice
President of Distribution; and on 15 April
2010, he was appointed as Chief Operating
Officer/Executive Director of TNB. He took
over the helm of the company as its
President/CEO on 1 July 2012.
Datuk Wira Ir. Azman obtained a Diploma
in Engineering from the England Newark
Technical College, UK, in 1976, a Bachelor
of Engineering in Electrical Engineering
from the University of Liverpool, UK, in
1979, and a Master of Business Administration
from the University of Malaya in 1996.
2 Fazlur Rahman bin Zainuddin
Chief Financial Officer/Vice President,
Group Finance
Fazlur Rahman bin Zainuddin, 43, was
appointed TNB Chief Financial Officer and
Vice President (Group Finance) on 1 July
2012. Prior to this, he was the Chief
Financial Officer of the Naza Group. Before
joining the Naza Group in 2010, Fazlur was
with Telekom Malaysia Berhad (TM) for five
years from 2005, during which time he
served in a number of different capacities
culminating in the position of Vice
President, Business Development. Fazlur
also spent 10 years from 1995 with Shell
Malaysia in various financial management
and corporate roles. Prior to that, he gained
four years’ experience in public accounting
practice, which included almost three years
in Pricewaterhouse Kuala Lumpur as a tax
consultant.
Fazlur also sits on the Board of Directors of
various TNB subsidiaries. He is a professional
accountant by training, a Fellow of the
A s s o c iat ion of Chartered Cert i f ied
Accountants (ACCA), UK, and a member of
the Malaysian Institute of Accountants (MIA).
3 Dato’ Ir. Mohd Nazri bin Shahruddin
Vice President,
New Business & Major Projects
Dato’ Ir. Mohd Nazri bin Shahruddin, 55,
joined the National Electricity Board (NEB)
on 1 September 1979 upon completion of
his studies in the UK as an NEB scholar. He
served in several power stations in the field
of Operations and Maintenance and was
involved in developing a number of power
plants, most notably the Sultan Azlan Shah
Power Station in Perak. Later, Dato’ Nazri
headed a team from TNB, Khazanah
Nasional and Malakoff which, in association
with a private Saudi firm, developed the
f irst Independent Water and Power
Producer (IWPP) project in Saudi Arabia, the
Shuaibah Power and Water Facility. He was
based in Jeddah for three years to complete
the project. In 2008, Dato’ Nazri was
appointed Vice President of Generation, a
position he held until his appointment in
September 2012 as Vice President of New
Business & Major Projects.
Dato’ Nazri holds a Bachelor of Science in
Mechanical Engineering from King’s
College, University of London.
4 Zainudin bin Ibrahim
Vice President, Generation
Tuan Haji Zainudin Ibrahim, 56, began his
32-year career in TNB as a Mechanical
Engineer at Tuanku Ja’afar Power Station in
1980. Following a two-year stint as a Shift
Charge Engineer at Sultan Ismail Power
Station, Paka, he returned to Tuanku Ja’afar
Power Station where he continued to serve
for the next 20 years in various positions in
the Maintenance Department culminating
as a Senior Manager. Between 2007 and
April 2012, he assumed the post of General
Manager, first at the Putrajaya Power
Station, and later at the Tuanku Ja’afar
Power Station. He then spent six months as
the Senior General Manager (Operations) of
Generation Division. On 3 September 2012,
he assumed his current position as the Vice
President, Generation.
Tuan Haji Zainudin obtained his Bachelor of
Engineering in Mechanical Engineering
from the University of Sheffield, UK in 1980
and his Master of Engineering Management
from University Tenaga Nasional in 2005.
5 Datuk Rozimi bin Remeli
Vice President, Transmission
Datuk Rozimi bin Remeli, 55, has spent over
33 years in TNB. He started as a Technical
Assistant in Distribution Butterworth,
Penang. He then served in Transmission
Maintenance since 1984 untill he was
promoted to General Manager (GM) of
Maintenance in 2006. Later in 2007 he was
again promoted to hold a position as a
Senior General Manager (SGM) Transmission
Asset Development. On 9 January 2010, he
assumed his current position as the Vice
President, Transmission Division
96
TENAGA NASIONAL BERHAD (200866-W)
Lead
ersh
ip
Annual Report 2012
Profile of Management Team

Datuk Rozimi holds a Diploma in Electrical
Engineering from Universiti Teknologi
Malaysia, a Bachelor of Engineering from
Northorp University, USA, and a Master of
Business Administration (MBA) from
Universiti Sains Malaysia. In addition, he is
currently the Adjunct Professor in the Civil
Engineering Department of University
Tenaga Nasional (UNITEN). He is also the
National Mirror Committee Chairman for
I E C / T C 1 1 5 w h e r e M a l a y s i a i s t h e
participating member.
6 Datuk Ir. Baharin bin Din
Vice President, Distribution
Datuk Ir. Baharin bin Din, 49, has spent
almost his entire 27-year career at
various engineering positions in TNB,
with the exception of two-and-a-half years
when he served the Ministry of Energy,
Telecommunications & Posts Malaysia, first
as a Deputy Director, then a Director, of the
Electrical Inspectorate Department, in Sabah
then Pahang. At TNB, he has taken
on managerial positions in the Engineering
Department overlooking the development
of Distribution; he has been involved
in Business Development, Network
Maintenance, Metering Services, Construction
Service, Network Service, and Engineering
Service and Logistics. In March 2007, he was
made Managing Director of Sabah Electricity,
a position he held for four years before
being assigned as Senior General Manager,
Customer Service & Metering, in the
Distribution Division on 1 December 2011.
He was promoted to Vice President of
Distribution on 1 January 2012.
Datuk Ir. Baharin obtained a Bachelor of
Science in Electrical Engineering from
Syracuse University, New York, USA, and a
Master of Business Administration from
UNITEN and Bond University, Australia,
under a joint UNITEN/Bond MBA programme.
7 Dato’ Muhammad Razif bin Abdul Rahman
Vice President, Human Resources
Dato’ Muhammad Razif bin Abdul Rahman,
50, has spent his entire 28-year career with
LLN/TNB. During this time, he has served in
var ious capac i t ies as Transmiss ion
Protection Engineer, Power Plant Engineer,
TNB Workshop Services Sdn. Bhd. Business
Development Manager , Perusahaan
Otomobil Elektrik Malaysia’s Operations
Manager and Head of Training at TNB
Transmission Network Sdn. Bhd. In 2002,
he moved from operations to the Group
Human Resources Division, where he
served as Head of Training & Development
and, later, as Head of Human Resources
Planning and Staff ing, before been
promoted to Vice President of Human
Resources in December 2008.
Dato’ Muhammad Razif obtained a degree
in Electrical Engineering from the University
of Liverpool in 1984.
8 Datin Roslina binti Zainal
Vice President, Planning
Datin Roslina binti Zainal, 50, has served
TNB for 27 years, beginning as an electrical
engineer in Johor Bahru when she joined
Lembaga Letrik Negara (as TNB was known
then) on 1 July, 1985. She was promoted
to a Senior Engineer of Energy Planning at
the Planning and Development Department
in TNB’s headquarters in 1988, following
which she was seconded as the Assistant
Director of Energy in the Economic
Planning Unit of the Prime Minister’s Office
from 1991 to 1993. On her return to TNB,
she was appointed as Manager, Regulatory
& Business Strategy at the Corporate
Planning Division and then Senior Manager,
Strategic and Business Management. In
2005, she was made General Manager,
Procurement of Energy, and on 1 April
2009, she assumed her current position of
Vice President, Planning.
Datin Roslina is also a member of the
Planning Committee of the National Nuclear
Development Programme, member of the
Board of Engineers Malaysia, an advisor to
the Institute of Energy Policy and Research,
UNITEN, and a Director of TNB Fuel Services
Sdn. Bhd.
She obtained a degree in Electrical
Engineering from the University of
Lakehead, Canada, and a Master of Business
Administration from the University of New
England, Australia.
97
KEEPING THE LIGHTS ON
Lead
ersh
ip
Annual Report 2012
Profile of Management Team

9 Kamaruddin bin Mahmood
Chief Information Officer
Kamaruddin bin Mahmood, 52, has more
than 27 years’ experience in the Information
& Communication Technologies (ICT)
industry, the last seven years of which have
been spent in TNB. He joined TNB in May
2005 as General Manager of the IT
Department in the ICT Division. Since then,
he has acquired a range of expertise
within the ICT Division, spending seven
months as GM of IT & Telecommunications
Development Department, one-and-a-half
years as GM of the IT & Business Solutions
Department, and another two years as
Senior GM of the same department,
following which he was promoted to his
current position as Chief Information Officer
(CIO) in March 2012. As CIO, Kamaruddin is
responsible for ensuring the company’s
vision, mission, strategy and goals are
achieved through the effective use of ICT.
Before joining TNB, he served in various key
positions in ICT in large companies dealing
in commodities and oil and gas.
Kamaruddin obtained a Bachelor of Science
from Murdoch University, Australia, and
attended a Management Programme at
Cambridge University, UK.
10 Ir. Nor Azmi bin Ramli
Chief Procurement Officer
Ir. Nor Azmi bin Ramli, 54, has served in
TNB for 31 years in various positions in the
areas of operations & maintenance and
management spanning the Distribution,
Generation and Procurement Divisions. His
last nine years of service with TNB have
been in Procurement. Before his current
appointment as the Chief Procurement
Officer for TNB, he was Head of Procurement
for Generation Division.
Ir. Nor Azmi is a certified Competent
Engineer 66KV, Steam Engineer Grade 2
and Internal Combustion Engineer Grade 2.
He is also a member of the Institution of
Engineers Malaysia, Institution of Certified
Engineers Malaysia and the Chartered
Institute of Purchasing and Supply.
Ir. Nor Azmi graduated in 1981 with a
Bachelor of Science in Electrical and
Electronics Engineering from the University
of Brighton, UK. He also holds a Master of
Business Administrat ion f rom Ohio
University, USA, and a Master of Science in
Logistics and Supply Chain Management
from the University of Bolton, UK.
11 Dato’ Roslan bin Ab Rahman
Chief Corporate Officer
Dato’ Roslan bin Ab Rahman, 55, began his
more than 30-year career at TNB in 1980,
when he joined the company as an
electrical engineer based in Batu Pahat,
Johor. He then assumed positions of greater
responsibility – from District Officer in
Termerloh, Pahang to Senior Manager of
Distribution at the headquarters, and Senior
District Manager in Klang followed by
Kuantan. In 1999, he was promoted to
Head of Corporate Quality at TNB’s
headquarter; two years later he became
General Manager (GM) of TNB Putrajaya/
Cyberjaya, fol lowing which he was
appointed GM of Customer Service and
Marketing, Distribution. Prior to being
promoted to Chief Corporate Officer on
1 September 2012, Dato’ Roslan was Senior
General Manager, Operation Region 2, for a
period of three years.
Dato’ Roslan holds a Bachelor of Science in
Electrical Engineering from the University
of Southampton, UK.
12 Norazni binti Mohd Isa
Company Secretary
Norazni binti Mohd Isa, 49, has served more
than 22 years in TNB, with vast experience
in tender and contract management. She
held various positions in the Shared
Purchasing Department, Procurement
Division. Previous positions in TNB before
assuming her current role include Legal
Executive in the Legal Services Department,
Company Secretary’s Office, Manager of
Licensing and Compliance Unit in Corporate
Communications Department and Head of
Tender and Contract, Procurement Division.
Norazni was appointed as a Deputy
Company Secretary on 1 April 2011 and
assumed the position of Joint Company
Secretary on 1 July 2011 and subsequently
to her present position as Company
Secretary on 31 May 2012.
Norazni obtained a Diploma and an
Advanced Diploma in Law from MARA
Institute of Technology (now Universiti
Teknologi MARA) and a Masters of Law
from the University of Malaya.
98
TENAGA NASIONAL BERHAD (200866-W)
Lead
ersh
ip
Annual Report 2012
Profile of Management Team

YOU SEE

TRANSFORMING ECONOMIES TO THE NEXT LEVEL OF GROWTH
WE SEE...

K E E P I N G T H E
LIGHTS ON

TNB BOARD
PRESIDENT/ CHIEF EXECUTIVE OFFICER
AUDIT AND FINANCIAL GOVERNANCE
– Internal Audit
– External Audit
– Financial Controls
BOARD AUDIT COMMITTEE
(BAC)
Group Executive Council Committee
Energy Supply CommitteeGroup Risk Management
Committee
Information andCommunication Technology (ICT)
Governance Council
Group ExecutiveManagement Committee
Group ManagementTender Committee
Commodity ProcurementExecutive Committee
Occupational Safety andHealth Steering Committee
BOARD NOMINATION
AND REMUNERATION
COMMITTEE (BNRC)
BOARD TENDER
COMMITTEE (BTC)
BOARD FINANCE AND
INVESTMENT COMMITTEE
(FIC)
BOARD DISCIPLINARY
COMMITTEE (BDC)
DELEGATIONACCOUNTABILITY
Corporate governance is core to ensuring the creation,
protection and enhancement of shareholders’ value.
The Board maintains and requires that the Management
of TNB maintains the highest level of corporate ethics.
The Board of Directors of TNB (Board) is concerned to ensure that
the Group is properly managed to protect and enhance
shareholders’ interests, and that the Company, its Directors, officers
and employees operate in an appropriate environment of corporate
governance.
The Board has adopted a corporate governance framework
comprising principles and policies that are consistent with the
Malaysian Code of Corporate Governance (Revised 2007) (the
Code) and the Main Market Listing Requirements of Bursa Malaysia
Securities Berhad (MMLR). This framework is designed to promote
responsible management and assists the Board to discharge its
corporate governance responsibilities on behalf of the Company’s
shareholders.
The statement outlines the Group’s main corporate governance
practices and policies in place throughout the Financial Year and
at the date of this statement, through discussion of:
i. Clear Roles and Responsibilities;
ii. Strengthen Composition;
iii. Reinforce Independence;
iv. Foster Commitment;
v. Uphold Integrity in Financial Reporting;
vi Recognise and Manage Risks;
vii. Ensure Timely and High Quality Disclosure;
viii. Strengthen Relationship Between Company and Shareholders.
In furtherance, the Board supports the eight (8) principles and
26 recommendations laid down in the Malaysian Code of Corporate
Governance 2012 in achieving excellence in corporate governance
through reinforcing self and market discipline and promoting good
compliance and corporate governance culture. The Board will
review the existing corporate governance practices throughout the
Group and will undertake appropriate action in embedding the
said principles and recommendations of the Malaysian Code of
Corporate Governance 2012 in the existing framework.
CORPORATE GOVERNANCE FRAMEWORK
102
TENAGA NASIONAL BERHAD (200866-W)
Acc
ount
abili
ty
Annual Report 2012
Statement of Corporate Governance

CLEAR ROLES AND RESPONSIBILITIES
Principal Responsibilities of the Board
The Board is primarily responsible for setting and reviewing the
strategic direction of the Group and monitoring the implementation
of that strategy by the Management including:
● Approving the strategic direction of the Group;
● Promoting ethical and responsible decision-making;
● Monitoring compliance with all applicable laws and regulations,
applicable accounting standards and significant corporate
policies;
● Overseeing and reviewing the conduct of the Group’s business
including its control and accountability systems;
● Approving the annual operating and capital budget and
monitoring the financial performance of the Group;
● Appointing and determining the duration, remuneration and
other terms of appointment of the President/Chief Executive
Officer as well as the Senior Management;
● Evaluating and monitoring the performance of the President/
Chief Executive Officer and the Senior Management through
their Key Performance Indicators (KPIs);
● Developing and reviewing the succession planning of the
Senior Management; and
● Monitoring and reviewing the Group’s Risk Management
System and internal compliance and control.
The Articles of Association of the Company enable the Board to
delegate to Board Committees and the Management. The roles
and responsibilities delegated to the Board Committees are
captured in the Terms of References (TORs) of each of the
established Committees.
The Delegated Authority Policy Framework outlines principles to
govern decision-making within the Group, including appropriate
escalation and reporting to the Board. The Board has also delegated
to the President/Chief Executive Officer, and through the President/
Chief Executive Officer to other Senior Management, responsibility
for the day-to-day management of the Company. These delegations
balance effective oversight with appropriate empowerment and
accountability of Management.
The distinct and separate roles of the Chairman and President/
Chief Executive Officer, with a clear division of responsibilities,
ensures a balance of power and authority, such that no one
individual has unfettered power of decision-making.
TNB Board is headed by Tan Sri Leo Moggie, whose extensive
knowledge, experience and reputation is unrivalled in the industry.
He plays a vital role in leading and guiding the Board with a keen
focus on governance and compliance. He maintains a constant
flow of dialogue with the President/Chief Executive Officer and
provides appropriate mentoring and guidance. Tan Sri Leo Moggie
also acts as a conduit between the Management and the Board,
and serves as the primary point of communication between the
Board and the President/Chief Executive Officer.
The President/Chief Executive Officer, Datuk Wira Ir. Azman bin
Mohd and his Management team are responsible for developing
the strategic objectives for the business and for the day-to-day
management of the Company with all powers, discretions and
delegations authorised from time to time by the Board.
Board of Directors
The Board may appoint a new Director either to fill a casual
vacancy or to add to the existing Directors, provided the total
number of Directors does not exceed 12 as stipulated in the
Articles of Association of the Company. The Minister of Finance
Incorporated (MoF Inc), being the Special Shareholder, shall have
the right to appoint up to six (6) Directors.
The Board currently has ten (10) members, six (6) of whom are
Independent Non-Executive Directors. These Directors are
considered by the Board to be independent of management and
free of any business or other relationship or circumstances that
could materially interfere with the exercise of objective, unfettered
or independent judgment.
The Board considers that it should include significant representation
by Directors who are capable and willing to make decisions in the
best interests of the shareholders, free from interests or influences
which conflict with that duty and are also independent of the
management.
The Board collectively has a broad range of experience and skills
appropriate to meet its objectives. Board members have expertise
and experience in areas of public service, administration, finance,
engineering, law, accounting and business. A brief profile of each
Director is presented on pages 84 to 89 of the Annual Report.
103
KEEPING THE LIGHTS ON
Acc
ount
abili
ty
Annual Report 2012
Statement of Corporate Governance

Re-election of Directors
The Company’s Articles of Association states that one third of the
Directors shall retire from office by rotation at each Annual General
Meeting (AGM) and all Directors shall retire from office at least
once every three (3) years but shall be eligible, and may offer
themselves for re-election.
Sections 129(2) and 129(6) of the Companies Act, 1965 state that a
Director who is over 70 years of age shall retire at every AGM and
may offer himself for re-appointment to hold office until the
Company’s next AGM.
The Board makes recommendations concerning the re-election
of any Director by shareholders at the AGM. Information on
the Directors standing for re-election at the forthcoming 22nd AGM
is contained in the Statement Accompanying Notice of the
22nd AGM.
Board Committees
TNB’s five (5) standing Board Committees assist the Board in its
oversight functions. The functions of the Committees are governed
by clearly defined TORs, which are reviewed periodically to ensure
that they are relevant and up-to-date. The five (5) Board Committees
are as follows:
i. Board Audit Committee
ii. Board Tender Committee
iii. Board Nomination and Remuneration Committee
iv. Board Finance and Investment Committee
v. Board Disciplinary Committee
Each Committee has to submit reports of their respective
deliberations and recommendations to the Board. All deliberations
and recommendations taken have to be minuted and approved by
each Committee and confirmed by the Chairman of the Committee
at the next Board’s meeting.
The salient TORs of the five (5) established Board Committees are
as follows:
Board Audit Committee (BAC)
Responsibilities
● The principal function of the BAC is to oversee the integrity of
the financial statements in compliance with the legal and
applicable accounting standard and to assess the effectiveness
of the Group’s enterprise wide risk management and internal
control framework.
● The detailed TOR of the BAC are on pages 125 to 128 of the
Annual Report.
Board Tender Committee (BTC)
Responsibilities
● To establish the framework of TNB’s Procurement Policy and
Procedures.
● To advise the Board regarding the details and implementation
of the framework of TNB’s Procurement Policy and Procedures.
● To assist the Board in regulating the compliance of Senior
Management and Executive Director with TNB’s Procurement
Policy and Procedures.
● To ensure TNB complies with the applicable laws, regulations,
rules and guidelines to achieve best practices in its procurement
of equipment, materials, work and services.
Board Nomination and Remuneration Committee (BNRC)
Responsibilities
● To identify and recommend new nominees to the Board, Board
Committees and TNB’s Group of Companies.
● To assist the Board in reviewing the Board’s required mix of
skills, experience and other qualities, including core
competencies which Non-Executive Directors should bring to
the Board.
● To implement the process formulated by the Board to assess
the effectiveness of the Board as a whole, the Board Committees
and the contribution of each individual Director.
● To determine and recommend to the Board the remuneration
packages of Non-Executive Directors.
104
TENAGA NASIONAL BERHAD (200866-W)
Acc
ount
abili
ty
Annual Report 2012
Statement of Corporate Governance

Board Finance and Investment Committee (FIC)
Responsibilities
To establish a framework of policies to assist the Committee in
making recommendations to the Board in relation to the
management of the Group’s financial and investment activities as
well as in evaluating corporate proposals.
Board Disciplinary Committee (BDC)
Responsibilities
● To manage disciplinary issues and actions with regard to
employees’ misconduct except for the hearing of appeal of
executives of grade M15 and above or equivalent grade
with regard to disciplinary cases, for which the power lies with
the Board.
● To establish new disciplinary procedures or amend existing
procedures whenever applicable, subject to the Board’s approval.
Board Meetings
The Board schedules monthly meetings with additional meetings
convened as and when key strategic issues or urgent matters arises
that require deliberation in between the scheduled meetings.
During the Financial Year under review, 14 Board meetings were
held and all Directors complied with the requirement of at least 50%
attendance as prescribed by the MMLR.
The Board and Board Committee meetings are scheduled
well in advance, with dates for the year circulated in the month of
October of the preceding year to give the Directors ample time to
plan ahead.
A pre-Board meeting is held prior to any Board meeting for the
Management to provide the Chairman with insights into the
papers to be deliberated. Senior Management and external advisors
may be invited to attend Board meetings to advise the Board and
to furnish information or clarification as and when required on
matters to be deliberated so as to enable the Board to make
informed decisions. When a Director is unable to attend a meeting,
his views are sought in advance then put to the meeting to
facilitate a comprehensive discussion. This way, each Director
makes himself/herself available to fellow Directors and contributes
to all major decisions before the Board.
The agenda of Board meetings is drawn up upon consultation with
the Chairman at the pre-Board meetings, after which the agenda
and Board papers are circulated to Board members at least three
(3) working days prior to the Board meetings. This is to allow the
Directors to review, consider and if necessary obtain further
information on the matters to be deliberated at the meeting.
A comprehensive Board paper is prepared which includes the
objectives, background, issues, implications, risks and other relevant
information to facilitate the Board to make informed and effective
decisions.
Board meetings were also held at various business operating units
or sites of new projects to allow the Board to better assess progress
made and note any other important issue. The Board visited TNB’s
two (2) major on-going projects, namely the 1x1,000MW Manjung
Coal Fired Power Plant Project and the Hulu Terengganu
Hydroelectric Project during the Financial Year under review.
Decisions of the Board are made unanimously or by consensus and
these decisions and conclusions are recorded in the minutes. Minutes
of the meetings are circulated to all Directors for their perusal and
confirmation. The Directors may request for clarification or raise
comments on the minutes prior to confirmation of the minutes.
The number of meetings of the Board and Board Committees held
during the Financial Year ended 31 August 2012 and the number of
meetings attended by each Director and Committee member are set
out below.
105
KEEPING THE LIGHTS ON
Acc
ount
abili
ty
Annual Report 2012
Statement of Corporate Governance

Board and Board Committee Members attendance details for the Financial Year ended 31 August 2012:
BOD BAC BTC BNRC FIC BDC
Name of Directors Attendance % Attendance % Attendance % Attendance % Attendance % Attendance %
Tan Sri Leo Moggie1 14
(Chairman)
100 − − 6 100 5
(Chairman)
100 −
Datuk Wira Ir. Azman
bin Mohd 2
14 100 − − − − −
Datuk Nozirah binti Bahari3 12 86 − 12
(Chairman)
92 − − –
Dato’ Mohammad Zainal
bin Shaari
12 86 − 8 62 8 100 5 100 −
Dato’ Zainal Abidin bin Putih 14 100 14
(Chairman)
100 − − 5 100 −
Tan Sri Dato’ Hari Narayanan
a/l Govindasamy
13 93 12 86 − 7 88 − −
Dato’ Fuad bin Jaafar 13 93 − 12 92 7 88 − 1 100
Tan Sri Dato’ Seri Siti Norma
binti Yaakob4
14 100 − − 8
(Chairman)
100 5 100 1
(Chairman)
100
Dato’ Abd Manaf bin Hashim 14 100 14 100 13 100 − − 1 100
Datuk Chung Hon Cheong5 14 100 12 86 − − 4 80 N/A*
Suria binti Ab Rahman
(Alternate Director to Dato’
Mohammad Zainal bin Shaari)
1 100 − 5 100 − − −
Dato’ Sri Che Khalib
bin Mohamad Noh6
11 100 − − − − −
Number of Meetings
held in FY201214 14 13 8 5 1
* No meeting was held since the appointment date.
Note:-1 Ceased as Chairman of BNRC w.e.f. 22 May 20122 Redesignated as President/Chief Executive Officer w.e.f. 1 July 20123 Ceased as member of BDC w.e.f. 27 January 20124 Appointed as Chairman of BNRC w.e.f. 22 May 20125 Appointed as member of BDC w.e.f. 27 January 20126 Ceased as President/Chief Executive Officer w.e.f. 30 June 2012
106
TENAGA NASIONAL BERHAD (200866-W)
Acc
ount
abili
ty
Annual Report 2012
Statement of Corporate Governance

Directors’ Code of Ethics
The Board continues to observe a high standard of ethical conduct
based on the Company Directors’ Code of Ethics established by the
Companies Commission of Malaysia.
In addition, each Director is supplied with the Directors’ Handbook,
which provides reference to the Directors in relation to their
professional responsibilities as well as the terms and conditions of
their service. The Directors’ Handbook is updated as and when the
need arises so as to reflect any changes in the rules and procedures
that govern the conduct of the Directors.
Indemnification of Directors and Officers
Directors and Officers are indemnified under a Directors’ and
Officers’ Liability Insurance against any liability incurred by them in
discharging of their duties while holding office as Directors and
Officers of the Company. The Directors and Officers shall not be
indemnified where there is any negligence, fraud, breach of duty
or breach of trust proven against them.
Supply of Information and Access to Advice
All Directors have unrestricted access to company records and
information, and receive regular detailed financial and operational
reports from the Management.
The Chairman and other Non-Executive Directors regularly consult
with the President/Chief Executive Officer, Chief Financial Officer
and other Senior Management, and may consult with, and request
additional information from, any of the Group’s employees.
The Board collectively and individually has the right to seek
external and independent professional advice at the Company’s
expense, to help carry out its responsibilities.
The Board Breakout Session (BBO) is an avenue for the Board and
Management to deliberate and exchange views as well as opinions
in formulating strategic plans and to chart the direction of the
Group. At these sessions, the Management will highlight to the
Board, issues and challenges encountered by the Group. During the
Financial Year under review, a BBO was held on 9 February 2012.
Company Secretary
The Company Secretary appointed by the Board attends Board and
Board Committee meetings and is responsible for providing
Directors with advice on compliance and corporate governance
issues. The Company Secretary is responsible for the operation of
the secretarial functions, including lodgments with relevant
statutory and regulatory bodies, the administration of Board and
Board Committee meetings (including preparation of the minutes,
matters arising and Chairman’s reports), the management of
dividend payments and the Employees’ Share Option Scheme
(ESOS), the administration of the Company’s subsidiaries and
oversight of the relationship with the Company’s Share Registrar.
STRENGTHEN COMPOSITION
The Board strives to achieve a balance of skills, experience, diversity
and perspective among its Directors.
The BNRC is delegated the responsibility of reviewing and making
recommendations to the Board regarding Board composition and
to assist with the selection and appointment of high calibre
Directors who are able to meet the present and future needs of
the Company. The BNRC is headed by Tan Sri Dato’ Seri Siti Norma
binti Yaakob, an Independent Non-Executive Director and a
majority of the Committee members are also Independent
Non-Executive Directors.
The BNRC conducts an annual review of the size and composition
of the Board and Board Committees, taking into consideration the
required mix of skills, competencies and experience relevant to the
business of TNB.
For the year under review, the Board is satisfied with the existing
number and composition of its members and is of the view that,
with the current mix of skills, knowledge, experience and strength,
the Board is able to discharge its duties effectively and in a
competent manner.
107
KEEPING THE LIGHTS ON
Acc
ount
abili
ty
Annual Report 2012
Statement of Corporate Governance

Board Performance Evaluation
The BNRC is also responsible for undertaking the annual assessment
of the Board’s performance as a whole and the performance of its
Committees. This is used as a tool to recognise the Board’s
strengths and to identify gaps or areas for improvement for the
Board as well as its Committees. The Board evaluates its overall
performance against predetermined criteria which cover the
following key areas:
● Board Structure
● Board Operations and Interaction
● Board Roles and Responsibilities
● Understanding the Committees’ Roles
● Mix of Skills and Knowledge
● Commitment of Members
● Depth of Discussions
The findings of the evaluation are compiled into a report and
deliberated by the BNRC and subsequently, by the Board.
The Board performance evaluation process in 2011 reported that the
Board and Board Committees had continued to operate effectively
in discharging their duties and responsibilities. On the whole, the
Board is of the opinion that the Directors have fulfilled their
responsibilities as members of the Board and Board Committees.
Directors’ Remuneration Framework
The Board, with the assistance of the BNRC, reviews the overall
remuneration policy of the Non-Executive Directors, Executive
Director and Senior Management to attract and retain executives
and Directors who will create sustainable value and returns for
members and other stakeholders of the Company.
The Board as a whole recommends the remuneration of the
Non-Executive Directors to the shareholders for approval at the
AGM. Non-Executive Directors are paid fixed monthly fees, meeting
allowances and benefits-in-kind comprising reimbursement on
electricity bills and business peripherals.
The policy for Directors’ remuneration is to provide a package that
is able to attract and retain Directors of calibre, thus acquire the
leadership skills and experience required. The policy also ensures
that the remuneration package does commensurate with the
Director’s responsibilities for the effective management and
operations of the Group.
The remuneration package for the Executive Director is structured
in such a way as to link rewards to corporate and individual
performance. It comprises salary, allowances, bonuses and other
customary benefits as accorded by comparable companies.
A significant portion of an Executive Director’s compensation
package has been made variable, to be determined by performance
during the year against individual KPIs in a scorecard aligned with
the corporate objectives as approved by the Board. The Executive
Director abstains from deliberation and voting on his/her
remuneration at Board meetings.
The BNRC reviews the performance of the Executive Director
annually and submits recommendations to the Board on
adjustments in remuneration and/or rewards to reflect the
Executive Director’s contributions towards the Group’s
achievements for the year.
108
TENAGA NASIONAL BERHAD (200866-W)
Acc
ount
abili
ty
Annual Report 2012
Statement of Corporate Governance

Details of comprehensive remuneration package of each Director of the Company, categorised into appropriate components for the
Financial Year ended 31 August 2012:
2.117 mm Name of Directors
Director’s Fees Meeting Allowances Benefits-in-Kind
(i) Salary(ii) Contribution
to EPF Company Subsidiaries Company Subsidiaries
(i) Bonus(ii) Variable
Pay(iii) Ex-Gratia
(iv) Completion Payment
(i) Car Allowance(ii) Management
Allowance(iii) Special Allowance Utilities Others Subsidiary Total
(RM) (RM) (RM) (RM) (RM) (RM) (RM) (RM) (RM) (RM) (RM)
Executive Directors
Datuk Wira Ir. Azman (i) 706,450.00 (i) 50,000.00 (i) 85,000.00 906.00 28,338.04
bin Mohd (ii) 117,897.00 – – – – (ii) 132,060.00 (ii) 8,000.00 –
(iii) 50,000.00 (iii) –
824,347.00 – – – – 232,060.00 93,000.00 906.00 28,338.04 – 1,178,651.04
Dato’ Sri Che Khalib (i) 1,000,000.00 (i) – (i) 98,000.00 285,792.10
bin Mohamad Noh (ii) 1,012,308.00 – – – – (ii) 460,000.00 (ii) – – –
(Ceased as President/ (iii) – (iii) 6,000.00
Chief Executive Officer (iv) 4,201,680.00
w.e.f. 30 June 2012)
2,012,308.00 – – – – 4,661,680.00 104,000.00 – 285,792.10 – 7,063,780.10
Non-Executive Directors
Tan Sri Leo Moggie – 180,000.00 300,000.00 46,500.00 37,300.00 – – 4,253.86 14,570.60 – 582,624.46
Datuk Nozirah binti Bahari – 120,000.00 – 37,500.00 – – – – 20,000.00 – 177,500.00
Dato’ Mohammad – *120,000.00 – *39,500.00 – – – 27,774.65 10,000.00 – 197,274.65
Zainal bin Shaari
Dato’ Zainal Abidin – 120,000.00 – 51,500.00 – – – 21,556.75 10,000.00 – 203,056.75
bin Putih
Tan Sri Dato’ Hari – 120,000.00 18,000.00 42,000.00 850.00 – – 4,509.00 10,000.00 – 195,359.00
Narayanan a/l
Govindasamy
Dato’ Fuad bin Jaafar – 120,000.00 36,000.00 41,000.00 6,800.00 – – 7,946.60 12,925.58 6,000.00 230,672.18
Tan Sri Dato’ Seri Siti – 120,000.00 – 38,000.00 – – – 1,829.45 10,000.00 – 169,829.45
Norma binti Yaakob
Dato’ Abd Manaf bin – 120,000.00 – 51,000.00 – – – 1,272.20 19,472.40 – 191,744.60
Hashim
Datuk Chung Hon Cheong – 120,000.00 – 40,500.00 – – – 22,670.20 9,972.00 – 193,142.20
Suria binti Ab Rahman – – – *8,000.00 – – – – – – 8,000.00
(Alternate Director to
Dato’ Mohammad Zainal
bin Shaari
Total 2,836,655.00 1,140,000.00 354,000.00 395,500.00 44,950.00 4,893,740.00 197,000.00 92,718.71 431,070.72 6,000.00 10,391,634.43
* Inclusive of RM120,000.00 and RM47,500.00 paid to Khazanah Nasional Berhad, in respect of Director’s Fees and Meeting Allowances provided for Dato’ Mohammad Zainal bin Shaari and Puan Suria binti Ab Rahman.
109
KEEPING THE LIGHTS ON
Acc
ount
abili
ty
Annual Report 2012
Statement of Corporate Governance

REINFORCE INDEPENDENCE
The Board considers that it should include significant representation
by Directors who are capable and willing to make decisions which
are in the best interests of shareholders free from interests and
influences which conflict with that duty and are also independent
of Management.
Independent Directors are those who have the ability to exercise
their duties unfettered by any business or other relationship and
are willing to express their opinions at the Board free of concern
about their position or the position of any third party.
Currently, TNB’s Board consists of six (6) Independent Non-
Executive Directors. The Independent Directors fulfill the criteria of
“Independence” as prescribed under Paragraph 1.01 of the MMLR.
The Independent Non-Executive Directors are persons of high
calibre and integrity, who collectively provide skills and
competencies to ensure the effectiveness of the Board. Among the
key criteria of the independence framework adopted by TNB are
independence from Management and the absence of any business
relationship which could materially interfere with the Independent
Director’s judgment and ability to provide a strong, valuable
contribution to the Board’s deliberations or which could interfere
with the Director’s ability to act in the best interest of TNB.
The Board continually assesses the independence of each Director
in accordance with the terms of the Directors’ Handbook, the
interests they have disclosed and such other factors as the Board
determines appropriate to take into account.
Dato’ Zainal Abidin bin Putih, who was appointed as the Senior
Independent Non-Executive Director in 2010, acts as a designated
contact to whom shareholders and stakeholders may convey any
concerns or queries on the affairs of the Company, as an alternative
to the formal channel of communication with shareholders.
The Senior Independent Non-Executive Director may be contacted
at the following email address: [email protected].
Conflicts of Interests
Over and above the issue of independence, each Director has a
continuing responsibility to determine whether he/she has a
potential or actual conflict of interest in relation to any material
matter which comes before the Board. Such a situation may arise
from external associations, interests or personal relationships.
The Company has adopted a practice whereby each Director is
required to declare whether he/she has any interest in any
transaction. If so, the Director abstains from deliberations and
decisions of the Board on the subject proposal.
FOSTER COMMITMENT
Commitment by the Board
The Directors’ Handbook stipulates that a Director, upon acceptance
of his appointment, must commit sufficient time to carry out his
duties and declare to the Board details of all other significant
business and interests, indicating broadly the time spent on such
commitments. The Director must advise the Board of any
subsequent changes to these commitments.
In line with the MMLR, all Directors of TNB complied with the
requirements on directorships held in other companies.
Continuing Development Program for Directors
An induction programme is made available to newly appointed
Directors, specifically designed to help familiarise them with issues
relating to the current business before the Board. Newly appointed
Directors are provided with a comprehensive information pack
which contains the Directors’ Handbook, the Company’s
Memorandum and Articles of Association, relevant Acts to the
nature of business of the Company, the latest Annual Report, TNB’s
Procurement Policy and Procedures, Procurement’s Code of
Conduct and Code of Ethics in order to facilitate the Directors in
discharging their duties.
New Board members are provided with the opportunity to
experience first-hand the operations of the Company and to meet
and discuss all aspects of the Company’s operations with the
Senior Management. As part of the induction programme, the
Company Secretary provides access to information in areas such as
operations, finance, treasury and risk management to assist the
new Board member as required.
All Directors of the Company have successfully completed the
Mandatory Accreditation Programme (MAP) as prescribed by the
MMLR. The Board encourages Directors to continue their education
by participating in workshops held throughout the year, visiting
relevant project sites and undertaking relevant external programmes.
The Board has attended training programmes such as McCloskey
South Africa Coal Exports Conference 2012, Building High
Performance Directors (BHPD), The Malaysian Corporate Governance
Code 2012 – The Implication and Challenges to Public Listed
Companies, Financial Institutions Directors’ Education Program and
MINDA Luncheon Talk on Board Composition and Diversity:
Strategies, Lessons and Looking Forward.
110
TENAGA NASIONAL BERHAD (200866-W)
Acc
ount
abili
ty
Annual Report 2012
Statement of Corporate Governance

The Company Secretary facilitates in organising internal and
external programmes, training sessions, briefings, workshops and
seminars for Directors. The annual Board Development Programme
(BDP) is organised in-house as part of TNB’s Continuing
Development Programme for the Board. During the Financial Year
under review, BDP 2012 entitled Electricity Industry Reform, Markets
and Strategy Discussions on Maintaining the Vertically Integrated
Utility, by Dr. Fereidoon P. Sioshansi, President of Menlo Energy
Economics, USA, was conducted.
The Board also participates in annual Board Technical Visits, either
locally or abroad, with the aim of enhancing the Board’s
understanding and knowledge of the technical and operational
aspects of the power sector as well as to keep abreast with the
latest technologies.
UPHOLD INTEGRITY IN FINANCIAL REPORTING
Financial Reporting
The Board aims to provide a clear, balanced and comprehensive
assessment of the Group’s financial performance and prospects
via the Audited Financial Statements and quarterly financial
reports as well as through material disclosure made in accordance
with the MMLR.
The Board is assisted by the BAC to oversee the integrity of the
Group’s financial reporting and as part of these roles, the operation
of the financial reporting processes. The processes are aimed at
providing assurance that the financial statements and related
notes are completed in accordance with applicable legal
requirements and accounting standards and give a true and fair
view of the Group’s financial positions.
For the year under review, a session between the BAC and the
external auditors in the absence of Management was held as part
of the medium for greater exchange of views and opinions
between both parties in relation to the financial reporting.
RECOGNISE AND MANAGE RISKS
Internal Control
It is important to emphasise that the ultimate responsibility for
ensuring a sound internal control system and reviewing the
effectiveness of the system lies with the Board. The Group’s
inherent system of internal control is designed to manage, rather
than eliminate, the risk of failure to achieve the Company’s
corporate objectives as well as to safeguard shareholders’
investments and the Company’s assets. Details of the Company’s
internal control system and framework are set out in the Statement
of Internal Control on pages 116 to 119 in the Annual Report.
ENSURE TIMELY AND HIGH QUALITY DISCLOSURE
TNB’s practice is to release all price sensitive information to Bursa
Malaysia Securities Berhad (Bursa Malaysia) in a timely manner as
required under the MMLR and to the market and community
generally through TNB’s media releases, website and other
appropriate channels.
Through TNB’s Corporate Disclosure Policy, TNB demonstrates its
commitment to achieving best practice in terms of disclosure by
acting in accordance with the spirit, intention and purpose of the
applicable regulatory requirements and by looking beyond form to
substance. The Corporate Disclosure Policy reflects relevant
obligations prescribed by the MMLR.
For disclosure purposes, price sensitive information is information
that a reasonable person would expect to have a material effect on
the price or value of TNB’s securities. The Company Secretary is
responsible for reviewing proposed disclosures and making
decisions in relation to what information can or should be disclosed
to the market. Each division in TNB is required to inform the
Company Secretary about any potentially price sensitive information
concerning TNB as soon as this becomes known.
Insider trading
The Directors and Senior Management of TNB are prohibited from
trading in securities or any kind of price sensitive information and
knowledge which have not been publicly announced in accordance
with the MMLR and the relevant provisions of the Capital Markets
and Services Act 2007. Notices on the closed period for trading in
TNB’s securities are circulated to Directors and Senior Management
who are deemed to be privy to any price sensitive information and
knowledge, in advance of the closed period where applicable.
111
KEEPING THE LIGHTS ON
Acc
ount
abili
ty
Annual Report 2012
Statement of Corporate Governance

STRENGTHEN RELATIONSHIP BETWEEN COMPANY AND
SHAREHOLDERS
The Board of TNB is committed to providing shareholders, investors
and other stakeholders with comprehensive, timely and equal
access to information about the Group’s activities to enable them
to make informed investment decisions.
TNB employs a wide range of communication approaches such as
direct communication and publication of all relevant Group’s
information on the website at www.tnb.com.my.
TNB utilises its corporate website as a means of providing
information to its shareholders and the broader investment
community. A section of the website is dedicated to TNB’s investors
where media releases, investor presentations and quarterly and
annual financial statements are available for review. These
announcements, presentations and reports are posted on the
website immediately after being released to the market.
Shareholders are encouraged to attend the AGMs and to use the
opportunity to ask questions and vote on important matters
affecting the Group, including the election of Directors, the receipt
of the Audited Financial Statements and the advisory vote on the
remuneration report. The external auditors attend the AGM and
are available to answer questions.
TNB further encourages shareholders to access the Annual Report
online to complement the Group’s commitment to the environment
as well as to achieve greater cost efficiencies. Nevertheless,
shareholders are still provided with the Annual Report in CD-ROM
format together with a summarised version of the Financial
Statements, Notice of AGM and Form of Proxy.
Relations Between the Company and Investors
TNB continually strives towards higher standards of disclosure and
corporate transparency by disseminating accurate and relevant
information to the marketplace expeditiously to help investors
make informed decisions, providing regular access to the Company’s
Management through one-on-one meetings (in-house meetings),
conferences, conference calls and briefings as well as meeting
investors’ growing demand for transparency and governance and
balancing that with commercial sensitivities of TNB’s business
operations. On top of that, developments of the International
Financial Reporting Standards (IFRS) convergence were
communicated to uphold transparency, ensuring that all
stakeholders are informed at all times.
The Investor Relations (IR) team has continued to engage with the
buy-side investors and sell-side analysts in order to provide them
with company updates. This is important as IR officers can gain
internal traction and secure access to key information flow and
understand the expectations of stakeholders. Fund managers
around the globe face ever-increasing challenges to obtain optimal
valuation. Hence, the Company’s engagement with fund managers
is vital as the latter will share their views on the factors affecting the
decision to invest.
Given current volatility, investors’ need for information has grown
and they seek to meet more frequently. Over the years, TNB’s IR has
strengthened its efforts to increase accessibility and visibility of the
Company’s management to analysts and investor groups. Various
communication platforms are offered to the financial fraternity by
the IR team, to ensure regular engagement with the institutional
investment community.
● Quarterly and Full Year Financial Results Announcements
TNB conducts media and analyst briefings at its headquarters
following its quarterly and full year financial results
announcements and subsequent to the release of disclosures
to Bursa Malaysia. The Company also hosts conference calls
during briefings to accommodate those who are not able to
attend as well as to enable the investment community at major
financial hubs worldwide to participate.
● Analyst Briefing Presentations
For the quarterly financial announcements, TNB presents
detailed financial statements and other key financial and
technical information of the Company in the form of
presentation slides, which help the analysts and investors
better understand the Group’s financial results and performance.
These slides are made available promptly on the Company’s
website under the IR portal following the release of the financial
results to Bursa Malaysia. At the same time, a copy of the
presentation slides is e-mailed to all analysts and investors on
IR’s distribution list.
● One-on-One & Group Meetings at Conferences
Regular participation at local and overseas conferences allows
TNB to reach out to local and foreign fund managers on
developments within the Group and emerging challenges.
112
TENAGA NASIONAL BERHAD (200866-W)
Acc
ount
abili
ty
Annual Report 2012
Statement of Corporate Governance

● Site Visits
Investors have grown more demanding and requested for
more site visits. Hence, as part of our continuous efforts to
ensure the financial community gets transparent information
and firsthand updates on the Company, during the year under
review, IR organised two (2) site visits. The first was a Malaysian
Industrial Development Finance (MIDF) visit to Jana Landfill
Sdn. Bhd., Puchong to provide better understanding of
electricity generation through a renewable energy plant. The
second was to the Tuanku Jaafar Power Station, Port Dickson
to observe the technical day-to-day operations of a gas-fired
power plant and its alternative fuel, distillate.
● In-house and External Meetings
With a strong domestic and foreign institutional shareholder
base, face time with Top Management is crucial to deliver
convincing Company’s message and views. The Management
and IR team frequently play host to local and international
fund managers and investors who request for meetings. During
these meetings, the fund managers and investors are updated
on the Company’s business operations and recent developments.
● Briefing and Dialogue Sessions
As part of IR’s annual programme and to provide a better
understanding of the Feed-in Tariff (FiT) to research analysts
and fund managers, a briefing session on the overview,
mechanism and prospect of FiT was held. The event was
organised in collaboration with the Sustainable Energy
Development Authority (SEDA), whose Chief Operating Officer
provided the audience with insights into FiT. A separate event
was held for analysts and fund managers to get to know TNB’s
incoming President/Chief Executive Officer. During this
dialogue, the audience was able to voice their queries and
views to Management and received immediate feedback.
Whistle-blowing Procedure
The Whistle-blowing procedure is a mechanism by which TNB
employees, contractors and members of the public are encouraged
to report serious issues relating to illegal, unethical or improper
conduct on a confidential basis, without fear of possible adverse
repercussion. An independent investigation team investigates all
reported concerns appropriately and will, where applicable, provide
feedback regarding the investigation’s outcome.
Complaints can be channeled online via http://wbis.tnb.com.my or
by calling the toll-free line at 1-800-888-862.
RESPONSIBILITY STATEMENT IN RESPECT OF THE FINANCIAL
YEAR UNDER REVIEW
(Pursuant to paragraph 15.26(a) of the MMLR)
The Board is fully accountable for ensuring the Audited Financial
Statements are prepared in accordance with the Companies Act,
1965 and the applicable approved accounting standards set out by
the Malaysian Accounting Standards Board so as to present a true
and fair view of the state of affairs of the Group and of the profit
or loss and cash flow as at the end of the accounting period.
In preparing the Audited Financial Statements, the Directors are
satisfied that the applicable approved accounting standards in
Malaysia have been complied with and reasonable and prudent
judgments and estimates have been made. The Audited Financial
Statements are also prepared on a going concern basis as the
Board has a reasonable expectation, after having made enquiries,
that the Group has adequate resources to continue its operational
existence for the foreseeable future.
113
KEEPING THE LIGHTS ON
Acc
ount
abili
ty
Annual Report 2012
Statement of Corporate Governance

ADDITIONAL COMPLIANCE STATEMENT
1. Utilisation of Proceeds Raised from Any Corporate Proposal
TNB Janamanjung Sdn. Bhd., a wholly owned subsidiary of
TNB, raised funds via Sukuk to pay for its Engineering,
Procurement and Construction (EPC) Contract. As of
31 August 2012, the Sukuk had raised RM4.850 million, of
which RM2,040.82 million was paid to the EPC contractor.
2. Share Buy-Back for the Financial Year
The Company did not propose any share buy-back during the
Financial Year under review.
3. Options, Warrants or Convertible Securities Exercised
During the Financial Year under review, 44,896,592 new
ordinary shares of RM1.00 each were issued by the Company
pursuant to the Employees’ Share Option Scheme II (ESOS II)
at exercise prices of RM4.45, RM5.06, RM5.08, RM5.36, RM5.45,
RM5.59, RM5.62, RM5.64, RM5.74, RM5.86, RM5.93, RM6.09,
RM6.24, RM6.40 and RM8.85 per share.
The new ordinary shares issued during the Financial Year
ranked pari passu in all respects with the existing ordinary
shares of the Company.
The Company has been granted exemption by the Companies
Commission of Malaysia via a letter dated 8 October 2012
from having to disclose in the Audited Financial Statements
the names of the persons to whom options have been
granted during the Financial Year and details of their holdings
pursuant to Section 169 (11) of the Companies Act, 1965
except for information on employees who were granted
options representing 756,000 ordinary shares or more.
The employee who was granted options representing 756,000
ordinary shares or more under ESOS II is set out on page 219
in this Annual Report.
4. American Depository Receipts (ADR)
In January 1994, TNB launched its Level 1 American Depository
Receipts (ADR) in New York, USA. Each ADR carries an equivalent
of four (4) underlying TNB shares. The only custodian bank for
TNB’s ADR programme is Malayan Banking Berhad. The Bank of
New York in the USA is the depository bank and the ADRs are
traded over the counter. As at 31 August 2012, a total of
5,013,848 ordinary shares were held through these ADRs,
which represented less than 5% of the issued and paid-up
capital of the 5,501,553,731 shares of TNB.
5. Imposition of Sanctions and/or Penalties
Neither the Company nor any of its subsidiaries, Directors or
Management was imposed with any sanction and/or penalty
by the relevant regulatory bodies in the Financial Year ended
31 August 2012.
6. Non-Audit Fees
The Group’s non-audit fees payable to the external auditors,
Messrs PricewaterhouseCoopers, for the Financial Year
ended 31 August 2012 amounted to RM639,147.00 and
PKR1,432,910.00.
7. Variation in Results
The Group did not issue any profit forecast for the Financial
Year ended 31 August 2012.
8. Profit Guarantee
The Group did not issue any profit guarantee for the Financial
Year under review.
114
TENAGA NASIONAL BERHAD (200866-W)
Acc
ount
abili
ty
Annual Report 2012
Statement of Corporate Governance

9. Material Contracts
Save as disclosed below, the Group and/or its subsidiaries did
not enter into any material contracts involving the interest of
the Directors or Major Shareholders which are still subsisting
as at 31 August 2012:
Lender Lembaga Kumpulan Wang Simpanan
Pekerja (KWSP)
Borrower Tenaga Nasional Berhad
Borrower/Lender
Relationship
KWSP is one of the Major Shareholders
in TNB (approximately 13.88% as at
22 August 2012)
Purpose of Loan Refinancing
Amount An aggregate of RM2,800 million
Details of facility Facility I – RM700.0 million
Facility II – RM700.0 million
Facility III – RM700.0 million
Facility IV – RM350.0 million
Facility V – RM350.0 million
Interest Rate Facility I – 5.45%
Facility II – 5.50%
Facility III – 5.60%
Facility IV – 5.65%
Facility V – 5.70%
Payment terms Interest Payment
30 June and 31 December each
calendar year
Principal repayment
Facility I – 31 December 2019
Facility II – 31 December 2020
Facility III – 31 December 2021
Facility IV – 31 December 2024
Facility V – 31 December 2025
10. Related Party Transactions
The Group has established appropriate procedures to ensure
it complies with MMLR with regard to related party
transactions. All related party transactions are reviewed by
the Group Internal Audit (GIA), following which a Group-Wide
Report is submitted to the BAC on a quarterly basis for
monitoring purposes.
The Group did not seek any mandate of its shareholders
pertaining to related party transactions during the Financial
Year under review.
STATEMENT ON COMPLIANCE WITH THE REQUIREMENTS OF
BURSA MALAYSIA IN RELATION TO APPLICATION OF PRINCIPLES
AND ADOPTION OF BEST PRACTICES LAID DOWN IN THE
MALAYSIAN CODE OF CORPORATE GOVERNANCE
(Pursuant to paragraph 15.25 of the MMLR)
The Board is pleased to report to its shareholders that the Group has
complied with and shall remain committed to attaining the highest
possible standards through the continuous adoption of the principles
and best practices of the Code and all other applicable laws.
Signed on behalf of the Board in accordance with their resolution
dated 31 October 2012.
Dato’ Zainal Abidin bin Putih
Senior Independent Non-Executive Director
115
KEEPING THE LIGHTS ON
Acc
ount
abili
ty
Annual Report 2012
Statement of Corporate Governance

BOARD RESPONSIBILITY
The Board of Directors (Board) is responsible for the system of
internal control at Tenaga Nasional Berhad Group (the Group).
The system is designed to safeguard shareholders’ investments,
the interest of customers, regulators and employees and the
Group’s assets.
The system of internal control covers risk management, finance,
operations, management information systems and compliance
with the relevant laws, regulations, policies and procedures. The
system is designed to manage rather than eliminate risk that may
impede the attainment of the Group’s business objectives. Thus,
the system only provides reasonable but not absolute assurance
against material misstatement, loss or fraud.
The Board has set a framework in place for identifying, evaluating
and managing significant risks faced by the Group, except for
associate companies and joint ventures which are not under the
control of the Group. The framework and risk management
processes are reviewed regularly by the Board, and are in line with
the Statement on Internal Control: Guidance for Directors of Public
Listed Companies.
The Board is assisted by Management to ensure that internal
controls and risk management practices are implemented within
the Group.
RISK MANAGEMENT
The Board approved the set-up of the Enterprise Wide Risk
Management (EWRM) function in 2003. An EWRM framework
guides risk management processes and incorporates the
assessment, reporting, treatment, monitoring and reviewing of
strategic and operational risks within the Group. The Board Audit
Committee (BAC) reviews the effectiveness of the EWRM functions
and deliberates on the risk reports issued and the risk management
activities undertaken during the year. The BAC is assisted by the
Group Risk Management Committee, Group Risk Management
Working Committee, Chief Risk Officer, Planning Division, EWRM
Department and operations staff to effectively embed a risk
management culture within the Group.
The EWRM Department works with the Group Internal Audit (GIA)
Department to provide assurance on the adequacy and
effectiveness of the EWRM system in mitigating and managing
risks faced by the Group. In the year under review, the EWRM
Department undertook the following initiatives to enhance EWRM
implementation within the Group:
● Conducted two (2) risk management forums and 29 risk
awareness and review sessions in TNB divisions, departments
and subsidiaries.
● Conducted six (6) two-days risk management training sessions
as part of the New Executive Training Programme.
● Conducted 11 Risk Management & Compliance Reviews to
establish the adequacy of the TNB Risk Information System
(TRIS) and the effectiveness of identified mitigation controls.
● Implemented the TRIS Helpdesk for better management of
queries/feedback.
CONTROL STRUCTURES
The Board has established control structures and is committed to
evaluating, enhancing and maintaining these to ensure effective
strategic and operational control over the Group’s business
operations. The following key control structures are in place to
assist the Board to maintain a proper control environment:
Board and Management Committees
To promote corporate governance, transparency and accountability,
the Board has set up Board and Management Committees to assist in
accomplishing the vision, mission, strategies and objectives set for the
Group. The Committees oversee the areas assigned to them under
their Terms of Reference. The Committees play an important role in
directing, monitoring and ensuring that the plans and operations are
in accordance with the Group’s policies and its approved long-term
and short-term business plans. The Committees are:
116
TENAGA NASIONAL BERHAD (200866-W)
Acc
ount
abili
ty
Annual Report 2012
Statement of Internal Control

Organisation Structure
The Board has implemented a divisional structure for the Group.
Clear lines of authority, responsibility and accountability have been
established to support the Group in achieving its vision, mission,
strategies and operational objectives. The divisional structure
enhances the ability of each division to focus on its assigned core
or support functions within the Group.
The Board also reviews and refines the effectiveness of the Group’s
organisation and control structures to enhance the Group’s ability
to achieve its strategic and operational objectives and manage
challenges in its operating environment. In September 2012, the
Board approved the restructuring of the organisation to enhance
its effectiveness in achieving its short and long-term objectives.
The changes were as follows:
● The Chief Operating Officer (COO) position was abolished when
the former COO became the President/Chief Executive Officer.
● A new division, New Business and Major Projects, was
established. The Business Development Department, Generation
Asset Development Department, Investment Management
Department and TNB Repair and Maintenance Sdn. Bhd. are
placed in this division.
● A new department, Strategic Management & Performance, was
established.
● The Corporate Services Division and Corporate Affairs Division
were merged to become the Corporate Affairs & Services
Division.
Management Information Systems
The Board recognises the importance of leveraging on information
and communication technology to promote effective and
efficient business operations, timely and accurate communication
with stakeholders, and enhance the Group’s performance in the
long term.
The major systems used by the Group are:
● Enterprise Resource Management System (ERMS)
● eCustomer Information & Billing System (eCIBS)
● Enterprise Human Resources Management System (EHRMS)
● Supervisory Control and Data Acquisition System (SCADA)
● Remote Meter System (RMR)
● Employee Self Service (ESS)
● TNB Outage Management Systems (TOMS)
● Corporate Geospatial Information System (CGIS)
For the Corporate Geospatial Information System (CGIS),
four modules have been rolled out in the Financial Year, bringing
the total number of operational modules to date to 20.
The project spans ten (10) years with 50 modules at the end of the
project period.
TNB initiated a Supply Change Management System during the
Financial Year and is in the final stages of implementing the
following modules within the system:
● Supplier Relationship Management (SRM)
● Contract Lifecycle Management (CLM)
● Spend Performance Management (SPM)
Group Policies and Procedures
The Board has approved policies and procedures to govern the
financial and operational functions, and ethics of the Group. The
policies ensure that ethics and internal control principles and
mechanisms are embedded in operations. This enables the Group
to respond quickly to evolving risks and immediately report on any
significant control failure. The policies and procedures are also
reviewed on a regular basis to ensure relevance and effectiveness.
Board Committees Management Committees
● Audit Committee
● Tender Committee
● Disciplinary Committee
● Nomination & Remuneration Committee
● Finance & Investment Committee
● Group Executive Council Committee
● Group Executive Management Committee
● Energy Supply Committee
● Group Management Tender Committee
● Group Risk Management Committee
● Commodity Procurement Executive Committee
● Information and Communication Technology Governance Council
● Incentive Based Regulation Council
117
KEEPING THE LIGHTS ON
Acc
ount
abili
ty
Annual Report 2012
Statement of Internal Control

Among others, the policies and procedures implemented are:
● Internal Control Guidelines
● Group Financial Policies & Procedures
● Treasury Policy
● Safety & Health Policy
● Environmental Policy
● Investment Policy
● Procurement Policy & Procedures (PP&P)
● Anti-Fraud Policy
● Disciplinary Policy & Procedures
● Information & Communication Policy & Codes of Practice
● Enterprise Wide Risk Management Policy & Guidelines
● Limits of Authority
● Code of Ethics
● Procurement Code of Conduct
● Whistle Blowing Procedures
During the year, the Group Procurement Division undertook
several initiatives to improve internal control in the procurement
process, as follows:
● PP&P training module for Executives and Non-Executives
● PP&P Dissemination Roadshow Programme
● Revision of circulars relating to Procurement Procedures &
Processes, Tenders and Contracts
● Implementation of Procurement Compliance Review
● Mandatory Annual Assessment of Vendors
● Procurement Risk Profile Review
Talent Management and Development
The Board acknowledges the importance of having leaders with
technical and management capabilities to steer the Company
forward. A structured talent management framework has been
established at both Company and Divisional levels to identify and
develop the workforce to achieve the Group’s strategic objectives.
Development programmes were designed to prepare talents for
positions of greater responsibility and expose them to the
challenges these entail. In the Financial Year 2012, besides
classroom training and project assignments, talents underwent
experiential learning through job attachments and secondments.
Revenue Assurance Department
On 7 August 2009, the Revenue Assurance Department (RAD) was set
up following the Board’s approval. Its role is to curb meter installation
tampering (MIT) and curtail revenue leakages from billing, metering
and administrative errors. RAD is also responsible for improving MIT
internal control mechanisms and ensure process compliance.
MONITORING & REVIEW
Board Interactions with Management via Breakout Sessions
The Board interacts actively with Management during breakout
sessions to discuss and review the Group’s plans, strategies,
performance and risks faced by the Group. During the year, one (1)
Board Breakout and two Subsidiary Breakout Sessions were held.
The Board Breakout Session provides a monitoring and review
mechanism to enhance the Board’s effectiveness and enable
Management to seek mandates to address risks faced in its internal
and external environment. The Subsidiaries Breakout Sessions
serve to enhance interaction between TNB and its subsidiaries, and
to assist in aligning subsidiaries’ policies and procedures to the
Group’s policies and procedures.
Business Planning and Budgeting
The Board approved the implementation of a 20-Year Strategic
Plan starting from 2005 until 2025. The 20-Year Strategic Plan is
divided into four phases to steer the Group towards its vision of
becoming a leading corporation in energy and related businesses
globally. Each phase comprises a Five-Year Strategic Plan.
The Group’s second phase of the Five-Year Strategic Plan, from
2011-2015 (i.e. Gemilang 2015), is geared towards Geographical
Expansion. It guides Management in preparing their Annual
Operating Plans, Key Performance Indicators (KPIs) and budgets.
The strategies identified in the 20-Year Strategic Plan, Five-Year
Strategic Plans and Annual Operating Plans as well as KPIs are
reviewed, approved and monitored by the Board. Progress reports
of the Five-Year Strategic Plans are presented and deliberated
during the Board and Management Breakout sessions.
Long-Term System Planning and Development
The Board is involved in reviewing and approving Long-Term
System Planning and Development. The Planning Division carries
out long-term system planning and development of the electricity
supply infrastructure, specifically generation capacity development
and transmission infrastructure development to cater for load
demand. The long-term load forecasts take into consideration
changes in the economic climate and are monitored closely to
response to the load demand situation.
For generation capacity planning and development, the Planning
Division works closely with the Energy Commission to present the
load forecast and generation development plans. These plans are
endorsed by the Jawatankuasa Perancangan, Pembangunan dan
Perlaksanaan Tariff or JPPPET (Planning, Development and Tariff
Implementation Committee) which is chaired by the Minister of
Energy, Green Technology & Water (KeTTHA). The Board keeps
abreast of generation developments. Generation expansion plans
118
TENAGA NASIONAL BERHAD (200866-W)
Acc
ount
abili
ty
Annual Report 2012
Statement of Internal Control

formulated for Peninsular Malaysia take into account long-term
energy security vis-à-vis the diversification of fuel resources,
generation plant type and global energy outlook scenarios.
As for transmission expansion plans, these are submitted by the
Planning Division based on the Malaysian Grid Code, Transmission
System Reliability Standards and TNB License Conditions.
The transmission plans are justified and approved by the Energy
Supply Committee at Management level before final approval by
the Board.
The above activities were carried out with effect from 1 September
2011, according to the requirements set in the new Licensee
Supply Regulations 1990 (Amendment 2002).
Financial and Operational Review
The BAC reviews the Group’s quarterly financial performance
together with Management, and these are subsequently reported
to the Board. The quarterly reviews enable the BAC to deliberate
and assess the Group’s financial results and operational
performance. Monthly management accounts, which serve as a
monitoring tool, are also circulated to the Board and key
Management to provide information on key financial results,
operational performance indicators and budget variances to enable
them to monitor and contribute towards improving performance.
The BAC also reviews and monitors the imminent implementation
of the Malaysian Financial Reporting Standards (MFRS) Framework
initiated by the Group Finance Division.
Division Compliance Departments/Units
The Board approved the set-up of Compliance departments, units
and taskforces at the EWRM Department and Generation,
Transmission, Distribution, Group Finance and ICT Divisions. During
the Financial Year, a new taskforce was established within Group
Human Resources. The Compliance departments, units and
taskforces ensure that operations adhere to approved policies and
procedures, and enhance control consciousness.
Group Internal Audit (GIA)
The GIA was set up by the Board to provide independent assurance
of the adequacy of risk management, internal control and
governance systems. GIA activities are guided by an Internal Audit
Charter which is approved by the BAC.
GIA carries out regular reviews of business processes to assess the
adequacy and effectiveness of internal controls, compliance with
regulations and the Group’s policies and procedures, and highlight
significant risks and control weaknesses affecting the Group.
GIA also performs strategic review/consultancy services where
relevant to assist entities to improve their operational performance.
Ad hoc appraisals, investigations or reviews are also conducted as
and when requested by the Board, BAC and Management.
BAC meetings are held regularly to deliberate audit findings,
management response, corrective actions, and to monitor actions
taken by Management in areas with significant control weaknesses.
Follow-up audits are conducted to review the adequacy and
effectiveness of corrective actions taken by Management on all
significant matters raised. A certain percentage of KPIs is allocated
to each Division Head for completion of corrective actions taken
by Management. The achievement of the Corrective Action KPIs by
each Division is deliberated during the BAC meeting.
GIA has an independent status in the Group and reports functionally
to the Board through the BAC. GIA’s annual audit plans, budgets,
competency and resources are reviewed and approved by the BAC.
This is to ensure the adequacy of coverage of significant and
high-risk areas and adequacy of resources. The BAC also approves
the GIA’s outsourcing and co-sourcing of internal audit assignments
to facilitate transfer of knowledge from consultants in areas where
technical skills are not available internally.
CONCLUSION
For the Financial Year under review, some weaknesses in internal
control were detected. However, after due and careful inquiry, and
based on the information and assurance provided, the Board is
satisfied that all necessary actions and enhancements in control
systems have been taken to address the weaknesses detected.
Nevertheless, for areas requiring attention, measures have been
and are being taken to ensure on-going adequacy and effectiveness
of internal control and to safeguard shareholders’ investments and
the Group’s assets.
This statement is made in accordance with the resolution of the
Board of Directors dated 31 October 2012.
119
KEEPING THE LIGHTS ON
Acc
ount
abili
ty
Annual Report 2012
Statement of Internal Control

The Board Audit Committee (BAC) was established on 9 December 1990 by the Board of
Directors to assist the Directors to carry out their responsibilities. The BAC is guided by its
Terms of Reference which are set out on pages 125 to 128 of the Annual Report.
MEMBERSHIP AND MEETINGS
The BAC members and details of their attendance at the BAC meetings held during the Financial Year are as
follows:
1. Dato’ Zainal Abidin bin Putih
Chairman
Senior Independent Non-Executive Director
2. Tan Sri Dato’ Hari Narayanan
a/l Govindasamy
Independent Non-Executive Director
3. Dato’ Abd Manaf bin Hashim
Independent Non-Executive Director
4. Datuk Chung Hon Cheong
Independent Non-Executive Director4
1 2
3
No. Name Status of Directorship Independent
No. of Meetings
Attended
1. Dato’ Zainal Abidin bin Putih
Chairman
Non-Executive Director Yes
(Senior Independent)
14/14
2. Tan Sri Dato’ Hari Narayanan
a/l Govindasamy
Member
Non-Executive Director Yes 12/14
3. Dato’ Abd Manaf bin Hashim
Member
Non-Executive Director Yes 14/14
4. Datuk Chung Hon Cheong
Member
Non-Executive Director Yes 12/14
120
TENAGA NASIONAL BERHAD (200866-W)
Acc
ount
abili
ty
Annual Report 2012
Board Audit Committee Report

While BAC’s Terms of Reference require the Committee to meet
six (6) times a year, BAC met 14 times during the Financial Year.
The Chief Internal Auditor and Company Secretary who is also the
secretary to BAC were in attendance during the meetings. The
President/Chief Executive Officer and other officers were invited to
the meetings to deliberate on matters within their purview.
After each meeting, the BAC Chairman submits a report on matters
deliberated to the Board of Directors for their information and
attention. Action sheets are issued by the Company Secretary on
the decisions made and actions required. These are circulated to
Management for their action.
SUMMARY OF ACTIVITIES OF THE BOARD AUDIT COMMITTEE
A summary of the activities carried out by the BAC during the
Financial Year is set out below:
Risk Management
● Reviewed the TNB Strategic Risks Report, TNB Biannual Risk
Assessment Reports and the activities undertaken by the
Enterprise Wide Risk Management Department to promote and
improve risk management awareness and processes.
Internal Audit
● Reviewed and approved Group Internal Audit (GIA)’s structure,
budget and Annual Audit Plan to ensure adequacy of resources,
competencies and coverage of auditable entities with significant
and high risks.
● Reviewed internal audit reports issued by GIA and external
parties on the effectiveness and adequacy of governance, risk
management, operational and compliance processes.
● Reviewed the adequacy and effectiveness of corrective actions
taken by Management on all significant matters raised.
● Reviewed the Quality Assurance Review Report on the internal
audit function carried out by an external consultant.
● Deliberated the results of ad-hoc investigations performed and
confirmed that appropriate actions were taken to correct the
weaknesses.
● Reviewed and approved the appointment of consultants for
co-sourced audits in technical areas.
● Reviewed the Terms of Reference, list of consultants, timeframe
and budget for consultancy fees for TNB’s Management &
Engineering Audit 2012.
● Assessed the performance of the Group Internal Audit
Department.
● Reviewed the Key Performance Indicators achieved by Division
Heads in completing corrective actions.
External Audit
● Reviewed and approved the External Auditor’s audit plan and
the scope of the annual audit.
● Deliberated and reported the results of the annual audit to the
Board of Directors.
● Assessed the performance of the External Auditors and
recommended their appointment and remuneration to the
Board of Directors.
● Met with the External Auditors without the presence of
Management to discuss matters that they wishes to present.
Financial Results
● Reviewed the Quarterly and Annual Financial Statements of the
Company and Group including announcements, and
recommended them to the Board for approval.
Related Party Transactions
● Reviewed the system for identifying, monitoring and disclosing
related party transactions for TNB and its subsidiaries.
Annual Reporting
● Reviewed and recommended the Statement on Corporate
Governance, Statement on Internal Control, Board Audit
Committee Report, Statement of Internal Audit Function,
Report on Related Party Transactions and Recurrent Related
Party Transactions and Corporate Social Responsibility Report
to the Board for approval.
121
KEEPING THE LIGHTS ON
Acc
ount
abili
ty
Annual Report 2012
Board Audit Committee Report

Others
● Reviewed and approved the allocation of options granted
under the Employees’ Share Option Scheme (ESOS) during the
Financial Year against the provisions set out under the
Company’s Scheme.
● Reviewed the implementation of initiatives under the Malaysian
Financial Reporting Standards (MFRS) Framework.
● Conducted two (2) Subsidiary Board Breakout Sessions with the
Top Management and Boards of Subsidiaries to discuss
subsidiaries’ related matters and the streamlining of subsidiaries’
policies and procedures against TNB’s policies and procedures.
● Reviewed the customisation of policies and procedures of
TNB’s subsidiaries.
● Visited the Tuanku Jaafar Power Station to enhance awareness
of operations and provided feedback to Management on areas
requiring improvement.
GROUP INTERNAL AUDIT
The BAC is assisted by the GIA Department in the discharge of its
duties and responsibilities. GIA is independent of operations, with
the primary responsibility of providing reasonable assurance to the
BAC that the system continues to operate effectively within the
Group through regular and systematic reviews of internal control.
GIA’s role includes evaluation and contribution to the improvement
of governance, strategic management, risk management, financial
and operational controls, compliance with established procedures,
laws and regulations, and reliability and integrity of information.
GIA uses a risk-based approach to prioritise internal audit activities,
consistent with the Group’s strategies.
During the Financial Year, a total of 202 reports covering
337 assignments were issued. The areas reviewed included
generation, transmission, distribution, procurement, engineering,
projects, finance, corporate governance, human resources, logistics,
information and communication technologies, investment in
subsidiaries and risk management.
The internal audit reports issued to Management included advice
and recommendations on best practices (wherever appropriate)
that add value to the Group. Management is required to respond
on corrective and preventive actions as well as deadlines to
complete the actions. The reports were tabled to the BAC for
deliberation. Management were present during the deliberation of
the reports to ensure that they carry out preventive and corrective
actions on the weaknesses reported.
Dato’ Zainal Abidin bin Putih
Chairman
Board Audit Committee
Tenaga Nasional Berhad
(Senior Independent Non-Executive Director)
122
TENAGA NASIONAL BERHAD (200866-W)
Acc
ount
abili
ty
Annual Report 2012
Board Audit Committee Report

The Group Internal Audit Department (GIA) carries
out the internal audit function of Tenaga Nasional
Berhad (TNB). GIA was established to support the
Board, through the Board Audit Committee (BAC)
to discharge its responsibilities in maintaining a sound
system of internal control to safeguard shareholders’
investment, the interest of stakeholders and the
Group’s assets.
GIA reports functionally to the BAC and
administratively to the Chief Executive Officer.
GIA’s authority, scope and responsibilities are
governed by an Internal Audit Charter.
MISSION/OBJECTIVES
GIA’s mission is to provide objective and independent assurance of
the Group’s system of internal control, through the following:
● Preparing and implementing a risk-based strategic annual audit
plan which covers the auditable entities within the organisation.
● Reviewing the adequacy and effectiveness of governance, risk
management, strategic management and control processes
established by the Group to manage its risks and operations.
● Reporting internal control weaknesses and recommending
preventive/corrective actions to improve operations, enable
accurate reporting, safeguard assets and promote the economic
utilisation of resources.
● Monitoring the implementation of corrective actions to
ascertain their adequacy and the ability of the auditable entities
to strengthen internal control in their areas of operation.
RESOURCES
GIA is structured into core and non-core units. The audit coverage
includes the functions of governance, risk management and review
of control in the areas of generation, transmission, distribution,
procurement, projects, engineering, accounting and finance,
human resources, information and communication technologies
(ICT) and investment in subsidiaries.
During the Financial Year, GIA issued 202 reports arising from the
performance of 140 planned jobs, eight (8) ad hoc jobs and 189
follow-up audits on corrective actions. One (1) planned audit was
co-sourced to an external consultant and the rest were performed
in-house by GIA.
GIA has a total of 122 auditors, comprising staff from various
backgrounds in engineering, finance, business, accounting, ICT and
quantity surveying. During the Financial Year, 39 staff joined while
13 staff left the department. The BAC is informed of promotions
and movements of GIA personnel.
In the Financial Year 2012, GIA spent a total of RM15.8 million.
70% of which was for staff related costs, 25% for other operating
costs and 5% for consultancy fees.
COMMITMENT TO COMPETENCE
Total training costs for the Financial Year 2012 was RM235,546.00.
GIA staff are sent for training in the areas of auditing skills, technical
skills, business acumen, strategic management and personal
development.
At the same time, staff are encouraged to take Certified Internal
Audit examinations to become Certified Internal Auditors (CIA).
They are provided with incentives such as allowances and
reimbursement of examination and registration fees when they
pass the CIA examinations. During the year, two (2) staff completed
the examination, bringing the total number of Certified Internal
Auditors in GIA to seven (7). Meanwhile, 23 staff are pursuing the
CIA qualification.
GIA won the 2012 Corporate Award – 3rd Place, Category 2 for
demonstrating strong commitment to the Certified Internal Auditor
Program for the period of January 2011 to December 2011 from
The Institute of Internal Auditors Malaysia. This is the 5th consecutive
year that GIA has won awards. The earlier four (4) awards were for
strong commitment to Continuous Professional Development
whilst the latest award is for strong commitment to the Certified
Internal Auditor Program.
123
KEEPING THE LIGHTS ON
Acc
ount
abili
ty
Annual Report 2012
Statement on Internal Audit Function

INITIATIVES/IMPROVEMENTS
GIA carried out the following initiatives/improvements during the
financial year:
i. Provided training for staff from the Group to enable them to
better understand systems, processes and controls, and
enhance operational systems and process controls.
ii. Provided advice on the set up of compliance units in
subsidiaries.
iii. Coordinated the Management & Engineering (M&E) Audit
2012 for TNB and assisted in the review of the Terms of
Reference for the M&E Audit 2012 for TNB, Sabah Electricity
Sdn. Bhd., Kapar Energy Ventures Sdn. Bhd. and TNB
Janamanjung Sdn. Bhd.
iv. Implemented Control Objectives for Information and Related
Technology (COBIT) by the ICT Audit Unit for information
technology audits.
v. Initiated formal training on governance, risk management
and compliance and internal auditing for TNB staff, in
collaboration with the Institute of Internal Auditors Malaysia
and ILSAS.
vi. Implemented job rotation to enable GIA staff to broaden
their exposure and skills. Priority is given to Senior Executives
and those who have requested for a rotation/transfer to
other units.
vii. Set up a database on customer satisfaction survey results to
enable analysis of results to improve GIA’s services.
viii. Revised the Quality Assurance Improvement Programme
(QAIP) arising from the Quality Assurance Review of the
internal audit function by an external party.
ix. Introduced a risk weighting system to prioritise audit areas in
the Core Business Audit Units.
x. Provided half-yearly reports on the implementation of the
Annual Audit Plan to enable monitoring by the BAC.
xi. Use of the IDEA system for continuous auditing by the
Distribution Audit Unit.
GIA is committed to providing objective and independent
assurance as well as value-added services to its customers in
accordance with the International Professional Practices Framework
on Internal Auditing.
Dato’ Zainal Abidin bin Putih
Chairman
Board Audit Committee
Tenaga Nasional Berhad
(Senior Independent Non-Executive Director)
124
TENAGA NASIONAL BERHAD (200866-W)
Acc
ount
abili
ty
Annual Report 2012
Statement on Internal Audit Function

1. CONSTITUTION
1.1 The Board of Directors of Tenaga Nasional Berhad (TNB),
in accordance with Article 146 of the Memorandum and
Articles of Association of TNB, established a Committee
of the Board, known as the Board Audit Committee
(BAC), vide Minute No. 39/90 on 9 October 1990.
1.2 The function and authority of the BAC extend to TNB
and all its subsidiaries, joint ventures and associates
where management responsibility is vested to TNB or its
subsidiaries (collectively referred to as the “Group”).
2. COMPOSITION OF THE COMMITTEE
2.1 Members of the BAC shall be appointed by the Board of
Directors of TNB and shall consist of not less than three
Directors, all of whom must be Non-Executive Directors,
with the majority being independent, in accordance
with the Bursa Malaysia Listing Requirements.
2.2 Where the members for any reason are reduced to less
than three, that Board shall within three months of the
event, appoint such number of new members as may be
required to make up the minimum number of three
members.
2.3 At least one member of the Committee must meet the
criteria set by the Bursa Malaysia Listing Requirements, i.e.:
i. must be a member of the Malaysian Institute of
Accountants or
ii. if he/she is not a member of the Malaysian Institute
of Accountants, he must have at least three years’
working experience, and:
a. must have passed the examinations specified
in Part 1 of the 1st Schedule of the Accountants
Act 1967; or
b. must be a member of one of the associations
of accountants specified in Part II of the 1st
Schedule of the Accountants Act 1967.
2.4 The Board shall elect a Chairman from the Committee
who shall be an Independent Director as set out in the
Bursa Malaysia Listing Requirements.
2.5 The term of office and performance of the Committee
shall be reviewed by the Board to determine whether
the Committee has carried out its duties in accordance
with its terms of reference.
2.6 No alternate Directors shall be appointed to the BAC.
3. CHAIRMAN OF THE COMMITTEE
3.1 The following are the main duties and responsibilities of
the Chairman of the Committee:
3.1.1 to steer the Committee to achieve its objectives;
3.1.2 to provide leadership to the Committee and
ensure proper flow of information to the
Committee, review adequacy and timing of
documentation;
3.1.3 to provide a reasonable time for discussion at the
Committee meetings, organise and present the
agenda for Committee meetings based on input
from members, and ensure that all relevant issues
are on the agenda. In addition, the Chairman
should encourage a healthy level of skepticism
and independence;
3.1.4 to ensure that consensus is reached on every
Committee resolution and, where considered
necessary, call for a vote for the decision to be
made by a simple majority. Dissenting opinions
should be captured;
3.1.5 to manage the process and working of the
Committee and ensure that the Committee
discharges its responsibilities;
3.1.6 to ensure that all members participate in the
discussion to enable effective decisions to be
made; and
3.1.7 to be available to answer questions about the
Committee’s work at the Annual General Meeting
of the company.
4. COMMITTEE MEMBERS
4.1 Each Committee member is expected to:-
4.1.1 provide independent opinions to the fact-finding,
analysis and decision-making process of the
Committee, based on his/her experience and
knowledge;
4.1.2 consider viewpoints of the other Committee
m e m b e r s , a n d m a k e d e c i s i o n s a n d
recommendations in the best interest of the Group;
4.1.3 keep abreast of the latest corporate governance
guidelines in relation to the Committee and the
Board as a whole; and
4.1.4 continuously seek out best practices in terms of
the processes utilised by the Committee, following
which these should be discussed with the rest of
the Committee for possible adoption.
125
KEEPING THE LIGHTS ON
Acc
ount
abili
ty
Annual Report 2012
Terms of Reference of The Board Audit Committee

5. OBJECTIVES OF THE COMMITTEE
The objectives of the Committee are:
5.1 to ensure transparency, integrity and accountability in
the Group’s activities so as to safeguard the rights and
interests of the shareholders;
5.2 to provide assistance to the Board in fulfilling its fiduciary
responsibilities relating to corporate accounting and
reporting practices;
5.3 to improve the Group’s business efficiency, the quality of
the accounting and audit function and strengthen public
confidence in the Group’s reported financial results;
5.4 to maintain, through regularly scheduled meetings, a
direct line of communication between the Board and
the External and Internal Auditors;
5.5 to ensure the independence of the external and internal
audit functions; and
5.6 to create a climate of discipline and control which will
reduce the opportunity for fraud.
6. AUTHORITY OF THE COMMITTEE
The Committee is authorised by the Board to:
6.1 investigate any activity within its Terms of Reference, or
as directed by the Board of Directors;
6.2 determine and obtain the resources required to perform
its duties, including approving the budget for the
external and internal audit functions;
6.3 have full and unrestricted access to all employees, the
Group’s properties and works, to all books, accounts,
records and other information of the Group in whatever
form;
6.4 have direct communication channels with external
auditors and person(s) carrying out the internal audit
function or activity for the Group;
6.5 direct the internal audit function in the Group;
6.6 approve the appointment of the Head of Internal Audit;
6.7 engage independent advisers and to secure the
attendance of outsiders with relevant experience and
expertise if considered necessary; and
6.8 review the adequacy of the structure and Terms of
Reference of the Board Committees, including the BAC.
7. FUNCTIONS OF THE COMMITTEE
The functions and responsibilities of the Committee are as
follows:
7.1 Corporate Financial Reporting
7.1.1 To review and recommend acceptance or
otherwise of accounting policies, principles and
practices.
7.1.2 To review the quarterly results and annual
financial statements of the Company and Group
before submission to the Board. The review
should focus primarily on:
i. any changes in the existing accounting
policies or implementation of new accounting
policies;
ii. major judgment areas, significant and
unusual events;
iii. significant adjustments resulting from audit;
iv. the going concern assumptions;
v. compliance with accounting standards; and
vi. compliance with Bursa Malaysia Listing
Requirements and other legal and statutory
requirements.
7.1.3 To review with Management and the external
auditors the results of the audit, including any
difficulties encountered.
7.1.4 To review and verify the allocation of scheme
options pursuant to the company’s Employee
Share Option Scheme (ESOS) in accordance with
the Bursa Securities Listing Requirements as to
provide a statement in the annual report.
7.2 Enterprise Wide Risk Management
7.2.1 To review the adequacy, and to provide
independent assurance to the Board, of the
effectiveness of the risk management functions in
the TNB Group.
7.2.2 To ensure that the principles and requirements of
managing r isk are consistently adopted
throughout the TNB Group.
7.2.3 To deliberate on the key risk issues highlighted by
the Group Risk Management Committee in their
reports to BAC.
126
TENAGA NASIONAL BERHAD (200866-W)
Acc
ount
abili
ty
Annual Report 2012
Terms of Reference of The Board Audit Committee

7.3 Internal Control
7.3.1 To assess the quality and effectiveness of the
system of internal control and the efficiency of
the Group’s operations.
7.3.2 To review the findings on internal control in the
Group by the internal and external auditors.
7.3.3 To review and approve the Statement on Internal
Control for the annual report as required under
Bursa Malaysia Listing Requirements.
7.4 Internal Audit
7.4.1 To approve the Corporate Audit Charter of the
internal audit function in the Group.
7.4.2 To ensure that the internal audit function has
appropriate standing in the Group and has the
necessary authority, resources and competency to
carry out its work. This includes a review of the
organisational structure, resources, budgets and
qualifications of the internal audit personnel.
7.4.3 To review internal audit reports and Management’s
response and actions taken in respect of these.
Where actions are not taken within an adequate
timeframe by Management, the BAC will report
the matter to the Board.
7.4.4 To review the adequacy of internal audit plans
and the scope of audits, and ensure that the
internal audit functions are carried out without
any hindrance.
7.4.5 To appraise the performance of the Head of
Internal Audit.
7.4.6 To be informed of resignations and transfers of
senior internal audit staff and provide resigning/
transferred staff an opportunity to express their
views.
7.4.7 To direct any special investigation to be carried
out by internal audit.
7.4.8 To review and approve the Statement on Internal
Audit Function required under Bursa Malaysia
Listing Requirements.
7.5 External Audit
7.5.1 To nominate the external auditors together with
such other functions as may be agreed to by the
Board and recommend for approval of the Board
the external audit fee, and consider any question
of resignation or termination.
7.5.2 To review the external audit reports and
Management’s response and actions taken in
respect of these. Where actions are not taken
within an adequate timeframe by Management,
the BAC will report the matter to the Board.
7.5.3 To review the external audit’s plans and scope of
work.
7.5.4 The BAC shall meet the external and internal
auditors or both at least twice a year to discuss
problems and reservations arising out of audits
and any matters the auditors may wish to discuss,
in the absence of Management, Executive
Directors or Non-Independent Directors where
necessary.
7.6 Corporate Governance
7.6.1 To review the effectiveness of the system for
monitoring compliance with laws and regulations
and the results of Management’s investigation
and follow-up (including disciplinary action) of
any instances of non-compliance.
7.6.2 To review the findings of any examinations by
regulatory authorities.
7.6.3 To review any related party transaction or conflict
of interest situation that arises within the Group,
including any transaction, procedure or course of
conduct that raises questions of integrity.
7.6.4 To review and approve the Statement of Corporate
Governance for the annual report as required
under Bursa Malaysia Listing Requirements.
7.6.5 To review the investor relations programme and
shareholder communications policy for the
company.
7.6.6 To examine instances and matters that may have
compromised the principles of corporate
governance and report back to the Board.
7.6.7 To develop and regularly review TNB’s Code of
Corporate Governance and Business Ethics.
7.6.8 Where the BAC is of the view that a matter
reported by it to the Board has not been
satisfactorily resolved, resulting in a breach of
Bursa Malaysia Listing Requirements, to promptly
report such matters to Bursa Malaysia.
127
KEEPING THE LIGHTS ON
Acc
ount
abili
ty
Annual Report 2012
Terms of Reference of The Board Audit Committee

8. COMMITTEE MEETINGS
8.1 The Committee shall convene meetings as and when
required, and at least six times during the financial
year of TNB.
8.2 The number of Committee meetings held a year and
the details of attendance of each individual member in
respect of meetings held should be disclosed in the
annual report.
8.3 The Chairman or Secretary of the Committee, on the
request of any member, the Head of Internal Audit or
the External Auditors, shall at any time summon a
meeting of the Committee by giving reasonable notice.
It shall not be necessary to give notice of a Committee
meeting to any member who at the time is overseas.
8.4 No business shall be transacted at any meeting of the
Committee unless the quorum of three members is
satisfied.
8.5 The Chairman of the Committee shall chair the
Committee meetings and in his absence, the members
present shall elect one amongst themselves to be the
Chairman of the meeting.
8.6 In appropriate circumstances, the Committee may deal
with matters by way of circular reports and resolution
in lieu of convening a formal meeting.
8.7 Officers of the Group or others as necessary may be
invited to attend meetings where the Committee
considers their presence necessary.
8.8 All recommendations of the Committee shall be
submitted to the Board for approval.
8.9 A Committee member shall excuse himself/herself
from the meeting during discussions or deliberations
of any matter which gives rise to an actual or perceived
conflict of interest situation for the member. Where
this causes insufficient Directors to make up a quorum,
the Committee has the right to appoint one or more
Director(s), who meet the membership criteria.
8.10 The Committee, through its Chairman, shall report to
the Board after each meeting.
8.11 Subject to the provisions of these Terms of Reference
and Memorandum and Articles of Association of TNB,
the Committee shall establish its own procedures for
meetings.
9. SECRETARY OF THE COMMITTEE
9.1 The Secretary of the Committee shall be the Company
Secretary.
9.2 The Secretary shall draw up an agenda for each
meeting, in consultation with the Chairman of the
Committee. The Agenda shall be sent to all members
of the Committee and the Head of Internal Audit at
least three working days before each meeting, together
with the relevant papers.
9.3 The Secretary shall promptly prepare the written
minutes of the meeting and distribute it to each
member. The minutes of the Committee meeting shall
be confirmed and signed by the Chairman of the
meeting at the next meeting.
9.4 The minutes of each meeting shall be entered into the
minutes book kept at the registered office of the
Company under the custody of the Company Secretary.
The minutes shall be available for inspection by
members of the Board, external auditors, internal
auditors, and other persons deemed appropriate by
the Company Secretary.
10. DISCLOSURE
10.1 The Committee shall assist the Board in making
disclosures concerning the activities of the Committee,
in the Report of the Board Audit Committee, to be
issued in the annual report.
10.2 The Board requires all Directors to submit a Disclosure
of Interest to avoid any conflict between their personal
interests and the interests of the Company. In the
event of a conflict, either perceived or actual, this
Disclosure of Interest shall be submitted to the
Chairman of the Committee with a copy to the
Company Secretary.
11. REVISION OF THE TERMS OF REFERENCE
11.1 Any revision or amendment to the Terms of Reference,
as proposed by the Committee or any third party, shall
be presented to the Board for its approval.
11.2 Upon the Board’s approval, the said revision or
amendment shall form part of these Terms of Reference,
which shall be considered duly revised or amended.
128
TENAGA NASIONAL BERHAD (200866-W)
Acc
ount
abili
ty
Annual Report 2012
Terms of Reference of The Board Audit Committee

Enterprise Wide Risk Management (EWRM) is a robust framework
that strives to create value for stakeholders as TNB fulfills its core
business function of providing reliable and affordable electricity.
In place since 2003, the framework prioritises strategic and operational
risks throughout the Group while enabling the development of an
effective internal compliance and review plan. This framework
provides a complete risk management cycle incorporating the
assessment, reporting, treatment, monitoring and review of business
risks within the Group.
EWRM REPORTING STRUCTURE
BOARD OF DIRECTORS
BOARD AUDIT COMMITTEE
GROUP RISK MANAGEMENT
COMMITTEEGROUP INTERNAL AUDIT
EWRM
DEPARTMENT
CORE
BUSINESS
ENTERPRISE
MANAGEMENT
CORPORATE
SERVICES
GROUP RISK MANAGEMENT
WORKING COMMITTEE
129
KEEPING THE LIGHTS ON
Acc
ount
abili
ty
Annual Report 2012
Enterprise Wide Risk Management (EWRM)

EWRM ACTIVITIES
Risk Reporting &
Monitoring
29 risk awareness and review sessions
Analysis and reporting of half-year risk assessments to risk
management committees (see EWRM reporting structure)
Communication of decisions from risk management
committees to the respective parties for further action
Risk Communication
Two risk management forums on:
(1) Risks and opportunities of Renewable Energy in Malaysia
from the perspectives of the Sustainable Energy
Development Authority (SEDA) and TNB
(2) Best practices in project risk management and insurance
Three risk management training sessions by TNB’s training
subsidiary, TNB Integrated Learning Solutions Sdn Bhd (ILSAS)
Six two-day risk management training sessions as part of the
New Executives Training Programme (PEP)
Six Risk Bulletins sent to all TNB email users
Risk information regularly communicated through the
internal TNB Group Finance website
TNB Risk Information
System (TRIS)
227 TRIS Helpdesk requests received and resolved
Risk Management
Compliance Review
11 risk management compliance reviews
Observation: Most of the divisions/departments/subsidiaries
reviewed have fulfilled the requirements stipulated in the
EWRM Policy and Procedures
TNB Corporate
Emergency Response
Plan (CERP)
A full-scale unannounced CERP drill
Six training sessions across Peninsular Malaysia
Ongoing activities towards ISO/IEC 27001:2005 Information
Security Management System (ISMS) certification as a
safeguard against cyber or information security threat
Enterprise Wide Risk Management enables management to deal effectively with uncertainties
and associated risks and opportunities, enhancing the capacity to build value. It helps
TNB to keep the lights on while avoiding pitfalls and surprises along the way.
130
TENAGA NASIONAL BERHAD (200866-W)
Acc
ount
abili
ty
Annual Report 2012
Enterprise Wide Risk Management (EWRM)

YOU SEE

SWITCHING ON TO A KNOWLEDGE-BASED SOCIETY
WE SEE...

K E E P I N G T H E
LIGHTS ON

Operations Review

CORE-BUSINESSESTNB’s core business lies in the generation, transmission and distribution of
electricity. Driven by its central role to ‘Keep the Lights On’, the company has
become a leading utilities provider in the region.
The Generation Division is responsible for generating electricity at TNB’s six
thermal power stations and three hydroelectric power generating schemes in
Peninsular Malaysia. Together with two independent power producers (IPPs) that it
supports, namely the wholly-owned Sultan Azlan Shah Power Station and the
majority-owned Sultan Salahuddin Abdul Aziz Shah Power Station, these plants
make up 36.6% of the generation market share in the peninsula. Generation also
owns TNB Liberty Power Limited of Pakistan.
The Transmission Division transports electricity from power generators to
distributors and large industrial customers. Its primary business includes operating
the grid and maintaining thousands of circuit-kilometres of transmission lines and
pylons in the peninsula. The division is committed to providing safe, secure and
reliable electricity supply at optimal cost.
The Distribution Division is responsible for reliable and robust network delivery.
It plans, designs, constructs, operates and maintains the nation’s electricity supply
system to provide sufficient electricity to all segments of customers, as efficiently as
possible. The division also presents TNB’s frontline service, handling the Customer
Service Centres, collecting revenue, and operating the Call Management Centres.
135
KEEPING THE LIGHTS ON
Ope
ratio
ns R
evie
w–
Cor
e Bu
sine
sses
Annual Report 2012

Zainudin bin IbrahimVice President
GENERATION
DIVISIONAL GOALS
TNB’s Generation Division operates and maintains six thermal power stations and three major hydroelectric power generating schemes in Peninsular Malaysia. The six thermal power stations comprise conventional gas and oil-fired plants as well as open and combined cycle gas turbine plants. The division further supports the operations and maintenance of three independent power producers (IPPs), namely the wholly TNB-owned coal fired Sultan Azlan Shah Power Station and gas fired TNB Liberty Power Limited of Pakistan, and the majority-owned Sultan Salahuddin Abdul Aziz Shah Power Station.
With over 60 years of experience, Generation Division takes the lead in providing the technical expertise in TNB’s overseas ventures.
years60OverExperience
136
TENAGA NASIONAL BERHAD (200866-W)
Ope
ratio
ns R
evie
w–
Cor
e Bu
sine
sses
Annual Report 2012
Operations Review

OPERATIONAL SUMMARY
Peak demand for electricity in Peninsular
Malaysia increased 2.3% to 15,826MW, as
recorded in June 2012, from 15,476MW
recorded in May 2011. Generation Division
has a total installed capacity of 9,041MW,
comprising 7,130MW thermal plants and
1,911MW hydro plants1. Graph 1 shows the
overall generation installed capacity for the
financial year 2012 in Peninsular Malaysia.
Due to several major scheduled planned
outages carried out in the financial year
under review, TNB’s generation market
share dropped 1.4 percentage point year-
on-year to 36.6%. Among the planned
outages carried out are Major Overhaul of
Unit 2 at Sultan Azlan Shah Power Station
in Manjung, Major Overhaul of Block 3 at
Sultan Ismail Power Station in Paka and
Major Overhaul GT3B at Sultan Iskandar
Power Station in Pasir Gudang. The Sultan
Azlan Shah Power Station in Manjung and
Tuanku Ja’afar Power Station in Port
Dickson continued to be the major
c o n t r i b u t o r s o f e n e r g y g e n e r a t e d ,
constituting 36.1% and 24.4% of TNB’s total
generation respectively.
Graph 2 shows the overall generation
market share for the financial year under
review while Graph 3 compares TNB’s
monthly market share for the financial
years 2011 and 2012.
1 Based on Generation Security Standard (June 2011) by
Energy Procurement Department, TNB.
Graph 1:
Generation Installed Capacity for FY2012
Graph 2:
Overall Generation Market Share by Sales for FY2012
9.5%
8.8%
3.8%
5.2%
6.5%
3.4%
1.5%
2.9%
11.1%KEV,
TNB,
OTHER,
PJ,
GLGR,
PG,
PD,
CB,
HYD,
MNJG,
PAKA,
41.6%
47.3%
13.2%
5.7%3.2%
8.9%
1.7%
2.0%
0.4%
11.1%KEV,
TNB,
OTHER,
PJ,
GLGR,
PG,
PD,
HYD,
MNJG,
PAKA,
36.6%
52.3%
1.5%CB,
20.0
30.0
40.0
50.046.1%
34.7%
39.8%
35.8%34.8%
36.6%
32.4%33.2%
FY11 FY12
Se
p
Oct
No
v
De
c
Jan
Fe
b
Ma
r
Ap
r
Ma
y
Jun
Jul
Au
g
Graph 3:
Comparison of Monthly Market Share for FY2011 and FY2012
137
KEEPING THE LIGHTS ON
Ope
ratio
ns R
evie
w–
Cor
e Bu
sine
sses
Annual Report 2012
Operations Review – Generation

Generation from gas contributed to 44.5% of
the total energy generated by TNB in the
financial year, followed by coal at 36.1%,
hydro at 15.5%, distillate at 3.3% and medium
fuel oil (MFO) at 0.6%. TNB’s generation
fuel mix for the period under review has
slightly changed due to the improved
reliability of gas supply by Petronas as
compared to the previous financial year.
Graph 4 shows TNB’s generation fuel mix for
the financial year 2012.
TECHNICAL PERFORMANCE REVIEW
Plant Equivalent Availability Factor (EAF)
Generation’s EAF for the financial year was
88.7%, a significant increase of 2.2 percentage
points from the previous financial year.
The overall station performance is good,
with 60% of the power stations achieving
or exceeding an EAF of 90%. Among the
different plant types, open-cycle gas
turbines achieved an EAF of 96.6%, hydro
plants 91.8%, combined-cycle plants 87.6%,
conventional coal thermal plants 83.0% and
conventional oil/gas thermal plants 80.8%.
As shown in Graph 5, the lowest EAF of
80.8% was recorded in September 2011,
when major planned outages were carried
out. Among these were major overhauls of
Unit 2 at the Sultan Azlan Shah Power
Station in Manjung, Unit 3 at the Pergau
Power Station and Unit 3 at the Sultan
Mahmud Power Station in Kenyir.
70.00
75.00
80.00
85.00
90.00
95.00
100.00
Se
p
Oct
No
v
De
c
Jan
Fe
b
Ma
r
Ap
r
Ma
y
Jun
Jul
Au
g
80.8
83.2
87.992.2
96.5
94.4
88.5
83.4
88.387.8
Graph 5:
Equivalent Availability Factor for FY2012 (%)
Graph 4:
Generation Mix in FY2012
GAS 44.5%
COAL 36.1%
DIST 3.3%MFO 0.6%
HYD 15.5%
138
TENAGA NASIONAL BERHAD (200866-W)
Ope
ratio
ns R
evie
w–
Cor
e Bu
sine
sses
Annual Report 2012
Operations Review – Generation

FY11 FY12
CB PAKA PD PG GLGR PJ MNJG SGPK KNYR CAM TNB
93
.5
92
.0
81
.1
93
.6
90
.3 97
.3
74
.6
93
.0
90
.1 95
.9
86
.8
94
.9
84
.2 89
.7
88
.3
89
.9 95
.0
83
.0
92
.7
91
.4
87
.7
88
.7
0
20
40
60
80
100
The significant increase in EAF from the
previous financial year was largely due to the
lower EUOF of 3.5%. Graph 6 shows the EAF
of TNB stations in the financial years 2011
and 2012. Graph 7 shows the EAF trend since
the financial year 2008. The EAF in the
financial year 2012 was higher than the target
value of 88.4% by 0.3 percentage points.
Plant Equivalent Unplanned Outage
Factor (EUOF)
Overall station reliability during the financial
year was good, with the exception of high
unplanned outages at the Sultan Ismail
Power Station in Paka and Gelugor Power
Station in Gelugor. Generation’s EUOF for
the financial year was 3.5%, which marked
an improvement of 50% from the previous
year. Graph 8 shows the EUOF trend from
the financial years 2008 to 2012.
The EUOF of most of the power stations
was good, with 70% of the stations
achieving an EUOF of less than 4%. The
Sultan Mahmud Power Station in Kenyir
recorded EUOF of less than 0.5%. The
Sultan Ismail Power Station in Paka and the
Gelugor Power Station in Gelugor recorded
high EUOF of 9.9% and 5.0% respectively.
Graph 6:
Equivalent Availability Factor by Station (%)
Graph 7:
Equivalent Availability Factor (%), from FY2008-2012
Graph 8:
Equivalent Unplanned Outage Factor (%), from FY2008-2012
85.0
84.0
86.0
87.0
88.0
89.0
90.0
91.0
FY08 FY09 FY10 FY11 FY12
90
.0
90
.5
89
.4
86
.8
88
.7
3.0
2.0
4.0
5.0
6.0
7.0
8.0
FY08 FY09 FY10 FY11 FY12
3.3
2.9
2.7
3.5
7.1
139
KEEPING THE LIGHTS ON
Ope
ratio
ns R
evie
w–
Cor
e Bu
sine
sses
Annual Report 2012
Operations Review – Generation

The EUOF for the financial year exceeded
the target of 3.3% by 0.2 percentage points,
mainly due to the prolonged unplanned
outages of GT3B at the Sultan Ismail Power
Station and mechanical failure of ST1C at
the Gelugor Power Station.
Graph 9 shows the EUOF of all the power
stations in the financial year 2012. The
major components that contributed to the
unplanned outages are as indicated in
Graph 10.
Net Unit Generated (NUG)
The total Net Unit Generated increased by
3.1% from the previous financial year to
39,041GWh. The Sultan Azlan Shah Power
Station in Manjung contributed to the
highest generation of 14,110GWh followed
by the Tuanku Ja’afar Power Station in Port
Dickson (9,522GWh) and the Sultan Ismail
Power Station in Paka (3,402GWh).
Graph 11 shows a comparison of the energy
generated by power stations in the financial
years 2011 and 2012. The annual trend of
energy generated from the financial years
2008 to 2012 is depicted in Graph 12.
Graph 11:
Net Unit Generated by Station (GWh)
Graph 9:
Equivalent Unplanned Outage Factor by Station (%)
Graph 10:
Unplanned Outage Analysis
BOILER
BALANCE
OF PLANT
GENERATOR
STEAM
TURBINE
HYDRO
GAS
TURBINE 12.5%
32.7%
7.9%
25.6%
0.9%
20.1%
0.3%MISCELLANEOUS
2,000
0
4,000
6,000
8,000
10,000
12,000
14,000
16,000
CB PAKA PD PG GLGR PJ MNJG SGPK KNYR CAM
FY11 FY12
1,7
37
5,1
83
7,9
79
2,1
41
2,2
19
28
4
12
,33
4
2,9
83
2,2
25
77
51,6
21
3,4
02
9,5
22
1,8
26
2,2
11
3
38
9
14
,11
0
2,8
79
2,3
88
79
1
FY11 FY12
CB PAKA PD PG GLGR PJ MNJG SGPK KNYR CAM TNB
1.6 2
.4
12
.5
4.7
1.8
0.4
17
.1
0.7
0.1
1.5
7.1
0
2.0
4.0
6.0
8.0
10.0
12.0
14.0
16.0
18.0
2.0
9.9
4.9
3.2
5.0
0.6
3.1
1.2
0.1
1.5
3.5
Graph 12:
Net Unit Generated (GWh), FY2008-2012
34,000
33,000
35,000
36,000
37,000
38,000
39,000
40,000
41,000
42,000
FY08 FY09 FY10 FY11 FY12
39
,04
1
37
,85
9
41
,14
6
39
,36
8
37
,77
0
140
TENAGA NASIONAL BERHAD (200866-W)
Ope
ratio
ns R
evie
w–
Cor
e Bu
sine
sses
Annual Report 2012
Operations Review – Generation

Net Thermal Efficiency (NEFF)
Generation Division’s overall net thermal
efficiency during the financial year was
39.0%. Graph 13 shows a comparison of the
thermal efficiency by station for the
financial years 2011 and 2012. This translates
to an improvement of 0.26% over 38.9%
achieved in the previous financial year.
Continuous efforts to improve TNB’s
thermal efficiency have resulted in this
improvement.
Overall, thermal efficiency has improved by
1.1 percentage points from the financial
year 2008 to the financial year 2012, as
depicted in Graph 14.
Carbon Emission
Total CO2 emissions in the financial year
was 0.55 metric tons per MWh, which
represents an increase of 1.9% from the
total emission of 0.54 metric tons of CO2/
MWh in the previous financial year. This
was due to high utilisation of coal-fired
plants throughout the year.
Graph 15 shows the total emissions of CO2
by all power stations for the financial year.
MFO and coal fuel contributed to the
highest emissions of CO2 of 0.94 metric
tons per MWh and 0.87 metric tons per
MWh respectively, followed by distillate
fuel at 0.64 metric tons per MWh and
natural gas at 0.48 metric tons per MWh.
Initiatives to mitigate CO2 emissions are
ongoing. These in c l ude im pr o v in g
performance tracking parameters for gas
turbines and standardising the compressor
water washing for CCP.
Graph 13:
Thermal Efficiency by Station (%)
Graph 14:
Thermal Efficiency (%), from FY2008-2012
0
10.0
20.0
30.0
40.0
50.0
60.0
CB PAKA PD PG GLGR PJ MNJG TNB
FY11 FY123
7.4
37
.5
48
.4
38
.0 39
.8
26
.6
35
.4
37
.3 38
.7
48
.2
37
.1 40
.5
26
.4
35
.3 38
.9
39
.0
FY08 FY09 FY10 FY11 FY1235.0
36.0
37.0
38.0
39.0
40.0
41.0
39
.0
38
.9
39
.4
39
.1
37
.9
Graph 15:
Total Emissions of CO2 by all power stations (metric tons/MWh)
CBPS PAKA TJPS PGPS GLGR MNJG PJPS SGPK KNYR CHPS TNB
0.5
5
0.0
1
0.0
1
0.0
1
0.7
90.8
7
0.5
10.5
6
0.4
40.5
4
0.5
4
0.0
0.1
0.2
0.3
0.4
0.5
0.6
0.7
0.8
0.9
1.0
141
KEEPING THE LIGHTS ON
Ope
ratio
ns R
evie
w–
Cor
e Bu
sine
sses
Annual Report 2012
Operations Review – Generation

TRANSMISSIONDatuk Rozimi bin RemeliVice President
The year under review was once again a remarkable year for Transmission Division. Business as usual for the Division is no longer about doing the same thing in the same way, but more about sustaining the Division’s outstanding world-class performance. ‘Striving for Sustainability’ is the new division mantra as it embarks on the 20 Transmission Key Action Plans outlined in Gemilang 2015 in order to attain the objectives of TNB’s 20-Year Strategic Plan.
1.03or less for the last four years
System Minutes
The yeaBusinessame wperformthe 20 Tthe obje
142
TENAGA NASIONAL BERHAD (200866-W)
Ope
ratio
ns R
evie
w–
Cor
e Bu
sine
sses
Annual Report 2012
Operations Review

TRANSMISSION IN BRIEF
Transmission Division plans, operates and
develops TNB’s 132kV, 275kV and 500kV
transmission network which transports
electricity in bulk from power generators to
distributors and also in some cases
transports directly, to large industrial
customers. Its primary business activities
include operating the grid on a 24/7 basis
by monitoring electricity flow across the
system, monitoring all network components
and replacing those that are no longer
funct ioning opt imal ly , and further
developing the network to meet the ever-
growing electricity demand.
The division continues to live up to the
challenge of maintaining thousands of
circuit-kilometres of transmission lines and
pylons in the peninsula. It is committed to
providing safe, secure and reliable electricity
supply at optimal cost. Most importantly, in
running its day-to-day business, the division
ensures it delivers quality service, practicing
good corporate governance, caring for the
environment and meeting corporate social
responsibilities.
The division aims to be the leading
transmission entity and grid system
operator in ASEAN, and among the best in
the world.
TRANSMISSION IN NUMBERS
The division achieved numerous milestones
in operational and corporate performance
over the year, some of which are highlighted
as follows:
Operational Excellence
● Superior performance in Transmission System Minutes, which measures the performance
of the National Grid, has not exceeded 1.03 minutes in the last four years.
● Further reduction in number of transmission-related tripping to 276 incidents in
FY2011/12 from 305 incidents in FY2010/11.
● A new record of 1.67% transmission system loss, inclusive of losses from distribution
power transformers.
● Further reduction in the Monthly Delay Index, which measures transmission project
delivery, from 5.03 months in the financial year 2007/08 to 1.40 months in the financial
year 2011/12.
0
1
2
3
4
5
6
7
FY
07
/08
6.5
6
5.0
3
1.0
2
3.3
7
0.8
5
2.5
7
1.0
1
1.9
6
1.0
3 1.4
0
FY
08
/09
FY
09
/10
FY
10
/11
FY
11
/12
0
1
2
3
4
5
6
7
FY
07
/08
FY
08
/09
FY
09
/10
FY
10
/11
FY
11
/12
46
4
42
9
39
2
33
3
30
7
30
5
27
6
0
50
100
150
200
250
300
350
400
450
500
FY
06
FY
07
FY
08
FY
09
FY
10
FY
11
FY
12
Total No. of Transmission Related Tripping
System Minutes (min) Monthly Delay Index (Month)
143
KEEPING THE LIGHTS ON
Ope
ratio
ns R
evie
w–
Cor
e Bu
sine
sses
Annual Report 2012
Operations Review – Transmission

● Zero major disturbance over the last
seven years.
● Zero tripping with load loss at the
500kV and 275kV levels for four
consecutive years.
● Highest maximum demand of 15,826
MW (recorded on 20 June 2012).
● Increased system c apa ci ty w ith
additional 2,160 MVA transformer
capacity, 149.0 circuit km of transmission
lines and 45.8 circuit km of underground
cables through the completion of 54
transmission projects.
● Occupational Health Safety Assessment
Series (OHSAS) certification of all 25
business units in Transmission, the first
achievement for the division.
● Attainment of 16 Gold awards from the
Malaysian Society for Occupational
Safety & Health (MSOSH) for the second
year running, with three business units
– Asset Development (East), Asset
Maintenance (Kelantan) and Asset
Maintenance (Pahang) – receiving the
highest award, the Gold Merit.
● All 25 business units maintained 5 Star
5S Certificate with Asset Maintenance
(Pahang) being additionally recognised
with the Anugerah Terbaik 5S at the
corporate level.
● Passing the SIRIM Surveillance Audit
with zero Non-Conformance Report
(NCR) for the second year running.
i n s t a l l a t i o n s , f o r i n s t a n c e ;
r e p l a c e m e n t o f e a r t h i n g
t ransformer , surge ar rester ,
wooden to composite arm and
under-rated capbank tuning
reactor, transformer oil reclamation,
installation of anti-theft lock nut,
and replacement of static and
electromechanical relay.
2. Enhancing supply reliability via the
development and implementation of
p i l o t S m a r t G r i d – W i d e A r e a
Intel l igence System (WAIS) to
maintain zero major disturbance
● Fully completed and operational
3 out of 6 key activities:
i. R e a l T i m e A p p l i c a t i o n
P l a t f o r m : I n t e l l i g e n t
processing unit capable of
gathering data and able to
make real time decision and
perform automated control
actions.
ii. A d v a n c e O v e r l o a d
Protection Scheme: Second
level protection system to
m i n i m i s e t h e r i s k s o f
cascading trippings.
iii. U n d e r V o l t a g e L o a d
Shedding Scheme: Intelligent
Under Voltage Load shedding
using wide area information.
DRIVING OPERATIONAL EXCELLENCE
THROUGH GEMILANG 2015
Transmission’s unwavering focus for the
last seven years on achieving operational
excellence by reducing System Minutes and
transmission losses and commissioning
projects on time while maintaining zero
major disturbance has contributed to TNB
establishing itself as one of the best power
utilities in the region. To propel TNB to
greater heights, Transmission is now
implementing all initiatives as outlined for
the division under Gemilang 2015, the
second phase of TNB’s 20-year Strategic
Plan. These serve to drive TNB towards its
vision of becoming a global leader by 2025.
Transmission Division has been entrusted
with 20 Key Action Plans under the five-
year Gemilang 2015, and has already
completed 75% of these. These comprise
four breakthrough strategies:
1. Enhancing supply reliability via Zero
Tripping Action Plan (ZTAP) & Critical
Installation Maintenance (CRIM)
Initiatives
● These initiatives are to mitigate
the strategic risk of inability to
fully ensure reliability and quality
of supply as to maintain low
system minutes. The activities
focused on refurbishment and
replacement of ageing and
problematic equipment that have
b e e n i d e n t i f i e d a t c r i t i c a l
144
TENAGA NASIONAL BERHAD (200866-W)
Ope
ratio
ns R
evie
w–
Cor
e Bu
sine
sses
Annual Report 2012
Operations Review – Transmission

3. Reducing transmission losses by
introducing low loss conductor:
● 6 projects have been identified
and one is current ly under
implementation: 60-km-circuit
length of 275kV overhead lines
(OHL) Ulu Jelai-Tapah.
4. Deploying innovation and proven
technology through the International
Electrotechnical Commission Standard
IEC 61850 based Substation Protection
Automation and Control System
(SPACS)
● Successfully commissioned the
following:
i. Real Time Digital Simulator
( R T D S ) w i t h I E C 6 1 8 5 0
I n t e r f a c e a n d D i g i t a l
Teleprotection Simulator as
the testing facilities to test
the SPACS
ii. IEC 61850 based Substation
Inte l l igent Management
System (61850 SIMS) as a
component of SPACS
iii. Awarded the IEC 61850 SPACS
pilot project in a transmission
substation at PMU Kajang
Estate 132/33kV GIS
● On building capacity, SPACS
t e c h n i c a l e x p e r t h a s b e e n
conducting a series of courses for
transmission and distribution
protection engineers using the IEC
61850 System Verif ication &
Simulation laboratory (IEC 61850
SVS Lab) at TNBR.
PROSPECTS
Transmission Division will continue to
implement initiatives identified under
Gemilang 2015. These have been laid down
in line with the division’s goal to be the
leading transmission entity and grid system
operator in ASEAN and among the best in
the world.
The division is committed to managing its
assets to fulfill the needs and requirements
o f s t a k e h o l d e r s , w h i l e o p t i m i s i n g
performance, risks and costs throughout
the life-cycle of these assets to ensure safe,
secure and reliable electricity supply.
The division is working towards PAS55
certification by streamlining its asset
management practices and processes in
accordance with the British Standards
Institution’s (BSI) Publicly Available
Specifications. This will ensure its Asset
Management Plan is in line with asset
management best practices, and allow
Transmission to abide by all statutory,
regulatory and legal requirements related
to its business and operations, maintain an
accurate and up-to-date asset information
system, integrate risk management as part
of the asset management system, and
continually improve the existing system.
As the backbone of the electricity supply
chain for more than 8 million electricity
consumers in Peninsular Malaysia, the
division is focused on deploying high-
impact technology to maintain a high level
of productivity. The division will be
establishing its second live-substation
maintenance team in the next financial
year to ensure continuing efficiency and
reliability of electricity supply. This will
allow for maintenance work to be carried
out at the critical substations and major
load centres without any power interruption
to customers.
In the financial year 2011/12, the division
has completed Phases 1 and 2 of the
Transmission Operation Monitoring &
Analysing System (TOMAS), a centralised
maintenance information system consisting
of work process management and
dashboard monitoring. After two years of
operation, TOMAS will be further enhanced
and will be integrated with the Corporate
Geospatial Information System (CGIS).
The division is committed to completing
and delivering all its projects on time, as
any delay in critical transmission development
projects poses a risk to the security and
reliability of the National Grid. There is at
present some public objection to certain
major transmission projects. Transmission is
trying to overcome this by seeking the
support and cooperation of all relevant
stakeholders for the benefit of all concerned.
Last but not least, the division remains
committed to ensuring excellence in its
products and services towards becoming
the leading transmission entity and grid
system operator in ASEAN, and among the
best in the world.
145
KEEPING THE LIGHTS ON
Ope
ratio
ns R
evie
w–
Cor
e Bu
sine
sses
Annual Report 2012
Operations Review – Transmission

DISTRIBUTION
The Distribution Division performed commendably during the year under review, achieving above average scores for most of the major performance indicators. This can be attributed to the effective implementation and close monitoring of Gemilang 2015 initiatives by various units within the Division.
146
OPERATIONAL SUMMARY
As the Division in TNB with the closest dealings with customers, a
primary role of the Distribution Division is to ensure reliable and robust
network delivery. Distribution Division plans, designs, constructs, operates
and maintains the nation’s electricity supply system at voltage levels of
33kV, 22kV, 11kV, 6.6kV and 400/230V in order to provide sufficient
electricity to all segments of customers, as efficiently as possible.
In addition, the Division is also entrusted with retail operations.
In this regard, it markets and sells electricity, connects new supply,
provides counter services at TNB’s Customer Service Centres
(Pusat Khidmat Pelanggan or PKP), collects revenue, operates the Call
Management Centres (TNB Careline 15454 and One Stop Engagement
Centre 1-300-88-5454), handles customer enquiries and complaints, and
nurtures strong customer and government relationships. To serve its
customers optimally, Distribution has established a network of 13 State
and 45 Area Offices, covering strategic locations nationwide.
Datuk Ir. Baharin bin DinVice President
141444444444444444666666666666666666666146
TENAGA NASIONAL BERHAD (200866-W)
Ope
ratio
ns R
evie
w–
Cor
e Bu
sine
sses
Annual Report 2012
Operations Review

+4.3% sales of electricity (units)
For the period under review, a total of
227,239 new customers were connected.
This effectively increased TNB’s customer
base to 7.88 million. Meanwhile, electricity
sales (in units) grew by 4.3% to 96,257.2GWh.
The year saw a change in leadership in
which Vice President Hj Hussin Othman
retired effective 1 January 2012. He was
succeeded by Datuk Ir. Baharin bin Din,
who served TNB as an engineer in the early
days of his career before being appointed
as the Managing Director of SESB from
2007 to 2011. Since assuming his current
posit ion, Datuk Ir . Baharin Din has
introduced several initiatives to further
strengthen TNB’s network delivery as well
as enhance its customer service.
The Division has implemented a 10-year
Roadmap, developed under the McKenzie
7S framework, which takes Distribution
beyond the Gemilang 2015 objectives.
Among the new object ives of the
Distribution 10-year Roadmap are:
1. to optimise and focus limited resources
on major and impactful areas of the
business in order to attain world-class
standards as envisaged under TNB’s
20-Year Strategic Plan, and
2. to engage all Distribution Division
staff in efforts to achieve world-class
standards.
A n o t h e r i n i t i a t i v e i n t r o d u c e d b y
Datuk Ir. Baharin is the D.O.I.T concept of
Discipline, Objectives, Integrity and
Teamwork. Distribution Division has
adopted D.O.I.T as a strong and influential
rallying point for its more than 16,000
personnel. D.O.I.T also reinforces TNB’s
shared values of Customer, Integrity,
Business Excellence and Caring.
147
KEEPING THE LIGHTS ON
Ope
ratio
ns R
evie
w–
Cor
e Bu
sine
sses
Annual Report 2012
Operations Review – Distribution

It is envisaged that D.O.I.T and the 10-year
Roadmap will provide both the “soft” and
“hard” tools to achieve TNB’s new goals as
unveiled by the new Chief Executive
Officer, Datuk Wira Ir. Azman bin Mohd.
TNB’s new goal focuses on the creation of
a more vibrant workforce and achieving a
“productivity revolution”. D.O.I.T and the
10-year Roadmap also complement the
Four Thrusts as underlined by the CEO
(Building Trust and Relationships, Building
Capacity, Building Performance and
Building Growth) which are designed to
bring about greater professionalism.
HIGHLIGHT OF ACHIEVEMENTS
Distribution Division’s main achievements
during the Financial Year 2011/2012
include:
● The official launch of TNB Careline by the
Minister of Energy, Green Technology
and Water on 16 February 2012.
● The introduction of five new main
communication channels to customers
on 16 February 2012, namely:
– Telephone/fax: 1300-88-5454
– Telephone/SMS: 1-5454
– Email: [email protected]
– Webchat: (www.tnb.com.my)
– Facebook: www.facebook.com.my/
tnbcareline
● Gold Award for Best Technology
Innovation in Contact Centre as
r e c o g n i s e d b y C o n t a c t C e n t r e
Association Malaysia (CCAM) in
October 2011.
● G o l d A w a r d f o r B e s t C R M
Implementation in Contact Centre as
r e c o g n i s e d b y C o n t a c t C e n t r e
Association Malaysia (CCAM) in
October 2011.
● Obtaining the highest score ever of
7.2 in the Customer Satisfaction Index
(CSI) Survey.
● Enhanced network rel iabil ity as
indicated by the significant reduction
in System Average Interruption
Duration Index (SAIDI) to 62.32 minutes
per customer per year from 78.9
minutes in the previous Financial Year.
● Reduction in the number of medium
voltage breakdowns to 2,621 cases as
compared to 13,428 cases in the
previous Financial Year.
● Recording a significant drop of 0.21%
in Distribution Losses from 6.79% in
the previous Financial Year to 6.58%,
resulting in a financial gain for
Distribution in excess of RM63 million.
● Collecting a total of RM51.87 million
and RM0.746 million (in kind payment)
in under-charged from detected meter
tampering cases.
● The recertification of all 119 stations
under the Division by the Malaysian
Productivity Corporation (MPC) for
Quality Environment Management
System (WIT-5S).
● Naming of TNB Kulaijaya as the Overall
Champion of the 2011 Ministry of
Trade and Industry Award; and
Champion in the Private Sector
Category.
● Contributing significantly to TNB
winning the Best Award in the 2011
National Award for Management
Accounting (NAfMA).
Business Performance Improvement
In the year under review, two major projects
were implemented by the Distribution
Division to assist in improving business
performance at the operational level.
1. Management Control System for
Area and Branch Managers
As part of continuous efforts to
improve its business performance,
Distribution Division introduced a Unit
Review Meeting (URM) and Supervisory
Review Meeting (SRM) at all its stations
in 2011 to provide a more structured
and systematic way of monitoring
operational activities, especially at the
area and branch levels.
2. Branch Manager Operations Manual
A structured and documented set of
guidelines has been developed for
Branch Managers to prioritise their
roles and responsibilities and assist
them in managing daily activities.
The guidelines, contained in a Branch
Manager Operations Manual, are
based on relevant best practices
documented in Distribution Division
over the years. In addition to
operational tasks, the guidelines also
cover related areas such as industrial
relations and public relations. This
manual is designed to serve as a
table file for quick reference.
148
TENAGA NASIONAL BERHAD (200866-W)
Ope
ratio
ns R
evie
w–
Cor
e Bu
sine
sses
Annual Report 2012
Operations Review – Distribution

OPERATIONAL IMPROVEMENTS
Customer Satisfaction Index (CSI) Survey
The CSI measures the level of satisfaction of
a sample population of TNB customers. In
the year under review, the survey involved
8,578 domestic, commercial and industrial
customers in Peninsular Malaysia.
Findings of the CSI
The CSI study is based on ratings given to
35 service deliveries spread across 11 service
categories, namely Connections/Upgrades,
Breakdowns, Shutdowns, Quality of Supply,
Customer Service Centre, Safety & Advisory,
TNB Careline, Restoration, Meter Reading-
Billing-Payments, Complaint Handling and
Enquiry Management.
The national CSI scores for the last five
years are as follows:
Chart 1:
National CSI scores over five years
6.9
CSI Score
6.9
7.1
7.0
7.2
04/05 05/06 07/08 09/10 11/12
These scores indicate that the public’s
perception of TNB’s customer service has
improved over the years.
People 1st Programme for Distribution
(P1PD)
As part of efforts to provide customers with
a positive and memorable experience at all
times, the People 1st Programme for
Distribution (P1PD) was developed and
implemented. Under the P1PD, a l l
Distribution Division frontliners at the Pusat
Khidmat Pelanggan (PKP) are given relevant
training and motivation in order to meet
the various needs of customers efficiently
and professionally.
Distribution Division has also revamped the
PKP and would be introducing uniforms for
counter service staff, enabling more online
transactions such as bill payments, and by
using the electronic media to showcase
TNB’s products and services.
Strengthening TNB’s mission to power the
nation, Distribution Division is also
c o n t r i b u t i n g t o t h e G o v e r n m e n t ’ s
Transformation Programme by participating
in the Urban Transformation Centre (UTC).
UTC is a one-stop centre through which
urban residents as well as micro enterprises
and small businesses are able to carry out
transactions with utility companies and
government bodies. PKP @ UTC Melaka is
pioneering this new operation, which will
be extended to all states nationwide.
TNB Careline
TNB Careline represents the company’s
main customer engagement centre and
consists of two main sub-units, namely the
Call Management Centre (CMC) and the
One Stop Engagement Centre (OSEC). The
key role of the CMC is to manage reports
and complaints from customers pertaining
to electricity supply disruption, including
street light malfunction. OSEC, on the other
hand, manages enquiries and complaints
regarding bills and accounts.
TNB Careline was officially launched by the
Minister of Energy, Green Technology and
Water, Datuk Seri Peter Chin Fah Kui, on 16
February 2012. It is integral to the Company’s
long-term strategy of developing an Online
Customer Service. This will become the
main platform for TNB’s virtual centre
through which customers can apply for
electricity supply, conduct Self Meter
Reading (SMR) and terminate their accounts.
e-Services
V i a T N B ’ s s e c u r e d w e b p o r t a l
https://e-services.tnb.com.my, customers
can view and track their monthly electricity
consumption online, monitor their billing
details as well as pay their bills. At the same
time, owners of premises can monitor their
tenants’ billing and payment information.
TNB’s e-Services include an e-Bulk Payment
facility to government and private agencies
with many accounts and high consumption,
in order to better manage their payments.
149
KEEPING THE LIGHTS ON
Ope
ratio
ns R
evie
w–
Cor
e Bu
sine
sses
Annual Report 2012
Operations Review – Distribution

Self Meter Reading (SMR)
Self Meter Reading (SMR) is a new initiative
introduced to address complaints pertaining
to electricity bills. Through SMR, domestic
customers are given the option of reading
their own meters for three consecutive
months following which the meter will be
read by TNB personnel on the fourth month
as part of a verification process. Customers
will be notified via SMS or email on the
meter reading date. They are required to
submit their meter readings via SMS to
15454 or via the e-Services platform on
TNB’s website within three days of receiving
this notification from TNB. SMR allows for
precise reading of electricity consumption
in which the customer also stands to
benefit from managing their monthly
electricity consumption.
(OPC) within the next 10 years. In addition,
Distribution Division will install smart
meters as a pilot project for 1,000 customers
in the next Financial Year.
Aged Meter Replacement Programme
Under TNB’s revenue assurance initiative,
Distribution Division has embarked on a
systematic programme to replace electricity
meters that are more than 15 years old.
As at July 2012, a total of 1,145,941 meters
has been replaced.
Asset Management PAS 55
Distribution Division operates network
assets with a net book value of RM17.87
billion (as at 31 August 2011). To ensure
these assets are effectively and efficiently
managed, the Division has established an
Asset Management (AM) System and
prepared a five-year Asset Management
Strategy supported by annual Asset
Management Plans. This is consistent with
the requirements of the BSi PAS 55:2008
Asset Management System and the soon-
to-be-introduced ISO 55000 standard on
asset management.
Chart 3:
Meter Replacement Program FY11/12
Jan
-Ma
y ’1
1
Jun
’1
1
Jul
’11
Au
g ’
11
Se
p ’
11
Oct
’1
1
No
v ’
11
De
c ’1
1
Jan
’1
2
Fe
b ’
12
Ma
c ’1
2
Ap
r ’1
2
Ma
y ’1
2
Jun
’1
2
Jul
’12
No. of Replacement
69
,11
5
10
0,5
90
15
0,6
28
20
5,4
24
20
5,4
24
20
5,4
24
22
9,1
41
31
5,1
57
44
1,0
76
57
6,6
76
71
6,6
29
84
3,5
93
97
4,6
76
1,0
84
,21
7
1,1
45
,94
1
0
200,000
400,000
600,000
800,000
1,000,000
1,200,000
1,400,000
Chart 2:
Customers enrolment in eServices
21,346
38,999
60,345
80,150
100,522
08/0907/08 09/10 10/11 11/12
FY 07/08 08/09 09/10 10/11 11/12
Total Customer Enrolled 21,346 38,999 60,345 80,150 100,522
Remote Meter Reading (RMR)
The Remote Meter Reading project (RMR)
was successfully implemented for 4,500
high and medium voltage customers
(HVMV) and 60,000 low voltage large power
customers (LV LPC) during the year under
review. This technology, which improves
operational efficiency, will be implemented
for the 1,000,000 ordinary power customers
150
TENAGA NASIONAL BERHAD (200866-W)
Ope
ratio
ns R
evie
w–
Cor
e Bu
sine
sses
Annual Report 2012
Operations Review – Distribution

The business objectives of the Asset
Management Strategy and Plan are:
● to achieve a Customer Satisfaction
Index Score of 7.5
● to achieve a SAIDI of 50 minutes and
● to reduce losses to 5%
These objectives complement TNB’s
Gemilang 2015 mission of being “committed
to excellence in our products and services”.
The Asset Management Plan is linked with
the Division’s national as well as state
business objectives and targets for the
Financial Year. It provides an overview of
TNB’s initiatives and key activities planned
for the current Financial Year which are
integral to fulfilling the Company’s business
objectives.
The Asset Management Plan also addresses
TNB’s core Business As Usual activities and
summarises the Company’s planned
expenditure to ensure its asset management
and risk capabilities conform with emerging
international best practices.
SUPPLY RELIABILITY IMPROVEMENT
SAIDI Segmentation
In order to optimise resources and focus on
relevant areas so as to meet customers’
expectations, Automation technology will be
one of the enablers for SAIDI segmentation.
Distribution Division has segmented its
SAIDI targets according to the following
categories:
Urban Areas
– In areas under the administration of
Dewan Bandaraya or Majlis Perbandaran,
automation is maximised to achieve
targeted restoration time in less than 15
minutes.
Rural Areas
– In these areas, restoration time is
targeted at less than four hours.
Voltage FY2009/10 FY2010/11 % Reduction
33 kV 58.52 47.03 20%
22 kV 88.16 62.74 29%
11 kV 80.85 72.06 11%
Power Quality (PQ)
In the Financial Year under review, TNB successfully conducted five seminars for large
power customers from various industries including the semiconductor and textile sectors.
Among the topics presented were PQ standards, PQ case studies, PQ monitoring and PQ
mitigation.
A new power quality guidebook, titled A Guidebook for Managing Power System Harmonics,
was also launched which is aligned to the supply application procedures and technical
requirements in the new Distribution Code.
Industrial Areas
– In areas gazetted by the Malaysian
Industrial Development Authority
(MIDA), electricity supply is critical,
therefore automation is targeted to
achieve restoration in less than one
minute.
SAIDI Segmentation allows TNB to manage
targeted areas and respective networks
more effectively and efficiently, while
undertaking relevant steps to enhance
restoration time with better and reliable
network configuration as well as network
automation packages.
Distribution Regional Control Centres
Regional Control Centres (RCCs) in TNB play
a vital role in ensuring reliability, continuity
and security of the electrical supply system.
The Distribution RCCs are situated in two
locations:
● Seberang Jaya, where the Northern and
Eastern Control Rooms are located
(NERCC)
● Bangsar, where the Metro and Southern
Control Rooms are located (MSRCC)
SCADA
TNB has completed the installation of the
Supervisory Control and Data Acquisition
(SCADA) system in 94% of its primary
substations. All primary distribution
substations are targeted to be equipped
with SCADA by 2015.
Secondary substations in prime areas are
also equipped with SCADA facilities.
A total of 1,131 VCB substations and 343
RMU substations are already equipped with
full SCADA functionalities.
With the installation of SCADA, more
medium voltage feeders and substations
are being monitored and controlled
remotely. This enables personnel at the
control centres to restore electricity supply
quickly in the event of an unscheduled
power outage, thereby reducing the
duration of outage as measured by SAIDI.
The table below indicates a significant
reduction in SAIDI over the last two
Financial Years.
151
KEEPING THE LIGHTS ON
Ope
ratio
ns R
evie
w–
Cor
e Bu
sine
sses
Annual Report 2012
Operations Review – Distribution

Arc Flash Protection Scheme
An Arc Flash Protection scheme has been incorporated into switchgears that serve critical
areas to provide additional protection to equipment and limit the extent of potential
damage in the event of a flashover. It has been observed that Main Intake Substations
(PMU) and Distribution Intake Substations (PPU) installed with the system suffer less
damage from flashovers than substations without it. Customer interruptions have also
been significantly shortened. To date, 59 substations have been installed with the scheme
and TNB is targeting its installation at 50 substations annually.
NEW TECHNOLOGIES
TNB leverages on new technologies to achieve its performance targets. Among the proven
technologies introduced during the year were:
a. Insulating cover H/pole 11kV : Reduce breakdowns at pole mounted S/S
b. 5 MVA Mini PPU 33/11kV : Reduce SAIDI and losses
c. Pre-moulded transition joint : Reduce breakdown due to joints
d. SF6 Pole Top LBS : Reduce breakdowns at MV overhead lines
e. Online battery monitoring system : Avoid malfunction of protection system
f. Mobile SSU : Reduce restoration time at MV substations
g. Mobile compact substation : Reduce restoration time at MV substations
h. Circuit Breaker RMU : Reduce the number of customers affected by
breakdowns
i. Mini PPU : Rural area primary substations
j. Directional Ultrasonic Detector : Diagnostic tool
k. Magnetic probe for Advanced TEV : Diagnostic tool
l. Portable PQ recorder : Diagnostic tool
m. SF6 load break switch : Reduce breakdowns at MV overhead lines
n. SCADA-ready line fault : Reduce restoration at MV overhead lines
Electricity Tariff
At the end of 2011, the Government introduced the Feed-in-Tariff (FiT) mechanism with
the aim of promoting the development of Renewable Energy (RE) in Malaysia. An FiT
contribution of 1% was imposed on all TNB customers, except domestic customers with a
monthly electricity consumption of 300kWh and below, effective from 1 December 2011.
The RE fund will be utilised to develop RE projects and initiatives, and will be managed
by the Sustainable Energy Development Authority (SEDA) under the Ministry of Energy,
Green Technology and Water.
In addition, as of 1 December 2011,
electricity bills included the amount of
subsidy paid by the Government. This is to
create public awareness of the increasing
cost of generating electricity and the
burden borne by the Government to
maintain competitive tariffs in the country.
TNB continues to give privileged customers,
inc luding government schools and
institutions of higher learning, places of
worship and welfare homes, a 10% discount
on their electricity bills. This amounted to
RM78.84 million (unaudited 12 months
actual) during the year under review.
The 10% discount for institutions of higher
learning is being extended to educational
institutions that are partly funded by the
G o v e r n m e n t , u n d e r l i n i n g T N B ’ s
commitment to support the country’s
education system.
152
TENAGA NASIONAL BERHAD (200866-W)
Ope
ratio
ns R
evie
w–
Cor
e Bu
sine
sses
Annual Report 2012
Operations Review – Distribution

NON-COREBUSINESSES
the underprivileged. In addition, Corporate
Affairs coordinates the activit ies of
Regulatory and Relationship Management.
The Corporate Services Division is tasked
with managing and ensuring the security of
all TNB’s properties and assets while also
providing logistics, project management
and consultancy support services.
The Procurement Division supports the
other divisions by formulating effective
procurement policies and implementing
strategic supply chain initiatives that
enhance procurement activities.
TNB’s Generation, Transmission and Distribution Divisions are strongly supported by other divisions in the Group that bring
into play their knowledge and expertise to ensure TNB operates as a dynamic, well-run enterprise that is able to fulfill its promise
of ‘Keeping the Lights On’. Among these support divisions are New Business & Major Projects, Group Finance, Planning,
Corporate Affairs, Corporate Services and Procurement.
New Business & Major Projects Division
represents a new division created in 2012 to
spearhead the growth of TNB’s non-
regulated business locally and internationally.
The division will oversee and consolidate all
business development roles and services
under one roof to capitalise on the Group’s
extensive knowledge and capabilities in
providing a range of energy-related services.
The Group Finance Division is responsible for
strategis ing TNB’s overal l f inancial
management. It assumes the conventional
f inancial functions of f inancial and
management reporting, taxation, budgeting,
corporate finance and treasury operations. In
addition, the division also undertakes the
financial planning, business development,
enterprise-wide risk management and investor
relations aspects of the Group’s business.
The Planning Division comprises departments
responsible for strategic planning, system
planning and development, as well as energy
procurement activities. These departments
collaborate to formulate and implement
TNB’s long-term strategies, ensure reliable
national supply as well as manage energy
procurement activities, including power
purchase agreements (PPAs).
The Corporate Affairs & Communications
Division ensures the Group communicates
effectively with its internal and external
audiences in order to maintain close
relationships with TNB’s various stakeholders
and build the TNB brand. The division also
oversees the Group’s foundation, Yayasan
Tenaga Nasional (YTN), through which TNB
supports the educational and welfare needs
of deserving students, and provides aid to
153
KEEPING THE LIGHTS ON
Ope
ratio
ns R
evie
w–
Non
-Cor
e Bu
sine
sses
Annual Report 2012
Operations Review

NEW BUSINESS & MAJOR
PROJECTS
INTERNAL BUSINESS AND MAJOR PROJECTS DIVISION
The International Business and Major Projects Division has been created to implement breakthrough strategies targeted at expanding TNB’s global business while streamlining investment vehicles and processes for overseas expansion. These functions were previously entrusted to the Investment Management Department and Business Development Department of Group Finance, and the Generation Asset Development of Generation Division.
Consolidating the three departments within one single structure will ensure:
– Better coordination in strategising for new projects, including bidding for new generation projects.
– More efficient and effective flow of data and information, and the sharing of lessons learnt from past projects.
– The optimal use of expertise within the division to create a competitive advantage for TNB. For example, expertise in generation development locally can be deployed for overseas generation ventures while expertise in business development overseas can assist in bidding for new projects domestically.
The main functions of the International Business and Major Projects Division include monitoring the investment portfolio of TNB subsidiaries, implementing generation project development, bidding for new generation capacity and developing new domestic and international business.
Dato’ Ir. Mohd Nazri bin ShahruddinVice President
154
TENAGA NASIONAL BERHAD (200866-W)
Ope
ratio
ns R
evie
w–
Non
-Cor
e Bu
sine
sses
Annual Report 2012
Operations Review

Subsidiaries Business Projects/Achievements Prospects
TNB Engineering
Corporation Sdn. Bhd.
Provider of District Cooling
Systems with Thermal Energy
Storage.
Completed 95% of District
Cooling plant in KLIA2 PV02, to
supply cooling energy to the
Main Terminal Building of
Malaysia Airports Holdings
Berhad and Integrated Complex.
Mergers, acquisition and
expansion of existing District
Cooling System
projects.
Specialise in Project Development
Ownership, Energy, Procurement
and Construction and
Comprehensive Operations and
Maintenance.
In Abu Dhabi, the 8,000RT and
30,000RT plants’ testing and
commissioning were completed
in May 2012 and targeted to
complete in October 2012,
respectively.
Energy management projects for
Government buildings.
TNB Energy Services
Sdn. Bhd.
Provider of green energy
solutions and services for
development, operation and
maintenance of renewable
energy projects.
Consultant to Public Private
Partnership Unit for its solar
hybrid station and supply system
to rural of Sarawak.
Power system studies for
future RE developers.
Involved in power quality and
energy efficiency audits.
Develop solar hybrid station for
RPS Kemar in Grik.
Opportunities in ASEAN region
and Middle East.
Tenaga Switchgear
Sdn. Bhd.
Manufacture high voltage
switchgears through joint venture
and collaborations with business
partners.
Successfully supplied
commissioned substations and
provided maintenance and
switchgear refurbishment.
Contracts to supply gas circuit
breakers to Pakistan, Vietnam
and Indonesia.
Offer turnkey contracting of
transmission and distribution
substation services, substation
engineering and design and
specialised maintenance and
repair of high, medium and low
voltage equipment services.
Certified ISO 9001:2008, ISO
14001 and OHSAS 18001:2007
and products are accredited by
international test labs with Type
Test Certificates.
Provide engineering design and
solution to Perusahaan Listrik
Negara Indonesia.
DEVELOPING NEW BUSINESS OPPORTUNITIES
In the spirit of expanding its footprint globally, TNB has focused on enhancing its earning
base locally and in emerging markets which are expected to see continuous and dynamic
growth. The Business Development Department spearheads this initiative by continually
exploring opportunities for partnerships and collaborations with international corporations
in electricity related businesses.
Despite the Arab Spring that stymied TNB’s efforts in the Middle East and North Africa
during the year under review, TNB continues to seek potential power projects in this
region. Within Southeast Asia, TNB is exploring opportunities in Indonesia, Vietnam and
Bangladesh. The company has also begun to look into the possibility of venturing into
upstream businesses in order to enhance fuel security.
155
KEEPING THE LIGHTS ON
Ope
ratio
ns R
evie
w–
Non
-Cor
e Bu
sine
sses
Annual Report 2012
Operations Review – New Business & Major Projects

Although TNB’s prospects are challenged
by global uncertainties and increasingly
competitive markets, there are more
opportunities now than ever given the
liberalisation of power markets throughout
the region. TNB has therefore outlined
several strategies to gain a competitive
edge, which includes creating effective
market intell igence and partnership
programmes. TNB looks forward to
collaborations with major players in the
i n d u s t r y t o b r o a d e n i t s b u s i n e s s
opportunities and enhance its investment
prospects in the longer term.
INVESTMENT MANAGEMENT
The Investment Management Department
in Group Finance oversees TNB’s local and
foreign investments with the aim of
bringing positive value to TNB as a whole.
This it achieves by closely monitoring the
financial and operational aspects of TNB’s
investments in key subsidiaries and
associate companies. The Department sets
strategic directions for each subsidiary and
continuously monitors performance
towards achieving TNB’s long-term goal of
increasing its non-regulated revenue.
MAJOR PROJECTS
On-going Projects
Hulu Terengganu Hydroelectric Project
(250MW)
Construction of the Hulu Terengganu
Hydroelectric Project consists of four work
packages – the Preliminary Civil Works,
Main Civil and Associated Works, Electrical
and Mechanical Plant and the High Voltage
Switchyard. Preliminary Civil Works was
awarded to AZRB and commenced in
January 2010. Upon its completion in May
2011, the project site was handed over to
the Main Civil Works contractor, Loh & Loh
Sinohydro JV, which was awarded the
contract in September 2010 with a
construction period of 56 months. The
contract for the Electrical & Mechanical
Works was awarded in October 2010 to the
consortium of Alstom Hydro Malaysia &
Alstom Power India Ltd, with a construction
period of 55 months. The High Voltage
Switchyard works will be undertaken by
Transmission Division. HTJV, a consortium
of SNC Lavalin Inc, SNC Lavalin Power
(Malaysia) Sdn. Bhd., KTA Tenaga and G&P
Associates, is the engineering consultant
for this project. Commercial operations of
the first unit is targeted to begin on 16
September 2015, followed by the second
unit on 17 December 2015. In addition, the
Energy Supply Committee (ref: JPT Bil.
4/2011 dated 12 August 2011) approved a
proposal to implement a small Hydropower
Plant (2x7.5MW, 53 GWh/a) at the Tembat
Transfer Tunnel outlet. This will be done
through an open tender separate from the
main contract. Commercial operations is
targeted for 2016.
Ulu Jelai Hydroelectric Project (372MW)
Preliminary Civil Works for the Ulu Jelai
Hydroelectric Project was awarded to the
TM-Salini consortium in August 2010, with
a construction period of 12 months. Work
commenced in October 2010. The contract
for the Main Civil and Electrical & Mechanical
Works was awarded to the same consortium
in December 2010, and work commenced
in March 2011. SMEC International Pty Ltd
entered into a joint venture agreement
with SMEC (Malaysia) Sdn. Bhd. as the
engineering consultant for this project. The
first unit is targeted to begin commercial
operations in December 2015, followed by
the second unit in March 2016.
Manjung Coal-Fired Power Plant Project
(1,000MW)
On 23 August 2010, the Government
awarded TNB a contract to build a 1,000MW
Coal-Fired Power Plant (“Project”) based on
the build, own and operate (BOO) concept.
For strategic financing purposes, TNB has
156
TENAGA NASIONAL BERHAD (200866-W)
Ope
ratio
ns R
evie
w–
Non
-Cor
e Bu
sine
sses
Annual Report 2012
Operations Review – New Business & Major Projects

identified TNB Janamanjung Sdn. Bhd.
(TNBJ) as the owner and developer of the
project, hence will operate the new power
plant as an independent power producer
(IPP). TNBJ subsequently awarded the
engineering, procurement and construction
(EPC) contract to the ALSTOM-CMC
consortium on 31 March 2011, which also
serves as the commencement date of the
contract. The project is located adjacent to
the existing Sultan Azlan Shah Power
Station in Manjung, Perak.
The new power plant will use the latest
supercritical boiler technology, which is
more efficient than conventional coal-fired
boilers. Accordingly, the new plant is
expected to operate at an efficiency level of
39.8%, which is higher than the 35%
efficiency level of the existing Sultan Azlan
Shah Power Station. This means that the
boiler will burn less coal, hence emit less
NOX, SO
X, CO
2 and particulates.
The Detai led Environmental Impact
Assessment Report was approved by the
Department of Environment on 22 February
2011, following which the Manjung
Municipal Council granted it planning
permission (Development Order) on
24 March 2011. TNBJ has also successfully
achieved its financial closing date on
15 November 2011. All project documents
related to the new power plant, such as the
Power Purchase Agreement, Coal Supply
and Transportation Agreement, and two
Shared Facilities Agreements were executed
successfully on 25 October 2011. TNBJ
has also obtained an IPP Licence from
the Energy Commission of Malaysia on
30 January 2012 for a 25-year period
commencing 31 March 2015 up to and
including 31 March 2040. For the coal
handling from the jetty to the new power
plant, TNBJ and Lekir Bulk Terminal Sdn.
Bhd. (LBT) signed a Jetty Terminal Usage
Agreement No. 2 on 27 July 2012 which
was approved by the shareholders of
Integrax Berhad (a holding company of
LBT) on 24 August 2012. The overall EPC
contract is progressing ahead of plan and
the plant is scheduled to begin commercial
operations on 31 March 2015.
Lahad Datu Combined Cycle IPP Project
(300MW)
The Federal Government, through the
Public Private Partnership Unit (UKAS),
awarded the combined cycle project to a
consortium of TNB (50%), Petronas (30%)
and the Sabah State Government (20%) on
25 July 2011. The power plant will be fueled
by natural gas from the proposed Petronas
LNG plant in the same area.
A project company, Eastern Sabah Power
Consortium Sdn. Bhd., was formed by
TNB in October 2011 to undertake the
project. Subsequently, in August 2012, a
Subscription and Shareholders’ Agreement
was signed between Orion Mission Sdn.
Bhd. (representing TNB), Petronas Power
Sdn. Bhd. (representing Petronas) and
Warisan Harta Sabah Sdn. Bhd. (representing
the Sabah State Government) to subscribe
to shares in the project company. Preliminary
works are on-going with the Power System
Studies while the Geotechnical Investigations
were completed in July 2012 and the
Environmental Impact Assessment is
pending approval from the Department of
Environment. Negotiations for a Power
Purchase Agreement with SESB, Gas Supply
Agreement with Petronas and Land Lease
Agreement with POIC Sabah Sdn. Bhd.
are on-going. The EPC contract is expected
to be awarded in mid-2013 while the first
unit is expected to be commissioned by
end 2015.
Jengka Biomass Power Project (10MW)
FTJ Bio Power Sdn. Bhd. (FTJ), a joint
venture (JV) company between TNB and
Felda Palm Industries Sdn. Bhd. (FPI), is
developing a 10MW biomass power plant
in Jengka, Pahang, with financing from the
Kuwait Finance House (Malaysia) Berhad.
The project was developed under the Small
Renewable Energy Power Programme
(SREP) launched by the Government to
promote renewable energy in power
generation in line with the Fifth Fuel Policy
and to reduce greenhouse gas emissions.
The plant, located at Jengka 9, Mukim
Chenor in Maran, will use palm oil empty
fruit bunches (EFB) as its primary source of
fuel. A Fuel Supply Agreement (FSA)
between FPI and FTJ has been signed for
supply of EFB from neighbouring FPI palm
oil mills. An Operation & Maintenance
Agreement (OMA), valid for six years will be
signed between TNB REMACO and FTJ.
157
KEEPING THE LIGHTS ON
Ope
ratio
ns R
evie
w–
Non
-Cor
e Bu
sine
sses
Annual Report 2012
Operations Review – New Business & Major Projects

C o n s t r u c t i o n o f t h e p o w e r p l a n t
commenced in May 2011 and is expected
to be completed in December 2012. FTJ
obtained Feed-in Approval (FiA) from the
Sustainable Energy Development Authority
(SEDA) in March 2012 under the Feed-in
Tariff (FiT) policy, which allows FTJ to sell
power to TNB at RM0.30/kWh in its first
year of operation. FTJ has also applied for
the project to be registered under the
Clean Development Mechanism (CDM) in
line with the Kyoto Protocol. This will allow
FTJ to participate in carbon credit trading
based on Certified Emission Reduction
(CER). The project is expected to contribute
to a reduction of about 35,000 tons of CO2
emissions annually.
Feasibility Study MOU of Potential Biogas
Projects at Sime Darby Plantations
Technical and financial feasibility studies for
potential biogas power plants using palm
oil mill effluents at identified Sime Darby
plantations were completed in November
2011. In February 2012, Mitsui & Co Ltd
decided not to invest in the joint venture
and withdrew from the MOU. In July 2012,
TNB and Sime Darby agreed to proceed
with developing the biogas power plants at
selected palm oil mills. A joint venture
company for the development and
implementation of the power plant will be
formed in the first quarter of the financial
year 2013.
Geothermal Development Programme
The geothermal development programme
has been stopped as TNB’s prerequisite for
exclusivity to access and develop the
identified potential sites was denied.
New Projects
Connaught Bridge Single Shaft Combined
Cycle Project (350MW)
The project will utilise an M701F3 MHI
gas turbine, to be incorporated with a
generator and a steam turbine in a single-
shaft arrangement. Connaught Bridge
power station was selected as the most
suitable site because of its available
infrastructure and strategic location to the
load centre. The Environmental Impact
Assessment study has been in progress
and is expected to be completed in
November 2012. The EPCC tender has
been floated and will be awarded in April
2013. The plant is expected to begin
commercial operations in August 2015.
Chenderoh Addit ional Generat ion
Capacity – Unit 5
This project will add a fifth generating
unit to the existing four units at the
Chenderoh Hydroelectric scheme. It will
harness the otherwise wasted energy from
the water spilling off the Chenderoh dam,
especially in the monsoon season. The
estimated annual energy output that can
be generated is 22.5GWh per year.
The contract for engineering services is
expected to be awarded by end of 2012,
while commercial operations is expected
to begin by end of 2018.
Tekai Hydroelectric Project (155.8MW)
The proposed project is located on Tekai
River in the district of Jerantut, Pahang.
The project will consist of two cascading
dams, namely Upper Tekai Dam and Lower
Tekai Dam, both of which will have surface
powerhouses or power stations. The
surface power station at Upper Tekai will
have an installed capacity of 150MW
peaking generating units while Lower
Tekai will have an installed capacity of
5.8MW base-load generating unit. The
proposed scheme will have a total installed
capacity of 155.8MW and an average
annual energy output of 274GWh.
In July 2012, the Government awarded the
project to TNB with a Commercial
Operation Date (COD) commencing in year
2020 with reasonable tariff. The project will
replace the need to plant up an equivalent
open cycle gas turbine (OCGT) plant. The
objective is to provide a financially viable
peaking hydroelectric scheme designed in
accordance with international standards.
158
TENAGA NASIONAL BERHAD (200866-W)
Ope
ratio
ns R
evie
w–
Non
-Cor
e Bu
sine
sses
Annual Report 2012
Operations Review – New Business & Major Projects

Future Projects
Proposed projects in Telom (132MW),
Sungai Pelus (34MW), Talong Sengoh
(200GWh per year), Lebir (274MW) and
Nenggiri (416MW) are at various stages of
d i s c u s s i o n / a c t i o n b e t w e e n T N B
management and state authorities.
TNB Repair and Maintenance Sdn. Bhd.
TNB Repair and Maintenance Sdn. Bhd.
(TNB REMACO), a business unit under New
Buisiness & Major Projects Division, provides
repair, maintenance and testing services as
well as the refurbishment of components.
Throughout the years, it has diversified into
project development and operations and
maintenance, both locally and overseas.
The primary focus of TNB Repair and
Maintenance Sdn. Bhd. (TNB REMACO) is on
TNB’s power plants in the fields of
scheduled maintenance and repair ,
refurbishment of components and testing
services. With a proven track record of over
30 years in power plant repair and
maintenance, TNB REMACO is Malaysia’s
premier specialist in this area. Over the
years, however, it has expanded beyond
TNB and diversified its business into other
areas such as project development and
operation and maintenance (O&M). TNB
REMACO was awarded the Power Plant
Service Provider of the Year at the 2012
Frost & Sullivan Malaysia Excellence Awards.
During the financial year, TNB REMACO
achieved a record revenue of RM543
million; an increase of RM188 million from
the previous year. Among the significant
contracts awarded during the year were
the Relocation of 2X32MW Frame 6 Gas
Turbine Generating Sets and Balance of
Plant from Teluk Ewa to Tawau Main Intake
Sabah; and the provision of Project
Management and Consultancy Services
(PMC) for the Construction of a 300MW
Gas Fired Combined Cycle Plant by Eastern
Sabah Power Consortium (ESPC) in Lahad
Datu, Sabah. The company also undertook
refurbishment works in Pupuk Kaltim,
Indonesia and Pulau Seraya, Singapore; and
completed a second job in Yemen for
Public Electricity Corporation (PEC). This
was to perform a 16,000EOH Minor
Inspection on the 3Xv94.2 Siemens Gas
Turbine at the Marib Power Station.
TNB REMACO signed a few Memorandums
of Understanding (MoUs), Joint Ventures
(JVs) and Non Disclosure Agreements
(NDAs) with its Malaysian and international
partners for overseas ventures. Among
these are:
● JV with Kharafi National, Kuwait for
Shuaibah North, Az-Zour and Sibayya
for O&M contracts
● NDA on Rehabilitation and Long Term
Service with DHA, Pakistan
● Agency Agreement with Sawary, Saudi
Arabia
● MoU with Mashor, Brunei
● NDA with Crescent Power and WIKA,
Indonesia
● NDA with Dyna Synegy and AYD,
Myanmar
TNB REMACO is currently exploring some
O&M contracts within its target markets,
including:
● 2X750MW combined cycle gas turbine
plant in Dairut, Egypt
● 94MW combined cycle and desalination
plant in DHA, Pakistan
● 2X600MW plant in Duyen Hai, Vietnam
● 2XFrame 5 Murphy Oil, Bintulu, Sarawak
In addition, TNB REMACO is exploring
defect warranty work in Yemen; a gas
turbine overhaul and balance of plant
project in Vietnam; and steam turbine
overhaul in Myanmar among various other
maintenance and repair projects globally.
159
KEEPING THE LIGHTS ON
Ope
ratio
ns R
evie
w–
Non
-Cor
e Bu
sine
sses
Annual Report 2012
Operations Review – New Business & Major Projects

GROUP FINANCEFazlur Rahman bin ZainuddinChief Financial Officer/Vice President
Group Finance Division has always supported TNB’s core function of ‘Keeping the Lights On’ by sustaining the company’s financial health whilst ensuring sound investment decisions and financial management.
Towards enhancing TNB’s financial management, Group Finance Division manages not only the conventional finance functions but also other related functions, as depicted below:
In addition, the various units in Group Finance Division play key roles in:
● Keeping TNB’s costs at manageable levels
● Acting as a focal point in assisting other business units to make informed
decisions on financial and commercial matters
GROUP FINANCE
DIVISION
FINANCIAL
PLANNING
TREASURYCORPORATE
FINANCE
RISK
MANAGEMENT
INVESTOR
RELATIONS
BUDGETING
TAXATIONFINANCIAL AND MANAGEMENT
REPORTING
160
TENAGA NASIONAL BERHAD (200866-W)
Ope
ratio
ns R
evie
w–
Non
-Cor
e Bu
sine
sses
Annual Report 2012
Operations Review

161
KEY ACHIEVEMENTS
During the financial year 2012, Group Finance Division continued to play a vital
role in managing the finance functions of the TNB Group. Key achievements
include the following:
● Assisting TNB Janamanjung Sdn Bhd in the RM4.85 billion Islamic Securities
issue for the development of the 1,100MW coal-fired power plant
● Implementing strategic initiatives to optimise costs incurred in developing
TNB Janamanjung Sdn Bhd‘s coal-fired power plant
● Supporting the SAVE programme initiated by the Ministry of Energy,
Green Technology and Water
● Implementing prudent tax management as part of TNB’s cost optimisation
initiatives
● Preparing for the implementation of the Incentive-Based Regulation
ASSISTING TNB JANAMANJUNG SDN BHD IN THE ISSUANCE OF ISLAMIC
SECURITIES
During the year, the Corporate Finance Unit assisted TNB Janamanjung Sdn Bhd to
issue 20-year Ringgit denominated Islamic Securities worth RM4.85 billion to fund
the expansion of the 1,100MW coal-fired power plant at the Sultan Azlan Shah
Power Station in Manjung, Perak.
The Islamic Securities, based on an Ijarah structure, were assigned a long-term AAA
rating by RAM Ratings. During the book-building period, the Islamic Securities were
4.76 times oversubscribed and carried coupons ranging between 3.80% and 4.90%.
The exercise was named the Asia-Pacific Bond Deal of the Year by Project Finance
International (PFI) and the Ijarah Deal of the Year at the Islamic Finance News
Annual Awards.
OPTIMISING THE DEVELOPMENT COST
OF TNB JANAMANJUNG SDN BHD’S
COALFIRED POWER PLANT
In efforts to optimise the development cost
of TNB Janamanjung Sdn Bhd’s coal-fired
power plant , the Treasury Unit in
collaboration with TNB Janamanjung Sdn
Bhd has been carrying out opportunistic
spot purchasing of the US Dollar (USD) and
Euro (EUR) whenever the Malaysian Ringgit
strengthens against these currencies to set
up floats in Foreign Currency Accounts
(FCAs) which will act as a natural hedge. The
funds are then invested in the USD and EUR
deposits until the project payment date.
SUPPORTING THE SAVE PROGRAMME
The Treasury Unit was entrusted to carry
out the payment for the Sustainability
Achieved via Energy Efficiency (SAVE)
programme initiated by the Ministry of
Energy, Green Technology and Water.
The programme aims to encourage greater
adoption by the public of energy-saving
electrical appliances by providing rebates
for air-conditioners and refrigerators. In
support of this programme, more than
6,000 payment transactions were executed
in the financial year 2012.
16166666666666611111111111111111161
KEEPING THE LIGHTS ON
Ope
ratio
ns R
evie
w–
Non
-Cor
e Bu
sine
sses
Annual Report 2012
Operations Review – Group Finance

IMPLEMENTING PRUDENT TAX
MANAGEMENT
The Tax Unit facilitates TNB and its
subsidiaries, both locally and overseas, in
implementing strategic tax planning
initiatives which include continuous efforts
to obtain government fiscal incentives and
exemptions in addition to implementing
compliance efforts to keep abreast of new
tax legislations. Key achievements in the
year include:
● obtaining approval for tax incentives
and exemptions resulting in tax savings
of RM2.1 billion for TNB Janamanjung
Sdn Bhd’s 1,100MW coal-fired power
plant, and
● achieving RM267 mi l l ion in tax
exemptions, thus reducing TNB’s capital
cost structure
PREPARING FOR THE INCENTIVEBASED
REGULATION
Preparations for the Incentive-Based
Regulation (IBR) proposed by the Energy
Commission are on-going and Group
Finance through its Financial Planning and
Divisional Accounting Unit is part of the
Working Group entrusted to ensure that
TNB complies with the framework as
outlined in the Regulatory Implementation
Guidelines (RIGs). Key tasks include
e s t a b l i s h i n g a m o r e r o b u s t a n d
comprehensive Revenue Requirement
Model, Regulatory Weighted Average Cost
of Capital, Cost of Service Model and
Regulatory Accounting Framework to
complement and support the IBR initiatives.
OUTLOOK AND THE WAY FORWARD
The financial year 2012 was initially
challenging to TNB’s cash position following
the increase in fuel costs due to the shortage
of natural gas supply in the first quarter.
However, subsequent compensation by
Petronas and the Government helped to
ease the burden.
Globally, the economic slowdown, especially
in the United States and China, and the
current European sovereign debt crisis had
resulted in the weakening of the Ringgit
against the US Dollar. This in turn affected
TNB’s operation costs.
Going forward, the main areas of focus in
the power sector will be: open bidding for
new power plants, implementing the
Incentive-Based Regulation, establishing an
effective fuel cost pass through mechanism
and renewing power purchase agreements
with independent power producers (IPPs).
Even as the market conditions remain
uncertain, Group Finance Division will
continue to support the Group’s capabilities
and growth aspirations to safeguard TNB’s
financial viability particularly in relations to
cash liquidity. The Division as a whole will
continue to strive for efficient and effective
cost management initiatives, with special
focus on value creation in the financial year
2013 to ensure financial sustainability.
As the Group moves forward to expand
globally, the Division will continue to play a
leading role in the quest to achieve TNB’s
strategic objectives.
162
TENAGA NASIONAL BERHAD (200866-W)
Ope
ratio
ns R
evie
w–
Non
-Cor
e Bu
sine
sses
Annual Report 2012
Operations Review – Group Finance

PLANNINGDatin Roslina binti ZainalVice President
HIGHLIGHTS OF ACHIEVEMENTS
● Financial compensation for the natural gas shortfall● Competitive bidding for new power plants● Implementation of the Incentive-Based Regulation (IBR)● Progress on TNB’s 5-Year Strategic Plan – GEMILANG 2015
Planning Division is entrusted with three key responsibilities:
● To ensure sufficient, reliable and affordable power supply to meet the nation’s electricity demand
● To ensure activities related to energy procurement, including negotiations and management of power purchase agreements (PPA) with power producers and cross border interconnections, are administered effectively and professionally in accordance with provisions of the PPA
● To ensure the formulation and subsequent implementation of long-term strategic plans are aligned towards TNB vision, mission and strategic objectives
163
KEEPING THE LIGHTS ON
Ope
ratio
ns R
evie
w–
Non
-Cor
e Bu
sine
sses
Annual Report 2012
Operations Review

Competitive Bidding to Meet Future
Generation Capacity Needs
In view of increasing electricity demand
and the expiry of existing generators in the
system (including those in first-generation
Independent Power Producers), there is a
need to secure fresh generation capacity.
This is being done via an international
competitive bidding process, facilitated by
the Energy Commission (EC). The EC has to
date invited bidders to participate in two
tracks of competitive bidding. Track 1
targets to secure between 1,000MW to
1,400MW capacity of combined cycle power
plant at Prai while Track 2 targets the
extension of existing generators for a total
capacity of about 2,250MW. Both Tracks 1
and 2 are to fulfil the capacity requirement
for years 2016 and 2017. Tenders will be
awarded to the successful bidders in
October 2012.
Incentive-Based Regulation (IBR)
The EC has initiated the introduction of a
new tariff regulation framework called the
Incentive-Based Regulation (IBR). Its key
objectives are to enhance the electric
utility’s efficiency and improve transparency
in determining consumer tariffs. Salient
features of the IBR include:
a. Accounting separation of TNB’s
business entities
b. Imbalanced cost pass through,
including the fuel cost pass through
mechanism
c. Incentive mechanism for performance
indicators
d. Determination of reasonable returns
to TNB
e. Tariff determination process and
decision (regulatory period)
f. Stakeholders/consumers consultation
regarding tariff reviews
g. Regulatory accounts and reporting
Planning Division leads a cross-divisional
team to engage with the EC in a series of
meetings and discussions to ensure the
successful implementation of IBR. A TNB IBR
Council was formed in June 2011 comprising
members of the Group Executive Council
Committee and led by the CEO to manage,
coordinate and oversee the implementation
of the IBR. All information and data
dissemination to the EC in relation to IBR
will be centralised and coordinated by the
TNB IBR Council and taskforce.
MANAGEMENT OF MAJOR STRATEGIC
ISSUES
Impact of Gas Shortfall, Mitigation and
Compensation
The power industry began to experience
major interruptions in gas supply in early
2010, which worsened in December 2010
due to fire at Petronas Bekok C platform. In
order to keep the lights on, TNB had to
turn to alternate fuels (oil and distillates)
which are five to six times more expensive
than gas. It also had to purchase more
expensive electricity from neighbouring
utilities to ensure continuous supply.
Following the Government’s decision to
implement a cost sharing mechanism as a
result of the gas curtailment, TNB is being
compensated for two-thirds of the
additional fuel costs it has had to face. To
date, it has received RM2,046 million in
January 2012 as compensation for the
period January 2010–October 2011, and
RM356 million for the period November
2011 to March 2012. TNB is also expected
to receive RM751 million to compensate for
the cost differential for the remaining
period of the financial year 2012.
164
TENAGA NASIONAL BERHAD (200866-W)
Ope
ratio
ns R
evie
w–
Non
-Cor
e Bu
sine
sses
Annual Report 2012
Operations Review – Planning

The EC has released a set of IBR Regulatory
Implementation Guidelines (RIGs) and
implementation plan indicating a trial
period for IBR from September 2013 to
August 2014. The first regulatory period
with full IBR will be from September 2014
to August 2017.
Periodic Fuel Cost Pass Through (FCPT)
Mechanism
From 2009, the Government has in principle
approved six-monthly reviews of gas and
coal prices, with the electricity tariff
adjusted accordingly, under the Fuel Cost
Pass Through (FCPT) mechanism. Tariff
reviews since then have incorporated the
price reviews of gas and coal. The FCPT is
crucial for TNB, particularly in view of the
fluctuating market price of coal as well as
the inevitable increase in fuel cost
associated with the introduction of LNG
into the generation mix.
Planning Division leads a cross-divisional
tariff team tasked with engaging relevant
Government agencies in tariff review
exercises, including the FCPT. Under RIG 8 of
the IBR framework, the EC has proposed the
implementation of a mechanism known as
the Imbalance Cost Pass Through (ICPT) in
which the FCPT would form a major
component. TNB has worked closely with the
EC to develop and refine a more transparent
ICPT/FCPT formula in addition to providing
the necessary fuel cost data. To date, the
ICPT/FCPT principles and calculations have
● Smart Grid Plan and Projects: Pilot
projects with low network loss and
higher reliability have been identified in
the Bukit Bintang commercial area,
Bayan Lepas industrial area and Medini
( W i l a y a h I s k a n d a r , J o h o r ) . T h e
Government has agreed to provide
some funding via the AAIBE fund for
Smart Grid initiatives.
● Research, Training and Capacity
Building: TNB’s training and research
c e n t r e s , n a m e l y t h e C e n t r e f o r
Renewable Energy (CRE), Institute of
Energy Policy and Research (IEPRe) and
ILSAS, conduct carbon footprint studies
and provide training for energy
m a n a g e r s w h i l e d e v e l o p i n g E E
equipment/processes leveraging on in-
house research and expertise.
Demand Side:
● Demand Side Management (DSM) and
Energy Efficiency (EE) Initiatives: These
include DSM analysis of tariff schemes/
incentives and Demand Response (DR)
studies and pilot projects, as well as
c o n t i n u o u s c o m m u n i c a t i o n a n d
awareness programmes through
internal and external media on the
creation of EE buildings and paperless
office environments.
been agreed by the EC and will be tabled to
the Ministry of Energy, Green Technology
and Water for approval.
TNB Initiatives in Supporting Sustainable
Clean Power Options
Together with the pledge of Keeping the
Lights On, TNB is constantly expanding its
business strategies and practices that
support sustainable development across
the organisation’s value chain. These
developments can be divided into two
m a in categor ies which ref lect the
fundamentals of the electricity supply
industry – the supply and demand sides.
The supply side comprises generation,
transmission and distribution of the
electricity value chain while the demand
side is made up of electricity customers.
Supply Side:
● Continuous Support of Low-Carbon
Generation Technologies: These include
the development of the 10MW Biomass
Plant in Jengka, Pahang; mini-hydros;
solar hybrids and bio-gas projects
alongside the continuous improvement
of TNB plant’s efficiency utilising the
latest technologies available. TNB
further manifests its commitment to the
development of Green Energy via the
Small Renewable Energy Programme
(SREP) and the current Feed-in-Tariff
(FiT) framework.
165
KEEPING THE LIGHTS ON
Ope
ratio
ns R
evie
w–
Non
-Cor
e Bu
sine
sses
Annual Report 2012
Operations Review – Planning

A l l o f t h e s e d e v e l o p m e n t s a r e
coordinated via Green Renewable Energy
and Energy Efficiency Roundtable,
otherwise known as GREENER TNB. The
aim is to coordinate the green initiatives
of al l TNB business entit ies and
subsidiaries and to define their roles in
view of the broad spectrum of TNB’s
Green Energy Policy. In extending the
role of GREENER to a wider audience, a
GREENER portal has been established as
a platform for green energy awareness.
Malaysian Electricity Supply Industry
(MESI) Reform Initiatives
As the country faces challenges in ensuring
electricity supply availability and affordability,
the Government has launched reforms to
enhance transparency and efficiency of the
industry as well as to ensure competitive
end user tar i f fs . TNB supports the
Government in its efforts to reform the
Malaysia Electricity Supply Industry (MESI)
through various initiatives, workshops and
Government engagements. These include
the MESI Reform Lab, New National Energy
Policy, Subsidy Reduction Plan, Incentive-
Based Regulation and the KETTHA/MyPower
MESI reform. TNB also supports related
programmes, notably the New Economic
Model (NEM), Economic Transformation
Programme (ETP) and Government
Transformation Programme (GTP).
FUEL SUPPLY SECURITY
Natural Gas and LNG Supply Arrangement
In 2011, the average supply of gas to the
power sector was only 924mmscfd, well
below the power sector requirement of
1,250mmscfd. Hence, TNB was unable to
fully utilise all the gas-fired power plants to
meet consumers’ demand. As a result,
alternative fuels namely coal, MFO and
distillates were used and electricity was
imported from neighbouring countries – all
at about six times the cost of gas – to meet
TNB’s obligation “to keep the lights on at
all costs”.
However, the gas supply situation is
e x p e c t e d t o i m p r o v e t h r o u g h t h e
commissioning of the Re-Gasification
Terminal (RGT) in Melaka by the end of
2012. This will allow TNB to use imported
LNG to make up for the shortage of gas
supply to the power sector.
Long-Term Generation Fuel Mix Study
Generation Planning Unit of the Planning
Division is working closely with the Ministry
of Energy, Green Technology and Water, the
Energy Commission, MyPower Corporation
and the Economic Planning Unit in the
Prime Minister’s Department to formulate a
long-term generation fuel mix for Peninsular
Malaysia. The study is critical for the country
to move forward in view of the numerous
challenges faced in keeping the lights on.
Issues such as prolonged gas curtailment,
pressure of increasing gas price and future
dependency on expensive imported LNG
have forced the country to relook the
current fuel mix in the power sector. To
ensure a secure, reliable and sustainable
supply of electricity, a balanced fuel mix
approach must consider the availability of
domestic resources and the availability and
risks associated with imported resources
and their countries of origin. The study also
serves as a strategic guide for future fuel
procurement planning and generation
system expansion plans.
5-Year GEMILANG 2015 Implementation,
Monitoring and Progress
The monitoring of Key Action Plans for
each Key Initiative under GEMILANG 2015 is
important to ensure TNB achieves its
targets of expanding its businesses and
services globally by 2015. The division’s Key
Action Plans and annual KPIs are monitored
collectively to ensure proper alignment
between the business planning activities
and the annual KPI Plan, and also to
increase the effectiveness in the execution
of the action plans and activities. At the
corporate level, the status of GEMILANG
2015 Key Action Plans and TNB’s annual
KPIs are reported to the management on a
quarterly basis.
Top Management KPIs
(derived from Division Balanced
Score card)CORPORATE
LEVEL
OVERSIGHT
PLATFORM
DIVISION LEVEL
Monitored by Strategic Planning (Quarterly)
Critical work plan for critical key initiatives
Division KPIs, Key Initiatives and detailed work plan all key
initiatives
Monitor through Strategic Planner Meeting (Quarterly)
Monitored by Div SMOD (Monthly)
28 Key Initiatives
(derived from Annual Operating
Plan)
GEMILANG 2015 MONITORING PROCESS
166
TENAGA NASIONAL BERHAD (200866-W)
Ope
ratio
ns R
evie
w–
Non
-Cor
e Bu
sine
sses
Annual Report 2012
Operations Review – Planning

LONGTERM SYSTEM PLANNING AND
DEVELOPMENT
Long-Term New Generation Option
Generation Planning Unit of the Planning
Division has assisted the EC in analysing
and studying the long-term generation
system expansion plan. The outcome of the
study was then presented to the Electricity
S u p p l y a n d T a r i f f P l a n n i n g a n d
Implementation Committee (JPPPET)
chaired by the Minister of Energy, Green
T e c h n o l o g y a n d W a t e r . T h e s t u d y
incorporates all potential big hydro power
plants (more than 30MW) as future
candidates in order to diversify the country’s
fuel mix. It also included thermal power
plants with high efficiency levels – e.g. coal
plants with 40% efficiency and gas fired
power plants with 50%-60% efficiency.
Moving forward, long-term options being
considered include importing energy from
Sarawak and Sumatera, and developing
nuclear power plants locally.
Transmission Development Plan
Planning of the transmission system is
carried out annually to ensure that the
power supply in Peninsular Malaysia is
adequate and secure in catering for growth
in electricity demand while complying with
the Malaysian Grid Code. The planning
incorporates detailed evaluation of the
adequacy and security of the system
through comprehensive simulation studies.
It also identifies appropriate locations for
future power plants and ensures adequate
power compensation requirements.
QUALITY MANAGEMENT AND OTHER
INITIATIVES
Planning Division strives to improve its
planning and operational processes
through quality initiatives such as Planning
Operation Control via Process Improvement
in line with ISO 9001:2008. To date, 29
processes and 30 work instructions have
been created for the Division. These
processes have been, and will continue to
be, closely monitored and continually
improved through audits and other
processes/initiatives. Recent audits have
seen a shift from a procedural to a process
approach and the division is well-positioned
to adapt to this development. The Process
Standardisation and Improvement (PSI)
culture has been fully adopted by the
Div is ion and the management has
demonstrated strong commitment to
continually improving its implementation.
At the same time, Planning Division
continues to strengthen the spirit of team
work internally through the Ganbatte
programme, which has also served to
facilitate a positive culture of change
management.
PROSPECTS
P l a n n i n g D i v i s i o n f a c e d n u m e r o u s
challenges in the financial year under
review, the most significant being the gas
shortfall, which severely impacted the
company’s bottom line. However, this has
subsequently been partially alleviated by
the Government’s compensation scheme.
With uncertainties in global economies,
especially in Europe, the coming years are
e x p e c t e d t o b e i n c r e a s i n g l y m o r e
challenging. Over and above economic
uncertainties, TNB faces the additional
challenges of depleting indigenous energy
resources, volatile LNG market prices, and
the implementation of the IBR as well as
increased environmental concerns.
Given this scenario, Planning Division’s role
will be even more critical than ever in
identifying and strategising opportunities
that lie ahead in order that TNB is able to
realise its 20-Year Strategic Plan.
167
KEEPING THE LIGHTS ON
Ope
ratio
ns R
evie
w–
Non
-Cor
e Bu
sine
sses
Annual Report 2012
Operations Review – Planning

Dato’ Roslan bin Ab RahmanChief Corporate Officer
CORPORATE AFFAIRS &
SERVICES
OFFICE OF THE CHIEF CORPORATE OFFICER
Corporate Affairs and Services is a new division that incorporates the functions previously carried out by Corporate Affairs and Corporate Services, which include regulatory matters and stakeholder management. One of the main focus areas of the division is the engagement and education of stakeholders. In times of rapid change such as the present, TNB needs to ensure that its interests and business viability are protected. Among the many challenges it can expect to face in the near future is the Incentive-Based Regulation (IBR) under which the regulator will introduce industry incentives and penalties based on international benchmarks.
The open access gas network will present another challenge, as it will entail the creation of various regulations and codes such as the Gas Act, Gas Network Code and RGT Code.
The Chief Corporate Officer will undertake to manage these and other challenges while also ensuring that TNB’s corporate social responsibility (CSR) serves as a strategic tool to enhance TNB’s image.
Dato’ RChief C
168
TENAGA NASIONAL BERHAD (200866-W)
Ope
ratio
ns R
evie
w–
Non
-Cor
e Bu
sine
sses
Annual Report 2012
Operations Review

Adelina IskandarVice President
CORPORATE AFFAIRS &
COMMUNICATIONS
Once again, in 2011/12, TNB won the Brand
Laureate Award in the category of Power
Utilities. As the division responsible for
managing TNB’s brand and image,
Corporate Affairs is proud of this external
recognition of the company’s strengths and
identity. It is through the division’s strategic
communication initiatives that TNB’s
reputation is constantly reinforced.
Yet another reflection of TNB’s growing
market reputation was its being placed 8th
on the list of 100 Most Valued Brands in
Malaysia, following a survey conducted by
Brand Finance Consultancy Pte. Ltd.
(Singapore).
In the financial year 2012, Corporate Affairs
Division continued its communication and
branding support of the Group, focusing in
particular on its energy efficiency initiatives.
T h i s w a s a c h i e v e d t h r o u g h p r i n t
advertisements and promotional efforts.
TNB issued ads in the News Straits Times
(NSTP) publications featuring energy saving
tips using Dato’ Lat’s cartoons; and
continued to distribute energy-efficient
light bulbs at community events.
It also initiated an energy efficiency
awareness campaign, in collaboration with
WWF Earth Hour 2012. For five days from
13 March 2012, at selected Customer
Service Centre counters, TNB gave away car
stickers to promote renewable energy.
TNB further reinforced its image as a driver
of green energy during Earthweek 2012,
when it organised several educational
activities to increase the public’s awareness
of energy efficiency. Over and above these
events, Corporate Affairs continued to
collaborate with FOMCA on energy efficiency
awareness programmes.
Corporate Affairs also embarked a public
awareness campaign on the challenges
faced by TNB in Keeping the Lights On
within the context of depleting fuel and
escalating costs. A special 18-episode
programme was broadcast on Buletin
Utama TV3, highlighting these issues to
some 2.3 million viewers in an easy-to-
understand format.
To improve TNB’s relationship with the
media, various media communication and
crisis management workshops including
media visits were conducted for Senior
Management at the organisation. Media
briefings were also structured to promote
TNB’s involvement in green technologies,
energy efficiency and the Feed-in-Tariff.
169
KEEPING THE LIGHTS ON
Ope
ratio
ns R
evie
w–
Non
-Cor
e Bu
sine
sses
Annual Report 2012
Operations Review – Corporate Affairs & Services

Corporate Affairs also focused on TNB’s
Government Relations Internal Programme
(GRIP), which serves as one of many
platforms used to discuss issues and matters
at a regional level.
M e a n w h i l e , R e g u l a t o r y R e l a t i o n s
Management continued to improve its
operations by developing a Regulatory
Compliance Database (RCD) with assistance
from the Legal Services and Information
C o m m u n i c a t i o n T e c h n o l o g y ( I C T )
Departments. RCD acts as a depository centre
for all TNB regulatory compliance issues.
B e s i d e s m a n a g i n g T N B ’ s e x t e r n a l
stakeholders, Corporate Affairs also
organised social activities for TNB staff,
such as Jom la Futsal and Jom la Smash. In
addition, staff are also kept updated on the
latest corporate developments via SMS
blasts, news flashes, Bersama CEO and the
NewsTube.
Social activities were also extended to
TNB’s kindergarten children. A Kidz Art
Class was conducted at our gallery to
encourage the use of art as a medium of
expression.
Corporate Affairs continues to provide
communication and branding services to
support the TNB Group in upholding its
image among all its stakeholders.
PROSPECTS
Moving forward, Corporate Affairs has
reviewed and strategised its communication
and networking initiatives in line with
Gemilang 2015, to better serve TNB’s
stakeholders – internally and externally.
A comprehensive Communication Policy
has been put in place to ensure consistency
in information management. Corporate
Affairs is also in the midst of reviewing and
updating its Corporate Identity Manual to
m e e t e x p e c t a t i o n s i n t h e c u r r e n t
environment.
170
TENAGA NASIONAL BERHAD (200866-W)
Ope
ratio
ns R
evie
w–
Non
-Cor
e Bu
sine
sses
Annual Report 2012
Operations Review – Corporate Affairs & Services

CORPORATE SERVICES
As a business partner to TNB’s core divisions and subsidiaries, the Corporate Services
Division (CSD) is committed to ensuring TNB meets its objectives by providing efficient
and effective support services as well as day-to-day operations. CSD supports the Group
in the areas of security and intelligence, land and wayleave procurement, project
management, asset and archives management, architectural related works, building
maintenance, fleet and freight management, Customs clearance, mobile generator set
(genset) services and the management of telephone and mail services at the headquarters.
CSD carries out its wide-ranging duties through the core departments of Security and
Intelligence Services, Property Services, Logistics Services, Land & Wayleave Management
and its own Support Services Department.
CORPORATE SERVICES
As a business partner to TNB’s c
Division (CSD) is committed to en
and effective support services as w
in the areas of security and int
management, asset and archives
maintenance, fleet and freight m
(genset) services and the managem
CSD carries out its wide-ranging
Intelligence Services, Property Serv
and its own Support Services Depa
Md. Jailani AbasSenior General Manager
171
KEEPING THE LIGHTS ON
Ope
ratio
ns R
evie
w–
Non
-Cor
e Bu
sine
sses
Annual Report 2012
Operations Review – Corporate Affairs & Services

ACHIEVEMENTS
Achievements of CSD during the year under
review are highlighted below, listed
according to its core departments.
● L a n d & W a y l e a v e M a n a g e m e n t
Department (LWMD)
In order to mitigate objections from
land owners and reduce costs in land
procurement and construction, a
long-term plan is being implemented to
reserve and gazette land required by
TNB, especially for transmission line
c o r r i d o r s . T a k i n g a d v a n t a g e o f
new technology by working with
UNITEN, TNB is planning a 20-Year
Corridor for Transmission Lines using
‘Geomatic Innovation’ which involves
new survey methodology utilising GIS
software. This project is being carried
out in collaboration with the Federal
Department of Town and Country
Planning Peninsular Malaysia (JPBD),
D e p a r t m e n t o f S u r v e y a n d
Mapping Malaysia (JUPEM) and the
Corporate Geospatial Information
System (CGIS) team.
At the same time, the procurement of
land for wayleave will be done through
the Land Acquisition Act 1960 and
Electricity Supply Act 1990. To date,
Johor, Perak and Negeri Sembilan have
agreed to the use of the Land
Acquisition Act 1960, which will hasten
the land procurement process and
reduce its cost.
● Security Services & Intell igence
Department (SSID)
SSID successfully implemented an
Integrated Security Management
System (ISMS) in the Northern Zone
(Perak, Pulau Pinang & Kedah/Perlis),
Central Zone (Kuala Lumpur, Selangor &
Putrajaya) and Southern Zone (Johor,
Melaka & Negeri Sembilan). To support
the ISMS, patrol-cum-response teams
have been set up in the critical zones.
The department also obtained the
approval of the Polis DiRaja Malaysia
(PDRM) for the power of investigation
under the Criminal Procedure Code
(CPC) . Subsequent ly , a Cr iminal
Investigation Unit was formed with
branches at every state to investigate
offences under the Penal Code in
relation to TNB assets.
● Property Services Department (PSD)
PSD continued to expand TNB’s working
space through the purchase and rent of
office buildings and space, as well as
through renovation. Notably, an
11-storey office building was acquired
for the offices of the General Manager
(Selangor) and Area Manager (Subang
Jaya) of Distribution Division.
PSD also achieved value creation from
idle assets and asset management
amounting to RM51.52 million.
● Logistics Services Department (LSD)
LSD now operates as a one-stop centre
for generator set services, managing the
gensets belonging to TNB and private
vendors. To promote greater efficiency
of Genset Management, several Genset
centre were set up – in the Klang Valley
(Kelana Jaya), Northern region (Chain
Ferry) and Eastern region (Gong Badak,
Temerloh and Muadzam Shah). LSD,
together with ICT, had developed an
Integrated Genset Management System
( IGMS) to manage requests and
payments for genset services.
Over the year, LSD achieved RM39.8
million in value creation from its daily
operations of freight management and
tax exemption, fleet management and
mobile genset services.
DIVISIONAL GOALS/OBJECTIVES
CSD continuously strives to provide cost-
effective services to its internal and external
customers, both in project implementation
and operations in line with TNB’s vision,
mission and strategies. Apart f rom
supporting TNB’s Strategic Plan, CSD’s core
focus is to assure the Group’s stakeholders
and shareholders of quality security services,
and property and logistics management,
and lend them confidence in its ability to
procure land as required for projects.
OPERATIONAL SUMMARY
Security Services & Intelligence Department
(SSID) consists of four units, namely
Operation, Planning & Crisis Management,
Criminal Investigation and Support Services,
which provide security protection to
thousands of TNB installations across the
country. SSID also investigates criminal-
related cases involving TNB’s assets and
assists the Project team for site entry and in
cases of electricity power theft.
In the financial year 2011/2012, SSID
provided in-house security personnel for
TNB’s strategic and critical installations
such as its power stations, 500kV and 275kV
substations, regional warehouses and
control centres. It also provided private
security personnel for installations such as
the 132kV substations, PPUs, PEs, Kedai
Tenaga, and state and district offices.
Additionally, the department provided
172
TENAGA NASIONAL BERHAD (200866-W)
Ope
ratio
ns R
evie
w–
Non
-Cor
e Bu
sine
sses
Annual Report 2012
Operations Review – Corporate Affairs & Services

surveil lance, enforcement and theft
prevention support operations with the use
of appropriate technology, investigations
a n d i n t e l l i g e n c e o p e r a t i o n s , t h u s
safeguarding TNB’s assets.
T h e L a n d & W a y l e a v e M a n a g e m e n t
Department (LWMD) comprises five units,
namely the Transmission Services Unit,
Distribution Services Unit, Generation
Services Unit, Geomatics & Technical
Services Unit and Planning & Support
Services Unit. Among the core functions of
the department are to procure land &
wayleave as required for Distribution,
Transmission and Generation projects.
The Property Services Department (PSD)
comprises five units that provide property
support services to the core business
of TNB. It carries out property planning
and development, project and property
management and property maintenance
with the objective of enhancing TNB’s
asset value.
The Logistics Services Department (LSD)
comprises three units – Fleet, Mobile
Genset and Freight Management – and
plays the role of a one-stop integrated
centre that coordinates and provides cost-
effective and timely logistics services to
TNB. It is responsible for appointing panel
workshops, procuring new vehicles and
disposing of old ones, providing genset as
a back-up for system availability, and
providing freight services.
MAJOR PROJECTS
SSID is implementing the Integrated Security
Management System (ISMS) which consists
of deterrent, detection and response
modules at the Northern, Central, Southern
and Eastern Zones. Combining different
security solutions into one control system,
ISMS plays a crucial role in safeguarding
TNB’s assets from threats and intruders.
LWMD is securing sites and wayleave for
major projects, including the 275kV Kg.
Pandan-Ampang East, 500kV for S.J
Janamanjung, 275kV for bulk supply VALE
Iron Ore, Manjung, 275kV Ulu Jelai Hydro
Project, 275kV Air Tawar-Bukit Merah, 275kV
Baharu Steel, 275kV Eastern Steel and 132kV
Hongkew Cement. It is also implementing a
long-term plan to reserve and gazette
corridors for transmission lines.
LSD is managing Centralised Genset Services
via an Integrated Genset Management
System (IGMS) which was developed jointly
with ICT. A centralised Genset Control
Centre was set up at Kelana Jaya to cater for
all requests for genset services from
Generation, Transmission and Distribution.
PSD procured two multi-storey office
buildings in Kuala Lumpur and Subang Jaya
with a total nett floor area of 520,000 square
feet, which will relieve TNB from renting
office space in various locations in Kuala
Lumpur, Petaling Jaya and Shah Alam.
173
KEEPING THE LIGHTS ON
Ope
ratio
ns R
evie
w–
Non
-Cor
e Bu
sine
sses
Annual Report 2012
Operations Review – Corporate Affairs & Services

OPERATIONAL IMPROVEMENTS
To ensure continuous improvement in its
daily operations, CSD has initiated various
programmes covering human resources
management, r isk management, KPI
monitoring, customer engagement, quality
management, compliance management
and vendor management. It also overseas
TNB’s networking with customers and
regulators such as state governments, land
offices, PUSPAKOM, Customs, PDRM, the
Malaysia Anti-Corruption Agency (SPRM)
and the local authorities to foster better
relationships with them. At the same time,
a review of major processes has been done
to improve operations.
KEY PERFORMANCE INDICATORS KPIs
CSD measures the quality of its products
and serv ices us ing feedback f rom
customers, benchmarking, auditing and
through the application of its KPIs. KPIs are
identified via the Business Planning process
to measure the division’s performance in
the areas of finance, customer service,
internal processes and learning & growth.
Its Major KPIs are the management of
OPEX, value creation, the management of
assets, security, the fleet, mobile gensets
(ISMS, IFMS, IGMS), wayleave and land
procurement. CSD strives to satisfy
customers by delivering excellent service.
CHALLENGES AND PROSPECTS
In its quest to uphold the highest standards
of service, CSD faces numerous challenges.
The task of protecting thousands of TNB
installations across the country requires top
technology coupled with human effort.
Towards this end, SSID adopts and adheres
strictly to all necessary legislations while
cont inuously updat ing i ts secur i ty
technology. It also works closely with
enforcement agencies to carry out its
functions effectively.
L W M D , m e a n w h i l e , f a c e s t h e d u a l
challenges of a continuously appreciating
market value for land, which it needs to
procure, and public objection towards TNB
projects, especially those in urban areas.
These necessitate the constant reviewing of
plans to procure land.
Another challenge is the management of
under-utilised assets (non-core assets)
belonging to TNB to unlock their value with
minimum risk to the Group in terms of
financial exposure. To accomplish this, PSD
plans to conduct further feasibility studies
on certain plots of available land.
L S D a l s o f a c e s t h e c h a l l e n g e o f
implementing the Integrated Genset
Management System nationwide.
In order to overcome these challenges, CSD
maintains a close rapport with all its
customers and stakeholders, and is
confident of continuing to support TNB’s
business excellence in the years to come.
174
TENAGA NASIONAL BERHAD (200866-W)
Ope
ratio
ns R
evie
w–
Non
-Cor
e Bu
sine
sses
Annual Report 2012
Operations Review – Corporate Affairs & Services

In support of Gemilang 2015 – Growth, Global, Green, Procurement Division strives to pursue its strategic role of managing TNB’s procurement towards efficient and effective supply chain management.
PROCUREMENTIr. Nor Azmi bin RamliChief Procurement Officer
175
KEEPING THE LIGHTS ON
Ope
ratio
ns R
evie
w–
Non
-Cor
e Bu
sine
sses
Annual Report 2012
Operations Review

● Increase value to internal and external
customers
● Develop a Green Procurement Policy
and Strategy
● Implement procurement best practices
● Implement international supply chain
management benchmarking activities
● Develop TNB’s procurement expertise
and capabilities
● Implement an ICT Supply Chain
Management System
The success of these key initiatives depends
largely on the competency and operational
per formance of the d iv is ion’s f ive
departments, namely Sourcing Controller,
Best Pract ice and Pol ic ies , Shared
Purchasing, Strategic Supplier Management
and Human Resources Management &
Administration Services.
OPERATIONAL SUMMARY
Procurement Division continues its efforts
towards optimising procurement costs,
benchmarking and emulating procurement
best practices, developing a stable and
co mpet i t ive suppl ier ba s e fo r th e
organisation, implementing supply chain
management initiatives and enhancing
TNB’s procurement expertise and capabilities.
In FY2012, Procurement Division focused its
core activities on eight key initiatives as
part of the five-year Gemilang 2015 to
enhance procurement efficiency and
effectiveness, as listed below:
● Enhance procurement value creation
● Explore and promote new businesses
for the Bumiputera Vendor Development
Programme
Procurement Value Creation Achievement
1Q 2Q 3Q
FY2007
(RM
’Mill
ion
)
4Q 1Q 2Q 3Q 4Q 1Q 2Q 3Q 4Q 1Q 2Q 3Q 4Q 1Q 2Q 3Q 4Q 1Q 2Q 3Q 4Q
7 37
96
149
151
166
173
267
281 297
423 46
4
483 51
9
793
794
804 84
2 904 96
1
973
1001
1016 10
78
FY2008 FY2009 FY2010 FY2011 FY2012
0
200
400
600
800
1,000
1,200
HIGHLIGHTS OF ACHIEVEMENTS
● Significant Procurement Value Creation
in FY2012 amounting to RM117.56
million
● Nationwide Procurement Community
2012 roadshows to disseminate the
revised TNB Procurement Policy and
Procedures (PPP) and revision of the
subsidiaries’ PPPs
● I m p l e m e n t i n g a S u p p l y C h a i n
Management System to enhance the
technological backbone of Procurement’s
ICT system
● Special Trade Mission to the Kingdom
of Saudi Arabia yielding potential sales
of RM1 billion for TNB’s subsidiaries and
vendors
Procurement Value Creation
Procurement continued to achieve significant
value creation of RM117.56 million in FY2012
mainly through e-Bidding, the application of
tax exemptions and negotiations. Other
contr ibuting factors were Purchase
Consolidation and Category Sourcing.
176
TENAGA NASIONAL BERHAD (200866-W)
Ope
ratio
ns R
evie
w–
Non
-Cor
e Bu
sine
sses
Annual Report 2012
Operations Review – Procurement

R e v i s i o n & D i s s e m i n a t i o n o f T N B
Procurement Policy & Procedures (PPP)
Having launched the revised TNB PPP in
FY2011, Procurement Division continued to
disseminate the new policy and procedures
across the peninsula in a total of 13 sessions
covering almost 1,000 TNB personnel in
FY2012. Subsequent to the revision, the
division enhanced the training modules
with ILSAS to ensure continuous updating
while coaching the subject matter experts
to ensure that training on the TNB PPP is
conducted effectively.
In an effort to ensure the subsidiaries
conduct effective procurement for their
nature of business, Procurement Division
also embarked on developing PPPs for the
different subsidiaries following instruction
from the Board Audit Committee. To date, it
has successfully completed drafting the
PPPs for Tenaga Nasional Engineering
Corporation (TNEC) and Sabah Electricity
Sdn. Bhd. (SESB).
While the PPPs are being disseminated and
training carried out, the effectiveness of
implementation is being evaluated via
Procurement Compliance Reviews conducted
across the core divisions.
TNB Supply Chain Management System
As part of its future positioning, Procurement
Division has charted the inclusion of a
holistic Supply Chain Management (SCM)
system in its five-year business plan for
2010-2015. This system is intended to
provide TNB with the technological ability
to implement best practices in procurement
processes, analyses and standardisation of
work processes to create value opportunities
and sustain efficiency, transparency and
consistency.
The SCM system includes modules on
electronic tendering, electronic contract
management system, a supplier-buyer
service portal, spend analytics and a
c e n t r a l i s e d s u p p l i e r d a t a b a s e a n d
assessment. The system involves end-to-end
procurement processes and best practices
that can reduce procurement costs by
facilitating TNB-supplier collaboration and
streamlining procurement processes.
The system itself testi f ies to TNB’s
recognition of the supplier community as
strategic partners. The system will go live in
stages and is expected to be completed in
early 2013.
Award Presentation to Excellent Suppliers
and Contractors
Procurement Division conducted a Malam
Anugerah Vendor/Pembekal/Kontraktor
Cemerlang TNB 2012 on 19 January 2012.
Twelve categories of awards were created
with 38 nominations received from various
divisions.
The awards were presented by Senator
Datuk Awang Adek Hussein, Deputy
Finance Minister of Malaysia. The event
served as a platform to acknowledge
excellent suppliers and contractors for
products and services rendered from 2010
to 2011. It was also conducted to enhance
the relationship and collaboration between
TNB and its suppliers and contractors.
177
KEEPING THE LIGHTS ON
Ope
ratio
ns R
evie
w–
Non
-Cor
e Bu
sine
sses
Annual Report 2012
Operations Review – Procurement

GLC’s Vendor Development Programme
(VDP) Sub-Group Circle
TNB has been appointed by the Putrajaya
Committee on GLC High Performance (PCG)
to chair the VDP Sub-Group Circle Meeting.
The first meeting cum workshop was held
on 11 July 2012 and was attended by
26 representatives from 14 GLCs. The circle is
an effort to ensure more GLCs are committed
to national wealth creation by implementing
structured vendor development programmes
at their respective companies. At the
meeting, the members deliberated and
shared their experiences of the vendor
development programme.
Strategic Sourcing Methodology Training
In February and March 2012, Procurement
Division engaged A.T Kearney Inc., a
leading global strategic procurement
practitioner, to train 30 TNB procurement
personnel on the 7-Step Strategic Sourcing
Methodology to enable TNB to embark on
Category Management and Strategic
Sourcing initiatives.
The training was conducted over six weeks
in ILSAS, during which the participants
were given hands-on experience on how
to conduct a proper strategic sourcing
effort which involves Spend Analysis,
Category Management, Market Analysis
and Supplier Relationship Management.
The training provided insights on TNB’s
procurement spend on items such as
transformers, switchgears, IT products,
Personal Protective Equipment and
Generation spares, and how to develop the
most suitable strategic sourcing initiatives
based on the information gathered.
Special Trade Mission to the Kingdom of
Saudi Arabia
Subsequent to the invitation by Saudi
Electricity Company (SEC), a special trade
mission to the Kingdom of Saudi Arabia was
organised from 25 to 30 May 2012 with the
support of the Malaysia External Trade
Development Corporation (MATRADE).
The mission’s participants were from
11 companies including TNB subsidiaries
and TNB vendors.
The objective was to promote products and
services related to the power generation
sector and related services to SEC and the
Saudi business community by leveraging on
the TNB and Malaysia brands. The Kingdom’s
growing demand for electricity at 8%
annually is considered as a highly potential
market for business opportunities, thus
making this mission a significant initiative
towards TNB’s global and regional business
expansion.
CHALLENGES AND PROSPECTS
Pursuant to Gemilang 2015 – Growth,
Global, Green, the main challenges for the
division are still related to enhancing its
strategic role to meet the increasing
expectations of stakeholders and elevating
its operational performance.
In FY2012, Procurement Division strove to
p r o v i d e c o n t i n u o u s p r o f e s s i o n a l
development opportunities for its staff
throughout the year through a series of
procurement skills-set training programmes
in an effort to produce capable and
competent personnel. The enhancement of
TNB procurement expertise and capabilities
through skills training and development
programmes is in line with the mandatory
subjects required for Chartered Institute of
Purchasing and Supply (CIPS) certification,
and is essential to ensure readiness of
procurement personnel in the global arena.
Currently, Procurement Division is stepping
up its efforts towards executing Category
Management and Strategic Sourcing as
methodologies to ensure that TNB obtains
more value creation from effective and
efficient Supply Chain Management.
The division has also embarked on a
significant benchmarking initiative with
China Light and Power (CLP), the best
utility company in the Asia-Pacific region in
the area of procurement, to learn and
adopt procurement best practices in an
effort to improve TNB’s bottom line and
reduce unnecessary procurement costs.
The rescheduled commissioning of the
Supply Chain Management System to
FY2013 poses a big challenge to the
division in entailing a holistic overhaul of
procurement processes via the ICT platform.
Nevertheless, its success is expected to turn
around TNB’s procurement practices and
result in an integrated system that employs
procurement best practices while enhancing
efficiency, transparency and consistency of
processes in the procurement community.
178
TENAGA NASIONAL BERHAD (200866-W)
Ope
ratio
ns R
evie
w–
Non
-Cor
e Bu
sine
sses
Annual Report 2012
Operations Review – Procurement

SESB continues to play its role of meeting
the increasing demand for electricity in
Sabah. With grants from the Government,
SESB targets to enable more people in the
state to have access to electricity supply as
part of its contribution to the social and
economic development of Sabah.
Demand for electricity in Sabah is expected
to be approximately 7% growth per year
until 2013, and to increase substantially in
the following years, reaching about
1,476MW by 2019.
Electrification coverage in Sabah as of
December 2011 was 81.5%. SESB aims to
achieve 95% electrification coverage by
end 2012 to enable more people in Sabah
to enjoy the benefits of electricity supply.
This is part of SESB’s contribution to the
socio-economic development of Sabah.
FINANCE
The sale of electricity in Sabah for FY2012
grew by 17%, RM1.29 billion compared to
RM1.10 billion recorded last financial year.
Total units sold for FY2012 was 4,428 GWh
compared with 4,239 GWh in FY2011.
Total audited operating expenditure for
FY2012 amounted to RM1,367 million
compared to RM1,227 million for FY2011
(Restated). SESB received substantial diesel
and medium fuel subsidies from the
Malaysian Government and the amount is
presented net of total subsidy.
Total operating loss was at RM50.20 million.
Total finance costs and foreign exchange
losses for FY2012 amounted to RM181.34
million compared to RM124.07 million in
FY2011. Cost Per Unit (CPU) SESB as at
31 August 2012 was 34.97 cent per kWh.
No. Item Denominator FY2012
FY2011
(Restated)
1 Sales RM’mil 1,291.7 1,100.2
2 Unit sold GWh 4,428 4,239
3 Opex RM’Mil 1,367.2 1,226.6
4 Fuel subsidy claim RM’Mil 543.4 547.5
80
7
85
4
95
4
1,0
29
1,1
00
1,2
92
RM’Mil
3,2213,385
3,7384,030
4,239
4,428
2007 2008 2009 2010 2011 2012
Gwh
RM’Mil Unit (Gwh)
Sales in RM & Unit
500
660
820
980
1,140
1,300
0
1,000
2,000
3,000
4,000
5,000
Sabah Electricity Sdn. Bhd.
179
KEEPING THE LIGHTS ON
Ope
ratio
ns R
evie
w–
Oth
er S
ervi
ces
Annual Report 2012
Operations Review

ENGINEERING
An Engineering Divison was set up in June
2011 to design major development projects
and to enhance their quality assurance as
well as material procurement. The division
is also responsible for factory and site
acceptance testing, specification compliance
audits and pre-commissioning inspection
and testing of all turnkey, independent
power producer (IPP), Small Renewable
Energy Power Programme (SREP) and rural
electrification projects.
Among the major projects undertaken in
the year under review were:
● a 132kV Kolopis-Kota Belud line LILO for
the construction of a 132/33kV Main
Intake Substation (PMU) in Tuaran
● a 132kV Beaufort-Penampang line LILO
for the PMU in Lansat
● C o n s t r u c t i o n o f t h e 1 - S u l a m a n
Distribution Intake Substation (PPU)
Other intiatives carried out include:
● A lightning performance study on
Transmission lines
● Installation of 22-11kV outdoor voltage
regulators in Kota Belud
● An energy audit demonstration on
commercial buildings
OPERATIONS
Generation
The total installed capacity in Sabah stands
at 1,324MW, of which 527.8MW is from
SESB, inclusive of 80MW from canopy gen-
sets. The remaining 796.2MW comes from
independent power producers (IPPs).
Transmission
To further enhance its services, SESB formed
a Live Line Squad in March 2012 under the
purview of Transmission Division, to train
qualified staff to conduct maintenance
work on live lines without shutting off the
electricity supply. A total of 17 technical
staff were sent for Live Line Training, at the
end of which eight were given a certificate
of competence from the Electricial Industrial
Training Institute (EITI) headed by Ir.
Stenold Pauli.
The division also engaged Sabah Air
Aviation Sdn. Bhd. to conduct a helicopter
survey of SESB’s transmission lines to gauge
the condition of both lines and towers,
ensuring the latter had not been affected
by factors such as erosion. The survey also
focused on the wayleaves to ascertain that
these pathways remained c lear of
obstructions such as trees.
Distribution
In February 2011, SESB’s management had
approved the implementation of an
Assisted Rural Wiring Scheme (ARWS) with
a revolving fund of RM5 million. The
scheme is intended to help rural folk who
are unable to pay wiring contractors under
the normal electricity application process.
With the ARWS, these applicants pay SESB
the cost of internal wiring of RM510 in
monthly installments of RM14.20 for the
first six months followed by RM14.16 per
month for 30 months. In addition, they pay
a security deposit of RM40 and stamp duty
of RM10 upon signing the consumer
agreement with SESB.
The programme was launched in April 2011
in collaboration with Persatuan Elektrik
Sabah (PES). Contractors selected for the
programme have to be registered with
SESB, PES and the Energy Commission (EC).
As at 31 August 2012, an estimated 16,080
houses had been identified for aid under
the programme and 2,944 applications had
been received from customers, 2,128
(72.28%) of which have been completed.
Meanwhile, the programme has been
extended until March 2013.
SESB has also continued to carry out the
Old Meter Replacement Programme among
domestic, commercial and industrial
customers statewide. In 2012, a total of
56,052 old meters were replaced.
180
TENAGA NASIONAL BERHAD (200866-W)
Ope
ratio
ns R
evie
w–
Oth
er S
ervi
ces
Annual Report 2012
Operations Review – Sabah Electricity Sdn. Bhd.

OPERATIONS SYSTEMS
Maximum demand in the Sabah Grid during
the financial year 2011/12 was 828.4MW,
which was a 0.21% decrease from the
maximum demand of 830.1MW recorded in
the financial year 2010/11.
640
660
680
700
720
740
760
780
800
820
840D
em
an
d (
MW
)
07/08
Sabah Grid Maximum Demand
FY2007/2008 – 2011/2012
646.9
08/09
704
09/10
772.8
10/11
830.1
11/12
828.35
SESB generated a total of 5205.83GWh in
the Sabah Grid System in the financial year
2011/12, marking a 4.87% increase from
4,964.28GWh in the previous financial year.
4,100
4,300
4,500
4,700
4,900
5,100
5,300
En
erg
y G
en
era
ted
(G
Wh
)
07/08
4,132.51
4,380.34
4,821.40
4,964.28
5,205.83
08/09 09/10 10/11 11/12
Sabah Grid Energy Generated
Financial Year 2007/2008 2008/2009 2009/2010 2010/2011 2011/2012
Total System Minutes
(Including Major
Incident – GTD)
154.38 31.58 20.21 40.13 263.91
Total System Minutes
(Excluding Major
Incident – GTD)
11.89 31.58 20.21 40.13 67.12
15
4.3
8
26
3.9
1
67
.12
11
.89
31
.58
31
.58
20
.21
20
.21
40
.13
40
.13
0
50
100
150
200
250
300
Sys
tem
Min
ute
s
FY07/08 FY08/09
Financial year
FY09/10 FY10/11 FY11/12
Total (Including Major Incident – GTD) Total (Excluding Major Incident – GTD)
Sabah Grid Delivery Point Unreliability Index
The Delivery Point Unreliability Index (DPUI) trend over the past five years for Transmission
is as shown in the graph below.
181
KEEPING THE LIGHTS ON
Ope
ratio
ns R
evie
w–
Oth
er S
ervi
ces
Annual Report 2012
Operations Review – Sabah Electricity Sdn. Bhd.

Calendar Year 2006 2007 2008 2009 2010 20112012 (As at
31 August)
SAIDI
(mins/cust/year)4,030.00 1,986.58 1,855.80 2,867.23 687.38 494.64
442.58
(Annualised
663.87)
ORGANISATIONAL DEVELOPMENT
SESB’s Key Performance Indicators (KPIs) for
the financial year 2012 fell under four
strategic themes, namely Enhanced
Financial Sustainability, Delighting the
Customers, Improving System Performance
and Improving Productivity. There are nine
strategic objectives within the strategic
themes under the Balanced Score Card
framework as follows:
1. Enhanced Financial Sustainability
● Enhance Business Sustainability
● Reduce Revenue Leakages
2. Improving System Performance
● E n h a n c e S u p p l y S e c u r i t y &
Reliability
● E n h a n c e S u p p l y S y s t e m
Development
● Enhance Supply Improve Processes
3. Improving Productivity
● D e v e l o p H i g h l y C o m p e t e n t
Workforce
● E n h a n c e O r g a n i s a t i o n a l
Productivity
SAIDI4,030.00
1,986.581,855.80
2,867.23
687.38494.64 442.58
663.87
Annualised
Linear (SAIDI)
0
500
1,000
1,500
2,000
2,500
3,000
3,500
4,000
4,500
2006 2007 2008 2009 2010 2011 2012
(As at 31 August)
SESB Saidi CY2006-2012
4. Delighting the Customers
● Improve Customer Satisfaction
● Enhance Stakeholder Satisfaction
5-Year Business Plan (FY2011–2015) and
Annual Operations Plan (FY2012)
SESB’s management conducted a review of
the 5-Year Business Plan FY2011–2015 and
Annual Operations Plan for the financial
year 2012 on 11-13 May 2012. Participants
of the review session comprised SESB’s
M a n a g e m e n t C o m m i t t e e , s e l e c t e d
executives and members of the local union.
Following an analysis of SESB’s performance
in relation to the Operations Plan and KPIs
for the f inancial year 2011, a fresh
Operations Plan and KPIs for FY2012 were
drawn up. As a result of the review, the
following actions are being taken:
● Identify the gap between business and
o p e r a t i o n a l t a r g e t s a n d a c t u a l
achievements for the purpose of taking
corrective measures so that the said
targets can be achieved.
● Each division in SESB to develop its
own 5-Year Business Plan and Annual
Operations Plans based on SESB’s
strategic objectives.
● Additional initiatives/activities to be
introduced to further strengthen
operational activities and to expedite
and or launch the implementation of
the said activities.
● Ensuring that daily activities and
initiatives are aligned to the objectives
of the Strategic Transformation Action
Roadmap 2026 (STAR 2026) FY2007 –
FY2026.
● Launch of the Information Security
Management System (ISMS) on 16 May
2012 to make progress on SESB’s MS
ISO 27001:2007 cert i f icat ion by
December 2012.
MAJOR PROJECTS
SESB’s Major Projects Divis ion was
establ ished in 2007 to manage al l
construction projects related to Generation,
Transmission and Distribution. Major Project
Divis ion is committed to achieving
excellence in its services to meet its
customers’ requirements and complete
projects within the specified time and
budget while maintaining top quality.
During the financial year 2012, Major
Projects supervised 28 projects valued at a
total of RM3,779.3 million. Seven of these
projects have been completed while the
remaining 21 projects are on-going.
CORPORATE SERVICES
The Corporate Services Division plays a
vital role in providing support services to
ensure SESB continues to meet i ts
objectives. Main achievements by the
division in 2012 include:
182
TENAGA NASIONAL BERHAD (200866-W)
Ope
ratio
ns R
evie
w–
Oth
er S
ervi
ces
Annual Report 2012
Operations Review – Sabah Electricity Sdn. Bhd.

1. Improved stakeholder relations:
● I m p l e m e n t a t i o n o f a T a r i f f
Communication Plan resulted in
m i n i m a l o b j e c t i o n s f r o m
stakeholders and the wider public.
● Timely briefings were held on
energy supply and new initiatives
with the Chief Minister, Cabinet,
state leaders and other key
stakeholders.
● Organisation of the Community
Leaders Outreach Progamme
(CLOP) in Tawau, Sandakan,
Labuan, Papar, Kota Belud, Ranau,
Semporna, Kuala Penyu, Tenom,
B e a u f o r t , P e n a m p a n g , K o t a
Kinabalu and Beluran.
● Enhancement of SESB’s corporate
website.
2. Improved media relations via media
build-up programme, as exemplified
by an increase in positive media
reports from 75% to 85%.
3. I m p r o v e d n o n - t a r i f f r e v e n u e
collection:
● Effective legal advice and action to
assist the relevant departments
within SESB to secure:
i. RM10 million in compensation
for losses suffered by SESB
due to delays by IPP to
c o m p l e t e p r o j e c t i n
accordance with the terms
and conditions of the Power
Purchase Agreement (PPA),
necessitating Supplemental
Agreement to the PPA;
ii. RM13.5 million in Liquidated
Ascertained Damages due to
IPP not achieving Scheduled
Commercial Operation Date
p u r s u a n t t o P P A a n d
Supplemental Agreement;
iii. RM76,296.64 in recovery of
l o s s e s d u e t o m e t e r
tempering matters; and
iv. RM30,122.20 in recovery of
o u t s t a n d i n g r e n t a l s , i n
relation to tenancy matters.
● Winning two criminal cases on
action taken by the Department of
Occupational Safety and Health for
n o n - c o m p l i a n c e o f n o i s e
monitoring.
4. Improved Cost Management
● The cost of fleet maintenance and
fuel consumption was reduced by
22% due to the replacement of 38
old vehicles with new ones.
5. Improved Security & Integrity
Management
● With the reinforcement of security
policies, 16 people including four
staff members were caught for
various offences including cable
theft and illegal connections of
electricity supply.
● To further enhance SESB’s Integrity
Governance, an MOU was signed
with the Malaysian Anti-Corruption
Commission (MACC), an Ethics
Committee was set up, and staff
integrity sessions were organised
with MACC.
6. Promotion of Energy Efficient (EE)
Practices
● As part of awareness creation, EE
posters and relevant corporate
g i f t s w e r e d i s t r i b u t e d t o
stakeholders, consumers and the
media.
● EE talks and product exhibitions
were held in Tawau, Sandakan,
Labuan, Kota Kinabalu, Papar, Kota
Belud, Ranau, Semporna, Kuala
P e n y u , T e n o m , B e a u f o r t ,
Penampang and Beluran involving
stakeholders, school students and
members of the public.
● As part of SESB’s corporate social
responsibil ity, it donated EE
products to orphanages in Tawau
and Tambunan, and the Hospice &
Dialysis Centre in Sandakan.
● An energy audit was conducted at
Wisma SESB in July 2011.
● Members of the public, including
school children, were encouraged
to enrol in Rakan EE.
183
KEEPING THE LIGHTS ON
Ope
ratio
ns R
evie
w–
Oth
er S
ervi
ces
Annual Report 2012
Operations Review – Sabah Electricity Sdn. Bhd.

DEPARTMENT SUMMARY
LSD comprises three distinct units and one
section, as follows:
Corporate Advisory Unit
This unit is responsible for the overall
provision of legal advisory on all legal
matters related to the business of TNB and
its subsidiaries including legal opinions,
d r a f t i n g , v e t t i n g a n d n e g o t i a t i n g
construction contracts and other project
documents required for local bidding
exercises, shareholder matters, financing
documentation for conventional and
Islamic facilities, commercial documentation
including ICT licensing agreements and
intellectual property-related agreements
and all other contractual documents related
to the business of TNB and its subsidiaries.
Regulatory & Legal Documentation Unit
This unit is responsible for advising TNB on
operational legal issues in relation to
electricity supply, land and consumer
The Legal Services Department (LSD) provides quality in-house legal services to TNB and its subsidiaries to support value creation in the Group’s core business, non-core business and management services.
Legal Services Department
matters. It is also responsible for preparing
various types of agreements, including
Electricity Supply Agreements, Electricity
Infrastructure Agreements, Co-generation
and Customised Agreements. The unit
further ensures TNB’s compliance with
prevailing Acts of Parliament, by-laws,
regulations and terms and conditions of
license as well as assisting in the drafting
and amendments of Electricity Supply Acts
1990 and other Acts which are relevant to
the electricity industry in Malaysia. This unit
is also involved in the formulation and
implementation of new legislation in the
areas of renewable energy and energy
efficiency.
Litigation Unit
This unit manages, supervises, coordinates
and liaises with appointed panel lawyers in
all court cases pertaining to claims made
by third parties against TNB in Malaysia and
abroad. It also handles the recovery of
debts and enforcement of TNB’s rights
against third parties. The unit further
oversees disputes referred to the Consumer
Tribunal, mediation, adjudication or
arbitration.
Business Enterprise Section
The Business Enterprise Section primarily
provides legal advisory for the Group’s
i n t e r n a t i o n a l p o w e r p r o j e c t s a n d
transactions related to the power industry.
This section also provides legal support on
diverse special projects including domestic
power bidding and Group-level corporate
compliance programmes.
184
TENAGA NASIONAL BERHAD (200866-W)
Ope
ratio
ns R
evie
w–
Oth
er S
ervi
ces
Annual Report 2012
Operations Review

● Legal Bulletin
LSD published two editions of the Legal
Bulletin to heighten legal awareness
across the board in TNB, and mitigate
the risks of staff breaching the law
while performing their daily tasks.
● Personal Data Protection Act 2010 –
Tenaga Nasional Berhad Personal Data
Protection Compliance Programme
The Business Enterpr ise Sect ion
organised and spearheaded the TNB
Group Personal Data Protect ion
Compliance Programme in anticipation
of the Personal Data Protection Act
2010 (PDPA) coming into force. The
programme was implemented as part
of TNB’s continuous commitment to
maintaining the privacy and security of
personal information of customers,
employees and other individuals. The
programme included a review and
update of TNB’s existing privacy and
document retention policies and
procedures, preparing revised customer
and employment forms, and conducting
internal briefing sessions to raise
awareness of the PDPA.
● Competition Act 2010 – Tenaga
N a s i o n a l B e r h a d C o m p e t i t i o n
Compliance Programme
The Business Enterpr ise Sect ion
i m p l e m e n t e d t h e T N B G r o u p
Competition Compliance Programme
ahead of the Competition Act 2010 (CA)
coming into force on 1 January 2012.
The programme identified the Group’s
commercial activities that are governed
by the CA and by the Energy Commission
Act 2001. Actions performed included a
review and update of the Group’s
existing competition and procurement
policies, practices and manuals, a review
of existing contracts and agreements,
and internal briefing sessions on the
principles of healthy and fair competition
in business dealings.
IMPROVING CUSTOMER SERVICE
In the financial year 2011/2012, LSD
embarked on a number of initiatives to
improve customer service.
Legal Awareness
● Brainstorming/Dialogue Sessions
LSD conducted several brainstorming/
dialogue sessions with Distribution
Division regarding recurring legal issues
to improve customer service. The
sessions were held in several states in
Peninsular Malaysia by the Regulatory &
Legal Documentation Unit involving
executives and non-executives from
Distribution. The focus was on legal
issues regarding land, for example
trespassing and the acquisition of land
f o r t h e c o n s t r u c t i o n o f T N B ’ s
installations, rechargeable job orders,
terms and conditions of l icensee
housing loans for TNB staff, and supply
matters involv ing Dist r ibut ion’s
operations.
● Legal Forum
The Corporate Advisory Unit together
with the Business Enterprise Section of
LSD organised its 7th Annual Legal
Forum 2012 on 27-28 February 2012.
More than 80 participants from various
divisions and TNB subsidiaries attended
the forum which dealt with the legal
implications of specific issues that affect
TNB. Presentations were made on
Bidding for Power, Asean Power Grid
Legal Issues and Challenges, Renewable
Energy, Mergers and Acquisitions,
Industrial Relations Issues Pursuant To A
Change In The Ownership of Business
and What Do You Do When You Meet
With An Accident?
LITIGATION UNIT’S KNOWLEDGESHARING
SESSIONS
The Litigation Unit continued to meet with
representatives from Distribution Division
from every state to discuss supply issues
such as meter tampering and outstanding
bills, and asset issues including electrical
accidents and property damage. The
objective was to obtain updates on the
status of litigation cases in the various
states and to create greater awareness of
the proper management of operations and
consumers to prevent, or at least reduce,
the number of claims made against TNB.
The Litigation Unit also conducted various
sessions with the Generation, Transmission
and Distribution Divisions on land matters
to ensure compliance with the Electricity
Supply Act 1990 with regard to land
procurement and wayleave.
A session was also organised with Group
Human Resources Division on the recovery
of housing, cars and computer loans from
ex-staff and scholars.
185
KEEPING THE LIGHTS ON
Ope
ratio
ns R
evie
w–
Oth
er S
ervi
ces
Annual Report 2012
Operations Review – Legal Services Department

On 15 March 2012, PQM was registered as
a wholly-owned management consultancy
subsidiary of TNB known as TNB Quantum
Solutions Sdn. Bhd. (QUANTUM). Its
objective is to serve TNB and its subsidiaries
as well as external parties.
Externally, QUANTUM strives to be the
management consultancy group of choice
in ASEAN by delivering professional
business solutions in quality excellence,
business process improvement and change
management through long-term and
meaningful relationships with clients.
Within TNB, QUANTUM ensures the
maintenance of standards by carrying out
business as usual quality management
programmes such as the Work Improvement
Teams – Innovative and Creative Circle
(WIT-ICC) and 5S.
Productivity and Quality Management (PQM)
The Productivity & Quality Management Department (PQM) is responsible for propelling the company towards its mission of attaining product and service excellence. This is accomplished through strategic transformation initiatives, performance enhancement projects, quality management programmes, change management programmes and business process reengineering.
186
TENAGA NASIONAL BERHAD (200866-W)
Ope
ratio
ns R
evie
w–
Oth
er S
ervi
ces
Annual Report 2012
Operations Review

TNB currently has over 800 active Work
Improvement Teams across the board in
the organisation, the best of which is
routinely entered into the Malaysia
Productivity Corporation (MPC) National
Innovative and Creative Circles Convention.
Meanwhile, TNB’s 5S programme is focused
on the Save (Energy Resources, the Earth)
Programme in line with the Group’s overall
strategy of going green.
TNB also runs a Process Standardisation &
Improvement (PSI) programme, which
forms a major initiative to propel the
company towards business excellence. The
company as a whole is now ISO 9001:2008
certified, with a pool of appointed ISO
t e a m s c o n s i s t i n g o f m a n a g e m e n t
representatives, document control managers
and internal auditors maintaining and
improving standardised processes.
As part of the Gemilang 2015 strategic
programme, TNB has embarked on a
Culture Change Programme aimed at
building and strengthening a vibrant
culture within the organisation. Initially, the
programme entailed 57 key activities, each
of which was to be driven by a champion.
Heads of Culture Change Programme were
also appointed to assist in spearheading
the activities. However, there has been a
change in the original set of activities so as
to be aligned with the four main thrusts
mooted by TNB President/Chief Executive
Officer Datuk Wira Ir. Azman bin Mohd.
A workshop to brainstorm the re-alignment
was attended by culture change agents
from various divisions and departments.
187
KEEPING THE LIGHTS ON
Ope
ratio
ns R
evie
w–
Oth
er S
ervi
ces
Annual Report 2012
Operations Review – Productivity and Quality Management (PQM)

188
TENAGA NASIONAL BERHAD (200866-W)
Ope
ratio
ns R
evie
w–
Oth
er S
ervi
ces
Annual Report 2012
National GridOperations Review

YOU SEE

CONSERVING OURPRECIOUS RESOURCES
WE SEE...

K E E P I N G T H E
LIGHTS ON
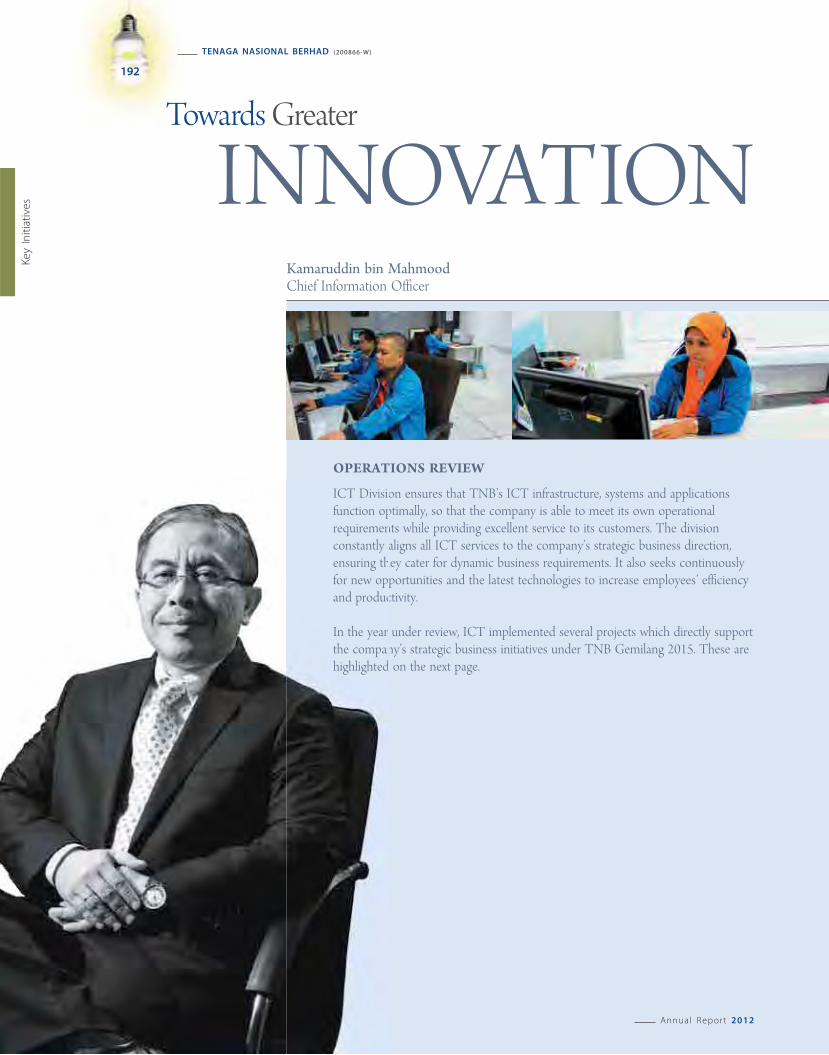
OPERATIONS REVIEW
ICT Division ensures that TNB’s ICT infrastructure, systems and applications function optimally, so that the company is able to meet its own operational requirements while providing excellent service to its customers. The division constantly aligns all ICT services to the company’s strategic business direction, ensuring they cater for dynamic business requirements. It also seeks continuously for new opportunities and the latest technologies to increase employees’ efficiency and productivity.
In the year under review, ICT implemented several projects which directly support the company’s strategic business initiatives under TNB Gemilang 2015. These are highlighted on the next page.
INNOVATION
ICT Divisiofunction oprequiremenconstantly aensuring thfor new oppand produc
In the year the companhighlighted
Kamaruddin bin MahmoodChief Information Officer
192
TENAGA NASIONAL BERHAD (200866-W)
Key
Initi
ativ
es
Annual Report 2012
Towards Greater

MAJOR PROJECTS
● Customer Relationship Management
(CRM) & Billing
ICT, together with Distribution Division,
has embarked on a CRM & Billing project
to transform TNB’s current Customer
Relationship Management (CRM) and
bill ing solutions capabilities. The
objective is to replace the current e-CIBS
billing and CRM satellite systems with a
flexible CRM & billing solution which will
enable TNB to support regulatory
changes fast and allow for extensive
customer self-service capabilities. This
project will adopt and adapt the utility-
specific best practice solution.
● Customer Management System (CMS)
Upgrade
The Customer Management System was
first implemented by ICT in 2009 as a
self-service tool for customers to lodge
technical incidents and requests for new
ICT products or services. During the year
under review, ICT undertook to upgrade
the system by improving its features
and functions while also enhancing its
look and feel. The new CMS will provide
better and enriched user experience by
having reporting capabilities, an easier
system maintenance and an improved
system design.
● Supply Chain Management (SCM)
This on-going project supports Group
Procurement Division’s strategic goals
to improve its business processes and
implement best practices, particularly in
the areas of tendering and purchasing,
spend analysis, contract management
and supplier relationship management.
The first module is expected to automate
and improve operational business
processes to monitor policy and process
compliance, better manage vendor
development programmes, give a
holistic view and control of suppliers in
TNB as well as to provide in-depth
visibility of TNB’s procurement spending.
● Application Performance Monitoring
(APM)
In production since June 2012, this
project covers 22 critical applications in
TNB. The APM tool is a single platform
t o m o n i t o r e n d - t o - e n d s y s t e m
performance thereby allowing visibility
of overall application performance
including the server, network and
applications layers. The tool will enable
ICT to proactively monitor critical TNB
systems by setting various performance
thresholds and trigger auto alerts.
193
KEEPING THE LIGHTS ON
Key
Initi
ativ
es
Annual Report 2012
Towards Greater Innovation

● Competency-Based Performance
Management System (CBPMS) for
Non-Execs
TNB has been using a Competency-
Based Performance Management
System (CBPMS) to plan, track, evaluate
and assess the competencies and KPIs
of executives and technical supervisors
online since 2003. The Company is
currently rolling out an enhanced
CBPMS4 which will allow non-executives
to participate in the online performance
management system.
● S e c u r i t y I n f o r m a t i o n & E v e n t
Management (SIEM)
SIEM is a tool that will assist in log
management , secur i ty inc idents
correlation, analysis and notification to
alert all support teams of security
incidents and to allow the Computer
Security Incident Response Team
(CSIRT) to mitigate such events. SIEM is
also in line with the Government’s
directive for al l Crit ical National
Information Infrastructure (CNII) to be
ISO 27001 certified.
Focus on Business Value & Expansion
● Improved Customer Centricity
In line with TNB’s transformation into a
customer-centric organisation in recent
years, ICT is always on the look-out for
new technologies and solutions to
support the company’s business
requirements as well as its vision and
mission. The division’s commitment
towards this end has led it to top TNB’s
Internal Customer Satisfaction Survey
(TICSS) for the last five consecutive
years, maintaining a consistent score of
above 9.0 over 10.0 for service delivery
in the Customer Satisfaction Index (CSI).
In providing the best service to its
c u s t o m e r s , I C T t o g e t h e r w i t h
Distribution Division is currently
implementing an Email Billing project
to promote e-billing as an alternative to
traditional posted bills. The e-bills will
be supplemented by SMS notification
as an early reminder to TNB customers.
● Internal social media – Powerfaces
During the year under review, ICT
col laborated with the Corporate
Communicat ions Department to
implement a corporate social networking
& knowledge management tool called
Powerfaces. This web-based channel
enhances knowledge-sharing and
promotes work collaboration by allowing
TNB staff to tap into each other’s
capabilities and experience. Powerfaces
has been successfully rolled out to
approximately 19,000 TNB staff. It has
also fostered a more open work culture
and improved overall engagement
between TNB management and staff.
PROSPECTS
ICT strives continuously to implement
innovative solutions to support TNB’s
overall vision and mission. Increased
customer demand together with a built-in
culture for international benchmarking
has brought new challenges for the
division to tackle.
194
TENAGA NASIONAL BERHAD (200866-W)
Key
Initi
ativ
es
Annual Report 2012
Towards Greater Innovation

In addition, the use of e-Application has
been extended with the development
of a Staff Module. This enables all Pusat
Khidmat Pelanggan personnel to key in
electricity application forms into the
e-Application system. As a result, the
processing time of applications will be
shorter, and there will be greater
transparency as applicants can track
their application status online.
● Seek new business opportunities
ICT Division intends to maximise the
value of its IT investments by remaining
as the preferred ICT provider and
e n a b l e r t o s u p p o r t T N B ’ s c o r e
businesses. Since 2008, it has also
become a revenue earner for the
company by leasing TNB infrastructure
t o v a r i o u s t e l c o s . A m o n g t h e
infrastructure being leased are Fibre
Optic Cables on LV Poles, Broadband
over Powerline (BPL), Telecommunications
Towers and Co-locations. Moving
forward, ICT will continue to look for
new business opportunities to increase
its revenue contribution to TNB.
● Green IT
ICT Division is committed in providing
quality service while protecting the
environment. All IT equipment used
therefore are energy efficient and meet
Green IT standards. At the same time,
initiatives such as the Electronic
Document Management System (EDMS),
Desktop & Video Conferencing, Server
Consolidation & Virtualisation, paperless
m e e t i n g s a n d v i r t u a l m e e t i n g
workspaces further contribute to a
greener TNB.
195
KEEPING THE LIGHTS ON
Key
Initi
ativ
es
Annual Report 2012
Towards Greater Innovation

DEVELOPMENT
During the year 2012, human capital development was achieved not only through training programmes, but also via experiential learning through job attachments, cross assignments and job rotations. In addition, the company is focusing more intently on mentoring as part of initiatives to create a wider pool of talented employees.
TNB has an on-going programme to build its workforce and ensure its employees are equipped with the right capabilities to carry out their functions. Over the years, millions of ringgit have been spent in learning and development programmes, and the trend will continue now that the company is spreading its wings overseas. The establishment of a competent and productive workforce forms a cornerstone of TNB’s growth and features among the objectives of the company’s current Strategic Plan.
Dato’ Muhammad Razif bin Abdul RahmanVice President
196
TENAGA NASIONAL BERHAD (200866-W)
Key
Initi
ativ
es
Annual Report 2012
Human Capital
Towards Business Expansion

197
EXPERIENTIAL LEARNING AND
CAPACITY BUILDING
TNB believes that providing high-potential
employees hands-on experience is one of
the most effective approaches in developing
leaders across the organisation. In 2012, the
company embarked on numerous job
attachment programmes either overseas or
in selected units within Group Internal
Audit, Group Finance and Group Human
Resources (GHR). The aim is to expose
employees to cross-cultural situations and
diverse disciplines so that they are able to
see the bigger picture in managing the
business. A total of 22 employees are
currently attached at various projects and
stations overseas while 16 employees from
the Corporate Talent Pool were stationed at
various units to further expand their
knowledge base throughout the year.
In addition, TNB participates in the annual
cross-assignment and cross-fertilisation
programmes between GLCs and the
Government. In 2012, six employees were
placed at several departments within the
Government and other GLCs, exposing them
to different environments and cultures.
The graph below shows the relation
between training budget utilisation and
employees’ competency scores over the
last five years. The competency score of
81% obtained in the financial year 2012 is
the highest during this period.
0
20
40
60
80
100
120
0
10
20
30
40
50
60
70
80
90
FY08 FY09 FY10 FY11 FY12
Actual Training Cost Spend (RM million)
Competency Score (%)
41
.6
62
.4
78
80
77
81
85
90
.6
11
2.4
10
1.6
% RM million
191999999999999777777777777777777197
KEEPING THE LIGHTS ON
Key
Initi
ativ
es
Annual Report 2012
Human Capital Development Towards Business Expansion

With regard to mentoring, every new
executive recruited is assigned a mentor. At
the same time, all employees undergoing
internal certification programmes to
facilitate their career progression are paired
with mentors during on-the-job training
modules at stations. During the year under
review, 226 non-executives underwent
these development programmes and were
successfully upgraded to higher positions
upon their completion.
TALENT MANAGEMENT FRAMEWORK
ENHANCED
TNB recognises that it is crucial to have a
pool of leaders who are able to steer the
company as it expands its business. An
assessment tool has been developed to
identify potential leaders by measuring
their competencies and readiness for
greater responsibilities. An established
Corporate Talent Pool (CTP) is now also
supported by Divisional Talent Pool (DTP)
initiatives. There are currently 320 and 660
employees in the CTP and DTP respectively.
The development programme for the CTP
is centralised at GHR while that for the DTP
is designed by the respective Divisions,
focusing on technical functionalities. These
frameworks are crucial in establishing
efficient succession plans for key posts in
the company.
The Special ist Career Path Scheme,
meanwhile, was made more attractive by
introducing flexi-grades for all positions
enabling incumbents to be promoted right
up to top management level. Currently,
there are three specialists and 32 technical
experts in the fields of Generation,
Transmission, Distribution and ICT.
Most future leaders of the company are
recruited into the Trainee Executive
Programme (PEP) itself, hence the selection
process for this is monitored rigorously. A
new executive has to undergo three stages
of group discussions, technical interviews
and experiential learning before being
recruited into the company. Upon
completion of the PEP programme, a
module focusing on functional competency
is provided to ensure continuity in career
development.
ENGAGED WORKFORCE FOR HIGHER
PRODUCTIVITY
Acknowledging the importance of an
engaged workforce, TNB has embarked on
various initiatives to inspire employees to
perform their best. In 2012, four aspects of
engagement were highlighted, namely
c o m m u n i c a t i o n b y l e a d e r s , c a r e e r
opportunities, recognition and performance
management. These focus areas were chosen
based on the Employee Engagement Survey
(EES) conducted in the previous year, in
which the company managed to obtain a
commendable score of 84%.
Activities to engage employees include
Management by Walking About (MBWA), an
outreach programme, job rotation and
assignment, recognition standardisation and
workshops on performance management.
Emphasis is also placed on building
relationships and trust among employees as
well as between the management and
employees in order to create an environment
in which job functions are carried out
smoothly and effectively.
Towards maintaining close ties with
employees, the management engages
regularly with the three TNB unions, namely
Persatuan Eksekutif TNB (PET), Kesatuan
Percantuman Pekerja-Pekerja TNB (K3P) and
Junior Officer Union (JOU). There is a
constant flow of feedback from the unions
and all concerns raised are addressed in the
spirit of achieving the company’s goals.
WORKFORCE OPTIMISATION
TNB’s Strategic Plan highl ights the
importance of efficiency in optimising the
company’s workforce. Accordingly a
manpower planning process has been
established and is regularly reviewed to
reflect optimum productivity. The Labour
Productivity Index (LPI) was introduced at
core and support divisions in the year
under review to measure workforce
productivity. Meanwhile, a High Performing
Workforce (HPW) initiative is being reviewed
as a mechanism to boost productivity.
Other workforce optimisation initiatives
include:
● Consistent reviews of job descriptions
with the help of the Job Description
(JD) online system
● Implementation of a culture change
programme which places emphasis on
learning and cross-functional teams
● Process reviews and restructuring
INTERNAL PROCESS ENHANCEMENT
HR strives continuously to improve its
service efficiency and transparency through
the enhancement of various systems. For
example, the Employee Self Service (ESS)
e-leave module for non-executives was
completed in June 2012, while in July 2012
HR began trials on the e-pay slip. In
addition, HR is implementing an On-Line
Performance Improvement Programme
(PIP), an E-Promotion to Position (e-POP)
and a Long Service Award System.
198
TENAGA NASIONAL BERHAD (200866-W)
Key
Initi
ativ
es
Annual Report 2012
Human Capital Development Towards Business Expansion

In the financial year 2012, two lab sessions
were conducted on caring for employees
a n d c o m p l i a n c e w i t h r e g u l a t o r y
requirements, and the recommendations
put forward are being implemented. These
labs are taking forward work initiated
following three labs held in the previous
year. To date, 75% of initiatives implemented
as a result of the first three labs have been
completed and efforts are being made to
ensure the objectives are fully achieved.
A total of 25 HR practitioners within the
company have completed a series of
courses and evaluations towards obtaining
HR certification from the Malaysian Institute
of Human Resource Management (MIHRM).
The management bel ieves that the
certification will increase the level of
professionalism among the HR practitioners
and act as recognition of their capabilities
in HR management.
A GHR Compliance Task Force (GHRCT) was
established in early 2012 to ensure all HR
practitioners at every level comply fully
with the company’s HR policies and
procedures. Part of the function of the
GHRCT is to detect issues at the business
unit level and to resolve these via
appropriate recommendations.
3RD TNB HR CONFERENCE
More than 400 HR practitioners from all
levels in TNB attended the 3rd HR
Conference organised by GHR on 27-28
June 2012. Prominent leaders from
government, multinational companies,
NGOs and GLCs were invited to share the
latest developments as well as best
practices in HR. The conference’s theme, HR
Transformation – Building a Strategic HR,
reflects the commitment of GHR to be a
strategic business partner to the company
in realising its vision. The conference
provided an ideal platform for HR
practitioners from TNB to network with
their counterparts from other GLCs and
relevant agencies.
BEYOND THE COMPANY, FOR THE
COUNTRY
For TNB, recognition from external parties
indicates that we are moving in the right
direction. In the financial year 2012, TNB
Integrated Learning Solution Sdn Bhd
(ILSAS) received the Energy Industry Award
for Energy Training Providers from the
Energy Commission for excellence in
training and competency development.
Meanwhile, two employees were recognised
by the Malaysian Institute of Management
(MIM). Pn Azrina Abdul Samad, Senior
Manager (Macro Policy, Regulation &
Pricing), from the Planning Division won
the MIM - Public Bank Manager of the Year
Award - Service Category while another
talent was a finalist in the same category.
The award underlines TNB employees’
contributions and professional experience.
In support of the national agenda, TNB
takes part in the Skim Latihan 1Malaysia
(SL1M). Throughout the financial year, TNB
took on a total of 210 unemployed
graduates for 12-month work exposure in
various business functions. The company
also participated in numerous career fairs
throughout the country and continued to
work closely with government units such as
the Ministry of Human Resources on issues
related to human resources development.
199
KEEPING THE LIGHTS ON
Key
Initi
ativ
es
Annual Report 2012
Human Capital Development Towards Business Expansion

OVERVIEWTNB, as a government-linked company
(GLC), has successfully demonstrated
outstanding achievements in managing
occupational safety and health at the
workplace. This would not be possible
without the strong commitment and
support from top management and all
staff. These achievements have propelled
TNB to the next level with better ability to
compete globally. Various efforts and
initiatives have been implemented to
ensure that occupational safety and health
management remains effective and aligned
to current regulatory requirements and
new technologies.
STRATEGIC PLAN
Rapid development of the country in
various industrial sectors, together with the
evolution of new technologies, pose a
challenge to TNB. The company has to
ensure its safety and health controls are
effective and in keeping with national
development. Thus, a strategic and
systematic plan has been developed by the
company for a period of five years, from
2010 to 2015.
Key initiatives include enhancing the
effectiveness of safety enforcement with
the objective of attaining full compliance
with occupational safety and health
requirements. Several programmes have
been developed and designed for TNB to
remain relevant and ultimately geared
towards realising TNB’s 20-Year Strategic
Plan for geographical expansion in 2015.
AWARDS AND RECOGNITIONS
GOLD MERIT
❏ Putrajaya Power Station, Generation
Division
❏ Asset Maintenance Department –
Kelantan, Transmission Division
❏ Asset Maintenance Department –
Pahang, Transmission Division
❏ Asset Development Department –
Eastern Region, Transmission Division
GOLD CLASS I
❏ TNB Janamanjung Sdn Bhd
❏ Chenderoh Power Station, Generation
Division
❏ Gelugor Power Station, Generation
Division
❏ Connaught Bridge Power Station,
Generation Division
❏ S u l t a n I s m a i l P o w e r S t a t i o n ,
Generation Division
❏ Cameron Highlands Power Stations,
Generation Division
❏ Asset Development Department –
Major Project, Transmission Division
34,280CONTRACTORS ATTENDED NIOSH-TNB SAFETY PASSPORT (NTSP) PROGRAMME SINCE ITS INTRODUCTION IN 2006
1.42OCCUPATIONAL ACCIDENT RATE PER 1,000 WORKERS
OHSAS 18001 CERTIFICATIONFULL RECOGNITION FROM THIRD PARTY FOR TRANSMISSION AND GENERATION DIVISIONS
90%5 STAR ACHIEVEMENTS IN SAFETY EXCELLENCE MANAGEMENT SYSTEM (SEMS) AUDIT
Malaysian Society for Occupational Safety
and Health (MSOSH) Award 2011
The MSOSH Award is an annual award
presented to companies in Malaysia with
proven outstanding Occupational Safety
and Health (OSH) performance.
200
TENAGA NASIONAL BERHAD (200866-W)
Key
Initi
ativ
es
Annual Report 2012
Occupational Safety and Health

❏ Asset Development Department –
Central Region, Transmission Division
❏ Asset Development Department –
Northern Region, Transmission
Division
❏ Asset Development Department –
Southern Region, Transmission
Division
❏ Asset Maintenance Department –
Johor I I (Kluang), Transmission
Division
❏ Asset Maintenance Department –
Kedah & Perlis, Transmission Division
❏ Asset Maintenance Department –
Kuala Lumpur, Transmission Division
❏ Asset Maintenance Department –
Pulau Pinang, Transmission Division
❏ Asset Maintenance Department –
Melaka, Transmission Division
❏ Asset Maintenance Department –
Terengganu, Transmission Division
❏ TNB Kuala Lumpur, Distribution
Division
❏ TNB Melaka, Distribution Division
❏ TNB Pahang, Distribution Division
GOLD CLASS II
❏ Sultan Mahmud Power Station,
Kenyir, Generation Division
❏ Asset Maintenance Department –
Johor I (Johor Bahru), Transmission
Division
❏ Asset Maintenance Department –
Negeri Sembilan, Transmission Division
❏ Asset Maintenance Department –
Perak, Transmission Division
SILVER
❏ Sultan Iskandar Power Station,
Generation Division
❏ S u n g a i P e r a k P o w e r S t a t i o n s ,
Generation Division
EMERGENCY PREPAREDNESS &
RESPONSE DRILL
The emergency preparedness drill is an
annual event conducted at all TNB divisions,
with particular focus on the power stations.
The objectives of this exercise are to test:
● the state of readiness of the power
station’s emergency management team
in handling emergencies,● the ability to command and control,● the effectiveness of communication
protocols, and● the ability of the emergency response
team to respond tactically in containing
the situation.
This exercise involves a total of 13 power
stations in collaboration with agencies such
as the Fire Department, Police and
Hospitals. The drill emergency scenario is
simulated to resemble as closely as possible
a real emergency situation. Desktop drills
are s imilar ly conducted for system
emergency scenarios involving the critical
“Islanding Operation”. The outcomes of all
drill exercises are reported to TNB’s
Corporate Emergency Response Plan (CERP)
Steering Committee.
WAY FOWARD
● TNB Safety Information System (TSIS)
TNB Safety Information System (TSIS) is
a computerised information system that
provides a platform to standardise
information relating to occupational
safety, health and environment. There
are four main modules, namely risk,
incident and action management,
r e p o r t s a n d d a s h b o a r d s . O n c e
established, this system will make the
safety information systems more
effective and accessible to all employees.
● New Occupational Safety, Health and
Environment (OSHE) Policies
TNB will implement new policies
relating to:
a. Corporate Fire Safety
b. Personal Protective Equipment
c. Occupational Health, Safety and
Environment Enforcement
These policies have been developed to
serve as reference points throughout
the organisation to achieve the highest
standards of OSHE practice. Adherence
to these policies will strengthen OSHE
management and contribute to added
value in the organisation.
● Building Capacity
TNB’s Safety School has been given the
role of organising and conducting OSHE
training to ensure the development of
relevant skills and knowledge among
employees. During the year under
review, 90 training sessions were
successfully conducted involving a total
of 2,700 staff. The Safety School has
a lso been entrusted to provide
c o n s u l t a n c y s e r v i c e s i n t h e
implementation of an Occupational,
Safety and Health management system
for certifications such as OHSAS 18001
and ISO 14001.
201
KEEPING THE LIGHTS ON
Key
Initi
ativ
es
Annual Report 2012
Occupational Safety and Health

ENVIRONMENTAL POLICY
As the main electricity provider, TNB is
sensitive to its responsibility of managing
the country’s natural resources wisely to
conserve the environment and minimise
carbon emissions. In 2005, the company
implemented an Environmental Policy with
the aim of:
● Taking environmental protection and
conservation into consideration in all
operations and decision-making
● Complying with all applicable laws and
regulations, and establishing standards
that wil l lead to the continuous
improvement of its environment
performance
We are Committed to the Continuous Improvement of Our Environmental Performance whilst Providing Safe, Efficient and Reliable Electricity Supply.
TNB Recognises that Economic Growth, Sustainable Development and Quality of Life Go Hand in Hand.
202
Key
Initi
ativ
es
Commitment to the Environment

● Implementing an Environmental
Management System (EMS) to eliminate
or minimise the environmental impact
of its operations
● Conducting environmental audits and
training programmes
● Promoting environmental awareness
among contractors, the public and other
stakeholders and to make available the
Environmental Policy to them
A. Environmental Management Plan
The Environmental Management Plan was
formulated as a licensing requirement
under the Environmental Quality Act, 1974;
and to ensure TNB’s power stations comply
with the Department of Environment’s
detailed Environmental Impact Assessment.
The programme focuses on monitoring air
and water quality as well as the boundary
noise level at all major projects.
B. Environmental Audits and MS ISO
Certification
To ensure an effective environment system
is in place and that environmental
management is continuously improved, all
TNB power plants have implemented the
Environmental Management System MS ISO
14001:2004, and have succeeded in getting
the certification from SIRIM QAS International
Sdn. Bhd.
C. Scheduled Waste Disposal
TNB has implemented a Scheduled Waste
Management programme to comply with
the Environmental Quality (Scheduled
Waste) Regulation 2005. Scheduled waste
includes all waste that requires disposal by
contractors registered with the Department
of Environment (DoE).
The DoE is notified of all scheduled waste
generated, which is deposited at the
Scheduled Waste Store prior to disposal.
Environmental Management Representatives
are responsible for recording, monitoring
and managing wastes generated at their
respective units.
D. Recycling Programme
Waste recycling and reduction programmes
are included in EMS initiatives at the
division level. Most power plants are
implementing this programme in addition
to the Environmental Management
programme to reduce consumption and
minimise wastage. Meanwhile, Transmission
Division has implemented a Condition
Monitoring Programme in which used
transformer oil is filtered using the latest
technology and then recycled back for use
in operations.
203
Key
Initi
ativ
es
Commitment to the Environment

E. Crisis Management
Crisis Management in TNB is coordinated
by the Emergency Response Team (ERT)
under TNB’s Safety Excellence Management
System (SEMS), which has been implemented
in all the divisions. SEMS identifies every
possible emergency that could take place
in the divisions’ business activities. An
Emergency Response Plan (ERP) has been
developed to mitigate these emergencies.
F. Halon Replacement
All equipment in TNB’s Generation,
Transmission and Distribution Divisions are
now halon-free.
G. Current Issues
i. Clean Development Mechanism (CDM)
at Ulu Jelai Hydroelectric Project
TNB is currently developing a Clean
Development Mechanism (CDM) at
the Ulu Jelai Hydroelectric Project in
Pahang. The CDM, as defined by
Kyoto Protocol/UNFCCC, has two
objectives: 1) to assist developed/
industrial countries achieve sustainable
development and to reduce the
emission of greenhouse gaseous; and
2) to assist developing countries,
for example Malays ia , achieve
their emission limits and reduction
commitments.
The 372MW Ulu Jelai Hydroelectric
Project is estimated to generate an
average of 374GWh of electricity per
annum. Its clean technologies will
contribute to the elimination of the
equivalent of 250,387 tonnes of CO2 a
year, or 1,752,709 tonnes over a
seven-year crediting period.
ii. Research on Carbon Fixation of Flue
Gas using Microalgae
The Electricity and Energy Industry
contributes to about 26% of total CO2
emissions in the country. As an industry
leader, TNB is exploring the possibility
of employing biological sequestration
of CO2 to fix some of the CO2 from the
flue gas released from its power plants
as an alternative to Carbon Capture
and Storage. Based on photosynthesis,
this natural and sustainable method of
CO2 sequestration has the added
advantage of producing valuable by-
products such as biodiesel. TNB’s
research focuses on the potential of
carbon fixation using the marine
microalgae, Isochrysis sp.
Upcoming initiatives involve the
design and development of a pilot
photobioreactor plant at a coal-fired
power station.
iii. Lake Brief Programme for lakes under
hydroelectric schemes
All lakes under the supervision of
TNB’s Generation Division are being
m o n i t o r e d u n d e r a L a k e B r i e f
programme run in collaboration with
the National Hydraulic Research
Institute of Malaysia (NAHRIM).
Beginning early 2010, the programme
seeks to determine the quality of the
lakes’ water, level of sedimentation,
pollution and eutrophication, as well
as fish population.
204
TENAGA NASIONAL BERHAD (200866-W)
Key
Initi
ativ
es
Annual Report 2012
Commitment to the Environment

Lake Brief takes into account details
such as the size of the lake, volume of
water, morphology, topography, water
consumption, in flow and out flow, its
socio-economic role and land use
within the catchment areas. The
information gathered is fed into
NAHRIM’s database, which will later
be useful for policy-making and
guidelines on the conservation of
lakes as valuable natural resources.
iv. Fish Rescue during Sg Terengganu
Diversion
A Fish Rescue Programme was
conducted at the Hulu Terengganu
Hydroelectric Project site, when Sg
Terengganu had to be diverted to
make way for a cofferdam. Fish caught
during this rescue operation were
transferred to temporary fish ponds
located at TNB Research Centre, within
the project area, before being released
to the upper stream away from the
project area and human intrusion.
Via the initiative, 59 species were
s a v e d , i n c l u d i n g t h e v a l u a b l e
freshwater species, Tor tambroides
(ikan kelah). The programme was
supported by local government
agencies such as the Fisheries
Department, DOE and Forestry
Department.
v. Wildlife Management Programme in
Hulu Terengganu
A Wildlife Management Programme
(WMP) was developed for the Hulu
Terengganu Hydroelectric project to
protect the flora and fauna of the
Tembat and Petuang Forest Reserves
in Hulu Terengganu. The collaboration
between TNB Research Sdn Bhd and
the Department of Wildlife and
National Parks, Peninsular Malaysia
(PERHILITAN) consists of:
● Monitoring the project area to
ensure no violations of the Wildlife
Act 716/2010
● Wi ld l i fe surveys to provide
baseline data for developing a
comprehensive wildlife rescue plan
in advance of the rescue operation
● R e s e a r c h i n g t h e e f f e c t s o f
constructing a dam on the human-
elephant conflict in the area
● Ensuring the wildl i fe rescue
operation is carried out smoothly
The WMP is being implemented in
two phases; Phase 1 during the
construction activities (2011-2014),
and Phase 2 during the impoundment
activities, which are scheduled for
early 2015.
205
KEEPING THE LIGHTS ON
Key
Initi
ativ
es
Annual Report 2012
Commitment to the Environment

Corporate Social Responsibility (CSR) is
about how an organisation assumes
responsibility for the impact of its actions
and operations on customers, suppliers,
employees, shareholders, local communities
and other stakeholders, as well as the
environment. It stems from an organisation’s
commitment to operating in an economically,
socially and environmentally sustainable
manner, often going beyond statutory
obligations to enhance the well-being of
society, and nation, and in the process gain
greater stakeholder trust and confidence.
At TNB, our core business of supplying
electricity fulfills a basic socio-economic
need, hence all our efforts to improve the
efficiency of our operations necessarily
enhances the way we fulfill our social
contract. However, as with the best CSR
efforts, our concept of corporate citizenry is
holistic and we ensure that we make a
meaningful as well as sustainable impact
on all the lives that we touch via education,
community outreach programmes, staff
welfare, the promotion of small and
m e d i u m - s i z e d v e n d o r c o m p a n i e s ,
supporting sports and artistic talent, as well
as by protecting our natural resources and
the environment.
As with our business operations, our CSR
initiatives continue to evolve as we strive to
i m p l e m e n t g l o b a l b e s t p r a c t i c e s .
A discernible example of this is our CSR
reporting this year. In the past, we have
reported our CSR under the seven pillars of
206
TENAGA NASIONAL BERHAD (200866-W)
Key
Initi
ativ
es
Annual Report 2012
Corporate Social Responsibility

P o w e r i n g C o m m u n i t i e s , P o w e r i n g
Education, Powering Business Excellence,
Powering a Green Nation, Powering
Champions, Powering the Workforce and
Powering Unity. This year, we have
collapsed the seven pillars into four, in line
with guidelines of leading CSR authorities
such as the Global Reporting Index (GRI),
ACCA and Bursa Malaysia. The four
categories are: the Community, Marketplace,
Workplace and the Environment.
SERVING THE COMMUNITY
Within the community, TNB has a tradition
of promoting education , aiding the
underprivileged and supporting the
development of sports and arts in the
country.
Our education initiatives date back to the
early days when employees had to be
sponsored to obtain the necessary technical
qualif ications to contribute towards
developing the power industry. For many
years, the engineers who would go on to
bring electricity to millions of Malaysians
received their tertiary education abroad,
many under scholarship from TNB itself. As
the company’s internal knowledge base
increased, it found itself in the position of
being able to set up its own training centre,
the Institut Latihan Sultan Ahmad Shah
(ILSAS), in 1976.
This was followed by the establishment in
1997 of the wholly-owned University
Tenaga Nasional (UNITEN), which offers
quality programmes in engineering, IT and
business management at the foundation,
undergraduate and postgraduate levels.
All the programmes are recognised by the
Malaysian Qualifications Agency (MQA),
while the Engineering programmes are
recognised by the Board of Engineers
Malaysia (BEM) and UK bodies such as the
Institution of Mechanical Engineers,
Institution of Engineering and Technology
and the Institution of Civil Engineering.
By end 2011, UNITEN had produced more
than 17,495 graduates who are now serving
the sectors of engineering, accountancy,
management and finance both locally and
abroad. UNITEN offers scholarships to its
students, under the Yayasan Canselor
UNITEN, a trust fund that was incorporated
for a period of five years from 2010 to 2014
under the Trustees (Incorporation) Act 1952
(Act 258) on 2 June 2009.
At the same time, the Group’s scholarship
programme for outstanding Malaysians
seeking to further their studies at local and
foreign universities has continued, funded
by TNB’s foundation, Yayasan Tenaga
Nasional (YTN). In the FY2012, YTN spent a
total of RM42.9 million to sponsor 1,868
students. This represents the largest annual
contribution made by TNB towards
promoting the professional workforce.
207
KEEPING THE LIGHTS ON
Key
Initi
ativ
es
Annual Report 2012
Corporate Social Responsibility

At the primary level, TNB is a staunch
advocate of the Khazanah Nasional-inspired
school adoption project, PINTAR. Standing
for Promoting Intelligence, Nurturing Talent
and Advocating Responsibility, PINTAR is
implemented by government l inked
c o m p a n i e s ( G L C s ) t o e n h a n c e t h e
educational level and promote excellence
among underserved schools in Malaysia.
TNB has adopted 27 primary schools
nationwide under the programme, and
assigned a liaison officer in each state to
mentor the adopted schools. In the FY2012,
a total of 2,635 Year 6 students benefitted
from the activities organised to improve
their performance in the Ujian Pencapaian
Sekolah Rendah (UPSR).
Other than supporting the underprivileged
through education, TNB extends a helping
hand to the hardcore poor via the Baiti
Jannati programme, which means ‘My
Home, My Heaven’ in Arabic. Under this
programme, TNB transforms dilapidated
houses into comfortable homes equipped
with electricity, water and proper sanitation.
The company also provides furniture, basic
food stuff and educational support for the
recipients’ children. Priority is given to
senior citizens, single parents and the
disabled. Since the programme was
introduced in 2007, 107 houses have been
repaired at a cost of RM1.75 million.
Since 2008, we have also adopted the
fishing community in Kampung Kuantan,
Kuala Selangor, and are helping them
improve their livelihood by upgrading the
firefly centre in their village and placing
signages along the route from Kuala
Lumpur to attract more visitors. In FY2012,
we also bought 10 new boats to replace
damaged ones, and arranged 23 visits by
government agencies and corporate bodies.
We are also sponsoring Arabic and Japanese
classes for the boatmen so they can
communicate with tourists from these
countries, and organise an annual Let’s Go
to School with TNB programme for their
children. We have put aside RM1.50 million
for this community project.
More generally, TNB contributes to the
well-being of the poor by paying zakat
(business tithes) to the religious authorities
in all the states where we operate.
The amount paid in each state depends on
the number of poor households, as
determined by the Economic Planning Unit
(EPU). In FY2012, the Group’s zakat
amounted to RM3,375,872.50.
Through YTN, we also regularly donate to
the Majlis Kanser Nasional (MAKNA) and
National Heart Institute (IJN). During the
year under review, we channeled RM100,000
towards MAKNA’s Mobile Cancer Screening
programme in rural communities. As of
August 2012 a total of 1,125 kampung folk
had been screened for cancer. YTN also
allocated RM100,000 to the IJN to help
finance heart surgeries for underprivileged
patients below the age of 18 years. YTN
has been supporting IJN since 2007 and,
to date, 54 children have benefited from
its donations.
TNB has always been a loyal supporter of
sporting activities and local sporting
talents, providing funds to uplift sports
standards in the country. From the early
d a y s , w e h a v e w e l c o m e d n a t i o n a l
sportsmen and women on our payroll to
provide them with a steady income as they
continued to train for local and international
competit ions. S ince 2006, we have
sponsored the activities of the Malaysian
Hockey Confederation (MHC). TNB also
organises a hockey coaching programme
208
TENAGA NASIONAL BERHAD (200866-W)
Key
Initi
ativ
es
Annual Report 2012
Corporate Social Responsibility

for students aged 13-17 years, conducted by employees who
are national hockey players. To date, 2,000 new talents have
been identified from seven states through this programme.
In addition, hockey clinics are run for the company’s PINTAR
students.
Other than hockey, TNB has a tradition of supporting SUKMA,
and this year was a Platinum Sponsor, donating RM100,000
towards SUKMA XV, held in Pahang from 7-16 July 2012.
The progressive management at TNB has also always believed
in the inherent value of art, and has served to promote artistic
talent in the country. The company began collecting the works
of prominent Malaysian artists in the 1960s, and today has a
collection of more than 70 pieces, representing one of the oldest
corporate collections in the country. This body of art is housed in
Galeri Tenaga, in Wisma TNB, Petaling Jaya. In addition to its own
collection, the gallery holds exhibitions of contemporary
Malaysian artists.
Both sports and art contribute towards creating a Malaysian
identity, which in turn serves to maintain national unity.
To further support the Government’s aspiration to nurture
1Malaysia, TNB hosts internal programmes and sends contingents
to participate in events organised by the Government that bring
together Malaysians of all creeds from all walks of life. These
include occasions such as Independence Day, Malaysia Day,
Federal Territory Day, Labour Day, Women’s Day, Sambutan
Maulidur Rasul and Maal Hijrah.
A LEADER IN THE MARKETPLACE
TNB has distinguished itself in the marketplace not just as
Malaysia’s leading electricity utility, but as an organisation that
uses its leadership position to further develop the energy
industry. We have also been a partner to the Government in
ensuring the widest possible distribution of electricity, extending
its reach to remote villages and islands.
209
KEEPING THE LIGHTS ON
Key
Initi
ativ
es
Annual Report 2012
Corporate Social Responsibility

TNB’s successes in the marketplace to date
are underpinned by a strong Corporate
Governance (CG) f ramework which
e n h a n c e s t r a n s p a r e n c y a s w e l l a s
stakeholder value. The Board of Directors
takes the lead in ensuring the company
adopts best practices in CG, and keeps up-
to-date with the latest enhancements in
this area. The Board is guided by the
Malaysian Code on Corporate Governance
and other relevant legislation to protect the
well-being of all stakeholders at all times.
In terms of stakeholder engagement, we
have in place various programmes targeted
at the different groups of stakeholders. We
have a well-oiled Investor Relations
Programme which includes investor briefings,
site visits and one-on-one dialogue. We
recently revised our Procurement Policy and
Procedures (PPP) both to reduce costs and to
strengthen our relationship with suppliers.
TNB is a role model in terms of vendor
development, our Bumiputera Vendor
Development Programme (VDP) having
benefited 468 companies to date. Just in
FY2012, we awarded a total of about RM1.0
billion in contracts to our vendors. Our VDP is
so successful that TNB has been appointed by
the Putrajaya Committee on GLC High
Performance (PCG) to chair the VDP Sub-
Group Circle Meeting, aimed at spurring on
more GLCs to contribute to national wealth
creation by implementing their own
structured vendor development programmes.
TNB also engages regularly with local
communities at the grassroots level. For
example, staff at power stations organise
annual Power Station Open Days, provide
free medical check-ups for the people and
take part in gotong-royong programmes. Via
th e Community Leaders Outreach
Programme (CLOP) launched in early 2005,
Management communicate directly with
community leaders , heads of local
governments and stakeholders on services,
complaints, enquiries and suggestions. The
feedback obtained is used to improve our
services. In conjunction with the programme,
we also organise exhibitions on our products,
services and activities. In the FY2012, TNB
spent RM353,979.67 to organise 13 CLOP
sessions throughout the peninsula.
As a responsible power company, TNB also
undertakes to educate children and
members of the public on using electricity
safely. The Electricity Safety Awareness
Campaign is an on-going effort organised in
col laborat ion with State Educat ion
Departments (SED). In FY2012, 3,449
participants benefitted from the programme.
But perhaps the most significant contribution
TNB is able to make in the marketplace is to
stay true to our core promise of Keeping the
Lights On, and to ensure that consumers can
afford to do so. We have set ourselves high
standards to drive operational excellence
and are guided to achieve these by our
20-Year Strategic Plan.
While staying focused on our core business
responsibility, TNB also fully supports the
Government in its efforts to achieve 100%
electrification of the country. Through the
Rural Electrification Programme, TNB
provides electricity to communities in
210
TENAGA NASIONAL BERHAD (200866-W)
Key
Initi
ativ
es
Annual Report 2012
Corporate Social Responsibility

remote villages and estates as well as to the
many small islands that dot Malaysia’s
coastline. The programme is run in
collaboration with the Ministry of Rural and
Regional Development (KKLW) and the
Electricity Supplies Industry Trust Account
(AAIBE) under the Ministry of Energy, Green
Technology and Water (KeTTHA). Electricity
is provided in these areas either by extending
TNB’s grid or via the installation of generator
sets, solar hybrid systems or other forms of
renewable energy. In FY2012, TNB was
awarded 91 rural electrification projects at a
total cost of RM83.5 million involving close
to 2,000 kampung houses. Of these,
54 projects were funded by KKLW and
another 37 projects by AAIBE/KeTTHA. Also
with the KKLW, TNB has been installing
street lights in villages around Malaysia.
Since the Village Street Lights Project
started in 2005, a total of 137,109 street
lights have been erected throughout
Peninsular Malaysia.
In addition, TNB has been involved in a
Rural School Electrification Project to
provide 24-hour supply to 42 schools in
very remote areas. Of the schools, 19 have
been connected through grid lines, 19 are
supplied via a solar hybrid system and four
receive electr ic i ty f rom standalone
generator systems. We were awarded the
RM98 million project by the Ministry of
Education in 2010, and completed it on 30
June 2012.
Finally, TNB plays a critical role in providing
the industry’s perspective in any policy-
making that affects the power sector.
At present, Planning Division leads a
cross-divisional team engaged with
Government agencies on the Fuel Cost Pass
Through (FCPT), which is to be part of the
soon-to-be-implemented Incentive-Based
Regulation (IBR).
WELLBEING AT THE WORKPLACE
TNB has always valued our employees and
provided them with a conducive work
environment that is both challenging and
rewarding. In July 2012, our President/CEO
Datuk Wira Ir. Azman Mohd introduced a
‘Vibrant Workforce, Productivity Revolution’
driven by four thrusts: Building Trust and
Relationships, Building Capacity, Building
Performance and Bui ld ing Growth.
The objective is to create an environment
where our more than 33,500 employees are
motivated, competent and committed to
the company’s goals.
For our part, we empower our workforce by
providing systematic training programmes
and career development opportunities, a
safe and healthy working environment,
attractive compensation and benefits
scheme, and work-life balance.
211
KEEPING THE LIGHTS ON
Key
Initi
ativ
es
Annual Report 2012
Corporate Social Responsibility

TNB has embarked on an integrated human
resources and career development initiative,
i n w h i c h t r a i n i n g , e d u c a t i o n a n d
development programmes are directly
linked to the career path and progression
of our employees. Although there are
distinct career plans for executives and
non-executives, there is a link between the
two, offering opportunities for career
advancement for non-executives who
aspire to serve the company in executive
positions. In FY2012, RM101.6 million was
spent on professional development, and
84.2% of the workforce attended at least
three days training.
Our employee healthcare benefits are
among the most comprehensive in the
country. Currently, we have 1,136 clinics
and hospitals across the country on our
panel. In addition to paying for medical
bills, we also provide our employees and
retirees medical aids such as wheelchairs,
hearing aids and prosthetic limbs. Our
healthcare benefits cover our employees’
immediate families. Children are eligible for
medical benefits up to the age of 18 years
or up to 24 years if they are still studying;
and there is no age limit for ‘special
children’. Employees aged 40 and above
are encouraged to undergo full medical
examinations at least once every two years,
while health talks and screenings are
routinely held. In FY2012, 74 health
campaigns were organised benefiting more
than 7,500 employees and retirees.
We believe that an engaged workforce is
the most productive. Hence, we adopt
several measures to engage all our
employees, from keeping them updated on
the latest corporate developments through
various electronic and print channels to
more personal sessions at which top
Management meet employees at the
regional and state levels. An important
event on our calendar is the Annual
Assembly held in conjunction with our
Anniversary celebration and New Year
gathering. At this gathering, both the
Chairman and the President/CEO address
employees and share with them their vision
for the company.
Employees have the opportunity to voice
out their opinions or grouses directly to the
top Management through emails and
dialogue sessions. These efforts are integral
to our efforts to be ‘The Employer of
Choice’. We conduct an annual Employee
212
TENAGA NASIONAL BERHAD (200866-W)
Key
Initi
ativ
es
Annual Report 2012
Corporate Social Responsibility

Engagement Survey (EES) to gauge the
effectiveness of our programmes and to
monitor employees’ commitment to the
organisation.
T o w a r d s p r o m o t i n g a s a f e w o r k
environment, Occupational Safety and
Health (OSH) courses such as SEMS Auditors,
Safety Representatives and Office Safety are
organised to ensure all employees attend
at least one day of OSH training per year.
At the same time, a Safety Excellence
Management System (SEMS) is being
adopted by all divisions and subsidiaries.
As a result of these initiatives, more
departments have been certified to OHSAS
18000 and MS 1722.
We believe, further, that employees need to
enjoy a healthy work-life balance in order to
perform optimally. Towards this end, we
support the childcare needs of employees
with young children by providing nine
nurseries and 11 kindergartens. Tuition is
offered for older children, at a minimal rate.
Staff are also encouraged to take part in
physical, recreational and social activities
organised by in-house clubs and societies.
There are 63 registered Kilat Clubs in the
c o u n t r y , t o w h i c h T N B c h a n n e l e d
approximately RM496,000 to finance sports
and social activities. Women employees and
wives of employees have the option of
jo ining PELITAWANIS, which has a
membership of 6,037. The society organises
charitable events, which are supported with
funds from TNB. In FY2012, the company
contributed about RM817,000 towards
PELITAWANIS. The welfare of our Muslim
employees is looked after by PAKATAN/
Persatuan Kebajikan Pekerja Islam TNB
(PKPI), which also organises outreach
programmes. In FY2012, this included
donating about USD4,800 to Islamic
communities in three villages in Cambodia.
TNB, meanwhile, supported PKPI with a
donation of RM270,000 for the financial year.
Families are invited to take part in fun-filled
Family Days which alternate on a yearly basis
with Sports Carnivals. The Family Days are
held at the headquarters and at the individual
states, while the Sports Carnival brings
together sportsmen from the TNB family
from all over Malaysia to the Klang Valley.
Retirees are not left out, and have their
own society, Persatuan Bekas Pekerja LLN/
TNB, which organises various social events.
In FY2012, RM130,000 was spent on social
and recreational activities including Majlis
Berbuka Puasa and Majlis Hari Raya.
To keep a constantly high morale at work,
TNB recognises outstanding employees at
the Meritorious Service Awards held at the
corporate and divisional levels. At the
corporate level, 33 employees in the
Executive, Non-Executive (Technical) and
Non-Executive (Non-Technical) categories
were awarded at the Majlis Perhimpunan
Warga Kerja TNB held on 19 January 2012.
The company also shows its appreciation to
long-serving employees. On 17-18 March
2012, 1,425 employees from all over the
country who have served between 25-35
years were feted.
In the event of the death of an employee,
the company provides RM2,000 to widows
and gives monthly stipends of RM60 each
to orphans aged seven to 12 years, and
RM90 each to children aged 13-17 years. In
F Y 2 0 1 2 , T N B s p e n t a p p r o x i m a t e l y
RM698,000 on both programmes, benefiting
40 TNB widows and 662 TNB orphans.
Meanwhile, Kumpulan Wang Khairat Pekerja
dan Pesara TNB (KWKPPTNB) helps the
families of the bereaved to pay for funeral
expenses. Funds for the scheme are
collected from RM1 monthly contributions
from members. KWKPPTNB currently has
12,116 ordinary members and 4,398 life
members (those who have been contributing
for more than 15 years at retirement).
213
KEEPING THE LIGHTS ON
Key
Initi
ativ
es
Annual Report 2012
Corporate Social Responsibility

Internally, TNB fosters the spirit of 1Malaysia
by celebrating Hari Raya Aidilfitri, Chinese
New Year and Deepavali by hosting open
days at the headquarters and all state offices
at which management, staff, stakeholders
and other guests come together in the spirit
of unity. The company also has a nationwide
Buka Puasa programme during the month of
Ramadan, when the Management in every
state hosts about 300-400 guests, including
community leaders, to a breaking of fast at
a local mosque.
CHAMPION OF A GREENER
ENVIRONMENT
In light of the urgency of climate change
issues, TNB has stepped up our efforts to
ensure all our operations are eco-friendly,
creating minimal impact on the natural
environment. The company is guided by
our Green Energy Policy, introduced in
2011, which states: “TNB is committed to
support the national green agenda and by
applying sustainable, efficient operations
and delivering green energy through the
application of appropriate technologies
and investments.”
Our commitment to the green agenda is
reflected in on-going efforts to reduce the
country’s carbon footprint via both demand
side and supply side management. In the
former, we have been promoting energy
efficiency (EE) through educational
campaigns while towards the latter we have
been investing in renewable energy (RE)
such as hydroelectricity and biomass, and to
a smaller extent, solar-fuelled energy. TNB
s u p p o r t s t h e G o v e r n m e n t ’ s S m a l l
Renewable Energy Programme (SREP) by
helping RE producers to connect to the
national grid. To fund the Feed-in-Tariff (FiT)
introduced at end 2011, the Government
set up an RE Fund. We ensure all consumers
contribute to this fund by channelling 1% of
their electricity bills towards it. TNB plays a
critical role in the success of SREP by
collecting the RE Fund contributions and
paying the FiT. In effect, TNB is the
administrator of this fledgling RE sector.
TNB further supports all EE and RE efforts
by investing in research in these areas. In
2008, we set up the Institute of Energy
Policy and Research (IEPRe) and the Centre
of Renewable Energy (CRE) at UNITEN.
Our own plants incorporate green
technologies. The Sultan Azlan Shah Power
Station in Perak (TNB Janamanjung), for
example, employs clean coal technology
which meets World Health Organisation
(WHO) standards. Flue-gas desulphurisation
equipment traps dust before pollution-free
hot gases are discharged. The power plant
is further equipped with a first of its kind
smart weather-based coal dust suppression
system for a coal stock yard in the country.
At the Sultan Salahuddin Abdul Aziz Power
Station in Kapar, Selangor, meanwhile, the
ash ponds are so pristine they have been
recognised by the Asia Pacific Migratory
Waterbird Conservation Strategy as an
important migratory shorebird sanctuary,
and included in the East Asian-Australasian
Shorebird Site Network.
As part of our commitment towards the
environment, we have ‘adopted’ the firefly
colony in Kampung Kuantan and scientists
at TNB Research have undertaken firefly
conservation studies to ensure the
sustainability of this fascinating insect
species.
Environment consciousness at the Group
level has trickled down to the ground, and
staff at the Transmission Division run a Tree
For A Tree programme through which
trees that are felled to make way for
transmission infrastructure are replaced
with new trees elsewhere. To date, some
420 saplings have been planted. Staff from
the division also collaborate with non-
governmental organisations to carry out
river and seashore cleaning activities.
214
TENAGA NASIONAL BERHAD (200866-W)
Key
Initi
ativ
es
Annual Report 2012
Corporate Social Responsibility

YOU SEE

SAFETY AND SECURITYFOR EVERYONE
WE SEE...

K E E P I N G T H E
LIGHTS ON
218 Directors’ Report
224 Consolidated Income Statements
225 Consolidated Statements of
Comprehensive Income
226 Consolidated Statements of
Financial Position
229 Consolidated Statements of
Changes in Equity
233 Consolidated Statements of
Cash Flows
236 Notes to the Financial Statements
364 Supplementary Information
Disclosed Pursuant to Bursa
Malaysia Securities Berhad Listing
Requirements
365 Statement by Directors
365 Statutory Declaration
366 Independent Auditors’ Report
FINANCIALstatements

The Directors have pleasure in submitting their Report with the audited financial statements of the Group and Company for the financial
year ended 31 August 2012.
PRINCIPAL ACTIVITIES
The Group and Company are primarily involved in the business of the generation, transmission, distribution and sales of electricity and
those tabulated in Note 14 to the financial statements.
There have been no significant changes in these activities during the financial year under review.
FINANCIAL RESULTS
Group Company
RM’million RM’million
Profit for the financial year attributable to:
– Owners of the Company 4,197.6 3,118.1
– Non-controlling interests 8.6 0
Profit for the financial year 4,206.2 3,118.1
DIVIDENDS
The dividends paid or declared since the previous financial year ended 31 August 2011 were as follows:
RM’million
In respect of the financial year ended 31 August 2012:
Interim dividend of 5.09 sen per ordinary share comprising franked dividend
of 0.38 sen gross per ordinary share less income tax of 25.0% and a single-tier
dividend of 4.71 sen per ordinary share, paid on 25 May 2012 273.0
For the financial year ended 31 August 2012, the Directors had on 31 October 2012 recommended the payment of a final single-tier
dividend of 15.0 sen per ordinary share, subject to the approval of the shareholders at the forthcoming Annual General Meeting of the
Company. The books closure and payment dates will be announced in due course.
218
TENAGA NASIONAL BERHAD (200866-W)
Fina
ncia
l Sta
tem
ents
Annual Report 2012
Directors’ Report

RESERVES AND PROVISIONS
All material transfers to or from reserves and provisions during the financial year are shown in the financial statements.
ISSUE OF SHARES
During the financial year, 44,896,592 new ordinary shares of RM1.00 each were issued by the Company pursuant to the Employees’ Share
Option Scheme II (‘ESOS II’) at exercise prices of RM4.45, RM5.06, RM5.08, RM5.36, RM5.45, RM5.59, RM5.62, RM5.64, RM5.74, RM5.86,
RM5.93, RM6.09, RM6.24, RM6.40 and RM8.85 per share.
The new ordinary shares issued during the financial year ranked pari passu in all respects with the existing ordinary shares of the
Company.
EMPLOYEES’ SHARE OPTION SCHEME ‘ESOS’
Options under the ESOS were granted to eligible Directors, employees and retirees of the Group to subscribe for ordinary shares of
RM1.00 each in TNB. The first ESOS expired on 11 May 2002.
The Company implemented a new Employees’ Share Option Scheme II (‘ESOS II’) on 8 July 2003 for a period of 10 years. The ESOS II is
governed by the bye-laws, which were approved by the shareholders at the Extraordinary General Meeting (‘EGM’) held on 29 May 2003
and amended at the EGM held on 15 December 2005.
The main features and movements during the financial year in the number of options over the shares of the Company are set out in
Note 38 to the financial statements.
The Company has been granted an exemption by the Companies Commission of Malaysia via a letter dated 8 October 2012 from having
to disclose in this Report the name of the persons to whom options have been granted under the ESOS II and details of their holdings
pursuant to Section 169 (11) of the Companies Act, 1965 except for information on employees who were granted options representing
756,000 ordinary shares and above.
The employee of the Company who was granted options representing 756,000 ordinary shares and above under ESOS II is as follows:
No. of No. of No. of
ordinary ordinary ordinary
shares shares shares
granted exercised available
under the under the under the
Name Designation options options options
Datuk Wira Ir. Azman bin Mohd President/Chief Executive Officer 878,427 20,000 858,427
None of the subsidiaries’ employees were granted options representing 756,000 ordinary shares and above under ESOS II.
219
KEEPING THE LIGHTS ON
Fina
ncia
l Sta
tem
ents
Annual Report 2012
Directors’ Report

DIRECTORS
The Directors who have held office during the period since the date of the last Report are:
Tan Sri Leo Moggie
Datuk Wira Ir. Azman bin Mohd (Appointed as President/Chief Executive Officer w.e.f. 1 July 2012)
Dato’ Mohammad Zainal bin Shaari
Tan Sri Dato’ Hari Narayanan a/l Govindasamy
Dato’ Zainal Abidin bin Putih
Dato’ Fuad bin Jaafar
Tan Sri Dato’ Seri Siti Norma binti Yaakob
Dato’ Abd Manaf bin Hashim
Datuk Chung Hon Cheong
Suria binti Ab Rahman (Alternate Director to Dato’ Mohammad Zainal bin Shaari)
Datuk Nozirah binti Bahari
Dato’ Sri Che Khalib bin Mohamad Noh (Ceased as President/Chief Executive Officer on 30 June 2012)
DIRECTORS’ BENEFITS
During and at the end of the financial year, no arrangements subsisted to which the Company is a party, being arrangements with the
object or objects of enabling Directors of the Company to acquire benefits by means of the acquisition of shares in or debentures of the
Company or any other body corporate, except for the options granted to the President/Chief Executive Officer pursuant to the ESOS II.
Since the end of the previous financial year, no Director has received or become entitled to receive a benefit (other than benefits
disclosed as Directors’ remuneration and benefits in Note 5 to the financial statements) by reason of a contract made by the Company
or a related corporation with the Director or with a firm of which the Director is a partner, or with a company in which the Director has
a substantial financial interest.
220
TENAGA NASIONAL BERHAD (200866-W)
Fina
ncia
l Sta
tem
ents
Annual Report 2012
Directors’ Report

DIRECTORS’ INTERESTS IN SHARES AND DEBENTURES
According to the Register of Directors’ shareholdings, particulars of the interests of Directors who held office as at the end of the financial
year in shares in the Company are as follows:
Number of ordinary shares of RM1.00 each
As at As at
1.9.2011 Acquired Disposed 31.8.2012
Datuk Wira Ir. Azman bin Mohd 4,375* 0 0 4,375*
Dato’ Zainal Abidin bin Putih 1,562 0 0 1,562
Dato’ Fuad bin Jaafar 78,125 0 0 78,125
Tan Sri Dato’ Seri Siti Norma binti Yaakob 1,562 0 0 1,562
Options over ordinary shares of RM1.00 each
As at Options As at
1.9.2011 granted Exercised 31.8.2012
Datuk Wira Ir. Azman bin Mohd 798,427 60,000 0 858,427
* Through nominees of Tasec Nominees (Tempatan) Sdn. Bhd.
According to the Register of Directors, none of the other Directors held any options over shares in the Company.
Other than as those disclosed above, none of the Directors in office at the end of the financial year held any other interest in shares and
debentures of the Company and its related corporations.
221
KEEPING THE LIGHTS ON
Fina
ncia
l Sta
tem
ents
Annual Report 2012
Directors’ Report

STATUTORY INFORMATION ON THE FINANCIAL STATEMENT
Before the consolidated income statements, statements of comprehensive income and statements of financial position of the Group and
Company were prepared, the Directors took reasonable steps:
(a) to ascertain that proper action had been taken in relation to the writing off of bad debts and the making of allowance for doubtful
debts and satisfied themselves that all known bad debts had been written off and that adequate allowance had been made for
doubtful debts; and
(b) to ensure that any current assets, other than debts, which were unlikely to be realised in the ordinary course of business their values
as shown in the accounting records of the Group and Company had been written down to an amount which they might be
expected to be realised.
At the date of this Report, the Directors are not aware of any circumstances:
(a) which would render the amount written off for bad debts or the amount of the allowance for doubtful debts in the financial
statements of the Group and Company inadequate to any substantial extent; or
(b) which would render the values attributed to current assets in the financial statements of the Group and Company misleading; or
(c) which have arisen which render adherence to the existing method of valuation of assets or liabilities of the Group and Company
misleading or inappropriate.
No contingent or other liability has become enforceable or is likely to become enforceable within the period of twelve months after the
end of the financial year which, in the opinion of the Directors, will or may affect the ability of the Group or of the Company to meet
their obligations when they fall due.
At the date of this Report, there does not exist:
(a) any charge on the assets of the Group and Company which has arisen since the end of the financial year which secures the liability
of any other person; or
(b) any contingent liability of the Group and Company which has arisen since the end of the financial year.
At the date of this Report, the Directors are not aware of any circumstances not otherwise dealt with in this Report or the financial
statements which would render any amount stated in the financial statements misleading.
222
TENAGA NASIONAL BERHAD (200866-W)
Fina
ncia
l Sta
tem
ents
Annual Report 2012
Directors’ Report

STATUTORY INFORMATION ON THE FINANCIAL STATEMENTS CONTINUED
In the opinion of the Directors:
(a) the results of the Group’s and Company’s operations during the financial year were not substantially affected by any item,
transaction or event of a material and unusual nature other than as disclosed in the financial statements; and
(b) there has not arisen in the interval between the end of the financial year and the date of this report any item, transaction or event
of a material and unusual nature likely to affect substantially the results of the operations of the Group or Company for the financial
year in which this Report is prepared.
AUDITORS
The auditors, PricewaterhouseCoopers, have expressed their willingness to continue in office.
Signed on behalf of the Board of Directors, in accordance with their resolution dated 31 October 2012.
TAN SRI LEO MOGGIE DATUK WIRA IR. AZMAN MOHD
CHAIRMAN PRESIDENT/CHIEF EXECUTIVE OFFICER
223
KEEPING THE LIGHTS ON
Fina
ncia
l Sta
tem
ents
Annual Report 2012
Directors’ Report

Group Company
Note 2012 2011 2012 2011
(Restated) (Restated)
RM’million RM’million RM’million RM’million
Revenue 4 35,848.4 32,241.2 33,341.0 30,157.1
Operating expenses 5 (31,592.1) (30,956.4) (29,656.8) (28,779.3)
Other operating income 7 2,140.6 532.0 2,180.4 752.9
Operating profit 6,396.9 1,816.8 5,864.6 2,130.7
Foreign exchange loss 8 (252.2) (194.1) (225.8) (208.7)
Share of results of jointly controlled entities 15 (0.2) 0.6 0 0
Share of results of associates 16 27.0 92.8 0 0
Profit before finance cost 6,171.5 1,716.1 5,638.8 1,922.0
Finance income 9 188.7 319.1 304.8 404.6
Finance cost 9 (823.0) (878.5) (1,513.9) (1,711.5)
Profit before taxation and zakat 5,537.2 1,156.7 4,429.7 615.1
Taxation and zakat 10 (1,331.0) (192.2) (1,311.6) (36.8)
Profit for the financial year 4,206.2 964.5 3,118.1 578.3
Profit attributable to:
– Owners of the Company 4,197.6 965.4 3,118.1 578.3
– Non-controlling interests 8.6 (0.9) 0 0
Profit for the financial year 4,206.2 964.5 3,118.1 578.3
Sen Sen
(Restated)
Earnings per share:
– Basic 11(a) 76.82 17.71
– Diluted 11(b) 76.63 17.67
Dividends per share: Sen Sen
Interim dividend (gross) 12 0.38 4.5
Interim dividend (single-tier) 12 4.71 0
Proposed final dividend (single-tier) 12 15.0 0
The notes set out on pages 236 to 363 form an integral part of these financial statements.
224
TENAGA NASIONAL BERHAD (200866-W)
Fina
ncia
l Sta
tem
ents
Annual Report 2012
Consolidated Income Statementsfor the financial year ended 31 August 2012

Group Company
Note 2012 2011 2012 2011
(Restated) (Restated)
RM’million RM’million RM’million RM’million
Profit for the financial year 4,206.2 964.5 3,118.1 578.3
Other comprehensive expense:
Foreign currency translation differences (51.2) (8.1) 0 0
Total comprehensive income for the financial year 4,155.0 956.4 3,118.1 578.3
Total comprehensive income attributable to:
– Owners of the Company 4,146.4 957.3 3,118.1 578.3
– Non-controlling interests 8.6 (0.9) 0 0
Total comprehensive income for the financial year 4,155.0 956.4 3,118.1 578.3
The notes set out on pages 236 to 363 form an integral part of these financial statements.
225
KEEPING THE LIGHTS ON
Fina
ncia
l Sta
tem
ents
Annual Report 2012
Consolidated Statements of Comprehensive Incomefor the financial year ended 31 August 2012

Group Company
Note 2012 2011 1.9.2010 2012 2011 1.9.2010
(Restated) (Restated) (Restated) (Restated)
RM’million RM’million RM’million RM’million RM’million RM’million
NON-CURRENT ASSETS
Property, plant and equipment 13 64,769.9 61,861.4 58,895.3 61,271.8 60,483.0 60,028.8
Subsidiaries 14 0 0 0 2,964.2 3,916.3 3,443.4
Jointly controlled entities 15 0.4 0.6 0 0 0 0
Associates 16 491.2 407.8 245.7 213.0 218.2 110.6
Investment in unquoted debt securities 17 163.7 164.0 164.0 163.7 164.0 164.0
Available-for-sale financial assets 18 38.0 38.0 38.0 38.0 38.0 38.0
Deferred tax assets 19 0 30.2 55.9 0 0 0
Derivative financial instruments 20 116.3 89.9 53.4 0 0 0
Long term receivables 21 419.2 388.6 448.7 1,184.6 1,088.3 1,151.7
Prepaid leases 22 3,789.3 3,161.0 2,606.1 3,539.1 2,930.3 2,380.0
69,788.0 66,141.5 62,507.1 69,374.4 68,838.1 67,316.5
CURRENT ASSETS
Non-current assets held-for-sale 23 9.8 11.4 18.0 9.8 11.4 18.0
Inventories 24 2,842.2 2,645.9 2,450.4 1,529.6 1,356.7 1,265.0
Receivables, deposits and
prepayments 25 6,988.7 6,022.1 5,200.4 4,963.3 3,724.9 3,453.6
Current tax assets 142.4 264.5 15.2 0 236.5 0
Amounts due from subsidiaries 26 0 0 0 1,939.3 2,447.2 2,573.0
Amounts due from associates 62.6 14.6 5.7 61.6 14.6 5.3
Short term investments 0 0 113.3 0 0 113.3
Financial assets at fair value through
profit or loss 27 9.1 8.6 8.6 9.1 8.6 8.6
Derivative financial instruments 20 0 1.5 0 0 1.5 0
Deposits, bank and cash balances 28 8,626.3 3,954.2 8,343.7 3,961.2 2,703.9 6,456.6
18,681.1 12,922.8 16,155.3 12,473.9 10,505.3 13,893.4
The notes set out on pages 236 to 363 form an integral part of these financial statements.
226
TENAGA NASIONAL BERHAD (200866-W)
Fina
ncia
l Sta
tem
ents
Annual Report 2012
Consolidated Statements of Financial Positionas at 31 August 2012

Group Company
Note 2012 2011 1.9.2010 2012 2011 1.9.2010
(Restated) (Restated) (Restated) (Restated)
RM’million RM’million RM’million RM’million RM’million RM’million
CURRENT LIABILITIES
Payables 29 5,746.6 5,571.4 5,276.9 3,485.6 3,549.8 3,439.6
Amounts due to subsidiaries 26 0 0 0 1,246.0 1,608.6 1,105.1
Amounts due to associates 697.9 707.9 623.6 697.9 707.9 623.6
Current tax liabilities 331.0 5.7 317.6 263.5 0 306.6
Deferred income 30 894.7 523.9 331.3 770.0 487.4 331.3
Short term borrowings 31 1,604.2 1,727.3 3,162.7 759.3 954.5 2,531.8
Hire purchase creditors and
finance lease obligation 33 55.1 49.1 2.6 671.6 384.8 163.0
9,329.5 8,585.3 9,714.7 7,893.9 7,693.0 8,501.0
NET CURRENT ASSETS 9,351.6 4,337.5 6,440.6 4,580.0 2,812.3 5,392.4
TOTAL ASSETS LESS CURRENT LIABILITIES 79,139.6 70,479.0 68,947.7 73,954.4 71,650.4 72,708.9
NON-CURRENT LIABILITIES
Borrowings 32 (21,467.6) (17,326.8) (17,932.9) (10,735.6) (11,219.7) (11,880.1)
Amounts due to subsidiaries 0 0 0 (2,383.4) (2,467.8) (2,796.7)
Consumer deposits 34 (3,284.7) (3,084.9) (2,903.9) (3,093.8) (2,901.7) (2,731.3)
Derivative financial instruments 20 (21.5) (44.1) (70.8) (21.5) (44.1) (70.8)
Employee benefits 35 (4,489.7) (4,220.5) (3,866.3) (4,286.0) (4,043.7) (3,704.8)
Other liabilities 36 (892.2) (910.0) (1,031.6) (496.7) (496.5) (567.2)
Deferred tax liabilities 19 (8,284.6) (7,852.2) (7,815.9) (6,589.3) (6,130.5) (6,204.3)
Deferred income 30 (2,291.2) (2,849.6) (2,710.9) (2,016.4) (2,454.8) (2,345.1)
Government development grants 37 (671.0) (627.2) (599.0) 0 0 0
Hire purchase creditors and
finance lease obligation 33 (1,338.8) (1,334.3) (63.5) (11,893.9) (12,565.5) (12,950.3)
(42,741.3) (38,249.6) (36,994.8) (41,516.6) (42,324.3) (43,250.6)
TOTAL NET ASSETS 36,398.3 32,229.4 31,952.9 32,437.8 29,326.1 29,458.3
The notes set out on pages 236 to 363 form an integral part of these financial statements.
227
KEEPING THE LIGHTS ON
Fina
ncia
l Sta
tem
ents
Annual Report 2012
Consolidated Statements of Financial Positionas at 31 August 2012

Group Company
Note 2012 2011 1.9.2010 2012 2011 1.9.2010
(Restated) (Restated) (Restated) (Restated)
RM’million RM’million RM’million RM’million RM’million RM’million
EQUITY
Share capital 38 5,501.6 5,456.6 4,352.7 5,501.6 5,456.6 4,352.7
Share premium 39 4,529.1 4,332.6 5,354.2 4,529.1 4,332.6 5,354.2
Revaluation and other reserves 40 648.7 689.4 682.8 1,051.9 1,041.3 1,015.5
Retained profits 41 25,457.9 21,518.8 21,372.0 21,355.2 18,495.6 18,735.9
CAPITAL AND RESERVES
ATTRIBUTABLE TO OWNERS
OF THE COMPANY 36,137.3 31,997.4 31,761.7 32,437.8 29,326.1 29,458.3
NON-CONTROLLING INTERESTS 261.0 232.0 191.2 0 0 0
TOTAL EQUITY 36,398.3 32,229.4 31,952.9 32,437.8 29,326.1 29,458.3
Sen Sen Sen
(Restated) (Restated)
NET ASSETS PER SHARE
ATTRIBUTABLE TO OWNERS
OF THE COMPANY 656.9 586.4 729.7
The notes set out on pages 236 to 363 form an integral part of these financial statements.
228
TENAGA NASIONAL BERHAD (200866-W)
Fina
ncia
l Sta
tem
ents
Annual Report 2012
Consolidated Statements of Financial Positionas at 31 August 2012

Attributable to equity holders of the Company
Ordinary Employees’
shares Share Option Revaluation Non-
of RM1.00 Share Scheme and other Retained controlling Total
Note each premium reserve reserves profits interests equity
RM’million RM’million RM’million RM’million RM’million RM’million RM’million
Group
At 1 September 2011
(as previously reported) 5,456.6 4,332.6 156.6 532.8 19,701.5 91.6 30,271.7
Prior Year Adjustment 48 0 0 0 0 1,817.3 140.4 1,957.7
As at 1 September 2011 (restated) 5,456.6 4,332.6 156.6 532.8 21,518.8 232.0 32,229.4
Profit for the financial year 0 0 0 0 4,197.6 8.6 4,206.2
Total other comprehensive income 0 0 0 (51.2) 0 0 (51.2)
Total comprehensive income
for the financial year 0 0 0 (51.2) 4,197.6 8.6 4,155.0
Realisation of revaluation reserve 40 0 0 0 (14.5) 14.5 0 0
Transaction with owners:
Changes in ownership interest
in a subsidiary 0 0 0 0 0 21.9 21.9
Dividend paid for the
financial year 2012 12 0 0 0 0 (273.0) 0 (273.0)
Dividend paid to non-controlling
interest 0 0 0 0 0 (1.5) (1.5)
Employees’ Share Option Scheme:
– Options granted 0 0 25.0 0 0 0 25.0
Issuance of share capital:
– Share options 38, 39 45.0 196.5 0 0 0 0 241.5
Total transaction with owners 45.0 196.5 25.0 0 (273.0) 20.4 13.9
At 31 August 2012 5,501.6 4,529.1 181.6 467.1 25,457.9 261.0 36,398.3
The notes set out on pages 236 to 363 form an integral part of these financial statements.
229
KEEPING THE LIGHTS ON
Fina
ncia
l Sta
tem
ents
Annual Report 2012
Consolidated Statements of Changes in Equityfor the financial year ended 31 August 2012

Attributable to equity holders of the Company
Ordinary Employees’
shares Share Option Revaluation Non-
of RM1.00 Share Scheme and other Retained controlling Total
Note each premium reserve reserves profits interests equity
RM’million RM’million RM’million RM’million RM’million RM’million RM’million
Group
At 1 September 2010
(as previously reported) 4,352.7 5,354.2 122.5 560.3 20,020.6 42.9 30,453.2
Prior Year Adjustment 48 0 0 0 0 1,351.4 148.3 1,499.7
As at 1 September 2010
(restated) 4,352.7 5,354.2 122.5 560.3 21,372.0 191.2 31,952.9
Profit for the financial year 0 0 0 0 965.4 (0.9) 964.5
Total other comprehensive income 0 0 0 (8.1) 0 0 (8.1)
Total comprehensive income
for the financial year 0 0 0 (8.1) 965.4 (0.9) 956.4
Realisation of revaluation
reserve 40 0 0 0 (19.4) 19.4 0 0
Transaction with owners:
Dividends paid for the
financial year ended:
– 31.08.2010 12 0 0 0 0 (654.0) 0 (654.0)
– 31.08.2011 12 0 0 0 0 (184.0) 0 (184.0)
Redesignation of liability
to non-controlling interest 0 0 0 0 0 41.7 41.7
Employees’ Share Option
Scheme:
– Options granted 0 0 34.1 0 0 0 34.1
Issuance of share capital:
– Share options 38, 39 13.8 68.5 0 0 0 0 82.3
– Bonus share 1,090.1 (1,090.1) 0 0 0 0 0
Total transaction with owners 1,103.9 (1,021.6) 34.1 0 (838.0) 41.7 (679.9)
At 31 August 2011 (restated) 5,456.6 4,332.6 156.6 532.8 21,518.8 232.0 32,229.4
The notes set out on pages 236 to 363 form an integral part of these financial statements.
230
TENAGA NASIONAL BERHAD (200866-W)
Fina
ncia
l Sta
tem
ents
Annual Report 2012
Consolidated Statements of Changes in Equityfor the financial year ended 31 August 2012

Non-distributable Distributable
Ordinary Employees’
shares Share Option Revaluation
of RM1.00 Share Scheme and other Retained Total
Note each premium reserve reserves profits equity
RM’million RM’million RM’million RM’million RM’million RM’million
Company
At 1 September 2011
(as previously reported) 5,456.6 4,332.6 156.5 884.8 18,630.5 29,461.0
Prior Year Adjustment 48 0 0 0 0 (134.9) (134.9)
At 1 September 2011 (restated) 5,456.6 4,332.6 156.5 884.8 18,495.6 29,326.1
Profit for the financial year 0 0 0 0 3,118.1 3,118.1
Total comprehensive income
for the financial year 0 0 0 0 3,118.1 3,118.1
Realisation of revaluation reserve 40 0 0 0 (14.5) 14.5 0
Transaction with owners:
Dividend paid for the financial year 2012 12 0 0 0 0 (273.0) (273.0)
Employees’ Share Option Scheme:
– Options granted 0 0 25.1 0 0 25.1
Issuance of share capital:
– Share options 38, 39 45.0 196.5 0 0 0 241.5
Total transaction with owners 45.0 196.5 25.1 0 (273.0) (6.4)
At 31 August 2012 5,501.6 4,529.1 181.6 870.3 21,355.2 32,437.8
The notes set out on pages 236 to 363 form an integral part of these financial statements.
231
KEEPING THE LIGHTS ON
Fina
ncia
l Sta
tem
ents
Annual Report 2012
Consolidated Statements of Changes in Equityfor the financial year ended 31 August 2012

Non-distributable Distributable
Ordinary Employees’
shares Share Option Revaluation
of RM1.00 Share Scheme and other Retained Total
Note each premium reserve reserves profits equity
RM’million RM’million RM’million RM’million RM’million RM’million
Company
At 1 September 2010
(as previously reported) 4,352.7 5,354.2 111.3 904.2 19,030.5 29,752.9
Prior Year Adjustment 48 0 0 0 0 (294.6) (294.6)
At 1 September 2010 (restated) 4,352.7 5,354.2 111.3 904.2 18,735.9 29,458.3
Profit for the financial year 0 0 0 0 578.3 578.3
Total comprehensive income
for the financial year 0 0 0 0 578.3 578.3
Realisation of revaluation reserve 40 0 0 0 (19.4) 19.4 0
Transaction with owners:
Dividend paid for the financial year ended:
– 31.08.2010 12 0 0 0 0 (654.0) (654.0)
– 31.08.2011 12 0 0 0 0 (184.0) (184.0)
Employees’ Share Option Scheme:
– Options granted 0 0 45.2 0 0 45.2
Issuance of share capital:
– Share options 38, 39 13.8 68.5 0 0 0 82.3
– Bonus shares 1,090.1 (1,090.1) 0 0 0 0
Total transaction with owners 1,103.9 (1,021.6) 45.2 0 (838.0) (710.5)
At 31 August 2011 (restated) 5,456.6 4,332.6 156.5 884.8 18,495.6 29,326.1
The notes set out on pages 236 to 363 form an integral part of these financial statements.
232
TENAGA NASIONAL BERHAD (200866-W)
Fina
ncia
l Sta
tem
ents
Annual Report 2012
Consolidated Statements of Changes in Equityfor the financial year ended 31 August 2012

The notes set out on pages 236 to 363 form an integral part of these financial statements.
Group Company
2012 2011 2012 2011
(Restated) (Restated)
RM’million RM’million RM’million RM’million
CASH FLOWS FROM OPERATING ACTIVITIES
Profit for the financial year 4,206.2 964.5 3,118.1 578.3
Adjustments for:
Taxation and zakat 1,331.0 192.2 1,311.6 36.8
Property, plant and equipment:
– Depreciation 4,268.1 4,061.9 4,033.6 3,952.8
– Written off 44.4 35.5 31.3 34.8
– Gain on disposals (5.8) (1.4) (5.8) (1.4)
Provision for retirement benefits 877.5 859.6 840.3 818.4
Provision for share options 25.0 34.1 21.2 29.8
Translation loss 230.8 227.0 213.1 244.1
Gain on:
– Disposal of non-current assets held for sale (1.8) (43.3) (1.8) (43.3)
– Redemption of redeemable preference
shares in a subsidiary 0 0 (56.8) (259.7)
– Disposal of short term investment (0.2) (5.0) (0.1) (5.0)
Share of results in jointly controlled entity 0.2 (0.6) 0 0
Share of results in associates (54.4) (62.9) 0 0
Reversal/(Recognition) of negative goodwill on acquisition of an associate 27.4 (29.9) 0 0
Dividend income 0 (5.4) (108.2) (88.2)
Interest income (172.2) (319.1) (316.5) (434.8)
Interest on borrowings 664.3 865.3 414.1 582.7
Release of deferred income (928.2) (652.8) (811.4) (595.2)
Release of Government development grants (77.0) (64.6) 0 0
Allowance for impairment:
– Receivables 122.9 100.5 111.6 66.3
– Amounts due from subsidiaries 0 0 292.8 187.7
Reversal of impairment:
– Receivables (141.1) (24.5) (125.2) (19.1)
– Amounts due from jointly controlled entities (0.5) (3.2) (0.5) (3.2)
Allowance for diminution in value of investments in subsidiaries 0 0 774.1 0
Write-back of diminution in value of marketable securities (0.5) 0 (0.5) 0
Allowance for inventory obsolescence 132.9 109.2 132.9 109.2
Write-back of inventory obsolescence (111.8) (117.8) (111.8) (117.7)
Inventories written off 18.6 22.9 18.4 21.4
Changes in fair value of derivatives and amortisation (50.1) (78.1) (6.5) 5.1
10,405.7 6,064.1 9,768.0 5,099.8
233
KEEPING THE LIGHTS ON
Fina
ncia
l Sta
tem
ents
Annual Report 2012
Consolidated Statements of Cash Flowsfor the financial year ended 31 August 2012

Group Company
2012 2011 2012 2011
(Restated) (Restated)
RM’million RM’million RM’million RM’million
CASH FLOWS FROM OPERATING ACTIVITIES (CONTINUED)
Inventories (236.0) (209.8) (212.4) (104.5)
Receivables (1,594.7) (1,296.2) (1,898.4) (271.3)
Payables 21.3 533.3 (421.5) (485.5)
Amounts due from subsidiaries 0 0 (410.7) (505.2)
Amounts due (from)/to associates (58.0) 75.4 (57.1) 75.0
Amounts due to jointly controlled entities 0.5 3.1 0.6 3.1
Cash generated from operations 8,538.8 5,169.9 6,768.5 3,811.4
Employee benefits paid (608.3) (505.4) (598.0) (479.5)
Contributions received 777.4 949.3 655.6 861.0
Consumer deposits received 199.8 181.0 192.1 170.5
Taxation and zakat paid (432.1) (696.8) (352.9) (653.7)
Net cash flows generated from operating activities 8,475.6 5,098.0 6,665.3 3,709.7
CASH FLOWS FROM INVESTING ACTIVITIES
Additional investments in:
– Subsidiary 0 0 (91.9) (437.2)
– Associates (91.9) (113.3) 0 (112.9)
Proceeds from redemption:
– Redeemable preference shares in a subsidiary 0 0 494.0 850.0
– Unsecured loan notes in an associate 5.2 5.2 5.2 5.2
Dividend income received 25.4 56.4 86.8 76.5
Interest income received 166.7 308.0 138.7 274.0
Property, plant and equipment:
– Additions (7,004.4) (5,655.9) (4,655.4) (4,257.7)
– Proceeds from disposals 6.0 2.0 6.0 2.0
Proceeds from disposal of non-current assets held for sale 18.3 67.0 18.3 67.0
Proceeds from disposal of short term investments 0.2 118.3 0.2 118.3
Net cash flows used in investing activities (6,874.5) (5,212.3) (3,998.1) (3,414.8)
The notes set out on pages 236 to 363 form an integral part of these financial statements.
234
TENAGA NASIONAL BERHAD (200866-W)
Fina
ncia
l Sta
tem
ents
Annual Report 2012
Consolidated Statements of Cash Flowsfor the financial year ended 31 August 2012

The notes set out on pages 236 to 363 form an integral part of these financial statements.
Group Company
Note 2012 2011 2012 2011
(Restated) (Restated)
RM’million RM’million RM’million RM’million
CASH FLOWS FROM FINANCING ACTIVITIES
Government development grants received 120.8 92.8 0 0
Proceeds from issuance of shares 241.5 82.3 241.5 82.3
Long term borrowings:
– Drawdown 4,888.2 438.6 0 0
– Repayments (1,275.1) (3,100.1) (824.5) (2,531.2)
Short term borrowings:
– Drawdown 353.5 332.7 0 0
– Repayments (329.6) (284.5) 0 0
Interest paid (675.2) (995.8) (553.9) (760.7)
Dividends paid to shareholders (273.0) (838.0) (273.0) (838.0)
Dividends paid to non-controlling interest (1.5) 0 0 0
Issue of shares to non-controlling interest 21.9 0 0 0
Net cash flows generated from/(used in) financing activities 3,071.5 (4,272.0) (1,409.9) (4,047.6)
NET INCREASE/(DECREASE) IN DEPOSIT, BANK
AND CASH BALANCES 4,672.6 (4,386.3) 1,257.3 (3,752.7)
EFFECT OF CHANGES IN FOREIGN CURRENCY (0.5) (3.2) 0 0
DEPOSIT, BANK AND CASH BALANCES AT THE BEGINNING
OF THE FINANCIAL YEAR 3,954.2 8,343.7 2,703.9 6,456.6
DEPOSIT, BANK AND CASH BALANCES
AT THE END OF THE FINANCIAL YEAR 28 8,626.3 3,954.2 3,961.2 2,703.9
Cash at bank, held in trust* (97.9) (465.7) 0 0
Debt reserve account** 32(b)(i) (218.6) (225.2) 0 0
Funds from MOF*** (2.5) (5.2) 0 0
CASH AND CASH EQUIVALENTS AT THE END
OF THE FINANCIAL YEAR 8,307.3 3,258.1 3,961.2 2,703.9
* The cash at bank held in trust is in respect of a grant given to a subsidiary by the Government of Malaysia for a designated capital
project.
** Debt reserve account relates to deposits placed with licensed financial institution as part of security obligations for bond financing.
*** Ministry of Finance (MOF) fund given to a subsidiary under stimulus package for training programmes.
235
KEEPING THE LIGHTS ON
Fina
ncia
l Sta
tem
ents
Annual Report 2012
Consolidated Statements of Cash Flowsfor the financial year ended 31 August 2012

1 GENERAL INFORMATION
The Group and Company are primarily involved in the business of the generation, transmission, distribution and sale of electricity
and those tabulated in Note 14 to these financial statements.
There have been no significant changes in these activities during the financial year.
The Company is a public limited liability company, incorporated and domiciled in Malaysia and listed on the Main Board of Bursa
Malaysia Securities Berhad.
The address of the registered office of the Company is Pejabat Setiausaha Syarikat, Tingkat 2, Ibu Pejabat Tenaga Nasional Berhad,
No. 129, Jalan Bangsar, 59200 Kuala Lumpur, Malaysia.
2 SUMMARY OF SIGNIFICANT ACCOUNTING POLICIES
Unless otherwise stated, the following accounting policies have been applied consistently in dealing with items that are considered
material in relation to the financial statements. These policies have been consistently applied to all the years presented, unless
otherwise stated.
(a) Basis of preparation
The financial statements of the Group and Company have been prepared in accordance with the provisions of the Companies
Act 1965 and Financial Reporting Standards (‘FRS’), the MASB Approved Accounting Standards in Malaysia for Entities Other
than Private Entities.
The financial statements have been prepared under the historical cost convention except as disclosed in this summary of
significant accounting policies.
The preparation of financial statements in conformity with FRS, requires the use of certain critical accounting estimates and
assumptions that affect the reported amounts of assets and liabilities and disclosure of contingent assets and liabilities at the
date of the financial statements, and the reported amounts of revenues and expenses during the reported period. It also
requires Directors to exercise their judgement in the process of applying the Group’s accounting policies. Although these
estimates and judgement are based on the Directors’ best knowledge of current events and actions, actual results may differ.
The areas involving a higher degree of judgement or complexity, or areas where assumptions and estimates are significant to
the financial statements are disclosed in Note 3 to these financial statements.
The financial statements have been approved for issue in accordance with a resolution of the Board of Directors on 31 October
2012.
236
TENAGA NASIONAL BERHAD (200866-W)
Fina
ncia
l Sta
tem
ents
Annual Report 2012
Notes to the Financial Statements– 31 August 2012

2 SUMMARY OF SIGNIFICANT ACCOUNTING POLICIES CONTINUED
(a) Basis of preparation (continued)
(i) Standards, amendments to published standards, Interpretation Committee (“IC”) Interpretations and improvements that
are effective
The new accounting standards, amendments to published standards, IC Interpretations and improvement to existing
standards effective for the Group’s and Company’s financial year beginning 1 September 2011 are as follows:
• Amendments to FRS 2 “Share-based Payment” and “Group Cash-settled Share-based Payment Transactions”
• Amendments to FRS 7 “Financial Instruments: Disclosures – Improving Disclosures About Financial Instruments”
• IC Interpretation 4 “Determining Whether an Arrangement Contains a Lease”
• Amendments to IC Interpretation 14 “Prepayment of a Minimum Funding Requirement”
• Amendments to IC Interpretation 19 “Extinguishing Financial Liabilities with Equity Instruments”
• Improvements to FRSs (2010)
A summary of the material impact of the new accounting standards, amendments and improvements to published and
existing standards and IC Interpretations on the financial statements of the Group and Company is set out in Note 48
to the financial statements.
The Notes to the balances as at 1 September 2010 that were restated due to a change in accounting policy have been
disclosed in the financial statements whilst the Notes to the unaffected balances have not been included.
(ii) Standards early adopted by the Group and Company
The Group and Company did not early adopt any new accounting standards, amendments and improvements to
published and existing standards and IC Interpretations.
(iii) Standards, amendments to published standards, IC Interpretations and improvements to existing standards that are
applicable to the Group and Company but not yet effective
In the next financial year, the Group will be adopting the new IFRS-compliant framework, Malaysian Financial Reporting
Standards (“MFRS”). In adopting the new framework, the Group will be applying MFRS 1 “First-time Adoption of MFRS”.
The Group will apply the new standards, amendments to standards and interpretations in the following period:
(i) Financial year beginning on/after 1 September 2012
• The revised MFRS 124 “Related Party Disclosures” (effective from 1 January 2012) removes the exemption to
disclose transactions between government-related entities and the government, and all other government-
related entities. The following new disclosures are now required for government related entities:
– The name of the government and the nature of their relationship;
– The nature and amount of each individually significant transactions; and
– The extent of any collectively significant transactions, qualitatively or quantitatively.
237
KEEPING THE LIGHTS ON
Fina
ncia
l Sta
tem
ents
Annual Report 2012
Notes to the Financial Statements– 31 August 2012

2 SUMMARY OF SIGNIFICANT ACCOUNTING POLICIES CONTINUED
(a) Basis of preparation (continued)
(iii) Standards, amendments to published standards, IC Interpretations and improvements to existing standards that are
applicable to the Group and Company but not yet effective (continued)
(i) Financial year beginning on/after 1 September 2012 (continued)
• Amendment to MFRS 112 “Income taxes” (effective from 1 January 2012) introduces an exception to the
existing principle for the measurement of deferred tax assets or liabilities arising on investment property
measured at fair value. MFRS 112 currently requires an entity to measure the deferred tax relating to an asset
depending on whether the entity expects to recover the carrying amount of the asset through use or sale. It
can be difficult and subjective to assess whether recovery will be through use or through sale when the asset
is measured using the fair value model in MFRS 140 “Investment property”. As a result of the amendments, IC
Interpretation 121 “Income taxes – recovery of revalued non-depreciable assets” will no longer apply to
investment properties carried at fair value. The amendments also incorporate into MFRS 112 the remaining
guidance previously contained in IC Interpretation 121 which is withdrawn.
• Amendment to MFRS 7 “Financial instruments: Disclosures on transfers of financial assets” (effective from
1 January 2012) promotes transparency in the reporting of transfer transactions and improve users’
understanding of the risk exposures relating to transfers of financial assets and the effect of those risks on an
entity’s financial position, particularly those involving securitisation of financial assets.
• Amendment to MFRS 101 “Presentation of items of other comprehensive income” (effective from 1 July 2012)
requires entities to separate items presented in ‘other comprehensive income’ (OCI) in the statement of
comprehensive income into two groups, based on whether or not they may be recycled to profit or loss in the
future. The amendment does not address which items are presented in OCI.
(ii) Financial year beginning on/after 1 September 2013
• MFRS 10 “Consolidated financial statements” (effective from 1 January 2013) changes the definition of control.
An investor controls an investee when it is exposed, or has rights, to variable returns from its involvement with
the investee and has the ability to affect those returns through its power over the investee. It establishes
control as the basis for determining which entities are consolidated in the consolidated financial statements
and sets out the accounting requirements for the preparation of consolidated financial statements. It replaces
all the guidance on control and consolidation in MFRS 127 “Consolidated and separate financial statements”
and IC Interpretation 112 “Consolidation – special purpose entities”.
• MFRS 11 “Joint arrangements” (effective from 1 January 2013) requires a party to a joint arrangement to
determine the type of joint arrangement in which it is involved by assessing its rights and obligations arising
from the arrangement, rather than its legal form. There are two types of joint arrangement: joint operations
and joint ventures. Joint operations arise where a joint operator has rights to the assets and obligations
relating to the arrangement and hence accounts for its interest in assets, liabilities, revenue and expenses. Joint
ventures arise where the joint operator has rights to the net assets of the arrangement and hence equity
accounts for its interest. Proportional consolidation of joint ventures is no longer allowed.
238
TENAGA NASIONAL BERHAD (200866-W)
Fina
ncia
l Sta
tem
ents
Annual Report 2012
Notes to the Financial Statements– 31 August 2012

2 SUMMARY OF SIGNIFICANT ACCOUNTING POLICIES CONTINUED
(a) Basis of preparation (continued)
(iii) Standards, amendments to published standards, IC Interpretations and improvements to existing standards that are
applicable to the Group and Company but not yet effective (continued)
(ii) Financial year beginning on/after 1 September 2013 (continued)
• MFRS 12 “Disclosures of interests in other entities” (effective from 1 January 2013) sets out the required
disclosures for entities reporting under the two new standards, MFRS 10 and MFRS 11, and replaces the
disclosure requirements currently found in MFRS 128 “Investments in associates”. It requires entities to disclose
information that helps financial statement readers to evaluate the nature, risks and financial effects associated
with the entity’s interests in subsidiaries, associates, joint arrangements and unconsolidated structured entities.
• MFRS 13 “Fair value measurement” (effective from 1 January 2013) aims to improve consistency and reduce
complexity by providing a precise definition of fair value and a single source of fair value measurement and
disclosure requirements for use across MFRSs. The requirements do not extend the use of fair value accounting
but provide guidance on how it should be applied where its use is already required or permitted by other
standards. The enhanced disclosure requirements are similar to those in MFRS 7 “Financial instruments:
Disclosures”, but apply to all assets and liabilities measured at fair value, not just financial ones.
• The revised MFRS 127 “Separate financial statements” (effective from 1 January 2013) includes the provisions
on separate financial statements that are left after the control provisions of MFRS 127 have been included in
the new MFRS 10.
• The revised MFRS 128 “Investments in associates and joint ventures”(effective from 1 January 2013) includes
the requirements for joint ventures, as well as associates, to be equity accounted following the issue of MFRS
11.
• Amendment to MFRS 1 “First time adoption of MFRSs: Government loans” (effective from 1 January 2013)
provides relief to first-time adopters from the retrospective application of MFRS 120 “Accounting for
Government Grants and Disclosure of Government Assistance” on government loans at a below-market rate of
interest existing at the date of transition to MFRS.
• Amendment to MFRS 7 “Financial instruments: Disclosures” (effective from 1 January 2013) requires more
extensive disclosures focusing on quantitative information about recognised financial instruments that are
offset in the statement of financial position and those that are subject to master netting or similar arrangements
irrespective of whether they are offset.
• Amendment to MFRS 119 “Employee benefits” (effective from 1 January 2013) makes significant changes to the
recognition and measurement of defined benefit pension expense and termination benefits, and to the
disclosures for all employee benefits. Actuarial gains and losses will no longer be deferred using the corridor
approach. MFRS 119 shall be withdrawn on application of this amendment.
239
KEEPING THE LIGHTS ON
Fina
ncia
l Sta
tem
ents
Annual Report 2012
Notes to the Financial Statements– 31 August 2012

2 SUMMARY OF SIGNIFICANT ACCOUNTING POLICIES CONTINUED
(a) Basis of preparation (continued)
(iii) Standards, amendments to published standards, IC Interpretations and improvements to existing standards that are
applicable to the Group and Company but not yet effective (continued)
(iii) Financial year beginning on/after 1 September 2014
• Amendment to MFRS 132 “Financial instruments: Presentation” (effective from 1 January 2014) does not
change the current offsetting model in MFRS 132. It clarifies the meaning of ‘currently has a legally enforceable
right of set-off’ that the right of set-off must be available today (not contingent on a future event) and legally
enforceable for all counterparties in the normal course of business. It clarifies that some gross settlement
mechanisms with features that are effectively equivalent to net settlement will satisfy the MFRS 132 offsetting
criteria.
(iv) Financial year beginning on/after 1 September 2015
• MFRS 9 “Financial instruments – classification and measurement of financial assets and financial liabilities”
(effective from 1 January 2015) replaces the multiple classification and measurement models in MFRS 139 with
a single model that has only two classification categories: amortised cost and fair value. The basis of
classification depends on the entity’s business model for managing the financial assets and the contractual
cash flow characteristics of the financial asset.
• The accounting and presentation for financial liabilities and for de-recognising financial instruments has been
relocated from MFRS 139, without change, except for financial liabilities that are designated at fair value
through profit or loss (“FVTPL”). Entities with financial liabilities designated at FVTPL recognise changes in the
fair value due to changes in the liability’s credit risk directly in other comprehensive income (OCI). There is no
subsequent recycling of the amounts in OCI to profit or loss, but accumulated gains or losses may be
transferred within equity.
The guidance in MFRS 139 on impairment of financial assets and hedge accounting continues to apply.
MFRS 7 requires disclosures on transition from MFRS 139 to MFRS 9.
(v) Impact arising from the initial application of the above standards in the financial statements of the Group and
Company.
• The Group has not completed its assessment of the financial effects of the differences between Financial
Reporting Standards and accounting standards under the MFRS Framework. Accordingly, the consolidated
financial performance and financial position as disclosed in these financial statements for the year ended 31
August 2012 could be different if prepared under the MFRS Framework.
240
TENAGA NASIONAL BERHAD (200866-W)
Fina
ncia
l Sta
tem
ents
Annual Report 2012
Notes to the Financial Statements– 31 August 2012

2 SUMMARY OF SIGNIFICANT ACCOUNTING POLICIES CONTINUED
(b) Subsidiaries and basis of consolidation
(i) Subsidiaries
Subsidiaries are those corporations or other entities (including special purpose entities) in which the Group has power to
exercise control over the financial and operating policies so as to obtain benefits from their activities, generally
accompanying a shareholding of more than one half of the voting rights. The existence and effect of potential voting
rights that are currently exercisable or convertible are considered when assessing whether the Group controls another
entity.
In the Company’s separate financial statements, investments in subsidiaries are stated at cost less accumulated
impairment losses. On disposal of such investments, the difference between net disposal proceeds and their carrying
amounts is included in the income statement.
(ii) Basis of consolidation
The consolidated financial statements comprise the financial statements of the Company and its subsidiaries. The
financial statements of the subsidiaries are prepared for the same reporting date as the Company.
Subsidiaries are consolidated from the date on which the Group obtains control, and continue to be consolidated until
the date that such control ceases. In preparing the consolidated financial statements, intragroup balances, transactions
and unrealised gains or losses are eliminated in full. Uniform accounting policies are adopted in the consolidated financial
statement for like transactions and events in similar circumstances.
The consideration transferred for acquisition of a subsidiary is the fair values of the assets transferred, the liabilities
incurred and the equity interests issued by the Group. The consideration transferred includes the fair value of any asset
or liability resulting from a contingent consideration arrangement. Acquisition-related costs are expensed as incurred.
Identifiable assets acquired and liabilities and contingent liabilities assumed in a business combination are measured
initially at their fair values at the acquisition date.
In a business combination achieved in stages, the previously held equity interest in the acquiree is re-measured at its
acquisition date fair value and the resulting gain or loss is recognised in profit or loss.
The excess of the consideration transferred, the amount of any non-controlling interest in the acquiree and the
acquisition-date fair value of any previous equity interest in the acquiree over the fair value of the Group’s share of the
identifiable net assets acquired is recorded as goodwill. If this is less than the fair value of the net assets of the subsidiary
acquired in the case of a bargain purchase, the gain is recognised in profit or loss. Refer to accounting policy Note 2(f)
on goodwill.
Non-controlling interest is the equity in a subsidiary not attributable, directly or indirectly, to a parent. On an acquisition-
by-acquisition basis, the Group measures any non-controlling interest in the acquiree either at fair value or at the non-
controlling interest’s proportionate share of the acquiree’s identifiable net assets. At the end of reporting period, non-
controlling interest consists of amount calculated on the date of combinations and its share of changes in the subsidiary’s
equity since the date of combination.
241
KEEPING THE LIGHTS ON
Fina
ncia
l Sta
tem
ents
Annual Report 2012
Notes to the Financial Statements– 31 August 2012

2 SUMMARY OF SIGNIFICANT ACCOUNTING POLICIES CONTINUED
(b) Subsidiaries and basis of consolidation (continued)
(ii) Basis of consolidation (continued)
All earnings and losses of the subsidiary are attributed to the parent and the non-controlling interest, even if the
attribution of losses to the non-controlling interest results in a debit balance in the shareholders’ equity. Profit or loss
attribution to non-controlling interests for prior years is not restated.
(iii) Changes in ownership interest
When the Group ceases to have control, joint control or significant influence, any retained interest in the entity is re-
measured to its fair value with the change in carrying amount recognised in the income statement. This fair value is its
fair value on initial recognition as a financial asset in accordance with FRS 139. Any amounts previously recognised in
other comprehensive income in respect of that entity are accounted for as if the Group had directly disposed of the
related assets or liabilities. Subsequently, it is accounted for as an equity accounted investee or as an available-for-sale
financial asset depending on the level of influence retained.
(c) Transactions with non-controlling interests
The Group applies a policy of treating transactions with non-controlling interests as transactions with equity owners of the
Group. For purchases from non-controlling interests, the difference between any consideration paid and the relevant share of
the carrying value of net assets of the subsidiary acquired is deducted from equity. For disposals to non-controlling interests,
where there is no change in controls, differences between any proceeds received and the relevant share of non-controlling
interests are also recorded in equity.
(d) Jointly controlled entities
Jointly controlled entities are corporations, partnerships or other entities over which there is contractually agreed sharing of
control by the Group with one or more parties where the strategic financial and operating decisions relating to the entities
require unanimous consent of the parties sharing control. The Group’s interest in jointly controlled entities is accounted for in
the consolidated financial statements using the equity method of accounting.
Equity accounting involves recognising in the consolidated income statement and consolidated statement of changes in
equity, the Group’s share of profits less losses of jointly controlled entities based on the latest audited financial statements or
management accounts of the jointly controlled entities, made up to the financial year end of the Group. Where necessary,
adjustments are made to the results and net assets of jointly controlled entities to ensure consistency of accounting policies
with those of the Group. The Group’s investment in jointly controlled entities is recorded at cost inclusive of goodwill and
adjusted thereafter for accumulated impairment loss and the post acquisition change in the Group’s share of net assets of the
jointly controlled entities.
Unrealised gains on transactions between the Group and its jointly controlled entities are eliminated to the extent of the
Group’s interest in the jointly controlled entities. Unrealised losses are also eliminated on the same basis but only to the extent
of the costs that can be recovered, and the balance that provides evidence of reduction in net realisable value or an
impairment of the asset transferred are recognised in the consolidated income statement.
242
TENAGA NASIONAL BERHAD (200866-W)
Fina
ncia
l Sta
tem
ents
Annual Report 2012
Notes to the Financial Statements– 31 August 2012

2 SUMMARY OF SIGNIFICANT ACCOUNTING POLICIES CONTINUED
(e) Associates
Associates are enterprises in which the Group exercises significant influence. Significant influence is the power to participate
in the financial and operating policy decisions of the associates but not control over those policies.
Investments in associates are accounted for in the consolidated financial statements using the equity method of accounting
and are initially recognised at cost. The equity method is applied based on the latest financial statements or management
accounts of the associates, made up to the financial year end of the Group. The Group’s investment in associates includes
goodwill identified on acquisition, net of any accumulated impairment losses (see Note 2(k)).
The Group’s share of its associates’ post-acquisition profits or losses is recognised in the income statement, and its share of
post-acquisition movements in other comprehensive income is recognised in other comprehensive income. The cumulative
post-acquisition movements are adjusted against the carrying amount of the investment. When the Group’s share of losses in
an associate equals or exceeds its interest in the associate, including any other unsecured receivables, the Group’s interest is
reduced to nil and recognition of further losses is discontinued except to the extent that the Group has incurred legal or
constructive obligations or made payments on behalf of the associate.
Unrealised profits on transactions between the Group and associates are eliminated partially to the extent of the Group’s
interest in the associates; unrealised losses are also eliminated unless the transaction provides evidence on impairment of the
asset transferred. Where necessary, in applying the equity method, adjustments are made to the financial statements of
associates to ensure consistency of accounting policies with those of the Group.
Dilution of gains and losses in associates are recognised in the income statement:
For incremental interest in an associate, the date of acquisition is the date at which significant influence is obtained. Goodwill
is calculated at each purchase date based on the fair value of assets and liabilities identified. The previously acquired stake is
stepped up to fair value and the share of profits and equity movements for the previously acquired stake are not recognised
since they are embedded in the step up.
(f) Goodwill
Goodwill represents the excess of the cost of the acquisition over the Group’s share of the fair value of the identifiable net
assets including contingent liabilities of subsidiaries, jointly controlled entities and associates at the date of the acquisition.
Goodwill is tested for impairment at least annually, or if events or circumstances occur indicating that impairment may exist.
Impairment of goodwill is charged to the income statement as and when it arises. Impairment losses on goodwill (inclusive of
impairment losses recognised in a previous interim period) are not reversed. Gains and losses on the disposal of an entity
include the carrying amount of goodwill relating to the entity disposed.
Goodwill on acquisition of jointly controlled entities and associates is included in the investments in jointly controlled entities
and associates respectively. Such goodwill is tested for impairment as part of the overall carrying amount.
243
KEEPING THE LIGHTS ON
Fina
ncia
l Sta
tem
ents
Annual Report 2012
Notes to the Financial Statements– 31 August 2012

2 SUMMARY OF SIGNIFICANT ACCOUNTING POLICIES CONTINUED
(g) Property, plant and equipment and depreciation
Property, plant and equipment are stated at cost or valuation less accumulated depreciation and accumulated impairment
losses. Cost includes expenditure that is directly attributable to the construction or acquisition of the items and bringing them
to the location and condition so as to render them operational in the manner intended by the Group. The Group allocates the
cost of an item of property, plant and equipment to its significant system and component parts.
The Directors have applied the transitional provisions of International Accounting Standard No. 16 (revised) “Property, Plant
and Equipment” as adopted by the Malaysian Accounting Standards Board which allow the freehold land, buildings and civil
works to be stated at their previous years’ valuations less accumulated depreciation.
When an asset’s carrying amount is increased as a result of a revaluation, the increase is recognised in other comprehensive
income as a revaluation surplus reserve.
When the asset’s carrying amount is decreased as a result of a revaluation, the decrease is recognised in the income statement.
However, the decrease is recognised in other comprehensive income to the extent of any credit balance existing in the
revaluation surplus reserve of that asset.
Subsequent costs are included in the asset’s carrying amount or recognised as a separate asset, as appropriate, only when it
is probable that future economic benefits associated with the item will flow to the Group and the cost of the item can be
measured reliably. The carrying amount of the replaced part is derecognised.
The cost of major overhaul/inspection is recognised in the asset’s carrying amount as a replacement and the remaining
carrying amount of the previous major overhaul/inspection is derecognised.
Major spare parts and standby equipment are recognised as assets when the Group expects to use them during more than
one period. Similarly, if the spare parts and servicing equipment can be used only in connection with an item of property,
plant and equipment, they are accounted for as property, plant and equipment.
Gains and losses on disposal of property, plant and equipment are determined by reference to their carrying amount and are
taken into account in determining profit/(loss) before taxation. On disposal of revalued assets, the amount in revaluation
reserve relating to those property, plant and equipment are transferred to retained profits.
Freehold land and capital project-in-progress are not depreciated. Leasehold land classified as finance lease (refer to accounting
policy Note 2(m)(i) on finance leases) is amortised over the remaining period of the respective leases ranging from 5 to 99
years on the straight line basis.
244
TENAGA NASIONAL BERHAD (200866-W)
Fina
ncia
l Sta
tem
ents
Annual Report 2012
Notes to the Financial Statements– 31 August 2012

2 SUMMARY OF SIGNIFICANT ACCOUNTING POLICIES CONTINUED
(g) Property, plant and equipment and depreciation (continued)
Depreciation is provided on all other categories of property, plant and equipment on the straight line basis which reflects the
estimated useful lives of the assets, summarised as follows:
Buildings and civil works 10 to 60 years
Plant and machinery 3 to 40 years
Lines and distribution mains 15 to 40 years
Distribution services 20 years
Meters 10 to 15 years
Public lighting 15 to 20 years
Furniture, fittings and office equipment 3 to 15 years
Motor vehicles 5 to 15 years
Residual values and useful lives of assets are reviewed, and adjusted if appropriate, at the end of the reporting period.
At the end of the reporting period, the Group assesses whether there is any indication of impairment. If such indications exist,
an analysis is performed to assess whether the carrying amount of the asset is fully recoverable. A write down is made if the
carrying amount exceeds the recoverable amount (see Note 2(k)).
(h) Non-current assets held-for-sale
The Group shall classify a non-current asset as held-for-sale if its carrying amount will be recovered principally through a sale
transaction rather than through continuing use.
The assets classified as non-current assets held-for-sale will be measured at the lower of its carrying amount and fair value less
costs to sell.
No depreciation or amortisation is provided against the assets while it is classified as non-current assets held-for-sale.
The assets shall be derecognised on disposal and the difference between the net disposal proceeds and the carrying amount
is recognised as profit or loss in the period of disposal.
An asset that ceases to be classified as non-current assets held-for-sale shall be measured at the lower of its carrying amount
before the asset was classified as non-current assets held-for-sale, adjusted for any depreciation, amortisation or revaluations
that would be recognised had the asset not be classified as non-current assets held-for-sale, and its recoverable amount at the
date of the subsequent decision not to sell.
245
KEEPING THE LIGHTS ON
Fina
ncia
l Sta
tem
ents
Annual Report 2012
Notes to the Financial Statements– 31 August 2012

2 SUMMARY OF SIGNIFICANT ACCOUNTING POLICIES CONTINUED
(i) Research and development
Expenditure on research activities, undertaken with the prospect of gaining new scientific or technical knowledge and
understanding, is recognised in the income statement as an expense as incurred.
Expenditure on development activities, whereby the application research findings are applied to a plan or design for the
production of new or substantially improved products and processes, is capitalised only if development costs can be measured
reliably, the product or process is technically and commercially feasible, future economic benefits are probable and the Group
has sufficient resources to complete the development and to use or sell the asset.
The expenditure capitalised includes the cost of materials, direct labour and overheads costs that are directly attributable to
preparing the assets for its intended use. For qualifying assets, borrowing costs are capitalised in accordance with the
accounting policy on borrowing costs. Other development expenditure is recognised in income statement as incurred.
Capitalised development costs are recognised as intangible assets and amortised from the point at which the asset is ready
for use on a straight-line basis over its useful life.
(j) Capitalisation of borrowing costs
Borrowing costs incurred to finance the construction of any qualifying assets are capitalised as part of the cost of the assets
during the period of time that is required to complete and prepare the asset for its intended use. All other borrowing costs
are expensed off to the income statement.
(k) Impairment of non-financial assets
Property, plant and equipment and other non-current assets, including intangible assets, are reviewed for impairment losses
whenever events or changes in circumstances indicate that the carrying amount may not be recoverable. Impairment loss is
recognised for the amount by which the carrying amount of the asset exceeds its recoverable amount. The recoverable
amount is the higher of fair value less cost to sell and its value-in-use. For the purposes of assessing impairment, assets are
grouped at the lowest level for which there are separately identifiable cash flows.
Impairment loss is charged to the statement of comprehensive income unless it reverses a previous revaluation in which case
it is charged to the revaluation surplus. Any subsequent increase in recoverable amount is recognised in the statement of
comprehensive income unless it reverses an impairment loss on a revalued asset in which case it is taken to revaluation
surplus.
(l) Customers’ contributions
Contributions (assets in the form of PPE or cash to acquire such assets) received from customers consist mainly of upfront
capital contributions for the construction of assets, used to connect the customers to a network or to provide them with the
service, are credited to the deferred income account upon recognition of the assets.
Contributions received prior to 1 January 2011 are amortised over 15 years, being the average useful life of the asset.
Effective 1 January 2011, in compliance with IC Interpretation 18, all contributions received from customers, when that amount
of contributions must be used only to construct or acquire an item of property, plant and equipment, and the item of
property, plant and equipment is used to either connect the customer to a network or to provide the customer with ongoing
access to supply of goods or services, or to do both, the contributions received are recognised as revenue. Revenue arising
from assets received from customers are recognised in the income statement when the performance obligations associated
with receiving those customer contributions are met.
246
TENAGA NASIONAL BERHAD (200866-W)
Fina
ncia
l Sta
tem
ents
Annual Report 2012
Notes to the Financial Statements– 31 August 2012

2 SUMMARY OF SIGNIFICANT ACCOUNTING POLICIES CONTINUED
(m) Leases
A lease is an agreement whereby the lessor conveys to the lessee in return for a payment, or series of payments, the right to
use an asset for an agreed period of time.
(i) Finance leases – where the group is the lessee
The group leases certain property, plant and equipment. Leases of property, plant and equipment where the group has
substantially transferred all the risks and rewards of ownership are classified as finance leases. Finance leases are
capitalised at the lease’s commencement at the lower of the fair value of the leased asset and the present value of the
minimum lease payments.
Each lease payment is allocated between the liability and finance charges so as to achieve a constant rate on the finance
balance outstanding. The corresponding rental obligations, net of finance charges, are included in other short-term and
long term payables. The interest element of the finance cost is charged to profit or loss within finance cost over the lease
period so as to produce a constant periodic rate of interest on the remaining balance of the liability for each period. The
property, plant and equipment acquired under finance leases are depreciated or amortised over the shorter of the useful
life of the asset and the lease term.
(ii) Operating leases – where the group is the lessee
Leases where substantially all of the risks and rewards of ownership are not transferred to the group are classified as
operating leases. Payments made under operating leases (net of any incentives received from the lessor) are charged to
profit or loss within other operating expenses on the straight-line basis over the period of the lease.
(iii) Operating leases – where the group is the lessor
Leases where substantially all of the risks and rewards of ownership are not transferred to the lessee (i.e. the group is the
lessor) are classified as operating leases. Payments received under operating leases that relate to sales of electricity are
recognised in profit or loss within revenue on the straight-line basis over the period of the lease. All other payment
received under operating leases are presented in profit or loss within other income.
(n) Inventories
Inventories are stated at the lower of cost and net realisable value.
Cost of work-in-progress and finished goods comprise raw materials, direct labour and a proportion of the production
overheads. Cost is determined on the weighted average basis and comprises all costs of purchase and other costs incurred in
bringing the inventories to their present location and condition.
Net realisable value is the estimated selling price in the ordinary course of business, less the costs of completion and selling
expenses.
247
KEEPING THE LIGHTS ON
Fina
ncia
l Sta
tem
ents
Annual Report 2012
Notes to the Financial Statements– 31 August 2012

2 SUMMARY OF SIGNIFICANT ACCOUNTING POLICIES CONTINUED
(o) Trade and other receivables
Trade and other receivables are amounts due from customers for goods sold or services performed in the ordinary course of
business. If collection is expected in one year or less (or in the normal operating cycle of the business if longer), they are
classified as current assets. If not, they are presented as non-current assets.
Trade and other receivables are recognised initially at fair value and subsequently measured at amortised cost using the
effective interest method, less accumulated impairment losses.
(p) Trade and other payables
Trade and other payables are obligations to pay for goods or services that have been acquired in the ordinary course of
business from suppliers. Accounts payable are classified as current liabilities if payment is due within one year or less (or in
the normal operating cycle of the business if longer). If not, they are presented as non-current liabilities.
Trade and other payables are recognised initially at fair value and subsequently measured at amortised cost, which is the fair
value of the consideration to be paid in the future for the goods and services received.
(q) Cash and cash equivalents
For the purpose of the consolidated statement of cash flows, cash and cash equivalents comprise cash in hand, deposits held
at call with banks, bank overdrafts and short-term, highly liquid investments that are readily convertible to known amounts of
cash and which are subject to an insignificant risk of changes in value.
(r) Share capital
(i) Classification
Ordinary shares and non-redeemable preference shares with discretionary dividends are classified as equity. Other shares
are classified as equity and/or liability according to the economic substance of the particular instrument.
Distributions to holders of a financial instrument classified as an equity instrument are charged directly to equity.
(ii) Share issue costs
Incremental external costs directly attributable to the issuance of new shares or options are shown in equity as a
deduction, net of tax, from the proceeds.
(iii) Dividends to shareholders of the Company
Dividends on redeemable preference shares are recognised as a liability and expressed on an accrual basis. Other
dividends are recognised as a liability in the period in which they are approved.
248
TENAGA NASIONAL BERHAD (200866-W)
Fina
ncia
l Sta
tem
ents
Annual Report 2012
Notes to the Financial Statements– 31 August 2012

2 SUMMARY OF SIGNIFICANT ACCOUNTING POLICIES CONTINUED
(s) Borrowings
Borrowings are recognised initially at fair value, net of transaction costs incurred. In subsequent periods, borrowings are stated
at amortised cost using the effective interest method, any difference between proceeds (net of transaction costs) and the
redemption value is recognised in the income statement over the period of the borrowings.
Interest, dividends, losses and gains relating to a financial instrument, or a component part, classified as a liability is reported
within finance cost in the income statement.
Borrowings are classified as current liabilities unless the Group and Company have an unconditional right to defer settlement
of the liability for at least twelve (12) months after the statement of financial position date.
Fees paid on the establishment of loan facilities are recognised as transaction costs of the loan to the extent that it is probable
that some or all of the facility will be drawn down. In this case, the fee is deferred until the draw-down occurs.
(t) Income tax and zakat
Income tax
Current tax expense is determined according to the tax laws of the countries in which the Company and its subsidiaries
operate and generate the taxable profits.
Deferred tax is recognised in full, using the liability method, on temporary differences arising between the amounts attributed
to assets and liabilities for tax purposes and their carrying amounts in the financial statements. However, deferred tax is not
accounted for if it arises from initial recognition of an asset or liability in a transaction other than a business combination as
at that time the transaction affects neither accounting nor taxable profit or loss.
Deferred tax assets are recognised to the extent that it is probable that taxable profit will be available against which the
deductible temporary differences, unused tax losses and unutilised tax credits can be utilised.
Deferred tax is recognised on temporary differences arising on investments in subsidiaries and associates except where the
timing of the reversal of the temporary difference can be controlled and it is probable that the temporary difference will not
reverse in the foreseeable future.
Deferred tax assets and deferred tax liabilities are offset when there is a legally and enforceable right to set off current tax
assets against current tax liabilities and when the deferred income tax assets and liabilities relate to taxes levied by the same
taxation authority on either the same taxable entity or different taxable entities where there is an intention to settle the
balances on a net basis.
Tax rates enacted or substantively enacted at the end of the reporting date are used to determine deferred tax.
Zakat
The Group recognises its obligation towards the payment of zakat on business income in the income statement. Zakat
payment is an obligation and is accrued based on 2.5% of profit before tax and determined according to the percentage of
Muslim shareholding in the Company.
249
KEEPING THE LIGHTS ON
Fina
ncia
l Sta
tem
ents
Annual Report 2012
Notes to the Financial Statements– 31 August 2012

2 SUMMARY OF SIGNIFICANT ACCOUNTING POLICIES CONTINUED
(u) Employee benefits
(i) Short-term employee benefits
Wages, salaries, paid annual leave, bonuses, and non-monetary benefits are accrued in the financial year in which the
services are rendered by employees of the Group.
(ii) Post-employment benefits
The Group has various post-employment benefit schemes which are either defined contribution or defined benefit plans.
Defined contribution plans
The Group’s contributions to defined contribution plans are charged to the statements of comprehensive income in the
financial year to which they relate. Once the contributions have been paid, the Group has no further payment obligations.
Defined benefit plans
The Group makes contributions to the Company’s Retirement Benefit Plan, a defined benefit plan and approved fund
independent of the Company’s finances. A book provision is also provided by the Company as the contribution rate
required to fund the benefits under the said plan is in excess of the Inland Revenue maximum limit. The Group and
Company also provide for a post retirement medical plan for certain employees.
The liability in respect of a defined benefit plan is the present value of the defined benefit obligation at the statements
of financial position date minus the fair value of plan assets, together with adjustments for actuarial gains/losses and past
service cost. The Group determines the present value of the defined benefit obligation and the fair value of any plan
assets with sufficient regularity such that the amounts recognised in the financial statements do not differ materially from
the amounts that would be determined at the end of reporting date.
The defined benefit obligation, calculated using the Projected Unit Credit Method, is determined by an independent
actuarial firm, considering the estimated future cash outflows using market yields at statement of financial position date
of Government securities which have currency and terms to maturity approximating the terms of the related liability. The
last revaluation was done in December 2009.
The amount of net actuarial gains and losses are credited or charged to the income statement, as the case may be, over
the expected average remaining service lives of the participating employees.
250
TENAGA NASIONAL BERHAD (200866-W)
Fina
ncia
l Sta
tem
ents
Annual Report 2012
Notes to the Financial Statements– 31 August 2012

2 SUMMARY OF SIGNIFICANT ACCOUNTING POLICIES CONTINUED
(u) Employee benefits (continued)
(iii) Share-based compensation
The Group has applied the provision of FRS 2 to all equity instruments granted after 31 December 2004 but not yet
vested as at 1 September 2006, the effective date the Group adopted this FRS.
The Group operates an equity-settled, share-based compensation plan for the employees of the Group. Employee services
received in exchange for the grant of the share options is recognised as an expense in the income statement over the
vesting periods of the grant with a corresponding increase in equity.
The total amount to be expensed over the vesting period is determined by reference to the fair value of the share
options granted, excluding the impact of any non-market vesting conditions (for example, profitability and sales growth
targets). Non-market vesting conditions are included in assumptions about the number of options that are expected to
be vested. At the end of each reporting date, the Group revises its estimates of the number of share options that are
expected to be vested. It recognises the impact of the revision of original estimates, if any, in the income statement, with
a corresponding adjustment to equity.
The proceeds received net of any directly attributable transaction costs are credited to share capital (nominal value) and
share premium when the options are exercised.
(v) Government development grants
Grants from the government are recognised at their fair value where there is a reasonable assurance that the grant will be
received and the Group will comply with all attached conditions.
Government grants relating to costs are deferred and recognised in the income statement over the period necessary to match
them with the costs they are intended to compensate.
Government grants relating to construction of property, plant and equipment are included in non-current liabilities as deferred
income and are credited to the income statement on the straight line basis over the expected lives of the related assets.
(w) Contingent liabilities
The Group does not recognise a contingent liability but discloses its existence in the financial statements. A contingent liability
is a possible obligation that arises from past events whose existence will be confirmed by uncertain future events beyond the
control of the Group or a present obligation that is not recognised because it is not probable that an outflow of resources will
be required to settle the obligation.
251
KEEPING THE LIGHTS ON
Fina
ncia
l Sta
tem
ents
Annual Report 2012
Notes to the Financial Statements– 31 August 2012

2 SUMMARY OF SIGNIFICANT ACCOUNTING POLICIES CONTINUED
(x) Revenue recognition
Revenue comprises the fair value of the consideration received or receivable for the sale of goods and services in the ordinary
course of the Group’s activities, net of estimated returns, rebates and discounts.
Electricity revenue
Electricity revenue is recognised when electricity is consumed by customers. Electricity revenue includes an estimated value of
the electricity consumed by customers from the date of their last meter reading and period end. Accrued unbilled revenues
are reversed the following month when actual billings occur.
Sale of goods
Sale of goods is recognised when significant risks and rewards of ownership have passed and the collectability of the related
receivable is reasonably assured.
Rendering of services
For services rendered, revenue is recognised in the accounting period in which the services are rendered, by reference to stage
of completion of the specific transaction and assessed on the basis of the actual service provided as a proportion of the total
services to be provided.
Construction contracts
Contract revenue includes the initial amount agreed in the contract plus any variations in contract work to the extent that it
is probable that they will result in revenue and can be measured reliably. As soon as the outcome of a construction contract
can be estimated reliably, contract revenue is recognised in profit or loss in proportion to the stage of completion of the
contract. Contract expenses are recognised as incurred unless they create an asset related to future contract activity.
The stage of completion is assessed by reference to the contract costs incurred to the reporting date as a percentage of total
estimated costs for each contract.
When an outcome of a construction contract cannot be estimated reliably, contract revenue is recognised only to the extent
of contract costs incurred that are likely to be recoverable. An expected loss on a contract is recognised immediately in the
income statement.
Other income
Other operating income earned by the Group and Company comprises interest and leasing income as well as dividend income.
Leasing income is accrued, unless collectability is in doubt. Dividend income is recognised when the shareholders’ rights to
receive payment is established.
Interest income is recognised using the effective interest method. When a loan and receivable is impaired, the Group reduces
the carrying amount to its recoverable amount, being the estimated future cash flow discounted at the original effective
interest rate of the instrument, and continues unwinding the discount as interest income. Interest income on impaired loan
and receivables are recognised using the original effective interest rate.
252
TENAGA NASIONAL BERHAD (200866-W)
Fina
ncia
l Sta
tem
ents
Annual Report 2012
Notes to the Financial Statements– 31 August 2012

2 SUMMARY OF SIGNIFICANT ACCOUNTING POLICIES CONTINUED
(y) Foreign currencies
(i) Functional and presentation currency
Items included in the financial statements of each of the Group’s entities are measured using the currency of the primary
economic environment in which the entity operates (the ‘functional currency’). The financial statements are presented in
Ringgit Malaysia, which is the Company’s functional and presentation currency.
(ii) Transactions and balances
Foreign currency transactions are translated into the functional currency using the exchange rates prevailing at the dates
of the transactions. Monetary assets and liabilities in foreign currencies are translated at exchange rates ruling at the
statement of financial position date. All exchange differences are recognised in the statement of comprehensive income
within the category of foreign exchange gain/loss.
(iii) Group companies
The results and financial position of all the Group entities (none of which has the currency of a hyperinflationary
economy) that have functional currencies different from the presentation currency are translated into the presentation
currency as follows:
• assets and liabilities for each statement of financial position presented are translated at the closing rate at the date
of that statement of financial position;
• income and expenses for each statement of comprehensive income are translated at average exchange rates (unless
this average is not a reasonable approximation of the cumulative effect of the rates prevailing on the transaction
dates, in which case income and expenses are translated at the rate on the dates of the transactions); and
• all resulting exchange differences are recognised as a separate component of equity.
On consolidation, exchange differences arising from the translation of the net investment in foreign operations are taken
to shareholders’ equity. When a foreign operation is partially disposed of or sold, exchange differences that were
recorded in equity are recognised in the income statement as part of the gain or loss on sale.
Goodwill and fair value adjustments arising on the acquisition of a foreign entity are treated as assets and liabilities of
the foreign entity and translated at the closing rate.
The principal closing rates used in translation of foreign currency amounts were as follows:
2012 2011
RM RM
Foreign currency
1 US Dollar 3.1251 2.9770
100 Japanese Yen 3.9740 3.8801
1 Sterling Pound 4.9491 4.8778
100 Pakistani Rupee 3.3000 3.4100
1 EURO 3.9237 4.3283
253
KEEPING THE LIGHTS ON
Fina
ncia
l Sta
tem
ents
Annual Report 2012
Notes to the Financial Statements– 31 August 2012

2 SUMMARY OF SIGNIFICANT ACCOUNTING POLICIES CONTINUED
(z) Financial instruments
Financial assets
(i) Classification
The Group and Company classify its financial assets in the following categories: at fair value through profit or loss
(“FVTPL”), loans and receivables, available-for-sale (“AFS”) and held-to-maturity (“HTM”). The classification depends on the
purpose for which the financial assets were acquired. Management determines the classification at initial recognition.
(a) Financial assets at FVTPL
Financial assets at FVTPL are financial assets held-for-trading. A financial asset is classified in this category if it is
acquired or incurred principally for the purpose of selling or repurchasing it in the near term. Derivatives are also
categorised as held-for-trading unless they are designated as hedges.
(b) Loans and receivables
Loans and receivables are non-derivative financial assets with fixed or determinable payments that are not quoted
in an active market. They are included in current assets, except for maturities greater than twelve (12) months after
the end of the reporting period. These are classified as non-current assets.
(c) AFS financial assets
AFS financial assets are non-derivatives that are either designated in this category or not classified in any of the
other categories. They are included in non-current assets unless the investment matures or management intends to
dispose of it within twelve (12) months from the end of the reporting period.
(d) HTM financial assets
HTM financial assets are non-derivative financial assets with fixed or determinable payments and fixed maturities
that the Group’s and Company’s management have the positive intention and ability to hold to maturity. If the
Group and Company were to sell other than an insignificant amount of HTM financial assets, the whole category
would be tainted and reclassified as AFS. HTM financial assets are included in non-current assets, except for those
with maturities less than twelve (12) months from the end of the reporting period, which are classified as current
assets.
(ii) Recognition and initial measurement
Regular purchases and sales of financial assets are recognised on the trade-date, the date on which the Group and
Company commit to purchase or sell the asset.
Financial assets are initially recognised at fair value plus transaction costs for all financial assets not carried at FVTPL.
Financial assets carried at FVTPL are initially recognised at fair value and transaction costs are expensed in the income
statement.
254
TENAGA NASIONAL BERHAD (200866-W)
Fina
ncia
l Sta
tem
ents
Annual Report 2012
Notes to the Financial Statements– 31 August 2012

2 SUMMARY OF SIGNIFICANT ACCOUNTING POLICIES CONTINUED
(z) Financial instruments (continued)
Financial assets (continued)
(iii) Subsequent measurement – gains and losses
AFS financial assets and financial assets at FVTPL are subsequently carried at fair value. Loans and receivables and HTM
financial assets are subsequently carried at amortised cost using the effective interest method.
Changes in the fair values of financial assets at FVTPL, including the effects of currency translation are recognised in the
income statement in the period in which the changes arise.
(iv) Subsequent measurement – Impairment of financial assets
(a) Assets carried at amortised cost
The Group and Company assess at the end of the reporting period whether there is objective evidence that a
financial asset or group of financial assets is impaired. A financial asset or a group of financial assets is impaired and
impairment losses are incurred only if there is objective evidence of impairment as a result of one or more events
that occurred after the initial recognition of the asset (a ‘loss event’) and that loss event (or events) has an impact
on the estimated future cash flows of the financial asset or group of financial assets that can be reliably estimated.
The criteria that the Group and Company use to determine that there is objective evidence of an impairment loss
include:
• Significant financial difficulty of the issuer or obligor;
• A breach of contract, such as a default or delinquency in interest or principal payments; or
• The Group, for economic or legal reasons relating to the borrower’s financial difficulty, granting to the
borrower a concession that the lender would not otherwise consider;
• It becomes probable that the borrower will enter bankruptcy or other financial reorganisation; or
• Disappearance of an active market for that financial asset because of financial difficulties; or
• Observable data indicating that there is a measurable decrease in the estimated future cash flows from a
portfolio of financial assets since the initial recognition of those assets, although the decrease cannot yet be
identified with the individual financial assets in the portfolio, including:
(i) adverse changes in the payment status of borrowers in the portfolio; and
(ii) national or local economic conditions that correlate with defaults on the assets in the portfolio.
255
KEEPING THE LIGHTS ON
Fina
ncia
l Sta
tem
ents
Annual Report 2012
Notes to the Financial Statements– 31 August 2012

2 SUMMARY OF SIGNIFICANT ACCOUNTING POLICIES CONTINUED
(z) Financial instruments (continued)
Financial assets (continued)
(iv) Subsequent measurement – Impairment of financial assets (continued)
(a) Assets carried at amortised cost (continued)
The amount of the loss is measured as the difference between the asset’s carrying amount and the present value
of estimated future cash flows (excluding future credit losses that have not been incurred) discounted at the
financial asset’s original effective interest rate. The asset’s carrying amount is reduced and the amount of the loss is
recognised in the income statements. If ‘loans and receivables’ or a ‘HTM investment’ has a variable interest rate,
the discount rate for measuring any impairment loss is the current effective interest rate determined under the
contract. As a practical expedient, the Group and Company may measure impairment on the basis of an instrument’s
fair value using an observable market price.
If, in a subsequent period, the amount of the impairment loss decreases and the decrease can be related objectively
to an event occurring after the impairment was recognised (such as an improvement in the debtor’s credit rating),
the reversal of the previously recognised impairment loss is recognised in the income statement.
When an asset is uncollectible, it is written off against the related accumulated impairment losses account. Such
assets are written off after all the necessary procedures have been completed and the amount of the loss has been
determined.
(b) Assets classified as AFS
The Group and Company assess at the end of the reporting period whether there is objective evidence that a
financial asset or a group of financial assets is impaired.
For debt securities, the Group and Company use criteria and measurement of impairment loss applicable for ‘assets
carried at amortised cost’ above. If, in a subsequent period, the fair value of a debt instrument classified as AFS
increases and the increase can be objectively related to an event occurring after the impairment loss was recognised
in the income statement, the impairment loss is reversed through the income statement.
In the case of equity securities classified as AFS, in addition to the criteria for ‘assets carried at amortised cost’ above,
a significant or prolonged decline in the fair value of the security below its cost is also considered as an indicator
that the assets are impaired. If any such evidence exists for AFS financial assets, the cumulative loss that had been
recognised directly in equity is removed from equity and recognised in the income statements. The amount of
cumulative loss that is reclassified to the income statement is the difference between the acquisition cost and the
current fair value, less any impairment loss on that financial asset previously recognised in the income statement.
Impairment losses recognised in the income statement on equity instruments classified as AFS are not reversed
through the income statement.
(v) De-recognition
Financial assets are de-recognised when the rights to receive cash flows from the investments have expired or have been
transferred and the Group and Company have transferred substantially all risks and rewards of ownership to related party.
256
TENAGA NASIONAL BERHAD (200866-W)
Fina
ncia
l Sta
tem
ents
Annual Report 2012
Notes to the Financial Statements– 31 August 2012

2 SUMMARY OF SIGNIFICANT ACCOUNTING POLICIES CONTINUED
(z) Financial instruments (continued)
Financial liabilities
The Group and Company classify its financial liabilities in the following categories: at fair value through profit or loss or other
financial liabilities. Management determines the classification of its financial liabilities at initial recognition.
Other financial liabilities are non-derivatives financial liabilities. Other financial liabilities are initially recognised at fair value
plus transaction cost and subsequently carried at amortised cost using the effective interest method. Changes in the carrying
value of these liabilities are recognised in the income statement.
The Group and Company’s other financial liabilities comprise trade and other payables and borrowings in the statement of
financial position. Financial liabilities are classified as current liabilities; except for maturities more than 12 months after the
reporting date, in which case they are classified as non-current liabilities.
Financial liabilities are derecognised when the liability is either discharged, cancelled, has expired or has been restructured
with substantially different terms.
(aa) Offsetting financial instruments
Financial assets and liabilities are offset and the net amount presented in the statement of financial position when there is a
legally enforceable right to offset the recognised amounts and there is an intention to settle on a net basis, or realise the asset
and settle the liability simultaneously.
(bb) Derivative financial instruments
Derivatives are initially recognised at fair value on the date a derivative contract is entered into and are subsequently re-
measured at their fair value.
Fair value changes on derivatives that are not designated or do not qualify for hedge accounting are recognised in the income
statement when the changes arise.
(cc) Financial guarantee contracts
Financial guarantee contracts are contracts that require the Group or Company to make specified payments to reimburse the
holder for a loss it incurs because a specified debtor fails to make payments when due, in accordance with the terms of a debt
instrument.
Financial guarantee contracts are recognised as a financial liability at the time the guarantee is issued. The liability is initially
measured at fair value and subsequently at the higher of the amount determined in accordance with FRS 137 “Provisions,
Contingent Liabilities and Contingent Assets” and the amount initially recognised less cumulative amortisation, where
appropriate.
The fair value of financial guarantees is determined as the present value of the difference in net cash flows between the
contractual payments under the debt instrument and the payments that would be required without the guarantee, or the
estimated amount that would be payable to a third party for assuming the obligations.
257
KEEPING THE LIGHTS ON
Fina
ncia
l Sta
tem
ents
Annual Report 2012
Notes to the Financial Statements– 31 August 2012

3 CRITICAL ACCOUNTING ESTIMATES AND JUDGEMENTS
Estimates and judgements are continually evaluated by the Directors and are based on historical experience and other factors,
including expectations of future events that are believed to be reasonable under the circumstances.
(a) Critical judgement in applying the Group’s accounting policies
There are no significant areas of critical judgement in applying accounting policies that have significant effetcs on the amounts
recognised in the financial statements.
(b) Critical accounting estimates and assumptions
The Group and Company make estimates and assumptions concerning the future. The resulting accounting estimates will, by
definition, rarely equate to the related actual results. To enhance the information content of the estimates, certain key
variables that are anticipated to have a material impact on the Group’s and Company’s results and financial position are tested
for sensitivity to changes in the underlying parameters. The estimates and assumptions that have a significant risk of causing
a material adjustment to the carrying amounts of assets and liabilities within the next financial year are outlined below.
(i) Impairment of property, plant and equipment
The Group and Company assess impairment of assets whenever the events or changes in circumstances indicate that the
carrying amount of an asset may not be recoverable, i.e., the carrying amount of the asset is more than the recoverable
amount.
Recoverable amount is measured at the higher of the fair value less cost to sell for that asset and its value-in-use. The
value-in-use is the net present value of the projected future cash flow derived from that asset discounted at an
appropriate discount rate. Projected future cash flows are based on Group’s and Company’s estimates calculated based
on historical, sector and industry trends, general market and economic conditions, changes in technology and other
available information. The assumptions used, results and conclusion of the impairment assessment are stated in the Note
13 to these financial statements.
(ii) Estimated useful lives of property, plant and equipment
The Group and Company regularly reviews the estimated useful lives of property, plant and equipment based on factors
such as business plan and strategies, expected level of usage and future technological developments. Future results of
operations could be materially affected by changes in these estimates brought about by changes in the factors mentioned
above. A reduction in the estimated useful lives of property, plant and equipment would increase the recorded
depreciation and decrease the value of property, plant and equipment.
(iii) Contingent liabilities
Determination of the treatment of contingent liabilities is based on management’s view of the expected outcome of the
contingencies after consulting legal counsel for litigation cases and internal and external experts to the Group for matters
in the ordinary course of business.
258
TENAGA NASIONAL BERHAD (200866-W)
Fina
ncia
l Sta
tem
ents
Annual Report 2012
Notes to the Financial Statements– 31 August 2012

3 CRITICAL ACCOUNTING ESTIMATES AND JUDGEMENTS CONTINUED
(b) Critical accounting estimates and assumptions (continued)
(iv) Impairment of trade receivables
Management reviews its loans and receivables for objective evidence of impairment at least quarterly. Significant financial
difficulties of the debtor, the probability that the debtor will enter bankruptcy, and default or significant delay in
payments are considered objective evidence that a receivable is impaired. In determining this, management makes
judgement as to whether there is observable data indicating that there has been a significant change in the payment
ability of the debtor, or whether there have been significant changes with adverse effect in the technological, market,
economic or legal environment in which the debtor operates in.
Where there is objective evidence of impairment, management makes judgements as to whether an impairment loss
should be recorded as an expense. The methodology and assumptions used for estimating both the amount and timing
of future cash flows are reviewed regularly to reduce any differences between the estimated loss and actual loss
experience.
(v) Estimation of income taxes
Income taxes are estimated based on the rules governed under the Income Tax Act 1967.
Differences in determining the capital allowances and deductibility of certain expenses may arise during the estimation
of the provision for income taxes between tax calculated at the statements of financial position date, and the final
submission to the tax authorities as a result of obtaining further detailed information that may become available
subsequent to the statements of financial position date.
Where the final tax outcome of these matters is different from the amounts that were initially recognised, such differences
will impact the income tax provisions and deferred tax balance in the period in which such determination is made.
(vi) Revenue recognition
Electricity revenue for energy supply activities includes an assessment of energy supplied to customers between the date
of the last meter reading and the financial year end of the Group and Company (unread and unbilled). An assessment is
also made of any factors that are likely to materially affect the ultimate economic benefits which will flow to the Group
and Company, including bill cancellation and adjustments. To the extent that the economic benefits are not expected to
flow to the Group and Company, the value of that revenue is not recognised.
259
KEEPING THE LIGHTS ON
Fina
ncia
l Sta
tem
ents
Annual Report 2012
Notes to the Financial Statements– 31 August 2012

3 CRITICAL ACCOUNTING ESTIMATES AND JUDGEMENTS CONTINUED
(b) Critical accounting estimates and assumptions (continued)
(vii) Fair value of derivatives and other financial instruments
Certain financial instruments such as investments and derivative financial instruments are carried on the statements of
financial position at fair value, with changes in fair value reflected in the income statements.
Fair values are estimated by reference in part to published price quotations and in part by using valuation techniques.
The fair value of financial instruments that are not traded in an active market (for example, over-the-counter derivatives)
is determined by using valuation techniques.
The Group and Company uses its judgement to select a variety of methods and make assumptions that are mainly based
on market conditions existing at the end of each financial reporting period.
(viii) Lease accounting
As a result of adopting IC 4 “Determining Whether an Arrangement Contains a Lease”, certain of the Group’s and
Company’s power purchase agreements have been accounted for as finance lease rather than the normal sale and
purchase arrangements. This has resulted in finance lease accounting being applied to these power purchase agreements.
To apply finance lease accounting, a number of assumptions in the lease models have been made, such as the
determination of minimum lease payments, implicit interest rates and residual values of the power plants at the end of
contract periods. Any future changes to these assumptions will affect the value of the lease assets and liabilities
recognised and the corresponding lease income and expenses.
4 REVENUE
Group Company
2012 2011 2012 2011
(Restated)
RM’million RM’million RM’million RM’million
Sales:
– Electricity 34,475.2 31,199.6 32,529.6 29,561.9
– Goods and services 405.7 327.3 0 0
– Contract revenue 39.3 52.1 0 0
– Recognition of customers’ contributions 571.4 268.7 489.6 263.9
Release of deferred income 356.8 393.5 321.8 331.3
35,848.4 32,241.2 33,341.0 30,157.1
260
TENAGA NASIONAL BERHAD (200866-W)
Fina
ncia
l Sta
tem
ents
Annual Report 2012
Notes to the Financial Statements– 31 August 2012

5 OPERATING EXPENSES
Group Company
2012 2011 2012 2011
(Restated) (Restated)
RM’million RM’million RM’million RM’million
Cost of sales:
– Energy cost 23,175.5 22,494.3 21,317.9 21,821.1
– Transmission cost 1,365.0 1,276.5 1,360.6 1,276.5
– Distribution cost 4,346.3 3,998.3 4,338.0 3,998.3
28,886.8 27,769.1 27,016.5 27,095.9
Administrative expenses 1,471.5 1,945.8 1,112.1 1,181.5
Other operating expenses 1,233.8 1,241.5 1,528.2 501.9
31,592.1 30,956.4 29,656.8 28,779.3
Operating expenses include the following items:
Group Company
2012 2011 2012 2011
(Restated) (Restated)
RM’million RM’million RM’million RM’million
Purchases from Independent Power
Producers (IPPs) 13,976.7 13,565.8 18,135.1 17,286.7
Directors’ remuneration:
– Fees and allowances 1.9 2.3 1.5 1.9
– Other emoluments 7.8 3.2 7.8 3.2
Auditors’ remuneration:
– Statutory audit fees
– PricewaterhouseCoopers, Malaysia
Current year 1.4 1.6 0.7 0.7
Under provision in prior year 0.4 0 0.3 0
– Member firm of PricewaterhouseCoopers
International Limited*# 0 0 0 0
– Assurance related fees 0.3 0.3 0.3 0.3
– Non-audit fees
– PricewaterhouseCoopers, Malaysia## 0.6 0.2 0.6 0
Staff cost (Note 6) 3,300.9 3,220.8 2,926.9 2,831.8
Property, plant and equipment:
– Depreciation 4,268.1 4,061.9 4,033.6 3,952.8
– Written off 44.4 35.5 31.3 34.8
Allowance for impairment:
– Receivables 122.9 100.5 111.6 66.3
– Amounts due from subsidiaries 0 0 292.8 187.7
261
KEEPING THE LIGHTS ON
Fina
ncia
l Sta
tem
ents
Annual Report 2012
Notes to the Financial Statements– 31 August 2012

5 OPERATING EXPENSES CONTINUED
Operating expenses include the following items:
Group Company
2012 2011 2012 2011
(Restated) (Restated)
RM’million RM’million RM’million RM’million
Reversal for impairment:
– Receivables (141.1) (24.5) (125.2) (19.1)
– Amounts due from a jointly controlled entity (0.5) (3.2) (0.5) (3.2)
Write-back of diminution in value of
marketable securities (0.5) 0 (0.5) 0
Allowance for inventory obsolescence 132.9 109.2 132.9 109.2
Write-back of inventory obsolescence (111.8) (117.8) (111.8) (117.7)
Allowance for diminution in value of investments
in subsidiaries 0 0 774.1 0
Inventories written off 18.6 22.9 18.4 21.4
Rental of land and buildings 162.7 52.9 141.5 31.7
Rental of plant and machinery 25.3 11.5 25.3 11.5
Research and development expenses 46.9 54.1 46.2 53.3
Receipt of Government subsidies** (543.4) (547.5) 0 0
Alternate fuel cost differential compensation*** (1,475.9) 0 (1,475.9) 0
* This represents the audit fees for Liberty Power Ltd amounting to RM35,120 (2011: RM34,479) and TNB Remaco Pakistan Pvt Ltd
amounting to RM9,422 (2011: RM44,255).
** This represents the subsidies that Sabah Electricity Sdn. Bhd. (‘SESB’) received for diesel and medium fuel oil from the Government of
Malaysia. The total amount credited in the current year was RM543.4 million (2011: RM547.5 million) and it has been offset against
energy cost.
*** This represents alternate fuel cost differential compensation from Petronas and the Government of Malaysia in respect of the fuel-cost
past through sharing mechanism for the current financial year.
# PricewaterhouseCoopers Malaysia and other member firms of PricewaterhouseCoopers International Limited are separate and
independent legal entities.
## This year amount primarily relates to due diligence and related services.
The estimated monetary value of benefits-in-kind received by the Directors was RM726,789 (2011: RM344,826) for the Group and
Company.
There was no amount paid and payable to any firm, of which a Director is a partner, for professional services rendered to the Group
and Company (2011: Nil).
262
TENAGA NASIONAL BERHAD (200866-W)
Fina
ncia
l Sta
tem
ents
Annual Report 2012
Notes to the Financial Statements– 31 August 2012

6 STAFF COST
Group Company
2012 2011 2012 2011
RM’million RM’million RM’million RM’million
Wages, salaries and bonuses 1,969.0 1,912.9 1,699.6 1,656.7
Defined contribution retirement plan 227.1 216.2 188.7 161.4
Retirement benefit plan (Note 35) 299.7 308.7 292.7 297.2
Retirement medical plan (Note 35) 577.8 550.9 547.6 521.2
Employees’ Share Option Scheme II 24.8 34.1 21.2 29.8
Other employee benefits 202.5 198.0 177.1 165.5
3,300.9 3,220.8 2,926.9 2,831.8
Details of the retirement benefit and retirement medical plans of the Group and Company are set out in Note 35 to these financial
statements.
7 OTHER OPERATING INCOME
Group Company
2012 2011 2012 2011
RM’million RM’million RM’million RM’million
Dividend income from subsidiaries 0 0 83.7 46.1
Dividend income from equity securities:
– Quoted shares 0 3.3 2.7 13.9
– Unquoted shares 0 2.1 21.8 28.2
Leasing income 42.2 9.2 44.5 11.5
Rental income 11.1 12.9 34.2 32.9
Release of Government development grants (Note 37) 77.0 64.6 0 0
Government grants relating to income 3.3 0 0 0
Alternate fuel cost differential compensation* 1,678.6 0 1,678.6 0
Gain on disposals:
– Property, plant and equipment 5.9 1.4 5.8 1.4
– Non-current assets held for sale 1.8 43.3 1.8 43.3
– Short term investment 0.1 5.0 0.1 5.0
Interest on late payments 66.2 132.4 64.5 132.4
Minimum charges 32.2 32.7 32.2 32.7
Gain on redemption of redeemable preference shares in a subsidiary 0 0 56.8 259.7
Other income 222.2 225.1 153.7 145.8
2,140.6 532.0 2,180.4 752.9
* This represents reimbursement from Petronas and the Government of Malaysia in respect of the alternate fuel cost differential
compensation for additional fuel costs caused by gas curtailment incurred in prior periods (from January 2010 to August 2011) but
was received during the year.
Other income comprises primarily of income from rechargeable jobs and recovery from insurance claims.
263
KEEPING THE LIGHTS ON
Fina
ncia
l Sta
tem
ents
Annual Report 2012
Notes to the Financial Statements– 31 August 2012

8 FOREIGN EXCHANGE
Group Company
2012 2011 2012 2011
RM’million RM’million RM’million RM’million
Foreign exchange (loss)/gain comprises:
Translation loss – foreign currency denominated term loans (275.4) (105.6) (256.8) (100.5)
Translation gain/(loss) – others 44.6 (121.4) 43.7 (143.6)
Transaction (loss)/gain – foreign term loans (2.6) 34.8 (2.6) 35.4
Transaction loss – others (18.8) (1.9) (10.1) 0
(252.2) (194.1) (225.8) (208.7)
9 FINANCE INCOME/COST
Group Company
2012 2011 2012 2011
(Restated) (Restated)
RM’million RM’million RM’million RM’million
Finance income:
Interest from subsidiaries 0 0 176.1 186.7
Interest from deposits, staff loans and associates 269.0 283.5 140.4 249.3
Changes in fair value and amortisation 16.5 0 (11.7) (31.4)
Waiver of loan interest 0 35.6 0 0
Less: Reduction of borrowing costs capitalised into
property, plant and equipment (96.8) 0 0 0
188.7 319.1 304.8 404.6
Finance cost:
Interest on borrowings 1,045.2 1,071.7 630.9 789.1
Less: Amount capitalised into property,
plant and equipment (380.9) (206.4) (216.8) (206.4)
664.3 865.3 414.1 582.7
Finance charges under finance leases 117.4 50.7 1,043.4 1,117.3
Interest on consumer deposits 74.9 40.6 74.6 37.8
Changes in fair value of derivatives and amortisation (33.6) (78.1) (18.2) (26.3)
823.0 878.5 1,513.9 1,711.5
264
TENAGA NASIONAL BERHAD (200866-W)
Fina
ncia
l Sta
tem
ents
Annual Report 2012
Notes to the Financial Statements– 31 August 2012

10 TAXATION AND ZAKAT
Group Company
2012 2011 2012 2011
(Restated) (Restated)
Note RM’million RM’million RM’million RM’million
Current tax:
– Malaysian corporate income tax 845.1 113.5 830.4 93.9
– Foreign corporate income tax 0.9 0 0 0
Deferred tax 19 462.6 62.0 458.8 (73.8)
Tax expense 1,308.6 175.5 1,289.2 20.1
Zakat 22.4 16.7 22.4 16.7
1,331.0 192.2 1,311.6 36.8
The analysis of the tax expense is as follows:
Current tax:
– Current year 839.7 99.9 826.8 83.2
– Under accrual in prior years 6.3 13.6 3.6 10.7
846.0 113.5 830.4 93.9
Deferred tax:
– Origination and reversal of temporary differences 462.6 62.0 458.8 (73.8)
1,308.6 175.5 1,289.2 20.1
265
KEEPING THE LIGHTS ON
Fina
ncia
l Sta
tem
ents
Annual Report 2012
Notes to the Financial Statements– 31 August 2012

10 TAXATION AND ZAKAT CONTINUED
The explanation of the relationship between tax expense and profit before taxation is as follows:
Group Company
2012 2011 2012 2011
(Restated) (Restated)
RM’million RM’million RM’million RM’million
Profit before taxation and zakat 5,537.2 1,156.7 4,429.7 615.1
Tax calculated at the Malaysian corporate income tax
rate of 25.0% (2011: 25.0%) 1,384.3 289.2 1,107.4 153.8
Tax effects of:
– Share of results of associates (10.1) (23.3) 0 0
– Income not subject to tax (202.5) (128.9) (223.6) (186.6)
– Expenses not deductible for tax purposes 84.7 91.7 375.1 145.6
– Expenses qualifying for double deduction (14.2) (7.3) (12.8) (6.0)
– Benefits from previously unrecognised tax losses (3.0) (0.2) 0 0
– Current year unrecognised temporary differences
and unused tax losses 16.4 29.9 0 0
– Foreign jurisdiction (0.4) 0 0 0
Under accrual of current tax in prior years 6.3 13.6 3.6 10.7
Recognition and reversal of prior year temporary differences 47.1 (89.2) 39.5 (97.4)
Zakat 22.4 16.7 22.4 16.7
Tax and zakat charge 1,331.0 192.2 1,311.6 36.8
Average effective tax rate (%) 24.0 16.6 29.6 6.0
11 EARNINGS PER SHARE EPS
(a) Basic earnings per share
Basic earnings per share is calculated by dividing the profit attributable to owners of the Company for the financial year by
the weighted average number of ordinary shares in issue during the financial year.
Group
2012 2011
(Restated)
Profit attributable to owners of the Company (RM’million) 4,197.6 965.4
Weighted average number of ordinary shares in issue (’000) 5,464,516 5,450,741
Basic earnings per share (sen) 76.82 17.71
266
TENAGA NASIONAL BERHAD (200866-W)
Fina
ncia
l Sta
tem
ents
Annual Report 2012
Notes to the Financial Statements– 31 August 2012

11 EARNINGS PER SHARE EPS CONTINUED
(b) Diluted earnings per share
For the purpose of calculating diluted earnings per share, the profit attributable to owners of the Company for the financial
year and the weighted average number of ordinary shares in issue during the financial year has been adjusted for the dilutive
effects of all potential ordinary shares such as share options granted to employees.
Group
2012 2011
(Restated)
Profit used to determine diluted earnings per share (RM’million) 4,197.6 965.4
Weighted average number of ordinary shares in issue (’000) 5,464,516 5,450,741
Adjustment for share options (’000) 13,484 11,706
Weighted average number of ordinary shares for diluted earnings per share (’000) 5,478,000 5,462,447
Diluted earnings per share (sen) 76.63 17.67
As per Note 2(a)(i), the changes in accounting policy due to the adoption of IC Interpretation 4 resulted in an increase to the
basic earnings per share and diluted earnings per share for the period ended 31 August 2011 by 8.55 sen and 8.53 sen
respectively. The effect of the adoption to the financial statements is disclosed in Note 48.
12 DIVIDENDS
Company
2012 2011
RM’million RM’million
Interim dividend of 0.38 sen gross per ordinary share,
less income tax of 25.0% and a single-tier dividend of 4.71 sen
per ordinary share (2011: 4.5 sen gross per ordinary share, less 273.0 184.0
income tax at 25.0%)
Proposed final single-tier dividend of 15.0 sen per ordinary share
(2011: Nil) 826.5 0
1,099.5 184.0
Interim dividends are paid and accounted for in shareholders’ equity as an appropriation of retained profits in the financial year.
At the forthcoming Annual General Meeting, a final single-tier dividend in respect of the financial year ended 31 August 2012 of
15.0 sen per ordinary share will be proposed for shareholders’ approval. The books closure and payment dates will be announced
in due course.
267
KEEPING THE LIGHTS ON
Fina
ncia
l Sta
tem
ents
Annual Report 2012
Notes to the Financial Statements– 31 August 2012

13 PROPERTY, PLANT AND EQUIPMENT
Transfers/
Adjustments/
Exchange Reclassi-
As at rate fication/ As at
1.9.2011 adjustment Additions Disposals Write off 31.8.2012
(Restated)
Group RM’million RM’million RM’million RM’million RM’million RM’million
2012
Cost/Valuation
At 1984 and earlier valuations:
Long leasehold land 8.4 0 0 0 0 8.4
At 1994 valuation:
Freehold land 543.9 0 0 0 (15.1) 528.8
Long leasehold land 601.5 0 0 (0.1) 0.9 602.3
Short leasehold land 2.4 0 0 0 0 2.4
Buildings and civil works 442.8 0 0 (0.2) (1.3) 441.3
1,599.0 0 0 (0.3) (15.5) 1,583.2
At cost:
Freehold land 260.6 (0.2) 8.1 0 (26.9) 241.6
Long leasehold land 353.5 0.1 9.5 0 34.2 397.3
Short leasehold land 181.9 0 10.8 0 0.9 193.6
Buildings and civil works 12,558.9 (0.1) 446.4 (0.1) 8.8 13,013.9
14,953.9 (0.2) 474.8 (0.4) 1.5 15,429.6
Plant and machinery:
– Owned 45,618.8 (20.8) 1,715.6 (142.3) 4,122.1 51,293.4
– Leased 1,312.8 0 0 0 0 1,312.8
Lines and distribution mains 30,328.4 0 1,857.5 (0.1) 90.4 32,276.2
Distribution services 3,100.6 0 198.5 0 17.3 3,316.4
Meters 1,783.7 0 271.3 0 (0.1) 2,054.9
Public lighting 350.6 0 26.9 0 (5.1) 372.4
Furniture, fittings and office equipment 1,312.3 (0.1) 92.4 (17.2) (1.0) 1,386.4
Motor vehicles 437.9 0 65.4 (13.3) (7.4) 482.6
99,199.0 (21.1) 4,702.4 (173.3) 4,217.7 107,924.7
Capital project-in-progress 5,646.3 0 7,067.8 0 (5,121.8) 7,592.3
104,845.3 (21.1) 11,770.2 (173.3) (904.1) 115,517.0
268
TENAGA NASIONAL BERHAD (200866-W)
Fina
ncia
l Sta
tem
ents
Annual Report 2012
Notes to the Financial Statements– 31 August 2012

13 PROPERTY, PLANT AND EQUIPMENT CONTINUED
Released on
Charged disposals/
As at for the Transfers/ As at
1.9.2011 financial year Write off 31.8.2012
(Restated)
Group RM’million RM’million RM’million RM’million
2012
Accumulated depreciation
At 1984 and earlier valuations:
Long leasehold land 2.5 0 0 2.5
At 1994 valuation:
Freehold land 0 0 0 0
Long leasehold land 161.5 11.2 0 172.7
Short leasehold land 1.7 0.1 0 1.8
Buildings and civil works 248.5 13.3 (0.6) 261.2
414.2 24.6 (0.6) 438.2
At cost:
Freehold land 0 0 0 0
Long leasehold land 51.7 4.9 1.6 58.2
Short leasehold land 69.8 7.3 0 77.1
Buildings and civil works 3,886.3 342.4 (1.8) 4,226.9
4,422.0 379.2 (0.8) 4,800.4
Plant and machinery:
– Owned 20,512.2 2,175.7 3,536.9 26,224.8
– Leased 20.9 62.5 0 83.4
Lines and distribution mains 13,313.8 1,271.5 (4.7) 14,580.6
Distribution services 1,660.0 140.1 0 1,800.1
Meters 971.2 110.6 0 1,081.8
Public lighting 208.1 11.8 0 219.9
Furniture, fittings and office equipment 1,153.4 68.6 (17.3) 1,204.7
Motor vehicles 282.1 48.1 (19.0) 311.2
42,543.7 4,268.1 3,495.1 50,306.9
Accumulated impairment losses
Plant and machinery 440.2 0 0 440.2
269
KEEPING THE LIGHTS ON
Fina
ncia
l Sta
tem
ents
Annual Report 2012
Notes to the Financial Statements– 31 August 2012

13 PROPERTY, PLANT AND EQUIPMENT CONTINUED
Transfers/
Adjustments/
Exchange Reclassi-
As at rate fication/ As at
1.9.2010 adjustment Additions Disposals Write off 31.8.2011
(Restated) (Restated)
Group RM’million RM’million RM’million RM’million RM’million RM’million
2011
Cost/Valuation
At 1984 and earlier valuations:
Long leasehold land 8.4 0 0 0 0 8.4
At 1994 valuation:
Freehold land 562.4 0 0 (0.5) (18.0) 543.9
Long leasehold land 602.8 0 0 (0.5) (0.8) 601.5
Short leasehold land 2.4 0 0 0 0 2.4
Buildings and civil works 446.5 0 0 (3.7) 0 442.8
1,622.5 0 0 (4.7) (18.8) 1,599.0
At cost:
Freehold land 361.4 (0.1) 6.1 0 (106.8) 260.6
Long leasehold land 330.7 0 3.2 (0.1) 19.7 353.5
Short leasehold land 181.9 0 0 0 0 181.9
Buildings and civil works 12,352.3 (0.2) 203.8 (10.6) 13.6 12,558.9
14,848.8 (0.3) 213.1 (15.4) (92.3) 14,953.9
Plant and machinery:
– Owned 43,490.4 (47.8) 2,032.9 (234.6) 377.9 45,618.8
– Leased 0 0 1,312.8 0 0 1,312.8
Lines and distribution mains 28,521.6 0 1,678.5 (0.1) 128.4 30,328.4
Distribution services 2,899.7 0 213.3 0 (12.4) 3,100.6
Meters 1,649.9 0 131.9 0 1.9 1,783.7
Public lighting 327.4 0 23.2 0 0 350.6
Furniture, fittings and office equipment 1,252.6 (0.3) 66.6 (1.8) (4.8) 1,312.3
Motor vehicles 310.4 (0.1) 126.7 (5.9) 6.8 437.9
93,300.8 (48.5) 5,799.0 (257.8) 405.5 99,199.0
Capital project-in-progress 4,499.1 (0.2) 6,007.6 0 (4,860.2) 5,646.3
97,799.9 (48.7) 11,806.6 (257.8) (4,454.7) 104,845.3
270
TENAGA NASIONAL BERHAD (200866-W)
Fina
ncia
l Sta
tem
ents
Annual Report 2012
Notes to the Financial Statements– 31 August 2012

13 PROPERTY, PLANT AND EQUIPMENT CONTINUED
Released on
Charged disposals/
As at for the Transfers/ As at
1.9.2010 financial year Write off 31.8.2011
(Restated) (Restated)
Group RM’million RM’million RM’million RM’million
2011
Accumulated depreciation
At 1984 and earlier valuations:
Long leasehold land 2.4 0.1 0 2.5
At 1994 valuation:
Long leasehold land 151.0 11.2 (0.7) 161.5
Short leasehold land 1.6 0.1 0 1.7
Buildings and civil works 238.3 13.5 (3.3) 248.5
393.3 24.9 (4.0) 414.2
At cost:
Long leasehold land 45.1 6.6 0 51.7
Short leasehold land 62.6 7.2 0 69.8
Buildings and civil works 3,550.8 334.9 0.6 3,886.3
4,051.8 373.6 (3.4) 4,422.0
Plant and machinery:
– Owned 18,378.7 2,105.0 28.5 20,512.2
– Leased 0 20.9 0 20.9
Lines and distribution mains 12,106.7 1,202.5 4.6 13,313.8
Distribution services 1,529.2 130.8 0 1,660.0
Meters 876.2 95.0 0 971.2
Public lighting 192.1 16.0 0 208.1
Furniture, fittings and office equipment 1,083.1 76.3 (6.0) 1,153.4
Motor vehicles 246.6 41.8 (6.3) 282.1
38,464.4 4,061.9 17.4 42,543.7
Accumulated impairment losses
Plant and machinery 440.2 0 0 440.2
271
KEEPING THE LIGHTS ON
Fina
ncia
l Sta
tem
ents
Annual Report 2012
Notes to the Financial Statements– 31 August 2012

13 PROPERTY, PLANT AND EQUIPMENT CONTINUED
Transfers/
Adjustments/
Reclassi-
As at fication/ As at
1.9.2011 Additions Disposals Write off 31.8.2012
(Restated)
Company RM’million RM’million RM’million RM’million RM’million
2012
Cost/Valuation
At 1994 valuation:
Freehold land 543.9 0 0 (15.1) 528.8
Long leasehold land 601.5 0 (0.1) 0.9 602.3
Short leasehold land 2.4 0 0 0 2.4
Buildings and civil works 437.1 0 (0.1) (1.2) 435.8
1,584.9 0 (0.2) (15.4) 1,569.3
At cost:
Freehold land 197.2 8.1 0 (27.0) 178.3
Long leasehold land 338.2 9.5 0 31.2 378.9
Short leasehold land 1.3 0 0 0.9 2.2
Buildings and civil works 10,917.3 422.8 (0.1) (9.6) 11,330.4
13,038.9 440.4 (0.3) (19.9) 13,459.1
Plant and machinery:
– Owned 34,603.9 1,629.5 (99.0) (18.6) 36,115.8
– Leased 13,653.1 0 0 0 13,653.1
Lines and distribution mains 29,059.6 1,798.0 0 10.1 30,867.7
Distribution services 2,947.8 191.5 0 5.9 3,145.2
Meters 1,733.5 262.9 0 (0.2) 1,996.2
Public lighting 350.6 26.9 0 (5.1) 372.4
Furniture, fittings and office equipment 1,122.9 80.3 (2.5) (0.6) 1,200.1
Motor vehicles 366.6 57.9 (11.7) (0.8) 412.0
96,876.9 4,487.4 (113.5) (29.2) 101,221.6
Capital project-in-progress 4,311.0 4,871.7 0 (4,487.4) 4,695.3
101,187.9 9,359.1 (113.5) (4,516.6) 105,916.9
272
TENAGA NASIONAL BERHAD (200866-W)
Fina
ncia
l Sta
tem
ents
Annual Report 2012
Notes to the Financial Statements– 31 August 2012

13 PROPERTY, PLANT AND EQUIPMENT CONTINUED
Released on
Charged disposals/
As at for the Transfers/ As at
1.9.2011 financial year Write off 31.8.2012
(Restated)
RM’million RM’million RM’million RM’million
Company
2012
Accumulated depreciation
At 1994 valuation:
Long leasehold land 161.5 11.2 0 172.7
Short leasehold land 1.7 0.1 0 1.8
Buildings and civil works 244.3 13.2 (0.5) 257.0
407.5 24.5 (0.5) 431.5
At cost:
Freehold land 0 0 0 0
Long leasehold land 49.3 4.7 0 54.0
Short leasehold land 0.3 0.2 0 0.5
Buildings and civil works 3,375.0 277.6 (0.3) 3,652.3
3,832.1 307.0 (0.8) 4,138.3
Plant and machinery:
– Owned 16,394.5 1,603.7 (78.0) 17,920.2
– Leased 3,671.3 557.8 0 4,229.1
Lines and distribution mains 12,858.4 1,217.2 (0.1) 14,075.5
Distribution services 1,563.5 132.8 0 1,696.3
Meters 944.7 106.5 0 1,051.2
Public lighting 208.1 11.8 0 219.9
Furniture, fittings and office equipment 1,000.6 54.8 (2.6) 1,052.8
Motor vehicles 231.7 42.0 (11.9) 261.8
40,704.9 4,033.6 (93.4) 44,645.1
273
KEEPING THE LIGHTS ON
Fina
ncia
l Sta
tem
ents
Annual Report 2012
Notes to the Financial Statements– 31 August 2012

13 PROPERTY, PLANT AND EQUIPMENT CONTINUED
Transfers/
Adjustments/
Reclassi-
As at fication/ As at
1.9.2010 Additions Disposals Write off 31.8.2011
(Restated) (Restated)
Company RM’million RM’million RM’million RM’million RM’million
2011
Cost/Valuation
At 1994 valuation:
Freehold land 562.4 0 (0.5) (18.0) 543.9
Long leasehold land 602.7 0 (0.5) (0.7) 601.5
Short leasehold land 2.4 0 0 0 2.4
Buildings and civil works 440.8 0 (3.7) 0 437.1
1,608.3 0 (4.7) (18.7) 1,584.9
At cost:
Freehold land 297.9 6.1 0 (106.8) 197.2
Long leasehold land 310.9 3.2 (0.1) 24.2 338.2
Short leasehold land 1.3 0 0 0 1.3
Buildings and civil works 10,737.4 189.4 (8.4) (1.1) 10,917.3
12,955.8 198.7 (13.2) (102.4) 13,038.9
Plant and machinery:
– Owned 32,680.4 1,875.3 (201.0) 249.2 34,603.9
– Leased 13,653.1 0 0 0 13,653.1
Lines and distribution mains 27,295.4 1,655.2 (0.1) 109.1 29,059.6
Distribution services 2,763.7 208.6 0 (24.5) 2,947.8
Meters 1,607.4 124.5 0 1.6 1,733.5
Public lighting 327.5 23.2 0 (0.1) 350.6
Furniture, fittings and office equipment 1,092.3 51.5 (1.0) (19.9) 1,122.9
Motor vehicles 246.2 119.0 (5.7) 7.1 366.6
92,621.8 4,256.0 (221.0) 220.1 96,876.9
Capital project-in-progress 4,102.7 4,464.3 0 (4,256.0) 4,311.0
96,724.5 8,720.3 (221.0) (4,035.9) 101,187.9
274
TENAGA NASIONAL BERHAD (200866-W)
Fina
ncia
l Sta
tem
ents
Annual Report 2012
Notes to the Financial Statements– 31 August 2012

13 PROPERTY, PLANT AND EQUIPMENT CONTINUED
Released on
Charged disposals/
As at for the Transfers/ As at
1.9.2010 financial year Write off 31.8.2011
(Restated) (Restated) (Restated)
Company RM’million RM’million RM’million RM’million
2011
Accumulated depreciation
At 1994 valuation:
Long leasehold land 150.9 11.3 (0.7) 161.5
Short leasehold land 1.7 0 0 1.7
Buildings and civil works 234.1 13.4 (3.2) 244.3
386.7 24.7 (3.9) 407.5
At cost:
Freehold land 0 0 0 0
Long leasehold land 42.5 6.7 0.1 49.3
Short leasehold land 0.3 0 0 0.3
Buildings and civil works 3,104.5 271.4 (0.9) 3,375.0
3,534.0 302.8 (4.7) 3,832.1
Plant and machinery:
– Owned 14,696.2 1,611.6 86.7 16,394.5
– Leased 3,113.5 557.8 0 3,671.3
Lines and distribution mains 11,706.0 1,152.4 0 12,858.4
Distribution services 1,438.7 124.8 0 1,563.5
Meters 853.1 91.6 0 944.7
Public lighting 191.7 16.4 0 208.1
Furniture, fittings and office equipment 961.4 59.1 (19.9) 1,000.6
Motor vehicles 201.1 36.3 (5.7) 231.7
36,695.7 3,952.8 56.4 40,704.9
275
KEEPING THE LIGHTS ON
Fina
ncia
l Sta
tem
ents
Annual Report 2012
Notes to the Financial Statements– 31 August 2012

13 PROPERTY, PLANT AND EQUIPMENT CONTINUED
Group Company
2012 2011 1.9.2010 2012 2011 1.9.2010
(Restated) (Restated) (Restated) (Restated)
RM’million RM’million RM’million RM’million RM’million RM’million
Net book value
At 1984 and earlier valuations:
Long leasehold land 5.9 5.9 6.0 0 0 0
At 1994 valuation:
Freehold land 528.8 543.9 562.4 528.8 543.9 562.4
Long leasehold land 429.6 440.0 451.8 429.6 440.0 451.8
Short leasehold land 0.6 0.7 0.8 0.6 0.7 0.7
Buildings and civil works 180.1 194.3 208.2 178.8 192.8 206.7
1,145.0 1,184.8 1,229.2 1,137.8 1,177.4 1,221.6
At cost:
Freehold land 241.6 260.6 361.4 178.3 197.2 297.9
Long leasehold land 339.1 301.8 285.6 324.9 288.9 268.4
Short leasehold land 116.5 112.1 119.3 1.7 1.0 1.0
Buildings and civil works 8,787.0 8,672.6 8,801.5 7,678.1 7,542.3 7,632.9
Total land and buildings 10,629.2 10,531.9 10,797.0 9,320.8 9,206.8 9,421.8
Plant and machinery:
– Owned 24,628.4 24,666.4 24,671.5 18,195.6 18,209.4 17,984.2
– Leased 1,229.4 1,291.9 0 9,424.0 9,981.8 10,539.6
Lines and distribution mains 17,695.6 17,014.6 16,414.9 16,792.2 16,201.2 15,589.4
Distribution services 1,516.3 1,440.6 1,370.5 1,448.9 1,384.3 1,325.0
Meters 973.1 812.5 773.7 945.0 788.8 754.3
Public lighting 152.5 142.5 135.3 152.5 142.5 135.8
Furniture, fittings and office equipment 181.7 158.9 169.5 147.3 122.3 130.9
Motor vehicles 171.4 155.8 63.8 150.2 134.9 45.1
57,177.6 56,215.1 54,396.2 56,576.5 56,172.0 55,926.1
Capital project-in-progress 7,592.3 5,646.3 4,499.1 4,695.3 4,311.0 4,102.7
64,769.9 61,861.4 58,895.3 61,271.8 60,483.0 60,028.8
276
TENAGA NASIONAL BERHAD (200866-W)
Fina
ncia
l Sta
tem
ents
Annual Report 2012
Notes to the Financial Statements– 31 August 2012

13 PROPERTY, PLANT AND EQUIPMENT CONTINUED
Had the revalued property, plant and equipment been included in the financial statements at cost less accumulated depreciation
and accumulated impairment losses, the net book value of the revalued property, plant and equipment would have been as follows:
Group Company
2012 2011 1.9.2010 2012 2011 1.9.2010
RM’million RM’million RM’million RM’million RM’million RM’million
Freehold land 48.0 48.0 48.2 48.0 48.0 48.2
Leasehold land 49.9 51.6 53.5 49.2 50.9 52.8
Buildings and civil works 75.7 82.4 89.3 75.2 81.8 88.6
173.6 182.0 191.0 172.4 180.7 189.6
The valuations of freehold land, buildings and civil works of the Group and Company was based on an independent valuation by
a professional firm of valuers on the open market value basis in 1994. The net surplus on revaluation was incorporated into the
financial statements as at 31 August 1996 and transferred to revaluation reserve.
The valuations of buildings of a subsidiary were carried out in 1982 and 1984 respectively based on independent valuations by
professional firms of valuers on the open market value basis. The net surplus on revaluation was transferred to revaluation reserve.
The title deeds of certain land are in the process of being registered in the name of the Company and certain subsidiaries.
Net book value of property, plant and equipment pledged as security for borrowings are disclosed in Note 32.
Interest capitalised during the financial year in capital project-in-progress amounted to RM284.1 million (2011: RM206.4 million) for
the Group and RM216.8 million (2011: RM206.4 million) for the Company.
The capitalisation rate used to determine the amount of borrowing cost eligible for capitalisation is 6.23% (2011: 6.17%) for the
Company.
Impairment test for property, plant and equipment
TNB Liberty Power Limited has recognised in prior years, a provision for impairment totalling RM440.2 million. Current year
assessment showed that no further impairment loss is required for the carrying amount of property, plant and equipment assessed.
The carrying value of the property, plant and equipment at statements of financial position date is RM236.0 million (2011: RM281.6
million). The recoverable amount of the property, plant and equipment is determined based on value in use.
277
KEEPING THE LIGHTS ON
Fina
ncia
l Sta
tem
ents
Annual Report 2012
Notes to the Financial Statements– 31 August 2012

14 SUBSIDIARIES
Company
Note 2012 2011 1.9.2010
(Restated) (Restated)
RM’million RM’million RM’million
At cost:
Unquoted ordinary shares 296.6 296.6 296.6
Redeemable preference shares 3,577.3 3,922.6 4,075.7
Options granted to employees of subsidiaries 19.2 15.4 0
Advance to subsidiaries treated as quasi-investment (a) 774.1 610.6 0
4,667.2 4,845.2 4,372.3
Less: Accumulated impairment losses (b) (1,703.0) (928.9) (928.9)
2,964.2 3,916.3 3,443.4
(a) The advances are unsecured and are non-interest bearing with no fixed terms of repayment. The Company does not anticipate
any repayment of the advances and will only recall the loans when the subsidiaries have surplus cash. These advances are
treated as an extension of its investments in subsidiaries.
(b) During the financial year, the Company recognised an impairment loss of RM774.1 million in respect of investment in
subsidiaries as the recoverable amount is lower than the carrying amount. The resulting impairment loss was recognised
within operating expenses line item of the Income Statement. The recoverable amounts are determined based on value in use.
Country of
Name of subsidiary Group’s interest Principal activities incorporation
2012 2011
TNB Janamanjung Sdn. Bhd. 100% 100% Generate and deliver Malaysia
electricity and
generating
capacity to TNB
TNB Power Daharki Ltd.# 100% 100% Investment holding Mauritius
TNB Fuel Services Sdn. Bhd. 100% 100% Supplying fuel and coal for Malaysia
power generation
TNB Energy Services 100% 100% Generating, distributing, Malaysia
Sdn. Bhd. supplying, dealing, selling
of different kinds of energy
sources and related technical
services
278
TENAGA NASIONAL BERHAD (200866-W)
Fina
ncia
l Sta
tem
ents
Annual Report 2012
Notes to the Financial Statements– 31 August 2012

14 SUBSIDIARIES CONTINUED
Country of
Name of subsidiary Group’s interest Principal activities incorporation
2012 2011
TNB Research Sdn. Bhd. 100% 100% Research and Malaysia
development, consultancy
and other services
TNB Ventures Sdn. Bhd. 100% 100% Investment holding Malaysia
TNB Engineering Corporation 100% 100% Principally engaged as Malaysia
Sdn. Bhd. turnkey contractors, energy
project development
specialising in district cooling
system and co-generation
including operation and
maintenance works
TNB Repair And 100% 100% Repair and maintenance Malaysia
Maintenance Sdn. Bhd. services to heavy industries
and other related services
TNB Engineers Sdn. Bhd. 100% 100% Dormant Malaysia
TNB Capital Ltd. 100% 100% Investment holding Malaysia
Universiti Tenaga Nasional 100% 100% Providing higher Malaysia
Sdn. Bhd. education and training
Malaysia Transformer 100% 100% Principally engaged in the Malaysia
Manufacturing Sdn. Bhd. manufacturing, selling and
repairing distribution, power
and earthing transformers
TNB Coal International Ltd.* 100% 100% Dormant Mauritius
Power and Energy 100% 100% Investment holding Mauritius
International (Mauritius) Ltd.*
Orion Mission Sdn. Bhd. 100% 100% Investment holding Malaysia
Sabah Electricity Sdn. Bhd. 83% 80% Business of generation, Malaysia
transmission, distribution
and sale of electricity and
services in Sabah
279
KEEPING THE LIGHTS ON
Fina
ncia
l Sta
tem
ents
Annual Report 2012
Notes to the Financial Statements– 31 August 2012

14 SUBSIDIARIES CONTINUED
Country of
Name of subsidiary Group’s interest Principal activities incorporation
2012 2011
Tenaga Switchgear Sdn. Bhd. 60% 60% Principally engaged in the Malaysia
business of assembling and
manufacturing of high voltage
switchgears and contracting
of turnkey transmission
substations
Kapar Energy Ventures 60% 60% Generate and deliver Malaysia
Sdn. Bhd. electricity energy and
generating capacity to TNB
TNB Integrated Learning 100% 100% Providing training and Malaysia
Solution Sdn. Bhd. consultancy services
TNB Generation Sdn. Bhd. 100% 100% Dormant Malaysia
TNB Transmission Network 100% 100% Dormant Malaysia
Sdn. Bhd.
TNB Distribution Sdn. Bhd. 100% 100% Dormant Malaysia
TNB Risk Management 100% 100% Dormant Malaysia
Sdn. Bhd.
TNB Logistics Sdn. Bhd.** 100% 100% Dormant Malaysia
TNB – IT Sdn. Bhd. 100% 100% Dormant Malaysia
TNB Workshop Services 100% 100% Dormant Malaysia
Sdn. Bhd.**
TNB Metering Services 100% 100% Dormant Malaysia
Sdn. Bhd.**
TNB Hidro Sdn. Bhd. 100% 100% Dormant Malaysia
TNB Prai Sdn. Bhd. 100% 100% Dormant Malaysia
TNB Properties Sdn. Bhd. 100% 100% Dormant Malaysia
TNB International Sdn. Bhd. 100% 100% Dormant Malaysia
280
TENAGA NASIONAL BERHAD (200866-W)
Fina
ncia
l Sta
tem
ents
Annual Report 2012
Notes to the Financial Statements– 31 August 2012

14 SUBSIDIARIES CONTINUED
Country of
Name of subsidiary Group’s interest Principal activities incorporation
2012 2011
Sepang Power Sdn. Bhd. 70% 70% Dormant Malaysia
TNB Quantum Solutions 100% 0% Carry out the business of Malaysia
Sdn. Bhd. consultancy, advisory,
capability development and
corporate coordination programs
Subsidiaries of TNB Engineering
Corporation Sdn. Bhd.
Bangsar Energy Systems 100% 100% Operating an integrated Malaysia
Sdn. Bhd. district cooling system for
air conditioning systems
of office building
TNEC Construction Sdn. Bhd. 100% 100% Dormant Malaysia
TNEC Operations and 100% 100% Operations and Malaysia
Maintenance Sdn. Bhd. maintenance of cooling
and power plants
Airport Cooling Energy Supply 77% 100% A special purpose vehicle Malaysia
Sdn. Bhd. (SPV) company to undertake
the build, operate and transfer
(BOT) project with MAHB
for the supply of chilled water
to the KLIA 2 building
(LCCT) and other facility
Subsidiary of Power and Energy
International (Mauritius) Ltd.
Independent Power 100% 100% Investment holding Mauritius
International Ltd.*
Subsidiary of Bangsar
Energy Systems Sdn. Bhd.
Selesa Energy Systems 70% 70% Dormant Malaysia
Sdn. Bhd.
281
KEEPING THE LIGHTS ON
Fina
ncia
l Sta
tem
ents
Annual Report 2012
Notes to the Financial Statements– 31 August 2012

14 SUBSIDIARIES CONTINUED
Country of
Name of subsidiary Group’s interest Principal activities incorporation
2012 2011
Subsidiary of TNEC Operations
and Maintenance Sdn. Bhd.
Tomest Energy Management 51% 51% Dormant Malaysia
Sdn. Bhd.
Subsidiary of TNB Power
Daharki Ltd.
TNB Liberty Power Ltd.# 100% 100% Operation of power Pakistan
plant and generation
of electricity
Subsidiary of TNB
Properties Sdn. Bhd.
TNP Construction Sdn. Bhd. 100% 100% Dormant Malaysia
Subsidiary of Universiti
Tenaga Nasional Sdn. Bhd.
UNITEN R & D Sdn. Bhd. 100% 100% Providing research and Malaysia
development in areas
related to engineering,
information technology,
business, accountancy,
liberal studies and other
services
Subsidiaries of TNB Repair
And Maintenance Sdn. Bhd.
Trichy Power Ltd.** 100% 100% Dormant India
Trichy Energy Ltd.** 100% 100% Dormant India
TNB Operations and 100% 100% Investment holding Mauritius
Maintenance International Ltd.
TNB Remaco Pakistan 100% 100% Providing repair and Pakistan
Private Limited# maintenance services to
heavy industries and other
related services
282
TENAGA NASIONAL BERHAD (200866-W)
Fina
ncia
l Sta
tem
ents
Annual Report 2012
Notes to the Financial Statements– 31 August 2012

14 SUBSIDIARIES CONTINUED
Country of
Name of subsidiary Group’s interest Principal activities incorporation
2012 2011
Subsidiary of TNB Operations and
Maintenance International Ltd.
Oasis Parade Sdn. Bhd. 100% 100% Investment holding Malaysia
Subsidiary of TNB
Ventures Sdn. Bhd.
Tenaga Cable Industries 76% 76% Manufacturing and Malaysia
Sdn. Bhd. distribution of power and
general cables, aluminium
rods and related activities
Subsidiary of TNB Coal
International Ltd.
Dynamic Acres Sdn. Bhd.* 100% 100% Dormant Malaysia
Subsidiary of Orion Mission
Sdn. Bhd.
Lahad Datu Holdings 100% 100% Dormant Malaysia
Sdn. Bhd.
Eastern Sabah Power 100% 0% To carry on the business Malaysia
Consortium Sdn. Bhd. of any matter relating to
electricity especially the
business of generation and
supply of electricity for any
purpose in Malaysia and
other parts of the world
Subsidiary of Lahad Datu
Holdings Sdn. Bhd.
Lahad Datu Energy 100% 100% Dormant Malaysia
Sdn. Bhd.
283
KEEPING THE LIGHTS ON
Fina
ncia
l Sta
tem
ents
Annual Report 2012
Notes to the Financial Statements– 31 August 2012

14 SUBSIDIARIES CONTINUED
Country of
Name of subsidiary Group’s interest Principal activities incorporation
2012 2011
Subsidiary of TNB Research
Sdn. Bhd.
TNBR QATS Sdn. Bhd. 100% 0% Provide quality assurance, Malaysia
chemical and scientific
testing services
# Audited by a member firm of PricewaterhouseCoopers International Limited which is a separate and independent legal entity
from PricewaterhouseCoopers Malaysia.
* Not audited by PricewaterhouseCoopers.
** The company is in the process of striking off.
15 JOINTLY CONTROLLED ENTITIES
Group
2012 2011
RM’million RM’million
Share of net assets of jointly controlled entities 0.4 0.6
The Group’s share of revenue, profit, assets and liabilities of jointly controlled entities are as follows:
Revenue 0 0.8
(Loss)/Profit after tax (0.2) 0.6
Non-current assets 0 0
Current assets 2.1 2.7
Current liabilities (12.4) (12.8)
Less: Accumulated impairment loss (7.9) (7.9)
Accumulated losses not recognised 18.6 18.6
0.4 0.6
284
TENAGA NASIONAL BERHAD (200866-W)
Fina
ncia
l Sta
tem
ents
Annual Report 2012
Notes to the Financial Statements– 31 August 2012

15 JOINTLY CONTROLLED ENTITIES CONTINUED
Company
2012 2011
RM’million RM’million
Unquoted ordinary shares, at cost 7.9 7.9
Less: Accumulated impairment losses (7.9) (7.9)
0 0
Details of the jointly controlled entities are as follows:
Country of
Name of jointly controlled entity Group’s interest Principal activities incorporation
2012 2011
Seatrac Sdn. Bhd. 50% 50% Dormant Malaysia
TNB Energy Services 51% 51% As the turnkey contractor Malaysia
Sdn. Bhd. & Eramaz to undertake the design,
Technology Sdn. Bhd. JV building and commissioning
of the system for the supply
of electricity in Kalabakan,
Sabah awarded by
Kementerian Kemajuan
Luar Bandar dan
Wilayah (“KKLW”)
285
KEEPING THE LIGHTS ON
Fina
ncia
l Sta
tem
ents
Annual Report 2012
Notes to the Financial Statements– 31 August 2012

16 ASSOCIATES
Group
2012 2011
RM’million RM’million
Share of net assets of associates 491.2 407.8
Company
2012 2011
RM’million RM’million
Unquoted shares, at cost 67.0 67.0
Quoted shares, at cost 106.5 106.5
Less: Accumulated impairment losses (9.6) (9.6)
163.9 163.9
Redeemable preference shares, at cost 33.2 33.2
Unsecured loan notes, at amortised cost 15.9 21.1
213.0 218.2
Quoted shares, at fair value 99.1 77.2
The Group’s share of revenue, profit, assets and liabilities of associates are as follows:
Group
2012 2011
RM’million RM’million
Revenue 780.1 1,120.4
Profit after taxation 27.0 92.8
Non-current assets 1,669.7 1,595.4
Current assets 556.8 548.9
Current liabilities (365.3) (356.8)
Non-current liabilities (1,467.5) (1,423.2)
Accumulated losses not recognised 97.5 43.5
Net assets 491.2 407.8
286
TENAGA NASIONAL BERHAD (200866-W)
Fina
ncia
l Sta
tem
ents
Annual Report 2012
Notes to the Financial Statements– 31 August 2012

16 ASSOCIATES CONTINUED
Details of the associates are as follows:
Country of
Name of associate Group’s interest Principal activities incorporation
2012 2011
Teknologi Tenaga Perlis 20% 20% Design, construction, Malaysia
Consortium Sdn. Bhd. divesting, operation and
maintenance of electricity
generating facility
Perusahaan Otomobil Elektrik 20% 20% Dormant Malaysia
(Malaysia) Sdn. Bhd.
GB3 Sdn. Bhd. 20% 20% Design, construction, Malaysia
operation and maintenance
of electricity generating facility
Fibrecomm Network (M) 49% 49% Provision of fibre optic Malaysia
Sdn. Bhd. transmission network services
Jimah Energy Ventures 20% 20% Generate electric power and Malaysia
Holdings Sdn. Bhd. investment holdings
FTJ Bio Power Sdn. Bhd. 40% 24.5% Generation and distribution Malaysia
of electricity using palm empty
fruit bunch as its main fuel
source
Intergrax Berhad 22.1% 22.1% Investment holding and Malaysia
coal handling services
Associates of TNB
Properties Sdn. Bhd.
INDERA-TNB 40% 40% Dormant Malaysia
Properties Sdn. Bhd.
KM Metro-TNB 40% 40% Dormant Malaysia
Properties Sdn. Bhd.
Associate of TNB Ventures
Sdn. Bhd.
Northern Utility Resources 20% 20% Dormant Malaysia
Sdn. Bhd. (Receivers and
Managers Appointed)
287
KEEPING THE LIGHTS ON
Fina
ncia
l Sta
tem
ents
Annual Report 2012
Notes to the Financial Statements– 31 August 2012

16 ASSOCIATES CONTINUED
Country of
Name of associate Group’s interest Principal activities incorporation
2012 2011
Associate of Independent
Power International Ltd.
Malaysian Shoaiba 20% 20% Investment holding Malaysia
Consortium Sdn. Bhd.
Associate of Oasis Parade
Sdn. Bhd.
Saudi-Malaysia Operation 30% 30% Investment holding Saudi Arabia
and Maintenance Services
Company Limited
Associate of TNB Energy
Services Sdn. Bhd.
Jana Landfill Sdn. Bhd. 20% 20% Generation and distribution Malaysia
of heat and electricity
using methane gas from
landfill sites
Associate of TNB Engineering
Corporation Sdn. Bhd.
Abraj Cooling LLC 49% 49% Contracting works for the United Arab
construction of District Emirates
Cooling Plants
17 INVESTMENT IN UNQUOTED DEBT SECURITIES
Group Company
2012 2011 2012 2011
RM’million RM’million RM’million RM’million
Unsecured loan notes 163.7 164.0 163.7 164.0
288
TENAGA NASIONAL BERHAD (200866-W)
Fina
ncia
l Sta
tem
ents
Annual Report 2012
Notes to the Financial Statements– 31 August 2012

18 AVAILABLEFORSALE FINANCIAL ASSETS
Group Company
2012 2011 2012 2011
RM’million RM’million RM’million RM’million
Available-for-sale financial assets 38.0 38.0 38.0 38.0
Available-for-sale financial assets comprise unquoted shares and are denominated in Ringgit Malaysia.
19 DEFERRED TAXATION
Deferred tax assets and liabilities are offset when there is a legally enforceable right to set off current tax assets against current tax
liabilities and when the deferred taxes relate to the same tax authority. The following amounts, determined after appropriate
offsetting, are shown in the statements of financial position:
2012 2011 1.9.2010
(Restated) (Restated)
RM’million RM’million RM’million
Group
Deferred tax assets 0 30.2 55.9
Deferred tax liabilities (8,284.6) (7,852.2) (7,815.9)
Net total (8,284.6) (7,822.0) (7,760.0)
Company
Deferred tax liabilities (6,589.3) (6,130.5) (6,204.3)
289
KEEPING THE LIGHTS ON
Fina
ncia
l Sta
tem
ents
Annual Report 2012
Notes to the Financial Statements– 31 August 2012

19 DEFERRED TAXATION CONTINUED
The movements during the financial year relating to deferred tax are as follows:
2012 2011 1.9.2010
(Restated) (Restated)
Group RM’million RM’million RM’million
As at the beginning of the financial year (charged)/credited (7,822.0) (7,760.0) (7,075.7)
to income statement:
– Property, plant and equipment (431.9) (310.6) (294.1)
– Unutilised tax losses (6.3) (1.6) 18.4
– Provision and allowances 139.5 469.8 134.8
– Accrued revenue (13.2) (67.6) 1.7
– Temporary difference from lease accounting (150.7) (152.0) (545.1)
(462.6) (62.0) (684.3)
As at the end of the financial year (8,284.6) (7,822.0) (7,760.0)
Subject to income tax
Deferred tax assets (before offsetting):
– Provision and allowances 1,670.6 1,531.1 1,061.3
– Unutilised tax losses 24.8 31.1 32.7
– Property, plant and equipment 15.1 122.1 238.6
Offsetting (1,710.5) (1,654.1) (1,276.7)
Deferred tax assets (after offsetting) 0 30.2 55.9
Deferred tax liabilities (before offsetting):
– Property, plant and equipment (8,632.8) (8,307.9) (8,113.9)
– Accrued revenue (514.5) (501.3) (433.6)
– Temporary difference from lease accounting (847.8) (697.1) (545.1)
Offsetting 1,710.5 1,654.1 1,276.7
Deferred tax liabilities (after offsetting) (8,284.6) (7,852.2) (7,815.9)
290
TENAGA NASIONAL BERHAD (200866-W)
Fina
ncia
l Sta
tem
ents
Annual Report 2012
Notes to the Financial Statements– 31 August 2012

19 DEFERRED TAXATION CONTINUED
The amount of deductible temporary differences, unused tax losses and reinvestment allowance (which have no expiry date) for
which no deferred tax assets is recognised in the statements of financial position are as follows:
2012 2011 1.9.2010
(Restated) (Restated)
RM’million RM’million RM’million
Deductible temporary differences 1,855.1 1,557.6 1,432.7
Tax losses 1,376.1 1,312.0 1,682.5
Reinvestment allowance 0 35.5 28.2
The movements during the financial year relating to deferred tax are as follows:
2012 2011 1.9.2010
(Restated) (Restated)
Company RM’million RM’million RM’million
As at the beginning of the financial year (charged)/credited (6,130.5) (6,204.3) (6,180.4)
to income statement:
– Property, plant and equipment (444.6) 60.7 (257.2)
– Provision and allowances 106.4 134.1 133.3
– Accrued revenue (13.2) (67.7) 1.7
– Temporary difference from lease accounting (107.4) (53.3) 98.3
(458.8) 73.8 (23.9)
As at the end of the financial year (6,589.3) (6,130.5) (6,204.3)
Subject to income tax
Deferred tax assets (before offsetting):
– Provision and allowances 1,297.9 1,191.5 1,057.4
Offsetting (1,297.9) (1,191.5) (1,057.4)
Deferred tax assets (after offsetting) 0 0 0
Deferred tax liabilities (before offsetting):
– Property, plant and equipment (7,310.3) (6,865.7) (6,926.4)
– Accrued revenue (514.5) (501.3) (433.6)
– Temporary difference from lease accounting (62.4) 45.0 98.3
Offsetting 1,297.9 1,191.5 1,057.4
Deferred tax liabilities (after offsetting): (6,589.3) (6,130.5) (6,204.3)
291
KEEPING THE LIGHTS ON
Fina
ncia
l Sta
tem
ents
Annual Report 2012
Notes to the Financial Statements– 31 August 2012

20 DERIVATIVE FINANCIAL INSTRUMENTS
Notional
amount Assets Liabilities
Group Note RM’million RM’million RM’million
2012
Non-current
Non-hedge accounting qualified derivative financial instruments:
– Currency options contracts (a) 1,033.2 116.3 0
– Interest rate swap contracts (b) 462.3 0 21.5
Total 1,495.5 116.3 21.5
2011
Current
Non-hedge accounting qualified derivative financial instruments:
– Forward foreign currency contracts 87.8 1.5 0
Non-current
Non-hedge accounting qualified derivative financial instruments:
– Currency options contracts (a) 1,008.8 89.9 0
– Interest rate swap contracts (b) 616.6 0 44.1
Total 1,713.2 91.4 44.1
292
TENAGA NASIONAL BERHAD (200866-W)
Fina
ncia
l Sta
tem
ents
Annual Report 2012
Notes to the Financial Statements– 31 August 2012

20 DERIVATIVE FINANCIAL INSTRUMENTS CONTINUED
Notional
amount Assets Liabilities
Company Note RM’million RM’million RM’million
2012
Non-current
Non-hedge accounting qualified derivative financial instruments:
– Interest rate swap contracts (b) 462.3 0 21.5
Total 462.3 0 21.5
2011
Current
Non-hedge accounting qualified derivative financial instruments:
– Forward foreign currency contracts 87.8 1.5 0
Non-current
Non-hedge accounting qualified derivative financial instruments:
– Interest rate swap contracts (b) 616.6 0 44.1
Total 704.4 1.5 44.1
Details of derivative financial instruments are as follows:
(a) Forward Start JPY call spread
In April 2004, TNB Capital (L) Limited (TNBCL) entered into Currency Option Agreements with a notional amount of
JPY26.0 billion as a hedge on its 30-year JPY26.0 billion term loan. This transaction enables TNBCL to reduce its exposure to
losses that may arise from adverse fluctuation on USD/JPY exchange rates in relation to the above term loan.
(b) Interest Rate Swap (‘IRS’)
The Company entered into IRS agreements on 10 October 2008 with effective period from 15 October 2008 to 28 February
2015 that entitle it to receive interest at floating rates, and oblige it to pay interest at fixed rate of 3.8% on aggregate notional
principal of USD384.6 million.
The effect of this transaction is to effectively fix the interest rate payable on the 9-year USD503.0 million term loan (ECA Loan).
293
KEEPING THE LIGHTS ON
Fina
ncia
l Sta
tem
ents
Annual Report 2012
Notes to the Financial Statements– 31 August 2012

21 LONG TERM RECEIVABLES
2012 2011 1.9.2010
(Restated) (Restated)
Note RM’million RM’million RM’million
Group
Other debtors (a) 317.7 388.6 448.7
Advance to contractors (b) 101.5 0 0
419.2 388.6 448.7
Company
Other debtors (a) 317.7 388.6 448.7
Amounts due from subsidiaries (c) 331.4 164.2 167.5
Redeemable unsecured loan stocks (‘RULS’) (d) 535.5 535.5 535.5
1,184.6 1,088.3 1,151.7
(a) Other debtors comprise advances given to Yayasan Tenaga Nasional and staff loans which are not expected to be received
within 12 months from the statement of financial position date.
(b) Advance to contractors primarily relates to construction of plant which will be utilised against milestone payment invoices,
which is more than 12 months.
(c) The amounts due from subsidiaries comprise advances and other receivables mainly from TNB Power Daharki Ltd. (‘TPD’) and
Kapar Energy Ventures Sdn. Bhd. (‘KEV’). The amount due from TPD is subject to interest at rates ranging from 2.3% to 3.8%
(2011: 1.9% to 3.4%) per annum and is unsecured. Amount due from Sabah Electricity Sdn. Bhd. (‘SESB’) and TNB Coal
International Ltd. are subject to an interest rate of 6.0% (2011: 6.0%) and 7.0% (2011: 7.0%) per annum respectively, are
unsecured and have no fixed term of repayment.
(d) Redeemable unsecured loan stocks bear interest at 15.0% (2011: 15.0%) per annum on the outstanding nominal value of the
principal and a compounding interest will be charged at 5.0% (2011: 5.0%) per annum on the unpaid interest after the due
date. Refer to Note 32(e) for the terms of RULS.
294
TENAGA NASIONAL BERHAD (200866-W)
Fina
ncia
l Sta
tem
ents
Annual Report 2012
Notes to the Financial Statements– 31 August 2012

22 OPERATING LEASE PAYMENTS
(a) Prepaid leases
Group Company
2012 2011 1.9.2010 2012 2011 1.9.2010
(Restated) (Restated) (Restated) (Restated)
RM’million RM’million RM’million RM’million RM’million RM’million
Prepaid leases 3,789.3 3,161.0 2,606.1 3,539.1 2,930.3 2,380.0
Payments made in advance to Independent Power Producers (IPPs) are primarily to reserve generating capacity for the future
goods and services. These amounts will be used as partial settlement towards the future amounts payable to the IPPs. There
is no contractual right to receive a refund in cash or another financial instrument from the IPPs.
(b) Lease payable and prepayment by lessee
Group Company
2012 2011 1.9.2010 2012 2011 1.9.2010
(Restated) (Restated) (Restated) (Restated)
RM’million RM’million RM’million RM’million RM’million RM’million
Lease payable 147.9 141.7 199.2 147.9 141.7 199.2
Prepayment by lessee 357.7 327.8 362.1 0 0 0
505.6 469.5 561.3 147.9 141.7 199.2
These amounts are disclosed in Note 36.
295
KEEPING THE LIGHTS ON
Fina
ncia
l Sta
tem
ents
Annual Report 2012
Notes to the Financial Statements– 31 August 2012

23 NONCURRENT ASSETS HELDFORSALE
Group Company
2012 2011 2012 2011
RM’million RM’million RM’million RM’million
Cost/Valuation
As at 1 September 12.3 19.9 12.3 19.9
Amount transferred from:
– Property, plant and equipment (Note 13) 15.6 18.6 15.6 18.6
Amount transferred to:
– Property, plant and equipment (Note 13) 0 (1.2) 0 (1.2)
Disposals (17.8) (25.0) (17.8) (25.0)
As at 31 August 10.1 12.3 10.1 12.3
Accumulated depreciation/Amortisation
As at 1 September 0.9 1.9 0.9 1.9
Amount transferred from:
– Property, plant and equipment (Note 13) 0.7 0.5 0.7 0.5
Amount transferred to:
– Property, plant and equipment (Note 13) 0 (0.2) 0 (0.2)
Disposals (1.3) (1.3) (1.3) (1.3)
As at 31 August 0.3 0.9 0.3 0.9
Net book amount
Property, plant and equipment 9.8 11.4 9.8 11.4
As at 31 August 9.8 11.4 9.8 11.4
During the financial year, the Company entered into several sale and purchase agreements with various parties, for which the
disposals are still in progress.
296
TENAGA NASIONAL BERHAD (200866-W)
Fina
ncia
l Sta
tem
ents
Annual Report 2012
Notes to the Financial Statements– 31 August 2012

24 INVENTORIES
Group Company
2012 2011 2012 2011
RM’million RM’million RM’million RM’million
Raw materials, fuel and consumables 2,766.1 2,462.3 1,529.6 1,356.7
Work-in-progress 37.6 169.8 0 0
Finished goods 38.5 13.8 0 0
2,842.2 2,645.9 1,529.6 1,356.7
25 RECEIVABLES, DEPOSITS AND PREPAYMENTS
Group Company
2012 2011 2012 2011
Note RM’million RM’million RM’million RM’million
Trade receivables 6,417.0 5,426.7 5,231.1 4,088.1
Staff advances/loans 70.2 62.0 66.2 56.0
Partial payment to contractors 353.2 527.0 90.7 50.7
Deposits and prepayments 133.2 114.0 26.8 26.1
Other receivables 630.5 554.1 63.3 70.6
Rechargeable debtors 83.9 55.8 83.9 45.7
7,688.0 6,739.6 5,562.0 4,337.2
Allowance for impairment:
Trade receivables 46 (c)(i) (573.1) (607.7) (490.2) (530.3)
Others 46 (c)(i) (126.2) (109.8) (108.5) (82.0)
(699.3) (717.5) (598.7) (612.3)
6,988.7 6,022.1 4,963.3 3,724.9
The Group’s and Company’s credit policy provides trade receivables with a 30 days (2011: 30 days) credit period. The Group has no
major significant concentration of credit risk other than business and residential trade receivables due to its diverse customer base.
All credit and recovery risks associated with receivables have been provided for in the financial statements.
Credit risks relating to Receivables, Deposits and Prepayments is disclosed in Note 46 (c)(i) to the financial statements.
297
KEEPING THE LIGHTS ON
Fina
ncia
l Sta
tem
ents
Annual Report 2012
Notes to the Financial Statements– 31 August 2012

26 AMOUNTS DUE FROM/TO SUBSIDIARIES
Amount due to TNB Capital (L) Ltd. is subject to interest rates ranging from 0.7% to 5.3% (2011: 0.5% to 5.3%) per annum,
is unsecured and has no fixed term of repayment.
Amount due from/(to) all other subsidiaries are unsecured, interest free and repayable on demand.
27 FINANCIAL ASSETS AT FAIR VALUE THROUGH PROFIT OR LOSS
Group Company
2012 2011 2012 2011
RM’million RM’million RM’million RM’million
Financial assets at fair value through profit or loss 9.1 8.6 9.1 8.6
Financial assets represent investments in a unit trust.
28 DEPOSITS, BANK AND CASH BALANCES
Group Company
2012 2011 2012 2011
RM’million RM’million RM’million RM’million
Cash in hand and at bank 856.1 1,005.0 466.2 500.9
Deposits with licensed banks 7,770.2 2,949.2 3,495.0 2,203.0
8,626.3 3,954.2 3,961.2 2,703.9
The interest rate per annum of deposits, bank and cash balances that were effective as at the end of the reporting date were as
follows:
Group Company
2012 2011 2012 2011
% % % %
Deposits with licensed banks 0.1 – 5.0 1.5 – 7.5 3.2 – 3.4 2.9 – 3.6
Bank balances 0.1 0.1 0.1 0.1
Deposits with licensed banks are held in the short-term money market. Deposits have maturity periods ranging from 5 to 366 days
(2011: 4 to 29 days) for the Group and 9 to 70 days (2011: 4 to 25 days) for the Company.
298
TENAGA NASIONAL BERHAD (200866-W)
Fina
ncia
l Sta
tem
ents
Annual Report 2012
Notes to the Financial Statements– 31 August 2012

28 DEPOSITS, BANK AND CASH BALANCES CONTINUED
Deposits of the Group and Company at the end of the financial year have an average maturity period of 113 days (2011: 16 days).
Group Company
2012 2011 2012 2011
Note RM’million RM’million RM’million RM’million
Cash and cash equivalents at the end
of the financial year comprise:
Cash in hand and at bank 856.1 1,005.0 466.2 500.9
Deposits with licensed banks 7,770.2 2,949.2 3,495.0 2,203.0
Deposit, bank and cash balances 8,626.3 3,954.2 3,961.2 2,703.9
Cash at bank held in trust* (97.9) (465.7) 0 0
Debt reserve account** 32 (b)(i) (218.6) (225.2) 0 0
Funds from MOF*** (2.5) (5.2) 0 0
8,307.3 3,258.1 3,961.2 2,703.9
* The cash at bank held in trust is in respect of a grant and deposit given to subsidiaries by the Government of Malaysia for
designated capital projects
** Debt reserve account relates to deposits placed with licensed financial institution as part of security obligations for bond
financing
*** Ministry of Finance (MOF) fund given to a subsidiary under a stimulus package for training programmes
29 PAYABLES
Group Company
2012 2011 2012 2011
RM’million RM’million RM’million RM’million
Trade payables 4,629.4 4,116.3 2,710.2 2,906.9Payroll liabilities 491.4 473.1 444.3 437.3Deposits 24.7 23.7 19.3 17.9Provisions 278.6 388.6 209.1 58.2Other payables and accruals 322.5 569.7 102.7 129.5
5,746.6 5,571.4 3,485.6 3,549.8
Credit terms of trade payables of the Group and Company vary from 30 to 60 days (2011: 30 to 60 days) depending on the terms
of the contracts.
299
KEEPING THE LIGHTS ON
Fina
ncia
l Sta
tem
ents
Annual Report 2012
Notes to the Financial Statements– 31 August 2012

30 DEFERRED INCOME
2012 2011
Group RM’million RM’million
As at the beginning of the financial year 3,373.5 3,042.2Received during the financial year 777.4 949.3Released to income statement (928.2) (652.8)Reclassified (to)/from other liabilities (36.8) 34.8 As at the end of the financial year 3,185.9 3,373.5
Realised within 12 months 894.7 523.9Realised after 12 months 2,291.2 2,849.6
3,185.9 3,373.5
2012 2011
Company RM’million RM’million
As at the beginning of the financial year 2,942.2 2,676.4Received during the financial year 655.6 861.0Released to income statement (811.4) (595.2)
As at the end of the financial year 2,786.4 2,942.2
Realised within 12 months 770.0 487.4Realised after 12 months 2,016.4 2,454.8
2,786.4 2,942.2
Deferred income relates to contributions paid in advance by electricity customers for the construction of electricity network assets.
300
TENAGA NASIONAL BERHAD (200866-W)
Fina
ncia
l Sta
tem
ents
Annual Report 2012
Notes to the Financial Statements– 31 August 2012

31 SHORT TERM BORROWINGS
Group Company
2012 2011 2012 2011
Note RM’million RM’million RM’million RM’million
Portion of borrowings due within
one financial year (Note 32):
– Secured 324.8 294.5 0 0
– Unsecured 989.0 1,164.0 759.3 954.5
1,313.8 1,458.5 759.3 954.5
Short term loans
– Secured 32 (b)(i) 223.1 225.8 0 0
– Unsecured 0.6 0.4 0 0
Bankers’ acceptances 66.7 42.6 0 0
1,604.2 1,727.3 759.3 954.5
The short term borrowings carry interest at rates ranging from 0.8% to 14.0% (2011: 0.8% to 15.5%) per annum for the Group and
from 0.8% to 8.3% (2011: 0.8% to 6.3%) for the Company.
32 BORROWINGS
Group Company
2012 2011 2012 2011
Note RM’million RM’million RM’million RM’million
Secured:
– Term loans (a) 1,490.1 1,312.5 0 0
– Bonds (b) 5,562.8 1,940.3 0 0
7,052.9 3,252.8 0 0
Unsecured:
– Term loans 9,525.9 9,903.8 8,007.1 8,147.4
– Bonds 5,597.7 4,479.6 3,487.8 3,425.3
– Income securities (c) 0 514.4 0 514.4
– Amount due to Cagamas Berhad (d) 0 87.1 0 87.1
– Redeemable unsecured loan stocks (e) 604.9 547.6 0 0
15,728.5 15,532.5 11,494.9 12,174.2
22,781.4 18,785.3 11,494.9 12,174.2
301
KEEPING THE LIGHTS ON
Fina
ncia
l Sta
tem
ents
Annual Report 2012
Notes to the Financial Statements– 31 August 2012

32 BORROWINGS CONTINUED
Group Company
2012 2011 2012 2011
RM’million RM’million RM’million RM’million
Payable within one year included
under short-term borrowings (Note 31) 1,313.8 1,458.5 759.3 954.5
Repayable after one year:
After one and up to two years 1,015.0 1,075.9 493.2 637.4
After two and up to five years 3,774.3 3,840.4 1,229.5 1,462.2
After five and up to ten years 9,006.3 3,713.9 4,816.7 2,213.2
After ten and up to twenty years 6,237.3 7,150.3 3,010.3 5,630.6
After twenty and up to thirty years 1,201.9 1,324.6 953.1 1,054.6
After thirty years 232.8 221.7 232.8 221.7
21,467.6 17,326.8 10,735.6 11,219.7
22,781.4 18,785.3 11,494.9 12,174.2
Group
2012 2011
RM’million RM’million
Net book values of property, plant and equipment pledged as security for borrowings:
(i) Machinery and equipment 4,769.8 4,730.5
(ii) Building 657.0 695.3
(iii) Leasehold land 63.7 64.6
5,490.5 5,490.4
(a) Term loans
The Federal Government loans obtained by SESB are secured by the following:
(i) A debenture creating:
(i) a first fixed charge over all present and future freehold and leasehold properties including all buildings and fixtures;
and
(ii) a first floating charge over all present and future assets of the Company not effectively charged by way of the fixed
charge.
(ii) A deed of assignment transferring all the Company’s present and future rights and interest in all sales proceeds or
revenue derived from the sale of electricity generated from the projects funded.
(iii) A deed of assignment transferring all the Company’s present and future rights and interests in the bank account in which
the loan proceeds are credited.
The tenure of the loans ranges from 20 to 25 years with a profit rate of between 3.0% to 6.0% per annum.
302
TENAGA NASIONAL BERHAD (200866-W)
Fina
ncia
l Sta
tem
ents
Annual Report 2012
Notes to the Financial Statements– 31 August 2012

32 BORROWINGS CONTINUED
(b) Bonds
(i) ISLAMIC DEBT SECURITIES – BAI BITHAMIN AJIL (‘BaIDS’)
On 28 June 2004, KEV obtained RM3,402.0 million BaIDS to finance the acquisition of Stesen Janaelektrik Sultan
Salahuddin Abdul Aziz. The tenure of the BaIDS Facility ranges from 1 to 15 years with a profit rate of between 3.7% and
8.7% per annum.
The BaIDS are secured by the following:
(i) charge over TNB’s leased land. The charge of the leased land was not effected as at 31 August 2012.
(ii) debenture over KEV’s assets and properties and assignment of all rights, title interest and benefits under the project
documents, the assigned insurances, and the designated accounts to secure the payment and repayment of the
total secured amounts.
(iii) the Priority and Security Sharing Agreement.
The terms of BaIDS require deposits to be placed in the debt reserve account with a licensed bank to meet the debt
servicing requirements. The terms of BaIDS also require KEV to maintain certain financial covenants.
The BaIDS is inclusive of a revolving credit facility for working capital purposes amounting to RM200.0 million which has
been classified as short term. (Refer Note 31)
(ii) ISLAMIC SECURITIES PROGRAMME
On 25 November 2011, TNB Janamanjung Sdn. Bhd. obtained RM4.85 billion Islamic Securities Programme to finance the
construction of 1,010 MW coal fired power plant. The tenure of the Islamic Securities Programme ranges from 5 to
20 years with a profit rate between 3.80% and 4.90% per annum.
The Islamic Securities Programme consists of 2 series and the details of the series are as follows:
(i) Series 1 consists of 15 tranches, with tenures ranging from 5 years to 19 years
(ii) Series 2 consists of 1 tranche, with tenure of 20 years.
The Islamic Securities Programme Series 1 is secured by the following:
(i) a first ranking assignment of all the Company’s rights, interest, titles and benefits under PPA1 (Manjung 1, 2 & 3)
and PPA2 (Manjung 4) inclusive of the proceeds therefrom; and
(ii) a first ranking assignment of all designated accounts and the related credit balances.
The Islamic Securities Programme Series 2 is unsecured and have the benefit of unconditional and irrevocable guarantee
from Tenaga Nasional Berhad, to meet the payment obligations of the Company.
The Islamic Securities Programme are issued by Manjung Island Energy Berhad (MIEB) which is a special purpose vehicle
company. All of the issued shares of MIEB are held by Equity Trust (Malaysia) Berhad as share trustee for the benefit of
certain specified charities, under the terms of a declaration of trust.
303
KEEPING THE LIGHTS ON
Fina
ncia
l Sta
tem
ents
Annual Report 2012
Notes to the Financial Statements– 31 August 2012

32 BORROWINGS CONTINUED
(c) Income securities
Fixed Income Securities (‘FIS’)
The FIS consists of both redeemable bonds and Redeemable Preference Shares (‘RPS’), details of which are as follows:
(i) 1,500 interest bearing 10-year redeemable unsecured bonds (“Bonds”) of an aggregated nominal value of RM999.0 million
issued at 100.0% of nominal value (in denominations of RM999,000.00 each), with detachable coupons representing
interest on the Bonds. The Bonds are to be redeemed at par in two tranches with redemption amounts of RM999.0
million and RM499.5 million on 16 August 2011 and 19 September 2011 respectively; and
(ii) 1,000 Class A RPS of RM1.00 each, issued at a premium of RM999.00 per share and 500 Class B RPS of RM1.00 each, issued
at a premium of RM999.00 per share. Both classes of RPS are redeemable at RM1,000 each at the Company’s option at
any time on or after 16 August 2010 and 19 September 2010, for Class A and B RPS respectively. If the Class A and B RPS
are not redeemed by 16 August 2011 and 19 September 2011 respectively, an additional sum of RM1.0 million on the
first tranche and RM0.5 million on the second tranche shall become due and payable under the final Bond Coupon
payment for each of the tranches.
With the adoption of the Single-tier Tax System, the Company is now making coupon payments on the FIS instead of dividend.
The interest payable under the Bond Coupon is RM94.5 million per annum payable semi-annually.
The FIS are classified as debt instruments and hence are reported as liabilities. The FIS (Tranche 2) amounting to RM500.0
million has since matured on 19 September 2011.
(d) Amount due to Cagamas Berhad
On 16 January 1995, TNB had entered into an Agreement with Cagamas Berhad whereby TNB can sell on a recourse basis its
housing loans provided by the Company to its employees to Cagamas Berhad. It has been repurchased on 22 March 2012
(2011: RM87.1 million).
(e) Redeemable unsecured loan stocks (‘RULS’)
On 29 June 2004, KEV issued RM957,574,000.00 of Redeemable Unsecured Loan Stocks (RULS) to the Company and Malakoff
Berhad to finance the acquisition of Stesen Janaelektrik Sultan Salahuddin Abdul Aziz, Kapar. The portion subscribed by
Malakoff Bhd amounts to RM383,029,600.00.
The main features of the RULS are as follows:
(i) The RULS bear interest at 15.0% (2011: 15.0%) per annum on the outstanding nominal value of the RULS. The interest is
repayable semi-annually on the last day of the relevant six month period from the issue date of RULS. A compounding
interest will be charged at 5.0% (2011: 5.0%) per annum on the unpaid interest after the due date. The change in the
compounding interest rate from 15.0% to 5.0% has been approved by the RULS holders at its meeting on 15 October
2008 and is effective from the first issuance date of the RULS.
(ii) The RULS are repayable from the third year from the issue date of RULS as stipulated in the agreement dated 29 June
2004. The RULS has to be settled in full by the final maturity date of 8 July 2029.
304
TENAGA NASIONAL BERHAD (200866-W)
Fina
ncia
l Sta
tem
ents
Annual Report 2012
Notes to the Financial Statements– 31 August 2012

33 HIRE PURCHASE CREDITORS AND FINANCE LEASE OBLIGATION
2012 2011 1.9.2010
(Restated) (Restated)
Note RM’million RM’million RM’million
Group
Finance lease liabilities (a) 1,350.8 1,328.6 0
Hire purchase creditors (b) 43.1 54.8 66.1
1,393.9 1,383.4 66.1
Company
Finance lease liabilities (a) 12,565.5 12,950.3 13,113.3
(a) The Group’s and the Company’s obligations under finance lease liabilities arise predominantly from the power purchase
agreements with several Independent Power Producers (IPPs). These power purchase agreements are accounted for as finance
leases in accordance with IC 4 and FRS 117.
Group Company
2012 2011 2012 2011 1.9.2010
(Restated) (Restated) (Restated)
RM’million RM’million RM’million RM’million RM’million
Present value of minimum lease payments 1,312.8 1,312.8 13,653.1 13,653.1 13,653.1
Amount payable under finance lease:
Within one year 39.6 34.9 671.6 384.8 163.0
After one year but within two years 42.8 39.3 715.1 671.6 384.8
After two years but within five years 154.2 140.9 2,324.9 2,204.4 2,102.7
Over five years 1,114.2 1,113.5 8,853.9 9,689.5 10,462.8
1,350.8 1,328.6 12,565.5 12,950.3 13,113.3
Analysed as:
Current:
Amount due for settlement within 12 months 39.6 34.9 671.6 384.8 163.0
Non-current:
Amount due for settlement after 12 months 1,311.2 1,293.7 11,893.9 12,565.5 12,950.3
1,350.8 1,328.6 12,565.5 12,950.3 13,113.3
Average effective interest rate (%) 8.8% 9.2% 8.0% 8.3% 8.8%
The finance charges associated with the finance leases were charged to the income statement in the financial year in which
they were actually incurred.
305
KEEPING THE LIGHTS ON
Fina
ncia
l Sta
tem
ents
Annual Report 2012
Notes to the Financial Statements– 31 August 2012

33 HIRE PURCHASE CREDITORS AND FINANCE LEASE OBLIGATION CONTINUED
(b) This represents future instalments under hire purchase of motor vehicles, repayable as follows:
Group
2012 2011
RM’million RM’million
Minimum lease payments:
– Not later than 1 year 17.5 16.9
– Later than 1 year and not later than 5 years 29.0 43.7
46.5 60.6
Future finance charges on hire purchase (3.4) (5.8)
Present value of hire purchase 43.1 54.8
Present value of hire purchase:
– Not later than 1 year 15.5 14.2
– Later than 1 year and not later than 5 years 27.6 40.6
43.1 54.8
Finance lease liabilities are effectively secured as the rights to the leased assets revert to the lessors in the event of default.
As at 31 August 2012, the weighted average effective interest rate applicable to the lease liabilities as at the financial year end
is 5.5% (2011: 5.6%) per annum and interest for the financial year is at 3.0% (2011: 3.0%) per annum for the Group. The entire
balance is denominated in Ringgit Malaysia.
34 CONSUMER DEPOSITS
Consumers (with the exception of employees and government departments/agencies) are required to deposit a sum sufficient to
cover charges for two months supply of energy as allowed under the regulation of the Licensee Supply (Amendment) Regulations
2002. In default of payment of the deposit within the time specified, the supply to the consumer’s installation may be disconnected,
subject to certain conditions laid out in the Regulations.
TNB and SESB pay 2.5% per annum on the amount of cash deposit as rebate in January every year.
306
TENAGA NASIONAL BERHAD (200866-W)
Fina
ncia
l Sta
tem
ents
Annual Report 2012
Notes to the Financial Statements– 31 August 2012

35 EMPLOYEE BENEFITS
The movements during the financial year in the amounts recognised in the financial statements are as follows:
Retirement Retirement
benefit medical
plan plan Total
RM’million RM’million RM’million
Group
At 1 September 2010 1,404.4 2,461.9 3,866.3
Charged to income statement (Note 6) 308.7 550.9 859.6
Contribution and benefits paid (254.4) (251.0) (505.4)
At 31 August 2011 1,458.7 2,761.8 4,220.5
Charged to income statement (Note 6) 299.7 577.8 877.5
Contribution and benefits paid (344.2) (264.1) (608.3)
At 31 August 2012 1,414.2 3,075.5 4,489.7
The amounts recognised in the consolidated statement of financial position are analysed as follows:
Retirement Retirement
benefit medical
plan plan Total
RM’million RM’million RM’million
At 31 August 2011
Present value of obligations 2,851.7 4,225.4 7,077.1
Fair value of plan assets (924.8) 0 (924.8)
Present value of unfunded obligations 1,926.9 4,225.4 6,152.3
Unrecognised actuarial losses (462.5) (1,463.6) (1,926.1)
Unrecognised past service cost (15.1) 0 (15.1)
Others:
– Retirement benefits plan 3.0 0 3.0
– Gratuity and retirement benefit 6.4 0 6.4
Liability in the statement of financial position 1,458.7 2,761.8 4,220.5
307
KEEPING THE LIGHTS ON
Fina
ncia
l Sta
tem
ents
Annual Report 2012
Notes to the Financial Statements– 31 August 2012

35 EMPLOYEE BENEFITS CONTINUED
The amounts recognised in the consolidated statement of financial position are analysed as follows: (continued)
Retirement Retirement
benefit medical
plan plan Total
RM’million RM’million RM’million
At 31 August 2012
Present value of obligations 2,911.7 4,379.6 7,291.3
Fair value of plan assets (1,146.0) 0 (1,146.0)
Present value of unfunded obligations 1,765.7 4,379.6 6,145.3
Unrecognised actuarial losses (362.2) (1,304.1) (1,666.3)
Unrecognised past service cost 0 0 0
Others:
– Retirement benefits plan 3.1 0 3.1
– Gratuity and retirement benefit 7.6 0 7.6
Liability in the statements of financial position 1,414.2 3,075.5 4,489.7
The expense recognised in the consolidated statement of comprehensive income is analysed as follows:
Retirement Retirement
benefit medical
plan plan Total
Group RM’million RM’million RM’million
2011
Current service cost 150.4 29.7 180.1
Interest cost 171.8 274.6 446.4
Expected return on plan assets (50.8) 0 (50.8)
Actuarial losses recognised 20.7 246.6 267.3
Past service cost 15.1 0 15.1
Others 1.5 0 1.5
Total included in staff costs (Note 6) 308.7 550.9 859.6
Actual return on plan assets 60.3 0 60.3
308
TENAGA NASIONAL BERHAD (200866-W)
Fina
ncia
l Sta
tem
ents
Annual Report 2012
Notes to the Financial Statements– 31 August 2012

35 EMPLOYEE BENEFITS CONTINUED
The expense recognised in the consolidated statement of comprehensive income is analysed as follows: (continued)
Retirement Retirement
benefit medical
plan plan Total
Group RM’million RM’million RM’million
2012
Current service cost 140.1 30.2 170.3
Interest cost 177.7 283.5 461.2
Expected return on plan assets (57.1) 0 (57.1)
Actuarial losses recognised 19.1 264.1 283.2
Past service cost 15.1 0 15.1
Others 4.8 0 4.8
Total included in staff costs (Note 6) 299.7 577.8 877.5
Actual return on plan assets 176.9 0 176.9
The charge to the income statement is included in operating expenses.
The principal actuarial assumptions used in respect of the Group’s defined benefit plans were as follows:
Retirement Retirement
benefit plan medical plan
Group % %
At 31 August 2011
Discount rates 6.6 7.1
Expected return on plan assets 6.0 N/A
Expected rate of salary increases 6.0 N/A
Medical cost inflation:
– inpatient N/A 8.0
– outpatient N/A 5.0
Others:
– specialist N/A 5.0
At 31 August 2012
Discount rates 6.6 7.1
Expected return on plan assets 6.0 N/A
Expected rate of salary increases 6.0 N/A
Medical cost inflation:
– inpatient N/A 8.0
– outpatient N/A 5.0
Others:
– specialist N/A 5.0
309
KEEPING THE LIGHTS ON
Fina
ncia
l Sta
tem
ents
Annual Report 2012
Notes to the Financial Statements– 31 August 2012

35 EMPLOYEE BENEFITS CONTINUED
The movements during the financial year in the amounts recognised in the Company’s financial statements are as follows:
Retirement Retirement
benefit medical
plan plan Total
Company RM’million RM’million RM’million
At 1 September 2010 1,391.5 2,313.3 3,704.8
Charged to income statements (Note 6) 297.2 521.2 818.4
Contributions and benefits paid (251.9) (227.6) (479.5)
At 31 August 2011 1,436.8 2,606.9 4,043.7
Charged to income statements (Note 6) 292.7 547.6 840.3
Contributions and benefits paid (337.0) (261.0) (598.0)
At 31 August 2012 1,392.5 2,893.5 4,286.0
The amounts recognised in the Company’s statement of financial position are analysed as follows:
Retirement Retirement
benefit medical
plan plan Total
RM’million RM’million RM’million
At 31 August 2011
Present value of obligations 2,838.3 4,070.5 6,908.8
Fair value of plan assets (924.1) 0 (924.1)
Present value of unfunded obligations 1,914.2 4,070.5 5,984.7
Unrecognised actuarial losses (462.3) (1,463.6) (1,925.9)
Unrecognised past service cost (15.1) 0 (15.1)
Liabilities in the statement of financial position 1,436.8 2,606.9 4,043.7
At 31 August 2012
Present value of obligations 2,900.8 4,197.5 7,098.3
Fair value of plan assets (1,146.0) 0 (1,146.0)
Present value of unfunded obligations 1,754.8 4,197.5 5,952.3
Unrecognised actuarial losses (362.3) (1,304.0) (1,666.3)
Unrecognised past service cost 0 0 0
Liabilities in the statement of financial position 1,392.5 2,893.5 4,286.0
310
TENAGA NASIONAL BERHAD (200866-W)
Fina
ncia
l Sta
tem
ents
Annual Report 2012
Notes to the Financial Statements– 31 August 2012

35 EMPLOYEE BENEFITS CONTINUED
The expense recognised in the Company’s statement of comprehensive income is analysed as follows:
Retirement Retirement
benefit medical
plan plan Total
Company RM’million RM’million RM’million
2011
Current service cost 140.4 0 140.4
Interest cost 171.7 274.6 446.3
Expected return on plan assets (50.7) 0 (50.7)
Actuarial losses recognised 20.7 246.6 267.3
Past service cost 15.1 0 15.1
Total included in staff costs (Note 6) 297.2 521.2 818.4
Actual return on plan assets 60.3 0 60.3
2012
Current service cost 136.9 0 136.9
Interest cost 177.7 283.5 461.2
Expected return on plan assets (57.2) 0 (57.2)
Actuarial losses recognised 19.8 264.1 283.9
Past service cost 15.5 0 15.5
Total included in staff costs (Note 6) 292.7 547.6 840.3
Actual return on plan assets 176.9 0 176.9
The charge to the income statements is included in operating expenses.
311
KEEPING THE LIGHTS ON
Fina
ncia
l Sta
tem
ents
Annual Report 2012
Notes to the Financial Statements– 31 August 2012

35 EMPLOYEE BENEFITS CONTINUED
The principal actuarial assumptions used in respect of the Company’s defined benefit plans were as follows:
Retirement Retirement
benefit plan medical plan
Company % %
At 31 August 2011
Discount rates 6.6 7.1
Expected return on plan assets 6.0 N/A
Expected rate of salary increases 6.0 N/A
Medical cost inflation:
– inpatient N/A 8.0
– outpatient N/A 5.0
Others:
– specialist N/A 5.0
At 31 August 2012
Discount rates 6.6 7.1
Expected return on plan assets 6.0 N/A
Expected rate of salary increases 6.0 N/A
Medical cost inflation:
– inpatient N/A 8.0
– outpatient N/A 5.0
Others:
– specialist N/A 5.0
The effect of a 1% movement in the assumed medical cost trend rate is as follows:
Group Company
Increase Decrease Increase Decrease
RM’million RM’million RM’million RM’million
Effect on the aggregate of the current service cost and interest cost 51.8 (42.0) 48.9 (39.8)
Effect on the defined benefit obligation 763.0 (621.0) 735.6 (599.0)
Plan assets comprise:
Group and Company
2012 2011
% %
Equity instruments 22.9 24.4
Debt instruments 72.7 72.7
Others 4.4 2.9
100.0 100.0
312
TENAGA NASIONAL BERHAD (200866-W)
Fina
ncia
l Sta
tem
ents
Annual Report 2012
Notes to the Financial Statements– 31 August 2012

35 EMPLOYEE BENEFITS CONTINUED
Pension plan assets include the Company’s ordinary shares with a fair value of RM5.5 million (2011: RM3.1 million).
The expected return on plan assets is determined by considering the expected returns available on the assets underlying the
current investment policy. Expected yields on fixed interest investments are based on gross redemption yields as at the end of the
reporting period. Expected returns on equity and property investments reflect long term real rates of return experienced in the
respective markets.
Expected contributions to post-employment benefit plans for the financial year ending 31 August 2013 are RM49.2 million.
2012 2011 2010 2009 2008
RM’million RM’million RM’million RM’million RM’million
Group
At 31 August
Present value of defined benefit obligation 7,287.0 7,072.3 6,809.5 6,521.5 5,412.7
Fair value of plan assets (1,146.0) (996.8) (852.1) (717.1) (615.1)
Deficit in the plan 6,141.0 6,075.5 5,957.4 5,804.4 4,797.6
Experience adjustments on plan liabilities (144.4) (97.7) (86.2) (894.7) (15.3)
Experience adjustments on plan assets 119.8 9.6 6.8 7.5 (119.6)
Company
At 31 August
Present value of defined benefit obligation 7,098.3 6,908.9 6,657.2 6,376.5 5,278.5
Fair value of plan assets (1,146.0) (996.8) (852.1) (717.1) (615.1)
Deficit in the plan 5,952.3 5,912.1 5,805.1 5,659.4 4,663.4
Experience adjustments on plan liabilities (144.4) (97.7) (90.0) (903.8) (23.8)
Experience adjustments on plan assets 119.8 9.6 6.8 7.5 (119.6)
313
KEEPING THE LIGHTS ON
Fina
ncia
l Sta
tem
ents
Annual Report 2012
Notes to the Financial Statements– 31 August 2012

36 OTHER LIABILITIES
2012 2011 1.9.2010
(Restated) (Restated)
Note RM’million RM’million RM’million
Group
Long term payable to State Government 45.2 45.2 48.0
Lease payable under operating lease 22 (b) 147.9 141.7 199.2
Prepayment by lessee 22 (b) 357.7 327.8 362.1
Others 341.4 395.3 422.3
892.2 910.0 1,031.6
Company
Payable to State Government 45.2 45.2 48.0
Lease payable under operating lease 22 (b) 147.9 141.7 199.2
Others 303.6 309.6 320.0
496.7 496.5 567.2
37 GOVERNMENT DEVELOPMENT GRANTS
Group
2012 2011
RM’million RM’million
As at the beginning of the financial year 627.2 599.0
Received during the financial year 120.8 92.8
Released to income statements (Note 7) (77.0) (64.6)
As at the end of the financial year 671.0 627.2
The development grants are provided by the Government mainly for the construction of transmission lines.
314
TENAGA NASIONAL BERHAD (200866-W)
Fina
ncia
l Sta
tem
ents
Annual Report 2012
Notes to the Financial Statements– 31 August 2012

38 SHARE CAPITAL
Group and Company
2012 2011
Authorised:
Ordinary shares of RM1.00 each 10,000,000,000 10,000,000,000
Special Rights Redeemable Preference Share of RM1.00 each 1 1
Class B Redeemable Preference Shares of RM1.00 each
As at the beginning/end of the financial year 0 500
Issued and fully paid:
Ordinary shares of RM1.00 each 5,501,553,731 5,456,657,139
Special Rights Redeemable Preference Share of RM1.00 each 1 1
Total share capital issued and fully paid as at the end of the financial year 5,501,553,732 5,456,657,140
Movements in issued ordinary shares of RM1.00 each
As at the beginning of the financial year 5,456,657,139 4,352,719,795
Issuance of ordinary shares of RM1.00 each under the ESOS II 44,896,592 13,804,154
Issuance of Bonus Shares as fully paid up, on the basis of one (1)
Bonus Share for every four (4) existing TNB shares held by
shareholders via the capitalisation of the share premium account 0 1,090,133,190
As at the end of the financial year 5,501,553,731 5,456,657,139
315
KEEPING THE LIGHTS ON
Fina
ncia
l Sta
tem
ents
Annual Report 2012
Notes to the Financial Statements– 31 August 2012

38 SHARE CAPITAL CONTINUED
Employees’ Share Option Scheme (‘ESOS’)
The Company implemented a new Employees’ Share Option Scheme II (‘ESOS II’) on 8 July 2003 for a period of 10 years. The ESOS
II is governed by the bye-laws, which were approved by the shareholders at an Extraordinary General Meeting (‘EGM’) on 29 May
2003 and amended at the EGM held on 15 December 2005.
The main features of ESOS II are as follows:
(a) The total number of ordinary shares to be issued by the Company under the ESOS II shall not exceed 10.0% of total issued
and paid-up ordinary shares of the Company, such that not more than 50.0% of the shares available under the ESOS II are
allocated, in aggregate, to Directors and senior management.
(b) Not more than 10.0% of the shares available under the ESOS II is allocated to any individual Director or employee who, either
singly or collectively through his/her associates, holds 20.0% or more in the issued and paid-up capital of the Company.
(c) Any employee, including any Executive Director and those categorised as Fixed Term Senior Management, but excluding a
Skim A employee (the scheme governing employees who, upon the corporatisation and privatisation of the Lembaga Letrik
Negara in 1990, remain employed under the Government’s terms and conditions) are eligible to participate in the ESOS II.
Employees under the Fixed Term Senior Management are also entitled to the Performance Options based on them meeting
prescribed performance targets.
(d) The option price under the ESOS II is the higher of the weighted average market price of the shares as shown in the daily
official list issued by the Bursa Malaysia Securities Berhad for the five trading days preceding the date of offer with a 10.0%
discount on the nominal value of the shares, subject always that the discount shall not be applicable to any shares under the
Performance Option.
(e) In the event of any alteration to the capital structure of the Company during the option period which expires on 7 July 2013,
such corresponding alterations shall be made in:
(i) the number of new shares in relation to the ESOS II so far as unexercised;
(ii) the option price; and/or
(iii) the method of the exercise of the option.
(f) Options granted under the ESOS II carry no dividends or voting rights. Upon exercise of the options, shares issued rank pari
passu in all respects with the then existing ordinary shares of the Company.
(g) The persons to whom the options have been granted under the ESOS II have no right to participate in any share issue of any
other company within the Group.
316
TENAGA NASIONAL BERHAD (200866-W)
Fina
ncia
l Sta
tem
ents
Annual Report 2012
Notes to the Financial Statements– 31 August 2012

38 SHARE CAPITAL CONTINUED
Employees’ Share Option Scheme (‘ESOS’) (continued)
Movements in the number of shares represented by options outstanding and their related weighted average exercise prices are as
follows:
2012 2011
Average Average
exercise Number exercise Number
price of shares price of shares
RM/share ‘000 RM/share ‘000
As at the beginning of the financial year 7.16 165,391 7.39 123,641
Granted 5.68 23,255 5.51 26,968
Exercised 5.38 (44,897) 6.45 (13,804)
Expired 5.80 (725) 9.18 (443)
Bonus issue 0 0 7.42 29,029
As at the end of the financial year 7.49 143,024 7.16 165,391
Details relating to the options exercised during the financial year are as follows:
Number of
Fair value of shares
shares at share Exercise issued as at
Exercise date issue date price 31.8.2012
RM/share RM/share
September 2011 5.37 – 4.89 4.45/5.45 4,000
October 2011 5.98 – 4.97 5.36/5.06 2,249
November 2011 5.95 – 5.34 5.36/4.45/5.45 53,121
December 2011 5.92 – 5.36 5.06/4.45/5.45 72,747
January 2012 6.40 – 5.81 5.36/5.06/4.45/5.45 256,241
February 2012 6.38 – 5.88 5.36/5.59/5.93/5.86/5.06/4.45/ 454,784
5.74/5.45
March 2012 6.72 – 6.13 5.36/5.59/5.93/5.86/5.06/4.45/ 1,715,368
5.74/5.45
April 2012 6.62 – 6.37 5.36/5.59/5.93/5.86/5.06/4.45/ 5,564,199
5.74/5.45
May 2012 6.67 – 6.10 5.36/5.59/5.93/5.86/5.06/4.45/ 5,952,358
5.74/5.45/5.64/5.08/5.62
June 2012 6.77 – 6.39 5.36/5.59/5.93/5.86/5.06/4.45/ 4,773,157
5.74/5.45/5.64
July 2012 6.86 – 6.50 5.36/5.59/5.93/5.86/5.06/4.45/ 10,464,257
5.74/5.45/5.64/6.24/6.09
August 2012 7.01 – 6.73 5.36/5.59/5.93/5.86/8.85/5.06/4.45/ 15,584,111
5.74/5.45/5.64/6.24/6.40
Total 44,896,592
317
KEEPING THE LIGHTS ON
Fina
ncia
l Sta
tem
ents
Annual Report 2012
Notes to the Financial Statements– 31 August 2012

38 SHARE CAPITAL CONTINUED
Employees’ Share Option Scheme (‘ESOS’) (continued)
Share options outstanding at the end of the year have the following expiry dates and exercise price.
Number of shares
Expiry date Exercise price 2012 2011
RM/share ‘000 ‘000
07.07.2013 5.36 33,639 43,562
07.07.2013 5.59 4,213 5,243
07.07.2013 6.20 219 219
07.07.2013 5.93 7,165 7,758
07.07.2013 6.24 326 359
07.07.2013 5.86 7,325 8,520
07.07.2013 5.86 3,014 3,425
07.07.2013 7.35 1,632 1,632
07.07.2013 8.85 18,177 18,235
07.07.2013 9.24 16 16
07.07.2013 8.98 43 43
07.07.2013 7.35 112 112
07.07.2013 7.35 1,278 1,278
07.07.2013 5.06 6,634 11,188
07.07.2013 5.86 1,309 1,402
07.07.2013 5.62 27 27
07.07.2013 6.36 22 22
07.07.2013 7.33 54 54
07.07.2013 7.33 307 307
07.07.2013 7.35 47 47
07.07.2013 7.35 100 100
07.07.2013 7.35 864 864
07.07.2013 8.57 112 112
07.07.2013 9.24 47 47
07.07.2013 4.45 5,043 9,965
07.07.2013 7.35 225 225
07.07.2013 7.35 52 52
07.07.2013 7.35 157 157
07.07.2013 7.33 25 25
07.07.2013 7.33 63 63
07.07.2013 6.36 212 212
07.07.2013 6.09 161 161
07.07.2013 5.62 63 63
07.07.2013 7.35 224 224
07.07.2013 9.24 63 63
07.07.2013 7.35 262 262
07.07.2013 4.76 88 88
07.07.2013 8.57 150 150
07.07.2013 7.33 174 174
07.07.2013 6.09 21 52
07.07.2013 5.74 15,661 22,353
07.07.2013 4.76 88 88
318
TENAGA NASIONAL BERHAD (200866-W)
Fina
ncia
l Sta
tem
ents
Annual Report 2012
Notes to the Financial Statements– 31 August 2012

38 SHARE CAPITAL CONTINUED
Employees’ Share Option Scheme (‘ESOS’) (continued)
Share options outstanding at the end of the financial year have the following expiry dates and exercise price.
Number of shares
Expiry date Exercise price 2012 2011
RM/share ‘000 ‘000
07.07.2013 5.08 0 150
07.07.2013 5.62 77 137
07.07.2013 6.09 422 485
07.07.2013 6.36 212 212
07.07.2013 6.38 37 37
07.07.2013 6.53 90 90
07.07.2013 6.56 63 63
07.07.2013 6.60 150 150
07.07.2013 6.75 27 27
07.07.2013 7.33 270 270
07.07.2013 7.35 63 63
07.07.2013 8.57 150 150
07.07.2013 9.24 63 63
07.07.2013 5.45 15,380 24,545
07.07.2013 5.64 15,181 0
07.07.2013 6.36 90 0
07.07.2013 4.76 53 0
07.07.2013 6.75 8 0
07.07.2013 5.08 120 0
07.07.2013 6.09 324 0
07.07.2013 7.33 175 0
07.07.2013 5.62 98 0
07.07.2013 6.53 92 0
07.07.2013 6.60 90 0
07.07.2013 6.56 50 0
07.07.2013 6.38 50 0
07.07.2013 6.98 38 0
07.07.2013 6.40 208 0
07.07.2013 6.28 30 0
143,025 165,391
319
KEEPING THE LIGHTS ON
Fina
ncia
l Sta
tem
ents
Annual Report 2012
Notes to the Financial Statements– 31 August 2012

38 SHARE CAPITAL CONTINUED
Employees’ Share Option Scheme (‘ESOS’) (continued)
The weighted average fair value of options granted during the respective financial year was determined using the Trinomial
valuation model. The significant inputs into the model were as follows:
Expected 5 year average
Share price Exercise Option dividend Risk free share price
Grant date at grant date price life yield interest rate movement
RM RM Years % % %
25.02.2005 8.24 7.75 8 1.14 3.64 21.57
30.03.2005 8.00 7.42 8 1.14 3.33/3.72 22.13
17.07.2005 8.56 7.80 7 1.14 3.40 19.41
24.02.2006 8.70 7.33 7 1.14 3.43/3.63/3.77 24.01
16.04.2006 8.65 7.33 7 1.14 3.55/3.96 18.07
25.09.2006 9.91 9.19 6 1.14 3.86/3.95 18.52
28.03.2007 11.50 11.07 6 1.14 3.48/3.50 17.59
26.07.2007 10.95 11.56 6 1.14 3.48 17.45
24.08.2007 10.29 11.24 6 1.14 3.60 19.92
27.10.2007 9.28 9.19 6 1.14 3.56 17.40
27.12.2007 9.54 9.19/10.72 6 1.14 3.64/3.79 17.47
25.04.2008 6.76 6.33 5 1.14 3.37/3.45 20.32
30.07.2008 8.35 7.33 5 1.14 3.73/3.89 22.42
06.11.2008 6.11 9.189 5 1.14 3.73 23.43
14.11.2008 6.20 9.189 5 1.14 3.60 23.47
19.12.2008 5.97 7.03/7.95/ 5 1.14 2.94/3.02 23.45
9.17/9.189/
10.716/
26.12.2008 6.01 9.17 5 1.14 2.92 23.40
27.03.2009 6.10 5.57 4 1.14 1.98/2.81 23.93
26.06.2009 7.73 9.189/9.17 4 1.14 2.89 23.82
06.07.2009 7.77 9.189 4 1.14 2.92 23.82
15.07.2009 7.92 9.189 4 1.14 3.72 23.79
30.12.2009 8.29 5.95/6.35/ 4 1.14 3.24 18.72
7.03/7.18/
7.62/7.95/
9.17/9.189/
10.716/
11.558
29.04.2010 8.48 7.18 3 1.14 2.57/2.99 15.80
30.12.2010 8.37 4.76/5.08 3 1.14 3.12 25.14
5.62/6.09
6.36/6.38
6.53/6.56
6.60/6.75
7.33/7.35
8.57/9.24
320
TENAGA NASIONAL BERHAD (200866-W)
Fina
ncia
l Sta
tem
ents
Annual Report 2012
Notes to the Financial Statements– 31 August 2012

38 SHARE CAPITAL CONTINUED
Employees’ Share Option Scheme (‘ESOS’) (continued)
Expected 5 year average
Share price Exercise Option dividend Risk free share price
Grant date at grant date price life yield interest rate movement
RM RM Years % % %
29.04.2011 6.01 5.45 2 1.14 2.92/3.29 23.07
10.04.2012 6.37 5.64 1 1.14 3.03/3.10 24.29
6.36/4.76
6.75/5.08
6.09/7.33
5.62/6.53
6.60/6.56
6.38/6.98
6.40/6.28
The charges to the income statement arising from share-based payments during the financial year amounted to RM24.8 million
(2011: RM34.1 million) for the Group and RM21.2 million (2011: RM29.8 million) for the Company as set out in Note 6 to these
financial statement.
31.8.2012
RM’000
Ordinary share capital, at par 44,896,592
Share premium 196,542,119
Proceeds received on exercise of share options 241,438,711
Fair value at exercise date of shares issued 298,700,859
Special Rights Redeemable Preference Share (‘Special Share’)
(a) The Special Share would enable the Government of Malaysia through the Minister of Finance Incorporated to ensure that
certain major decisions affecting the operations of the Company are consistent with the Government’s policies. The Special
Shareholder, which may only be the Government or any representative or person acting on its behalf, is entitled to receive
notices of meetings but not to vote at such meetings of the Company. However, the Special Shareholder is entitled to attend
and speak at such meetings.
The Special Shareholder has the right to appoint any person, but not more than six at any time, to be the Board of Directors
of the Company.
(b) Certain matters, in particular the alteration of the Articles of Association of the Company relating to the rights of the Special
Shareholder, creation and issue of additional shares which carry different voting rights, the dissolution of the Company,
substantial disposal of assets, amalgamations, merger and takeover, require the prior consent of the Special Shareholder.
(c) The Special Shareholder does not have any right to participate in the capital or profits of the Company.
(d) The Special Shareholder has the right to require the Company to redeem the Special Share, at par, at any time.
321
KEEPING THE LIGHTS ON
Fina
ncia
l Sta
tem
ents
Annual Report 2012
Notes to the Financial Statements– 31 August 2012

38 SHARE CAPITAL CONTINUED
Class B Redeemable Preference Shares (‘RPS’)
The main features of the Company’s Class B RPS is as follows:
(a) The RPS do not carry any right to participate in the assets and surplus profit of the Company.
(b) The RPS holders have no voting rights except on resolution to amend the RPS holders’ rights.
(c) These RPS are not convertible into ordinary shares.
(d) The Company has the right to redeem all Class B RPS on or after 19 September 2010 at RM1,000 each.
As described in Note 32(b) to these financial statements, these RPS form part of the Company’s Fixed Income Securities.
39 SHARE PREMIUM
Group and Company
2012 2011
RM’million RM’million
As at the beginning of the financial year 4,332.6 5,354.2
Arising in respect of ordinary shares issued during the financial year 196.5 68.5
Bonus issue during financial year 0 (1,090.1)
As at the end of the financial year 4,529.1 4,332.6
40 REVALUATION AND OTHER RESERVES
Group Company
2012 2011 2012 2011
RM’million RM’million RM’million RM’million
Non-distributable
Revaluation reserve 880.4 894.9 870.3 884.8
Foreign currency translation reserve (266.7) (215.5) 0 0
Reserve on consolidation (146.6) (146.6) 0 0
Employees’ Share Option Scheme reserve 181.6 156.6 181.6 156.5
648.7 689.4 1,051.9 1,041.3
322
TENAGA NASIONAL BERHAD (200866-W)
Fina
ncia
l Sta
tem
ents
Annual Report 2012
Notes to the Financial Statements– 31 August 2012

40 REVALUATION AND OTHER RESERVES CONTINUED
The movements in each category of reserves were as follows:
Group Company
2012 2011 2012 2011
RM’million RM’million RM’million RM’million
Revaluation reserve
As at the beginning of the financial year 894.9 914.3 884.8 904.2
Realisation of revaluation reserve (14.5) (19.4) (14.5) (19.4)
As at the end of the financial year 880.4 894.9 870.3 884.8
Revaluation reserve represents the revaluation of freehold land, buildings and civil works in the past.
Group Company
2012 2011 2012 2011
RM’million RM’million RM’million RM’million
Foreign currency translation reserve
As at the beginning of the financial year (215.5) (207.4) 0 0
Arising in the financial year (51.2) (8.1) 0 0
As at the end of the financial year (266.7) (215.5) 0 0
The foreign currency translation reserve comprises exchange differences resulting from the translation of the results and financial
position of foreign operations.
Group Company
2012 2011 2012 2011
RM’million RM’million RM’million RM’million
Reserve on consolidation
As at the beginning/end of the financial year (146.6) (146.6) 0 0
The reserve on consolidation comprise goodwill which arose from acquisition of subsidiaries prior to financial year ended 2006, and
had been taken directly to reserves.
323
KEEPING THE LIGHTS ON
Fina
ncia
l Sta
tem
ents
Annual Report 2012
Notes to the Financial Statements– 31 August 2012

40 REVALUATION AND OTHER RESERVES CONTINUED
Group Company
2012 2011 2012 2011
RM’million RM’million RM’million RM’million
Employees’ Share Option Scheme reserve
As at the beginning of the financial year 156.6 122.5 156.5 111.3
Arising in the financial year 25.0 34.1 25.1 45.2
As at the end of the financial year 181.6 156.6 181.6 156.5
The share options reserve comprises the fair value of options granted, less any shares issued under the ESOS. When share options
are exercised, the proceeds received from the exercise of these options together with the corresponding share options reserve, net
of any directly attributable transactions costs are transferred to share capital (nominal value) and share premium.
Group Company
2012 2011 2012 2011
RM’million RM’million RM’million RM’million
Total revaluation and other reserves
As at the beginning of the financial year 689.4 682.8 1,041.3 1,015.5
Arising in the financial year (26.2) 26.0 25.1 45.2
Realisation of revaluation reserve (14.5) (19.4) (14.5) (19.4)
As at the end of the financial year 648.7 689.4 1,051.9 1,041.3
324
TENAGA NASIONAL BERHAD (200866-W)
Fina
ncia
l Sta
tem
ents
Annual Report 2012
Notes to the Financial Statements– 31 August 2012

41 RETAINED PROFITS
The Finance Act 2007 introduced the single-tier system with effect from the year of assessment 2008. Under the single-tier system,
companies are not required to have a Section 108 balance for dividend payment purposes. Dividends paid under the single-tier
system are tax exempt in the hands of the shareholders. The Section 108 balance as at 31 December 2007 will be available to
companies until such time that the balance is fully utilised or upon expiry of the six-year transitional period on 31 December 2013,
whichever is earlier, unless the companies opt to disregard the Section 108 balance and pay dividends under the single-tier system
as provided for under the special transitional provisions of the Finance Act 2007.
As at 31 August 2012, the Company’s Section 108 balance is insignificant and the intention is for the balance not be utilised. The
Company has now moved to the single-tier system to replace the imputation system. Dividends paid under the single-tier system
are now tax exempt in the hands of the shareholders.
Therefore, the retained profits of RM21,355.2 million (2011: RM18,480.0 million) as at 31 August 2012 can be distributed as exempt
dividends under the single-tier system.
In addition, the Company has tax exempt income as at 31 August 2012 arising from the Income Tax (Amendment) Act 1999, relating
to tax on income earned in 1999 being waived and exempt dividend income amounting to approximately RM3.1 million (2011:
RM3.1 million) available for distribution as tax exempt dividends to shareholders.
42 COMMITMENTS
(a) Capital and other commitments for 5 years
Group Company
2012 2011 2012 2011
RM’million RM’million RM’million RM’million
Authorised capital expenditure
not provided in the financial statements:
– Contracted 4,224.6 10,831.7 1,039.5 5,587.9
– Not contracted 13,513.9 9,101.9 12,909.3 8,369.6
17,738.5 19,933.6 13,948.8 13,957.5
325
KEEPING THE LIGHTS ON
Fina
ncia
l Sta
tem
ents
Annual Report 2012
Notes to the Financial Statements– 31 August 2012

42 COMMITMENTS CONTINUED
(b) Operating lease commitments – as lessee
The Group and the Company leases a number of plant and machineries under operating leases. These leases have an average
tenure between 21 and 25 years. None of the leases includes contingent rentals.
Future minimum rental payable under non-cancellable operating leases at the reporting date are as follows:
Group Company
2012 2011 2012 2011
RM’million RM’million RM’million RM’million
Payable not later than one year 5,457.1 5,456.3 5,152.2 5,155.4
Payable later than one year but not later than five years 20,289.8 21,252.8 19,095.5 20,042.5
Payable more than five years 32,236.8 36,731.0 30,440.5 34,645.8
57,983.7 63,440.1 54,688.2 59,843.7
(c) Operating lease commitments – as lessor
The Group leases out its plant and equipment under non-cancellable operating leases. The lessees are required to pay absolute
fixed lease payments during the lease period. Total future minimum lease receivables under non-cancellable operating leases
contracted for at the reporting date but not recognised as receivables, are as follows:
Group Company
2012 2011 2012 2011
RM’million RM’million RM’million RM’million
Payable not later than one year 139.5 143.7 47.7 48.3
Payable later than one year but not later than five years 291.3 378.6 95.4 95.4
Payable more than five years 452.9 520.0 0 0
883.7 1,042.3 143.1 143.7
326
TENAGA NASIONAL BERHAD (200866-W)
Fina
ncia
l Sta
tem
ents
Annual Report 2012
Notes to the Financial Statements– 31 August 2012

43 CONTINGENT LIABILITIES UNSECURED
Group Company
2012 2011 2012 2011
RM’million RM’million RM’million RM’million
Claims by third parties 320.8 594.9 314.8 402.9
Trade guarantees and performance bonds 27.4 152.5 0 0
Bank guarantees 0 3.6 0 0
Other contingent liabilities 5.0 2.4 0 0
353.2 753.4 314.8 402.9
Claims by third parties include claims by contractors, consultants, consumers and former employees. These claims are being
resolved and the Directors are of the opinion that their outcome will not have a material adverse effect on the financial position
of both the Group and the Company.
44 SIGNIFICANT RELATED PARTY DISCLOSURES
The related party transaction of the Company comprises mainly transactions between the Company and its subsidiaries and
associates namely the following:
Subsidiaries
• TNB Janamanjung Sdn. Bhd. • Sabah Electricity Sdn. Bhd.
• TNB Fuel Services Sdn. Bhd. • TNB Research Sdn. Bhd.
• Kapar Energy Ventures Sdn. Bhd. • TNB Capital Ltd.
• Tenaga Switchgear Sdn. Bhd. • TNB Power Daharki Ltd.
• Malaysia Transformers Manufacturing Sdn. Bhd. • Tenaga Cable Industries Sdn. Bhd.
• TNB Integrated Learning Solution Sdn. Bhd. • Universiti Tenaga Nasional Sdn. Bhd.
• TNB Engineering Corporation Sdn. Bhd. • TNB Repair And Maintenance Sdn. Bhd.
Associates
• Teknologi Tenaga Perlis Consortium Sdn. Bhd.
• GB3 Sdn. Bhd.
• Fibrecomm Network (M) Sdn. Bhd.
• Jimah Energy Ventures Holdings Sdn. Bhd.
• Integrax Berhad
All related party transactions were entered into a normal course of business and at prices available to third parties or at negotiated
terms.
As stated under paragraph 5 of FRS Standard No. 124 “Related Party Disclosures”, disclosure of significant related party transactions
between a state-controlled enterprise with other state-controlled enterprise is not required to be disclosed in the financial
statements.
327
KEEPING THE LIGHTS ON
Fina
ncia
l Sta
tem
ents
Annual Report 2012
Notes to the Financial Statements– 31 August 2012

44 SIGNIFICANT RELATED PARTY DISCLOSURES CONTINUED
Accordingly, significant related party transactions between the Company and other Government controlled entities are not presented as
the principal shareholders of the Company are the Government of Malaysia and related entities owned by the Government.
In addition to related party balances mentioned elsewhere in the financial statements, set out below are other significant related
party transactions which were carried out on terms and conditions negotiated amongst the related parties:
Company
2012 2011
RM’million RM’million
(a) Transactions with subsidiaries
Income:
– Sales of electricity 35.2 31.9
– Interest income 176.1 185.5
– Dividend income 83.7 46.2
– Rental income 27.3 27.3
Expenditure:
– Purchases of electricity 4,844.5 4,527.3
– Training fees 56.3 50.2
– Interest expense 90.4 88.0
Amounts due from subsidiaries 2,270.7 2,611.4
Amounts due to subsidiaries 3,629.4 4,076.4
Group Company
2012 2011 2012 2011
RM’million RM’million RM’million RM’million
(b) Transactions with associates
Income:
– Sales of electricity 0.6 0.5 0.6 0.5
– Interest income 43.3 43.9 43.3 43.9
– Dividend income 24.5 36.8 24.5 36.8
– Leasing income 42.2 9.2 42.2 9.2
Expenditure:
– Purchases of electricity 3,618.8 3,966.3 3,618.8 3,966.3
Amounts due from associates 62.6 14.6 61.6 14.6
Amounts due to associates 697.9 707.9 697.9 707.9
Sales and purchases of electricity to and from associates are aggregated because the transactions are similar in nature and no
single transaction is significant enough to warrant separate disclosure.
328
TENAGA NASIONAL BERHAD (200866-W)
Fina
ncia
l Sta
tem
ents
Annual Report 2012
Notes to the Financial Statements– 31 August 2012

44 SIGNIFICANT RELATED PARTY DISCLOSURES CONTINUED
Group Company
2012 2011 2012 2011
RM’million RM’million RM’million RM’million
(c) Key management compensation
Short-term employee benefits:
– Salaries, allowances and bonus 21.7 17.7 14.3 10.1
– Benefits-in-kind 1.0 1.0 0.7 0.8
– Defined contribution retirement plan 2.6 1.7 1.9 1.0
– Other staff benefits 0.4 0.3 0.3 0.3
Share-based payment:
– ESOS expense 0.3 1.7 0.3 1.5
Key management personnel are the persons who have authority and responsibility for planning, directing and controlling the
activities of the Company or the Group either directly or indirectly.
Whenever exist, related party transactions also includes transaction with entities that are controlled, jointly controlled or significantly
influenced directly or indirectly by any key management personnel or their close family members.
45 SEGMENTAL REPORTING
Segmental reporting is not presented as the Group is principally engaged in the generation, transmission, distribution and sales of
electricity and the provision of other related services, which are substantially within a single business segment and this is consistent
with the current practice of internal reporting. The Group operates primarily in Malaysia.
46 FINANCIAL INSTRUMENTS
(a) Categories of financial instruments
The table below provides an analysis of financial instruments categorised as follows:
(i) Loans and receivables (L&R);
(ii) Fair value through profit or loss (FVTPL);
(iii) Available-for-sale financial assets (AFS); and
(iv) Other financial liabilities measured at amortised cost (OL).
329
KEEPING THE LIGHTS ON
Fina
ncia
l Sta
tem
ents
Annual Report 2012
Notes to the Financial Statements– 31 August 2012

46 FINANCIAL INSTRUMENTS CONTINUED
(a) Categories of financial instruments (continued)
Carrying L&R/
amount OL FVTPL AFS
2012 RM’million RM’million RM’million RM’million
Group
Financial assets
Unsecured loan stocks in associate 15.9 15.9 0 0
Investment in unquoted debt securities 163.7 163.7 0 0
Available-for-sale financial assets 38.0 0 0 38.0
Derivative financial instruments 116.3 0 116.3 0
Long term receivables 419.2 419.2 0 0
Trade and other receivables 6,988.7 6,988.7 0 0
Amounts due from associates 62.6 62.6 0 0
Financial assets at fair value through profit and loss 9.1 0 9.1 0
Deposits, bank and cash balances 8,626.3 8,626.3 0 0
16,439.8 16,276.4 125.4 38.0
Carrying L&R/
amount OL FVTPL AFS
RM’million RM’million RM’million RM’million
Company
Financial assets
Unsecured loan stocks in associate 15.9 15.9 0 0
Investment in unquoted debt securities 163.7 163.7 0 0
Available-for-sale financial assets 38.0 0 0 38.0
Derivative financial instruments 0 0 0 0
Long term receivables 853.2 853.2 0 0
Trade and other receivables 4,963.3 4,963.3 0 0
Amounts due from subsidiaries 2,270.7 2,270.7 0 0
Amounts due from associates 61.6 61.6 0 0
Financial assets at fair value through profit and loss 9.1 0 9.1 0
Deposits, bank and cash balances 3,961.2 3,961.2 0 0
12,336.7 12,289.6 9.1 38.0
330
TENAGA NASIONAL BERHAD (200866-W)
Fina
ncia
l Sta
tem
ents
Annual Report 2012
Notes to the Financial Statements– 31 August 2012

46 FINANCIAL INSTRUMENTS CONTINUED
(a) Categories of financial instruments (continued)
Carrying L&R/
amount OL FVTPL AFS
2011 RM’million RM’million RM’million RM’million
Group
Financial assets
Unsecured loan stocks in associate 21.1 21.1 0 0
Investment in unquoted debt securities 164.0 164.0 0 0
Available-for-sale financial assets 38.0 0 0 38.0
Derivative financial instruments 91.4 0 91.4 0
Long term receivables 388.6 388.6 0 0
Trade and other receivables 6,022.1 6,022.1 0 0
Amounts due from associates 14.6 14.6 0 0
Financial assets at fair value through profit and loss 8.6 0 8.6 0
Deposits, bank and cash balances 3,954.2 3,954.2 0 0
10,702.6 10,564.6 100.0 38.0
Carrying L&R/
amount OL FVTPL AFS
(Restated) (Restated) (Restated) (Restated)
RM’million RM’million RM’million RM’million
Company
Financial assets
Unsecured loan stocks in associate 21.1 21.1 0 0
Investment in unquoted debt securities 164.0 164.0 0 0
Available-for-sale financial assets 38.0 0 0 38.0
Derivative financial instruments 1.5 0 1.5 0
Long term receivables 924.1 924.1 0 0
Trade and other receivables 3,724.9 3,724.9 0 0
Amounts due from subsidiaries 2,611.4 2,611.4 0 0
Amounts due from associates 14.6 14.6 0 0
Financial assets at fair value through profit and loss 8.6 0 8.6 0
Deposits, bank and cash balances 2,703.9 2,703.9 0 0
10,212.1 10,164.0 10.1 38.0
331
KEEPING THE LIGHTS ON
Fina
ncia
l Sta
tem
ents
Annual Report 2012
Notes to the Financial Statements– 31 August 2012

46 FINANCIAL INSTRUMENTS CONTINUED
(a) Categories of financial instruments (continued)
Carrying L&R/
amount OL FVTPL
2012 RM’million RM’million RM’million
Group
Financial liabilities
Payables 5,716.0 5,716.0 0
Amounts due to associates 697.9 697.9 0
Derivative financial instruments 21.5 0 21.5
Borrowings 23,071.8 23,071.8 0
Other liabilities 341.4 341.4 0
29,848.6 29,827.1 21.5
Company
Financial liabilities
Payables 3,478.9 3,478.9 0
Amounts due to subsidiaries 3,629.4 3,629.4 0
Amounts due to associates 697.9 697.9 0
Derivative financial instruments 21.5 0 21.5
Borrowings 11,494.9 11,494.9 0
Other liabilities 303.6 303.6 0
19,626.2 19,604.7 21.5
332
TENAGA NASIONAL BERHAD (200866-W)
Fina
ncia
l Sta
tem
ents
Annual Report 2012
Notes to the Financial Statements– 31 August 2012

46 FINANCIAL INSTRUMENTS CONTINUED
(a) Categories of financial instruments (continued)
Carrying L&R/
amount OL FVTPL
(Restated) (Restated) (Restated)
2011 RM’million RM’million RM’million
Group
Financial liabilities
Payables 5,527.0 5,527.0 0
Amounts due to associates 707.9 707.9 0
Derivative financial instruments 44.1 0 44.1
Borrowings 19,054.1 19,054.1 0
Other liabilities 395.3 395.3 0
25,728.4 25,684.3 44.1
Company
Financial liabilities
Payables 3,541.2 3,541.2 0
Amounts due to subsidiaries 4,076.4 4,076.4 0
Amounts due to associates 707.9 707.9 0
Derivative financial instruments 44.1 0 44.1
Borrowings 12,174.2 12,174.2 0
Other liabilities 309.6 309.6 0
20,853.4 20,809.3 44.1
(b) Net gains and losses arising from financial instruments
Group Company
2012 2011 2012 2011
RM’million RM’million RM’million RM’million
Net gains/(losses) on:
Financial assets at fair value through profit and loss 39.7 64.8 21.0 28.2
Loans and receivables 16.5 0 (11.7) (31.4)
Financial liabilities measured at amortised cost – Borrowings (6.1) 13.3 (2.8) (1.9)
50.1 78.1 6.5 (5.1)
333
KEEPING THE LIGHTS ON
Fina
ncia
l Sta
tem
ents
Annual Report 2012
Notes to the Financial Statements– 31 August 2012

46 FINANCIAL INSTRUMENTS CONTINUED
(c) Financial risk management
The Group has exposure to the following risks from its use of financial instruments:
• Credit risk;
• Liquidity risk; and
• Market risk
Credit risk
Credit risk is the risk of a financial loss to the Group if a customer or counterparty to a financial instrument fails to meet its
contractual obligations. The Group’s exposure to credit risk arises principally from its receivables from customers, deposits,
bank and cash balances, derivative instruments and investment securities. In addition, the Company’s exposure to credit risk
arises principally from loans and advances to subsidiaries and financial guarantees given to banks for credit facilities granted
to subsidiaries.
(i) Receivables
Risk management objectives, policies and processed for managing the risk
Management has a credit policy in place and the exposure to credit risk is monitored on an ongoing basis. Normally
financial guarantees given by banks, shareholders or directors of customers are obtained, and credit evaluations are
performed on customers requiring credit over a certain amount.
Exposure to credit risk
The Group’s and the Company’s credit policy provides trade receivables with a 30 days (2011: 30 days) credit period. The
Group has no major significant concentration of credit risk due to its diverse customer base. An allowance has been made
for estimated unrecoverable amounts, determined by reference to past default experience of individual debtors and
collective portfolio.
The total trade receivables and impairment provided are as follows:
Group Company
2012 2011 2012 2011
RM’million RM’million RM’million RM’million
Trade receivables 6,417.0 5,426.7 5,231.1 4,088.1
Less: Impairment losses (573.1) (607.7) (490.2) (530.3)
5,843.9 4,819.0 4,740.9 3,557.8
Given the varied nature of the Group’s customer base, the following analysis of trade receivables by type of customer is
considered the most appropriate disclosure of credit concentrations.
334
TENAGA NASIONAL BERHAD (200866-W)
Fina
ncia
l Sta
tem
ents
Annual Report 2012
Notes to the Financial Statements– 31 August 2012

46 FINANCIAL INSTRUMENTS CONTINUED
(c) Financial risk management (continued)
Credit risk (continued)
(i) Receivables (continued)
Exposure to credit risk (continued)
Group Company
2012 2011 2012 2011
RM’million RM’million RM’million RM’million
Industrial 2,368.0 1,826.0 1,795.0 1,176.1
Commercial 2,578.5 2,001.4 2,141.9 1,587.6
Domestic 1,312.1 1,396.8 1,188.5 1,217.7
Specific agriculture 20.1 10.2 20.1 10.2
Mining 4.4 2.0 4.4 2.0
Public lighting 90.1 110.3 81.2 94.5
Others 43.8 80.0 0 0
6,417.0 5,426.7 5,231.1 4,088.1
The net trade receivables are denominated in the following currencies:
Group Company
2012 2011 2012 2011
RM’million RM’million RM’million RM’million
MYR 5,519.4 4,551.5 4,740.9 3,557.8
USD 13.2 10.5 0 0
PKR 310.9 257.0 0 0
Others 0.4 0 0 0
335
KEEPING THE LIGHTS ON
Fina
ncia
l Sta
tem
ents
Annual Report 2012
Notes to the Financial Statements– 31 August 2012

46 FINANCIAL INSTRUMENTS CONTINUED
(c) Financial risk management (continued)
Credit risk (continued)
(i) Receivables (continued)
Impairment losses
The ageing of trade receivables as at the end of the reporting period was:
Individual Collective
Gross impairment impairment Net
2012 RM’million RM’million RM’million RM’million
Group
Not past due 4,473.9 (1.0) (0.2) 4,472.7
Past due 0-30 days 426.5 (1.8) (0.3) 424.4
Past due 31-120 days 720.9 (4.4) (1.3) 715.2
Past due 121-240 days 219.3 (15.7) (2.0) 201.6
Past due more than 240 days 576.4 (476.9) (69.5) 30.0
6,417.0 (499.8) (73.3) 5,843.9
Company
Not past due 3,862.6 (0.9) (0.2) 3,861.5
Past due 0-30 days 314.2 (1.5) (0.3) 312.4
Past due 31-120 days 406.1 (4.3) (1.0) 400.8
Past due 121-240 days 183.3 (15.1) (2.0) 166.2
Past due more than 240 days 464.9 (410.3) (54.6) 0
5,231.1 (432.1) (58.1) 4,740.9
336
TENAGA NASIONAL BERHAD (200866-W)
Fina
ncia
l Sta
tem
ents
Annual Report 2012
Notes to the Financial Statements– 31 August 2012

46 FINANCIAL INSTRUMENTS CONTINUED
(c) Financial risk management (continued)
Credit risk (continued)
(i) Receivables (continued)
Impairment losses (continued)
Individual Collective
Gross impairment impairment Net
2011 RM’million RM’million RM’million RM’million
Group
Not past due 3,493.0 (2.4) (0.5) 3,490.1
Past due 0-30 days 575.0 (1.4) (0.3) 573.3
Past due 31-120 days 602.6 (5.5) (1.1) 596.0
Past due 121-240 days 249.0 (87.9) (2.0) 159.1
Past due more than 240 days 507.1 (429.7) (76.9) 0.5
5,426.7 (526.9) (80.8) 4,819.0
Company
Not past due 2,781.6 (2.4) (0.5) 2,778.7
Past due 0-30 days 293.9 (1.4) (0.3) 292.2
Past due 31-120 days 384.2 (5.0) (1.1) 378.1
Past due 121-240 days 198.0 (87.2) (2.0) 108.8
Past due more than 240 days 430.4 (387.8) (42.6) 0
4,088.1 (483.8) (46.5) 3,557.8
Trade receivables that are neither past due nor impaired
With respect to the trade receivables that are neither past due nor impaired, there is no indication as of the reporting
date that the debtors will not meet their payment obligations. The quality of these trade receivables is such that
management believes no impairment is necessary, except in situations where they are part of individually impaired trade
receivables.
Trade receivables that are past due but not impaired
Full allowance for impairment was not made in respect of these past due trade receivable based on the past historical
collection trends and available deposits.
337
KEEPING THE LIGHTS ON
Fina
ncia
l Sta
tem
ents
Annual Report 2012
Notes to the Financial Statements– 31 August 2012

46 FINANCIAL INSTRUMENTS CONTINUED
(c) Financial risk management (continued)
Credit risk (continued)
(i) Receivables (continued)
Impairment losses (continued)
The movements in the allowance for impairment losses of trade receivables during the financial year were:
Group Company
2012 2011 2012 2011
RM’million RM’million RM’million RM’million
At 1 September (607.7) (576.7) (530.3) (500.3)
Impairment loss recognised (96.4) (36.4) (85.1) (30.0)
Impairment loss reversed 131.0 5.4 125.2 0
At 31 August (573.1) (607.7) (490.2) (530.3)
The movements in the allowance for impairment losses of other receivables during the financial year were:
Group Company
2012 2011 2012 2011
RM’million RM’million RM’million RM’million
At 1 September (109.8) (64.8) (82.0) (64.8)
Impairment loss recognised (26.5) (64.1) (26.5) (36.3)
Impairment loss reversed 10.1 19.1 0 19.1
At 31 August (126.2) (109.8) (108.5) (82.0)
Trade receivables are secured by deposits in the form of cash and bank guarantees. The deposits amount are reviewed
on an individual basis periodically.
(ii) Investments, deposits, bank and cash balances and derivative instruments
Risk management objectives, policies and processes for managing the risk
Investments and deposits, bank and cash balances are allowed only in liquid securities and only with reputable financial
institutions. Transactions involving derivative financial instruments are with approved financial institutions.
Exposure to credit risk, credit quality and collateral
The maximum exposure to credit risk is represented by the carrying amounts in the statements of financial position.
In view of the sound credit rating of counterparties, management does not expect any counterparty to fail to meet its
obligations. The Group does not have overdue investments that have not been impaired.
The investments, deposits, cash and bank balances and derivative instruments are unsecured.
338
TENAGA NASIONAL BERHAD (200866-W)
Fina
ncia
l Sta
tem
ents
Annual Report 2012
Notes to the Financial Statements– 31 August 2012

46 FINANCIAL INSTRUMENTS CONTINUED
(c) Financial risk management (continued)
Credit risk (continued)
(iii) Financial guarantees
Risk management objectives, policies and processes for managing the risk
The Company provides unsecured financial guarantees to banks in respect of banking facilities granted to certain
subsidiaries and associates. The Company monitors on an ongoing basis the results and repayments made by the
subsidiaries and associates.
Exposure to credit risk, credit quality and collateral
The maximum exposure to credit risk amounts to RM8.7 million (2011: RM269.8 million) and RM2,766.5 million (2011:
RM2,766.2 million) for the Group and Company respectively representing the total banking facilities limit of the
subsidiaries and associates as at end of the reporting period.
As at end of the reporting period, there was no indication that any subsidiary or associate would default on repayment.
The financial guarantees have not been recognised since the fair value on initial recognition is not material as the
probability of the subsidiaries and associates defaulting on its banking facilities is remote.
(iv) Intercompany balances
Risk management objectives, policies and processes for managing the risk
The Company provides unsecured loans and advances to subsidiaries. The Company monitors the results of the
subsidiaries regularly.
Exposure to credit risk, credit quality and collateral
As at the end of the reporting period, the maximum exposure to credit risk is represented by their carrying amounts in
the statements of financial position.
Loans and advances are only provided to subsidiaries by the Company.
Impairment losses
As at the end of the reporting period, there was no indication that the loans and advances to the subsidiaries are not
recoverable other than those which have already been impaired. The Company does not specifically monitor the ageing
of current advances to the subsidiaries. Nevertheless, these advances have been overdue for less than a year. Non-current
loans to subsidiaries are neither past due nor impaired.
Liquidity risk
Liquidity risk is the risk that the Group will not be able to meet its financial obligations as they fall due. The Group’s exposure
to liquidity risk arises principally from its various payables, loans and borrowings.
The Group maintains a level of cash and cash equivalents and bank facilities deemed adequate by the management to ensure,
as far as possible, that it will have sufficient liquidity to meet its liabilities when they fall due.
339
KEEPING THE LIGHTS ON
Fina
ncia
l Sta
tem
ents
Annual Report 2012
Notes to the Financial Statements– 31 August 2012

46 FINANCIAL INSTRUMENTS CONTINUED
(c) Financial risk management (continued)
Liquidity risk (continued)
The table below summarises the maturity profile of the Group’s financial liabilities as at the end of the reporting period based
on the undiscounted contractual payments:
Contractual
Carrying interest/ Contractual Under 1 More than 5
amount Coupon rate cash flows year 1-2 years 2-5 years years
2012 RM’million RM’million RM’million RM’million RM’million RM’million
Group
Non-derivative
financial liabilities
Payables 5,716.0 0% 5,716.0 5,716.0 0 0 0
Amounts due to associates 697.9 0% 677.0 697.9 0 0 0
Borrowings 23,071.8 0.8% to 15.0% 31,978.9 2,318.1 1,786.4 6,194.4 21,680.0
Other liabilities 341.4 0% 341.4 83.5 71.7 186.2 0
29,827.1 38,713.3 8,815.5 1,858.1 6,380.6 21,680.0
Derivative financial
liabilities
Interest rate swap 21.5 3.8% 26.6 15.9 8.9 1.8 0
29,848.6 38,739.9 8,831.4 1,867.0 6,382.4 21,680.0
340
TENAGA NASIONAL BERHAD (200866-W)
Fina
ncia
l Sta
tem
ents
Annual Report 2012
Notes to the Financial Statements– 31 August 2012

46 FINANCIAL INSTRUMENTS CONTINUED
(c) Financial risk management (continued)
Liquidity risk (continued)
The table below summarises the maturity profile of the Company’s financial liabilities as at the end of the reporting period
based on the undiscounted contractual payments (continued):
Contractual
Carrying interest/ Contractual Under 1 More than 5
amount Coupon rate cash flows year 1-2 years 2-5 years years
2012 RM’million RM’million RM’million RM’million RM’million RM’million
Company
Non-derivative
financial liabilities
Payables 3,478.9 0% 3,478.9 3,478.9 0 0 0
Amounts due to subsidiaries 3,629.4 0.7% to 5.3% 0 758.1 182.0 1,474.9 1,214.4
Amounts due to associates 697.9 0% 677.0 697.9 0 0 0
Borrowings 11,494.9 0.8% to 15.0% 16,274.2 1,135.6 973.3 2,521.0 11,644.3
Other liabilities 303.6 0% 303.6 45.7 71.7 186.2 0
19,604.7 20,733.7 6,116.2 1,227.0 4,182.1 12,858.7
Derivative financial
liabilities
Interest rate swap 21.5 3.8% 26.6 15.9 8.9 1.8 0
19,626.2 20,760.3 6,132.1 1,235.9 4,183.9 12,858.7
341
KEEPING THE LIGHTS ON
Fina
ncia
l Sta
tem
ents
Annual Report 2012
Notes to the Financial Statements– 31 August 2012

46 FINANCIAL INSTRUMENTS CONTINUED
(c) Financial risk management (continued)
Liquidity risk (continued)
The table below summarises the maturity profile of the Group’s financial liabilities as at the end of the reporting period based
on the undiscounted contractual payments (continued):
Contractual
Carrying interest/ Contractual Under 1 More than 5
amount coupon rate cash flows year 1-2 years 2-5 years years
2011 RM’million RM’million RM’million RM’million RM’million RM’million
Group
Non-derivative
financial liabilities
Payables 5,527.0 0% 5,527.0 5,527.0 0 0 0
Amounts due to associates 707.9 0% 696.8 707.9 0 0 0
Borrowings 19,054.1 0.8% to 15.5% 18,618.8 1,543.5 1,078.3 3,654.6 12,342.4
Other liabilities 435.9 0% 435.9 55.6 106.2 274.1 0
25,724.9 25,278.5 7,834.0 1,184.5 3,928.7 12,342.4
Derivative financial
liabilities
Interest rate swap 44.1 3.8% 40.9 19.0 13.1 7.3 1.5
Forward exchange
contracts
(gross settled):
Outflows 0 86.3 86.3 0 0 0
Inflows (1.5) (87.8) (87.8) 0 0 0
25,767.5 25,317.9 7,851.5 1,197.6 3,936.0 12,343.9
342
TENAGA NASIONAL BERHAD (200866-W)
Fina
ncia
l Sta
tem
ents
Annual Report 2012
Notes to the Financial Statements– 31 August 2012

46 FINANCIAL INSTRUMENTS CONTINUED
(c) Financial risk management (continued)
Liquidity risk (continued)
The table below summarises the maturity profile of the Company’s financial liabilities as at the end of the reporting period
based on the undiscounted contractual payments (continued):
Contractual
Carrying interest/ Contractual Under 1 More than 5
amount Coupon rate cash flows year 1-2 years 2-5 years years
2011 RM’million RM’million RM’million RM’million RM’million RM’million
Company
Non-derivative
financial liabilities
Payables 3,541.2 0% 3,541.2 3,541.2 0 0 0
Amount due to subsidiaries 4,076.4 0.5% to 5.3% 0 1,608.6 176.2 1,351.2 940.4
Amount due to associates 707.9 0% 696.9 707.9 0 0 0
Borrowings 12,174.2 0.8% to 8.3% 12,064.5 824.5 637.4 1,462.2 9,140.4
Other liabilities 309.6 0% 309.6 30.3 80.9 198.4 0
20,809.3 16,612.2 6,712.5 894.5 3,011.8 10,080.8
Derivative financial
liabilities
Interest rate swap 44.1 3.8% 40.9 19.0 13.1 7.3 1.5
Forward exchange
contracts
(gross settled):
Outflows 0 86.3 86.3 0 0 0
Inflows (1.5) (87.8) (87.8) 0 0 0
20,851.9 16,651.6 6,730.0 907.6 3,019.1 10,082.3
343
KEEPING THE LIGHTS ON
Fina
ncia
l Sta
tem
ents
Annual Report 2012
Notes to the Financial Statements– 31 August 2012

46 FINANCIAL INSTRUMENTS CONTINUED
(c) Financial risk management (continued)
Market risk
Market risk is the risk that changes in market prices, such as foreign exchange rates, interest rates and other prices will affect
the Group’s financial position or cash flows.
(i) Foreign currency risk
The Group is exposed to foreign currency risk on sales, purchases and borrowings that are denominated in a currency
other than the respective functional currencies of Group entities. The currencies giving rise to this risk are primarily US
Dollar (USD), Japanese Yen (JPY), European Dollar (EURO) and Pakistani Rupees (PKR).
Risk management objectives, policies and processes for managing the risk
The Group is required to hedge a minimum of 50.0% of TNB’s known foreign currency exposure up to 12 months period.
The Group uses forward exchange contracts and other financial derivatives to hedge its foreign currency risk. Most of the
forward exchange contracts have maturities of less than three months.
Exposure to foreign currency risk
The currency exposure of financial assets and financial liabilities of the Group and Company that are not denominated
in the functional currency of the respective companies is set out below.
USD JPY EURO Others
RM’million RM’million RM’million RM’million
Group
2012
Financial assets
Receivables, deposits and prepayments 13.2 0 0 311.3
Deposits, bank and cash balances 2.1 0.0 32.7 16.3
Derivative financial instruments 116.3 0 0 0
131.6 0.0 32.7 327.6
Financial liabilities
Borrowings 2,876.8 5,221.2 0 23.1
Derivative financial instruments 21.5 0 0 0
2,898.3 5,221.2 0 23.1
344
TENAGA NASIONAL BERHAD (200866-W)
Fina
ncia
l Sta
tem
ents
Annual Report 2012
Notes to the Financial Statements– 31 August 2012

46 FINANCIAL INSTRUMENTS CONTINUED
(c) Financial risk management (continued)
Market risk (continued)
(i) Foreign currency risk (continued)
USD JPY EURO Others
RM’million RM’million RM’million RM’million
Group
2011
Financial assets
Receivables, deposits and prepayments 10.5 0 0 257.0
Deposits, bank and cash balances 0 0 0 15.6
Derivative financial instruments 89.9 0 0 0
Forward foreign currency 0.3 1.2 0 0
100.7 1.2 0 272.6
Financial liabilities
Borrowings 2,909.9 5,457.9 0 25.8
Derivative financial instruments 44.1 0 0 0
2,954.0 5,457.9 0 25.8
Company
2012
Financial assets
Amounts due from subsidiaries 151.9 0 0 0
Financial liabilities
Amounts due to subsidiaries 0 0 0 0
Borrowings 1,301.5 4,177.3 0 0
Derivative financial instruments 21.5 0 0 0
1,323.0 4,177.3 0 0
345
KEEPING THE LIGHTS ON
Fina
ncia
l Sta
tem
ents
Annual Report 2012
Notes to the Financial Statements– 31 August 2012

46 FINANCIAL INSTRUMENTS CONTINUED
(c) Financial risk management (continued)
Market risk (continued)
(i) Foreign currency risk (continued)
USD JPY EURO Others
RM’million RM’million RM’million RM’million
Company
2011
Financial assets
Amounts due from subsidiaries 475.7 0 0 0.2
Forward foreign currency 0.3 1.2 0 0
476.0 1.2 0 0.2
Financial liabilities
Amounts due to subsidiaries 33.5 0 0 0
Borrowings 1,239.0 4,318.1 0 0
Derivative financial instruments 44.1 0 0 0
1,316.6 4,318.1 0 0
Currency risk sensitivities analysis
A 10.0% strengthening of the foreign currencies against MYR at the end of the reporting period would have increased/
(decreased) pre-tax profit or loss by the amounts shown below. This analysis assumes that all other variables, in particular
interest rates, remained constant and ignores any impact of forecasted sale and purchases.
Profit or loss
2012 2011
Group RM’million RM’million
USD (418.9) (130.6)
JPY (1,063.9) (792.4)
Company
USD (190.6) (79.6)
JPY (513.8) (431.8)
346
TENAGA NASIONAL BERHAD (200866-W)
Fina
ncia
l Sta
tem
ents
Annual Report 2012
Notes to the Financial Statements– 31 August 2012

46 FINANCIAL INSTRUMENTS CONTINUED
(c) Financial risk management (continued)
Market risk (continued)
(i) Foreign currency risk (continued)
A 10.0% weakening of the foreign currencies against MYR at the end of the reporting period would have had equal but
opposite effect on the above currencies to the amounts shown above, on the basis that all other variables remained
constant.
Nevertheless, foreign currency risk arises from Group entities which have a functional currency other than MYR is not
material and hence, sensitivity analysis is not presented.
(ii) Interest rate risk
The Group’s investment in fixed rate debt securities and its fixed rate borrowing are exposed to a risk of change in their
fair value due to changes in interest rates. The Group’s variable rate borrowings are exposed to a risk of change in cash
flows due to changes in interest rates. Investment in equity securities and short-term receivables and payables are not
significantly exposed to interest rate risk.
Risk management objectives, policies and processes for managing the risk
The Group has entered into interest rate swap with an outstanding notional contract amount of RM462.3 million (2011:
RM616.6 million) in order to achieve an appropriate mix of fixed and floating rate exposure within the Group’s policy.
Such interest rate swaps have the economic effect of converting borrowings from floating rates to fixed rates. Generally,
the group raises long-term borrowings at floating rates and swaps them into fixed rates that are lower than those
available if the Group borrowed at fixed rates directly. Under the interest rate swaps, the Group agrees with other parties
to exchange, at specified intervals (semi-annually), the difference between fixed contract rates and floating-rate interest
amounts calculated by reference to the agreed notional amounts.
Exposure to interest rate risk
The interest rate profile of the Group’s and the Company’s significant interest-bearing financial instruments, based on
carrying amounts as at the end of the reporting period were:
Group Company
2012 2011 2012 2011
RM’million RM’million RM’million RM’million
Fixed rate instruments:
Financial assets 495.2 552.6 1,030.9 1,674.4
Financial liabilities 22,617.3 18,437.4 11,494.9 11,338.3
Floating rate instruments:
Financial assets 0 0 46.1 475.7
Financial liabilities 454.5 616.6 0 0
A change of 100 basis point (bp) in interest rates of the financial liabilities at the end of the reporting period would have
increased the finance cost to RM3.7 million (2011: RM5.3 million). However, this change has no impact to post-tax profit
or loss as the floating instrument have been fixed via Interest rate swap. This analysis assumes that all other variables, in
particular foreign currency rates, remained constant.
The financial assets are not sensitive to interest rate changes.
347
KEEPING THE LIGHTS ON
Fina
ncia
l Sta
tem
ents
Annual Report 2012
Notes to the Financial Statements– 31 August 2012

46 FINANCIAL INSTRUMENTS CONTINUED
(c) Financial risk management (continued)
Market risk (continued)
(ii) Interest rate risk (continued)
The exposure of financial assets of the Group to interest rate risk are as follows:
Balances Balances
under under
Non-Islamic Islamic
principles principles Total
Group RM’million RM’million RM’million
2012
Financial assets
Unsecured loan stocks in associate 15.9 0 15.9
Investment in unquoted debt securities 0 163.7 163.7
Long term receivables 419.2 0 419.2
Trade and other receivables 0 0 0
Deposits, bank and cash balances 2,233.4 5,558.6 7,792.0
2,668.5 5,722.3 8,390.8
2011
Financial assets
Unsecured loan stocks in associate 21.1 0 21.1
Investment in unquoted debt securities 0 164.0 164.0
Long term receivables 333.4 0 333.4
Trade and other receivables 50.6 0 50.6
Deposits, bank and cash balances 1,438.7 1,460.4 2,899.1
1,843.8 1,624.4 3,468.2
348
TENAGA NASIONAL BERHAD (200866-W)
Fina
ncia
l Sta
tem
ents
Annual Report 2012
Notes to the Financial Statements– 31 August 2012

46 FINANCIAL INSTRUMENTS CONTINUED
(c) Financial risk management (continued)
Market risk (continued)
(ii) Interest rate risk (continued)
The exposure of financial assets of the Company to interest rate risk are as follows: (continued)
Balances Balances
under under
Non-Islamic Islamic
principles principles Total
Company RM’million RM’million RM’million
2012
Financial assets
Unsecured loan stocks in associate 15.9 0 15.9
Investment in unquoted debt securities 0 163.7 163.7
Long term receivables 806.1 0 806.1
Trade and other receivables 45.0 0 45.0
Amounts due from subsidiaries 46.1 0 46.1
Deposits, bank and cash balances 1,453.0 2,063.8 3,516.8
2,366.1 2,227.5 4,593.6
2011
Financial assets
Unsecured loan stocks in associate 21.1 0 21.1
Investment in unquoted debt securities 0 164.0 164.0
Long term receivables 868.9 0 868.9
Trade and other receivables 50.6 0 50.6
Amounts due from subsidiaries 476.0 0 476.0
Deposits, bank and cash balances 733.5 1,460.4 2,193.9
2,150.1 1,624.4 3,774.5
349
KEEPING THE LIGHTS ON
Fina
ncia
l Sta
tem
ents
Annual Report 2012
Notes to the Financial Statements– 31 August 2012

46 FINANCIAL INSTRUMENTS CONTINUED
(c) Financial risk management (continued)
Market risk (continued)
(ii) Interest rate risk (continued)
The exposure of financial liabilities of the Group to interest rate risk are as follows: (continued)
Balances Balances
under under
Non-Islamic Islamic
principles principles Total
Group RM’million RM’million RM’million
2012
Financial liability
Borrowings 13,938.4 9,133.4 23,071.8
13,938.4 9,133.4 23,071.8
Total interest sensitivity gap (11,269.9) (3,411.1) (14,681.0)
2011
Financial liability
Borrowings 14,543.5 4,510.5 19,054.0
14,543.5 4,510.5 19,054.0
Total interest sensitivity gap (12,699.7) (2,886.1) (15,585.8)
350
TENAGA NASIONAL BERHAD (200866-W)
Fina
ncia
l Sta
tem
ents
Annual Report 2012
Notes to the Financial Statements– 31 August 2012

46 FINANCIAL INSTRUMENTS CONTINUED
(c) Financial risk management (continued)
Market risk (continued)
(ii) Interest rate risk (continued)
The exposure of financial liabilities of the Company to interest rate risk are as follows: (continued)
Balances Balances
under under
Non-Islamic Islamic
principles principles Total
Company RM’million RM’million RM’million
2012
Financial liabilities
Borrowings 9,308.6 2,186.3 11,494.9
Amounts due to subsidiaries 2,630.0 0 2,630.0
11,938.6 2,186.3 14,124.9
Total interest sensitivity gap (9,572.5) 41.2 (9,531.3)
2011
Financial liabilities
Borrowings 9,987.9 2,186.3 12,174.2
Amounts due to subsidiaries 2,644.0 0 2,644.0
12,631.9 2,186.3 14,818.2
Total interest sensitivity gap (10,481.8) (561.9) (11,043.7)
351
KEEPING THE LIGHTS ON
Fina
ncia
l Sta
tem
ents
Annual Report 2012
Notes to the Financial Statements– 31 August 2012

46 FINANCIAL INSTRUMENTS CONTINUED
(c) Financial risk management (continued)
Market risk (continued)
(ii) Interest rate risk (continued)
The table below summarises the effective weighted average interest rate as at 31 August 2012 and 31 August 2011 by
major currencies for each class of financial assets and financial liabilities.
USD JPY EURO RM Others
Group % % % % %
2012
Financial assets
Unsecured loan stocks in associate 0 0 0 12.0 0
Long term receivables 0 0 0 4.0 0
Trade and other receivables 0 0 0 4.0 0
Deposits, bank and cash balances 0 0 0.2 3.6 0
Financial liabilities
Borrowings 5.5 1.8 0 5.9 14.0
2011
Financial assets
Unsecured loan stocks in associate 0 0 0 12.0 0
Long term receivables 0 0 0 4.0 0
Trade and other receivables 0 0 0 4.0 0
Deposits, bank and cash balances 0 0 0 3.4 7.5
Financial liability
Borrowings 5.3 2.0 0 6.6 15.5
352
TENAGA NASIONAL BERHAD (200866-W)
Fina
ncia
l Sta
tem
ents
Annual Report 2012
Notes to the Financial Statements– 31 August 2012

46 FINANCIAL INSTRUMENTS CONTINUED
(c) Financial risk management (continued)
Market risk (continued)
(ii) Interest rate risk (continued)
The table below summarises the effective weighted average interest rate as at 31 August 2012 and 31 August 2011 by
major currencies for each class of financial asset and financial liabilities. (continued)
USD JPY EURO RM Others
Company % % % % %
2012
Financial assets
Unsecured loan stocks in associate 0 0 0 12.0 0
Long term receivables 0 0 0 11.2 0
Trade and other receivables 0 0 0 4.0 0
Amounts due from subsidiaries 3.0 0 0 5.0 0
Deposits, bank and cash balances 0 0 0 3.3 0
Financial liabilities
Amounts due to subsidiaries 0 0 0 3.7 0
Borrowings 7.4 1.3 0 6.1 0
2011
Financial assets
Unsecured loan stocks in associate 0 0 0 12.0 0
Long term receivables 0 0 0 11.2 0
Trade and other receivables 0 0 0 4.0 0
Amounts due from subsidiaries 2.5 0 0 5.0 0
Deposits, bank and cash balances 0 0 0 3.4 0
Financial liabilities
Amounts due to subsidiaries 0 0 0 4.5 0
Borrowings 7.7 1.5 0 6.2 0
353
KEEPING THE LIGHTS ON
Fina
ncia
l Sta
tem
ents
Annual Report 2012
Notes to the Financial Statements– 31 August 2012

46 FINANCIAL INSTRUMENTS CONTINUED
(c) Financial risk management (continued)
Market risk (continued)
(iii) Other price risk
Equity price risk arises from the Group’s investment in equity securities.
Risk management objectives, policies and processes for managing the risk
Management of the Group monitors the equity investments on an individual basis by fund managers. Material
investments within the portfolio are managed on an individual basis and all buy and sell decisions are approved by the
Risk Management Committee of the Group.
The results and cash flows of the Group and Company is significantly independent of equity price change.
Fair value of financial instruments
The carrying amounts of cash and cash equivalents, short term receivables and payables and short term borrowings
approximate their fair values and are equivalent to nominal values due to the relatively short term nature of these financial
instruments.
The carrying amount of non-current financial assets and liabilities of the Group and Company at the reporting date
approximated their fair value except as set out below:
2012 2011
Carrying Carrying
amount Fair value amount Fair value
RM’million RM’million RM’million RM’million
Group
Unsecured loan stocks in associate 15.9 16.4 21.1 24.4
Investment in unquoted debt securities 163.7 347.6 164.0 388.5
Long term receivables 419.2 209.4 388.6 292.3
Borrowings 23,071.8 22,318.4 19,054.1 19,784.2
Company
Unsecured loan stocks in associate 15.9 16.4 21.1 24.4
Investment in unquoted debt securities 163.7 347.6 164.0 388.5
Long term receivables 1,184.6 1,095.5 1,356.7 1,208.9
Borrowings 11,494.9 12,252.9 12,174.2 12,815.5
Amounts due to subsidiaries (non-current) 2,383.4 2,858.2 2,467.8 2,752.2
354
TENAGA NASIONAL BERHAD (200866-W)
Fina
ncia
l Sta
tem
ents
Annual Report 2012
Notes to the Financial Statements– 31 August 2012

46 FINANCIAL INSTRUMENTS CONTINUED
(c) Financial risk management (continued)
Fair value of financial instruments (continued)
The following summarises the methods used in determining the fair value of financial instruments reflected in the above table:
(i) Investments in equity and debt securities
The fair values of financial assets that are quoted in an active market are determined by reference to their quoted closing
price at the end of the reporting period. For investment in unquoted debt securities, fair value is calculated based on the
present value of future principal and interest cash flows, discounted at the market rate of interest at the end of the
reporting period.
(ii) Financial instruments
The fair value of forward exchange contracts is based on their quoted price, if available. If a quoted price is not available,
then fair value is estimated by the difference between the contractual forward price and the current forward price for
the residual maturity of the contract.
The fair value of interest rate swaps and currency options are based on figures provided by calculating agents/
counterparties. Those figures except for currency options are tested for reasonableness by discounting estimated future
cash flows based on the terms and maturity of each contract and using market interest rates for a similar instrument at
the measurement date.
(iii) Loans and borrowings
Fair value, which is determined for disclosure purposes, is calculated based on the present value of future principal and
interest cash flows, discounted at the market rate of interest at the end of the reporting period.
(iv) Interest rates used to determine fair value
The interest rates used to discount estimated cash flows, when applicable, ranges between 0.72% to 21.30% (2011: 0.49%
to 21.30%).
The table below analyses financial instruments carried at fair value, by valuation method.
The different levels have been defined as follows:
• Level 1: Quoted prices (unadjusted) in active markets for identical assets or liabilities.
• Level 2: Inputs other than quoted prices included within Level 1 that are observable for the asset or liability, either
directly (that is, as prices) or indirectly (that is, derived from prices).
• Level 3: Inputs for the asset or liability that are not based on observable market data (that is, unobservable inputs).
355
KEEPING THE LIGHTS ON
Fina
ncia
l Sta
tem
ents
Annual Report 2012
Notes to the Financial Statements– 31 August 2012

46 FINANCIAL INSTRUMENTS CONTINUED
(c) Financial risk management (continued)
The following table presents the Group’s and Company’s assets and liabilities that are measured at fair value at 31 August 2012.
Level 1 Level 2 Level 3 Total
RM’million RM’million RM’million RM’million
Group
Financial assets at fair value through profit and loss 9.1 0 0 9.1
Derivatives 0 116.3 0 116.3
Available-for-sale financial assets 0 38.0 0 38.0
Total assets 9.1 154.3 0 163.4
Derivatives 0 21.5 0 21.5
Total liabilities 0 21.5 0 21.5
Company
Financial assets at fair value through profit and loss 9.1 0 0 9.1
Available-for-sale financial assets 0 38.0 0 38.0
Total assets 9.1 38.0 0 47.1
Derivatives 0 21.5 0 21.5
Total liabilities 0 21.5 0 21.5
The unrealised gains/(losses) have been recognised in other operating expenses in profit or loss.
Although the Group believes that its estimates of fair value are appropriate, the use of different methodologies or assumptions
could lead to different measurements of fair value.
The favourable and unfavourable effects of using reasonably possible alternative assumptions have been calculated by
recalibrating the model values using expected cash flows and risk-adjusted discount rate based on the probability weighted
average of the Group’s ranges of possible outcomes.
356
TENAGA NASIONAL BERHAD (200866-W)
Fina
ncia
l Sta
tem
ents
Annual Report 2012
Notes to the Financial Statements– 31 August 2012

47 CAPITAL RISK MANAGEMENT
The Group’s and Company’s main objective of capital management is to safeguard the Group’s and Company’s ability to continue
as a going concern in order to provide returns for shareholders and benefits for other stakeholders. The Group and Company will
also strive to maintain an optimal capital structure to reduce the cost of capital.
For the purpose of sustaining or changing the capital structure, the Group and Company may adjust the amount of dividends paid
to shareholders, issue new shares or return capital to shareholders.
In order to be consistent with industry norms, the Group and Company monitors its capital structure on the basis of the gearing
ratio. This ratio is calculated as total borrowings divided by capital employed. Total borrowings include non-current and current
borrowings as shown in the consolidated statement of financial position. Capital employed is the summation of total equity and
total borrowings.
The gearing ratios as at 31 August were as follows:
Group Company
2012 2011 2012 2011
(Restated) (Restated)
RM’million RM’million RM’million RM’million
Total borrowings 23,114.9 19,108.9 11,494.9 12,174.2
Total equity 36,398.3 32,229.4 32,437.8 29,326.1
Total capital employed 59,513.2 51,338.3 43,932.7 41,500.3
Gearing ratios 0.39 0.37 0.26 0.29
The gearing ratio as at 31 August 2012 was relatively consistent to prior year.
357
KEEPING THE LIGHTS ON
Fina
ncia
l Sta
tem
ents
Annual Report 2012
Notes to the Financial Statements– 31 August 2012

48 CHANGES IN ACCOUNTING POLICIES AND PRIOR YEAR ADJUSTMENT
The Group and Company have adopted IC 4 “Determining Whether an Arrangement Contains a Lease”, which prescribes that the
determination of whether an arrangement is or contains a lease shall be based on the substance of the arrangement. It requires an
assessment of whether the fulfilment of the arrangement is dependent on the use of specific assets and the arrangement conveys
a right to use such assets. The adoption of IC 4 has resulted in certain contractual arrangements on electricity supply and power
purchase of the Company and the Group’s subsidiaries being accounted for as finance or operating leases. In prior financial years,
these arrangements were accounted for as normal sale and purchase contracts.
The change in accounting policy has been applied retrospectively with comparative figures restated accordingly.
At 31 August 2011 At 1 September 2010
Previously Previously
reported Effect of Restated reported Effect of Restated
as at adoption as at as at adoption as at
31.8.2011 of IC 4 31.8.2011 1.9.2010 of IC 4 1.9.2010
RM’million RM’million RM’million RM’million RM’million RM’million
Consolidated statements of
changes in equity
Group
Retained profits 19,701.5 1,817.3 21,518.8 20,020.6 1,351.4 21,372.0
Non-controlling interests 91.6 140.4 232.0 42.9 148.3 191.2
Company
Retained profits 18,630.5 (134.9) 18,495.6 19,030.5 (294.6) 18,735.9
In addition, during the financial year, the Group made certain reclassifications to the comparatives to conform to current year
presentation in the financial statements, providing more relevant information about the effects of the transaction on the Group’s
financial position.
358
TENAGA NASIONAL BERHAD (200866-W)
Fina
ncia
l Sta
tem
ents
Annual Report 2012
Notes to the Financial Statements– 31 August 2012

48 CHANGES IN ACCOUNTING POLICIES AND PRIOR YEAR ADJUSTMENTS CONTINUED
Changes in accounting policies and reclassifications
The change in accounting policy and reclassifications had resulted in the changes in financial position and results as set out below:
Balances as at 31 August 2011
Previously Effect of
reported adoption Change in Restated
as at of classifi- as at
31.8.2011 IC 4 cation 31.8.2011
Group RM’million RM’million RM’million RM’million
Non-current assets
Property, plant and equipment 60,569.5 1,291.9 0 61,861.4
Prepaid leases 0 3,161.0 0 3,161.0
Current liabilities
Payables (5,585.6) 0 14.2 (5,571.4)
Finance lease obligation 0 (34.9) (14.2) (49.1)
Non-current liabilities
Deferred tax liabilities (7,155.1) (697.1) 0 (7,852.2)
Finance lease obligation 0 (1,293.7) (40.6) (1,334.3)
Other liabilities (481.1) (469.5) 40.6 (910.0)
Company
Non-current assets
Property, plant and equipment 50,501.2 9,981.8 0 60,483.0
Investment in subsidiaries 4,451.8 0 (535.5) 3,916.3
Long term receivables 821.2 0 267.1 1,088.3
Prepaid leases 0 2,930.3 0 2,930.3
Current assets
Amount due from subsidiaries 2,178.8 0 268.4 2,447.2
Current liabilities
Finance lease obligation 0 (384.8) 0 (384.8)
Non-current liabilities
Deferred tax liabilities (6,175.5) 45.0 0 (6,130.5)
Finance lease obligation 0 (12,565.5) 0 (12,565.5)
Other liabilities (354.8) (141.7) 0 (496.5)
359
KEEPING THE LIGHTS ON
Fina
ncia
l Sta
tem
ents
Annual Report 2012
Notes to the Financial Statements– 31 August 2012

48 CHANGES IN ACCOUNTING POLICIES AND PRIOR YEAR ADJUSTMENTS CONTINUED
Changes in accounting policies and reclassifications (continued)
The change in accounting policy and reclassifications had resulted in the changes in financial position and results as set out below:
(continued)
Balances as at 1 September 2010
Previously Effect of
reported adoption Change in Restated
as at of classifi- as at
1.9.2010 IC 4 cation 1.9.2010
Group RM’million RM’million RM’million RM’million
Non-current assets
Prepaid leases 0 2,606.1 0 2,606.1
Current liabilities
Finance lease obligation 0 0 (2.6) (2.6)
Non-current liabilities
Deferred tax liabilities (7,270.8) (545.1) 0 (7,815.9)
Other liabilities (536.4) (561.3) 66.1 (1,031.6)
Finance lease obligation 0 0 (63.5) (63.5)
Company
Non-current assets
Property, plant and equipment 49,489.2 10,539.6 0 60,028.8
Investment in subsidiaries 3,978.9 0 (535.5) 3,443.4
Long term receivables 616.2 0 535.5 1,151.7
Prepaid leases 0 2,380.0 0 2,380.0
Current liabilities
Finance lease obligation 0 (163.0) 0 (163.0)
Non-current liabilities
Deferred tax liabilities (6,302.6) 98.3 0 (6,204.3)
Finance lease obligation 0 (12,950.3) 0 (12,950.3)
Other liabilities (368.0) (199.2) 0 (567.2)
360
TENAGA NASIONAL BERHAD (200866-W)
Fina
ncia
l Sta
tem
ents
Annual Report 2012
Notes to the Financial Statements– 31 August 2012

48 CHANGES IN ACCOUNTING POLICIES AND PRIOR YEAR ADJUSTMENTS CONTINUED
Changes in accounting policies and reclassifications (continued)
The change in accounting policy and reclassifications had resulted in the changes in income statements and results as set out
below:
For the financial year ended 31 August 2011
As
previously Effect of As
reported adoption restated
as at of as at
31.8.2011 IC 4 31.8.2011
Consolidated income statements RM’million RM’million RM’million
Group
Revenue 32,206.9 34.3 32,241.2
Operating expenses (31,582.8) 626.4 (30,956.4)
Finance cost (827.8) (50.7) (878.5)
Deferred taxation 90.0 (152.0) (62.0)
Non-controlling interests 7.0 (7.9) (0.9)
Company
Operating expenses (30,109.6) 1,330.3 (28,779.3)
Finance cost (594.2) (1,117.3) (1,711.5)
Deferred taxation 16.5 (53.3) (36.8)
361
KEEPING THE LIGHTS ON
Fina
ncia
l Sta
tem
ents
Annual Report 2012
Notes to the Financial Statements– 31 August 2012

48 CHANGES IN ACCOUNTING POLICIES AND PRIOR YEAR ADJUSTMENTS CONTINUED
Changes in accounting policies and reclassifications (continued)
The impact of the adoption of IC 4 to the financial position and results for the financial year ended 31 August 2012 is set out below:
Consolidated Statements of Financial Position Increase/(Decrease)
to balances as at 31 August 2012
Group RM’million
Property, plant and equipment (62.5)
Prepaid leases 628.3
Other liabilities 36.1
Deferred tax liabilities 150.7
Finance lease obligation:
– Non-current liabilities 17.5
– Current liabilities 4.7
Company
Property, plant and equipment (557.8)
Prepaid leases 608.8
Other liabilities 6.2
Deferred tax liabilities 107.4
Finance lease obligation:
– Non-current liabilities (671.6)
– Current liabilities 286.8
362
TENAGA NASIONAL BERHAD (200866-W)
Fina
ncia
l Sta
tem
ents
Annual Report 2012
Notes to the Financial Statements– 31 August 2012

48 CHANGES IN ACCOUNTING POLICIES AND PRIOR YEAR ADJUSTMENTS CONTINUED
Changes in accounting policies and reclassifications (continued)
The impact of the adoption of IC 4 to the income statements and results for the financial year ended 31 August 2012 is set out
below:
Consolidated Income Statements Increase/(Decrease)
for the financial year ended 31 August 2012
Group RM’million
Revenue (29.9)
Operating expenses (654.8)
Finance cost 117.4
Deferred taxation 150.7
Non-controlling interests 13.0
Company
Operating expenses (1,473.0)
Finance cost 1,043.4
Deferred taxation 107.4
The adoption of IC 4 did not result in any cash impact to the financial year ended 31 August 2011 and 31 August 2012.
363
KEEPING THE LIGHTS ON
Fina
ncia
l Sta
tem
ents
Annual Report 2012
Notes to the Financial Statements– 31 August 2012

The following analysis of realised and unrealised profits or losses at the legal entity level is prepared in accordance with Guidance on
Special Matter No. 1, Determination of Realised and Unrealised Profits or Losses in the Context of Disclosure Pursuant to Bursa Malaysia
Securities Berhad Listing Requirements, as issued by the Malaysian Institute of Accountants.
Total retained profits of Tenaga Nasional Berhad:
Group Company
2012 2011 2012 2011
(Restated) (Restated)
RM’million RM’million RM’million RM’million
Retained profits
– Realised 29,472.8 26,186.9 27,013.0 23,694.6
– Unrealised
(7,299.5) (6,836.9) (5,657.8) (5,199.0)
Total share of retained profits from jointly controlled entities:
– Realised
(10.2) (10.1) 0 0
Total share of retained profits from associates:
– Realised 225.0 270.8 0 0
– Unrealised (115.5) (103.6) 0 0
Consolidation adjustment 3,185.3 2,011.7 0 0
Total retained profits 25,457.9 21,518.8 21,355.2 18,495.6
The disclosure of realised and unrealised profits above is solely for compliance with the directive issued by the Bursa Malaysia Securities
Berhad and should not be used for any other purpose.
364
TENAGA NASIONAL BERHAD (200866-W)
Fina
ncia
l Sta
tem
ents
Annual Report 2012
Supplementary Information Disclosed Pursuant to Bursa Malaysia Securities Berhad Listing Requirements

We, Tan Sri Leo Moggie and Datuk Wira Ir. Azman Mohd, two of the Directors of Tenaga Nasional Berhad, do hereby state that, in the
opinion of the Directors, the financial statements set out on pages 224 to 363 are drawn up so as to give a true and fair view of the
state of affairs of the Group and of the Company as at 31 August 2012 and of the results and the cash flows of the Group and of the
Company for the financial year ended on that date in accordance with the MASB Approved Accounting Standards in Malaysia for Entities
Other than Private Entities and the provisions of the Companies Act, 1965.
The supplementary information set out on page 364 have been prepared in accordance with the Guidance on Special Matter No.1,
Determination of Realised and Unrealised Profits or Losses in the Context of Disclosure Pursuant to Bursa Malaysia Securities Berhad
Listing Requirements, as issued by the Malaysian Institute of Accountants.
Signed on behalf of the Board of Directors, in accordance with their resolution dated 31 October 2012.
TAN SRI LEO MOGGIE DATUK WIRA IR. AZMAN MOHD
CHAIRMAN PRESIDENT/CHIEF EXECUTIVE OFFICER
I, Fazlur-Rahman Zainuddin, the person primarily responsible for the financial management of Tenaga Nasional Berhad, do solemnly and
sincerely declare that the financial statements set out on pages 224 to 363 are, in my opinion, correct and I make this solemn declaration
conscientiously believing the same to be true, and by virtue of the provisions of the Statutory Declarations Act, 1960.
FAZLURRAHMAN ZAINUDDIN
Subscribed and solemnly declared by the above named Fazlur-Rahman Zainuddin at Kuala Lumpur, Malaysia on 31 October 2012, before
me.
COMMISSIONER FOR OATHS
365
KEEPING THE LIGHTS ON
Fina
ncia
l Sta
tem
ents
Annual Report 2012
Statutory Declaration Pursuant to Section 169 (16) of the Companies Act, 1965
Statement by Directors Pursuant to Section 169 (15) of the Companies Act, 1965

REPORT ON THE FINANCIAL STATEMENTS
We have audited the financial statements of Tenaga Nasional Berhad on pages 224 to 363 which comprise the consolidated statements
of financial position as at 31 August 2012 of the Group and of the Company, and the consolidated statements of income, comprehensive
income, changes in equity and cash flows of the Group and of the Company for the financial year then ended, and a summary of
significant accounting policies and other explanatory notes, as set out on Notes 1 to 48.
Directors’ Responsibility for the Financial Statements
The Directors of the Company are responsible for the preparation of financial statements that give a true and fair view in accordance
with MASB Approved Accounting Standards in Malaysia for Entities Other than Private Entities and the Companies Act, 1965, and for
such internal control as the Directors determine is necessary to enable the preparation of financial statements that are free from material
misstatement, whether due to fraud or error.
Auditors’ Responsibility
Our responsibility is to express an opinion on these financial statements based on our audit. We conducted our audit in accordance with
approved standards on auditing in Malaysia. Those standards require that we comply with ethical requirements and plan and perform
the audit to obtain reasonable assurance whether the financial statements are free from material misstatement.
An audit involves performing procedures to obtain audit evidence about the amounts and disclosures in the financial statements. The
procedures selected depend on our judgement, including the assessment of risks of material misstatement of the financial statements,
whether due to fraud or error. In making those risk assessments, we consider internal control relevant to the entity’s preparation of
financial statements that give a true and fair view in order to design audit procedures that are appropriate in the circumstances, but not
for the purpose of expressing an opinion on the effectiveness of the entity’s internal control. An audit also includes evaluating the
appropriateness of accounting policies used and the reasonableness of accounting estimates made by the Directors, as well as evaluating
the overall presentation of the financial statements.
We believe that the audit evidence we have obtained is sufficient and appropriate to provide a basis for our audit opinion.
Opinion
In our opinion, the financial statements have been properly drawn up in accordance with MASB Approved Accounting Standards in
Malaysia for Entities Other than Private Entities and the Companies Act, 1965 so as to give a true and fair view of the financial position
of the Group and of the Company as of 31 August 2012 and of their financial performance and cash flows for the financial year then
ended.
REPORT ON OTHER LEGAL AND REGULATORY REQUIREMENTS
In accordance with the requirements of the Companies Act, 1965 in Malaysia, we also report the following:
(a) In our opinion, the accounting and other records and the registers required by the Act to be kept by the Company and its
subsidiaries of which we have acted as auditors have been properly kept in accordance with the provisions of the Act.
(b) We have considered the financial statements and the auditors’ reports of all the subsidiaries of which we have not acted as auditors,
which are indicated in Note 14 to the financial statements.
(c) We are satisfied that the financial statements of the subsidiaries that have been consolidated with the Company’s financial
statements are in form and content appropriate and proper for the purposes of the preparation of the financial statements of the
Group and we have received satisfactory information and explanations required by us for those purposes.
(d) The audit reports on the financial statements of the subsidiaries did not contain any qualification or any adverse comment made
under Section 174(3) of the Act.
366
TENAGA NASIONAL BERHAD (200866-W)
Fina
ncia
l Sta
tem
ents
Annual Report 2012
Independent Auditors’ Reportto the Members of Tenaga Nasional Berhad (Incorporated in Malaysia) (Company No. 200866-W)

OTHER REPORTING RESPONSIBILITIES
The supplementary information set out on page 364 is disclosed to meet the requirement of Bursa Malaysia Securities Berhad and is not
part of the financial statements. The Directors are responsible for the preparation of the supplementary information in accordance with
Guidance on Special Matter No. 1, Determination of Realised and Unrealised Profits or Losses in the Context of Disclosure Pursuant to
Bursa Malaysia Securities Berhad Listing Requirements, as issued by the Malaysian Institute of Accountants (“MIA Guidance”) and the
directive of Bursa Malaysia Securities Berhad. In our opinion, the supplementary information is prepared, in all material respects, in
accordance with the MIA Guidance and the directive of Bursa Malaysia Securities Berhad.
OTHER MATTERS
This report is made solely to the members of the Company, as a body, in accordance with Section 174 of the Companies Act, 1965 in
Malaysia and for no other purpose. We do not assume responsibility to any other person for the content of this report.
PRICEWATERHOUSECOOPERS NURUL A’IN BINTI ABDUL LATIF
(No. AF: 1146) (No. 2910/02/13(J))
Chartered Accountants Chartered Accountant
Kuala Lumpur
31 October 2012
367
KEEPING THE LIGHTS ON
Fina
ncia
l Sta
tem
ents
Annual Report 2012
Independent Auditors’ Reportto the Members of Tenaga Nasional Berhad (Incorporated in Malaysia) (Company No. 200866-W)

SHARE CAPITAL
Authorised Share Capital : 10,000,000,000 ordinary shares of RM1.00 each
One (1) Special Rights Redeemable Preference Share of RM1.00
1,000 Class A Redeemable Preference Shares of RM1.00 each
500 Class B Redeemable Preference Shares of RM1.00 each
Issued and Fully Paid-Up : 5,509,832,109 ordinary shares of RM1.00 each
Share Capital One (1) Special Rights Redeemable Preference Share of RM1.00
Voting Right : One (1) voting right for one (1) ordinary share
ANALYSIS OF SHAREHOLDINGS
Size of Shareholdings
No. of
Shareholders
% of
Shareholders
No. of
Shares
% of Issued
Share Capital
Less than 100 1,477 4.09 54,789 0.00
100 – 1,000 5,355 14.81 3,794,453 0.07
1,001 – 10,000 25,783 71.31 75,048,351 1.36
10,001 – 100,000 2,714 7.51 69,518,735 1.26
100,001 to less than 5% of Issued Shares 822 2.27 2,133,849,770 38.73
5% and above of Issued Shares 3 0.01 3,227,566,011 58.58
Total 36,154 100.00 5,509,832,109 100.00
DIRECTORS’ SHAREHOLDINGS
No. Name of Directors
No. of Shares
Direct/Indirect
Interest %
1. Tan Sri Leo Moggie – –
2. Datuk Wira Ir. Azman bin Mohd
– Tasec Nominees (Tempatan) Sdn. Bhd.
4,375 0.00
3. Datuk Nozirah binti Bahari – –
4. Tan Sri Dato’ Hari Narayanan a/l Govindasamy – –
5. Dato’ Zainal Abidin bin Putih 1,562 0.00
6. Dato’ Mohammad Zainal bin Shaari – –
7. Dato’ Fuad bin Jaafar 78,125 0.00
8. Tan Sri Dato’ Seri Siti Norma binti Yaakob 1,562 0.00
9. Dato’ Abd Manaf bin Hashim – –
10. Datuk Chung Hon Cheong – –
11. Puan Suria binti Ab Rahman
(Alternate Director to Dato' Mohammad Zainal bin Shaari)
– –
368
TENAGA NASIONAL BERHAD (200866-W)
Oth
er In
form
atio
n
Annual Report 2012
Analysis of Shareholdingsas at 15 October 2012

SUBSTANTIAL SHAREHOLDERS
No. Name of Substantial Shareholders No. of Shares %
1. Khazanah Nasional Berhad 1,939,655,861 35.20
2. Employees Provident Fund Board 775,133,219 14.07
– 1,875,000 shares held in its own name
– 703,066,182 shares held through Citigroup Nominees (Tempatan) Sdn. Bhd.
– 21,108,562 shares held through Citigroup Nominees (Tempatan) Sdn. Bhd.
– 16,941,100 shares held through Citigroup Nominees (Tempatan) Sdn. Bhd.
– 7,688,375 shares held through Citigroup Nominees (Tempatan) Sdn. Bhd.
– 4,614,000 shares held through Citigroup Nominees (Tempatan) Sdn. Bhd.
– 4,500,000 shares held through Citigroup Nominees (Tempatan) Sdn. Bhd.
– 4,100,000 shares held through Citigroup Nominees (Tempatan) Sdn. Bhd.
– 3,911,800 shares held through Citigroup Nominees (Tempatan) Sdn. Bhd.
– 2,300,000 shares held through Citigroup Nominees (Tempatan) Sdn. Bhd.
– 2,250,000 shares held through Citigroup Nominees (Tempatan) Sdn. Bhd.
– 1,600,000 shares held through Citigroup Nominees (Tempatan) Sdn. Bhd.
– 1,178,200 shares held through Citigroup Nominees (Tempatan) Sdn. Bhd.
3. Amanahraya Trustees Berhad 584,843,968 10.61
Skim Amanah Saham Bumiputera
30 LARGEST SHAREHOLDERS
No. Name of Shareholders No. of Shares %
1. Khazanah Nasional Berhad 1,939,655,861 35.20
2. Citigroup Nominees (Tempatan) Sdn. Bhd.
Employees Provident Fund Board
703,066,182 12.76
3. Amanahraya Trustees Berhad
Skim Amanah Saham Bumiputera
584,843,968 10.61
4. Lembaga Tabung Haji 208,615,968 3.79
5. Kumpulan Wang Persaraan (Diperbadankan) 205,230,325 3.72
6. Cartaban Nominees (Asing) Sdn. Bhd.
Exempt An for State Street Bank & Trust Company (West CLT OD67)
88,242,931 1.60
7. Amanahraya Trustees Berhad
Amanah Saham Malaysia
85,500,000 1.55
8. Amanahraya Trustees Berhad
Amanah Saham Wawasan 2020
71,340,325 1.30
9. HSBC Nominees (Asing) Sdn. Bhd.
BBH and Co Boston for Vanguard Emerging Markets Stock Index Fund
54,755,707 0.99
10. Citigroup Nominees (Tempatan) Sdn. Bhd.
Exempt An for Eastspring Investments Berhad
53,202,868 0.97
11. Maybank Nominees (Tempatan) Sdn. Bhd.
Maybank Trustees Berhad for Public Ittikal Fund (N14011970240)
51,154,000 0.93
369
KEEPING THE LIGHTS ON
Oth
er In
form
atio
n
Annual Report 2012
Analysis of Shareholdingsas at 15 October 2012

No. Name of Shareholders No. of Shares %
12. Maybank Nominees (Tempatan) Sdn. Bhd.
Maybank Trustees Berhad for Public Regular Savings Fund (N14011940100)
40,149,575 0.73
13. Malaysia Nominees (Tempatan) Sendirian Berhad
Great Eastern Life Assurance (Malaysia) Berhad (PAR 1)
39,906,525 0.72
14. AMSEC Nominees (Tempatan) Sdn. Bhd.
AmTrustee Berhad for CIMB Islamic Dali Equity Growth Fund (UT-CIMB-DALI)
38,366,700 0.70
15. Cartaban Nominees (Asing) Sdn. Bhd.
Government of Singapore Investment Corporation Pte Ltd for Government of Singapore (C)
34,477,118 0.63
16. HSBC Nominees (Asing) Sdn. Bhd.
Exempt An for JPMorgan Chase Bank, National Association (U.A.E.)
29,564,693 0.54
17. Amanahraya Trustees Berhad
Amanah Saham Didik
27,305,737 0.50
18. Amanahraya Trustees Berhad
AS 1Malaysia
26,547,700 0.48
19. Cartaban Nominees (Tempatan) Sdn. Bhd.
Petroliam Nasional Berhad (Strategic Inv)
21,738,625 0.39
20. Citigroup Nominees (Tempatan) Sdn. Bhd.
Employees Provident Fund Board (Nomura)
21,108,562 0.38
21. HSBC Nominees (Asing) Sdn. Bhd.
Exempt An for JPMorgan Chase Bank, National Association (U.S.A.)
19,375,810 0.35
22. Amanahraya Trustees Berhad
Public Islamic Dividend Fund
17,396,875 0.32
23. Citigroup Nominees (Tempatan) Sdn. Bhd.
Employees Provident Fund Board (CIMB PRIN)
16,941,100 0.31
24. Pertubuhan Keselamatan Sosial 15,569,500 0.28
25. Amanahraya Trustees Berhad
Public Islamic Select Enterprises Fund
15,557,400 0.28
26. Cartaban Nominees (Asing) Sdn. Bhd.
BBH (LUX) SCA for Fidelity Funds Asean
14,921,975 0.27
27. HSBC Nominees (Asing) Sdn. Bhd.
Exempt An for the Bank of New York Mellon (Mellon Acct)
14,670,978 0.27
28. Amanahraya Trustees Berhad
Public Growth Fund
14,385,000 0.26
29. Citigroup Nominees (Tempatan) Sdn. Bhd.
Exempt An for American International Assurance Berhad
13,274,050 0.24
30. Amanahraya Trustees Berhad
Public Islamic Sector Select Fund
12,969,550 0.24
Total 4,479,835,608 81.31
30 LARGEST SHAREHOLDERS CONTINUED
370
TENAGA NASIONAL BERHAD (200866-W)
Oth
er In
form
atio
n
Annual Report 2012
Analysis of Shareholdingsas at 15 October 2012

Prop
erty
List
LAN
DBU
ILD
ING
SD
ESCR
IPTI
ON
Leas
ehol
dFr
eeho
ldTo
tal
No.
(10)
Built
-Up
Area
(sq
M)
(11)
Tota
l
NBV
(RM
’000
)
(12)
(13)
Grou
p
No.
of L
ots (1
)
Area
(sq
M)
(2)
NBV
(RM
’000
)
(3)
No.
of L
ots (4
)
Area
(sq
M)
(5)
NBV
(RM
’000
)
(6)
No.
of L
ots
(1+4
)
Area
(sq
M)
(2+5
)
NBV
(RM
’000
)
(3+6
)
Loca
tion
Perli
s56
98,3
102,
227
5757
,124
3,44
911
315
5,43
45,
676
8610
,583
66,8
43Po
wer
Sta
tions
,
Keda
h28
789
5,80
714
,931
429
553,
895
30,8
6671
61,
449,
702
45,7
9737
010
0,38
824
3,30
0Ru
ral P
ower
Sta
tions
,
Pula
u Pi
nang
193
679,
177
67,8
8448
763
1,11
055
,571
680
1,31
0,28
712
3,45
532
438
,596
449,
346
Min
i Hyd
ros,
Pera
k67
84,
375,
025
127,
629
430
3,50
5,88
391
,734
1,10
87,
880,
908
219,
363
818
237,
480
860,
110
Jetti
es, D
ams
Sela
ngor
794
8,08
2,59
037
3,17
575
92,
322,
041
220,
250
1,55
310
,404
,631
593,
425
1,39
425
1,98
32,
603,
520
Mai
n In
take
Sub
stat
ions
,
W. P
erse
kutu
an37
528
1,79
472
,445
453
1,21
4,66
214
3,20
882
81,
496,
456
215,
653
570
211,
231
1,12
8,21
9Di
strib
utio
n Su
bsta
tions
,
Putra
jaya
/3
588,
490
13,9
084
1,55
465
77
590,
044
14,5
6560
8,58
036
,628
Resid
entia
l Hou
ses,
Cyb
erja
yaAp
artm
ents
,
N. S
embi
lan
274
2,87
0,75
616
,749
255
702,
149
40,4
3552
93,
572,
905
57,1
8424
914
6,92
154
9,53
3Ho
liday
Bun
galo
ws,
Mel
aka
324
434,
353
23,3
3529
511
0,53
922
,873
619
544,
892
46,2
0815
090
,842
111,
929
Offi
ce B
uild
ings
,
Joho
r93
93,
327,
640
104,
402
742
859,
706
49,1
921,
681
4,18
7,34
615
3,59
456
512
7,15
691
2,27
9W
areh
ouse
s,
Paha
ng32
81,
302,
354
22,2
9627
524
4,45
313
,274
603
1,54
6,80
735
,570
606
97,4
2151
9,60
4St
ore
& W
orks
hops
Tere
ngga
nu34
82,
069,
733
30,4
3387
25,1
34,1
5643
,150
435
27,2
03,8
8973
,583
318
68,0
1931
3,73
5
Kela
ntan
343
1,24
3,53
69,
806
282
449,
303
21,5
5362
51,
692,
839
31,3
5930
840
0,11
386
3,19
5
Saba
h83
6,26
1,62
112
,388
624,
501,
754
32,4
6414
510
,763
,375
44,8
5241
813
2,60
030
8,08
2
Paki
stan
138
,141
121
179
0,34
41,
681
282
8,48
51,
802
112
,713
791
TOTA
L5,
026
32,5
49,3
2789
1,72
94,
618
41,0
78,6
7377
0,35
79,
644
73,6
28,0
001,
662,
086
6,23
71,
934,
626
8,96
7,11
4
371
KEEPING THE LIGHTS ON
Oth
er In
form
atio
n
Annual Report 2012
Net Book Value of Land & Buildings

KUALA LUMPUR
Pengurus Besar (Kuala Lumpur)
Bahagian Pembahagian
Tenaga Nasional Berhad
Tingkat 11, Wisma TNB Jalan Kepong
Peti Surat 11050
50990 Kuala Lumpur
Tel : 03-6250 6020
D/L : 03-6250 6301
Fax : 03-6250 6500
PUTRAJAYA & CYBERJAYA
Pengurus Besar (Putrajaya & Cyberjaya)
Bahagian Pembahagian
Tenaga Nasional Berhad
Blok 4802-0-7, Jalan Perdana
CBD Perdana
63000 Cyberjaya
Tel : 03-8886 6888
Fax : 03-8886 6933
NEGERI SEMBILAN
Pengurus Besar Negeri (Negeri Sembilan)
Bahagian Pembahagian
Tenaga Nasional Berhad
Aras 5, Wisma TNB Jalan Dato’ Bandar Tunggal
70990 Seremban
Tel : 06-768 3400/06-767 9075
Fax : 06-764 4271
NEGERI MELAKA
Pengurus Besar Negeri (Melaka)
Bahagian Pembahagian
Tenaga Nasional Berhad
Aras M, Jalan Banda Kaba
Karung Berkunci 1005
75990 Melaka
Tel : 06-282 8544
Fax : 06-282 6460
NEGERI JOHOR
Pengurus Besar Negeri (Johor)
Bahagian Pembahagian
Tenaga Nasional Berhad
Tingkat 14, Wisma TNB Jalan Yahya Awal
80100 Johor Bahru
Tel : 07-219 2000
Fax : 07-223 1425
NEGERI PAHANG
Pengurus Besar Negeri (Pahang)
Bahagian Pembahagian
Tenaga Nasional Berhad
Aras 13, Wisma TNB
Lot 14, Seksyen 19 Jalan Gambut
25000 Kuantan
Tel : 09-515 5555
D/L : 09-515 5556
Fax : 09-515 5656
NEGERI TERENGGANU
Pengurus Besar Negeri (Terengganu)
Bahagian Pembahagian
Tenaga Nasional Berhad
Jalan Cherong Lanjut
20673 Kuala Terengganu
Tel : 09-622 3401
D/L : 09-622 3022
Fax : 09-624 3896
NEGERI KELANTAN
Pengurus Besar Negeri (Kelantan)
Bahagian Pembahagian
Tenaga Nasional Berhad
Aras 5, Wisma TNB Jalan Tok Hakim
15000 Kota Bharu
Tel : 09-745 1100
D/L : 09-744 5477
Fax : 09-744 9161
NEGERI PERLIS
Pengurus Besar Negeri (Perlis)
Bahagian Pembahagian
Tenaga Nasional Berhad
Bulatan Jubli Emas
01000 Kangar
Tel : 04-976 0021/22/23
D/L : 04-9767 470
Fax : 04-976 1921
NEGERI KEDAH
Pengurus Besar Negeri (Kedah)
Bahagian Pembahagian
Tenaga Nasional Berhad
Aras 8, Wisma TNB
No. 887, Jalan Sultan Badlishah
05990 Alor Star
Tel : 04-733 3737
D/L : 04-735 8808
Fax : 04-733 0591
NEGERI PULAU PINANG
Pengurus Besar Negeri (Pulau Pinang)
Bahagian Pembahagian
Tenaga Nasional Berhad
Tingkat 17, Wisma TNB
No. 30, Jalan Anson
10400 Pulau Pinang
Tel : 04-222 4000
Fax : 04-227 3110
NEGERI PERAK
Pengurus Besar Negeri (Perak)
Bahagian Pembahagian
Tenaga Nasional Berhad
Tingkat 2, Wisma TNB Jalan Lahat
30200 Ipoh
Tel : 05-208 8000
D/L : 05-254 7475
Fax : 05-254 5199
NEGERI SELANGOR
Pengurus Besar Negeri (Selangor)
Bahagian Pembahagian
Tenaga Nasional Berhad
Aras 7, Menara MRCB
No. 2, Jalan Majlis 14/10
Seksyen 14
40000 Shah Alam
Tel : 03-5522 4000
Fax : 03-5522 4181
372
TENAGA NASIONAL BERHAD (200866-W)
Oth
er In
form
atio
n
Annual Report 2012
Group Directory

I/We, NRIC No./Passport No./Co. No. (FULL NAME IN CAPITAL LETTERS)
of (FULL ADDRESS)
being a Member/Members of Tenaga Nasional Berhad, hereby appoint:
Name/NRIC No. No. of shares Percentage (%)
Proxy 1 or failing him/her
Proxy 2 or failing him/her
TOTAL
the Chairman of the Meeting, as my/our proxy, to attend and vote for me/us and on my/our behalf at the 22ND ANNUAL GENERAL MEETING of
TENAGA NASIONAL BERHAD to be held at Dewan Serbaguna, Kompleks Sukan TNB, Jalan Pantai Baru, 59200 Kuala Lumpur on Tuesday,
18 December 2012 at 10.00 a.m. and/or at any adjournment thereof.
My/Our proxy is to vote as indicated below:
ORDINARY BUSINESS FOR AGAINST
1. ORDINARY RESOLUTION 1 To receive the Audited Financial Statements for the Financial Year ended
31 August 2012 and the Reports of the Directors and Auditors thereon
2. ORDINARY RESOLUTION 2 Declaration of Dividend
3. ORDINARY RESOLUTION 3 Approval for Payment of Directors’ Fees
Re-election of the following Directors who retire in accordance with Article 135 of the Company’s Articles
of Association:
4. ORDINARY RESOLUTION 4 Dato’ Fuad bin Jaafar
5. ORDINARY RESOLUTION 5 Dato’ Abd Manaf bin Hashim
6. ORDINARY RESOLUTION 6 Datuk Wira Ir. Azman bin Mohd
Re-appointment of the following Directors who retire in accordance with Section 129 (6) of the Companies
Act, 1965:
7. ORDINARY RESOLUTION 7 Tan Sri Leo Moggie
8. ORDINARY RESOLUTION 8 Tan Sri Dato’ Seri Siti Norma binti Yaakob
9. ORDINARY RESOLUTION 9 Re-appointment of Messrs PricewaterhouseCoopers as Auditors
SPECIAL BUSINESS
10. ORDINARY RESOLUTION 10 Authority to Directors for the Issuance of Shares pursuant to ESOS II
11. ORDINARY RESOLUTION 11 Proposed Offer and Grant of Options to Datuk Wira Ir. Azman bin Mohd
12. ORDINARY RESOLUTION 12 Proposed Renewal of Share Buy-Back Authority
13. SPECIAL RESOLUTION 1 Proposed Amendments to the Articles of Association of the Company
(Please indicate with an “X” in the appropriate space how you wish your vote to be cast. If you do not indicate how you wish your proxy to vote
on any resolution, the proxy shall vote as he thinks fit, or at his discretion, abstain from voting.)
Dated this ________ day of __________, 2012.
Signature of Shareholder(s) or Common Seal
Number of Ordinary Share(s) held
CDS Account No.
KEEPING THE LIGHTS ON
Proxy Form

NOTES:
1. Any member entitled to attend and vote at this Meeting is entitled to appoint a proxy to attend and vote in his stead. A proxy
may but need not be a member of the Company and the provisions of Section 149(1)(b) of the Companies Act, 1965 shall not apply
to the Company.
2. The instrument appointing a proxy shall be in writing under the hand of the appointer or of his attorney duly appointed under a
power of attorney. Where the instrument appointing a proxy is executed by a corporation, it shall be executed either under its
common seal or under the hand of any officer or attorney duly appointed under a power of attorney.
3. A member shall not be entitled to appoint more than two (2) proxies to attend and vote at the Meeting. Where a member appoints
two (2) proxies, the appointment shall be invalid unless the proportion of the shareholdings to be represented by each proxy is
specified.
4. A corporation which is a member, may by resolution of its Directors or other governing body authorise such person as it thinks fit
to act as its representative at the Meeting, in accordance with Article 107(6) of the Company’s Articles of Association.
5. Only members registered in the Record of Depositors as at 11 December 2012 shall be eligible to attend the Meeting or appoint
proxy to attend and vote on their behalf.
6. The instrument appointing a proxy must be deposited at Symphony Share Registrars Sdn. Bhd., Level 6, Symphony House, Pusat
Dagangan Dana 1, Jalan PJU 1A/46, 47301 Petaling Jaya, Selangor Darul Ehsan not less than forty-eight (48) hours before the time
set for the Meeting.
STAMP
Symphony Share Registrars Sdn. Bhd.
Level 6, Symphony House
Pusat Dagangan Dana 1
Jalan PJU 1A/46
47301 Petaling Jaya
Selangor Darul Ehsan