Evaluation of comfort properties of polyester knitted spacer fabrics finished with water repellent...
7
Transcript of Evaluation of comfort properties of polyester knitted spacer fabrics finished with water repellent...

Fibers and Polymers 2007, Vol.8, No.4, 386-392
386
Evaluation of Comfort Properties of Polyester Knitted Spacer Fabrics
Finished with Water Repellent and Antimicrobial Agents
R. Bagherzadeh*, M. Montazer, M. Latifi, M. Sheikhzadeh1, and M. Sattari
2
Textile Engineering Department, Amirkabir University of Technology, Tehran, Iran 1Textile Engineering Department, Isfahan University of Technology, Isfahan, Iran
2Bacteriology Department, School of Medical Sciences, Tarbiat Modares University, Tehran, Iran
(Received December 24, 2006; Revised May 20, 2007; Accepted May 29, 2007)
Abstract: In order to impart barrier properties against water and microorganisms on breathable three dimensional spacer fab-rics as medical or technical textiles, fabric samples were treated with two water repellent agents and a quaternary ammoniumsalt namely cetyltrimethylammonium bromide (CTAB), using pad-dry-cure method. Two different water repellent agentsbased on hydrocarbon and acrylic copolymer were used. The water repellent property of samples was tested by Bundesmannand contact angle tests. Antimicrobial activity of samples was analyzed quantitatively according to AATCC 100. Simulta-neous finishing of samples was done with 3 % CTAB and 4 % fluoroalkyl acrylic copolymer. To study the effect of varioustreatments on comfort related properties, air and water vapor permeability, water repellency and compression were measured.The results showed that the antimicrobial and water repellent spacer fabrics can be achieved applying selected material with-out significant changes on their comfort properties. Also a regression model was presented to predict the water vapour perme-ability of knitted spacer fabrics based on course density (CPC) changing.
Keywords: Spacer fabric, Water repellent, Antimicrobial, Comfort
Introduction
The basic construction of three dimensional spacer fabrics
is formed of two textile layers held by spacer threads in a
defined spacing. This structure provides tortuous spaces
which let heat and moisture to be transferred through the
fabric with air easily. These characteristics of the spacer
fabrics make them suitable to use for medical purpose such
as beds, supporting pillows, bandages, shoes, operation
tables and so on.
One of the most important finishing techniques for
outdoor clothing or medical and protective purposes is water
repellent finish, which is impermeable to liquid penetration
but permeable to water vapor transfer (i.e. perspiration) [1].
Fluoroalkyl copolymers and hydrocarbon polymers are mostly
used as water repellent agents in textile finishing process.
They can also give a reasonable oil and soil repellency to
finished fabrics [2-5]. Cross-transmission of diseases in
hospitals is a major threat [6]. Surgical apparel should not
only provide protection against microbial attack, but should
also have blood barrier properties since most infections are
caused by blood-borne pathogens such as HIV and HBV [7,8].
To prevent or minimize infection or transmission of diseases
and to protect patients and surgical staff from infectious
liquid, it is very important to treat these textile materials with
antimicrobial and liquid repellent finishes [9,10].
Antimicrobial activity of textile fabrics is a very desirable
property for medical application and other uses that need
noxious odor such as footwear to be reduced. Various anti-
microbial agents, including aromatic halogen compounds,
organo-metallic and metal salts, quaternary ammonium salts,
and organo-silicon quaternary ammonium salts have been
applied to impart antimicrobial properties to textiles [11].
Sun and co-workers, have extended the technology to its use
in rendering fabrics containing cellulose biocidal [12,13]. It
has been also demonstrated that nylon can be rendered
biocidal [14,15]. Recent reports have demonstrated that
polyethylene terephethalate (PET) can also be antimicrobial
by several method and material [16,17]. Yang and co-workers
treated 100 % polyester fabric with 2-hydroxy-2,4,4-trichloro-
diphenyl ether, and reported the weak bactericidal efficacy
against Staphylococcus aureus and Escherichia coli before
and after multiple washes [18]. Huh and co-workers produced
chitosan-grafted and quaternized chitosan-grafted PET follow-
ing a glow-discharge graft of acrylic acid onto the fiber. The
treated PET was able to inhibit the growth of bacteria after
long contact times [19]. Antimicrobial activity of small ions
like silver, zinc, copper and quaternary ammonium compounds
is well documented. One of the available disinfectant agents
is CTAB (cetyltrimethylammonium bromide) which is a
quaternary ammonium salt with a positively charged nitrogen
ion that can interact with the cell membrane of microorganism
and destroy it [20]. Also CTAB has a hydrophobic long chain
that makes it a compatible compound using in co-application
with water repellent agents.
There is a general agreement that the transmission of air
and water vapor through a garment are probably the most
important factors in clothing comfort. Comfort, as felt by the
user, is a complex factor depending upon the above attributes.
Many medical products including clothes, pillowcases,
operation tables and etc, are closely related to comfort feeling.
Some early study reported various aspects of comfort related*Corresponding author: [email protected]
Evaluation of Comfort Properties of Polyester Fibers and Polymers 2007, Vol.8, No.4 387
to properties of fabrics [21-25].
The low-load compression behavior of fabrics is very
important in terms of handle and comfort. Mukhopadyhay et
al. [26] carried out exhaustive work on the thickness and
compressional characteristics of air-jet textured yarn woven
fabrics. They concluded that compressibility, thickness recovery,
compressional energy, recovered energy and resiliency were
influenced by fabric constructional parameters. Most of the
results were based on the compression-recovery graph obtained
from Instron. Postle et al. [27] concluded that fabric bending,
compression and surface characteristics were the three most
important characteristics for predicting overall handle and
associated quality attributes. Taylor and Pollet [28] used the
equation proposed by van Wyk [29] to approximate static
low-load compression curves of both woven and knitted
fabrics and developed the three-parameter model which was
initially proposed by de-Jong et al. [30]. A theoretical model
was proposed by Soe et al. [31] and the compression
properties of plain knitted fabrics were predicted from yarn
properties and fabric geometry. Recently, Bakhtiari, Najar
and co-workers [32], showed that Acrylic weft-knitted fabrics
with knit-tuck structure exhibit higher compression rigidity
and lower softness than the plain and knit-miss structures.
The objectives of the present study was to investigate the
effect of water repellent and antimicrobial finishing and
structural characteristic (CPC, course density) on the comfort
properties of 3D knitted spacer fabrics, and also obtaining a
multifunctional water repellent antimicrobial spacer fabric
with no sacrifice of comfort properties. To do this, in this
research work CTAB was used as an antimicrobial agent due
to its disinfectant properties and availability. Two different
water repellent agents were also applied on the raw and dyed
spacer fabrics to develop multi-functional textiles and also
comfort related properties including air and water vapor
permeability and compression of samples were evaluated.
Experimental
Materials and Methods
Characteristics of the fabrics used in this study are described
in Table 1. Two different knitted spacer fabrics including raw
and dyed fabrics (fabric dyed with disperse dye in jet) were
provided from Bonyad Polypropylene Fiber Production Co.
(Iran). The water repellent agents used, were fluoroalkyl
acrylic copolymer namely, BAYGARD AFF (Bayer Co.),
and a hydrocarbon based polymer namely, ADRATEX-CA
(P-574) (ADRASA Co.). The symbols of AFF and P-574
were used as representatives of the agents. A quaternary
ammonium salt, namely hexadecyltrimethylammonium bromide
(CTAB) used as antimicrobial agent (Merck Co.) [33].
Various concentrations of CTAB (1, 3, and 5 %) and 2.5 %
citric acid were added to distilled water. The spacer fabrics
were impregnated in the bath of 1, 3, and 5 % CTAB
finishing solutions, individually, and then padded to a wet
pickup of 85 %, dried at 110oC for 2 minutes and cured at
140 oC for 1 minute. To provide water repellent finish, samples
were impregnated in the bath of 4 and 6 % of P-574 and
AFF solution, individually, and then padded to a wet pickup
of about 85 %. The samples were then dried at 130 oC for
2 minutes and cured at 160oC for 1 minute. For simultaneous
finishing, samples were impregnated in the bath of 4 % AFF
and 3 % CTAB solution, and then padded to a wet pickup of
about 85 %, dried at 110oC for 2 minutes and cured at
150 oC for 1 minute.
Testing and Analysis of Treated Fabrics
Water repellency of the samples was measured by
Bundesmann test method according to BS 5066 and contact
angle was measured according to ASTM D 724-99 test
method. The antimicrobial activity of the samples was
evaluated quantitavely according to AATCC 100-1993. The
colonies of the bacterium on the agar plate were counted and
the reduction in numbers of bacterium was calculated using
the following equation:
Reduction rate (%) = 100 × (A − B)/A (1)
where A is the number of bacterial colonies from an untreated
fabric, and B is the number of bacterial colonies from the
CTAB-treated fabrics [34].
Physical and comfort properties including: thickness, air
and water vapor permeability, and compression of samples
were measured under constant conditions. Fabric thickness
was measured according to ASTM D 1777 test method, with
a Shirley digital thickness tester. Air permeability was
Table 1. Characteristics of PET knitted spacer fabrics
Sample Yarn count
(Tex)
Course per
centimeter
(CPC)
Fabric
thickness
(mm)
Raw fabric
(R)
Back layer 7.78(34 f)
17 3.16 Spacer layer 2.23(mono)
Front layer 11.12(48 f)
Dyed fabric
(D)
Back layer 7.78(34 f)
17 2.66 Spacer layer 2.23(mono)
Front layer 11.12(48 f)
Samples with different CPC
CPC 17
Back layer 7.78(34 f)
17 3.21 Spacer layer 3.33(mono)
Front layer 11.12(48 f)
CPC 20
Back layer 7.78(34f)
20 3.24 Spacer layer 3.33(mono)
Front layer 11.12(48 f)
CPC 22
Back layer 7.78(34 f)
22 3.23 Spacer layer 3.33(mono)
Front layer 11.12(48 f)
388 Fibers and Polymers 2007, Vol.8, No.4 R. Bagherzadeh et al.
measured according to BS 5636. Ten samples were tested
and the mean value was reported. Water vapor permeability
was measured by cup method according to BS 7209 which
four samples were measured and the mean value was
recorded. The weight loss was converted to water vapor
permeability according to equations (2)-(4). The water vapor
permeability index is calculated by expressing the water
vapor permeability (WVP) of the fabric as a percentage of
the WVP of reference fabric which is tested simultaneously
with the specimen.
(2)
(3)
Water vapor permeability index = (4)
where M is loss in mass (g), t is time between weighing (hr),
A is internal area of dish (m2) d is internal diameter of dish
(mm), WVPf is the water vapor permeability of the test
fabric, and WVPr is the water vapor permeability of the
reference.
Compression of samples was measured by an Instron Model
5566 Tensile Tester according to the method used in previous
works [35,36]. In order to evaluate the compression behavior
of fabrics, different parameters similar to those introduced
by Kawabata [37] in KES-F system were used. Four tests
were conducted for each fabric sample. Results from com-
pression and recovery tests were recorded and plotted.
The compression parameters including the work of
compression (WC; area under of the compression curve), the
work of recovery from compression (W'C; area under of the
recovery curve), the dissipated compression energy (Em), the
resilience of the fabric (RC), and energy lost (EL) can be
defined as below:
(5)
(6)
(7)
(8)
(9)
From equations (7), (8) and (9)
(10)
Where suffix c refers to the compression, suffix r refers to
the recovery state, P is pressure, V is fabric volume or
thickness, T0c is initial thickness, and Tm is maximum
thickness.
WC and W'C were measured by a program developed with
MATLAB software.
Contact angle of fabric samples were experimented
according to ASTM D 724-99 test method.
Results and Discussion
Fabric Thickness
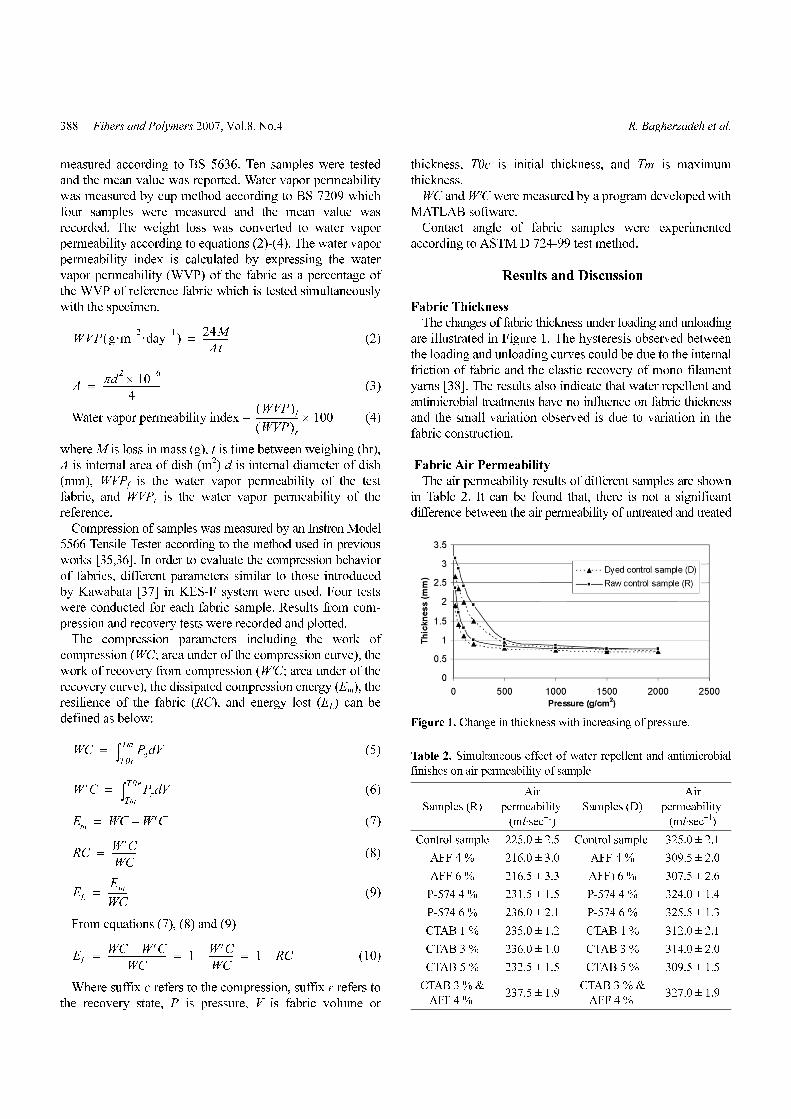
The changes of fabric thickness under loading and unloading
are illustrated in Figure 1. The hysteresis observed between
the loading and unloading curves could be due to the internal
friction of fabric and the elastic recovery of mono filament
yarns [38]. The results also indicate that water repellent and
antimicrobial treatments have no influence on fabric thickness
and the small variation observed is due to variation in the
fabric construction.
Fabric Air Permeability
The air permeability results of different samples are shown
in Table 2. It can be found that, there is not a significant
difference between the air permeability of untreated and treated
WVP g·m2–·day
1–( )
24M
At-----------=
Aπd
210
6–×
4-------------------------=
WVP( )f
WVP( )r------------------- 100×
WC Pc VdT0c
Tm
∫=
W′C Pr VdTm
T0r
∫=
Em WC W′C–=
RCW′C
WC-----------=
EL
Em
WC---------=
ELWC W′C–
WC-------------------------- 1
W′C
WC-----------– 1 RC–= = =
Figure 1. Change in thickness with increasing of pressure.
Table 2. Simultaneous effect of water repellent and antimicrobial
finishes on air permeability of sample
Samples (R)
Air
permeability
(ml·sec−1)
Samples (D)
Air
permeability
(ml·sec−1)
Control sample 225.0 ± 2.5 Control sample 325.0 ± 2.1
AFF 4 % 216.0 ± 3.0 AFF 4 % 309.5 ± 2.0
AFF 6 % 216.5 ± 3.3 AFF) 6 % 307.5 ± 2.6
P-574 4 % 231.5 ± 1.5 P-574 4 % 324.0 ± 1.4
P-574 6 % 236.0 ± 2.1 P-574 6 % 325.5 ± 1.3
CTAB 1 % 235.0 ± 1.2 CTAB 1 % 312.0 ± 2.1
CTAB 3 % 236.0 ± 1.0 CTAB 3 % 314.0 ± 2.0
CTAB 5 % 232.5 ± 1.5 CTAB 5 % 309.5 ± 1.5
CTAB 3 % &
AFF 4 % 237.5 ± 1.9
CTAB 3 % &
AFF 4 % 327.0 ± 1.9
Evaluation of Comfort Properties of Polyester Fibers and Polymers 2007, Vol.8, No.4 389
fabrics. This can be attributed to the open construction of the
spacer fabric which is not affected by the water repellent
treatment. However, dyed samples show a higher amount of
air permeability. This is due to the dyeing process and tension
applied during the drying which leads to lower thickness and
higher fabric porosity. These results approve to the results of
Kaminsayaka [30]. Effects of water repellent and antimicrobial
finishing on raw and dyed fabrics are similar. The air perme-
ability results show that dyed fabrics are more air permeable
than raw fabrics. Co-application of water repellent and anti-
microbial finishes on the fabric has no significant influence
on fabric air permeability.
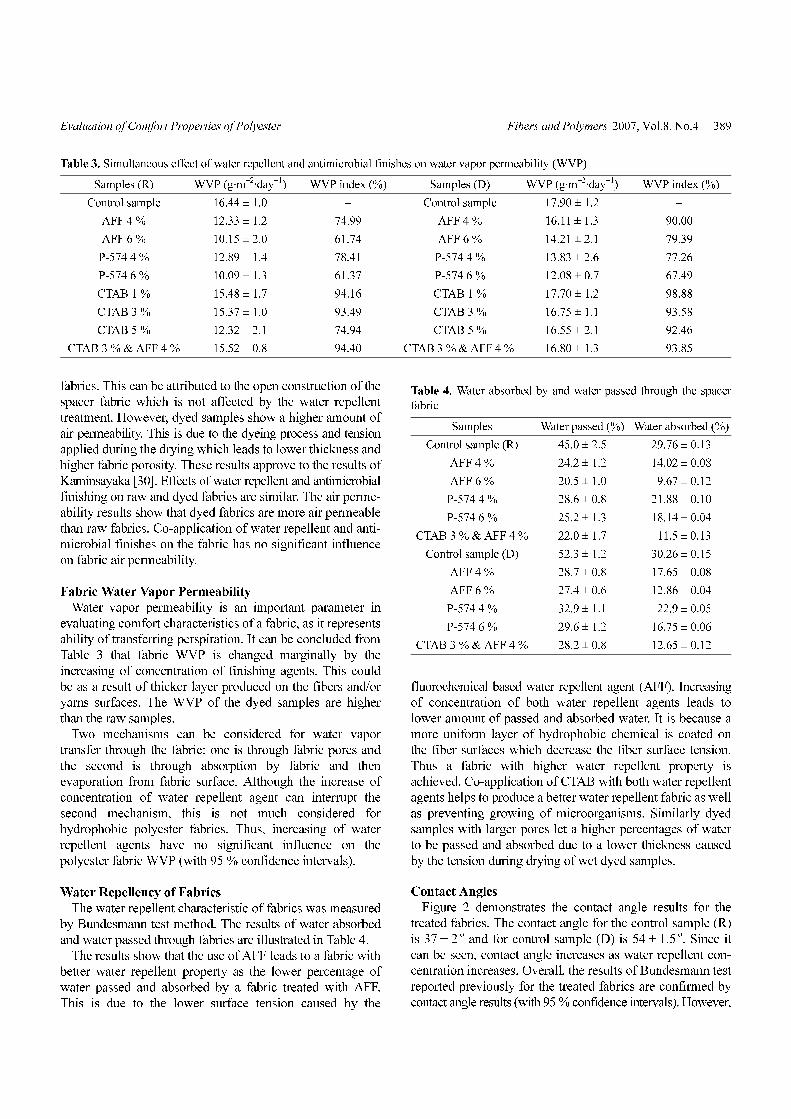
Fabric Water Vapor Permeability
Water vapor permeability is an important parameter in
evaluating comfort characteristics of a fabric, as it represents
ability of transferring perspiration. It can be concluded from
Table 3 that fabric WVP is changed marginally by the
increasing of concentration of finishing agents. This could
be as a result of thicker layer produced on the fibers and/or
yarns surfaces. The WVP of the dyed samples are higher
than the raw samples.
Two mechanisms can be considered for water vapor
transfer through the fabric: one is through fabric pores and
the second is through absorption by fabric and then
evaporation from fabric surface. Although the increase of
concentration of water repellent agent can interrupt the
second mechanism, this is not much considered for
hydrophobic polyester fabrics. Thus, increasing of water
repellent agents have no significant influence on the
polyester fabric WVP (with 95 % confidence intervals).
Water Repellency of Fabrics
The water repellent characteristic of fabrics was measured
by Bundesmann test method. The results of water absorbed
and water passed through fabrics are illustrated in Table 4.
The results show that the use of AFF leads to a fabric with
better water repellent property as the lower percentage of
water passed and absorbed by a fabric treated with AFF.
This is due to the lower surface tension caused by the
fluorochemical based water repellent agent (AFF). Increasing
of concentration of both water repellent agents leads to
lower amount of passed and absorbed water. It is because a
more uniform layer of hydrophobic chemical is coated on
the fiber surfaces which decrease the fiber surface tension.
Thus a fabric with higher water repellent property is
achieved. Co-application of CTAB with both water repellent
agents helps to produce a better water repellent fabric as well
as preventing growing of microorganisms. Similarly dyed
samples with larger pores let a higher percentages of water
to be passed and absorbed due to a lower thickness caused
by the tension during drying of wet dyed samples.
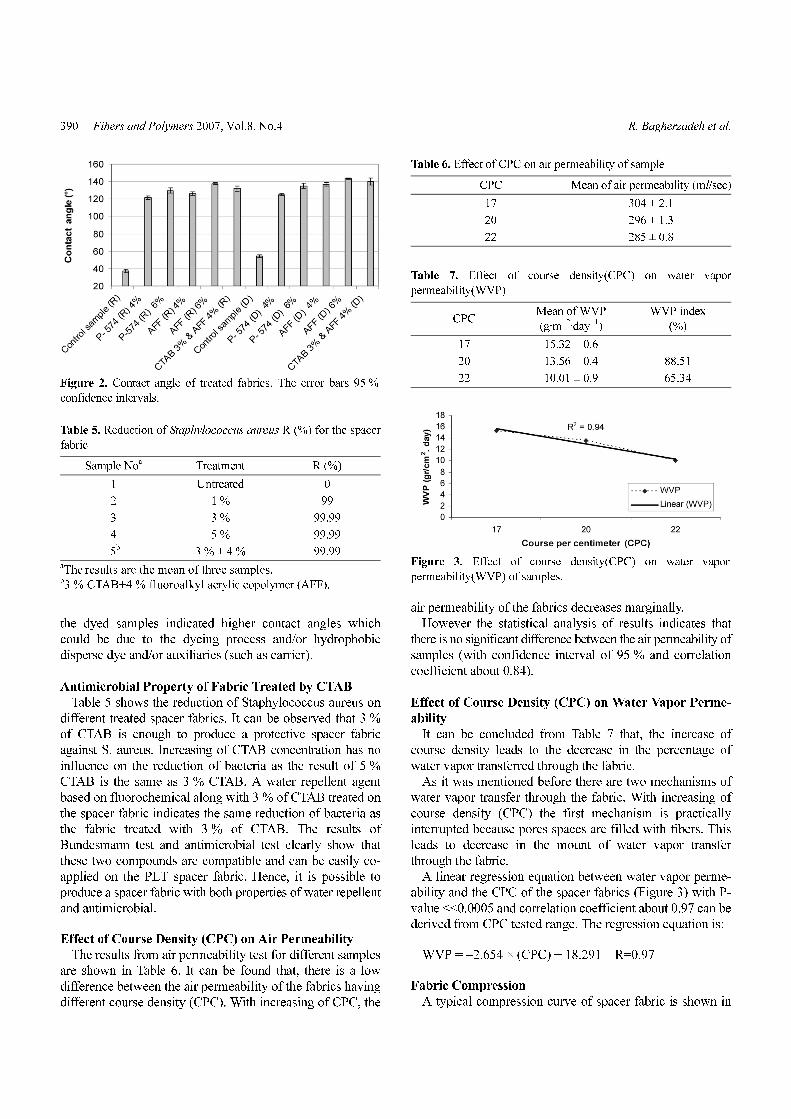
Contact Angles
Figure 2 demonstrates the contact angle results for the
treated fabrics. The contact angle for the control sample (R)
is 37 ± 2o and for control sample (D) is 54 ± 1.5
o. Since it
can be seen, contact angle increases as water repellent con-
centration increases. Overall, the results of Bundesmann test
reported previously for the treated fabrics are confirmed by
contact angle results (with 95 % confidence intervals). However,
Table 3. Simultaneous effect of water repellent and antimicrobial finishes on water vapor permeability (WVP)
Samples (R) WVP (g·m−2·day−1) WVP index (%) Samples (D) WVP (g·m−2·day−1) WVP index (%)
Control sample 16.44 ± 1.0 − Control sample 17.90 ± 1.2 −
AFF 4 % 12.33 ± 1.2 74.99 AFF 4 % 16.11 ± 1.3 90.00
AFF 6 % 10.15 ± 2.0 61.74 AFF 6 % 14.21 ± 2.1 79.39
P-574 4 % 12.89 ± 1.4 78.41 P-574 4 % 13.83 ± 2.6 77.26
P-574 6 % 10.09 ± 1.3 61.37 P-574 6 % 12.08 ± 0.7 67.49
CTAB 1 % 15.48 ± 1.7 94.16 CTAB 1 % 17.70 ± 1.2 98.88
CTAB 3 % 15.37 ± 1.0 93.49 CTAB 3 % 16.75 ± 1.1 93.58
CTAB 5 % 12.32 ± 2.1 74.94 CTAB 5 % 16.55 ± 2.1 92.46
CTAB 3 % & AFF 4 % 15.52 ± 0.8 94.40 CTAB 3 % & AFF 4 % 16.80 ± 1.3 93.85
Table 4. Water absorbed by and water passed through the spacer
fabric
Samples Water passed (%) Water absorbed (%)
Control sample (R) 45.0 ± 2.5 29.76 ± 0.13
AFF 4 % 24.2 ± 1.2 14.02 ± 0.08
AFF 6 % 20.5 ± 1.0 9.67 ± 0.12
P-574 4 % 28.6 ± 0.8 21.88 ± 0.10
P-574 6 % 25.2 ± 1.3 18.14 ± 0.04
CTAB 3 % & AFF 4 % 22.0 ± 1.7 11.5 ± 0.13
Control sample (D) 52.3 ± 1.2 30.26 ± 0.15
AFF 4 % 28.7 ± 0.8 17.65 ± 0.08
AFF 6 % 27.4 ± 0.6 12.86 ± 0.04
P-574 4 % 32.9 ± 1.1 22.9 ± 0.05
P-574 6 % 29.6 ± 1.2 16.75 ± 0.06
CTAB 3 % & AFF 4 % 28.2 ± 0.8 12.65 ± 0.12
390 Fibers and Polymers 2007, Vol.8, No.4 R. Bagherzadeh et al.
the dyed samples indicated higher contact angles which
could be due to the dyeing process and/or hydrophobic
disperse dye and/or auxiliaries (such as carrier).
Antimicrobial Property of Fabric Treated by CTAB
Table 5 shows the reduction of Staphylococcus aureus on
different treated spacer fabrics. It can be observed that 3 %
of CTAB is enough to produce a protective spacer fabric
against S. aureus. Increasing of CTAB concentration has no
influence on the reduction of bacteria as the result of 5 %
CTAB is the same as 3 % CTAB. A water repellent agent
based on fluorochemical along with 3 % of CTAB treated on
the spacer fabric indicates the same reduction of bacteria as
the fabric treated with 3 % of CTAB. The results of
Bundesmann test and antimicrobial test clearly show that
these two compounds are compatible and can be easily co-
applied on the PET spacer fabric. Hence, it is possible to
produce a spacer fabric with both properties of water repellent
and antimicrobial.
Effect of Course Density (CPC) on Air Permeability
The results from air permeability test for different samples
are shown in Table 6. It can be found that, there is a low
difference between the air permeability of the fabrics having
different course density (CPC). With increasing of CPC, the
air permeability of the fabrics decreases marginally.
However the statistical analysis of results indicates that
there is no significant difference between the air permeability of
samples (with confidence interval of 95 % and correlation
coefficient about 0.84).
Effect of Course Density (CPC) on Water Vapor Perme-
ability
It can be concluded from Table 7 that, the increase of
course density leads to the decrease in the percentage of
water vapor transferred through the fabric.
As it was mentioned before there are two mechanisms of
water vapor transfer through the fabric. With increasing of
course density (CPC) the first mechanism is practically
interrupted because pores spaces are filled with fibers. This
leads to decrease in the mount of water vapor transfer
through the fabric.
A linear regression equation between water vapor perme-
ability and the CPC of the spacer fabrics (Figure 3) with P-
value <<0.0005 and correlation coefficient about 0.97 can be
derived from CPC tested range. The regression equation is:
WVP = −2.654 × (CPC) + 18.291 R=0.97
Fabric Compression
A typical compression curve of spacer fabric is shown in
Figure 2. Contact angle of treated fabrics. The error bars 95 %
confidence intervals.
Table 5. Reduction of Staphylococcus aureus R (%) for the spacer
fabric
Sample Noa Treatment R (%)
1 Untreated 0
2 1 % 99
3 3 % 99.99
4 5 % 99.99
5b 3 % + 4 % 99.99aThe results are the mean of three samples. b3 % CTAB+4 % fluoroalkyl acrylic copolymer (AFF).
Table 6. Effect of CPC on air permeability of sample
CPC Mean of air permeability (ml/sec)
17 304 ± 2.1
20 296 ± 1.3
22 285 ± 0.8
Table 7. Effect of course density(CPC) on water vapor
permeability(WVP)
CPCMean of WVP
(g·m−2·day−1)
WVP index
(%)
17 15.32 ± 0.6 −
20 13.56 ± 0.4 88.51
22 10.01 ± 0.9 65.34
Figure 3. Effect of course density(CPC) on water vapor
permeability(WVP) of samples.

Evaluation of Comfort Properties of Polyester Fibers and Polymers 2007, Vol.8, No.4 391
Figure 4. Fabric samples tested in the compression experiment
were conditioned and fully-dried relaxed under the room
temperature and humidity conditions of 20 ± 2oC and 65 ± 2 %
RH for 24 hours. In order to investigate fabric compression
property, an Instron model 5566 with cyclic loads was used.
It can be observed that the compression curve of spacer
fabric consists of three zones. At low pressure, two outer
fabrics along with spacer threads are compressed and
uniform surfaces are made by distribution of fibers in yarns
of two outer fabrics. The compression characteristic in the
first region is presumed to be elastic. Increasing of pressure
overcomes the internal friction between fibers and yarn and
the deformation of mono filament spacer threads takes place.
Thus in the second region, fabric thickness decreases
nonlinearly with increasing pressure. Further increasing in
pressure compresses the mono filament spacer threads so, in
third region a highly packed fiber layers can be considered.
The WC and W'C were derived by measuring the surface
area under the compression and recovery curves. The results
of energy lost (EL) in the Table 8 indicate that with
increasing of cycle number EL decreases for all fabric
samples. This could be due to the deformation of spacer
threads which are forced to be inclined in the first cycle of
compression. For the second cycle of compression lower
load that leads to a lower energy lost is required to apply on
the fabric. This is the same for the third cycle of
compression. For the consecutive cycle of compression the
rate of energy lost seems to be constant [35].
The statical analysis of results from Table 9 shows that
there are no significant differences between the amount of
RC and EL for AFF treated samples and control samples.
However the percentages of RC and EL for the samples
treated with P-574 differ from the control samples. The P-
574 treated samples have a lower RC and a higher EL in
comparison with control samples (Figure 5). This can be
Figure 4. A typical compression and recovery curve of spacer
fabric obtained by Instron tester.
Table 8. Changes of energy lost (EL) with different cycles for
different samples
SampleEL (%)
Cycle 1 Cycle 2 Cycle 3
Control sample (R) 57.50 55.19 48.69
Control sample (D) 56.69 54.74 50.20
AFF 4 % (R) 56.43 54.03 50.42
AFF 6 % (R) 57.05 56.70 51.39
AFF 4 % (D) 56.43 54.02 51.28
AFF 6 % (D) 56.82 50.38 45.28
P-574 (R) 4 % 66.46 52.39 51.28
P-574 (R) 6 % 63.31 62.64 56.97
P-574 (D) 4 % 62.76 61.82 56.91
P-574 (D) 6 % 60.93 60.20 55.05
CPC 17 50.38 48.87 34.55
CPC 20 48.68 46.23 31.45
CPC 22 45.88 44.52 30.58
Table 9. Fabric resiliency( RC) and energy lost (EL) results
Sample RC (%) EL (%)
Control sample (R) 0.43 0.57
Control sample (D) 0.43 0.57
AFF 4 % (R) 0.44 0.56
AFF 6 % (R) 0.43 0.57
AFF 4 % (D) 0.44 0.56
AFF 6 % (D) 0.43 0.57
P-574 (R) 4 % 0.34 0.66
P-574 (R) 6 % 0.37 0.63
P-574 (D) 4 % 0.37 0.63
P-574 (D) 6 % 0.39 0.61
CPC 17 0.50 0.50
CPC 20 0.50 0.49
CPC 22 0.54 0.46
Figure 5. Effect on resiliency (RC) and energy lost (EL) for P-574
treated fabrics.

392 Fibers and Polymers 2007, Vol.8, No.4 R. Bagherzadeh et al.
attributed to the water repellent chemical structure of P-574
which makes fabrics harsh. Increasing of course density also
causes an increase in fabric resiliency (RC).
Conclusion
This research shows the method of producing of multi-
functional PET knitted fabric with comfort properties. Also
a regression model was presented to predict the water
vapour permeability of knitted spacer fabrics based on CPC
changing. Fluorochemical based water repellent agent produces
fabric with better water repellent property. 3 % of CTAB
produces reasonable antimicrobial PET spacer fabric. PET
spacer fabric treated with CTAB accompanied with the water
repellent agent using a pad-dry-cure technique shows excellent
compatibility, water repellency and antimicrobial properties
with reasonable comfort properties.
Acknowledgements
The authors wish to express their gratitude to Bonyad PP.
Fiber Production Co. for providing samples.
References
1. M. Montazer, 5th International Conference TEXSCL 2003,
June 16-18, Liberic Czech Repablic, 2003.
2. J. T. Marsh, “An Introduction to Textile Finishing”,
pp.458-494, London, Chapman Publication, 1966.
3. J. W. Rowen and D. D. Gagliardi, Dyestuff Rep., 36, 533
(1947).
4. H. G. Weiland, “Canadian Textile Journal”, p.46, August,
1979.
5. T. R. Harding, J. Text. Inst., 42, 691 (1951).
6. W. C. Beck and T. S. Collette, Am. J. Surgery, 33(2), 125
(1952).
7. K. K. Leonas, INJ Spring, 8(1), 18 (1999).
8. J. T. Schwartz and D. E. Saunders, Surgery Cynecol.
Obstet., 4, 507 (1980).
9. J. S. Cho and G. Cho, Text. Res. J., 67(12), 875 (1997).
10. W. Huang and K. K. Leonas, Text. Res. J., 70(9), 774
(2000).
11. S. Lee, J. Cho, and G. Cho, Text. Res. J., 69(2), 104 (1999).
12. G. Sun and X. Xu, Text. Chem. Col., 30(6), 26 (1998).
13. G. Sun and X. Xu, Text. Chem. Col., 31(5), 31 (1999).
14. J. Lin, C. Winkelmann, S. D. Worley, R. M. Broughton,
and J. F. J. Williams, J. Appl. Polym. Sci., 81(4), 943
(2001).
15. J. Lin and C. V. Worley, Polymer, 42(18), 7903 (2001).
16. J. Buchenska, J. Appl. Polym. Sci., 65(5), 967 (1997).
17. L. Jian, W. Catherine, S. D. Worley, K. Jangho, C. Wei, C.
Unchin, R. M. Broughton, J. I. Santiago, and J. F.
Wolliams, J. Appl. Polym. Sci., 85, 177 (2002).
18. Y. Yang, L. Corcoran, K. Vorlicek, and S. Li, Tex. Chem.
Col., 32, 44 (2000).
19. M. W. Huh, I. K. Kang, D. H. Lee, W. S. Kim, D. H. Lee,
L. S. Park, K. E. Min, and K. H. Seo, J. Appl. Polym. Sci.,
81, 2769 (2001).
20. Y. H. Kim and G. Sun, Text. Res. J., 70, 728 (2000).
21. A. Das and M. Ishtiaque, JTATM, 3(4), 1 (2004).
22. P. W. Gibson, Text. Res. J., 63, 749 (1993).
23. K. H. Umbach, Melliand Textileberichte International
Textile Reports, 74, 174 (1993).
24. J. Smith, Text. Horizons, 5(8), 35 (1985).
25. K. Slater, Text. Prog., 9(4), 1 (1977).
26. A. Mukhopadyhay, A. K. Dash, and V. K. Kothari,
International Journal of Clothing Science and Technology,
14(2), 88 (2002).
27. R. Postel, J. Text. Inst., 62, 219 (1971).
28. P. M. Taylor and D. M. Pollet, Text. Res. J., 72, 983 (2002).
29. C. M. Van Wyk, J. Text. Inst., 37, 285 (1946).
30. S. de Jong, J. W. Snaith, and N. A. Michie, Text. Res. J.,
56, 759 (1986).
31. A. K. Soe, T. Matsuo, M. Takahashi, and M. Nakajima,
Text. Res. J., 73, 861 (2003).
32. M. Bakhtiari, S. S. Najar, S. M. Etrati, and Z. Khorram
Toosi, Fibers and Polymers, 7(3), 295 (2006).
33. Y.-A. Son and G. Sun, J. Appl. Polym. Sci., 90, 2194
(2003).
34. M. Montazer and M. G. Afjeh, J. Appl. Polym. Sci., 103,
178 (2007).
35. J. E. Booth, Arrowsmith Bristol, 1968.
36. M. H. Varkiani, Ph.D. Dissertation, AUT, Tehran, 2005.
37. S. Kawabata, “The Standardization and Anaylsis of Hand
Evaluation”, The Hand Evaluation and Standardization
Committee, Text. Mach. Soc. Japan, 1980.
38. M. Matsudaira and H. Qin, J. Text. Inst., 83, 476 (1995).