Finished Genome of the Fungal Wheat Pathogen Mycosphaerella graminicola Reveals Dispensome...
17
Finished Genome of the Fungal Wheat Pathogen Mycosphaerella graminicola Reveals Dispensome Structure, Chromosome Plasticity, and Stealth Pathogenesis Stephen B. Goodwin 1. * , Sarrah Ben M’Barek 2 , Braham Dhillon 3 , Alexander H. J. Wittenberg 2 , Charles F. Crane 1 , James K. Hane 4 , Andrew J. Foster 5 , Theo A. J. Van der Lee 2 , Jane Grimwood 6,7 , Andrea Aerts 7 , John Antoniw 8 , Andy Bailey 9 , Burt Bluhm 10 , Judith Bowler 11 , Jim Bristow 7 , Ate van der Burgt 2 , Blondy Canto-Canche ´ 12 , Alice C. L. Churchill 13 , Laura Conde-Ferra `ez 12 , Hans J. Cools 8 , Pedro M. Coutinho 14 , Michael Csukai 11 , Paramvir Dehal 7 , Pierre De Wit 15 , Bruno Donzelli 16 , Henri C. van de Geest 2 , Roeland C. H. J. van Ham 2 , Kim E. Hammond-Kosack 8 , Bernard Henrissat 14 , Andrzej Kilian 17 , Adilson K. Kobayashi 18 , Edda Koopmann 19 , Yiannis Kourmpetis 15 , Arnold Kuzniar 15 , Erika Lindquist 7 , Vincent Lombard 14 , Chris Maliepaard 15 , Natalia Martins 20 , Rahim Mehrabi 21 , Jan P. H. Nap 2 , Alisa Ponomarenko 3 , Jason J. Rudd 8 , Asaf Salamov 7 , Jeremy Schmutz 6,7 , Henk J. Schouten 2 , Harris Shapiro 7 , Ioannis Stergiopoulos 15 , Stefano F. F. Torriani 22 , Hank Tu 7 , Ronald P. de Vries 23 , Cees Waalwijk 2 , Sarah B. Ware 2 , Ad Wiebenga 23 , Lute-Harm Zwiers 23 , Richard P. Oliver 24 , Igor V. Grigoriev 7. * , Gert H. J. Kema 2. * 1 USDA–Agricultural Research Service, Purdue University, West Lafayette, Indiana, United States of America, 2 Plant Research International B.V., Wageningen, The Netherlands, 3 Department of Botany and Plant Pathology, Purdue University, West Lafayette, Indiana, United States of America, 4 School of Veterinary and Biomedical Sciences, Murdoch University, Perth, Australia, 5 IBWF e.V., Institute for Biotechnology and Drug Research, Kaiserslautern, Germany, 6 HudsonAlpha Institute of Biotechnology, Huntsville, Alabama, United States of America, 7 DOE Joint Genome Institute, Walnut Creek, California, United States of America, 8 Rothamsted Research, Department of Plant Pathology and Microbiology, Harpenden, United Kingdom, 9 School of Biological Sciences, University of Bristol, Bristol, United Kingdom, 10 University of Arkansas, Fayetteville, Arkansas, United States of America, 11 Syngenta, Jealott’s Hill Research Centre, Bracknell, United Kingdom, 12 Unidad de Biotecnologı ´a, Centro de Investigacio ´ n Cientı ´fica de Yucata ´n, A.C., (CICY), Me ´rida, Me ´ xico, 13 Department of Plant Pathology and Plant-Microbe Biology, Cornell University, Ithaca, New York, United States of America, 14 Architecture et Fonction des Macromolecules Biologiques, CNRS, Marseille, France, 15 Wageningen University and Research Centre, Wageningen, The Netherlands, 16 USDA–Agricultural Research Service, Ithaca, New York, United States of America, 17 Diversity Arrays Technology Pty Ltd, Yarralumla, Australia, 18 Embrapa Meio-Norte, Teresina, Piauı ´, Brazil, 19 Bayer CropScience AG, Monheim, Germany, 20 Embrapa-Cenargen, Brasilia, Brazil, 21 Department of Genetics, Seed and Plant Improvement Institute, Karaj, Iran, 22 Plant Pathology, Institute of Integrative Biology, Swiss Federal Institute of Technology (ETH), Zu ¨ rich, Switzerland, 23 CBS–KNAW Fungal Biodiversity Centre, Utrecht, The Netherlands, 24 Environment and Agriculture, Curtin University, Bentley, Australia Abstract The plant-pathogenic fungus Mycosphaerella graminicola (asexual stage: Septoria tritici) causes septoria tritici blotch, a disease that greatly reduces the yield and quality of wheat. This disease is economically important in most wheat-growing areas worldwide and threatens global food production. Control of the disease has been hampered by a limited understanding of the genetic and biochemical bases of pathogenicity, including mechanisms of infection and of resistance in the host. Unlike most other plant pathogens, M. graminicola has a long latent period during which it evades host defenses. Although this type of stealth pathogenicity occurs commonly in Mycosphaerella and other Dothideomycetes, the largest class of plant-pathogenic fungi, its genetic basis is not known. To address this problem, the genome of M. graminicola was sequenced completely. The finished genome contains 21 chromosomes, eight of which could be lost with no visible effect on the fungus and thus are dispensable. This eight-chromosome dispensome is dynamic in field and progeny isolates, is different from the core genome in gene and repeat content, and appears to have originated by ancient horizontal transfer from an unknown donor. Synteny plots of the M. graminicola chromosomes versus those of the only other sequenced Dothideomycete, Stagonospora nodorum, revealed conservation of gene content but not order or orientation, suggesting a high rate of intra-chromosomal rearrangement in one or both species. This observed ‘‘mesosynteny’’ is very different from synteny seen between other organisms. A surprising feature of the M. graminicola genome compared to other sequenced plant pathogens was that it contained very few genes for enzymes that break down plant cell walls, which was more similar to endophytes than to pathogens. The stealth pathogenesis of M. graminicola probably involves degradation of proteins rather than carbohydrates to evade host defenses during the biotrophic stage of infection and may have evolved from endophytic ancestors. PLoS Genetics | www.plosgenetics.org 1 June 2011 | Volume 7 | Issue 6 | e1002070
Transcript of Finished Genome of the Fungal Wheat Pathogen Mycosphaerella graminicola Reveals Dispensome...

Finished Genome of the Fungal Wheat PathogenMycosphaerella graminicola Reveals DispensomeStructure, Chromosome Plasticity, and StealthPathogenesisStephen B. Goodwin1.*, Sarrah Ben M’Barek2, Braham Dhillon3, Alexander H. J. Wittenberg2, Charles F.
Crane1, James K. Hane4, Andrew J. Foster5, Theo A. J. Van der Lee2, Jane Grimwood6,7, Andrea Aerts7,
John Antoniw8, Andy Bailey9, Burt Bluhm10, Judith Bowler11, Jim Bristow7, Ate van der Burgt2, Blondy
Canto-Canche12, Alice C. L. Churchill13, Laura Conde-Ferraez12, Hans J. Cools8, Pedro M. Coutinho14,
Michael Csukai11, Paramvir Dehal7, Pierre De Wit15, Bruno Donzelli16, Henri C. van de Geest2,
Roeland C. H. J. van Ham2, Kim E. Hammond-Kosack8, Bernard Henrissat14, Andrzej Kilian17, Adilson K.
Kobayashi18, Edda Koopmann19, Yiannis Kourmpetis15, Arnold Kuzniar15, Erika Lindquist7, Vincent
Lombard14, Chris Maliepaard15, Natalia Martins20, Rahim Mehrabi21, Jan P. H. Nap2, Alisa
Ponomarenko3, Jason J. Rudd8, Asaf Salamov7, Jeremy Schmutz6,7, Henk J. Schouten2, Harris Shapiro7,
Ioannis Stergiopoulos15, Stefano F. F. Torriani22, Hank Tu7, Ronald P. de Vries23, Cees Waalwijk2, Sarah B.
Ware2, Ad Wiebenga23, Lute-Harm Zwiers23, Richard P. Oliver24, Igor V. Grigoriev7.*, Gert H. J. Kema2.*
1 USDA–Agricultural Research Service, Purdue University, West Lafayette, Indiana, United States of America, 2 Plant Research International B.V., Wageningen, The
Netherlands, 3 Department of Botany and Plant Pathology, Purdue University, West Lafayette, Indiana, United States of America, 4 School of Veterinary and Biomedical
Sciences, Murdoch University, Perth, Australia, 5 IBWF e.V., Institute for Biotechnology and Drug Research, Kaiserslautern, Germany, 6 HudsonAlpha Institute of
Biotechnology, Huntsville, Alabama, United States of America, 7 DOE Joint Genome Institute, Walnut Creek, California, United States of America, 8 Rothamsted Research,
Department of Plant Pathology and Microbiology, Harpenden, United Kingdom, 9 School of Biological Sciences, University of Bristol, Bristol, United Kingdom,
10 University of Arkansas, Fayetteville, Arkansas, United States of America, 11 Syngenta, Jealott’s Hill Research Centre, Bracknell, United Kingdom, 12 Unidad de
Biotecnologıa, Centro de Investigacion Cientıfica de Yucatan, A.C., (CICY), Merida, Mexico, 13 Department of Plant Pathology and Plant-Microbe Biology, Cornell University,
Ithaca, New York, United States of America, 14 Architecture et Fonction des Macromolecules Biologiques, CNRS, Marseille, France, 15 Wageningen University and Research
Centre, Wageningen, The Netherlands, 16 USDA–Agricultural Research Service, Ithaca, New York, United States of America, 17 Diversity Arrays Technology Pty Ltd,
Yarralumla, Australia, 18 Embrapa Meio-Norte, Teresina, Piauı, Brazil, 19 Bayer CropScience AG, Monheim, Germany, 20 Embrapa-Cenargen, Brasilia, Brazil, 21 Department
of Genetics, Seed and Plant Improvement Institute, Karaj, Iran, 22 Plant Pathology, Institute of Integrative Biology, Swiss Federal Institute of Technology (ETH), Zurich,
Switzerland, 23 CBS–KNAW Fungal Biodiversity Centre, Utrecht, The Netherlands, 24 Environment and Agriculture, Curtin University, Bentley, Australia
Abstract
The plant-pathogenic fungus Mycosphaerella graminicola (asexual stage: Septoria tritici) causes septoria tritici blotch, adisease that greatly reduces the yield and quality of wheat. This disease is economically important in most wheat-growingareas worldwide and threatens global food production. Control of the disease has been hampered by a limitedunderstanding of the genetic and biochemical bases of pathogenicity, including mechanisms of infection and of resistancein the host. Unlike most other plant pathogens, M. graminicola has a long latent period during which it evades hostdefenses. Although this type of stealth pathogenicity occurs commonly in Mycosphaerella and other Dothideomycetes, thelargest class of plant-pathogenic fungi, its genetic basis is not known. To address this problem, the genome of M.graminicola was sequenced completely. The finished genome contains 21 chromosomes, eight of which could be lost withno visible effect on the fungus and thus are dispensable. This eight-chromosome dispensome is dynamic in field andprogeny isolates, is different from the core genome in gene and repeat content, and appears to have originated by ancienthorizontal transfer from an unknown donor. Synteny plots of the M. graminicola chromosomes versus those of the onlyother sequenced Dothideomycete, Stagonospora nodorum, revealed conservation of gene content but not order ororientation, suggesting a high rate of intra-chromosomal rearrangement in one or both species. This observed‘‘mesosynteny’’ is very different from synteny seen between other organisms. A surprising feature of the M. graminicolagenome compared to other sequenced plant pathogens was that it contained very few genes for enzymes that break downplant cell walls, which was more similar to endophytes than to pathogens. The stealth pathogenesis of M. graminicolaprobably involves degradation of proteins rather than carbohydrates to evade host defenses during the biotrophic stage ofinfection and may have evolved from endophytic ancestors.
PLoS Genetics | www.plosgenetics.org 1 June 2011 | Volume 7 | Issue 6 | e1002070

Citation: Goodwin SB, Ben M’Barek S, Dhillon B, Wittenberg AHJ, Crane CF, et al. (2011) Finished Genome of the Fungal Wheat Pathogen Mycosphaerellagraminicola Reveals Dispensome Structure, Chromosome Plasticity, and Stealth Pathogenesis. PLoS Genet 7(6): e1002070. doi:10.1371/journal.pgen.1002070
Editor: Harmit S. Malik, Fred Hutchinson Cancer Research Center, United States of America
Received October 17, 2010; Accepted March 24, 2011; Published June 9, 2011
This is an open-access article, free of all copyright, and may be freely reproduced, distributed, transmitted, modified, built upon, or otherwise used by anyone forany lawful purpose. The work is made available under the Creative Commons CC0 public domain dedication.
Funding: The work conducted by the U.S. Department of Energy Joint Genome Institute was supported by the Office of Science of the U.S. Department ofEnergy under Contract No. DE-AC02-05CH11231. Supported in part by USDA CRIS projects 3602-22000-013-00D and 3602-22000-015-00D. The funders had norole in study design, data collection and analysis, decision to publish, or preparation of the manuscript.
Competing Interests: The authors have declared that no competing interests exist.
* E-mail: [email protected], [email protected] (SBG); [email protected] (GHJK); [email protected] (IVG)
. These authors contributed equally to this work.
Introduction
The ascomycete fungus Mycosphaerella graminicola (Figure S1)
causes septoria tritici blotch (STB), a foliar disease of wheat that
poses a significant threat to global food production. Losses to STB
can reduce yields of wheat by 30 to 50% with a huge economic
impact [1]; global expenditures for fungicides to manage STB total
hundreds of millions of dollars each year [2–3]. This fungus is
difficult to control because populations contain extremely high
levels of genetic variability [4] and it has very unusual biology for a
pathogen. Unlike most other plant pathogens [5–7], M. graminicola
infects through stomata rather than by direct penetration and
there is a long latent period of up to two weeks following infection
before symptoms develop. The fungus evades host defenses [8]
during the latent phase, followed by a rapid switch to necrotrophy
immediately prior to symptom expression 12–20 days after
penetration [5,9–10]. Such a switch from biotrophic to necro-
trophic growth at the end of a long latent period is an unusual
characteristic shared by most fungi in the genus Mycosphaerella.
Very little is known about the cause or mechanism of this lifestyle
switch [9–10] even though Mycosphaerella is one of the largest
and most economically important genera of plant-pathogenic
fungi.
A striking aspect of M. graminicola genetics is the presence of
many dispensable chromosomes [11]. These can be lost readily in
sexual progeny with no apparent effect on fitness. However, the
structure and function of dispensable chromosomes are not
known. Here we report the first genome of a filamentous fungus
to be finished according to current standards [12]. The 21-
chromosome, 39.7-Mb genome of M. graminicola revealed an
apparently novel origin for dispensable chromosomes by horizon-
tal transfer followed by extensive recombination, a possible
mechanism of stealth pathogenicity and exciting new aspects of
genome structure. The genome provides a finished reference for
the Dothideomycetes, the largest class of ascomycete fungi, which
also includes the apple scab pathogen Venturia inaequalis, the
southern corn leaf blight pathogen Cochliobolus heterostrophus, the
black Sigatoka pathogen of banana, M. fijiensis, and numerous
other pathogens of almost every crop.
Results
Features of the finished genomeThe finished genome of M. graminicola isolate IPO323 consists of
21 complete chromosomes, telomere to telomere (Figure S2), with
the exceptions of one telomere of chromosome 21 and two internal
gaps of unclonable DNA that are missing from chromosome 18
(Table 1). Alignments between the 21 chromosomes and two
genetic linkage maps yielded an excellent correspondence (Figure 1
and Figure S3), representing the most complete and the first
finished sequence of a filamentous fungus. The next most complete
genome of a filamentous fungus is that of Aspergillus fumigatus, which
did not include centromere sequences and contained 11 gaps in
total [13]. The complete 43,960-bp mitochondrial genome also
was obtained and has been described elsewhere [14].
Sexual activation of chromosome plasticity and repeat-induced point mutation
Comparative genome hybridizations using a whole-genome
tiling array made from the genome sequence of IPO323
demonstrated striking sexually activated chromosomal plasticity
in progeny isolates (Figure 2) and chromosome number polymor-
phisms in field isolates. For example, isolate IPO94269, a field
strain from bread wheat in the Netherlands, was missing two
chromosomes that were present in IPO323 (Figure 2A).
Sexual-driven genome plasticity was particularly evident among
progeny isolates in the two mapping populations, including losses
of chromosomes that were present in both parents and disomy for
others [11]. For example, progeny isolate #51 of the cross
between IPO323 and IPO94269 lost chromosomes 14 and 21
(Figure 2B) even though they were present in both parents. This
isolate also was missing chromosome 20, which was polymorphic
for presence between the parents of the cross. More surprisingly,
this isolate was disomic for chromosomes 4 and 18 (Figure 2B),
indicating that chromosomes can be both gained and lost during
meiosis. For chromosome 18, both copies must have originated
from IPO323 because no homolog was present in IPO94269.
Molecular markers for chromosome 4 appeared to be heterozy-
gous indicating that both parents contributed a copy to progeny
isolate #51 (data not shown). Progeny isolate #2133 of the cross
between isolates IPO323 and IPO95052 showed loss of three
dispensable chromosomes (15, 18 and 21) that were present in
both parents (Figure 2C), most likely due to non-disjunction during
meiosis. Thus, extreme genome plasticity was manifested as
chromosome number and size polymorphisms [11] that were
generated during meiosis and extended to core as well as
dispensable chromosomes.
The whole-genome hybridizations also indicated that the core
and dispensable chromosomes can be remarkably uniform for
gene content, given the high capacity of the latter for change.
Comparative genome hybridizations between IPO323 and
IPO95052, an isolate from a field of durum wheat in Algeria,
showed that they had the same complement of core and
dispensable chromosomes (Figure 2D). This was surprising,
because populations of the pathogen from durum wheat (a
tetraploid) usually are adapted to that host and not to hexaploid
bread wheat, yet the chromosomal complements of isolates from
these hosts on different continents were the same.
Evidence for repeat-induced point mutation (RIP), a mecha-
nism in fungi that inactivates transposons by introducing C to T
Finished Genome of Mycosphaerella graminicola
PLoS Genetics | www.plosgenetics.org 2 June 2011 | Volume 7 | Issue 6 | e1002070

transitions in repeated sequences [15–16], was seen in genome-
wide analyses of transition:transversion ratios in long terminal
repeat (LTR) pairs from 20 retrotransposon insertions which had
255 transitions and 6 transversions for a ratio of 42.5:1. Similarly
high transition:transversion ratios were found in all repetitive
sequences analyzed and extended to the coding regions in addition
to the LTRs [17]. The reverse transcriptase coding regions from
transposon families RT11 and RT15 had transition:transversion
ratios of 27.8:1 and 25.3:1, respectively, instead of the 1:1 ratio
expected among 6,939 mutations analyzed. This high incidence of
transitions most likely reflects changes caused by RIP. The coding
regions of all transposons with more than 10 copies included stop
codons that prevent proper translation, indicating that they were
inactivated.
Core and dispensable chromosomes are highly divergentThere were significant differences in structure and gene content
between the 13 core and eight dispensable chromosomes (Table 1
and Table 2); the latter are referred to collectively as the
dispensome. The dispensome constituted about 12% of the
genomic DNA but contained only 6% of the genes. In contrast,
the 13 core chromosomes had twice as many genes per Mb of
DNA, about half as much repetitive DNA, a significantly higher
G+C content, and much higher numbers of unique genes (Table 1
and Table 2). Genes in the dispensome were significantly shorter,
usually were truncated relative to those on the core chromosomes
(Table 2) and had dramatic differences in codon usage (Figure S4).
About 59% of the genes on core chromosomes could be
annotated compared to only 10% of those on the dispensome
(Table 2). Some unique genes in the dispensome with intact,
presumably functional reading frames, had possible paralogs on
the core chromosomes (Figure S5) that appeared to be inactivated
by mutations (Figure S6). A majority of the annotated dispensome
genes coded for putative transcription factors or otherwise may
function in gene regulation or signal transduction (Table S1). Most
of the redundant genes on the dispensome were copies of genes
present on core chromosomes, yet no syntenic relationships could
be identified. Instead, each dispensable chromosome contained
genes and repetitive sequences from all or most of the core
chromosomes (Figure 3 and Figure S7) with additional unique
genes of unknown origin. Sharing of genetic material applied to
core chromosomes as well as the dispensome, consistent with a
high level of recombination (Figure S8). Whether the primary
direction of transfer is from core to dispensable chromosomes or
vice versa is not known.
The dispensome contained fewer genes encoding secreted
proteins such as effectors and other possible pathogenicity factors
compared to the core set. Signal peptides showed no enrichment
on the dispensome (Table S1) except for a few clusters overlapping
with transposon-related repeats. Although mature microRNAs
have not been demonstrated in fungi, they may be important
regulatory molecules. In the M. graminicola genome, 418 non-
overlapping loci potentially encoding pre-microRNA-like small
RNA (pre-milRNA) were predicted computationally based on the
RFAM database [18]. This number was similar to the 434 loci
predicted in the 41-Mb genome of Neurospora crassa using the same
approach. Of the 418 putative pre-milRNA loci predicted in the
genome of M. graminicola, 88 (21%) are located on the 11% of the
genome present as dispensome. This is about twice as much as is
expected on the basis of a random distribution. Therefore, the
dispensome is enriched for pre-milRNA loci.
The 418 pre-milRNA loci code for 385 non-redundant pre-
milRNA sequences that can give rise to distinguishable mature
milRNAs. The occurrence of mature milRNAs derived from the
predicted set was analyzed in a small-RNA data consisting of
almost 6 million reads (Illumina platform) generated from
germinated spores of M. graminicola isolate IPO323 (Table S2).
Many of the non-redundant predicted milRNA sequences were
represented in the RNA reads, at widely different amounts per
sequence. In total, 65 of the 385 non-redundant sequences were
observed 10 times or more. Two predicted sequences occurred
more than a thousand times each, experimentally confirming the
presence of putatively mature milRNAs derived from computa-
tionally predicted pre-milRNA sequences. In N. crassa, computa-
tionally predicted putative milRNA sequences also were confirmed
experimentally [19], supporting the likelihood of their existence in
M. graminicola.
The origin of the dispensome of M. graminicola is not clear. The
two most likely origins would be degeneration of copies of the core
chromosomes or by horizontal transfer. Disomy for core
chromosomes, as seen in one of the progeny isolates, could
provide the origin for a dispensable chromosome. If one of the two
chromosome copies became preferentially subject to RIP followed
by breakage or interstitial deletions this could result in a
degenerated copy of that core chromosome. However, in that
case we would expect the dispensome to share large regions of
synteny with specific core chromosomes, and this was not
observed, which renders this explanation less likely.
The large differences in codon usage between core and
dispensable chromosomes could be explained by horizontal
transfer or possibly by RIP. To discriminate between these
hypotheses, RIP was simulated on the genes of the core
chromosomes. Principal components analysis (PCA) of the
simulated data set did not reduce the differences in codon bias
(Figure S9A); if anything, it made them farther apart. This result
was consistent whether it included only putative functional,
truncated copies or entire pseudogenes after RIPping (data not
shown). DeRIPping of genes on the dispensable chromosomes also
did not affect the results (Figure S9B), so RIP could not explain the
observed differences in codon usage between core and dispensable
Author Summary
The plant-pathogenic fungus Mycosphaerella graminicolacauses septoria tritici blotch, one of the most economicallyimportant diseases of wheat worldwide and a potentialthreat to global food production. Unlike most other plantpathogens, M. graminicola has a long latent period duringwhich it seems able to evade host defenses, and itsgenome appears to be unstable with many chromosomesthat can change size or be lost during sexual reproduction.To understand its unusual mechanism of pathogenicityand high genomic plasticity, the genome of M. graminicolawas sequenced more completely than that of any otherfilamentous fungus. The finished sequence contains 21chromosomes, eight of which were different from those inthe core genome and appear to have originated byancient horizontal transfer from an unknown donor. Thedispensable chromosomes collectively comprise the dis-pensome and showed extreme plasticity during sexualreproduction. A surprising feature of the M. graminicolagenome was a low number of genes for enzymes thatbreak down plant cell walls; this may represent anevolutionary response to evade detection by plant defensemechanisms. The stealth pathogenicity of M. graminicolamay involve degradation of proteins rather than carbohy-drates and could have evolved from an endophyticancestor.
Finished Genome of Mycosphaerella graminicola
PLoS Genetics | www.plosgenetics.org 3 June 2011 | Volume 7 | Issue 6 | e1002070

chromosomes. PCA of a sample of genes shared between core and
dispensable chromosomes showed few differences in codon bias
(Figure S9C) or amino acid composition (Figure S9D), consistent
with an origin by duplication and exchange among chromosomes.
This conclusion was supported when the analysis was expanded to
include all genes with putative homologs on core and dispensable
chromosomes (Figure S9E) even though these genes had a very
different codon usage compared to the entire sets of genes on the
core chromosomes (Figure S9F).
To test the horizontal transfer hypothesis, additional PCAs were
performed on simulated horizontal transfer data sets made by
combining the genome of M. graminicola with those of two other
fungi. Best non-self BLAST hits for genes on the M. graminicola
dispensome most often were to fungi in the Pleosporales or
Eurotiales (Table S3), so published genomes from species
representing those orders were chosen for analysis. PCA of the
combined genomes of M. graminicola and Stagonospora nodorum
(representing the Pleosporales) gave separate, tight clusters for the
core chromosomes of M. graminicola versus most of those from S.
nodorum (Figure S10A). Dispensable chromosomes of M. graminicola
formed a looser, distinct cluster, and a fourth cluster was
comprised of M. graminicola chromosome 14 plus scaffolds 44
and 45 of S. nodorum (Figure S10A); this may indicate the existence
of dispensable chromosomes in the latter species. Analysis of the
combined genomes of M. graminicola plus Aspergillus fumigatus
(Eurotiales) gave a similar result (Figure S10B). The separate
clustering by PCA of the M. graminicola dispensome and core
chromosomes is consistent with an origin by horizontal transfer,
but not from either of the two species tested. PCA on the
frequencies of repetitive elements also indicated a separation
between core and dispensable chromosomes (Figure S11),
consistent with the horizontal transfer hypothesis.
A more refined test of the RIP hypothesis was performed by using
the observed rates of all mutations in families of transposons with 10
or more elements to simulate mutational changes on replicated
samples drawn from the core chromosomes. Observed mutation rates
were calculated from aligned sequences; multicopy transposons were
chosen for this analysis because they are the most likely to have been
processed through the RIP machinery so will reflect the actual biases
that occur in M. graminicola. Codon bias and other parameters in the
mutated samples were then compared to those in the dispensome and
in the original, non-mutated samples. Application of the mutational
changes moved the samples drawn from the core chromosomes closer
to the value observed for the dispensome, but the dispensome
remained distinct except for a few of the analyses that are least likely
to be affected by selection (Figure 4). This confirmed that the
dispensome has been subject to RIP but that this alone was not
sufficient to explain the observed pattern of codon usage.
Table 1. Sizes and gene contents of the 21 chromosomes of Mycosphaerella graminicola isolate IPO323.
Chromosome All genes Unique genesaSignalpeptides
Averagegene size(bp)
Genes/MbDNA
PercentG+C
Percentrepetitive
milRNAs/MbDNAb
Number Size Number Annotated Number Annotated
1 6,088,797 1,980 1,258 1,067 497 208 1338.6 325 53.1 9.5 9.7
2 3,860,111 1,136 650 607 238 108 1402.7 294 52.4 15.7 9.6
3 3,505,381 1,071 630 583 246 122 1337.1 306 52.6 14.2 6.3
4 2,880,011 821 498 421 182 81 1388.6 285 52.2 16.1 13.2
5 2,861,803 778 489 389 180 91 1352.6 272 52.0 19.1 18.9
6 2,674,951 692 427 328 152 66 1353.0 259 51.4 22.2 12.3
7 2,665,280 766 357 462 131 96 1202.7 287 52.6 14.0 16.1
8 2,443,572 689 397 384 159 62 1311.2 282 51.7 17.6 13.5
9 2,142,475 604 353 305 134 69 1345.1 282 51.5 20.8 18.7
10 1,682,575 516 298 266 110 46 1418.7 307 52.5 14.1 9.5
11 1,624,292 488 279 270 115 65 1352.5 300 52.8 10.5 5.5
12 1,462,624 408 227 232 96 59 1254.3 279 52.3 14.5 10.9
13 1,185,774 330 183 165 68 47 1195.7 278 52.0 17.8 17.7
14 773,098 114 25 48 5 3 920.1 147 48.5 36.7 23.3
15 639,501 86 6 44 1 2 773.7 134 51.0 34.4 25.0
16 607,044 88 5 40 1 5 898.5 145 51.5 25.6 31.3
17 584,099 78 6 36 1 1 777.9 134 52.0 26.4 18.8
18c 573,698 64 7 28 4 0 965.1 112 48.6 40.3 33.1
19 549,847 87 8 53 3 4 658.3 158 51.3 25.1 23.6
20 472,105 79 4 41 2 4 863.1 167 51.5 21.1 25.4
21d 409,213 58 4 21 1 2 921.6 142 51.9 30.1 14.7
Total 39,686,251 10,933 6,111 5,790 2,326 1,141 13.5
aAt a BLAST cutoff value of 16e220.bPredicted numbers of loci for pre-microRNA-like small RNAs.cThis chromosome contains two internal gaps of unclonable DNA marked by gaps of 1.4 and 4.5 kb; all other chromosomes are complete.dThe sequence of one telomere is missing from this chromosome; all other telomeres are complete.doi:10.1371/journal.pgen.1002070.t001
Finished Genome of Mycosphaerella graminicola
PLoS Genetics | www.plosgenetics.org 4 June 2011 | Volume 7 | Issue 6 | e1002070

A new type of syntenyPairwise sequence comparisons between the chromosomes of M.
graminicola and scaffolds of Stagonospora nodorum, another wheat
pathogen in the Dothideomycetes but in a different order from
Mycosphaerella, revealed multiple regions with approximately 70–
90% similarity (Figure 5). However, the similarity did not extend
to the dispensome, which generally was different from all of the S.
nodorum scaffolds. Detailed examination showed that each region of
similarity generally represents only one or a few genes in both
organisms. Comparisons between the initial draft genome (version
1.0) of M. graminicola (Figure 5A) and the finished sequence
(Figure 5B) revealed some misassemblies and also indicated
scaffolds that ultimately were joined in the final assembly.
A surprising result was that the dot-plot patterns were very different
from those that characterize the macro- or microsynteny seen in
other organisms when viewed at a whole-scaffold/chromosome scale.
Instead of the expected diagonal lines indicating chromosomal
regions with content in the same order and orientation, the dots are
scattered quasi-randomly within ‘blocks’ defined by scaffold/
chromosome boundaries (Figure 5). For many S. nodorum scaffolds
the vast majority of dots related are shared exclusively with one or a
small number of M. graminicola chromosomes. For example, there are
predominant one-to-one relationships between M. graminicola version
3 chromosomes 11 and 12 with S. nodorum scaffolds 21 and 7
(Figure 5B, circle V), respectively. Similarly, M. graminicola chromo-
somes 5–10 each had strong relationships with 2 to 4 scaffolds of S.
nodorum. We refer to this conservation of gene content but not order or
orientation among chromosomes as ‘mesosynteny’. Analyses of
additional genomes has shown that mesosynteny as defined here
occurs among all Dothideomycetes tested and may be unique to that
class of fungi (data not presented).
Mesosynteny as a tool to assist genome assemblyMacrosyntenic relationships are used commonly to assist the
assembly and finishing of fragmented genome sequences [20–23],
particularly in prokaryotes. Sequences that are macrosyntenic to a
long segment of a closely related genome are highly likely to be
joined physically. If mesosynteny between a new genome assembly
and a reference genome also may be used to suggest scaffolds that
should be juxtaposed it could significantly reduce the cost and
complexity of assembling and finishing genomes. To test whether
mesosynteny could be used to predict scaffold or contig joins in a
genomic sequence, versions 1 and 2 of the M. graminicola genome
assembly were analyzed to determine whether any of the
improvements in the finished genome could have been predicted
bioinformatically by mesosynteny (Dataset S1).
The first version of the M. graminicola genome consisted of 129
scaffolds (http://genome.jgi-psf.org/Mycgr1/Mycgr1.home.html).
Comparison of M. graminicola version 1 scaffolds with those of the
P. nodorum genome predicted all scaffold joins made in version 2
(Figure 5, Dataset S1). Version 1 scaffolds 10 and 14 (Figure 5:
group I), 7 and 17 (groups II, VII and IX), and 12 and 22 (groups
III and VIII) were joined into chromosomes 7, 5 and 10,
respectively. Mesosynteny also indicated both instances where
version 1 scaffolds were assembled incorrectly and subsequently
were split in version 2. Compared to the scaffolds of P. nodorum, M.
graminicola version 1 scaffold 4 exhibited regions of mesosynteny
adjacent to regions of no synteny. Corrections to the assembly
made in version 2 separated these two distinct regions into
separate chromosomes. Version 1 scaffolds 4 and 9 (Figure 5:
groups IV/VI and V) were corrected to version 2 chromosomes 6
and 16 (Figure 5: group IV/VI) and chromosomes 12 and 21
(Figure 5: group V) respectively. Mesosynteny was remarkably
successful and has great potential to assist the assembly and
finishing of fungal genomes.
A mechanism of stealth pathogenesisGenerally, gene families involved in cell wall degradation are
expanded in fungal plant pathogens [24–25]. However, in M.
graminicola, gene families characterized by the Carbohydrate-
Figure 1. Features of chromosome 2 of Mycosphaerella graminicola and alignment to genetic linkage maps. A, Plot of GC content. Areasof low GC usually correspond to regions of repetitive DNA. B, Repetitive regions of the M. graminicola genome. C, Single-copy (red) regions of the M.graminicola genome. D, Locations of genes for proteins containing signal peptides. E, Locations of homologs involved in pathogenicity or virulencethat have been experimentally verified in species pathogenic to plant, animal or human hosts. F, Approximate locations of quantitative trait loci (QTL)for pathogenicity to wheat. G, Alignments between the genomic sequence and two genetic linkage maps of crosses involving isolate IPO323. Tophalf, Genetic linkage map of the cross between IPO323 and the Algerian durum wheat isolate IPO95052. Bottom half, Genetic linkage map of thecross between bread wheat isolates IPO323 and IPO94269. The physical map represented by the genomic sequence is in the center. Lines connectmapped genetic markers in each linkage map to their corresponding locations on the physical map based on the sequences of the marker loci.Exceptions to the almost perfect alignment between the three maps are indicated by crossed lines, most likely due to occasional incorrect scorings ofthe marker alleles. Chromosome 2 was used for this illustration because no QTL mapped to chromosome 1.doi:10.1371/journal.pgen.1002070.g001
Finished Genome of Mycosphaerella graminicola
PLoS Genetics | www.plosgenetics.org 5 June 2011 | Volume 7 | Issue 6 | e1002070

Active Enzyme database (CAZy) [26] as plant cell wall
polysaccharidases were severely reduced in size (Figure 6).
According to the CAZy analysis, the genome of M. graminicola
contains fewer genes for cellulose degradation than those of six
other fungi with sequenced genomes including both grass
pathogens and saprophytes (Table 3), and only about one-third
as many genes for cell wall degradation in total compared to the
other plant pathogens (Table S4). This reduction in CAZymes in
M. graminicola was very visible when the putative genes were
divided based on polysaccharide substrate (Table S4). In addition,
genes involved in appressorium formation, which are required for
pathogenesis of many plant pathogens including Magnaporthe oryzae
[27], were absent or reduced in the Mycosphaerella graminicola
genome, reflecting its alternative host-penetration strategy.
To further analyze the mechanism of stealth pathogenesis, we
profiled the growth on polysaccharides of M. graminicola compared
to Stagonospora nodorum and Magnaporthe oryzae, two pathogens of the
cereals wheat and rice, respectively, with sequenced genomes
(Figure S12). Growth of M. graminicola corresponded with the
CAZy annotation for a strongly reduced number of genes
encoding putative xylan-degrading enzymes. Furthermore, the
CAZy annotation demonstrated that M. graminicola contains a
much smaller set of glycoside hydrolases, carbohydrate esterases,
and carbohydrate binding modules (CBMs) compared to the other
two cereal pathogens (Table S5). The strong reduction of CBMs in
M. graminicola suggests a different strategy in the degradation of
plant cell walls compared to the other two species. The M.
graminicola genome is particularly depauperate for enzymes
Figure 2. Box plots of comparative genome hybridizations (CGH) of DNA from five isolates of Mycosphaerella graminicola to a whole-genome tiling array made from the finished sequence of isolate IPO323. A, CGH between IPO323 and the Dutch field isolate IPO94269. B,CGH between IPO323 and progeny isolate #51 from the cross between IPO323 and IPO94269. C, CGH between IPO323 and progeny isolate #2133 ofthe cross between IPO323 and IPO95052. D, CGH between IPO323 and Algerian field isolate IPO95052, which was isolated from and is adapted todurum (tetraploid) wheat. The genomic difference between the strains for each CGH is shown by 21 box plots, one for each chromosome of M.graminicola. The horizontal line in each box is the median log ratio of hybridization signals of the two strains; the upper and lower ends of a boxrepresent the 25% and 75% quartiles. The whiskers extending from each box indicate 1.5 times the interquartile range, the distance between the 25%and 75% quartiles. The larger the deviation from 0, the greater the difference between the strains for a particular chromosome. Pink boxes that aresignificantly less than the zero line indicate missing chromosomes. The purple boxes in panel B (4 and 18) that are significantly higher than the zeroline indicate chromosomes that are disomic.doi:10.1371/journal.pgen.1002070.g002
Finished Genome of Mycosphaerella graminicola
PLoS Genetics | www.plosgenetics.org 6 June 2011 | Volume 7 | Issue 6 | e1002070

degrading cellulose, xylan and xyloglucan compared to the other
two species, so is very atypical for a cereal pathogen.
A possible mechanism of stealth pathogenesis was indicated by
gene families that were expanded in the genome of M. graminicola.
In comparative analyses of gene families and PFAM domains with
several other fungi, the most striking expansions were observed for
peptidases (M3, S28, pro-kuma, M24, metalloendopeptidase,
metalloproteinase) and alpha amylases (glycoside hydrolase family
13) (Tables S6 and S7). This suggests that alternative nutrition
sources during the biotrophic phase of infection may be proteins
which are available in the apoplast, or possibly starch from
chloroplasts that are released early in the infection process [5].
Overall, these analyses revealed that the genome of M. graminicola
differs significantly from those of other cereal pathogens with
respect to genes involved in plant penetration as well as
polysaccharide and protein degradation (Figure 6, Table 3), which
most likely reflects its stealthy mode of pathogenesis.
Differences in gene expression during the different stages of
infection were evident from an analysis of EST sequences [9] from
wheat leaves 5, 10 and 16 days after inoculation (DAI) with M.
graminicola. Most genes were present at only one sampling time
with little overlap, particularly between the library from the
biotrophic stage of infection (5 DAI) compared to the other two
(Figure S13A). Lack of overlap extended to a library from minimal
medium minus nitrogen to simulate the nitrogen starvation
thought to occur during infection (Figure S13B). Expression of
genes for cell wall-degrading enzymes also was reduced during the
biotrophic stage of infection [9], consistent with the stealth-
pathogenicity hypothesis.
Discussion
The dispensome as defined here includes all parts of the genome
that can be missing in field or progeny isolates with no obvious
effects on fitness in axenic culture, on a susceptible host or during
mating. For M. graminicola, this includes the eight known
dispensable chromosomes in isolate IPO323 plus any others that
may be discovered in the future. The core genome consists of all
chromosomes that are always present in field and progeny isolates,
presumably because they contain genes that are vital for survival
so cannot be lost. Both core and dispensable chromosomes may be
present in two or possibly more copies, but core chromosomes are
never absent.
The dispensome of M. graminicola is very different from the
supernumerary or B chromosomes in plants and some animals.
The B chromosomes of plants contain few if any genes and are
composed mostly of repetitive elements assembled from the A
chromosomes. They may have a negative effect on fitness [28] and
appear to be maintained primarily by meiotic drive [29]. In
contrast, the dispensome of M. graminicola contains many unique
and redundant genes and is not maintained by meiotic drive, as
individual chromosomes are lost readily during meiosis [11].
Table 2. Differences between essential and dispensable chromosomes in the genome of Mycosphaerella graminicola isolateIPO323.
Chromosomes
Statistic Core (1–13) Dispensable (14–21) Combined (1–21)
Size in bp
Total 35,077,646 4,608,605 39,686,251
Mean 2,698,280 576,076*** 1,889,821
Percent 88.4 11.6 100.0
All genes
Total 10,279 654 10,933
Mean 790.7 81.8*** 521
Percent of total 94.0 6.0 100.0
Unique genesa
Total 5,479 311 5,790
Mean 421.5 38.9*** 276
Percent of all 53.3 47.6 53.0
Annotated genes
Total 6,046 65 6,111
Mean 465.1 8.1*** 291.0
Percent of all 58.8 9.9 55.9
Unique total 2,308 18 2,326
Unique mean 177.5 2.3*** 110.8
Transcript size, mean in bp 1327.1 847.3*** 1144.3
Gene density, Mb21 288.9 142.4*** 233.1
Repetitive DNA, mean 15.9% 30.0%*** 21.2%
G+C, mean 52.3% 50.9%** 51.7%
aAt a BLAST cutoff value of 16e220.***The mean for the dispensable chromosomes is significantly different from that for the essential chromosomes at P,0.001 by one-tailed t test.**The mean for the dispensable chromosomes is significantly different from that for the essential chromosomes at P = 0.012 by one-tailed t test.doi:10.1371/journal.pgen.1002070.t002
Finished Genome of Mycosphaerella graminicola
PLoS Genetics | www.plosgenetics.org 7 June 2011 | Volume 7 | Issue 6 | e1002070

Dispensable chromosomes have been reported in other fungi
but they are significantly fewer and larger (from 0.7 to 4.9 Mb
with an average of about 1.5 to 2.0 Mb) than those in M.
graminicola (from 0.42 to 0.77 Mb) and mostly are composed of
repetitive DNA with few known genes [30]. Unlike the dispensome
of M. graminicola, the few genes on dispensable chromosomes in
other fungi often are pathogenicity factors [31–33] and whole
chromosomes may be transferred asexually [34]. Dispensable
chromosomes in other fungi are different from the dispensome of
M. graminicola except for the conditionally dispensable or lineage-
specific chromosomes reported recently in Nectria haematococca
(asexual stage: Fusarium solani) and other species of Fusarium [35–
36], which also were different from core chromosomes in structure
and gene content and contained numerous unique genes.
However, unlike those in M. graminicola, dispensable chromosomes
of Fusarium species had clear functions in ecological adaptation,
were transferred more or less intact among closely related species
[35] and did not show extensive recombination with core
chromosomes.
The high instability of the M. graminicola dispensome during
meiosis and mitosis would cause it to be eliminated unless it
provided a selective advantage to the pathogen at least under some
conditions. The unique genes with annotations indicated possible
functions in transcription or signal transduction. There also was an
enrichment for predicted pre-milRNAs, which may indicate that
parts of the dispensome are involved in gene regulation. Based on
dispensable chromosomes in other plant pathogens, genes on the
dispensome were expected to be involved with host adaptation or
Figure 3. Analysis of genes that are shared between dispensable chromosome 14 and the 13 core chromosomes of Mycosphaerellagraminicola isolate IPO323. Each chromosome is drawn to scale as a numbered bar around the outer edge of the circle, and the sequence wasmasked for repetitive DNA prior to analysis. Lines connect regions of 100 bp or larger that are similar between each core chromosome and thecorresponding region on chromosome 14 at 16e25 or lower. Chromosome 14 is an amalgamation of genes from all of the core chromosomes butthey are mixed together with no synteny. Genes on the other dispensable chromosomes were not included in this analysis.doi:10.1371/journal.pgen.1002070.g003
Finished Genome of Mycosphaerella graminicola
PLoS Genetics | www.plosgenetics.org 8 June 2011 | Volume 7 | Issue 6 | e1002070

Figure 4. Principal Component Analysis of: S, observed genes on the dispensome; O, observed samples of genes on the corechromosomes before mutation; and x, samples of genes from the core chromosomes after mutation. Mutation was simulated usingobserved frequencies of all mutations in families of transposable elements with ten or more copies, and included mutations from RIP and otherprocesses. Mutating the samples of genes from the core chromosomes always made them more similar to the observed value for the dispensome butonly rarely included the dispensome value (see panel C). This occurred primarily with codon preference and GC content by amino acid, which are thequantities that are least subject to natural selection for protein function. A, amino acid frequency using the values for the aligned sequence with thehighest GC content to build the table of mutation frequencies; B, codon preference using the consensus of the aligned sequences to make the tableof mutation frequencies covering only the 59 portion of each gene; C, codon preference using the values for the aligned sequence with the highest
Finished Genome of Mycosphaerella graminicola
PLoS Genetics | www.plosgenetics.org 9 June 2011 | Volume 7 | Issue 6 | e1002070

pathogenicity, yet so far no genes for pathogenicity or fitness of M.
graminicola have been mapped to the dispensome [37]. A more
interesting possibility is that the dispensome facilitates high
recombination among chromosomes and could provide a
repository of genes that may be advantageous under certain
environmental conditions. This hypothesis should be tested by
additional experimentation.
A recent comparison of the M. graminicola genome with that of
its closest known relative, the unnamed species S1 from wild
grasses in Iran, identified probable homologs for all of the
dispensome chromosomes in the sibling species except for
chromosome 18 [38]. These putative homologs presumably are
dispensable also in species S1, but this has not been proven and
only one isolate has been sequenced. Species S1 and M. graminicola
are thought to have diverged approximately 10,500 years ago [39],
concomitant with the domestication of wheat as a crop. Therefore,
unlike dispensable chromosomes in other fungi, the dispensome of
M. graminicola appears to be relatively ancient and has survived at
least one speciation event. Analyses of two recently sequenced
Dothideomycetes with Mycosphaerella sexual stages, M. pini
(asexual stage: Dothistroma septosporum) and M. populorum (asexual
stage: Septoria musiva), showed that they contained clear homologs
of all of the core chromosomes of M. graminicola, but none of their
chromosomes corresponded to the dispensome (B. Dhillon and S.
B. Goodwin, unpublished). Taken together, these observations
indicate that the dispensome of M. graminicola most likely was
acquired prior to its divergence from a common ancestor with
species S1 more than 10,000 years ago, but after the split of the
M.graminicola-S1 lineage from that which gave rise to M. pini and
M. populorum. The mechanism for the longevity of this dispensome
with no obvious effects on fitness is not known.
More than half of the genes on the dispensome and almost all of
the transposons also were present on core chromosomes.
Moreover, there was no increase in gene numbers so a simple
transfer of chromosomes from another species does not explain all
of the observations. Instead, we propose a new model for the
origin of dispensable chromosomes in M. graminicola by horizontal
transfer followed by degeneration and extensive recombination
with core chromosomes. The tight clustering of the dispensable
chromosomes in the PCAs, with the possible exception of
chromosome 14, indicates that they probably came from the
same donor species. However, it is difficult to explain why they are
so numerous. The most likely mechanism of horizontal transfer is
via a sexual or somatic fusion with another species that had eight
or more chromosomes, in which only a few genes were maintained
on each donated chromosome. Chromosome segments that were
redundant with the core set could be eliminated, leaving only those
that are unique or that could confer some sort of selective
advantage to the individual or to the dispensome. The fitness
advantage could be transitory or occur only under certain
conditions to allow those chromosomes to be dispensable, at least
on an individual or population basis. Another possibility is that the
numerous dispensable chromosomes are fragments from one or
two larger chromosomes that were broken, acquired additional
telomeres and lost content to result in their current, reduced
complements of genes. High recombination within chromosomes
and transfer of content between the donor and host chromosomes
must have occurred to explain the observed pattern of shared
genes.
The recombination hypothesis is supported by degenerated
copies of some unique genes that were found on core
chromosomes. These most likely represent genes that were copied
from core to dispensable chromosomes, after which the copy on
the core chromosome became inactivated, probably by RIP.
Duplication, diversification and differential gene loss were
proposed recently as the origin of lineage-specific gene islands in
Aspergillus fumigatus [40], but that process seems to be very different
from what occurred in M. graminicola. In A. fumigatus, large blocks of
genes with synteny to other chromosomes were found, the
opposite of what was seen for M. graminicola. The origin and
evolution of the dispensome in M. graminicola seems to be very
different from those reported for dispensable chromosomes in
other fungi [35]. Unlike other fungi in which single chromosomes
seem to have been transferred recently, the dispensome of M.
graminicola most likely originated by ancient horizontal transfer of
many chromosomes thousands of years ago. So far it is not known
to be conditionally dispensable, unlike dispensable chromosomes
in other fungi, which have clear roles in ecological adaptation.
The mesosyntenic analyses provided a new approach that
complements the use of genetic linkage maps to support whole-
genome assembly. Gene content was highly conserved on syntenic
chromosomes in the two distantly related species, but there was
little or no conservation of gene order or orientation. The
comparison of the version 1 assembly of M. graminicola with the
related S. nodorum genome sequence indicated scaffolds that should
be merged and others that were erroneously assembled into one
scaffold. Hence, mesosynteny validated the high-density genetic
analyses and may provide an additional tool for whole-genome
assembly for fungi where linkage maps do not exist or cannot be
generated. Groups of genes in S. nodorum that corresponded to
more than one group in M. graminicola may indicate scaffolds that
should be joined in S. nodorum or, more likely, may reflect
chromosomal rearrangements that have occurred since the
divergence of S. nodorum and M. graminicola from an ancient
common ancestor.
Considering their early divergence [41] relative to species within
the same genus, the degree of mesosyntenic conservation between
M. graminicola and S. nodorum is striking. However, it is very
surprising that the synteny only applied to gene content but not
order or orientation. In comparisons between other organisms,
synteny plots usually yield diagonal lines even between unrelated
species such as humans and cats [42]. The lack of diagonal lines in
the comparisons of S. nodorum with M. graminicola indicate a high
rate of shuffling of genes on chromosomal blocks that have
remained constant over long periods of evolutionary time. The
mechanism by which these small chromosomal rearrangements
occur is not known.
The greatly reduced number of cell wall-degrading enzymes
(CWDEs) in the genome of M. graminicola compared with other
sequenced fungal genomes might be an evolutionary adaptation to
avoid detection by the host during its extended, biotrophic latent
phase and thus evade plant defenses long enough to cause disease.
Similar loss of CWDEs in the ectomycorrhizal fungus Laccaria
bicolor was thought to represent an adaptation to a symbiotic
GC content to build the table of mutation frequencies covering only the 59 portion of each gene; D, codon usage using the values for the alignedsequence with the highest GC content to build the table of mutation frequencies but with all mutation frequencies cut in half; E, codon usage usingthe values for the aligned sequence with the highest GC content to build the table of mutation frequencies; and F, GC skew using the consensus ofthe aligned sequences to make the table of mutation frequencies. The first principal component always separated out the pre- and post-mutatedchromosome samples. The locations of the observed values for the dispensome (S) are circled.doi:10.1371/journal.pgen.1002070.g004
Finished Genome of Mycosphaerella graminicola
PLoS Genetics | www.plosgenetics.org 10 June 2011 | Volume 7 | Issue 6 | e1002070

lifestyle [43]. Based on these results we propose a novel, biphasic
mechanism of stealth pathogenesis. During penetration and early
colonization, M. graminicola produces a reduced set of proteins that
facilitate pathogenicity and function as effectors in other fungi.
Instead of the usual carbohydrate metabolism, nutrition during the
extended biotrophic phase may be by degradation of proteins
Figure 5. Comparisons of Mycosphaerella graminicola genome assembly versions 1 and 2 against that of Stagonospora nodorumisolate SN15. Scaffolds/chromosomes are ordered along their respective axes according to both decreasing length and increasing number. The 6-frame translations of both genomes were compared via MUMMER 3.0 [53]. Homologous regions are plotted as dots, which are color coded forpercent similarity as per the bar on the right. Amendments made in the version 2 assembly and their corresponding regions in assembly version 1 arecircled in red. Version 2 chromosomes 5 (B, circle II), 7 (B, circle I) and 10 (B, circle III) were derived from joined version 1 scaffolds 7 and 17 (A, circle II),10 and 14 (A, circle I) and 12 and 22 (A, circle III), respectively, validating the method. Observation of the mesosyntenic pattern also could be used toidentify inappropriately joined scaffolds. For example, M. graminicola v2 chromosomes 6 and 16 (B, circle IV) and 12 and 21 (B, circle V) were derivedfrom split version 1 scaffolds 4 (A, circle IV) and 9 (A, circle V), respectively. These scaffolds are characterized by an abrupt termination of themesosyntenic block at the split point as indicated by red lines (A, circles IV and V). A total of 21 predictions was made and 14 were validated.doi:10.1371/journal.pgen.1002070.g005
Finished Genome of Mycosphaerella graminicola
PLoS Genetics | www.plosgenetics.org 11 June 2011 | Volume 7 | Issue 6 | e1002070

rather than carbohydrates in the apoplastic fluid and intercellular
spaces. The large number of proteases expressed during the early
stages of the infection process supports this hypothesis. The
biotrophic phase terminates by a switch to necrotrophic growth,
production of specific cell wall-degrading enzymes and possibly by
triggering programmed cell death [5,9–10].
Stealth biotrophy raises the intriguing possibility that M.
graminicola and possibly other Dothideomycetes may have evolved
originally as endophytes or could be evolving towards an
endophytic lifestyle. The finished genome of M. graminicola
provides a gold standard [12] for this class of fungi, which is the
largest and most ecologically diverse group of Ascomycetes with
approximately 20,000 species, classified in 11 orders and 90
families, and provides a huge advantage for comparative genomics
to identify the genetic basis of highly divergent lifestyles.
Materials and Methods
Biological materialMycosphaerella graminicola isolates IPO323 and IPO94269 are
Dutch field strains that were isolated in 1984 and 1994 from the
wheat cultivar Arminda and an unknown cultivar, respectively.
Isolate IPO95052 was isolated from a durum (tetraploid) wheat
sample from Algeria. All isolates are maintained at the CBS-
KNAW Fungal Biodiversity Centre of the Royal Netherlands
Academy of Arts and Sciences (Utrecht, the Netherlands) under
accession numbers CBS 115943 (IPO323), CBS 115941
(IPO94269) and CBS 115942 (IPO95052). Mycelia of each isolate
were used to inoculate 200 mL of YG broth (10 g of yeast extract
and 30 g of glucose per L) and were cultured until cloudy by
shaking at 120 rpm at 18uC, after which the spores were
lyophilized, 50 mg of lyophilised spores were placed in a 2-mL
tube and ground with a Hybaid Ribolyser (model nu FP120HY-
Figure 6. Numbers of genes for proteases and plant cell wall (PCW) degrading polysaccharidases in the genomes of seven fungi withsequenced genomes. Genes for PCW-polysaccharidases were severely reduced in the genome of Mycosphaerella graminicola but proteases wereabout the same. The overall profile of the enzymes in M. graminicola was most similar to that of T. reesei than to any of the other plant pathogens.Species analyzed included the saprophytes Aspergillus nidulans (Anid), Neurospora crassa (Ncra), and Trichoderma reesei (Trees), and the plant pathogensFusarium graminearum (Fgram), Mycosphaerella graminicola (Mgram), Magnaporthe oryzae (Moryz), and Stagonospora nodorum (Snod).doi:10.1371/journal.pgen.1002070.g006
Table 3. Numbers of predicted enzymes degrading celluloseacross seven ascomycete species with sequenced genomes.
Saprophytesa Pathogensa
CAZy familyb Anid Ncra Trees Fgram Mgram Moryz Snod
GH5 cellulasesc 3 1 2 2 0 2 3
GH6 2 3 1 1 0 3 4
GH7 3 5 2 2 1 6 5
GH12 1 1 2 4 1 3 4
GH45 1 1 1 1 1 1 3
GH61 9 14 3 15 2 17 30
GH74 2 1 1 1 0 1 0
CBM1 8 19 15 12 0 22 13
Total cellulases 29 45 27 38 5 55 62
aSpecies analyzed included the saprophytes Aspergillus nidulans (Anid),Neurospora crassa (Ncra), and Trichoderma reesii (Trees), and the plantpathogens Fusarium graminearum (Fgram), Mycosphaerella graminicola(Mgram), Magnaporthe oryzae (Moryz), and Stagonospora nodorum (Snod).
bFamilies defined in the Carbohydrate-active enzymes database (www.cazy.org).
cGH5 is a family containing many different enzyme activities; only thosetargeting cellulose are included.
doi:10.1371/journal.pgen.1002070.t003
Finished Genome of Mycosphaerella graminicola
PLoS Genetics | www.plosgenetics.org 12 June 2011 | Volume 7 | Issue 6 | e1002070

230) for 10 s at 2500 rpm with a tungsten carbide bead. DNA was
extracted using the Promega Wizard Magnetic DNA Purification
system for food according to instructions provided by the
manufacturer.
Initial sequencing and assemblyWhole-genome shotgun (WGS) sequencing of the genome of M.
graminicola used three libraries with insert sizes of 2–3, 6–8, and 35–
40 kb. The sequenced reads were screened for vector using
cross_match, trimmed for vector and quality, and filtered to
remove reads shorter than 100 bases. WGS assembly was done
using Jazz, a tool developed at the JGI [44]. After excluding
redundant and short scaffolds, the assembly v1.0 contained
41.2 Mb of sequence in 129 scaffolds, of which 4.0 Mb (7.5%)
was in gaps (Table S8). The sequence depth derived from the
assembly was 8.8860.04.
Gap closure and finishingTo perform finishing, the M. graminicola WGS assembly was
broken down into scaffold-size pieces and each piece was
reassembled with phrap. These scaffold pieces were then finished
using a Phred/Phrap/Consed pipeline. Initially, all low-quality
regions and gaps were targeted with computationally selected
sequencing reactions completed with 4:1 BigDye terminator:
dGTP chemistry (Applied Biosystems). These automated rounds
included resequencing plasmid subclones and walking on plasmid
subclones or fosmids using custom primers.
Following completion of the automated rounds, a trained
finisher manually inspected each assembly. Further reactions were
then manually selected to complete the genome. These included
additional resequencing reactions and custom primer walks on
plasmid subclones or fosmids as described above guided by a
genetic map of more than 2,031 sequenced markers plus paired-
end reads from a library of Bacterial Artificial Chromosome
clones. Smaller repeats in the sequence were resolved by
transposon-hopping 8-kb plasmid clones. Fosmid and BAC clones
were shotgun sequenced and finished to fill large gaps, resolve
larger repeats and to extend into the telomere regions.
Each assembly was then validated by an independent quality
assessment. This included a visual examination of subclone paired
ends using Orchid (http://www-hagsc.org), and visual inspection
of high-quality discrepancies and all remaining low-quality areas.
All available EST resources were also placed on the assembly to
ensure completeness. The finished genome consists of 39,686,251
base pairs of finished sequence with an estimated error rate of less
than 1 in 100,000 base pairs. Genome contiguity is very high with
a total of 21 chromosomes represented, 19 of which are complete
and 20 of which are sequenced from telomere to telomere.
Genome annotationBoth draft (v1.0) and finished (v2.0) assemblies of M. graminicola
were processed using the JGI annotation pipeline, which combines
several gene predictors:1) putative full-length genes from EST
cluster consensus sequences; 2) homology-based gene models were
predicted using FGENESH+ [45] and Genewise [46] seeded by
Blastx alignments against sequences from the NCBI non-
redundant protein set; 3) ab initio gene predictor FGENESH [45]
was trained on the set of putative full-length genes and reliable
homology-based models. Genewise models were completed using
scaffold data to find start and stop codons. ESTs were used to
extend, verify, and complete the predicted gene models. Because
multiple gene models per locus were often generated, a single
representative gene model for each locus was chosen based on
homology and EST support and used for further analysis. Those
comprised a filtered set of gene models supported by different lines
of evidence. These were further curated manually during
community annotation and used for analysis.
All predicted gene models were annotated using InterProScan
[47] and hardware-accelerated double-affine Smith-Waterman
alignments (www.timelogic.com) against the SwissProt (www.
expasy.org/sprot) and other specialized databases such as KEGG
[48]. Finally, KEGG hits were used to map EC numbers (http://
www.expasy.org/enzyme/), and Interpro hits were used to map
GO terms [49]. Predicted proteins also were annotated according
to KOG [50,51] classification.
Following the machine annotation, manual validation and
correction of selected gene sets was performed by more than 30
annotators through a jamboree held at the JGI facilities in Walnut
Creek, California, USA. Annotators were trained by JGI staff and
continue to make modifications as necessary.
Potential microRNA-like small RNA (milRNAs) loci were
annotated using the INFERNAL software tool and based on 454
microRNA families (covarion models) from the RFAM database
version 9.1 [52]. milRNAs were predicted if their scores were
higher than thresholds, defined individually for each family, in the
same way as PFAM domains are predicted.
Experimental validation of the predicted milRNAs was done by
sequencing of an RNA library Total RNA was isolated from
spores germinated on water agar of M. graminicola isolate IPO323.
A small RNA library was prepared according to the protocol for
Illumina sequencing; small RNAs from 16–,50 nt were isolated
from gels, sequenced with an Illumina/Solexa single read DNA 50
cycles Genome Analyzer II, and compared by BLAST search
against the list of 535 predicted pre-milRNAs from the genome
sequence.
Assembly and annotations of the M. graminicola finished genome
are available from the JGI Genome Portal at http://www.jgi.doe.
gov/Mgraminicola and were deposited at DDBJ/EMBL/Gen-
Bank under the project accession ACPE00000000.
Microarray analysesWhole-genome tiling microarrays were designed by choosing
one 50-mer primer every 100 bases spanning the entire finished
genome. The arrays were manufactured and hybridized by the
Nimblegen Corporation with total DNA extracted from each field
isolate.
Principal component analyses of core and dispensablechromosomes
The CodonW package (http://codonw.sourceforge.net/) was
used for correspondence analysis of codon usage, which
mathematically is identical to principal component analysis.
CodonW requires as an input a set of coding sequences, usually
of individual genes. For chromosome-level analyses coding
sequences from the frozen gene catalog models for each
chromosomes were concatenated, forming 21 ‘superORFs’, one
for each chromosome. Because partial models may introduce some
potential frameshifts with internal stop codons they were removed
from the analysis; this did not affect the results as their total
number is low. CodonW has no graphical outputs, so they were
used as inputs for scatter plots in R (http://www.r-project.org/).
For M. graminicola only a similar analysis was done for repeats.
RepeatScout was run on the genome to produce a set of ab initio-
identified repeat sequences. From that set 81 distinct repeat
sequences, each with an occurrence exceeding 20 times in the
genome, were extracted. For each chromosome a vector of length
81 was calculated with the relative frequency of each repeat. A PC
analysis was run on the resulting vectors using the standard
Finished Genome of Mycosphaerella graminicola
PLoS Genetics | www.plosgenetics.org 13 June 2011 | Volume 7 | Issue 6 | e1002070

principal component function pcomp in R. Separation at the
repeat level means that these chromosomes have distinct
evolutionary profiles not only on the protein-coding level, but
also on other parts of the chromosomes, suggesting that entire
chromosomes may be transferred horizontally.
MesosyntenyDot plots were generated via MUMMER 3.0 [53] with data
derived from default PROmer comparisons between the M.
graminicola genome assembly versions 1 and 2 (http://genome.jgi-
psf.org/Mycgr3/Mycgr3.home.html) and S. nodorum SN15 assem-
bly version 2 [54], available under GenBank accessions CH445325–
CH445384, CH445386–CH445394 and CH959328–CH959365,
or AAGI00000000. Additional comparisons and statistical analyses
were made with custom-designed perl scripts.
Data from the M. graminicola version 2 comparison with S.
nodorum were used to test the efficacy of mesosyntenic comparisons
to assist the completion of fungal genomes. The mesosynteny-
based prediction of scaffold joining involved 3 stages: determining
the percent coverage of scaffolds/chromosomes for each scaffold/
chromosome pair (i.e., a function of the number of ‘dots’ per
‘block’); determining which scaffold/chromosome pairs were
significantly related and forming groups of joined scaffolds; and
filtering out background levels of similarity due to sequence
redundancy and incomplete genome assemblies.
Coordinates of homologous regions were obtained from
PROmer coordinate outputs (MUMMER 3.0) and used to
determine the percent of sequence covered by matches to a
sequence from the alternate genome for each sequence pair.
Where match coordinates overlapped on the sequence of interest,
those matches were merged into a single feature to avoid
redundancy. A perl script for conversion of PROmer coordinate
outputs to a table of percent coverage is available on request.
Coverage values for each M. graminicola-S. nodorum sequence pair
were subject to a binomial test for significance. The threshold for
significance (Psig)$0.95 was:
Psig~F x,p,nð Þ~Xx
i~0
n
i
� �pð Þi 1{pð Þn{1
where x is the percent coverage, n equals 100, and p is the
probability of chromosome homology.
The probability of chromosome homology (p) was equal to 1/
(21619), which was derived from the number of M. graminicola
chromosomes (21) and the approximate PFGE estimate of S.
nodorum chromosomes (19) [55]. This is the likelihood that a given
sequence pair represents related chromosomes. This model
assumes that no whole-genome/chromosome duplication events
have occurred previously between either fungal genome since
divergence from their last common ancestor.
The significance of percent coverage (Psig) was tested
bidirectionally for each sequence pair (i.e., for sequence pair A–
B, both coverage of sequence A by B and coverage of sequence B
by A were tested). Sequence pairs were significantly related if a
test in either direction was successful. A minimum length
threshold of 1 kb was also imposed for both sequences. Where
multiple scaffolds of M. graminicola were significantly related to the
same S. nodorum scaffold, those M. graminicola scaffolds formed a
‘joined group’ of candidates for representation of the same
chromosome.
All possible paired combinations of M. graminicola scaffolds
present within predicted joined groups were subject to filtering for
high levels of background similarity as follows:
retention~#joined groups (scaffolds joined)
#joined groups (either scaffold present)
The retention score is a measure of the reliability of scaffold join
relationships. Joins between M. graminicola scaffold pairs with
retention scores ,0.25 were discarded.
CAZy annotation and growth profilingAnnotation of carbohydrate-related enzymes was performed
using the Carbohydrate-Active Enzyme database (CAZy) annota-
tion pipeline [26]. BLAST was used to compare the predicted
proteins of M. graminicola to a collection of catalytic and
carbohydrate-binding modules derived from CAZy. Significant
hits were compared individually by BLAST to assign them to one
or more CAZy families. Ambiguous family attributions were
processed manually along with all identified models that presented
defects (deletions, insertions, splicing issues, etc.).
Growth profiling of S. nodorum and M. graminicola was on
Aspergillus niger minimal medium [56]. Cultures were grown at 25
degrees for seven days after which pictures were taken for growth
comparison. Carbon sources used were: glucose (Sigma); soluble
starch (Difco); alpha-cellulose (Sigma); Guar Gum (Sigma,
galactomannan); Oat spelt xylan (Sigma); and Apple Pectin
(Sigma).
Genome structure analysesComparisons of sequence content between core and dispensable
chromosomes was with Circos [57]. This tool draws ribbons
connecting sequences that align in different data sets.
Supporting Information
Dataset S1 The method and calculations for using mesosynteny
to predict scaffold joins from version 1 to version 2 of the
Mycosphaerella graminicola genomic sequence.
(XLS)
Figure S1 Aspects of the in vitro and in vivo lifestyle of
Mycosphaerella graminicola. 1. Typical colony appearance of M.
graminicola isolates grown under light (upper two rows) and dark
(lower low) conditions. Light stimulates yeast-like growth whereas
darkness induces filamentous growth. 2. Close-up of yeast-like
growth on V8 agar. 3. In vitro production of asexual fructifications
(pycnidia; arrow) on wheat leaf extract agar. 4. Penetration of a
wheat leaf stoma (arrow) by a pycnidiospore germ tube. 5.
Simultaneous penetration of a wheat leaf stoma by three germ
tubes of sexual airborne ascospores (arrows) that are transported
over vast distances. 6. Colonization of the mesophyll tissue by an
intercellular hypha (arrows) during the symptomless biotrophic
phase of pathogenesis. 7. Initiation (arrow head) of a pycnidium in
the substomatal cavity of a wheat leaf. 8. Ripe pycnidia in a
primary leaf of a susceptible wheat seedling. High humidity
stimulates the extrusion of cyrrhi, tendril-like mucilages containing
asexual pycnidiospores that are rain-splash dispersed over short
distances. 9. Typical infection of the primary leaf of a resistant
cultivar. Note the low fungal density in the apoplast (arrow) and
the response of the mesophyll cells (arrow head), particularly the
chloroplasts, to the presence of intercellular hyphae. 10. Typical
symptoms on a primary seedling leaf of a highly susceptible wheat
cultivar. 11. Typical response on a primary leaf of a highly
resistant wheat cultivar. 12. Adult-plant evaluation plots are
inoculated at the adult plant stage with individual isolates using
air-driven equipment. 13. Symptoms on an adult plant flag leaf
Finished Genome of Mycosphaerella graminicola
PLoS Genetics | www.plosgenetics.org 14 June 2011 | Volume 7 | Issue 6 | e1002070
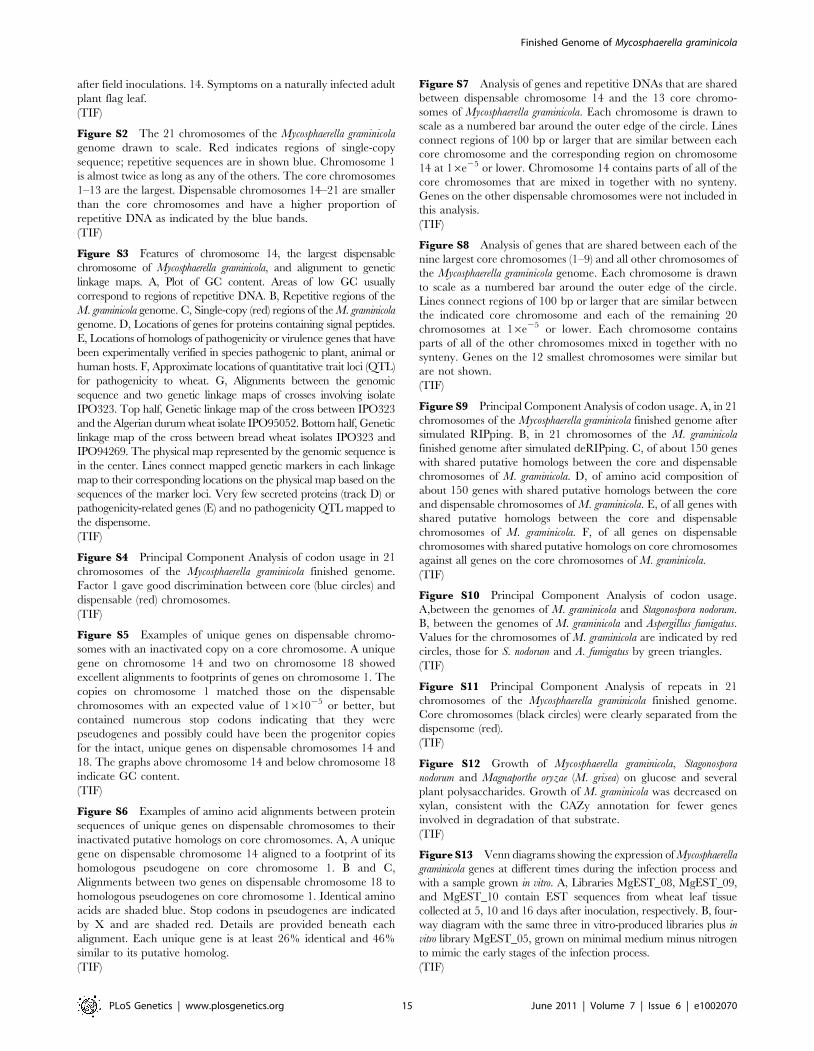
after field inoculations. 14. Symptoms on a naturally infected adult
plant flag leaf.
(TIF)
Figure S2 The 21 chromosomes of the Mycosphaerella graminicola
genome drawn to scale. Red indicates regions of single-copy
sequence; repetitive sequences are in shown blue. Chromosome 1
is almost twice as long as any of the others. The core chromosomes
1–13 are the largest. Dispensable chromosomes 14–21 are smaller
than the core chromosomes and have a higher proportion of
repetitive DNA as indicated by the blue bands.
(TIF)
Figure S3 Features of chromosome 14, the largest dispensable
chromosome of Mycosphaerella graminicola, and alignment to genetic
linkage maps. A, Plot of GC content. Areas of low GC usually
correspond to regions of repetitive DNA. B, Repetitive regions of the
M. graminicola genome. C, Single-copy (red) regions of the M. graminicola
genome. D, Locations of genes for proteins containing signal peptides.
E, Locations of homologs of pathogenicity or virulence genes that have
been experimentally verified in species pathogenic to plant, animal or
human hosts. F, Approximate locations of quantitative trait loci (QTL)
for pathogenicity to wheat. G, Alignments between the genomic
sequence and two genetic linkage maps of crosses involving isolate
IPO323. Top half, Genetic linkage map of the cross between IPO323
and the Algerian durum wheat isolate IPO95052. Bottom half, Genetic
linkage map of the cross between bread wheat isolates IPO323 and
IPO94269. The physical map represented by the genomic sequence is
in the center. Lines connect mapped genetic markers in each linkage
map to their corresponding locations on the physical map based on the
sequences of the marker loci. Very few secreted proteins (track D) or
pathogenicity-related genes (E) and no pathogenicity QTL mapped to
the dispensome.
(TIF)
Figure S4 Principal Component Analysis of codon usage in 21
chromosomes of the Mycosphaerella graminicola finished genome.
Factor 1 gave good discrimination between core (blue circles) and
dispensable (red) chromosomes.
(TIF)
Figure S5 Examples of unique genes on dispensable chromo-
somes with an inactivated copy on a core chromosome. A unique
gene on chromosome 14 and two on chromosome 18 showed
excellent alignments to footprints of genes on chromosome 1. The
copies on chromosome 1 matched those on the dispensable
chromosomes with an expected value of 161025 or better, but
contained numerous stop codons indicating that they were
pseudogenes and possibly could have been the progenitor copies
for the intact, unique genes on dispensable chromosomes 14 and
18. The graphs above chromosome 14 and below chromosome 18
indicate GC content.
(TIF)
Figure S6 Examples of amino acid alignments between protein
sequences of unique genes on dispensable chromosomes to their
inactivated putative homologs on core chromosomes. A, A unique
gene on dispensable chromosome 14 aligned to a footprint of its
homologous pseudogene on core chromosome 1. B and C,
Alignments between two genes on dispensable chromosome 18 to
homologous pseudogenes on core chromosome 1. Identical amino
acids are shaded blue. Stop codons in pseudogenes are indicated
by X and are shaded red. Details are provided beneath each
alignment. Each unique gene is at least 26% identical and 46%
similar to its putative homolog.
(TIF)
Figure S7 Analysis of genes and repetitive DNAs that are shared
between dispensable chromosome 14 and the 13 core chromo-
somes of Mycosphaerella graminicola. Each chromosome is drawn to
scale as a numbered bar around the outer edge of the circle. Lines
connect regions of 100 bp or larger that are similar between each
core chromosome and the corresponding region on chromosome
14 at 16e25 or lower. Chromosome 14 contains parts of all of the
core chromosomes that are mixed in together with no synteny.
Genes on the other dispensable chromosomes were not included in
this analysis.
(TIF)
Figure S8 Analysis of genes that are shared between each of the
nine largest core chromosomes (1–9) and all other chromosomes of
the Mycosphaerella graminicola genome. Each chromosome is drawn
to scale as a numbered bar around the outer edge of the circle.
Lines connect regions of 100 bp or larger that are similar between
the indicated core chromosome and each of the remaining 20
chromosomes at 16e25 or lower. Each chromosome contains
parts of all of the other chromosomes mixed in together with no
synteny. Genes on the 12 smallest chromosomes were similar but
are not shown.
(TIF)
Figure S9 Principal Component Analysis of codon usage. A, in 21
chromosomes of the Mycosphaerella graminicola finished genome after
simulated RIPping. B, in 21 chromosomes of the M. graminicola
finished genome after simulated deRIPping. C, of about 150 genes
with shared putative homologs between the core and dispensable
chromosomes of M. graminicola. D, of amino acid composition of
about 150 genes with shared putative homologs between the core
and dispensable chromosomes of M. graminicola. E, of all genes with
shared putative homologs between the core and dispensable
chromosomes of M. graminicola. F, of all genes on dispensable
chromosomes with shared putative homologs on core chromosomes
against all genes on the core chromosomes of M. graminicola.
(TIF)
Figure S10 Principal Component Analysis of codon usage.
A,between the genomes of M. graminicola and Stagonospora nodorum.
B, between the genomes of M. graminicola and Aspergillus fumigatus.
Values for the chromosomes of M. graminicola are indicated by red
circles, those for S. nodorum and A. fumigatus by green triangles.
(TIF)
Figure S11 Principal Component Analysis of repeats in 21
chromosomes of the Mycosphaerella graminicola finished genome.
Core chromosomes (black circles) were clearly separated from the
dispensome (red).
(TIF)
Figure S12 Growth of Mycosphaerella graminicola, Stagonospora
nodorum and Magnaporthe oryzae (M. grisea) on glucose and several
plant polysaccharides. Growth of M. graminicola was decreased on
xylan, consistent with the CAZy annotation for fewer genes
involved in degradation of that substrate.
(TIF)
Figure S13 Venn diagrams showing the expression of Mycosphaerella
graminicola genes at different times during the infection process and
with a sample grown in vitro. A, Libraries MgEST_08, MgEST_09,
and MgEST_10 contain EST sequences from wheat leaf tissue
collected at 5, 10 and 16 days after inoculation, respectively. B, four-
way diagram with the same three in vitro-produced libraries plus in
vitro library MgEST_05, grown on minimal medium minus nitrogen
to mimic the early stages of the infection process.
(TIF)
Finished Genome of Mycosphaerella graminicola
PLoS Genetics | www.plosgenetics.org 15 June 2011 | Volume 7 | Issue 6 | e1002070

Table S1 List of functional domains or other annotations for 65
genes on dispensable chromosomes 14–21 of the genome of
Mycosphaerella graminicola.
(DOCX)
Table S2 Analysis of small RNA sequences (generated on the
Illumina platform) for the presence of computationally predicted
pre-microRNA-like (milRNA) sequences in germinated spores of
Mycosphaerella graminicola isolate IPO323.
(DOCX)
Table S3 Best non-self BLAST hits for 654 called genes on
dispensable chromosomes of Mycosphaerella graminicola queried with
tblastn against a combined database containing the GenBank nt
and EST datasets plus M. graminicola version 2.0 and M. fijiensis
v1.0 from the Joint Genome Institute.
(DOCX)
Table S4 Numbers of predicted enzymes degrading hemicellu-
lose, pectin and cutin across seven ascomycete species with
sequenced genomes.
(DOCX)
Table S5 Total numbers of predicted CAZymes in Mycosphaerella
graminicola and selected ascomycetes.
(DOCX)
Table S6 PFAM domains that are expanded in the genome of
Mycosphaerella graminicola relative to those of five other Ascomyce-
tesa and two plant-pathogenic Stramenopilesb.
(DOCX)
Table S7 PFAM domains that are expanded in the genome of
Mycosphaerella graminicola relative to those of five other Ascomyce-
tesa but not the two plant-pathogenic Stramenopilesb.
(DOCX)
Table S8 Assembly statistics for the Mycosphaerella graminicola
version 1 (8.96draft) and version 2 (finished) sequences compared
to the 106 draft sequence of Stagonospora nodorum.
(DOCX)
Acknowledgments
We thank Els C. P. Verstappen, Jessica R. Cavaletto, Ineke Ph. De Vries,
and Odette Mendes for excellent technical support.
Author Contributions
Conceived and designed the experiments: SB Goodwin, IV Grigoriev, GHJ
Gema. Performed the experiments: S Ben M’Barek, AHJ Wittenberg, TAJ
Van der Lee, PM Coutinho, B Henrissat, V Lombard, SB Ware, C
Waalwijk. Analyzed the data: SB Goodwin, S Ben M’Barek, B Dhillon,
AHJ Wittenberg, CF Crane, JK Hane, AJ Foster, J Grimwood, J Antoniw,
A Bailey, B Bluhm, J Bowler, A Burgt, B Canto-Canche, ACL Churchill, L
Conde-Ferraez, HJ Cools, M Csukai, P Dehal, P De Wit, B Donzelli, HC
van de Geest, KE Hammond-Kosack, RCHJ van Ham, B Henrissat, A
Kilian, AK Kobayashi, E Koopmann, Y Kourmpetis, A Kuzniar, E
Lindquist, C Maliepaard, N Martins, R Mehrabi, JPH Nap, A
Ponomarenko, JJ Rudd, A Salamov, J Schmutz, HJ Schouten, I
Stergiopoulos, SFF Torriani, RP de Vries, A Wiebenga, L-H Zwiers, RP
Oliver, IV Grigoriev, GHJ Gema. Contributed reagents/materials/
analysis tools: CF Crane, JK Hane, A Aerts, E Lindquist, H Shapiro, H
Tu. Wrote the paper: SB Goodwin, GHJ Gema. Managed the Community
Sequencing Program: J Bristow
References
1. Eyal Z, Schare AL, Prescott JM, van Ginkel M (1987) The Septoria Diseases of
Wheat: Concepts and Methods of Disease Management. Mexico, DF:
CIMMYT.
2. Hardwick NV, Jones DR, Slough JE (2001) Factors affecting diseases of winter
wheat in England and Wales, 1989–98. Plant Pathol 50: 453–462.
3. McDougall P (2006) Phillips McDougall Agriservice Report. Scotland, UK:
Pathhead, Midlothian.
4. Linde CC, Zhan J, McDonald BA (2002) Population structure of Mycosphaerella
graminicola: From lesions to continents. Phytopathology 92: 946–955.
5. Kema GHJ, Yu D, Rijkenberg FHJ, Shaw MW, Baayen RP (1996) Histology of
the pathogenesis of Mycosphaerella graminicola in wheat. Phytopathology 86:
777–786.
6. Duncan KE, Howard RJ (2000) Cytological analysis of wheat infection by the
leaf blotch pathogen Mycosphaerella graminicola. Mycol Res 104: 1074–1082.
7. Jing H-C, Lovell D, Gutteridge R, Jenk D, Kornyukhin D, et al. (2008)
Phenotypic and genetic analysis of the Triticum monococcum–Mycosphaerella
graminicola interaction. New Phytol 179: 1121–1132.
8. Adhikari TB, Balaji B, Breeden J, Goodwin SB (2007) Resistance of wheat to
Mycosphaerella graminicola involves early and late peaks of gene expression. Physiol
Mol Plant Pathol 71: 55–68.
9. Kema GHJ, van der Lee TAJ, Mendes O, Verstappen ECP, Lankhorst RK,
et al. (2008) Large-scale gene discovery in the septoria tritici blotch fungus
Mycosphaerella graminicola with a focus on in planta expression. Mol Plant-Microbe
Interact 21: 1249–1260.
10. Keon J, Antoniw J, Carzaniga R, Deller S, Ward JL, et al. (2007)
Transcriptional adaptation of Mycosphaerella graminicola to programmed cell
death (PCD) of its susceptible wheat host. Mol Plant-Microbe Interact 20:
178–193.
11. Wittenberg AHJ, van der Lee TAJ, Ben M’Barek S, Ware SB, Goodwin SB,
et al. (2009) Meiosis drives extraordinary genome plasticity in the haploid fungal
plant pathogen Mycosphaerella graminicola. PLoS ONE 4: e5863. doi:10.1371/
journal.pone.0005863.
12. Chain PS, Grafham DV, Fulton RS, FitzGerald MG, Hostetler J, et al. (2009)
Genome project standards in a new era of sequencing. Science 326: 236–237.
13. Nierman WC, Pain A, Anderson MJ, Wortman JR, Kim HS, et al. (2005)
Genomic sequence of the pathogenic and allergenic filamentous fungus
Aspergillus fumigatus. Nature 438: 1151–1156.
14. Torriani SFF, Goodwin SB, Kema GHJ, Pangilinan JL, McDonald BA (2008)
Intraspecific comparison and annotation of two complete mitochondrial genome
sequences from the plant pathogenic fungus Mycosphaerella graminicola. Fungal
Genet Biol 45: 628–637.
15. Selker EU (2002) Repeat-induced gene silencing in fungi. Adv Genet 46:
439–450.
16. Cambareri EB, Jensen BC, Schabtach E, Selker EU (1989) Repeat-induced G-C
to A-T mutations in Neurospora. Science 244: 1571–1575.
17. Dhillon B, Cavaletto JR, Wood KV, Goodwin SB (2010) Accidental
amplification and inactivation of a methyltransferase gene eliminates cytosine
methylation in Mycosphaerella graminicola. Genetics 186: 67–77.
18. Gardner PP, Daub J, Tate JG, Nawrocki EP, Kolbe DL, et al. (2008) Rfam:
updates to the RNA families database. Nucleic Acids Res 37: D136–D140.
19. Lee H-C, Li L, Gu W, Xue Z, Crosthwaite SK, et al. (2010) Diverse pathways
generate microRNA-like RNAs and dicer-independent small interfering RNAs
in fungi. Molecular Cell 38: 803–814.
20. Fedorova ND, Khaldi N, Joardar VS, Maiti R, Amedeo P, et al. (2008) Genomic
islands in the pathogenic filamentous fungus Aspergillus fumigatus. PLoS Genet 4:
e1000046. doi:10.1371/journal.pgen.1000046.
21. Ma L-J, van der Does HC, Borkovich KA, Coleman JJ, Daboussi M-J, et al.
(2010) Comparative genomics reveals mobile pathogenicity chromosomes in
Fusarium. Nature 464: 367–373.
22. Kay S, Hahn S, Marois E, Hause G, Bonas U (2007) A bacterial effector acts as
a plant transcription factor and induces a cell size regulator. Science 318:
648–651.
23. Giles NH, Geever RF, Asch DK, Avalos J, Case ME (1991) Organization and
regulation of the qa (quinic acid) genes in Neurospora crassa and other fungi.
J Hered 82: 1–7.
24. Martin F, Kohler A, Murat C, Balestrini R, Coutinho PM, et al. (2010) Perigord
black truffle genome uncovers evolutionary origins and mechanisms of
symbiosis. Nature 464: 1033–1038.
25. Yun SH, Arie T, Kaneko I, Yoder OC, Turgeon BG (2000) Molecular
organization of mating type loci in heterothallic, homothallic, and asexual
Gibberella/Fusarium species. Fungal Genet Biol 31: 7–20.
26. Dean RA, Talbot NJ, Ebbole DJ, Farman ML, Mitchell TK, et al. (2005) The
genome sequence of the rice blast fungus Magnaporthe grisea. Nature 434:
980–986.
27. Cuomo CA, Guldener U, Xu J-R, Trail F, Turgeon BG, et al. (2007) The
Fusarium graminearum genome reveals a link between localized polymorphism and
pathogen specialization. Science 317: 1400–1402.
28. Cantarel BL, Coutinho PM, Rancurel C, Bernard T, Lombard V, et al. (2009)
The Carbohydrate-Active enZymes database (CAZy): an expert resource for
glycogenomics. Nucleic Acids Res 37: D233–D238.
29. Caracuel-Rios Z, Talbot NJ (2007) Cellular differentiation and host invasion by
the rice blast fungus Magnaporthe grisea. Curr Opin Microbiol 10: 339–345.
Finished Genome of Mycosphaerella graminicola
PLoS Genetics | www.plosgenetics.org 16 June 2011 | Volume 7 | Issue 6 | e1002070
30. Jones RN, Viegas W, Houben A (2008) A century of B chromosomes in plants:
so what?. Ann Bot 101: 767–775.
31. Jones N, Houben A (2003) B chromosomes in plants: escapees from the A
chromosome genome? Trends Plant Sci 8: 417–423.
32. Covert SF (1998) Supernumerary chromosomes in filamentous fungi. Curr
Genet 33: 311–319.
33. Miao VP, Covert SF, VanEtten HD (1991) A fungal gene for antibiotic
resistance on a dispensable (‘‘B’’) chromosome. Science 254: 1773–1776.
34. Hatta R, Ito K, Hosaki Y, Tanaka T, Tanaka A, et al. (2002) A conditionally
dispensable chromosome controls host-specific pathogenicity in the fungal plant
pathogen Alternaria alternata. Genetics 161: 59–70.
35. Wang C, Skrobek A, Butt TM (2003) Concurrence of losing a chromosome and
the ability to produce destruxins in a mutant of Metarhizium anisopliae. FEMS
Microbiol Lett 226: 373–378.
36. Masel AM, He CZ, Poplawski AM, Irwin JAG, Manners JM (1996) Molecular
evidence for chromosome transfer between biotypes of Colletotrichum gloeosporioides.
Mol Plant-Microbe Interact 9: 339–348.
37. Coleman JJ, Rounsley SD, Rodriguez-Carres M, Kuo A, Wasmann CC, et al.
(2009) The genome of Nectria haematococca: Contribution of supernumerary
chromosomes to gene expansion. PLoS Genet 5: e1000618. doi:10.1371/
journal.pgen.1000618.
38. Ware SB (2006) Aspects of sexual reproduction in Mycosphaerella species on
wheat and barley: genetic studies on specificity, mapping, and fungicide
resistance. Wageningen University, The Netherlands: Ph.D. thesis.
39. Stukenbrock EH, Jørgensen FG, Zala M, Hansen TT, McDonald BA, et al.
(2010) Whole-genome and chromosome evolution associated with host
adaptation and speciation of the wheat pathogen Mycosphaerella graminicola. PLoS
Genet 6: e1001189. doi:10.1371/journal.pgen.1001189.
40. Stukenbrock EH, Banke S, Javan-Nikkhah M, McDonald BA (2007) Origin and
domestication of the fungal wheat pathogen Mycosphaerella graminicola via
sympatric speciation. Mol Biol Evol 24: 398–411.
41. James T, Kauff F, Schoch CL, Matheny PB, Hofstetter V, et al. (2006)
Reconstructing the early evolution of fungi using a six-gene phylogeny. Nature
443: 818–822.
42. Housworth EA, Postlethwait J (2002) Measures of synteny conservation between
species pairs. Genetics 162: 441–448.
43. Martin F, Aerts A, Ahren D, Brun A, Danchin EGJ, et al. (2008) The genome of
Laccaria bicolor provides insights into mycorrhizal symbiosis. Nature 452: 88–92.44. Aparicio S, Chapman J, Stupka E, Putnam N, Chia J-M, et al. (2002) Whole-
genome shotgun assembly and analysis of the genome of Fugu rubripes. Science
297: 1301–1310.45. Salamov A, Solovyev VV (2000) Ab initio gene finding in Drosophila genomic
DNA. Genome Res 10: 516–522.46. Birney E, Durbin R (2000) Using GeneWise in the Drosophila annotation
experiment. Genome Res 10: 547–548.
47. Zdobnov EM, Apweiler R (2001) InterProScan – an integration platform for thesignature-recognition methods in InterPro. Bioinformatics 17: 847–848.
48. Kanehisa M, Goto S, Kawashima S, Okuno Y, Hattori M (2004) The KEGGresource for deciphering the genome. Nucleic Acids Res 32: D277–D280.
49. Ashburner M, Ball CA, Blake JA, Botstein D, Butler H, et al. (2000) GeneOntology: tool for the unification of biology. Nat Genet 25: 25–29.
50. Tatusov RL, Fedorova ND, Jackson JD, Jacobs AR, Kiryutin B, et al. (2003)
The COG database: an updated version includes eukaryotes. BMC Bioinfor-matics 4: 41.
51. Koonin EV, Fedorova ND, Jackson JD, Jacobs AR, Krylov DM, et al. (2004) Acomprehensive evolutionary classification of proteins encoded in complete
eukaryotic genomes. Genome Biol 5: R7.
52. Griffiths-Jones S, Moxon S, Marshall M, Khanna A, Eddy SR, et al. (2005)Rfam: annotating non-coding RNAs in complete genomes. Nucleic Acids Res
33: D121–D124.53. Kurtz S, Phillippy A, Delcher AL, Smoot M, Shumway M, et al. (2004) Versatile
and open software for comparing large genomes. Genome Biology 5: R12.54. Hane JK, Lowe RGT, Solomon PS, Tan K-C, Schoch CL, et al. (2007)
Dothideomycete–plant interactions illuminated by genome sequencing and EST
analysis of the wheat pathogen Stagonospora nodorum. The Plant Cell 19:3347–3368.
55. Cooley RN, Caten CE (1991) Variation in electrophoretic karyotype betweenstrains of Septoria nodorum. Mol Gen Genet 228: 17–23.
56. de Vries RP, Frisvad JC, van de Vondervoort PJI, Burgers K, Kuijpers AFA,
et al. (2005) Aspergillus vadensis, a new species of the group of black Aspergilli.Antonie Van Leeuwenhoek 87: 195–203.
57. Krzywinski M, Schein J, Birol I, Connors J, Gascoyne R, et al. (2009) Circos: Aninformation aesthetic for comparative genomics. Genome Res 19: 1639–1645.
Finished Genome of Mycosphaerella graminicola
PLoS Genetics | www.plosgenetics.org 17 June 2011 | Volume 7 | Issue 6 | e1002070