Finished Goods Made from Agricultural Materials - National ...
42
This PDF is a selection from an out-of-print volume from the National Bureau of Economic Research Volume Title: Inventories and Business Cycles, with Special Reference to Manufacturers' Inventories Volume Author/Editor: Moses Abramovitz Volume Publisher: NBER Volume ISBN: 0-870-14087-6 Volume URL: http://www.nber.org/books/abra50-1 Publication Date: 1950 Chapter Title: Finished Goods Made from Agricultural Materials Chapter Author: Moses Abramovitz Chapter URL: http://www.nber.org/chapters/c9135 Chapter pages in book: (p. 269 - 309)
-
Upload
khangminh22 -
Category
Documents
-
view
6 -
download
0
Transcript of Finished Goods Made from Agricultural Materials - National ...

This PDF is a selection from an out-of-print volume from the National Bureau of Economic Research
Volume Title: Inventories and Business Cycles, with Special Reference to Manufacturers' Inventories
Volume Author/Editor: Moses Abramovitz
Volume Publisher: NBER
Volume ISBN: 0-870-14087-6
Volume URL: http://www.nber.org/books/abra50-1
Publication Date: 1950
Chapter Title: Finished Goods Made from Agricultural Materials
Chapter Author: Moses Abramovitz
Chapter URL: http://www.nber.org/chapters/c9135
Chapter pages in book: (p. 269 - 309)
CHAPTER 12
Finished Goods Made from Agricultural Materials
Finished goods made from nonfarm raw materials are a fairlyhomogeneous group. Stocks move inversely during business cyclesof ordinary length because production, while sensitive to changesin demand, responds only after a certain interval and at a certainrate. The group of products now to be reviewedproducts fabri-cated from agricultural raw materialsdoes not present such auniform picture. At bottom, the reason for their diverse behavioris that they approximate only loosely the group we wish to distin-guish, namely, products whose production cycles are influencedmore largely by fluctuations in conditions of supply than by thosein conditions of demand. However, since many fabricated farmproducts do, in fact, meet this specification while others do not foridentifiable reasons, a review of the group will go far toward clari-fying the situation.
i Conformity to Cycles in Business and ProductionThe relation of manufacturers' stocks of finished goods madefrom agricultural raw materials to business cycles is diverse. Of theten full cycle indexes in Table r' three have fairly substantialvalues with a negative sign, one indicates regular positive conform-ity; six indexes arc low, and of these, three are negative, one ispositive, and two are zero. But even among the group that appar-ently responds inversely to changes in business activity, reasonsdiffer.
In marked contrast to the diverse behavior of this collection ofinventories to business cycles is their response to production in theirown industries (Table 56). Seven of the ten stock series seem toconform positively to production cycles as judged by the sign of thefull cycle index, and six of the seven do so regularly, as evidenced
S
272 CHAPTER TWELVE
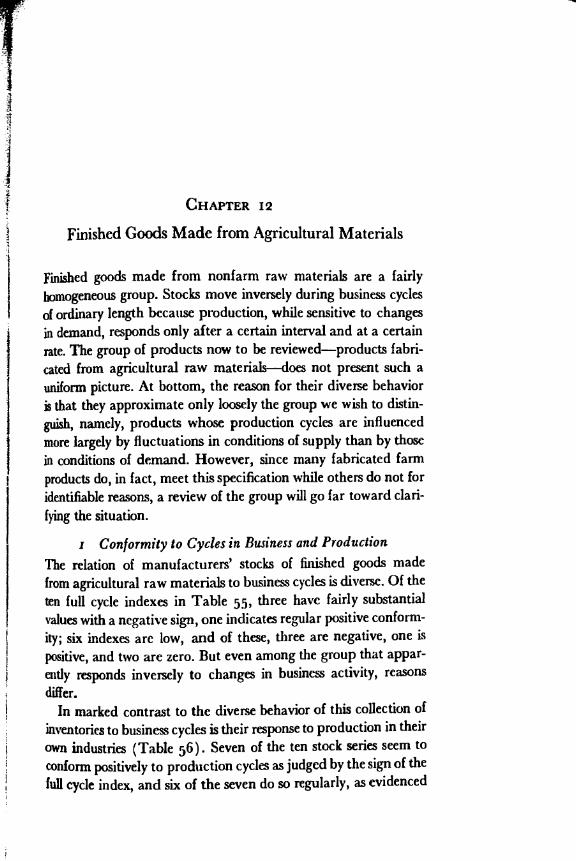
TAaLE 55Manufacturers' Stocks of Fabricated Agricultural Products
Conformity to Business CyclesvrAcdls
PO. OF MATCIIFti I5I)EX 05 CO.5I-0k%1j15 ToCYCLF5 WITH LXI. St SIX FL',
Lap. C-ontr. CycleEvaporated milk. case goods, 1921-38 1-V +50 0 -Shortenings, 1924-$8 V1l1-V + ioo -OCottonseed oil, crude. igig-8 l-IV too b7 -Cottonced oil, refined, 1919-38 l-IV so -Linseed oil. 1919-38 5 I-V 20 60Inedible tallow, 1919-38 1-IV 20 soBeef & veal in cold storage, ipig-8 I-V so +67 +60Pork in cold storage, i9ip-8 5 I-V +50 +33 oLard in cold storage, tgtg-8 S I-V +6o o +80Finished cattle hide leather, 1924-38 3 I-V toThe period is that covered by the number of full cycles in the series measured from troughto trough. Asterisks indicate that the Contraction and full q-cic indexes cover an addluotsalreference phase at the beginning or end.
by high indexes. It is interesting, moreover, that the stock seriesthat conform positively to production cycles include the three thatyielded high negative indexes of conformity to busincss cycles.
We can, therefore, say two things. First, the diverse responses ofstocks of fabricated farm products to business cycles are found inassociation with similar response to cycles in production. Secondly,of the commodities that move inversely during business cycles somedo so for reasons quite different from those that control the be-havior of nonfarm products. In the latter group, stocks moved in-versely to cycles in both business and production. Among farmproducts, however, some that behave inversely during businesscycles still conform positively to cycles in production. To gain someunderstanding of this behavior, we consider these commodities inseparate groups.
2 Crude and Refined Coltonseed OilStocks of cottonseed oil may be said to be a classic example of theinventory category studied in this chapter. They represent an ex-treme case of a commodity whose rate of production is governedby changes in the supply of raw materials; and since the oil,whether crude or refined, is durable and staple, the behavior of cot-tonseed oil stocks is in striking contrast to that of the other durablecommodities reviewed in the preceding chapter. It is convenient,therefore, to study cottonseed oil stocks first, then treat the otherfabricated farm products as variants,

* 12
-mon
th m
ovin
g av
erag
e.
TAB
LE 5
6
Man
ufac
ture
rs' S
tock
s of F
abric
ated
Agr
icul
tura
lPr
oduc
tsC
onfo
rmity
to P
rodu
ctio
n C
ycle
s
ocu
IND
ICA
TOR
OP
PRO
DU
CTI
ON
NO
. OF
CY
CLE
S
grA
CES
MA
TCH
EDW
ITH
XX
I'.
IND
EX TOEx
p.
OF
CO
NFO
P.M
ITY
PRO
DU
CTI
ON
Cnn
tr.C
ycle
Evap
orat
ed m
ilk, c
ase
good
sEv
apor
ated
milk
out
pUt,
1920
-37
5I-
v0
20+
20
Shor
teni
ngs
Shor
teni
ngs o
utpu
t, 19
23-4
03
I_v
+ 50
- 100
0
Cot
tons
eed
oil,
crud
eC
rude
cot
tons
eed
oil o
utpu
t, 19
20-4
05
I_v
+ 6o
+ 10
0+
100
Cot
tons
eed
oil,
refin
edR
efin
ed c
otto
nsee
d oi
l out
put,
1920
-40
5lI-
VI
+ 6o
+ 10
0+
8Li
nsee
d oi
lIn
edib
le ta
llow
Lins
eed
oil o
utpu
t, 19
22.3
8*In
edib
le ta
llow
out
put,
19 1
9-37
7 5
vIII
-Iv
I-v
.7'
+6o
75 + 20
100
+ 78
Bee
f & v
eal i
n co
ld st
orag
eB
eef,
froz
en &
pla
ced
in c
ure,
192
1-35
3I-
v+
100
± 10
0+1
00
Pork
in c
old
stor
age
Pork
, fro
zen
& p
lace
d in
cur
e, 5
921-
353
I-v
+100
+ 50
0+1
00
Lard
in c
old
stor
age
Lard
out
put,
1925
-37
3I_
v+
100
0+
100
Fini
shed
cat
tle h
ide
leat
her
Cat
tle h
idc
leat
her o
utpu
t, 19
2 1-
407
I_v
100
1410
0
274
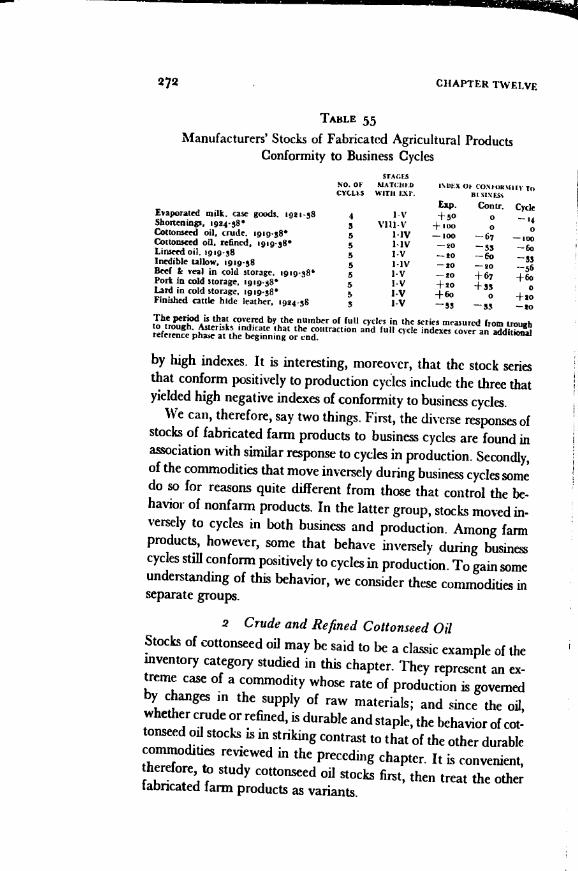
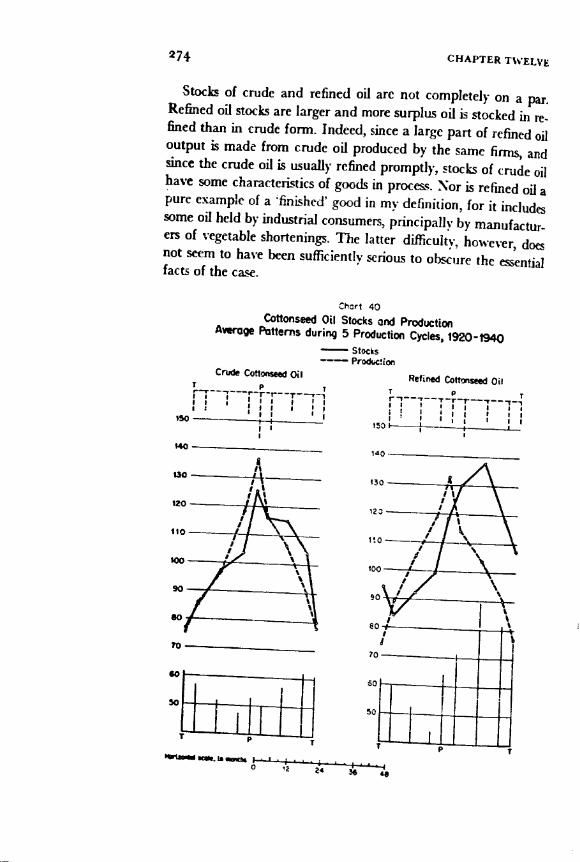
Stocks of crude and refined oil are not completely on a par.Refined oil stocks are larger and more surplus oil is stocked in re-fined than in crude form. Indeed, since a large part of refined oiloutput is made from crude oil produced by the same finns, andsince the crude oil is usually refined promptly, stocks of crude oilhave some characteristics of goods in process. Nor is refined oil apure example of a flnished' good in my definition, for it thcludsome oil held by industrial consumers, principally by manufactur.ers of vegetable shortenings. The latter difficulty, however, doesnot seem to have been sufficiently serious to obscure the essentialfacts of the case.
140
Ctrt 40Cottonseed oi Stocks and Production
Average Patterns during 5 Production Cycles5 1920-1940- StocProdc ion
Crude Cottonsee Oil Refined Coftons OiT p1 pr --------! i I. iiI j
I ;II I I950
150 I 1
70
60
so
1
140
130
123
910
100
90
50
50
TIb1 I
CHAPTER TWELVE
&

11SUJD FARM STOCKS
Stocks of both commodities appear to move inversely to businesscycles. The full cycle index of confonnity for crude oil during fivecycles is too, that for refined oil, 6o. In this respect the be-havior of these commodities resembles the nonfarm products sur-veyed in the preceding chapter. Unlike the latter, however, stocksof crude and refined cottonseed oil respond positively to fluctua-tions in production (Table 56 and Chart 40).
To understand the tendency for stocks to conform positively toproduction cycles, we must consider the conditions influencing out-put. The output of cottonseed oil, both crude and refined, is con-trolled largely by the supply of cottonseed. Cottonseed, being cheapand bulky, can be stored much more economically after it hasbeen reduced to oil. The production of crude oil, therefore, tendsto rise and fall with the supply of seed. And since the oil, once corn-pressed into its crude form, is usually promptly refined, the stockof crude oil acts, to a considerable degree, as an inventory of goodsin process, rising and falling in close conformity with output(Chart 4').
Chart 41
Cotton Crop and Production of Crude and Refined Cottonseed OilCrop Years
1916 '10 '20 '22 '24 '26
275
201B 016
14
12
lOgI8
' '34 '36 '38 '40L0ritIVC scolis
The relation between the stocks and output of refined oil is based
on a different principle. The supply of cottonseed and, therefore,the output of refined oil is governed by the size of the cotton crop(Chart 41); and the latter, in turn, is governed, in the short-run,
C
276 CHAPTER TWELVE
mainly by weather conditions. Hence the output of refined oil risesand falls independently of movements in the demand for oil. Stothof refined oil will tend to increase when output rises and to declinewhen output falls. They do not, however, typically rise as soon asoutput turns up, for usually some time will elapse before the risingtrend of production outruns the rate of utilization of oil. Similarly,when output falls, some time will elapse before production dropsbelow the rate of utilization. The peaks and troughs of stocks,therefore, tend to lag behind those of output (Chart 4°). More-over, if we assume that stocks and production fluctuate synchron-ously, the conformity indexes of refined stocks during 5 outputcycles 1920-40 are +20, +20, +11. But if we assume that stockstypically rise between stages II and VI of output cycles, the in-dexes run +6o, +100, +78.
This is not to say that the utilization of cottonseed oil is inde-pendent of its supply even in the shortrun.1 Refined cottonseed oilhas many uses in common with lard, the other principal edible fat,and with other animal fats and vegetable oils. Other things beingequal, when the supply of cottonseed oil rises in consequence of alarge cotton crop, its price tends to drop and it tends to be substi-tuted for competing fats and oils in the production of shortenings,salad oils, soaps, and many other commodities. That utilizationand production of refined cottonseed oil tend to move together isevidenced by the conformity indexes for refined oil output during7 cycles in the 'disappearance' of refined oil 1920-41 which run+100, +71, +100.2 But as might be expected, when the price ofoil declines, the oil tends to be stored in anticipation of a period of'Some additional explanation of the distjnctio between demand and utiliza-tion may he helpful. Demand for Cottonseed oil can rise because say, nationalincome increases, stimulating activity in industries using oil. Or it can risebecause the supply of substitute oils and fats declines, compelling heavier de.pendence on cottonseed oil. Changes in demand are accompanjtd by changesin the utilization of Cottonseed oil, but they are not regularly accompanied bychanges in the output, since that is governed by the size of the Cotton crop. Asindicated in the text, however, utilization is correlated also with output, sincea larger supply of cottonseed oil tends to reduce its price and to encouzagesubstitution for competing fats and oils. Economists will recognize that demandmeans demand in the schedule sense, while utilization means the amount re-moved from the market for further fabrication or consumption2 'Disappearance' is a measure of the utilization of o'J in further fabrication,computed by adjusting refined oil output for changes in stocks.

maSHED FARM STOCKS 277
wer output and higher prices. Consequently, cotton crops, cot-onseed oil production, the utilization of oil, and after an interval,stocks of oil, all move together and inversely to oil prices.
The production of cottonseed oil (and ultimately the size of thecotton crop) is probably the chief influence controlling cyclicalchanges in the volume of oil utilization. If it were the only signifi-cant factor we would expect the cycles in production and utiliza-tion to be so closely parallel that the conformity of stocks to bothwould be approximately the same.8
It is instructive to consider another simple case. If the utiliza-tion of cottonseed oil moved in cycles unrelated to its output, thatis, if utilization were influenced only from the side of dci nand, anincrease in utilization would tend to draw down stocks, at leastalter an interval in which utilization overtook and ran ahead ofproduction. A decline in utilization would cause stocks to accumu-lateagain, after an interval. In short, under these simple assump-tions stocks would tend to vary inversely to utilization, with a lag.
Neither model fits the case. The utilization of cottonseed oil isstrongly influenced by its rate of production because of the com-petitive relation of cottonseed oil with other fats and oils. But util-ization is influenced also by two factors on the side of demand: thesupply of competing fats and oils, and the level of business ortional income. I do not attempt to measure their importance di-rectly, but it may be inferred by comparing the behavior of pricesof cottonseed oil and its main competitor, lard, during businesscycles (Chart 42).
The similarity in the price movements of the two commoditiesindicates that they are close substitutes. When the supply of lard islarge, it is substituted for cottonseed oil which causes the price ofoil to decline in about the same degree as the price of lard. Thepositive conformity of both price series with business cycles indi-cates that the demand for fats and oils rises and falls with the levelof income. No other inference is open since the output of neither'Cases of this sort were typical among nonagricultural commodities. There theCyclical fluctuation in demand was the dominating influence on both ship-Iflflts and production, and stocks tended to vary inversely to both.4Conforinjty indexes for the wholesale price of refined cottonseed oil at NewYOt* (I' business cycles, 1891-1938) are +45, +45, +60; those for thewholesale price of lard ( business cycles, 1912-38) are + ,00, +6o, + too.
W cycles, 1914-21, arc omitted from both measures.
$

cats per poind30
Refinedcottonzeed oil
25
20
l5
I098
7
6
3
Chart 42Refined Cottonseed OH and Lard
Wholesale Prices, Annual Averages
1919 '21 '23 '25 '27 29 3I'33'33'37.LegQrilIOlCuCel.Si*cificatitns oaf wureea
ReIned coftenseed oil: cads per poue'd, N., prin9, summer, peltom.1919-33, Oeperime,t of Agnaifture; 1933-39, Bureau of Lo StatitiLord: cents per pouid, prim. contract; 8ureu of Labor Statistics.cauitroctions (thodid) and
are harked off by Ut. nt.ntIlyrelater. dhronclo9y.
commodity is closely related to business at large.5 The behavior ofshortenings production, the principal consumer of cottonseed oilduring the interwar period, supports our inference. The output ofshortenings conformed positively to business cycles; its conformityindexes were +100, +50, +67 for cycles, '924-38. Moreover,its cyclical swings were substantial. The amplitude of shorteningsproduction was 93.8 for cycles, '923-40; of cottonseed oil pro-duction itself, 114.8 for4 cycles, 1922-40.
The variety of factors affecting the utilization of cottonseed oilcauses the relation between stocks and utilization to be irregular.The factors influencing 'disappearance' from the side of demand,that is, the level of income and the supply of other fats and oils,would tend to produce an inverted relation, with stocks lagging.But disappearance also tends to rise and fall with cottonseed oilproduction. And the relation between production and stocks is5 The conformity indexes for lard production from federally inspected slaugh.ter (5 cycles, 191938) are +20, -2O, + It; those for refined cottonseed oilproduction ( cycles. 1913-38) are 2o, 0,
278CHAPTER TWELVE

p Th-i 'ITIlI I'I140 _______________ IiTi'I I
10
140
130
20
110
100
70
0 12 24 36
positive, with stocks lagging. This, of course, has its effect on the
relation between oil utilization and stocks. The net result is a draw.
Stocks do not exhibit any regular relation to cycles in utilization.
Conformity indexes for stocks during 7 cycles in the disappearance
of refined cottonseed oil, 1920-38, are o, 14, o. This, of course,
does not prove that stocks are not systematically affected by fluctu-
ations in the demand for oil. That could be true only if the demand
for oil were always constant, an assumption contrary to fact, for
the demand for cottonseed oil varies with both the level of business
and the supply of competing fats. The difficulty is that demand
acts on stocks only through its influence on the utilization of oil,
and utilization is influenced strongly also by the supply of oil. The
influence of demand is therefore obscured.This analysis enables us to understand the behavior of produc-
lion and stocks during business cycles. As might be expected, the
patterns of production of both crude and refined oil are very sun-
fiNISHED YAkM STOCKS 279
Chort 43
Cottonseed Oil Stocks and Productionsraq Patterns during 5 BusIness Cycles, 1919-1938
- Stocks-- ProductiOn
Crud. CottoniSed Oil Rstinid Cottonssed Oil
I P 7rirTTI I I II I II I I
I
80
280 CHAPTER TWELVE
ilar (Chart 43). Neither responds markedly to business cycles, al-though during the five interwar cycles, production rose more dur-ing contractions, on the average, than durbig expansions. This, inturn, reflects similar movements in the cotton crop.
The patterns of stocks are again similar to those of production,but an inverted relation to business cycles is more distinct. For the5 business cycles t 919-38, the indexes for crude oil were 00,----67, 100; for refined oil, 20, 33, 60. The utilization of oilwas, then, regularly larger than output during business expansionsand regularly lower during contractions due to the influence of thelevel of income on the use of oil. While utilization cycles resembleproduction cycles closely, for reasons already stated, changes in in-come must have been sufficient to keep use greater than outputwhen income was rising and lower than output when income wasdeclining.5
3 Cold Storage holdings of Pork, Lard, and BeefInventories of pork, lard, and beef held in storage at slaughteringplants diffcr from those of cottonseed oil in a vital respect: thestocks of animal products are relatively perishable. Hence theirprimary function is to smooth out seasonal fluctuations in themarketing of hogs and cattle. Only necessary working inventory iscarried over from seasons of slack to those of heavy marketings.'Cottonseed oil inventories also have a seasonal function, but, in ad-
' In ideal circumstances, the correlation of utilization with business activityshould tend to produce reference cycles in stocks that are related to businessinversely and with a lag, rather than with a lead, as seems to have been thecase. This departure from expectations is probably partly due to the patternof Cottonseed oil production itself during the cycles covered by the data(Chart 43). It may be due in part also to the influence of changes in the sup-ply of competing goods on the demand for cottonseed oil.'In response to an inquiry about the character of cold storage stocks of meat,H. B. Arthur, Manager of the Commercial Research Department of Swift andCompany, writes (June 24, 1q42):"Your inquiry as to what proportion of frozen meats are surplus and what pro-portion are in process of distribution: In one sense none of these meats are sur-plus and all of them are in process of distribtI0 That is, meats are putin frozen storage almost entirely for the purpose of carrying surplus supplieswhich result from the flush marketing periods over into the season whensmaller livestock niarketings would otherwise result in shortages. The answerto the inquiry is, therefore, that practically all of the frozen meats are 'surplus'

jNlSUED FARM STOCKS 281
they serve to carry over supplies from years of relativelyheavy production or light demand to years when these conditionsre reversed.Cold storage holdings of meat and lard must consequently move
together with production (Table 56 and Chart 44), not becauseproduction outruns consumption when output is high but ratherbecause the seasonal carryover is large in years of heavy animalslaughter.
To understand the behavior of these three kinds of inventoryduring business cycles, we must know how their output behaves.The production of all three products moves in close conformity tothe rate of animal slaughter (Table 57 and Chart 45). The sim-ilarity between the three products, however, ends here. There is nofirm evidence of a regular relation between pork and lard produc-
only in the seasonal sense and that they are 'in process of distribution' in theannual sense. The amount of frozen meats carried over from one year to thenext is extremely small, although the 'out of stock' condition may come at onedate for one particular cut and at a little later date for another.
Beef is frozen in very small amounts compared with pork items. Frozen beefconsists almost entirely of meat to be used in the manufacture of sausage, beefspecialties and leaner types of certain cuts used in lower-priced restaurants andmiall institutions. Beef is frozen principally in the fall months when the so-called 'grass' cattle are marketed in large numbers. The only reason why thismeat is frozen is that the cattle that produce this particular type of beef aremarketed in the fall of the year in such numbers as to produce a surplus. Insome other seasons this grade of beef is not produced currently in sufficientquantities to take care of the demand.
Beef is not placed in cure as a result of such market factors as a decline inthe demand for beef, since the amount of beef that is cured is an insignificantpart of the supply and consists principally of certain cuts, such as briskets andbeef hams and rump butts. The briskets are put into cure throughout the year,depending on an anticipated demand for corned beef. The beef hams and rumpbutts come from lean cattle which are marketed in largest numbers in the fall.The rump butts make corned beef and the beef hams are usually cured to pm-duos dried beef. There is, of course, a very considerable demand for all ofthese cuts in the frozen state, and the curing is not a matter of storing surplusesbut rather of preparing the product to meet a particular demand for beef thatba, been cured in this way.
In the case of pork there is a large surplus produced during the winter anda Comparatively small supply in the summer. As stated above there is verylittle pork held over from one year to the nest, Storage is a matter of smooth-mg the seasonal flow to market. In the case of smoked meats such as hams andbacon, the season of large supply is in the winter, whereas the season of largedemand is in the summer."
S

Col
d st
orag
eld
lnga
ot p
ork
POrk
I ro
zsn
or p
lace
d In
cur
s
140
130
120
110
100 90 80 70 60 50
3 cy
cle.
192
1-19
357
pT
1TT
T1i
lI
II
I
Cha
rt 4
4F
roze
n an
d C
ured
Mea
t Pro
duct
s an
d La
rd, C
old
Sto
rage
Hol
dtng
s an
d O
utpu
tA
vera
ge P
atte
rns
durL
ng O
utpu
t Cyc
les
Col
d 51
0409
. hol
dIng
s of l
ard
-- L
ard
prod
uctio
n3
cycl
es, 1
925-
1937
130
120
Ito 100 90 60 50
NW
Inm
unm
,I'lI'
l4,l
0It
SC35
4s50
p.T
rrLI
III
Ip
1'
II
7p
7
140
130
120 60 50
T
Col
d st
orag
e ho
ldIn
gs o
f 91s
fG
ist,
froz
is o
r pla
cid
In c
urs
3 cy
cles
, 192
1-19
33P
7I
111
1-I
ii
i':
pI

I
- rk
frzS
ieV
_=,
hut
rTm
so 70
tii
Cho
ri45
Fro
zsn
and
Cur
ed M
eat P
rodu
cts
and
Lard
SS
'0Q
S P
atte
rns
of O
utpu
t dur
tnq
Sla
ught
er C
ycle
s-
e..f.
fron
or $
QN
I Ia
I5
140
150
ISO
150
____
____
itoA i.&
110
120
A11
011
0__
___
*00
70 00
NuI
IsIIC
s,Ia
'-
C c
yd,
1-iIS
6
1J1T
'h
70
T
CttI
Sou
lr
T

284
Pork, frozen orplaced in cure
Lard productionBeef, frozen or
placed in cure
CHAPTER TWELVE
TABLE 57Lard, Pork, and Frozen and Cured Beef Production
Conformity to Cycles in Animal Slaughter
Pork, frozen or placed in
NO. INDEX OF CONFORMIIY ToINDICATOE OF OF
ANIMAL SLAUGHTEX C'CLES FXp. Contr. Cycle
Commercial hog, 1920-35 3 +100 4-ioo +100Commercial hog, 1920-37 4 +zoo +6o +100Cattle underfed.inlpection, 1921-35 2 +100 +100 +100
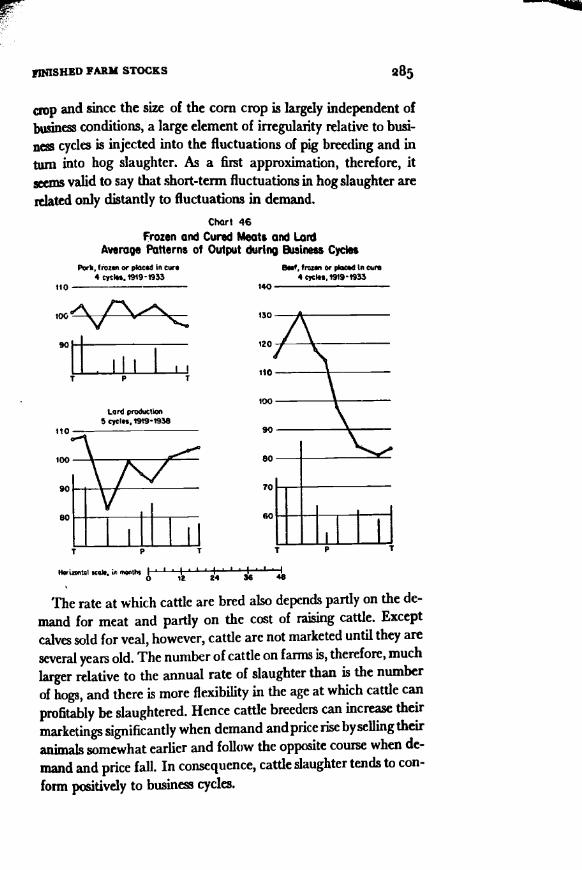
tion and business cycles. Beef production, though moving in longercycles than general business, appears to be influenced to a markeddegree by the fluctuations in demand that accompany businesscycles (Table 58 and Chart 46). The apparently high positive con-formity index for pork production is belied by the extremely irregu-lar reference cycle patterns in Chart 46.
The causes of this disparate behavior go back to the conditionsunder which hogs and cattle are raised. Most hogs by far areslaughtered when they are 8-jo months old. With few exceptionsit is unprofitable to slaughter younger or older hogs. As a result,the number of hogs slaughtered in a given season is governedlargely by the number farmers considered it profitable to breed 2-
TABLE 58Lard, Pork, and Frozen and Cured Beef Production
Conformity to Business CyclestrACES
NO. MATCHEDOF WITH
CYCLES EXP.
INDEX OF (mNF0E,4nyTO IUSINES$
Exp. Coon-. Cycle
i6 months earlier (the normal period of gestation of pigs is fourmonths). In part, of course, changes in the incentive to raise hogsdepend upon demand. Increases in demand will tend to stimulatehog marketings, but only after i 2-16 months. In part, however, theincentive to raise pigs depends upon the price of feed, in the UnitedStates chiefly corn. Since the price of corn moves inversely to the
cure, 1919-33Lard production, 1919-38Beef, frozen or placed in
45
I-VI-V
0+20
+5020 +7!+11
cure, 1919.33Beef, frozen or placed in 4 I-V o +100 +43
Cure, 1919.33 4 I-TV 0 +100 +100
9°it.
110
100
90
80
Lard production5 cycIss. 19191938
IIP I
120
Ito
100
N untalic .,irmontl, I' 'I'' I0 Ia 24 34 48
The rate at which cattle are bred also depends partly on the de-mand for meat and partly on the cost of raising cattle. Exceptcalves sold for veal, however, cattle arc not marketed until they areseveral years old. The number of cattle on farms is, therefore, muchlarger relative to the annual rate of slaughter than is the numberof hogs, and there is more flexibility in the age atwhich cattle canprofitably be slaughtered. Hence cattle breeders can increase theirmarketings significantly when demand andprice rise byselling theiranimals somewhat earlier and follow the opposite course when de-mand and price fall. In consequence, cattle slaughter tends to con-form positively to business cycles.
IJNISIIED FARM STOCKS 285
p and since the size of the corn crop is largely independent ofjsiness conditions, a large element of irregularity relative to busi-
n cycles is injected into the fluctuations of pig breeding and inturn into hog slaughter. As a first approximation, therefore, itse,ms valid to say that short-term fluctuations in hog slaughter arerelated only distantly to fluctuations in demand.
Chort 46Frozen and Cured Meats and Lord
Average Patterns of Output during Bisiness CyclesPorli, frozen or plocid in cu,. Beet, frozen or piaCSd In core
4 cycles. 19191933 4 cycles, 1919-1933110 140
lOG 130
80
70

286 CHAPTER TWELVE
The fluctuations of pork, lard, and beef inventories are consist.ent with these conditions in the animal breeding industry. As Table55 indicated, cold storage holdings of pork and lard do not appeto be related to business cycles, while stocks of beef and veal con-form positively. The full cycle indexes for the two hog productswere o and +20; for beef and veal, the full cycle index was +6o.
4 Inedible TallowThe commodities reviewed above illustrated how the productionof goods fabricated from agricultural raw materials is sometimescontrolled, in the short-run, by the output of the raw materialsrather than, as is more usual in manufacturing, by changes in de-mand. The use of agricultural raw materials, however, is not de-cisive in this respect. Indeed, it is neither necessary nor sufficient.Although farm products furnish the most important examples, thesupply of a raw material may change independently of demandwhenever it is a byproduct, whether of agriculturai origin or not.On the other hand, the fact that the raw material fluctuates, in theshort-run, independently of demand does not necessarily meanthat the rate of output of the fabricated conunodity will followsuit. The output of the fabricated conunodity can be divorcedfrom the independent cyclical variations in the supply of raw ma-terials almost wholly, or in some degree, if one or more of severalconditions supervene. (a) If the raw material is durable and canbe stored economically, stocks can be drawn down in good timesand allowed to accumulate in recessions, while the Consumptionof the raw material rises and falls with the fluctuations in demandfor fabricated products. Cotton and rubber, reviewed in ChapterJO, are good examples. (b) If the material is a byproduct whoseoutput, relative to the major product, is not invariant, its supplycan be enlarged at special expense. Tallow, the next commodity tobe studied, is an example. (c) If a considerable portion of the rawmaterial supply comes from abroad, imports are likely to rise andfall in response to the demand for the fabricated commodity andto offset, at least in part, fluctuations in the domestic portion of thesupply of materials. Linseed oil and leather production are ex-amples we shall review below. As stated, the freedom from fluctu-ations in raw material supply that these conditions gain for manu-

fiNISHED FARM STOCKS 287
facturing operations may be great or small, but when the condi-tions are present, the situation is worth separate notice and study.
Inedible tallow is a puzzling case in point.' Produced largelyfrom the fatty wastes of slaughtered cattle and, to a much smallerextent, from those of sheep and lambs, it is a byproduct of meatproduction. Not all tallow, however, is produced by meat packersunder true byproduct conditions. In large part it is manufacturedby rendering plants which purchase fatty wastes from local slaugh-terers and convert them into tallow and grease. The productionof the two divisions of the industry has been estimated by L. B.Zapoleon (Table 59).
TsiInedible Tallow Produced by Meat Packers and Others
(millions of pounds)
Inedible Animal Fats in the U. S., Fats and Oils Studies, , Stanford Univer-sity, Food Research Institute, Dec. 1929, p. 107.
The United States Tariff Commission writes (Report to theCongress on Certain Vegetable Oils, Whole Oil and Copra, No.41, 1932, pp. 222-4):
"Inedible tallow is derived principally from such fat of cattle andsheep as can not be utilized for food purposes. . . . Since 19i4 the re-covery [of tallow] has increased more than the total production ofmeat, evidencing a greater utilization of waste animal fats. . . the in-crease in production of inedible tallow was mainly by producers otherthan the packers.. . local rendering plants distributed in urban cen-ters. . . . The bulk of the increase has come from the local renderers....
The two principal divisions of the industry stand on a differentfooting as far as expansion is concerned. Speaking broadly, the pack-ers recover now about the maximum amount of inedible fats and willprobably continue to do so irrespective of price so long as it covers theco5t of recovery. Production by renderers, however, must be affectedlargely by price, for they are not in the position of utilizing a by-prod-
'The chief use of tallow is in the manufacture of soap, of which it is the prin-cipal raw materiaL
1914 1919 1921 1923 1925 1927Packers 164 875 152 177 165 171Others 77 875 207 214 234Total 197 252 327 384 378 404
288
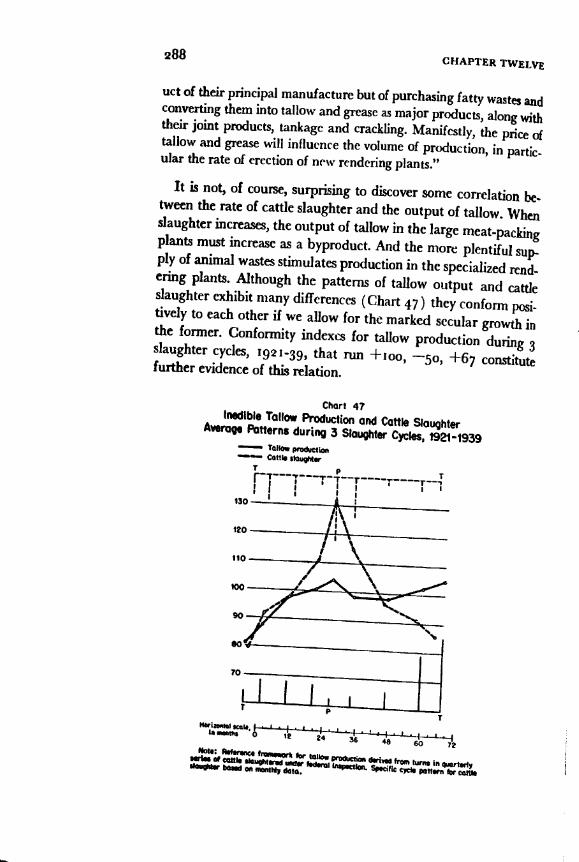
uct of their principal manufacture but of purchasing fatty waste andconverting them into tallow and grease as major products, along withtheir joint products, tanicage and crackling. Manifestly, the price oftallow and grease will influence the volume of production, in partie..ular the rate of erection of new rendering plants."
It is not, of course, surprising to discover some correlation be-tween the rate of cattle slaughter and the output of tallow. Whenslaughter increases, the output of tallow in the large meat-paclgplants must increase as a byproduct. And the more plentiful sup-ply of animal wastes stimulates production in the specialized rend..ering plants. Although the patterns of tallow output and cattleslaughter exhibit many differences (Chart 47) they conform posi-tively to each other if we allow for the marked secular growth inthe former. Conformity indexes for tallow production duringslaughter cycles, 1921-39, that run +ioo, 50, +6 constitute
further evidence of this relation.
Chart 47Inedible lallow Producffor and Cattle Slaughter
Average Patterns during 3 Slaughter Cycles, 1921-1939Thilo, WodvClIøu,CttIs IlugI*sr
Ic.I. -Ia..nth, 0 '2 24bQ 12
Not.: Rsfr,for bib. PCO 'Clion
4sri,s from lurn in qusrte,jybouçIt uiidir fodirni IronctiS.c,n cxci, ponom, for ccitt.
do.. bONd on WnthI døl.
CHAPTER TWELVE

FINISHED FARM STOCKS
Chart 48Wholesale Prices of Inedible Tallow and
TallowMeal Production RatIo*
* BeefS veal. lOIT). GM flGltiQfl.Ccflfr@Ctve%$ (shaded) and eipwslons(msliaded) ore marked off
lIve yearly nf*rence dwnoloj.
iced
289
What is surprising is that the recovery of tallow does not seem tohave been sensitive to changes in its price, certainly not to inter-annual movements (Chart 48). The sharp decline in prices be-tween 1928 and 1932, for example, did not prevent a concomitantincrease in the rate of tallow recovery. Indeed, the dominant im-pression of Chart 48 is that the rate of tallow recovery per poundof meat has moved inversely to tallow prices. Though prices varypositively with busiiiess cycles the tallow-meat production ratio doesnot respond in any regular fashion to prosperity and depression.In the cycles of 1918-20, 1921-24, and 1923-26 it moves positivelywith business, but in the cycles of 1919-20, 1920-23, 1929-37, and1932-38 it moves inversely. The effect of the violent cycle of 1927-32 IS hardly noticeable.
I cannot explain this perverse behavior, but it is consistent withother characteristics of tallow output and stocks. For example, inthe interwar period the rate of cattle slaughter tended to vary withbusiness cycles.9 The influence of the irregular movements of therate of tallow recovery per pound of meat, however, was sufficientto make the output of tallow during business cycles irregular as
Sec above, Sec. 3. The conformity indexes of cattle slaughter to the 5 inter-war business cycles were +60, + 100, +78.

CHAPTER TWELVE
well. The full cycle index of the conformity of tallow output was +r r, and the average reference cycle pattern of tallow output, despite marked specific cycles, exhibits little except secular growth of output (Chart 49) .
Chart 49
Inedible Tallow Production, Average Patterns
---- 5 specific cycles, 1919-1937 -- 5 reference cycles •. 1919-1938
T P T r-:---1---1--T1-f11 1 1 I 1 I I
120 ---------''-+---
80
I I I I I T p T
Horizontal scale, in months 0 12 24 36 48
It appears, therefore, that despite a local rendering industry presumably able to increase output in response to demand, production of tallow was not, in the interwar period, sensitive to shortrun changes in demand as indicated by prices. Instead, it fluctuated in cycles of its own, influenced partly by the rate of animal slaughter and partly by other factors. As a result, the relation of tallow stocks to production and business cycles is similar to that of cottonseed oil and other commodities with the same characteristics. Stocks conform positively to production cycles and inversely to business cycles, with some tendency to lead the latter (Chart 50). The conformity indexes of stocks during 5 production cycles I 9 I 9-37 were +6o, +2o, +78; during 5 business cycles 1919-38, -2o, -2o, -s6 when stages I-IV were matched with expansions.
5 Linseed Oil
The behavior of linseed oil stocks permits a somewhat fuller development of the idea first encountered in the review of tallow inventories. Variations in the supply of domestic raw materials, in this

FINISHED FARM STOCKS
130
120
110
100
90
80
70
0
Chart 50biedible Tollow Stocks and Production, Average Patterns
- StocksProductj
5 Production Cycles, 1919-1937
El---------
T
130
110
100
90
80
70
5 BusIness Cycles, 1919-1938I p1fTTvr1r1
II; I,
1 '°H IHip
0 12 24 36 48
case flaxseed, influence the output of linseed oil, but again anotherfactor intervenes to enable production to proceed with some de-gree of independence of raw material supply and thus to be ad-justed more closely to demand than in the cases of cottonseed oiland hog products.
The fact that both are vegetable oils invites comparison betweencottonseed oil and linseed oil. With respect to the former, we foundthat output cycles were dominated by cycles in the cotton crop,since the cottonseed itself could not be stored economically; hencethe production of oil was not correlated significantly with busi-ne cycles. The domestic crop of flaxseed does not impose itsown pattern upon the production of linseed oil nearly as strictly.The difference reflects the different degree to which operations inthe two industries depend upon the size of the domestic seed crop.While cottonseed oil is made almost exclusively from Americancottonseed, approximately half of our linseed oil in recent yearshas been pressed from imported flaxseed. The production of flax-
T
291

S
292
seed in the United States controls the quantity of linseed oil pro-duced from domestic materials, but year to year changes in thetotal output of linseed oil often disagree with those of domestic flax-seed output in direction and size (Chart 51 ). The balancing factoris the quantity of linseed oil produced from imported seed.'°
IIa
Chart 51Floxseed and Linseed Oil Production
i i j I i I
y
I j'i !i\iLin1ied oil o6x.d
from foreign mOlerinhiliii - III phi.1'28 '30 '32 '34 '36 '38
'I
CUAPTER TWELVE
T1 1 40
30
-20
'40
S
0to
87
6
5
Logarithmic scamIjesoed oil from Jorolga d dom,5h maImjnJs from U. S. TorlU Cnivoios,ou,, Rporl to thsCCOVSU as Cobb VSQ.tobl. Oils, Oil 004 Ccçro (41), 1932, p 73-4.
The possibility of offsetting fluctuations in the domestic crop offlaxseed by varying the rate of imports makes the production oflinseed oil responsive to changes in demand. To establish this re-lation, we estimated linseed oil shipments from output and changesin stocks.' Cycles in the output of linseed oil vary positively withshipments as evidenced by conformity indexes of + 100, +100,+ 100 during 2 cycles of shipments '921-38 (actually five phases-10 There is some suggestion in the chart that longer-run developments in do-mestic flaxseed production follow the trend of linseed oil production. If so,this would aid in adjusting linseed oil production to demand by gradually re-moving the pressure of excess supplies of raw materials when demand is fall-ing and by gradually reducing dependence on imports during expansions.11 Stocks of linseed oil are largely held by manufacturers, but they includesome stocks in public storage owned by others. The computed shipments series,therefore, is strictly an index of the 'disappearance' of linseed oil from the in-ventorics in manufacturing plants and in public warehouses.
26
Liniald oil om&c.dfrom domothe mo1rils200 'iii iii
1$ '20 '22 '24

I
FINISHED FARM STOCKS 293
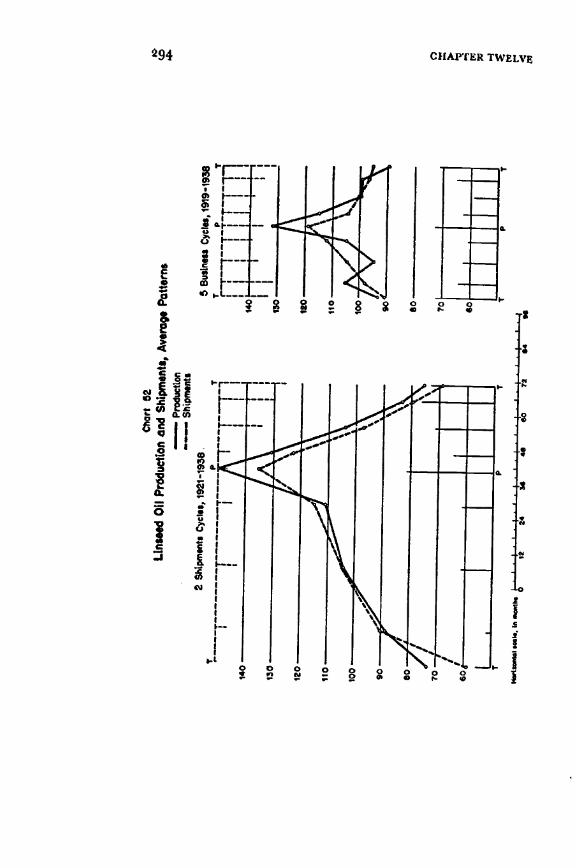
three contractions and two expansions). The sanie relation is re-vealed by the cycle patterns in Chart 52. Output as well as ship-ments also conformed positively to business cycles. The averagepatterns are confirmed by conformity indexes of + 100, +20, +78for shipments and +6o, +6o, +78 for production during the 5business cycles 1919-38.
The low conformity of shipments to business contractions re-flects the fact that shipments continued to rise during the two mildrecessions of the mid-'twenties. This is, of course, characteristic ofcommodities used in building construction during the tremendousupswing of construction that marked the period. Production, incontrast, did not rise during one of the five expansions and declinedduring one of the two mild contractions skipped by the shipmentsseries. Both the rise and decline indicate that while production canbe adjusted to changes in demand, other important factors helpto guide its course.
Confirmation comes from a fact hidden in the average patternsand other information of Chart 52. While there were 5 businesscycles during the period, and only two and one-half cycles in lin-seed oil shipments, the National Bureau has identified 8 cycles inlinseed oil production. The situation may be clarified by inspectingthe complete series of seasonally corrected production and ship-ments data in Chart 53. The circles and asterisks indicate the spe-cific cycle turns identified by the National Bureau. Beginning witha peak tentatively placed in the third quarter of i9ig, shipmentsdecline until the end of 192!. They then begin a long cycle whichreaches a peak at the end of 1928 and a trough in Anotherlong cycle corresponding to the long business cycle of 1933-37-38follows. Production has an initial expansion in 1918-19 before ourshipments series begins. It has a contraction corresponding to thatof shipments in 1919-22, then moves through the two long cyclesfound also in shipments. In addition, production moved throughseveral shorter cycles: two during the major expansion from 1922to 1929, one during the major contraction from 1929 to 1932, andtwo during the major expansion of the 'thirties.
Most of the 'extra' cycles in production may reasonably be at-tributed to the fact that variations in imports cannot offset imme-diately and completely the effects of fluctuations in the domestic
C1c
rt 5
2LL
ns.e
d O
H P
rddu
ctto
n an
d Sh
pmnt
., A
vera
9.Pa
ttern
s- Produ
ctio
nS
hipm
.nti
2 S
hipm
ent,
Cyc
les,
192
1 -1
93e.
5 B
usin
esT
PT
T
140
Ti1
T13
0'
I13
0
A10
010
0
9090
ao/
60
2/
60/
so
Ii Urn
wo,
Th,
243!
.J,
Ip
g

Pdl
lhIc
n. o
f ycu
nds
400
500
200
100
90 SO 70 SQ 50 40
* S
Cho
rt 5
3Lt
nsee
d O
U P
rodu
ctio
n an
d S
Mpm
.nts
*
SP
uaks
and
rou
ghi o
f cyc
ss In
pro
duel
løn.
* P
eeks
and
rou
gh, O
f Cyc
iss
In s
htpn
wnt
sC
orits
allo
no (
shod
d) a
nd .a
Dan
slon
s (u
nsho
dsd)
all
mQ
rk.d
of I
by
the
quar
terly
r,f.
ro*c
. chr
onol
ogy.
1918
9'2
0'2
1'2
223
'24
'25
'26
'27
'28
'29
'30
'31
'32
Pro
duct
Ion_
....,,
ds
ShI
pmen
ts
.
II
II
'II
I4
-'3
8'3
6'3
7'
'39
'40
'41
'48
II
II
MU
Lcrs
sfpm
ds40
0
300
200
100
- S
O
- 70
- 60
- 50 40
L.09
0l'tt
lWM
C N
OS
I
CO

296 CHAPTER TWELVE
crop of flaxseed. A bumper crop, therefore, is likely to cause atemporary increase in linseed oil production; a short crop, a tem-porary decline. After some months, indeed, larger imports canmake good deficiencies, and smaller imports remove the pressuiof surplus seed. Hence the larger movements of linseed oil ship-nicnts are faithfully followed by production. Fluctuations in thedomestic crop, however, seem still able to activate smaller produc-tion cycles that are independent of demand.
A glance back at Chart 51 lends support to this view. If we neg-lect the initial expansion of production before the shipments databegin, we can match four of the other five extra movements oflinseed oil production with a pronounced fluctuation in the crop.The output peak in early 1925 then corresponds to the large flax-seed crop harvested in autumn 1924. The output peak at the endof 1927 followed the large harvest of that year. The large outputof 1931 can be matched with the big crop of zgo, and in the sameway a large harvest was followed by a peak in linseed oil output atthe end of
The fifth extra movement in output, in I93334, presumablyhas a different explanation. It represents, I think, the additionaloutput stimulated by the expectation of increases in prices andwages that accompanied the dollar devaluation and NRA episodesof 1933. Once these influences had spent themselves, productionwas cut and stocks liquidated.
These two sets of influences upon output, the longer cycles of de-mand and the shorter fluctuations of raw material supply, help toexplain the behavior of linseed oil stocks. As already shown in con-nection with cottonseed oil stocks, during the shorter, supply-stimu-lated production cycles, stocks of linseed oil tend to follow pro-duction with a lag (Chart 54). The fluctuations in the supply offlaxseed carry linseed oil output now above, now below, the rateof shipments. When output turns up, however, it does not imme-diately rise above shipments, and until it does, stocks continue tofall. And similarly when it turns down. Note particularly the pat-tern of stocks in the flrt full cycle of output, 1922-26, the contrac-tion of the next cycle, and the patterns of the last four cycles. De-spite the fact that production does not proceed independently ofdemand but, as we have seen, n correlated also with the rate of

140
130
120
110
100
90
80
70 -
ISO
120
110
100
90
SO
10
120
110
FINISHED FARM STOCKS
S
Chart 54Unseed Oil Stocks end Production, Potterns during Production Cycles
peak
Pra*xtlo.psak
/
/
1918-22
1922-26
1926-28
- Stocks 120
- Production
,i.I.i,I36 24 12 0 12 24
Month.
II
Projctnpeak
110
ISO
120
110
110
100
1934-36
1936-38
297
12 0 12Months
Average, 7 cycles1922-38
120:'
S i_ -
shipments, the influence of production cycles has made itself feltin fairly regular fashion. Stages IV-VIJI seemed to be the mosttypical period of expansion for stocks during output cycles, whichaccounts for the negative sign of the conformity indexes. Matchingthe typical expansion stages of stocks with contractions of produc-tion yielded indexes of -71, 75, too for the seven and one-halfcycles.
The movement of stocks during cycles in shipments (Chart55)is roughly consistent with the findings of Chapter ii for finishedstaples whose output can be adjusted to movements of demand.Stocks move inversely during the short contraction of shipmentsfrom 1919 to 7921 but during the exceptionally long phases 1921-28, 1928-33, and 1933-37, they move with shipments. During theshort contraction of 1937-38, they again respond inversely. This
even mixture of very long and short phases and of the differing be-havior of stocks during them yields low indexes of conformity:+100, 33, 0.The resemblance between the behavior of linseed oil stocks dur-ing cycles in shipments and the typical behavior of nonagricultur2jcomino.jjj is not, indeed, perfect, but the differences seem trace-able largely to the influences of the shorter, independent outputcycles. For example, stocks turn up unexpectcdiy early in the longexpansion of shipments beginning in 7927. The explanation seemsto lie in the very large increases of the flaxseed crop between 7922and 7923 and again between 1923 and 7924. We would expectstocks to rise for a time after the peak ofshipments in the last quar-ter of 1928 but instead they reached a peak earlier, in the secondquarter of 1928, then declined. The explanation again is the move-ment of crops. The large flaxseed crop harvested in autumn '927was followed by an upsurge of production in the fourth quarter ofthe year and the first quarter of 1928 (see Chart53) which liftedstocks to a peak some months later. The early decline of stockstherefore seems to reflect liquidation of excess stocks of linseed oilaccumulated as a result of the bumper crop of flaxsced in 7927.Similarly, the choppiness of the pattern of stocks in the 1928-33Contraction and in the '933-38 expansion (Chart 55) can betraced to the extra production cycles already noted.The relation of linseed oil stocks to business cycles is fixed by
298CHAPTER TWELVE

/
Chart 55Linseed Oil Stocki and ShipmentsPOttems durinQ Shipments Cycles
130
120
hO
100
90
80
- StocksShipments
1921-33
5*.tpm.
1919-21
/H
P 7
,i.l,t.l.i l.I.l.I.l.II.i, .I.I,I,I.i.,.i.84 72 60 4e 36 24 12 0 12 24 36 48Mont IiiAveroge, 2 cycles, 1921-38
-- TTTT1I Ij

C
300
the relation between stocks and shipments and output. As indi-cated above, both output and shipments tend to conform positivelyto business cycles, although in the period covered there were Signi-ficant irregularities connected with the long cycles in shipmentsand the supply-stimulated fluctuations in production. The relationbetween stocks and shipments was sometimes inverse, sometimespositive, depending on the length of the phase; the relation be-tween stocks and production was more or less regularly positivewith a very long lagequivalent to an inverse correlation with alead.12 It is not surprising, therefore, that stocks should behave ir-regularly during busines cycles, as Chart 56 suggests, with someslight tendency toward inverted behavior: the conformity meas-ures are 20, ---6o, for 5 business cycles i 919-38.
Chart 56
Linseed Oil Stocks, Average Patterns-- 5 sp.cihc ccl.i, 1922-1938- 4 r.fsrsnca cdes 1921-1938
P T P
120
110
100
90
80
70
HorIztal%c&,.I.I.l.il.l ;_Ilin ,.t5s 0 12 24 36 48
CHAPTER TWELVE
6 Finished Cattle I-tide Leather"Even better than linseed oil, the output of leather illustrates howmanufacturers of farm products can proceed independently ofshort-term changes in the supply of raw materials. The independ-12 The conformity measures for stocks during output cycles are, indeed, nega-tive allowing for a one-stage lead.'5See also Ruth P. Mack's forthcoming study referred to in Ch. so, note 8.

FINISHED FARM STOCKS 301
ence, of course, is not absolute, but it is marked, and the behaviorof tanners' stocks of finished leather reflects the kinship betweenleather and other commodities whose output in the short-mn iscontrolled largely by demand.
The principal source of cattle hide leather in the United Statesis domestic slaughter. The supply of domestic hides in a givenperiod is, therefore, influenced both by the current demand formeat and the breeding decisions made several years earlier. Thecurrent demand for leather is of little consequence since hides donot account for more than 10 percent of the value of slaughteredcattle. Despite these conditions, as we saw in Chapter 10, tannerscan, in most cases, obtain enough hides to meet their current needs.First, cattle slaughter and leather output are at least indirectly re-lated. Cattle slaughter tends to increase when consumer incomesrise. And since the demand for shoes and industrial leather too isstimulated by better business and rising incomes, the output ofleather and the domestic supply of hides both conform positivelyto business cycles. The increase in cattle slaughter is not nearly aslarge as in leather output, however (Chart 20). The discrepancybetween the consumption and output of hides is covered largelyby imports. When demand for hides outruns supply, the pricetends to rise, and with rising prices, imports increase (Chart 21).Hence, the total movement into sight of cattle hides is more nearlyadjusted to the demands of leather production than is domesticcattle slaughter (Chart 22). Finally, since hides can be stored eco-nomically for long periods, a buffer stock is kept by dealers, im-porters, and packers on which manufacturers can draw when thecurrent supply, whether from domestic slaughter or imports, is in-adequate.
This argument, of course, is not exhaustive. When demand forhides tends to outrun supply, the rising price can and, to some de-gree presumably does, check leather output. To this degree thecycles in leather output are influenced by the supply of raw ma-terials. To some degree the same is presumably true of all manu-factured goods, whether from agricultural or nonagricultural ma-terials. But here, as in the case of most nonfarm products, the in-fluence of raw materials is not decisive. By increasing imports anddrawing on stocks of hides, leather output can outrun the supply

S
302CRAPTER TWELVE
of hides from domestic slaughter, and by reducing imports and al-lowing excess stocks to accumulate in the hands of dealers and im-porters, it can be curtailed when demand falls off. One indicationthat tanners can adjust receipts to current needs is that their inven..tories of raw hides increase and decline with leatheroutput, leavingto dealers' and importers' stocks the function of ironing out dis-parities between supply and demand (Chart 23). Additionai con-flimation is afforded by the relation between leather and shoe pro-duction. Cycles in leather output conform positively to those inshoe output, and their patterns are generaliy similar (ChartConformity indexes for leather output during 7 cycles in shoe out-put 1924-40 were +100, +75, +100.Chart 57
Leather and Shoe PoductionAverage Patterns during 7 Shoe Productjcn Cycles
1924-1940- Li0th preduc$IcnShe. OjCffO.
110
1 p THie.,a, sc..Dr.n Co Io Il0caI Ica 24
En this situation, stocks of finished leather at tanners act like thecommodities derived from nonagricul materiajs reviewed inChapter ii: they move inverse'y to both leather and shoe output.The conformity indexes of leather stocks during 7 cycles in leatherOutput 1921-40 werejo0, 4, IOO. Siniilarly, the conformity

indexes of leather stocks during 7 cycles m shoe outpUt 192 4-40were-100,5O,IO0 (Chart 58).
Chart 58Finished Leather Stocks at Tanners and Qther and Shoe Production
Average Patterns, during Production CyclesTajms Stools and L.othSr Prodoctian
7 Cyclf Pto&t1Cfl
- To,wisr? stools- Leathor ton
Tannors Stools wiO Shoe PrducttafldorUig 7 Cycles of Shoe ProdoCtion
I924i940- Tannsn ntocls
Shoe p4OducttOfl
I P T I P T
flTT[F Vii FrTmTim12o 120
110 110
soIlI tI I I
satts' scels.Ja ms$ I
Leather stocks also tended to move inversely during businesscycles, although less regularly because of the imperfect conformityof leather and shoe output to business cycles. The conformity in-
dexes were 33, 33, w for 3 busincss cycles 1924-38 (Chart
59).This behavior contrasts markedly with that of commodities
whose production is governed by the supply of raw materials. Cot-tonseed oil and hog products, for example, tend to move irregu-larly, or inversely with a lag, during cycles in demand but to con-form positively to cycles in output. Leather stocks, like stocks ofother commodities whose production is dominated by demand,tend to move inversely to output, to demand (as represented byshoe output), and to business at large.
7 Other Fabricated Agricultural ProductsUnfortunately, I cannot yet explain even tentatively the behaviorof stocks of evaporated milk and shortenings. I can merely recordsome of the relevant measures of their movements.
303WJSHS1) FARM STOCKS

Chort 59FtnLehed Leather Stocks at Tanners and Leather and Shoe ProductionAverage Patterns durtnq Business Cycle.
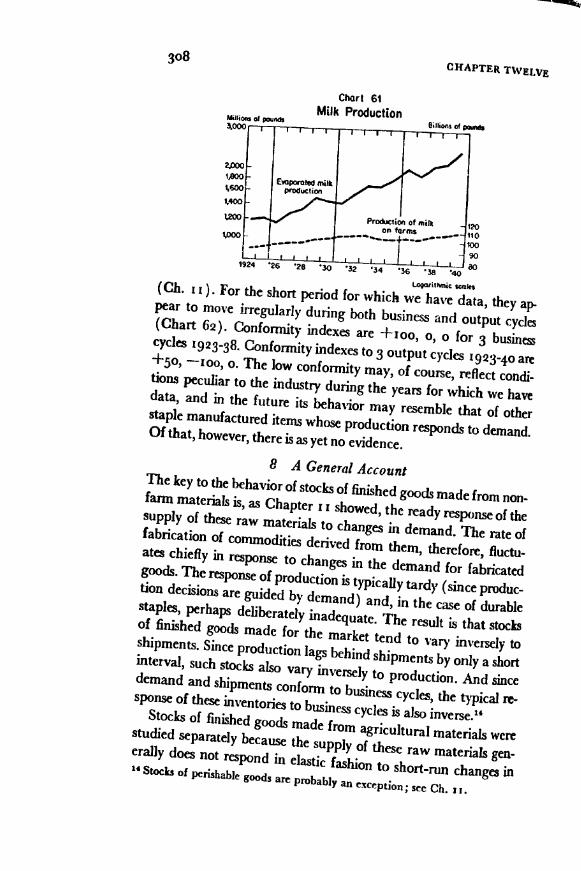
EVAPORATED MILK (cAsE GOODS) AT MANUFACTURERSDuring the business cycles for which we have data inventoriesmoved irregularly. Conformity indexes for 4 cycles i 1-38 were+50, 0, 14. There does seem to be some evidence, however, of atendency for stocks to conform positively to cycles in evaporatedmilk output with a lag of approximately two stages (Chart 6o).Conformity indexes are +6o, +33, ±40 for 5 output cycles 1920-37 when the expansion of stocks was measured between stages IIIand VII; measured synchronously, the indexes are o, 20, +20.Unlike several other fabricated farm products reviewed above,cycles in the output of evaporated milk are not controlled by cyclesin the supply of its raw material. The output of fluid milk is vet',
SHORTENINGS
The meager evidence we have on stocks of shortenings does notsuggest behavior consistent with any of the standard patterns so fardefined. Since shortenings are made from various vegetable oilsand animal fats, both domestic and imported, output cycles are notlikely to be strongly influenced by cycles in the output of raw ma-terials. This, indeed, is suggested too by the conformity measuresfor shorten ings output which run + 100, +50, +67 for 3 cycles1923-38 when expansion is calculated from stages Ito V.
Stocks of shortenings do not, however, act like stocks of otherfabricated goods whose output cycles are dominated by demand
305FINISHED FARM STOCKS
I
steady compared with that of evaporated milk (Chart 6i). Fluc-tuations in the latter must, therefore, be regarded as responses tochanges on the side of demand. But these changes themselves arelikely to be very complex; for evaporated milk is merely one of afairly large number of products derived from whole milk. Henceits production would tend to be stimulated when the demand forevaporated milk is high relative to the demands for other milkproducts rather than when the demand for evaporated milk byitself is high. Moreover, since canning milk is one means of storingan otherwise perishable product, the demand for evaporated milk,including the demand for storage purposes, might be expected tobe high when the demand for milk products in general is low. Thisin turn leads one at first to expect evaporated milk output to behigh during depression, low during prosperity. The evidence, how-ever, shows that it has not fluctuated in any regular fashion duringbusiness cycles. Conformity indexes for 5 cycles 1919-38 were +6o,
50, 0.I suspect that stocks tend to respond positively with some lag to
cycles in evaporated milk output because the latter is influencedby the relative profitability of storing milk in this form. This hy-pothesis, however, should be tested by studying the cost of produc-ing evaporated milk and its price relative to costs and prices ofnumerous other milk products. Apparently, too, the complex fac-
tors that control the relative profitability of producing evaporatedmilk as against other milk products do not make evaporated milkoutput respond in any regular fashion to business cycles. Hence theirregular behavior of its stocks during business cycles.

S
130
120
210
GO
3o6 CHAPTER TWELVE
120
Months
100
to
70
60
140
130
Chart 60
Evaporated Milk Stocks and ProductionFOtterns during Production Cycles
12 0 22 24Months
- StocStProductton
1920-22
1922-26
1926-31
1931-33
Pro&j
t24 tZ 0 12
Months
to
Ito

rlNzsnr.D PARM STOCKS
140
130
20
lb
90
60
70
60
50
1933-3?
- StocksProduction
$
12011010090801924 '26 '26 '30 '32 '34 '36 '38 '40
LcQwItMI cnki(Ch. it). For the short period for which we have data, they ap-pear to move irregularly during both business and output cycles(Chart 62). Conformity indexes are +100, o, o for 3 businesscycles 1923-38. Conformity indexes to 3 output cycles 1923-40 are+50, ioo, o. The low conformity may, of course, reflect condi-tions peculiar to the industry during the years for which we havedata, and in the future its behavior may resemble that of otherstaple manufactured items whose production responds to demand.Of that, however, there is as yet no evidence.8 A General Account
The key to the behavior of stocks of finished goods made from non-farm materials is, as Chapter i i showed, the ready response of thesupply of these raw materials to changes in demand. The rate offabrication of commodities derived from them, therefore, fluctu-ates chiefly in response to changes in the demand for fabricatedgoods. The response of production is typically tardy (since produc-tion decisions are guided by demand) and, in the case of durablestaples, perhaps deliberately inadequate. The result is that stocksof finished goods made for the market tend to vary inversely toshipments. Since production lags behind shipments by only a shortinterval, such stocks also vary inversely to production. And sincedemand and shipments conform to business cycles, the typical re-sponse of these inventories to business cycles is also inverse.14Stocks of finished goods made from agricultural materials werestudied separately because the supply of these raw materials gen-erally does not respond in elastic fashion to short-run changes in'Stock3 of perishable goods arc probably an exception; sec Ch. ii.
Milioils *1 poAth3000 i
Chart 61Milk Production
Eoporoed milkpOduCUOfl
CHAPTER TWELVE
6lIos c( aids

150 .- 120
110 110
100
I
80
/70
p 7 1
0 12 24 36 42 50 72
Hp I
demand. The current supply, as determined by weather and othernatural causes, may, therefore, largely determine the rate of fab-rication independently of the influence of the demand for the fab-ricated products. The effect of supply conditions on cycles in thestocks of finished goods, however, is not uniform. The conclusionsto which the analysis of this chapter leads may be summarized ina series of statements.i) If a fabricated commodity's principal raw material is agricul-tural, and if a current deficiency in supply cannot be supplementedby imports or drafts from stocks or a current surplus removed byaccumulating stocks, then the level of fabrication is determinedby the output of raw materials. Examples are cottonseed oil, lard,frozen and cured pork.152) If the finished product is perishable, it mustbe marketed fairlyquickly at whatever price it will bring. Stocks, representing only' Frozen and cured beef is not a good example since the stock of cattle issufficiently large to allow slaughter to respond to current changes in demand.
FINISHED FARM STOCKS 309
Chart 62Shortenln9s Stocks and Production, Avera9ePotlerns- Stocks
Production3 ProductIon Cycles, 1923-1940 3 BusIness Cycles, 1924-1938
fT1_rrrrrT ' I r130 130
6060
*
CHAPTER TWELvE
the quantities in the course of distribution or the seasonal carry.over, will rise and fall with output. They will not be correlated withdemand since supplies cannot be carried over when supply tendsto outrun demand, nor will stocks be available to supplement cur-rent output when demand tends to outrun supply. Examples arelard and frozen and cured pork.3) If the finished product is durable, (a) finished stocks again willtend to rise and fall with the production of the fabricated com-modity because the latter is not correlated with demand. Stocks,however, will tend to lag behind production since an interval willusually elapse between the time production begins to increase (de-cline) and the time it surpasses (drops below) consumption. Anexample is cottonseed oil.
Stocks of finished durables (b) will tend to vary inversely to de-mand. For when demand is weak, a tendency for output to exceedutilization will lead to the accumulation of stocks; and when de-rnand is strong, a tendency for utilization to exceed output can bemet partly by drawing on stocks. Peaks in stocks, however, willtend to come later than troughs in the utilization of the commoditysince an upturn in utilization will not immediately carry it aboveoutput. And the same can be said for the relation between troughsin stocks and peaks in utilization. The correlation between stocksand utilization will be disturbed by the irregular fluctuations instocks caused by irregular movements in output during cycles inutilization. The strength of the correlation will, therefore, dependupon the relative amplitudes of output and utilization. If demandand utilization are positively correlated with business cycles, stockswill tend to conform inversely to business cycles with a lag. Andagain this pattern will be disturbed by the irregular fluctuationsof output and concomitant movements in stocks. Again an ex-ample is cottonseed oil.
4) For the above relations to hold, it is neither a necessary nor asufficient condition that the goods be fabricated from agriculturalmaterials. (a) It is not a necessary condition because the output ofa raw materia' may fluctuate independently of demand for reasonsother than the hazards of farming. It will do so, for example, if itis a byproduct f another commodity. (b) It is not a sufficient
condition because short-run movements in the production of thefabricated commodity can be rendered independent of currentraw material supply if: (i) the material can be stored econom-ically, (ii) supplies can be supplemented from abroad, (iii) in thecase of byproducts, more can be obtained at special expense.
) If fabrication is not controlled by current domestic supply be-cause one or more of these conditions is present, its movementstend to follow demand. The behavior of stocks of finished goodswill then resemble that of goods produced from nonagriculturalmaterials. Examples are leather, linseed oil and, less clearly, tallow.
It would, of course, be of great interest to measure accuratelythe stocks held by various industries that fit each case describedabove. This is not possible, but rough figures indicate that manu-factured commodities whose rate of output is dominated by van..ations in the supply of raw materials are probably of minor import-ance (App. E, Table io6). Apart from byproducts, a very smallgroup, the class is confined at the outset to products that are madefrom agricultural raw materials. These accounted for some $1,368million worth of stocks of finished goods on December 31, 1939,or approximately 35 percent of total finished goods stocks. Of thisquantity, however, some $560 million represents goods made fromcottoii, wool, silk, hides, and rubber which can be economicallystored in crude form. The possibility of holding large quantities ofsuch goods for long periods undoubtedly accounts for the fact thatcycles in the output of commodities made from these materials arcinfluenced principally by changes in demand, as common knowl-edge assures us they are. Eliminating these goods reduces the classvirtually to manufactured food and tobacco products whichamounted to $8o8 million, or 20 percent of all finished goods.
But not all of this remainder clearly meets the specifications ofthe class. Products made from grains can be better stored raw thanin the form of flour, and better as flour than in the form of bakeryproducts. It is uncertain how much to allow for these exceptions.Roughly, we may say that stocks of finished foods whose outputcycles are governed by raw materials supply constitute perhaps 15to 20 percent of all finished goods inventories, or 6 to 8 percent ofmanufacturers' total inventories.
S
FINISHED FARM STOCKS 3''