The Calgary Goods Movement Strategy
141
calgary.ca | contact 311 The Calgary Goods Movement Strategy Stage 1 Report: State of goods movement in Calgary Prepared for The City of Calgary by: Watt Consulting Group In association with David Kriger Consultants Inc. and CPCS Transcom Ltd. Contact: Tomasz Kroman Senior Consultant Watt Consulting Group Ltd. 403.569.8721 [email protected] #310, 3016 5 Avenue N.E. Calgary, T2A 6K4 Approved by Council: December 17, 2018
-
Upload
khangminh22 -
Category
Documents
-
view
0 -
download
0
Transcript of The Calgary Goods Movement Strategy

calgary.ca | contact 311
The Calgary Goods
Movement Strategy Stage 1 Report: State of goods
movement in Calgary
Prepared for The City of Calgary by:
Watt Consulting Group In association with David Kriger Consultants Inc. and CPCS Transcom Ltd.
Contact:
Tomasz Kroman
Senior Consultant
Watt Consulting Group Ltd.
403.569.8721
#310, 3016 5 Avenue N.E.
Calgary, T2A 6K4
Approved by Council: December 17, 2018

2 January 24, 2018 The Calgary Goods Movement Strategy Prepared by Watt Consulting Group Ltd. for The City of Calgary
Executive Summary
Overview of the Goods Movement Strategy
This report is the first in a series that supports the development of The City of Calgary’s Goods
Movement Strategy.
Calgary is connected to local, national and international markets in several ways. Major railways,
interprovincial and cross-border highways and a large international airport distribute products to and
from businesses in Calgary and all over the world. Calgary residents and businesses alike rely on the
timely availability of goods and products in order to meet their daily needs.
The Municipal Development Plan (MDP) and the Calgary Transportation Plan (CTP) set out the future
direction for Calgary’s urban form and transportation system. Both plans recognize that efficient goods
movement is essential to Calgary’s wellbeing and quality of life, as well as to the achievement of
transportation, land use, economic and environmental aspirations and goals.
In support of this recognition, The City of Calgary has commissioned a Goods Movement Strategy (The
Strategy, or sometimes the GMS). The Strategy will help determine what transportation infrastructure
improvements need to be made to help Calgary thrive as an inland port over the next 30 years. The
Strategy also will help The City support businesses and residents alike through continued
improvements to our transportation network. These improvements will help us continue to efficiently
move goods to markets in Calgary and beyond.
The objectives of the Goods Movement Strategy are to:
• Identify and prioritize short, medium and long-term actions and investments in transportation
infrastructure to enhance the goods movement network in the city of Calgary.
• Support the Calgary Transportation Plan and Municipal Development Plan.
• Complement other City and regional economic development initiatives.
• Review and, where appropriate, consolidate The City’s bylaws related to goods movement. This
includes the truck route map and Bylaw 60M90.
The Strategy considers all modes of goods movement, namely road, active transportation, rail, air,
marine, pipeline and utilities. The Strategy focuses on the city of Calgary proper but also considers
goods movement activities and linkages with the surrounding region. It also considers the relationship
between goods movement and Calgary’s transportation network, land use and economic development.
The Strategy will support the MDP, the CTP and other City policies.

3 January 24, 2018 The Calgary Goods Movement Strategy Prepared by Watt Consulting Group Ltd. for The City of Calgary
The development of the Strategy has been organized according to four stages:
• Foundation establishes the basis for the Strategy, including a profile of current conditions and
trends and a review of the policy context. This report summarizes the findings of the
Foundation stage.
• Issues and challenges gathers stakeholder views on issues and challenges that relate to goods
movement in and around Calgary.
• Opportunities explores how these issues and challenges can be addressed.
• Strategy and actions uses the results of the preceding stages to develop a policy framework for
the Strategy, within which actions, investments and priorities are then identified. This stage also
develops plans for implementing the Strategy and measures and data for subsequently monitoring
the progress of this implementation. It also develops a plan for subsequent broader stakeholder
engagement.
Figure ES-1 summarizes the four-stage process, along with an approximate timeline and a list of the
key tasks that are conducted in each stage.
The Strategy has three types of outcomes:
• Policies specific to the Strategy and others that can be incorporated into future CTP, MDP and
other City plans and strategies. These will be developed within the context of a policy framework
for the GMS, in order to ensure consistency with each other and to coordinate the actions and
priorities. Consolidated truck route bylaws are also policy outputs.
• Actions and investments. The Strategy will identify potential investment areas in infrastructure and
operations that are under the jurisdiction of The City, other levels of government and
network/terminal owners. It also will identify potential initiatives in technology, operations and
practices, based on best practices in Calgary and elsewhere that could be taken up by the private
sector. Business cases for these initiatives will be developed using benefit-cost analyses and will
adhere to The City’s Triple Bottom Line policies. Performance monitoring measures will also be
identified to help The City assess progress on the implementation of the Strategy.
• Basis for continuing engagement. Through its comprehensive engagement process (described
below), the Strategy has already begun to establish a dialogue among key goods movement
stakeholders. The Strategy will provide the opportunity to continue this dialogue and potentially
establish partnerships for implementing and possibly funding the Strategy’s actions. It will also
provide the opportunity for collaborating on other future initiatives.
The Strategy will complement and share a structure that is similar to other approved City transportation
plans that detail the development of the transit network (Route Ahead), the pedestrian network (Step
Forward) and the bicycle network (Cycling Strategy).

4 January 24, 2018 The Calgary Goods Movement Strategy Prepared by Watt Consulting Group Ltd. for The City of Calgary
Stakeholder engagement and communications are the basis of the GMS, supported by analysis,
profiles of existing conditions and trends, reviews of best practices and policies elsewhere and focused
data collection. To do this, The City has developed and will administer a comprehensive engagement
process.
The process provides several different ways (activities) for stakeholders to contribute to the Strategy,
as follows:
• Project launch presentations at key industry and City forums at the beginning of the work, in
February 2017.
• A web survey was distributed to members of the Calgary Chamber of Commerce.
• One-on-one interviews were conducted with a range of stakeholders.
• As part of the initial study work, agency meetings were conducted with internal City staff and with
the City’s emergency services, as well as with regional municipalities.
• Two advisory groups were struck to assist in formation of short term operational improvement
opportunities and a long term strategic plan.
Figure ES-1 – Process for developing the Goods Movement Strategy

5 January 24, 2018 The Calgary Goods Movement Strategy Prepared by Watt Consulting Group Ltd. for The City of Calgary
• Combined ‘all-stakeholder’ workshops provide an opportunity for all of the stakeholders to come
together and review and contribute to the findings at key intervals.
There will also be opportunities to engage the public as the Stage 4 strategy and actions are
developed. The basic policy framework will be presented to the public, in order to gather additional
feedback on its shape and to look for gaps. There will also be a report back to the public, along with a
final draft of the recommended GMS. The Strategy also will be posted online for the general public.
Figure ES-1 shows six groups of engagement opportunities, generally coinciding with the initiation
and/or end of each stage.
A vision for the Goods Movement Strategy
As a first step, the Foundation stage established a vision. The vision suggests a desired or ideal future
state for goods movement in Calgary. It sets the direction for the development of the policy framework
for the GMS and of the subsequent actions and investments. The vision also establishes the
importance of efficient goods movement in the eyes of the public and of political decision-makers. The
vision further establishes goods movement as an important part of transportation, land use and
economic development investments and priorities. This is especially important if, as elements of the
Strategy are implemented, conflicts arise between addressing the needs of goods movement and
addressing other needs, such as urban passenger movement.
A review of the CTP and other relevant City of Calgary policies and of goods movement strategies
elsewhere results in the following proposed vision for goods movement in Calgary:
The goods movement strategy supports a multi-modal system that is safe, economical, reliable, efficient and environmentally sustainable. Within Calgary, goods movement is widely recognized as an essential contributor to the economic, social and environmental wellbeing of residents and businesses.
The vision expresses how it will support all components of the goods movement system, regardless of
who owns, supplies or operates these components. The vision talks to five key attributes:
• Safe for all users of the system, including passenger modes.
• Economical to implement, operate, maintain and use.
• Reliable in terms of the service offered to users, door-to-door travel times (i.e., which is not
necessarily the same as offering short travel times) and network redundancy (allowing diversion
between routes and modes, as situations dictate).
• Efficient in terms of directness and connectivity, including seamless interchanges between modes
and efficient to operate and maintain.
6 January 24, 2018 The Calgary Goods Movement Strategy Prepared by Watt Consulting Group Ltd. for The City of Calgary
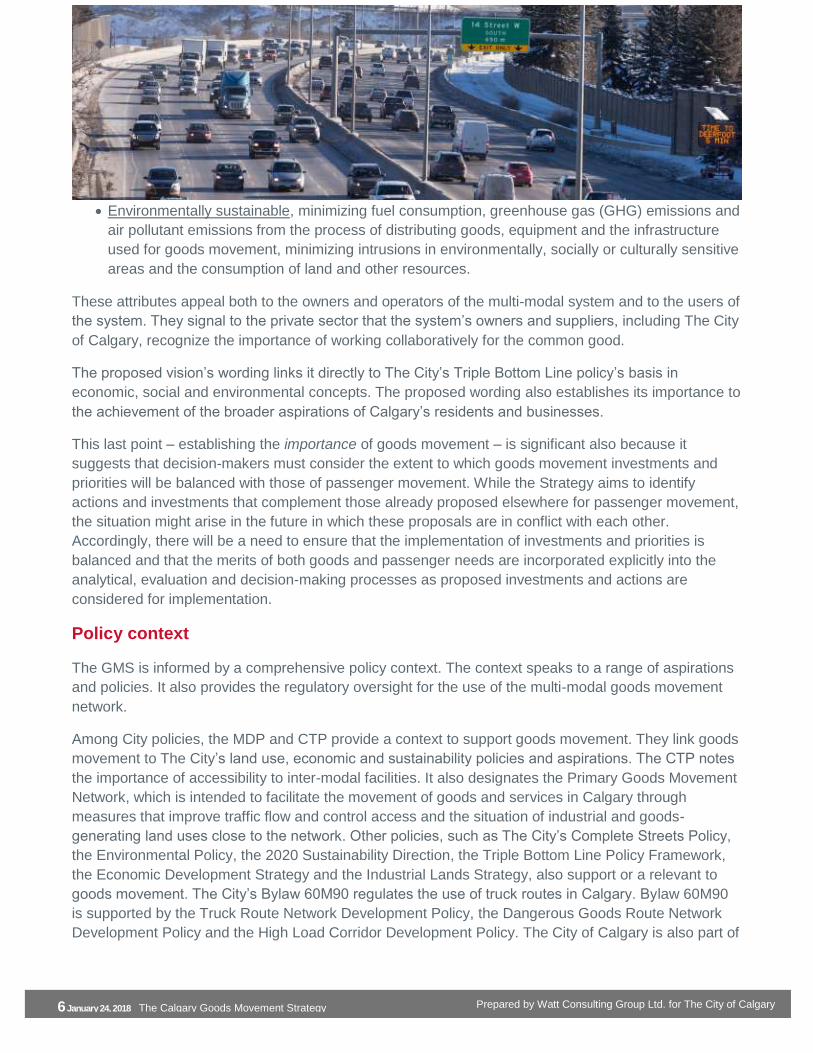
• Environmentally sustainable, minimizing fuel consumption, greenhouse gas (GHG) emissions and
air pollutant emissions from the process of distributing goods, equipment and the infrastructure
used for goods movement, minimizing intrusions in environmentally, socially or culturally sensitive
areas and the consumption of land and other resources.
These attributes appeal both to the owners and operators of the multi-modal system and to the users of
the system. They signal to the private sector that the system’s owners and suppliers, including The City
of Calgary, recognize the importance of working collaboratively for the common good.
The proposed vision’s wording links it directly to The City’s Triple Bottom Line policy’s basis in
economic, social and environmental concepts. The proposed wording also establishes its importance to
the achievement of the broader aspirations of Calgary’s residents and businesses.
This last point – establishing the importance of goods movement – is significant also because it
suggests that decision-makers must consider the extent to which goods movement investments and
priorities will be balanced with those of passenger movement. While the Strategy aims to identify
actions and investments that complement those already proposed elsewhere for passenger movement,
the situation might arise in the future in which these proposals are in conflict with each other.
Accordingly, there will be a need to ensure that the implementation of investments and priorities is
balanced and that the merits of both goods and passenger needs are incorporated explicitly into the
analytical, evaluation and decision-making processes as proposed investments and actions are
considered for implementation.
Policy context
The GMS is informed by a comprehensive policy context. The context speaks to a range of aspirations
and policies. It also provides the regulatory oversight for the use of the multi-modal goods movement
network.
Among City policies, the MDP and CTP provide a context to support goods movement. They link goods
movement to The City’s land use, economic and sustainability policies and aspirations. The CTP notes
the importance of accessibility to inter-modal facilities. It also designates the Primary Goods Movement
Network, which is intended to facilitate the movement of goods and services in Calgary through
measures that improve traffic flow and control access and the situation of industrial and goods-
generating land uses close to the network. Other policies, such as The City’s Complete Streets Policy,
the Environmental Policy, the 2020 Sustainability Direction, the Triple Bottom Line Policy Framework,
the Economic Development Strategy and the Industrial Lands Strategy, also support or a relevant to
goods movement. The City’s Bylaw 60M90 regulates the use of truck routes in Calgary. Bylaw 60M90
is supported by the Truck Route Network Development Policy, the Dangerous Goods Route Network
Development Policy and the High Load Corridor Development Policy. The City of Calgary is also part of

7 January 24, 2018 The Calgary Goods Movement Strategy Prepared by Watt Consulting Group Ltd. for The City of Calgary
TRAVIS, which is the Provincially-led multi-jurisdictional permitting system for over-sized and
overweight loads.
At the regional level, goods movement in Calgary is informed by the Calgary Metropolitan Plan.
Relevant provincial policies and regulations include the Commercial Vehicle Safety Regulations and the
2017-2020 Transportation Business Plan. Relevant Government of Canada Acts include the Canada
Transportation Act and the Transportation of Dangerous Goods Act. The Asia-Pacific Gateway and
Corridor Initiative and the Trade and Transportation Corridors Initiative aim to support national and
international trade flows between North America and Asia through strategic infrastructure investments
and policy measures in different parts of Canada.
Overview of existing conditions
Calgary is supported by a comprehensive multi-modal goods movement network, comprising the
Primary Goods Movement Network, Calgary International Airport and several CN and CP intermodal
terminals, transload facilities and automotive compounds.
A review of existing conditions and trends describe several key characteristics concerning the network
and its use:
• Although the region surrounding Calgary is growing quickly, according to City of Calgary
forecasts, the city itself is expected to continue to be the dominant hub for population (81% by
2039) and jobs (87% by 2039).
• Southeast and northeast Calgary are the primary concentrations of the region’s industrial activity.
They will continue to grow. Commercial and industrial activity is also expected to grow east and
northeast of Calgary and along Highway 2, especially to the north.
• Transportation is an important economic sector in Calgary, employing 61,000 people in 2015.
Excluding downtown, which likely represents head office employment, most transportation-related
employment is clustered into two areas in Calgary: in the city’s northeast, south of Calgary
International Airport and in the city’s southeast between the CP and CN rail networks. The airport,
railways and the city’s major highways and arterials provide multi-modal access to these clusters.
• A review of truck activity, based on GPS traces, indicates that these areas are also key
generators of truck trips, along with industrial areas to the north and east of Calgary. The highest
proportions of truck activity, as a percentage of total traffic volumes, occur on the roads and
highways that serve these areas, as well as on sections of the Stoney Trail and roads in
northwest Calgary.
• In absolute terms, the northeast quadrant of Stoney Trail experiences some of the highest truck
volumes, which is consistent with its role in connecting the major industrial areas and the inter-city
highway network. Highway 2 from the north and the south makes up the busiest truck entry points
to Calgary.

8 January 24, 2018 The Calgary Goods Movement Strategy Prepared by Watt Consulting Group Ltd. for The City of Calgary
• Among the city’s expressways and highways, truck speeds are highest on the Stoney Trail, with
nearly free flow speeds being maintained even during the commuter peak periods. However,
many sections of Deerfoot Trail and Glenmore Trail are subject to some congestion. Truck
volumes across the city have been growing, generally in line with growth in Calgary’s population
and employment, and with volumes crossing the city boundaries growing fastest. These trends
are expected to continue in the future.
Some of the most significant delay bottlenecks are:
• On Deerfoot Trail north of the Trans-Canada Highway, speeds drop below 30 kilometres per hour
(kph) in the northbound direction between 4:00 and 6:00 p.m., compared to a free-flow speed of
almost 60 kph.
• Glenmore Trail is very slow in the a.m. peak period westbound approaching Ogden Road S.E.,
likely due to road construction in this area.
• Deerfoot Trail is subject to heavy truck delay northbound between 130 Avenue S.E. and Anderson
Road S.E. (particularly between 7:00 and 9:00 a.m.) and southbound from 11 Street S.E. to
Anderson Road S.E. (between 3-6 p.m.).
• Many of the streets in downtown Calgary are subject to significant truck delay, although speeds
are generally fairly low to begin with.
The locations of delay on Deerfoot and Glenmore Trail are in line with congestion points most
frequently identified by stakeholders.
• Data on the quantities and types of freight that are moved on Calgary’s railways are not available.
However, CP’s mainline in southeast Calgary, which links Calgary with the rest of Canada to the
east and to the United States Midwest, averages more than 25 freight trains per day. CP’s
mainline to the west has the second highest levels, between 16 and 24 trains per day. These
volumes are lower than, but are approaching, the potential capacity of a single-track line. CN’s rail
line in southeast Calgary has lower traffic levels, between 5 and 10 trains per day.
• Calgary International Airport is a 24/7 airport, with non-stop flights to 68 cities. The airport handles
approximately 135,000 tonnes of air cargo each year: although these quantities are small relative
to other modes, given that most of these commodities are high-value, air cargo’s share of total
freight to and from Calgary by value is much higher than its share by volume. Approximately $2.1
billion worth of products was exported internationally by air in 2016. Approximately $2.9 billion
worth of products delivered by air were cleared through customs at the airport. Most cargo moves
in the belly of passenger aircraft. Tonnages are not available; however, as one indication, it can
be noted that Calgary International Airport is third-busiest airport in Canada, with nearly 250,000
itinerant aircraft movements in 2015.

9 January 24, 2018 The Calgary Goods Movement Strategy Prepared by Watt Consulting Group Ltd. for The City of Calgary
• Liquid product and natural gas pipelines operate in and through Calgary. Of note, one pipeline
carries refined fuel products from refineries in the Edmonton area to distribution terminals in
Calgary, carrying approximately 48,000 barrels of refined fuel products per day.
• The GMS is informed by a variety of data sources that describe goods movement in and around
the city. Most of these sources cover road-based activity. The City has screenline and intersection
counts throughout Calgary, as well as accident reports and TRAVIS permitting activity. GPS truck
trip traces provide 24/7/365 coverage of heavy truck routings, stops, trip origins, trip destinations
and travel times, from which speeds and delays can also be identified. Transport Canada data
indicate the frequency of freight trains, although only on sections which have at-grade crossings.
Other Transport Canada data provide inter-city and international travel times for marine, rail and
truck cargo movements.
• To supplement these data, the Strategy updated a series of roadside truck origin-destination
surveys that were conducted in 2000. These surveys were carried out at a cordon surrounding the
city. They captured the characteristics of inter-city and inter-regional truck trip origins and
destinations, the types and amounts of loads carried and routing, among other information.
• In addition to being an important Western Canada hub for goods movement, goods movement
also is a key contributor to the Calgary region’s economy. The Transportation and Warehousing
and Wholesale Trade sectors directly accounted for nearly 8% or $9 billion (expressed in 2007 $)
of the Calgary region’s gross domestic product (GDP) in 2015. These sectors in turn support other
economic activity, yielding a combined GDP impact of $14.5 billion (2007 $) in 2015 and directly
and indirectly supporting 134,000 jobs in the Calgary region.
• Initial consultations, conducted at the launch of the Strategy in February 2017, identified several
issues that were important to stakeholders. The most important of these were congestion on
provincial highways in and around Calgary, congestion on other roads in and around Calgary and
conflicts with other traffic, including transit, pedestrians and cyclists.
Summary
Goods movement is critical to Calgary’s economic wellbeing and quality of life. Calgary and the
surrounding region have a comprehensive, multi-modal goods movement network. This report, State of
Goods Movement in Calgary, establishes an inventory of the goods movement system and its use. It
provides a sound and robust basis for subsequent stages and stakeholder consultations to support the
development of The City of Calgary Goods Movement Strategy.

10 January 24, 2018 The Calgary Goods Movement Strategy Prepared by Watt Consulting Group Ltd. for The City of Calgary
Table of Contents Executive Summary 2
Overview of the Goods Movement Strategy 2
A vision for the Goods Movement Strategy 5
Policy context 6
Overview of existing conditions 7
Summary 9
Appendices 11
1 Introduction 14
1.1 Study purpose 14
1.2 What does the GMS include? 15
1.3 Relationship to other City initiatives 15
1.4 Study approach and outcomes 16
1.5 Stakeholder engagement and communications 18
1.6 This report 20
1.7 Sources of information 21
2 A vision for the Goods Movement Strategy 22
2.1 Why a vision? 22
2.2 Review of other visions 22
2.3 A proposed vision 26
3 Policy Context 28
3.1 The City of Calgary 28
3.2 Calgary Regional Partnership 39
3.3 Province of Alberta 39
3.4 Government of Canada 41

11 January 24, 2018 The Calgary Goods Movement Strategy Prepared by Watt Consulting Group Ltd. for The City of Calgary
4 Overview of existing conditions 45
4.1 Introduction 45
4.2 Land Use, demographic and economic characteristics and trends 45
4.3 Goods Movement Network 61
5 State of goods movement data 98
5.1 Inventory of data 98
5.2 Data needs 98
6 The economic importance of goods movement in
Calgary 106
6.1 Defining the economic importance of goods movement in Calgary 106
6.2 Measuring the impact of transportation and logistics activities on Calgary’s economy 115
6.3 Transportation and logistics costs 117
7 Snapshot: what we’ve heard so far 132
8 Appendices 134
8.1 Appendix A – Visions for goods movement strategy 134
8.2 Appendix B – YYC air cargo facilities 139
Appendices A. List of technical reports
B. Transportation infrastructure improvements in Calgary that could be implemented in the short-term, medium-term and long-
term, and other regional projects to enhance goods movement
C. Recommended updates to the Primary Goods Movement Network
D. Recommended consolidation of the truck bylaws

12 January 24, 2018 The Calgary Goods Movement Strategy Prepared by Watt Consulting Group Ltd. for The City of Calgary
Acronyms and Abbreviations
AMTA Alberta Motor Transport Association
APGCI Asia-Pacific Gateway and Corridor Initiative
ATRI American Transportation Research Institute
BIA Business improvement area
BNSF Burlington Northern Santa Fe Railway
BRZ Business revitalization zone
CED Calgary Economic Development
CLC Calgary Logistics Council
CMA Census Metropolitan Area
CN Canadian National Railway
CP Canadian Pacific Railway
CRP Calgary Regional Partnership
CTC Calgary Transportation Club
CTP Calgary Transportation Plan
D&B Dun and Bradstreet Employment Location Data
EOQ Economic order quantity
GDP Gross domestic product
GHG Greenhouse gas
GPS Global Positioning System
GMS The City of Calgary Goods Movement Strategy
LFS Labour Force Survey (Statistics Canada)
MDP Municipal Development Plan
MGA Municipal Government Act (Province of Alberta)
13 January 24, 2018 The Calgary Goods Movement Strategy Prepared by Watt Consulting Group Ltd. for The City of Calgary
NAICS North American Industrial Classification System
NAPCS North American Product Classification System
NNC Nutrition North Canada
OAG Operational Advisory Group
QE2 Queen Elizabeth II Highway (Highway 2)
SAG Strategic Advisory Group
TAZ Traffic analysis zone
TFR Canadian Pacific Railway name for transload facilities
The
Strategy The City of Calgary Goods Movement Strategy
TTI Travel time index
TRAVIS Multi-jurisdictional Transportation Routing and Vehicle Information System
UP Union Pacific Railroad
UTM Universal Transverse Mercator
YYC Calgary International Airport

14 January 24, 2018 The Calgary Goods Movement Strategy Prepared by Watt Consulting Group Ltd. for The City of Calgary
1 Introduction
1.1 Study purpose
Calgary is connected to local, national and international markets in several ways. Major railways,
interprovincial and cross-border highways and a large international airport distribute products to and
from businesses in Calgary and all over the world. Calgary residents and businesses alike rely in the
timely availability of goods and products in order to meet their daily needs.
The Municipal Development Plan (MDP) and the Calgary Transportation Plan (CTP) set out the future
direction for Calgary’s urban form and transportation system. Both plans recognize that efficient goods
movement is essential to Calgary’s wellbeing and quality of life, as well as to the achievement of
transportation, land use, economic and environmental aspirations and goals.
In support of this recognition, The City of Calgary has commissioned a Goods Movement Strategy (The
Strategy, or sometimes the GMS). The Strategy will help determine what transportation infrastructure
improvements need to be made to help Calgary thrive as an inland port over the next 30 years. The
Strategy also will help The City support businesses and residents alike through continued
improvements to our transportation network. These improvements will help us continue to efficiently
move goods to markets in Calgary and beyond.
The objectives of the Goods Movement Strategy are to:
• Identify and prioritize short, medium and long-term actions and investments in transportation
infrastructure to enhance the goods movement network in the City of Calgary.
• Support the Calgary Transportation Plan and Municipal Development Plan.
• Complement other City and regional economic development initiatives.
• Review and, where appropriate, consolidate The City’s bylaws related to goods movement. This
includes the truck route map and Bylaw 60M90.
The City’s Project Charter describes the outcomes and role of the Goods Movement Strategy in the
following terms:1
“The GMS will provide a list of actions and investments that support Calgary’s continued development as an
economic leader in multi-modal services and solutions. The City will work with representatives from goods
movement industries in the development of the strategic plan. The GMS will allow The City to support the goods
movement industry and the citizens of Calgary through continued improvements to the transportation and
supporting networks that allow for the efficient movement of goods to markets in Calgary and beyond. The GMS will
assist Council and Administration in making informed decisions on projects and initiatives to support goods
movement industries in Calgary. Informed decisions on goods movement will sustain and grow a vibrant economy
with Calgary’s continued role as a global economic leader through a full range of multi-modal services and solutions.”
1 Project Charter for the Goods Movement Strategy, The City of Calgary, August 2016.

15 January 24, 2018 The Calgary Goods Movement Strategy Prepared by Watt Consulting Group Ltd. for The City of Calgary
1.2 What does the GMS include?
The Goods Movement Strategy considers all modes of goods movement, namely:
• Road, which includes trucking services and couriers.
• Active transportation, comprising bicycles and pedestrians.
• Rail, focusing on intermodal terminals, transload terminals and rail corridors in and around
Calgary (as opposed to rail services and routes).
• Air, focusing on the Calgary International Airport (as opposed to air services and routes).
• Marine - that is, accounting for ocean ports that serve goods moving to, from or through Calgary.
• Pipeline, primarily in their role in transmitting and delivering energy to Calgary’s homes and
businesses.
• Utilities, in consideration of how utilities distribute power and communications services and how
these facilities interact influence right of way requirements and urban road usage.
The GMS focuses on the movement of goods (sometimes referred to as freight or cargo). However, the
Strategy also considers service vehicles, which do not generally carry goods but are engaged in
providing commercial services, such as appliance repair.
The GMS focuses on urban goods movement, which is primarily road-based. However, it also looks at
Calgary’s intermodal connections with the rest of Alberta, the rest of Canada, the United States and
around the world.
The GMS is focused on the city of Calgary proper, but also considers goods movement activities and
linkages with the surrounding region (the Calgary Region).
The Strategy considers the relationship between goods movement and Calgary’s transportation
network, land use and economic development. Although economic analysis and the development of
business cases will be developed to support the Strategy’s recommended actions and investments, it
should be noted that taxation and financing policies are not within the scope of the strategy.
1.3 Relationship to other City initiatives
The GMS is being developed within the context of other key City initiatives – notably, the MDP, the
CTP, The City’s Sustainability Directions and The City’s economic development aspirations and
policies.2 It is intended to support and be consistent with these initiatives in several specific ways.
The Strategy will support the Municipal Development Plan by:
• Complementing and supporting the MDP’s urban growth policies.
• Considering the role of Smart Freight, freight-friendly land use planning and other planning
concepts that can help to manage urban growth
• Considering the relationship between Calgary and its surrounding municipalities, insofar as
goods-generating land uses and development are concerned.
2 Chapter 3 profiles these and other policies and initiatives.

16 January 24, 2018 The Calgary Goods Movement Strategy Prepared by Watt Consulting Group Ltd. for The City of Calgary
• Complementing The City’s growth management and industrial land strategies.
The Strategy will support the Calgary Transportation Plan by:
• Complementing and supporting the CTP’s multi-modal, sustainable passenger transportation
initiatives. The Strategy also will account for greenhouse gas (GHG) emissions in goods
movement.
• Reviewing, enhancing and augmenting the CTP’s goods movement policies.
• Providing actions and policies that show how the CTP’s goods movement goals will be achieved.
• Serving as a key input to the planned 2019 update of the CTP.
The Strategy will support The City of Calgary’s 2020 Sustainability Directions for a prosperous
economy and smart growth by:
• Developing a list of actions and investments that support the attraction and retention of businesses that must move goods to markets in Calgary, the surrounding region, nationally and internationally.
The Strategy will support Calgary’s economic development:
• By articulating the importance of goods movement to Calgary’s economy and to The City’s economic development aspirations. The Strategy will establish the importance of efficient goods movement to the costs and availability of goods and products, and it will examine the contributions of the goods movement industry to Calgary’s economy and jobs.
• Through the Strategy’s engagement (see Section 1.5) by: o Providing a voice for goods movement stakeholders. o Establishing the basis for future partnerships. o Identifying contacts for future consultations as needed for specific projects.
The Strategy will profile goods-generating industries, examine intermodal connectivity and consider
other issues that important to goods movement stakeholders.
1.4 Study approach and outcomes
1.4.1 Approach and process
Stakeholder engagement and communications are the basis of the GMS, supported by analysis,
profiles of existing conditions and trends, reviews of best practices and policies elsewhere and focused
data collection. The development of the Strategy has been organized according to four stages:
1. Foundation establishes the basis for the Strategy, including a profile of current conditions and
trends and a review of the policy context.
2. Issues and challenges gathers stakeholder views on issues and challenges that relate to goods
movement in and around Calgary.
3. Opportunities explores how these issues and challenges can be addressed.
4. Strategy and actions uses the results of the preceding stages to develop a policy framework for
the Strategy, within which actions, investments and priorities are then identified. This stage also
develops plans for implementing the Strategy and for monitoring the progress of this
implementation. It also develops a plan for subsequent broader stakeholder engagement.

17 January 24, 2018 The Calgary Goods Movement Strategy Prepared by Watt Consulting Group Ltd. for The City of Calgary
Figure 1-1 summarizes the four-stage process, along with an approximate timeline and a list of the key
tasks that are conducted in each stage.
1.4.2 Outcomes
The Strategy has three types of outcomes:
• Policies specific to the Strategy and others that can be incorporated into future CTP, MDP and
other City plans and strategies. These will be developed within the context of a policy framework
for the GMS, in order to ensure consistency with each other and to coordinate the actions and
priorities. Consolidated truck route bylaws are also policy outputs.
• Actions and investments. The Strategy will identify potential investment areas in infrastructure and
operations that are under the jurisdiction of The City, other levels of government and network/port
owners. It also will identify potential initiatives in technology, operations and practices, based on
best practices in Calgary and elsewhere that could be taken up by the private sector.
• Business cases for these initiatives will be developed using benefit-cost analyses and
will adhere to The City’s Triple Bottom Line policies. Performance monitoring measures will also
be identified to help The City assess progress on the implementation of the Strategy.
• Basis for continuing engagement. Through its comprehensive engagement process (described
below), the Strategy has already begun to establish a dialogue among key goods movement
stakeholders. The Strategy will provide the opportunity to continue this dialogue and potentially
establish partnerships for implementing and possibly funding the Strategy’s actions. It will also
provide the opportunity for collaborating on other future initiatives.
Figure 1-1 – Process for developing the Goods Movement Strategy

18 January 24, 2018 The Calgary Goods Movement Strategy Prepared by Watt Consulting Group Ltd. for The City of Calgary
The Strategy will complement and share a structure similar to other approved City transportation plans
that detail the development of the transit network (Route Ahead), the pedestrian network (Step
Forward) and the bicycle network (Cycling Strategy).
1.5 Stakeholder engagement and communications
1.5.1 Stakeholder engagement
The goods movement stakeholder community is broad and diverse. Table 1-1 lists the anticipated
stakeholder groups that are being consulted for the GMS: note that this list is indicative and is subject
to revision as the Strategy progresses.
Table 1-1: List of stakeholder groups (indicative)
• City Council
• Internal City Divisions – Roads, Real Estate and Development Services, Growth Strategies
• Truck Route Committee
• Regional agencies
• Alberta Transportation
• Research institutes (Van Horne Institute, Mount Royal University)
• Calgary Airport Authority
• Railways – Canadian National Railway (CN), Canadian Pacific Railway (CP)
• Trucking companies and couriers
• Industries and businesses
• Industry organizations – Calgary Logistics Council (CLC), Alberta Motor Transport Association (AMTA), Calgary Transportation Club (CTC)
• Economic development organizations – Calgary Economic Development (CED), Calgary Chamber of Commerce, business revitalization zones (BRZs), business improvement areas (BIAs)
• Residents and communities
• Utility transmission companies – pipelines, fibre, electrical transmission
The stakeholders identified above represent a wide cross section of the goods movement community in Calgary. This will result in a wide array of interests and priorities. Accordingly, The City has developed and will administer a comprehensive engagement process.3 The process provides several different ways (activities) for stakeholders to contribute to the Strategy, as follows: 4
• Project launch presentations at key industry and City forums at the beginning of the work, in February 2017.
• A web survey was distributed to members of the Calgary Chamber of Commerce.
• One-on-one interviews were conducted with a range of stakeholders.
• As part of the initial study work, agency meetings were conducted with internal City staff and with the City’s emergency services, as well as with regional municipalities.
3 Working with City staff, the Strategy’s consultant team will contribute technical content and will lead the
technical discussion at in-person meetings.
4 Additional details can be found in The City of Calgary, Goods Movement Strategy // Engage Plan, draft 2.1, 10
January 2017.

19 January 24, 2018 The Calgary Goods Movement Strategy Prepared by Watt Consulting Group Ltd. for The City of Calgary
• Two advisory groups were struck to assist in formation of short-term operational improvement opportunities and a long term strategic plan. Further details on the role of the advisory groups are provided in Section 1.5.3.
• Combined ‘all-stakeholder’ workshops provide an opportunity for all of the stakeholders to come together and review and contribute to the findings at key intervals.
It should be noted that all surveys are anonymous, so that the respondent cannot be identified. Although summary reports will be prepared for each engagement opportunity, no attributions will be made to individual participants without their permission.
There will also be opportunities to engage the public as the Stage 4 strategy and actions are developed. The basic policy framework will be presented to the public, in order to gather additional feedback on its shape and to look for gaps. There will also be a report back to the public, along with a final draft of the recommended GMS. The Strategy also will be posted online for the general public.
Figure 1-1 shows six groups of engagement opportunities, generally coinciding with the initiation and/or end of each stage. Table 1-2 lists how the various engagement activities fit within each engagement opportunity.
Table 1-2: Engagement opportunities and associated activities
Engagement Activity included
Engagement I – Introduction • 2 meetings with The City of Calgary • 1 meeting each with Truck Route Committee, CLC, CED,
plus one-page survey • 2 advisory group meetings
Engagement II – Issues and
Challenges
• 2 advisory group meetings • 1 workshop with various goods movement stakeholders • Web survey through the Calgary Chamber of Commerce • One-on-one interviews
Engagement III – Issues and
Challenges (report back) and
Opportunities
• 2 advisory group meetings • 1 workshop with various goods movement stakeholders
Engagement IV – Opportunities
(report back)
• 2 advisory group meetings • 1 workshop with various goods movement stakeholders • 1 public meeting
Engagement V – Policy
Framework, Actions,
Investments and Priorities
• 2 advisory group meetings • 1 workshop with various goods movement stakeholders • 1 public meeting
Engagement VI – Strategy,
Actions and Implementation Plan
• 2 advisory group meetings • 1 workshop with various goods movement stakeholders
Presentations • 1 each to Committee, Council, CED and CLC (4 total)
1.5.2 Communications strategy

20 January 24, 2018 The Calgary Goods Movement Strategy Prepared by Watt Consulting Group Ltd. for The City of Calgary
The City developed a communications plan to inform stakeholders about engagement opportunities and
encourage their participation in them. The communications plan includes tactics such as a dedicated
page on calgary.ca for the Strategy, advertising the project using The City of Calgary’s social media, e-
mail newsletters and articles in community and industry newsletters.5 Also important is an educational
strategy for the general public, to be implemented by The City prior to the Stage 4 Strategy and
Actions. This strategy will be used to educate and inform the public about goods movement generally
and its role in the daily lives and activities of residents and businesses.
1.5.3 Role of advisory groups
The City has struck operational and strategic advisory groups as part of the strategy. The Operational
Advisory Group (OAG) focuses on short-term conditions and issues, looking at short-term actions and
practices that can support goods movement. The Strategic Advisory Group (SAG) focuses on long-term
strategies, policies and infrastructure needs.
The two advisory groups complement each other. Examples of issues that the OAG considers include:
• Infrastructure operations and maintenance
• State-of-roads
• Traffic signal synchronization
• Load management and similar short-term actions and practices that could be taken up by the
goods movement community
• Bylaws relating to goods movement in Calgary.
Examples of issues considered by the SAG include:
• Future long-term goods movement infrastructure and facilities.
• Long-term land use (development) and growth management policies as they pertain to goods
movement or goods-generating uses.
• Relationship of goods movement and the City’s economic development aspirations.
The members of each advisory group have been chosen in order to provide a broad range of
perspectives from the stakeholder community. They are intended to speak from the perspective of their
own experiences, but they do not represent their individual organizations or businesses.
As noted, the advisory groups will meet at strategic points over the course of the Strategy. The
meetings will be administered by The City of Calgary, with the technical contribution provided by the
Strategy’s consultant.
1.6 This report
This report describes the findings of the Stage 1 Foundation tasks. It is organized into seven chapters,
as follows (with the chapter number shown in parentheses):
• Introduction (Chapter 1).
5 For details, see The City of Calgary, Communication Plan for The Goods Movement Strategy.

21 January 24, 2018 The Calgary Goods Movement Strategy Prepared by Watt Consulting Group Ltd. for The City of Calgary
• Vision – establishing a vision and guidelines for the Strategy (Chapter 2).
• Policy context for the Strategy (Chapter 3).
• Overview of existing conditions and profile of the goods movement network (Chapter 4).
• State of goods movement data – a review of the data that The City has available for goods
movement planning and analysis (Chapter 5).
• Explanation of the economic importance of goods movement in Calgary (Chapter 6).
• Summary of stakeholder engagement findings to date (Chapter 7).
The report is accompanied by two appendixes. Appendix 8.1 summarizes visions from goods
movement strategies in other cities elsewhere in Canada, the United States and overseas, in support of
Chapter 2. Appendix 8.2 lists the cargo facilities at Calgary International Airport, in support of the
Section 4.3.3 description of the Airport as a cargo hub.
1.7 Sources of information
This report is based on a number of policy documents and reports, all of which are cited in the
footnotes in the discussion. Travel and demographic forecasts and screenline counts were provided by
The City’s Forecasting Division: these data were analyzed by the consultant. The City also provided
several digital maps. Finally, the report takes into account the results of the initial paper surveys, which
were distributed at the project launch meetings.

22 January 24, 2018 The Calgary Goods Movement Strategy Prepared by Watt Consulting Group Ltd. for The City of Calgary
2 A vision for the Goods Movement Strategy
2.1 Why a vision?
This chapter develops a vision for goods movement. The vision suggests a desired or ideal future state
for goods movement in Calgary. As such, it sets the direction for the development of the policy
framework for the GMS and of the subsequent actions and investments. The vision also establishes the
importance of efficient goods movement in the eyes of the public and of political decision-makers. The
vision further establishes goods movement as an important part of transportation, land use and
economic development investments and priorities. This is especially important if, as elements of the
Strategy are implemented, conflicts arise between addressing the needs of goods movement and
addressing other needs, such as urban passenger movement.
2.2 Review of other visions
The development of the vision is based upon current City priorities and directions for transportation. It
also draws on a review of vision statements from other goods movement strategies in Canada, the
United States and overseas. These are discussed below.
2.2.1 Existing City visions relating to goods movement
2.2.1.1 Council Priorities
Council has defined a vision for Calgary that is expressed in terms of five Council Priorities. These are:6
• A prosperous city. Calgary continues to grow as a magnet for talent, a place where there is
opportunity for all and the best place in Canada to start and grow a business.
• A city of inspiring neighbourhoods. Every Calgarian lives in a safe, mixed and just neighbourhood
and has the opportunity to participate in civic life.
• A city that moves. People and goods can move well and safely throughout the city, using a variety
of convenient, affordable, accessible and efficient transportation choices.
• A healthy and green city. We steward our air, land and water while encouraging healthy lifestyles
for all Calgarians.
• A well-run city. Calgary’s government is open, responsive, accountable and transparent,
delivering excellent services at a fair price. We work with our government partners to ensure we
have the tools we need.
Although only the third priority talks explicitly to goods movement, it is clear that goods movement
contributes to the other four priorities. The third priority also introduces several concepts that important
to goods movement:
• Convenience, which can be exemplified by seamless intermodal connections.
6 The City of Calgary Action Plan, 2015-2018, Our Vision http://www.calgary.ca/CA/fs/Pages/Action-Plan/Council-
Priorities.aspx.

23 January 24, 2018 The Calgary Goods Movement Strategy Prepared by Watt Consulting Group Ltd. for The City of Calgary
• Affordability, for both the user and provider of goods movement services.
• Accessibility – that is, all types of goods can be moved to and from all locations.
• Efficiency, which can be defined in several ways, including reliability of journey times, directness
of routes between origin and destination, a safe environment for all network users, availability of
lowest cost services and so on.
2.2.1.2 Municipal Development Plan
The Municipal Development Plan (MDP) guides Calgary’s long-term urban growth and development.
The MDP identifies 11 Sustainability Principles for Land Use and Mobility, of which the ninth principle
refers to goods movement explicitly:7
Connect people, goods and services locally, regionally and globally.
Other principles influence or are influenced by goods movement, notably:
• Provide a variety of transportation options. (4th principle)
• Mix land uses. (6th principle)
• Support compact development. (8th principle)
• Provide transportation services in a safe, effective, affordable and efficient manner that ensures
reasonable accessibility to all areas of the city for all citizens. (10th principle)
• Utilize green infrastructure and buildings. (11th principle)
2.2.1.3 Calgary Transportation Plan
The Calgary Transportation Plan (CTP) guides the long-term development of Calgary’s transportation
system. While the CTP provides a vision for the future of transportation in Calgary, it does not articulate
a specific vision for goods movement. However, it does express an objective for goods movement:8
To recognize the important economic role of goods movement by providing a safe, efficient and connective goods movement network that supports the Calgary International Airport, the Canadian National (CN) and Canadian Pacific (CP) intermodal facilities, transportation and distribution districts and goods movement routes, while also minimizing impacts on surrounding communities.
This objective speaks to the concepts of safety, efficiency and connectivity in its definition of the goods
movement network that serves Calgary and its intermodal rail and air terminals. It also recognizes the
importance of minimizing the less desirable impacts of goods movement on the adjoining communities.
2.2.2 Goods movement visions from other jurisdictions
7 Municipal Development Plan, Office Consolidation, December 2015, The City of Calgary. The relevant MDP
policies are examined in Section 3.1.1 below.
8 Calgary Transportation Plan, Section 3.4 Goods Movement, The City of Calgary, 2009. The relevant CTP
policies are examined in Section 3.1.2 below.

24 January 24, 2018 The Calgary Goods Movement Strategy Prepared by Watt Consulting Group Ltd. for The City of Calgary
Visions from other jurisdictions in Canada, the United States and overseas can inform the development
of a vision for the GMS (see Appendix 8.1 for details).
The visions can be categorized into two groups:
• Some visions are fairly broad. They are included within a broader transportation master plan and
consider goods movement within that context. These provide the connection with passenger
transportation and with other societal visions regarding land use, sustainability, the environment
and the economy.
• Other visions are more specific to goods movement. They make a more explicit connection to the
role of goods movement in achieving other societal visions, especially economic development but
also sustainability and air quality. They detail various attributes of what an ideal goods movement
network looks like and how it fits in more explicitly with other societal visions. They also bring the
public and private sectors explicitly into the vision.
The explicitness of these more specific visions (the second group) provides a better model for the
Strategy, while still ensuring that the vision is linked back to broader policy statements (the first group).
Note that several other transportation master plans and goods movement strategies were also
reviewed. However, they are not included in Appendix 8.1 because they do not articulate any vision, let
alone one from which visions for goods movement could be derived. This matters because the
presence of a vision statement signals its importance to the reader, increases awareness and
education and helps to engage public and private stakeholders in the eventual implementation of a
strategy and its actions.
In terms of the scope of the vision, the examples suggest that:
• The vision must speak to all perspectives: public aspirations such as land use, sustainability,
environment, affordability, residents’ quality of life and the private sector’s economic viability.
• The vision must be consistent with and not contradict the wording of existing City policies.
A recent goods movement strategy in which consultant team members were involved (Halton Region in
the Greater Toronto and Hamilton Area) illustrates the importance of these two points. Stakeholders
identified the following elements as being most important to the vision:
• Reliability, where reliability means door-to-door travel times that are predictable with a high
degree of confidence.
• Cost-efficiency, a system that provides financial benefits – for example, by increasing Halton
Region’s attractiveness to employers.
• A balanced system whose components (corridors) address the needs of all users in a balanced
way.
• A system that optimizes 24-hour capacity - for example, through off-peak delivery.
It can be seen that these priorities reflect multiple public and private perspectives, while supporting the
Region’s sustainable transportation and economic development policies. In terms of the vision’s
content and messaging, the review of other goods movement strategy visions suggests that:

25 January 24, 2018 The Calgary Goods Movement Strategy Prepared by Watt Consulting Group Ltd. for The City of Calgary
• Goods movement is explicitly recognized as being important and contributing to the wellbeing of
Calgary’s residents and businesses.
• Goods movement supports economic development aspirations. It does so consistently with
aspirations for safety, sustainability, the environment, urban form and healthy communities.
• Goods movement is explicitly accounted for in the planning, design and operations of
communities, the transportation system and private land uses and in the prioritization and funding
of public infrastructure investments.
Table 2-1 lists the key attributes of a goods movement system, as explained in other goods movement
strategies – that is, a goods movement system is the multi-modal network of infrastructure, terminals
and services that serves the Calgary region. It can be seen that many of these complementary
initiatives are aimed at the efficient movement of people. These attributes define what the GMS seeks
to achieve.
Table 2-1: Attributes of a goods movement system: What the Strategy aims to achieve
System attribute Description
Safe, efficient, reliable
Is safe, efficient, reliable, free of delays, especially unexpected
delays, affordable to build, operate/ maintain and use,
convenient spatially and temporally and accessible to all users.
Complementary use of corridors Complements the movement of people safely, efficiently and
reliably, through the use of shared corridors where appropriate.
Offers choices
Offers choices of modes as volumes, origins-destinations,
shipping costs and frequencies change. Also ensures reliability
by providing redundancy in the road/highway network so that
drivers can switch easily to another route if an incident occurs on
their primary route.
Integrated
Is integrated among all modes and their individual components,
with roles and responsibilities of owners, maintainers and users
clearly understood.
Multi-modal
Provides seamless transfer among modes, meaning that
intermodal terminals are easily accessed and that services
operate on convenient schedules.
Connectivity and directness
Meets industry’s needs with a well-developed network of direct
connections with goods-generating activity centres and
intermodal terminals and with the major goods movement
network.
Urban and inter-urban Serves local and inter-regional needs (including access to
internation ports).
Context sensitive Recognizes and avoids sensitive areas, such as residential
neighbourhoods and environmentally protected areas

26 January 24, 2018 The Calgary Goods Movement Strategy Prepared by Watt Consulting Group Ltd. for The City of Calgary
Broad ownership and buy-in Encourage cooperative expansion/upkeep and financing from
both the public and private sectors
Soft attributes
Is defined as much by the quality, expertise and skills of the
labour force that provides goods movement services as by
infrastructure, operations and network performance.
Measureable outcomes
Is defined by measureable outcomes for all perspectives (for
example, improving residents’ health and improving Calgary’s
competitiveness by reducing delays and congestion).
2.3 A proposed vision
In sum, all of the attributes discussed above can be understood in terms of the following vision for
goods movement in Calgary:
The goods movement strategy supports a multi-modal system that is safe, economical, reliable,
efficient and environmentally sustainable.
Within Calgary, goods movement is widely recognized as an essential contributor to the
economic, social and environmental wellbeing of residents and businesses.
The vision is drawn from the once proposed by the consultant team for recent goods movement
strategies elsewhere in Canada. It expresses how it will support all components of the goods
movement system, regardless of who owns, supplies or operates these components. The vision talks to
five key attributes:
• Safe for all users of the system, including passenger modes.
• Economical to implement, operate, maintain and use.
• Reliable in terms of the service offered to users, door-to-door travel times (which is not
necessarily the same as offering short travel times) and network redundancy (allowing diversion
between routes and modes, as situations dictate).
• Efficient in terms of directness and connectivity, including seamless interchanges between modes
and being efficient to operate and maintain.
• Environmentally sustainable, minimizing fuel consumption, greenhouse gas (GHG) emissions and
air pollutant emissions from the process of distributing goods, equipment and the infrastructure
used for goods movement, minimizing intrusions in environmentally, socially or culturally sensitive
areas and the consumption of land and other resources.
These attributes appeal both to the owners and operators of the multi-modal system and to the users of
the system. They signal to the private sector that the system’s owners and suppliers, including The City
of Calgary, recognize the importance of working collaboratively for the common good.
The proposed vision’s wording links it directly to the Triple Bottom Line policy’s basis in economic,
social and environmental concepts. The proposed wording also establishes its importance to the
achievement of the broader aspirations of Calgary’s residents and businesses.

27 January 24, 2018 The Calgary Goods Movement Strategy Prepared by Watt Consulting Group Ltd. for The City of Calgary
This last point – establishing the importance of goods movement – is significant also because it
suggests that decision-makers must consider the extent to which goods movement investments and
priorities will be balanced with those of passenger movement. While the Strategy aims to identify
actions and investments that complement those already proposed elsewhere for passenger movement,
the situation might arise in the future in which these proposals are in conflict with each other.
Accordingly, there will be a need to ensure that the implementation of investments and priorities is
balanced and that the merits of both goods and passenger needs are incorporated explicitly into the
analytical, evaluative and decision-making processes as proposed investments and actions are
considered for implementation.

28 January 24, 2018 The Calgary Goods Movement Strategy Prepared by Watt Consulting Group Ltd. for The City of Calgary
3 Policy Context
The relevant policies and regulations that govern the use and development of the goods movement
system in Calgary are presented below, organized by relevant jurisdiction. Consistent with the nature of
a strategic plan, the perspective is that of planning, rather than operations, enforcement and
engineering.
3.1 The City of Calgary
In 2007, Calgary City Council approved the Terms of Reference for an Integrated Land Use and
Mobility Plan which expands Calgary’s previous transportation plan (The Go Plan – 1995) into the
Municipal Development Plan and the Calgary Transportation Plan, two policy documents that are
central to informing The City’s goods movement strategy.
The Plans set a long-term (60-year) strategy “of a more sustainable city form for Calgary and the transportation
networks needed to serve it. This is supported by a 30-year plan for managing growth and change, public
investment and land use approval decisions. Finally, short-term, ten year, corporate decision-making, business
planning, implementation and accountabilities are aligned to the strategies and plan to support Calgary’s move to
being a more sustainability city.”9
Aspects related to the movement of goods in the MDP and CTP are discussed below.
3.1.1 Municipal Development Plan (MDP)
The MDP is a statutory plan, prepared and adopted by bylaw, in accordance with Section 632 of the
Municipal Government Act. It is aligned with the Provincial Land Use Framework as well as the draft
Calgary Metropolitan Plan.
The MDP covers a range of topics that are focused on land use planning, development and growth
management and speaks to the movement of goods in several specific ways, providing the policy
framework for the GMS:
• Section 2.1.2 “Creating a city attractive to business” policies that support “the transportation and logistics
industry” include:
o Recognizing the role of the Calgary International Airport as a global logistics center while
ensuring city-wide access is retained for public transit, passenger vehicles and goods
movement;
o Identifying railroad inter-modal sites as strategic destinations within the regional logistics
network and plan for supporting land uses that benefit from proximity to these facilities;
9 This and the ensuing discussions are taken from Amendment No. 17 to the Municipal Development Plan as
adopted by Calgary City Council in September 2009, accessed March 15, 2017 from http://www.calgary.ca/PDA/pd/Documents/planning_policy_information/mdp-municipal-development-plan.pdf

29 January 24, 2018 The Calgary Goods Movement Strategy Prepared by Watt Consulting Group Ltd. for The City of Calgary
o Recognizing the access needs of the logistics industry by locating warehouses and local
distribution centers in areas that provide direct roadway connections to the goods
movement corridors.
• Section 2.5 “Connecting the City” notes that Calgary is a major hub for goods movement in western
Canada and the movement of goods and services by air, rail and truck plays an important role in
the Calgary economy.
o Related policy directives under Section 2.5.1 “Transportation Choice” are “respect the needs
of businesses and the impact on local communities in the planning, design and maintenance of
goods and service movement in the city.”
• Section 3.7 “Industrial Areas”10 provides related mobility policies for both existing planned and
future industrial areas including:
o The road network should support the efficient movement of trucks, goods and services
through existing planned and future industrial;
o New inter-modal sites and warehousing facilities should develop within 1,600m of the
Strategic Goods Movement Network (see discussions under CTP);
o Protect the integrity of primary goods movement corridors by limiting direct access from
truck routes to adjacent properties.
• Section 5.3 “Monitoring and reporting” provides core indicators for land use and mobility. As it relates
to the core indicator “Goods Access”11 – currently, 73% of inter-modal and warehousing facilities
are located within 1,600m of the Primary Goods Movement Network with a 60-year target set at
95%.
Thus, the MDP provides the policy context for land use planning for the movement of goods by all
modes of transportation and provides targets towards achieving the goals and objectives of the MDP.
3.1.2 Calgary Transportation Plan (CTP)
The CTP provides policy direction on all aspects of Calgary’s transportation system. Adopted by
Calgary City Council in September 2009, the most recent version of the report includes amendments
from January 2014. Policy directions contained in the CTP are integrated with the MDP. 12
10 Defined in the MDP as areas providing a broad variety of industrial uses and intensities that support business
in Calgary.
11 Measures the percent of inter-modal and warehousing facilities within 1,600m of the Primary Goods Movement
Network (see discussion under CTP)
12 This and the ensuing discussions are taken from the Calgary Transportation Plan (amended last in January
2013) as adopted by Calgary City Council in September in 2009, accessed March 15, 2017 from http://www.calgary.ca/Transportation/TP/Documents/CTP2009/calgary_transportation_plan.pdf

30 January 24, 2018 The Calgary Goods Movement Strategy Prepared by Watt Consulting Group Ltd. for The City of Calgary
Although the CTP emphasizes passenger movement, it recognizes commercial vehicles as a critical
element of Calgary’s economy with an emphasis on several key areas (airport, industrial areas,
intermodal rail terminals and heavily used goods movement corridors).
Specifically, the CTP provides the policy framework for the Goods Movement Strategy as follows:
• The CTP describes seven transportation goals, of which the fifth – “Promote economic development
by ensuring the efficient movement of workers and goods” - describes achieving a transportation system
that facilitates the efficient movement of workers and goods by road, rail and air. It also
recommends that transportation facilities provide access to major industrial and employment
locations.
o Transportation policies (Part 3) related to the movement of goods emphasize the
efficient movement of commercial vehicles in industrial areas, along corridors defined as
the Primary Goods Movement Network and to the airport and inter-modal rail facilities.
Section 3.4 deals specifically with planning the movement of goods, recognizing that Calgary is (1)
a major part of the east-west trade corridor in Western Canada and (2) is a key distribution point
for the movement of Asia-Pacific-related imports and exports. For planning purposes,
consideration is given to the three primary modes responsible for goods movement in the Calgary
region – rail, air and truck (see Table 3-1). Each mode plays a distinct role in the movement of
goods, however, as a matter of policy, these modes must be capable of working together in order
to drive the economy.
o As it relates to trucking, the CTP includes a new Primary Goods Movement Network “that
will facilitate the movement of goods and services in Calgary” and defines “high-priority goods
movement routes where the most concentrated activity will occur.” The Primary Goods
Movement Network is illustrated in Figure 4-13 in Section 4.3.1.1.
• Recommendations in Section 3.4 Goods Movement include:
o The importance of inter-modal facilities and a connected goods movement network
should be recognized to ensure reliable goods movement and land accessibility;
o Calgary, regional partners and other stakeholders should co-ordinate the development of
roadway connections in the city and region, with consideration for the location of
industrial land uses;
o The integrity of major goods movement routes should be protected by limiting direct
driveway access to roadways that form part of the Primary Goods Movement Network
while encouraging appropriate adjacent land use planning with adequate truck
accessibility.
o Intelligent Transportation Systems (ITS)13 should be used to improve traffic flow and
travel time reliability on the Primary Goods Movement Network. The retention and
expansion of existing railway corridors within city limits should be supported.
o Calgary should consider the impact of goods movement routes on roadways in adjacent
municipalities.
13 ITS, as defined in the CTP, is the application of advanced technology to improve transportation operations,
including the control and management of traffic flow and communication of relevant information to travelers and service providers so they can respond to changes in travel conditions or times as necessary.

31 January 24, 2018 The Calgary Goods Movement Strategy Prepared by Watt Consulting Group Ltd. for The City of Calgary
Table 3-1: Primary transport modes for goods movement
Mode Infrastructure characteristics related to goods movement
Air
• The Calgary International Airport is one of only two airports in Canada with direct connections to Asia and Europe
• It operates 24 hours a day, seven days a week without curfews or noise restrictions
• Has first-class cargo facilities including: o Livestock handling facility o On-site refrigeration facilities o 17 acres of runway-side warehouse and logistics lands
Rail
• CN and CP both have major rail inter-modal facilities in southeast Calgary
• There is a need for safer infrastructure related to the interaction between railway and roadway users as there are numerous level crossings within the Calgary City limits
Truck
• Calgary is a trucking hub with major highway connections passing through the City, including: o Highway 2 (Deerfoot Trail), which is a major north/south route as part
of the CANAMEX highway system (also provides connectivity to the Alberta oilsands)
o The Trans-Canada Highway, which is the major east/west route providing connectivity across Canada
• When the Ring Road is completed, it will also play a central role in facilitating the movement of goods
• Within the Calgary city limits, bylaws designate certain routes for trucks above a certain weight. These trucks may only deviate from assigned routes to reach their ultimate destinations using the shortest path to and from designated routes.
Source: Calgary Transportation Plan
3.1.2.1 Monitoring and Reporting Program
As part of the CTP Implementation Framework, the Transportation Data division of Calgary’s
Transportation Planning department developed the Monitoring and Reporting Program or “Mobility
Monitor” as a mechanism through which the objectives of the CTP and MDP can be assessed.14
Travel time reliability on the goods movement network is one of the citywide indicators monitored by the
program with results informing a baseline and 10-year targets. Bluetooth technology is used to collect
data by tracking when individual signals reach various points along routes of study in order to
determine travel time.
14 This and ensuing discussion are taken from Mobility Monitor Issue #39 – June 2011, Measuring Travel Time
Reliability on Selected Goods Movement Corridors, accessed March 17, 2017 from http://www.calgary.ca/_layouts/cocis/DirectDownload.aspx?target=http%3a%2f%2fwww.calgary.ca%2fTransportation%2fTP%2fDocuments%2fPlanning%2fTransportation-Data%2fmobility_monitor_june.pdf&noredirect=1&sf=1

32 January 24, 2018 The Calgary Goods Movement Strategy Prepared by Watt Consulting Group Ltd. for The City of Calgary
The metric that measures travel time reliability is the Travel Time Buffer Index (%)15 which measures
the extra buffer time that most drivers add to their average travel time when planning trips to ensure on-
time arrival. In other words, it is a measure of expected variability in the time spent traveling a route.
3.1.3 2015-2024 Transportation Infrastructure Investment Plan
In a report called “Investing in Mobility”, The City of Calgary provides a strategic outline that defines the
priority and timing of transportation-related capital projects from 2015 to 2024 and is aligned with the
previously discussed CTP.16
Section 3 covers transport infrastructure investments in the category of goods movement and traffic
growth. Projects in this category are designed to improve travel speeds and reliability for commercial
vehicles and commuters on heavily used road corridors and include (1) new interchanges and bridges,
(2) road widening and upgrades, (3) new road connections to provincial highways and (4) new traffic
signals and noise barriers.
Specific references are made to investments in the Primary Goods Movement Network (see
discussions under the CTP) which are aimed to “improve travel time, safety and reliability for commercial
vehicles conducting business in Calgary.” They also support the economy by ensuring Calgary’s continued
role as a major distribution hub for western Canada.
In total, $762 million has been allocated towards funding projects in the Primary Goods Movement
Network including interchanges, interchange upgrades, road extensions and ramps.
3.1.4 Complete Streets Policy
Although Section 3.7 of the CTP includes 22 guiding policies for Complete Streets17 design, as a
planning document it does not provide detailed criteria to design nor the process to implement
Complete Streets. Thus the Complete Streets Policy was created as a key CTP implementation
deliverable. The purpose of the policy is to:18
• Improve safety and accessibility for all road users. The policy provides comprehensive guidelines
to The City of Calgary staff and the development industry on how to incorporate Complete Streets
15 Travel Time Buffer Index (%) = (95th percentile travel time [minutes] – average travel time [minutes]) ÷ average
travel time [minutes]
16 This and the ensuing discussions are taken from Investing in Mobility – 2015-2024 Transportation
Infrastructure Investment Plan, accessed March 17, 2017 from http://www.calgary.ca/Transportation/TP/Documents/Planning/Investing%20in%20Mobility/investing-in-mobility.pdf
17 Per the Complete Streets Policy, Complete Streets are defined as a new selection of multi-modal streets that
incorporate elements of green infrastructure and function in the context of surrounding land uses.
18 This and ensuing discussion are taken from Complete Streets Policy – November 2014, accessed March 21,
2017 from http://www.calgary.ca/_layouts/cocis/DirectDownload.aspx?target=http%3a%2f%2fwww.calgary.ca%2fCA%2fcity-clerks%2fDocuments%2fCouncil-policy-library%2fTP021-Complete-Streets-Policy.pdf&noredirect=1&sf=1
33 January 24, 2018 The Calgary Goods Movement Strategy Prepared by Watt Consulting Group Ltd. for The City of Calgary
concepts into the planning, design and construction of new streets and the reconstruction of
existing streets. These guidelines better accommodate pedestrians, cyclists, street trees and low-
impact development while striving to maintain existing right-of-way requirements; and
• Create liveable neighbourhoods by encouraging people to travel by walking, cycling and taking
transit. It will enhance the safety and security of streets for all users, promote attractive
streetscapes, provide transportation options, reduce the total amount of paved lanes, promote the
economic wellbeing of both businesses and residents and increase civic space.
3.1.5 Other transportation studies
3.1.5.1 RouteAhead (transit)
In 2011, Council directed that a new long-term plan for Calgary’s public transit be created in
accordance with the CTP and subsequently established a team to develop the plan called RouteAhead.
Based on extensive public engagement and guidance from a steering committee, RouteAhead provides
strategic direction for public transit in Calgary for the next 30 years. It should be noted that RouteAhead
does not cover the movement of goods.19
3.1.5.2 Cycling Strategy
Council developed its Cycling Strategy in light of the CTP. The strategy was approved in June 2010. It
sets the vision for becoming “one of the premier cycling cities in North America by making changes that
encourage people to cycle.” 20 While focusing on the movement of people, the implementation of the
Cycling Strategy would support the movement of goods by bicycle.
3.1.5.3 Pedestrian Strategy
Similar to the Cycling Strategy, StepForward is a policy document that focuses on the needs of
pedestrians in Calgary and provides the vision for a safe and walkable city.21 As with the Cycling
Strategy, the implementation of the Pedestrian Strategy would further support the movement of goods
on foot.
3.1.5.4 Pathway and Bikeway Plan
Adopted by Council in July 2000, the Pathway and Bikeway Plan establishes “guiding principles that will
ensure that Pathways and Bikeways are planned, developed, maintained and managed as a seamlessly integrated
19 RouteAhead, A Strategic Plan for Transit in Calgary – Approved by Calgary City Council in March 2013,
accessed March 21, 2017 from https://www.calgarytransit.com/sites/default/files/content/PDF/2013-0118strategyaheadweb1.pdf
20 Cycling Strategy – June 2011, accessed March 22, 2017 from
https://www.calgary.ca/Transportation/TP/Documents/cycling/Cycling-Strategy/2011-cycling-strategy.pdf?noredirect=1
21 StepForward – A Strategic Plan for Improving Walking in Calgary – August 2016¸accessed March 23, 2017
from http://www.calgary.ca/Transportation/TP/Documents/Planning/Calgary-Transportation-Plan/pedestrian-strategy-report-sept2016.pdf

34 January 24, 2018 The Calgary Goods Movement Strategy Prepared by Watt Consulting Group Ltd. for The City of Calgary
network for transportation and recreation.” Necessarily, this plan emphasizes facilitating the movement of
people by non-motorized means of transportation, although again its implementation provided a
network that equally could be used to move goods by active transportation modes. An updated plan will
be presented to Council for approval in 2018.
3.1.6 Truck route regulations
3.1.6.1 Bylaw 60M90
Truck routes are an important consideration in the Strategy. The City of Calgary regulates the use of
truck routes through Bylaw 60M90, in terms of both the movement of goods to, from and through the
city and impacts associated with trucking operations.
Bylaw 60M90 defines a truck as:
“(i) a truck-type vehicle22 with a maximum weight in excess of 5,450 kilograms; or (ii) any self-propelled vehicle, excluding Calgary Transit buses and school buses, with a maximum weight in excess of 5,450 kilograms; or (iii) a tractor, grader, road building or road maintenance equipment, or construction equipment, other than truck-type vehicles, regardless of weight.”
Restrictions on trucking routes in Bylaw 60M90 can be categorized into two types:
• General prohibitions, which can be permanent (all times) or at certain times of day. Restrictions can be imposed in order to avoid travel through residential areas, reduce truck noise impacts on adjacent areas, or because of truck traffic safety concerns due to undesirable road geometries or a high collision history. Other factors also may apply. Exemptions can be allowed for local access, where no alternative exists.23
• Load restrictions, which allow heavy truck traffic but only up to certain weight or dimensional limits. The restrictions are intended to minimize damage to the pavement and road structure; specifically on sections of roads or on structures that were not designed or constructed to handle the loads, roads that have critical height or weight restrictions, or road sections where repeated loading will deteriorate the condition of the infrastructure beyond what is considered normal and acceptable. The restrictions can be year-round or seasonal (during the spring thaw period). Load restrictions commonly apply to rural roads, although not exclusively.24
22 Paraphrased from Bylaw 60M90 as a vehicle or group of attached vehicles…intended for the conveyance of
goods or materials of any kind.
23 Schedule “A” – Highways Designated as Truck Routes, Schedule “B” – highways designated as “Restricted
Truck Routes”, Schedule “C” – Truck Zones of Bylaw 60M90 provide named streets, avenues and highways that form the regulated routings for trucks in Calgary.
24 Schedule “D” – High Load Corridor Routes and Schedule “E” – High Load Corridor Routes provide named
street, avenues and highways designated for high load trucks in Calgary.

35 January 24, 2018 The Calgary Goods Movement Strategy Prepared by Watt Consulting Group Ltd. for The City of Calgary
3.1.6.2 Expansion of Bylaw 60M90
In 2006, the City of Calgary approved three new policies that expand on Bylaw 60M90, based on an
increased focus on truck and goods movement issues within the Roads, Transportation Planning and
Land Use Planning and Policy business units:25
• Truck Route Network Development Policy: Provides guidelines and principles for identifying
acceptable truck routes based on sound engineering, adherence to other City of Calgary Council
policies and minimizing impacts to the environment, social fabric and economic sustainability. The
policy mandates a five-year review cycle for Bylaw 60M90.
• Dangerous Goods Route Network Development Policy: Provides guidelines and principles for
identifying acceptable dangerous-goods routes based on sound engineering and public safety.
• High Load Corridor Development Policy: Provides guidelines and principles for identifying
acceptable high-load truck routes based on parameters discussed above in the Truck Route
Network Development Policy.
These policies aim to ensure that The City of Calgary takes a more proactive approach to addressing
increasing issues with trucking and goods movement.
3.1.6.3 Multi-Jurisdictional Transportation Routing and Vehicle Information System (TRAVIS)
Introduced as a pilot project in 2009, TRAVIS is a one window web-based system that allows
municipalities in Alberta to issue a single permit for overweight and over-sized loads that travel on
provincial and municipal roadways.26 In 2013, TRAVIS was transitioned to a permanent program.
3.1.7 Environmental / sustainability / climate change strategies
Several other municipal-level initiatives are worthy of mention as they may inform the Strategy. These
initiatives are summarized below.
3.1.7.1 Environmental Policy
Revised in 2012, The City’s Environmental Policy aims to (1) conserve, protect and enhance the
environment for all Calgarians and the regional community, (2) integrate environmental principles and
performance objectives into all decision-making processes [relating to growth, planning, infrastructure,
25 This and ensuing discussions are taken from Mobility Monitor Issue #17 – September 2007, Trucks,
Commercial Vehicles and Goods Movement in Calgary, accessed March 17, 2017 from http://www.calgary.ca/_layouts/cocis/DirectDownload.aspx?target=http%3a%2f%2fwww.calgary.ca%2fTransportation%2fTP%2fDocuments%2fdata%2fmobility_monitor_sept.pdf&noredirect=1&sf=1
26 This and the ensuing discussions are taken from Roadata Services Ltd, October 2011 - What Industry Needs
to know about Changes to the Travis Web accessed on March 21, 2017 from http://www.roadata.com/Trans/documents/What%20Industry%20needs%20to%20know%20about%20changes%20to%20the%20TRAVIS%20Web.pdf and The City of Calgary, Vehicle Overweight Permit, accessed March 21, 2017 from http://www.calgary.ca/Transportation/Roads/Pages/Traffic/Permits/Load-ban-permits.aspx

36 January 24, 2018 The Calgary Goods Movement Strategy Prepared by Watt Consulting Group Ltd. for The City of Calgary
transportation and development] and (3) recognize that environmental stewardship is a shared
responsibility of government, business, communities and individual citizens.27
3.1.7.2 Community Greenhouse Gas Reduction Strategy
City Council adopted the Calgary Community Greenhouse Gas Reduction Plan in 2011 as a matter of
priority and in line with the MDP and CTP. The vision of the plan “is for energy used in Calgary to have a low
impact on health and the environment, come from a diverse set of sources, be accessible and support local
prosperity and adaptability”. The goal of the plan “is to significantly reduce GHG emissions in Calgary while
realizing other environmental, economic and social benefits” which are accomplished through the plan’s
“objectives of energy conservation and efficiency and the development and use of low-carbon energy sources.”28
The plan notes that GHG emissions are also a result of the creation, production and transportation of
products and services although such emissions were not investigated within the scope of the plan
(unless they are generated within city boundaries).
Based on a triple-bottom-line analysis, four focus areas were identified and ranked in order of reduction
potential. The fourth focus area “transportation choices and compact development” includes promoting
walking, cycling and transit, which are influenced by land use and transportation planning and pricing
policies.
Through research and stakeholder consultations, the plan describes actions at the organizational level
that can reduce GHG emissions. Organizations and related actions that are pertinent to the Strategy
are summarized in Table 3-2.
The City is currently updating the Community Greenhouse Gas Reduction Strategy.
27 The City of Calgary’s Environmental Policy – Revised 2012, accessed March 21, 2017 from
http://www.calgary.ca/UEP/ESM/Documents/ESM-Documents/environmental_policy.pdf
28 This and ensuing discussions are taken from the Calgary Community GHG Reduction Plan – Energy in the
City, 2011 accessed March 21, 2017 from http://www.calgary.ca/UEP/ESM/Documents/ESM-Documents/Calgary_GHG_Plan_Nov_2011.pdf

37 January 24, 2018 The Calgary Goods Movement Strategy Prepared by Watt Consulting Group Ltd. for The City of Calgary
Table 3-2: Actions by organization type that are relevant to the Strategy
Organization type Action
Fleet operators
• Undertake driver training and feedback systems on driving habits;
• Put in place idling and driving policies; • Install fuel saving devices such as auxiliary power units, on-board
computers and truck plug-ins;
• Keep vehicles properly maintained including proper air pressure in tires; and
• Identify and work to remove barriers to new products, services and behaviours.
Companies with shipping
• Undertake freight logistics management to reduce the shipment of partial loads; and
• Electrify loading docks and put in place idling policies.
Rail operators
• Use hybrid or genset switcher locomotives.
• Install anti-idling devices such as auxiliary power units, automatic start/stop devices, rail yard electrification.
• Identify and work to remove barriers to new products, services and behaviours.
Source: Calgary Community Greenhouse Gas (GHG) Reduction Plan, 2011
3.1.7.3 2020 Sustainability Direction
This document links imagineCALGARY’s Long Range Urban Sustainability Plan (100-year vision) to
The City of Calgary’s three-year business plans and budgets. Plans and budgets act as reference
points in moving to a 10-year horizon per the Direction.29
With respect to improving goods movement, strategies include (1) identifying and prioritizing capital and
operational improvements to the Goods Movement Network and (2) planning and implementing
ongoing improvement to reduce travel time and improve reliability of the major goods movement
network. Related targets for 2020 are:
• Decrease the Travel Time Buffer Index – extra time needed to ensure on-time arrival; and
• Maintain or improve the average travel time on selected Goods Movement Network corridors,
reducing traffic delays (average speed on selected goods movement corridors).
3.1.7.4 Triple Bottom Line Policy Framework
Adopted by Calgary City Council in September 2005, the Triple Bottom Line Policy Framework serves
to incorporate sustainable development (economic, environmental, social and smart growth) principles
into the City’s decision-making processes. The policy speaks to the movement of people and goods
more generally and largely incorporates policies existing under the CTP.30
29 This and ensuing discussions are taken from 2020 Sustainability Direction, accessed March 21, 2017 from
http://www.calgary.ca/_layouts/cocis/DirectDownload.aspx?target=http%3a%2f%2fwww.calgary.ca%2fCA%2fcmo%2fDocuments%2f2013-0648_ChangesTo2020SusCover_spread_web.pdf&noredirect=1&sf=1
30 Triple Bottom Line Policy Framework – May 2006, accessed March 22, 2017 from
http://www.calgary.ca/CA/cmo/Documents/TBL%20Framework.pdf

38 January 24, 2018 The Calgary Goods Movement Strategy Prepared by Watt Consulting Group Ltd. for The City of Calgary
3.1.8 Economic development strategy
The City of Calgary’s ten-year economic development strategy was updated in 2015.31 Entitled Building
on our energy, the strategy has six areas of focus that build on the strength of the energy sector,
support entrepreneurs, give more attention to growing technology and innovation, build, attract and
retain a skilled work force and promote collaboration to implement the strategy.
Transportation and logistics is recognized as an important economic sector and the strategy notes that
Calgary is geographically well located to serve as Western Canada’s transportation and logistics hub.
The strategy identifies several implementation actions to support its areas of focus, of which three are
linked to goods movement:
• Solidify the region’s position as Western Canada’s premiere distribution and logistics hub, by
potentially establishing the Calgary Region as a foreign trade zone (with its associated benefits to
businesses located in the zone), marketing the Region’s strong transportation infrastructure,
increasing air access to high growth markets and establishing the Region as an inland port.32
Four indicators are proposed to measure the progress of implementing this action:
o Number of transportation and logistics companies and distribution centres in Calgary.
o Volume and value of goods shipped through Calgary.
o Capacity to receive goods for sorting and distribution.
o Number of international air connections.
• Develop an integrated, multi-modal transportation system that supports a prosperous and
competitive economy, by maintaining automobile and commercial goods vehicle mobility while
increasing emphasis on alternative modes of transportation (among other potential tactics,
including revenue generation and financing tools). Indicators include the amount of spending on
transportation infrastructure, commute times and transit usage.
• Address greater connectivity between Calgary’s primary cultural, recreation and commercial
districts in the Centre City,33 by increasing the accessibility to and within the Centre City for both
people and goods. Relevant indicators include the primary modes of transportation within the
Centre City (i.e., the supply, quality and level of service of the multi-modal network).
3.1.9 Industrial lands strategy
The City of Calgary adopted the Industrial Land Development Strategy in 2013, which provides a
framework for developing and servicing City-owned lands for industrial and other uses. The Industrial
Land Development Strategy has five guiding principles, the first of which is to support local economic
development. In doing so, it notes that The City could consider requests for developing or
31 The ensuing discussion is drawn from Building on our energy, Calgary Economic Development and The City of
Calgary, version 2.1, August 26, 2015.
32 The Strategy defines an inland port as “an area that facilitates trade through investment in multi-modal transportation assets and
[promotes] value-added services as goods move through the supply chain.”
33 The Centre City is defined as Stampede Park to Calgary Zoo and Inglewood to Downtown West Village.

39 January 24, 2018 The Calgary Goods Movement Strategy Prepared by Watt Consulting Group Ltd. for The City of Calgary
consolidating large-sized lots (larger than 10 acres), where this would support the development of an
intermodal park or provide access to goods movement as a function of the lot’s location.34
A 2015 report to The City’s Land and Asset Strategy Committee noted that the ‘goods movement
sector’ has a strong attraction to southeast Calgary, where most of the City-owned industrial lands are
located. The report cites the potential growth of distribution centres in the Calgary region, given the
region’s established role as a Western Canada distribution hub. However, it notes that to maintain their
competitive advantage, “trucking and warehousing companies will seek locations with good linkages to major
roads and regional highways (limited traffic congestion, right turn movements and few traffic signals),” which can
result in some businesses relocating from Calgary to “industrial parks in neighbouring municipalities.”
Manufacturing for the oil and gas sector also is identified as an important economic segment. However,
some of these businesses “rely on the high and wide corridors (traffic signals need to swivel, absence of
overhead wires, access to regional highways) to move high-value products out of the city.” To attract and retain
these businesses, sites are needed “with good access to regional highways and high and wide load access
within Calgary.”35
The Industrial Land Development Strategy is currently being updated.
3.2 Calgary Regional Partnership
3.2.1 Calgary Metropolitan Plan
Developed by municipalities under the Calgary Regional Partnership, the Calgary Metropolitan Plan
provides a blueprint for accommodating regional growth within the next 60 years. The Calgary
Metropolitan Plan is guided by five principles. The fourth principle, “integrating efficient infrastructure
systems,” is pertinent to the Strategy as it speaks to a system that incorporates complete transportation
and mobility systems for the movement of people and goods.36
3.3 Province of Alberta
3.3.1 Multi-Modal network strategy
The Province of Alberta operates a number of highways in Calgary (see Figure 4-12 in Section 4.3.1
below). Generally, the provincial Traffic Safety Act governs the use of highways in Calgary. Regulations
under the Traffic Safety Act concern cargo securement, commercial vehicles, bus safety rules of the
34 2013-22 Industrial Land Strategy: For the development of City-owned lands, approved by City Council 18
March 2018.
35 Industrial Land Strategy – Updated Report 2015, Corporate Services Department Report to Land and Asset
Strategy Committee, 30 April 2015.
36 Calgary Regional Partnership, Calgary Metropolitan Plan – May 2014, accessed March 21, 2017 from
http://calgaryregion.ca/dam/Website/reports/General/CRP-current-general-documents/Calgary-Metropolitan-Plan---June-2014/Calgary%20Metropolitan%20Plan%20-%20June%202014.pdf

40 January 24, 2018 The Calgary Goods Movement Strategy Prepared by Watt Consulting Group Ltd. for The City of Calgary
road, driver training and examinations, vehicle equipment, vehicle seizure, demerit points and long-haul
regulations.
From a planning perspective, two recent provincial initiatives are relevant. They are described in the
next sections.
3.3.2 Commercial vehicle safety regulations
New commercial vehicle safety regulations in Alberta came into effect in July 2009. These regulations
brought provincial regulations in line with current Canadian and North American standards. They were
based on extensive consultations with commercial vehicle stakeholders including industry, municipal
and safety organizations.37 Key regulations for commercial vehicle include:
• Modified vehicles (manufactured on or after January 1, 2012) will need a new compliance label or
a mechanical fitness certificate issued by a qualified professional engineer;
• All vehicles must be maintained in safe operating condition;
• A commercial vehicle must have brakes on all wheels (including trailers) except where the vehicle
is exempted from the Motor Vehicle Safety Act or the Traffic Safety Act;
• A warning sign must be displayed on the rear of a commercial vehicle that transports flammable
liquid or gas if the tank has a capacity of 5,000 litres or greater;
• A single-axle trailer (other than a semi-trailer) is prohibited from carrying petroleum products on a
highway when the tank has a capacity of 3,000 litres or greater for flammable liquids or 450 litres
or greater for flammable gas;
• A commercial vehicle will not be allowed to operate on a highway at a speed or with a load
greater than the rating of any tire on the vehicle;
• Requirements in the Driveway and Towaway Regulations will be substantially simplified and
updated to reflect current automotive technology;
• An advance warning triangle will be the only recognized advance warning device (flags and flares
will no longer be recognized as they are obsolete); and
• The use of “working lights” on commercial vehicles will be permitted as long as it is not in motion
on a highway.
37 This and the ensuing discussions are taken from Updated Rules for Vehicles in Alberta – May 2009, accessed
March 19, 2017 from http://www.transportation.alberta.ca/Content/docType41/production/updatedvehiclerulesAB.pdf.
See also Traffic Safety Act, Commercial Vehicle Safety Regulation, Alberta Regulation 121/2009, at
http://www.transportation.alberta.ca/3.htm.

41 January 24, 2018 The Calgary Goods Movement Strategy Prepared by Watt Consulting Group Ltd. for The City of Calgary
3.3.3 Business Plan 2017-20 Transportation
A transportation-based business plan outlines a coordinated approach to providing a safe, efficient,
environmentally responsible and sustainable transportation system that is affordable and meets the
needs of Albertans.38 The plan covers the period 2017 to 2020.
As it relates to the Goods Movement Strategy, “The Government of Alberta will work with jurisdictional partners
to promote opportunities for improvements to network supply chains and information management to encourage
seamless inter-modality and support collaboration between commercial carriers and shippers working toward
achieving effective harmonized standards and regulations.”
The Government of Alberta will also provide “ongoing support toward the development of effective connections
between modes of transportation (road, rail, air, marine, public and active transportation)” to enable “a reliable and
well-integrated system.”
3.4 Government of Canada
The Government of Canada sets the rules for how certain parts of the transportation system operate
through the Canada Transportation Act and the Transportation of Dangerous Goods Act. The two Acts
are supported by various specific orders and regulations.
3.4.1 Transportation safety
Transport Canada develops and enforces safety regulations and standards and tests and promotes
safety technologies in air, marine, rail and road transportation. In terms of road transportation relevant
to goods movement, Transport Canada is limited to regulating the safety of interprovincial trucking.
Transport Canada is more active in rail safety regulation. Rail safety is regulated by the Railway Safety
Act. The Government of Canada has developed a number of regulations pursuant to this Act that have
relevance for the Strategy including regulations requiring notice be provided to municipalities of certain
railway engineering work. Transport Canada also works actively with the railways to reduce trespassing
on railway property.
3.4.2 Transportation of dangerous goods
The Government of Canada regulates the transportation of dangerous goods through the
Transportation of Dangerous Goods Act and the regulations and orders made pursuant to this Act.
Transport Canada works with its partners to promote public safety in the transportation of dangerous
goods, including:
• Establishing safety standards and regulations for the safe transportation of dangerous goods;
• Monitoring compliance of modal shippers, consignors and importers with the Emergency
Response Assistance Plan, means of containment standards and facility assessments; and
38 This and ensuing discussions are taken from Business Plan 2017-20 Transportation, accessed March 19, 2017
from http://finance.alberta.ca/publications/budget/budget2017/transportation.pdf

42 January 24, 2018 The Calgary Goods Movement Strategy Prepared by Watt Consulting Group Ltd. for The City of Calgary
• Operating the Canadian Transport Emergency Centre to help emergency response personnel
deal with dangerous goods accidents.
3.4.3 Asia-Pacific Gateway and Corridor Initiative (and the New Trade and Transportation Corridors Initiative)
The Asia-Pacific Gateway and Corridor Initiative (APGCI) “is an integrated set of strategic
transportation infrastructure investments and policy measures that facilitate global supply chains
between North America and Asia.”39 As the initiative is geographically crosscutting (see Figure 3-1), it
requires regional partnerships between provincial governments (and the private sector) in order to fulfill
its mission. As it relates to the Strategy, both the Province of Alberta and the Calgary International
Airport are partners in the APGCI.40
Figure 3-1: Asia-Pacific Transport Corridor
To date, the Government of Canada has worked with partners in the APGCI to invest over $1.4 billion
in strategic infrastructure projects. Strategic projects include British Columbia’s Lower Mainland and
Prince Rupert ports, their principal road and rail connections stretching across western Canada and
south to the United States, key boarder crossings and major Canadian airports.
Infrastructure projects that are relevant to the Calgary region include:
39 Asia-Pacific Gateway and Corridor Initiative, accessed on March 22, 2017 from
www.asiapacificgateway.gc.ca/investments.html (Note that the website has since been terminated)
40 This and ensuing discussions are taken from APGCI Investments Map – modified in November 2015,
accessed on March 22, 2017 from http://www.asiapacificgateway.gc.ca/investments.html (Note that the website has since been terminated.)

43 January 24, 2018 The Calgary Goods Movement Strategy Prepared by Watt Consulting Group Ltd. for The City of Calgary
• Twinning of the TransCanada Highway in Banff National Park to facilitate travel and trade
between Alberta and British Columbia.
• Widening of 52 Street S.E. from 114 Avenue to 130 Avenue S.E. from two to four lanes and from
90 Avenue to 106 Avenue S.E. from two to six lanes; construction of a grade separation at the CP
line and the Western Headwaters Canal; intersection improvements; and storm water upgrades.
Trade and Transportation Corridors Initiative
Announced in November 2016 and incorporated into the 2017 federal budget, the Trade and
Transportation Corridors Initiative will see investments from the Government of Canada of $10.1 billion
over the next 11 years in trade and transportation projects. The purposes of this initiative and related
investments are to build stronger and more efficient transportation corridors to international markets
and to help Canadian business compete, grow and create more jobs for Canadians.
Notably, under the Trade and Transportation Corridors Initiative, the Government of Canada will invest
$2 billion over 11-years in the National Trade Corridors Fund, “a merit-based program to make
Canada's trade corridors more efficient and reliable.”41 Municipalities are eligible recipients for this
program. The program will fund the following types of projects:
• Prepare (for example, plan, demolish, prepare site), construct, rehabilitate and improve
infrastructure assets related to transportation, such as:
o Studies (feasibility, environmental, planning and integration), including computer and
simulation modelling, to guide the development of infrastructure projects and technology
applications.
o Highway, bridge, interchange and road projects along corridors that involve more than
one mode of transportation, including those that provide access to border crossing
facilities.
o Infrastructure that involves more than one mode of transportation (for example, airports,
ports, rail yards, facilities, access roads) and makes the best use of the overall
transportation system to support international trade.
o Grade separations that provide more efficient and safer road and rail interaction.
o Improvements to the transportation infrastructure in Canada's territorial north and at
airports with annual passenger flows below 600,000.
• Acquire and install technologies and equipment that advance and support the efficient movement
of goods and people and help integrate transportation modes in Canada's trade corridors (for
example, Intelligent Transportation Systems (ITS) and radio frequency or optical identification
readers).42
41 Transport Canada. 2017. Trade and Transportation Corridors Initiative, announced July 4, 2017.
42 Transport Canada. 2017. Apply for NTCF Funding.

44 January 24, 2018 The Calgary Goods Movement Strategy Prepared by Watt Consulting Group Ltd. for The City of Calgary
Expressions of interest for funding were due in September 2017, and it is unclear whether there will be
future funding rounds.43
43 Transport Canada. 2017. Apply for NTCF Funding.

45 January 24, 2018 The Calgary Goods Movement Strategy Prepared by Watt Consulting Group Ltd. for The City of Calgary
4 Overview of existing conditions
4.1 Introduction
This section profiles the existing components of the goods movement system, notably the existing and
planned goods movement networks, including restrictions, land use (distinguishing industrial land use),
key intermodal facilities, significant goods movement origins and destinations. It provides an inventory
of goods movement infrastructure and constraints, including bridge structures and gaps in
infrastructure.
4.2 Land Use, demographic and economic characteristics and trends
4.2.1 Population and employment
In 2015, the Calgary Region, comprising Calgary and the surrounding region, was home to 1,178,000
people and 690,000 jobs. Of these, 83% of the population and 91% of the jobs were in Calgary.
By 2039, the Region is projected to have 2,238,000 residents and 1,158,000 jobs, as illustrated in
Figure 4-1. Of these, Calgary’s proportions are expected to drop slightly, to 81% of the population and
87% of the jobs
Figure 4-2 illustrates the expected growth rates in population and jobs relative to 2015. Between 2015
and 2039, the city’s population is expected to grow by 1.8% annually and its jobs by 1.7% annually. In
the surrounding region, the population is expected to grow by 2.5% annually and jobs are expected to
grow by 3.1% annually.44 Calgary will remain the dominant demographic and employment centre of the
region. However, the growth rates in the surrounding region for both population and jobs are expected
to be much greater than those inside Calgary.
44 These growth rates are all expressed as compound annual growth rates.

46 January 24, 2018 The Calgary Goods Movement Strategy Prepared by Watt Consulting Group Ltd. for The City of Calgary
Source: Consultant analysis of data provided by The City of Calgary.
Figure 4-1: Projected population and employment, 2015 – 2039
Source: Consultant analysis of City of Calgary data. All growth rates are referenced against the year 2015 (i.e., 2015 = 100)
Figure 4-2: Projected growth rates in population and employment
4.2.2 Land Use
Figure 4-3 shows Calgary’s urban structure by major land use category. The map, developed as part of
the MDP and amended in 2014, also shows key transportation and utility corridors. Southeast and
northeast Calgary will continue to be the primary concentrations of industrial activity and will see growth
in these activities. Figure 4-4 shows the expected growth areas in the surrounding regions. It can also
be seen that commercial / industrial activity is expected to grow east and northeast of Calgary and
along Highway 2, especially to the north.
0
200
400
600
800
1,000
1,200
1,400
1,600
1,800
2,000
2015 2019 2023 2027 2031 2035 2039
Po
pu
lati
on
an
d e
mp
loym
en
t (t
ho
usan
ds)
Calgary population
Surrounding region population
Calgary employment
Surrounding region employment
40
60
80
100
120
140
160
180
200
220
2015 2020 2025 2030 2035
Fo
recaste
d g
row
th (
2015
= 1
00)
Calgary population
Surrounding region population
Calgary employment
Surrounding region employment

47 January 24, 2018 The Calgary Goods Movement Strategy Prepared by Watt Consulting Group Ltd. for The City of Calgary
Source: Municipal Development Plan, Map 1, as amended 2014.
Figure 4-3: Urban Structure – Municipal Development Plan (as amended 2014)

Source: Calgary Metropolitan Plan, Calgary Regional Partnership, June 2014.
Figure 4-1: Planning concept map – Calgary Metropolitan Plan

49 January 24, 2018 The Calgary Goods Movement Strategy Prepared by Watt Consulting Group Ltd. for The City of Calgary
4.2.3 Transportation-related employment levels and locations
Employment levels and business location data provide an indication of where significant freight-
generators are located within Calgary. These data are only a proxy for the number of trips that are
made from a given location, particularly in light of emerging trends such as the increasing automation of
distribution centres. However, in general a correlation can be expected between the size of a freight-
related business location (in terms of number of employees) and the number of truck trips to and from
this location. Visualizing where these businesses are clustered then provides an indication of where
much of the truck traffic in Calgary is likely originating or terminating.
4.2.3.1 Employment levels
On average in 2015, the transportation sector in Calgary employed 61,000 people, though not all of
these are related to freight. Figure 4-5 breaks down this employment by North American Industrial
Classification System (NAICS) three-digit subsector codes.45 Most of these people are employed in
trucking (16,500), which is obviously freight-related. The second highest sub-sector is air transportation
(9,100); however, this figure is likely driven by the presence of WestJet’s head office and main hub and
by Air Canada’s hub, rather than primarily by freight demand. Rail transportation employs 3,100 people.
Although this employment is almost exclusively freight related, the figure is also driven by the presence
of CP’s head office in Calgary.
Dun and Bradstreet46 employment data were also used to understand the geographic distribution of
transportation-sector employment in Calgary, as they offer finer geographic resolution. These data are
plotted on the map in Figure 4-7 under section 4.2.3.2 below. In order to validate the Dun and
Bradstreet data, Table 4-1 summarizes the differences in employment counts between and the
Statistics Canada Labour Force Survey (LFS) data used in Figure 4-5 and 47 Dun and Bradstreet
Employment Location data. The counts from both sources are categorized by three-digit NAICS codes.
Overall, the total employment is similar within 6% (65,000 versus 61,400) between the two data sets. In
addition, truck transportation is the largest transportation sector in both data sets. However, the LFS
reports significantly lower employment in the rail transportation, rail transportation support and trucking
sectors, and significantly higher employment in the air transportation and couriers and messengers
sectors.
Some of the difference may be due to differences in the data collection method between the two
surveys, including the interpretation of the classification system, although the drop in rail sector
45 NAICS is a standard system for categorizing businesses and economic activity. It is used by Statistics Canada
and corresponding agencies in the United States and Mexico. NAICS codes have six digits, which are aggregated into sectors (two digits) and subsectors (three digits, as described in this analysis). More information can be found at http://www.statcan.gc.ca/eng/subjects/standard/naics/2017/index.
See also the discussion in Section 6.1.3 below.
46 Dun and Bradstreeet is a company that maintains a database of commercial entities.
47 The LFS is a monthly survey undertaken by Statistics Canada to estimate employment and unemployment.

50 January 24, 2018 The Calgary Goods Movement Strategy Prepared by Watt Consulting Group Ltd. for The City of Calgary
employment is likely due to the restructuring that CP underwent post-2013, which resulted in an
estimated up to 6,000 job losses company wide.48
The wholesale sector (NAICS 41) is also a freight-generating sector. On average in 2015, the
wholesale sector employed 34,000 people. As shown in Figure 4-6, the largest fraction of these
employees (9,900) were employed in the machinery equipment and supplies wholesaler subsectors,
followed by building material and supplies wholesalers (7,200) subsectors.
Source: CPCS analysis of Statistics Canada Labour Force Survey data, categorized by three-digit NAICS codes.
Figure 4-5: Transportation sector employment, Calgary, average 2015 (thousands)
48 Deveau, S. 2013, CP Rail may cut as many as 6,000 jobs: Harrison. The Financial Post.
9.1
3.2
16.5
7.9
6.3
5.6
4.4
3.2
5.1Air transportation
Rail transportation
Water transportation
Truck transportation
Transit transportation
Pipeline transportation
Scenic transportation
Support transportation
Postal service
Couriers messengers
Warehousing storage

51 January 24, 2018 The Calgary Goods Movement Strategy Prepared by Watt Consulting Group Ltd. for The City of Calgary
Table 4-1: Sector-by-sector comparison between Dun and Bradstreet (D&B) and Statistics Canada Labour Force Survey (LFS) data
Employee counts Percent
difference NAICS (3-digit code) D&B (2011) LFS (2015)
Air transportation 2,601 9,133 251%
Rail transportation 5,877 3,192 -46%
Water transportation 208 0 -100%
Truck transportation 24,841 16,508 -34%
Transit transportation 6,562 7,925 21%
Pipeline transportation 5,466 6,317 16%
Scenic transportation 275 0 -100%
Support transportation 9,961 5,642 -43%
Postal service 3,610 4,425 23%
Couriers and messengers 54 3,158 5749%
Warehousing storage 5,565 5,117 -8%
Total 65,020 61,417 -6%
Source: CPCS analysis of D&B (Dun and Bradstreet) and Statistics Canada LFS (Labour Force Survey), categorized according to NAICS three-digit code.

52 January 24, 2018 The Calgary Goods Movement Strategy Prepared by Watt Consulting Group Ltd. for The City of Calgary
Source: CPCS analysis of Statistics Canada Labour Force Survey data, categorized by three-digit NAICS codes.
Figure 4-6: Wholesale sector employment, Calgary, average 2015
4.2.3.2 Employment locations
Although the size of a business establishment in terms of total number of employees is only a proxy for
freight volumes to and from those establishments, it is expected that there is likely a significant number
of truck trips to and from areas where these establishments are clustered. Figure 4-7 shows
employment data in the transportation sector, plotted by location49 and subsector.50 Excluding
downtown, which likely primarily represents head office employment, most transportation-related
employment is clustered into two areas in Calgary: in the city’s northeast, south of Calgary International
Airport and in the city’s southeast between the CP and CN rail networks.
Around Calgary International Airport there is primarily air sector and support sector employment, which
includes activities that relate to passenger transportation. However, there are also several warehousing
and storage and trucking sector employers, which likely support the transit of freight through Calgary
International Airport. In 2011, the value of freight transiting through the airport was $3.6 billion in freight
value.51
In the city’s southeast, warehousing and storage, trucking and rail sector employment are clustered
around areas with rail spur access, which also corresponds to locations of many transload facilities, as
well as CP’s intermodal terminal. In particular, this employment is clustered in the triangle formed
49 Based on the business address.
50 Note that Figure 4-7 and some of the other maps that are depicted in Chapter 4 are projected according to
UTM (Universal Transverse Mercator) cartographical system of depicting spatial locations. As a result, the maps might appear as if they have been tilted slightly compared with other maps, such as that shown in Figure 4-15 However, the use of the UTM projection promotes the highest degree of accuracy in the scale, based on the source information. Calgary is located in UTM zone 12N.
51 Based on data collected by Dun and Bradstreet.
1.2
5.7
2.7
2.6
7.2
9.9
4.6
Farm product wholesaler
Petroleum product wholesaler
Food and beverage and tobaccowholesaler
Personal and household goodswholesaler
Motor vehicle and parts wholesaler
Building material and supplieswholesaler
Machinery equipment and supplieswholesaler
Miscellaneous wholesaler

53 January 24, 2018 The Calgary Goods Movement Strategy Prepared by Watt Consulting Group Ltd. for The City of Calgary
between the CN and CP lines, within the area bounded by 50 Avenue S.E. to the north, Glenmore Trail
to the south and the CP line to the west. There is also a smaller cluster of employment between CP’s
line south to Lethbridge and its line east to Regina – i.e., between Macleod Trail to the west, Highway 2
to the east and Highway 8 to the south. Figure 4-7 depicts the two clusters inside the dashed black-
and-white rings.

54 January 24, 2018 The Calgary Goods Movement Strategy Prepared by Watt Consulting Group Ltd. for The City of Calgary
Source: CPCS analysis of Dun and Bradstreet data
Figure 4-7 Calgary Region transportation and logistics sector employment locations

55 January 24, 2018 The Calgary Goods Movement Strategy Prepared by Watt Consulting Group Ltd. for The City of Calgary
Some of these clusters are adjacent to locations of expanding industrial parks in Calgary, which can
provide facilities for additional warehouse space. For example, Dufferin Industrial Park, Point Trotter
Industrial Park and Great Plains Industrial Park are all located in the city’s southeast to east of the
existing cluster shown (i.e. closer to Stoney Trail). The proposed Aurora Business Park is located in the
other cluster of freight-related employment in Calgary around Calgary International Airport. These
locations are likely to be locations of additional freight generation in the future.
4.2.4 Logistics parks in and around Calgary: how logistics facilities have grown
Several business and logistics parks in Calgary are at various stages of development and provide for
high quality, available serviced industrial land. Business and industrial/logistics parks in Calgary
include:
• Dufferin Industrial Park: In southeast Calgary, it has direct access to the Stoney Trail ring road
and is in close proximity to the CP intermodal facility. Large shippers, including Sears and
Canadian Tire, have co-located distribution centres next to the CP yard. The park is fully serviced
with water/wastewater, lights, sidewalks, etc. Three serviced industrial lots are available at
Dufferin North. The lots are approximately 50 acres, 28 acres and 19.4 acres. Four serviced
industrial lots are available at Dufferin South, between 4.25 and 6 acres. Further lots are to be
released in both areas.
• Point Trotter Industrial Park: Located near the Dufferin Industrial Park, this site includes 117
acres of developable land (28 lots ranging from 1.06 - 5.26 acres, of which 14 are currently
available) for smaller scale manufacturing and warehousing. The park is fully serviced with
water/wastewater, lights, sidewalks, etc. An additional phase of the industrial park is currently in
the design phase, with an anticipated release for 2018.
• Great Plains Industrial Park: Located in the southeast quadrant of the city, this industrial park
provides quick access to Stoney Trail and is home to warehousing and light manufacturing
activity. The park is fully serviced with water/wastewater, lights, sidewalks, etc. However lots at
this site are currently sold out.
• Aurora Business Park: Located in northeast Calgary, it is immediately west of Calgary
International Airport and the Deerfoot Trail (QE2) north-south highway. This business park, which
is being developed by The City of Calgary, has direct links to nearby air-related logistics facilities.
Comprised of 320 acres, Aurora is envisioned as an employment node with a mixture of light
industrial and office uses. Fully serviced land will be available in this park by 2019.
• Other City of Calgary business parks, including Starfield, Eastlake and Shepard industrial parks,
also have fully serviced available industrial land with lots ranging from 3 to 10 acres. The Forest
Lawn Creek industrial park is currently under development and does not yet offer serviced land
but it has over 500 acres of saleable land.
• There are additional logistics development opportunities in the broader Calgary Region. For
example, CN’s Calgary Logistics Park in Rocky View County has co-located land available for
logistics activity.
One way to visualize recent trends is by mapping the location of large freight facilities over the last
fifteen years. Figure 4-8 shows the location of distribution and manufacturing facilities with a building

56 January 24, 2018 The Calgary Goods Movement Strategy Prepared by Watt Consulting Group Ltd. for The City of Calgary
footprint over 250,000 square feet, for a time period ranging from 2002 to 2017 (years selected based
on the availability of Google Earth aerial imagery).
On the map, each circle denotes a single facility, with the size of the circle corresponding to the size of
the facility and the shade representing the age (darker red indicates more recent construction). Notably,
in the last fifteen years there has been some growth in large facilities in the southwest. There has also
been significant growth in the northwest part of the region, including near the airport and outside of the
city proper.

57 January 24, 2018 The Calgary Goods Movement Strategy Prepared by Watt Consulting Group Ltd. for The City of Calgary
Figure 4-8: Evolution of freight facility locations in Calgary Region, 2002 - 2017

58 January 24, 2018 The Calgary Goods Movement Strategy Prepared by Watt Consulting Group Ltd. for The City of Calgary
4.2.5 Truck trip ends cluster analysis
In addition to employment locations and facility locations from satellite imagery, GPS data from the
American Transportation Research Institute (ATRI) were used to map trip ends by traffic analysis zone
(TAZ), where a trip end is defined as a location where a truck starts or ends a trip. ATRI receives GPS
data from truck fleets across North America, primarily (though not exclusively) larger trucks engaged in
long-haul trucking. The data for this study were provided for weekdays within four representative two-
week periods, taken in the months of March, June, September and December 2016 (generally the first
two weeks of the month, with the exception of September for which the last two weeks were used).
The ATRI data go beyond employment and square footage to indicate actual truck traffic, i.e. the total
number of truck trips “generated” within each TAZ.
Figure 4-9 shows the location of trip ends in Calgary. The distribution of trip ends is very similar to the
distribution of employment, except for the additional trip end clusters in Balzac and Airdrie, which are
not shown in the employment data summarized in section 4.2.3.2. High concentrations of trip ends are
apparent in certain locations, especially in the N.E. and S.E. However, it can also be seen that truck
trips are generated throughout Calgary, even in zones that have relatively low levels of employment.
The trip ends were used to identify freight clusters, which are contiguous TAZs with significant truck trip
generation according to the GPS trip end data. Nine major clusters were identified based on the data,
as shown in Figure 4-10.

59 January 24, 2018 The Calgary Goods Movement Strategy Prepared by Watt Consulting Group Ltd. for The City of Calgary
Source: CPCS analysis of ATRI GPS data (2016).
Figure 4-9: Trip ends by traffic zone

60 January 24, 2018 The Calgary Goods Movement Strategy Prepared by Watt Consulting Group Ltd. for The City of Calgary
Source: CPCS analysis of ATRI GPS data (2016).
Figure 4-10: Top freight clusters by trip ends

61 January 24, 2018 The Calgary Goods Movement Strategy Prepared by Watt Consulting Group Ltd. for The City of Calgary
Error! Reference source not found.
Source: CPCS analysis of ATRI GPS data (2016). Note: truck trip origins.
Figure 4-11: Trip generation by cluster
Figure 4-11 shows the generation of trips by freight cluster, according to the ATRI GPS data. The top
cluster by truck trip generation is the Southeast Calgary-Foothills cluster with 38% of truck trip
generation, followed by the area east of Calgary at 10%. Collectively, the top nine freight clusters are
associated with 78% of truck trip generation in the Calgary region, with other parts of the region – “non-
clusters” – generating 22% of trips.
4.3 Goods Movement Network
4.3.1 Roads and highways
4.3.1.1 Primary Goods Movement Network
Figure 4-12 shows the existing Calgary road and street network, as depicted in the CTP. Figure 4-13
shows the Primary Goods Movement Network, as depicted in the CTP. Figure 4-13 shows primary
connectors, which include most sections of the provincial highway system within Calgary, as well as
secondary connectors. Note that the Primary Goods Movement Network is also connected to the
external road and highway network. The Primary Goods Movement Network is intended to serve as a
“safe, efficient and connective” network that supports the airport, the intermodal rail terminals and
Calgary’s key industrial areas, while minimizing impacts on the surrounding communities.52 As defined,
the Primary Goods Movement Network identifies high-priority goods movement routes where the most
52 Section 3.4, Calgary Transportation Plan.

62 January 24, 2018 The Calgary Goods Movement Strategy Prepared by Watt Consulting Group Ltd. for The City of Calgary
concentrated activity is expected to occur. The Primary Goods Movement Network is not the same as a
truck route system, which is updated on an ongoing basis.
The availability of more transportation options for reducing auto use is expected to mitigate the impact
of congestion on commercial vehicle movements.

63 January 24, 2018 The Calgary Goods Movement Strategy Prepared by Watt Consulting Group Ltd. for The City of Calgary
Figure 4-12: Calgary Road Network

64 January 24, 2018 The Calgary Goods Movement Strategy Prepared by Watt Consulting Group Ltd. for The City of Calgary
Figure 4-13: Primary Goods Movement Network Source: Calgary Transportation Plan, Map 5

65 January 24, 2018 The Calgary Goods Movement Strategy Prepared by Watt Consulting Group Ltd. for The City of Calgary
The CTP also proposes other ways to improve the efficiency of the Network: 53
• Maintain the “integrity” of major goods movement routes by limiting direct driveway access onto
Network roads.
• Promote the location of goods-generating activities close to the Network, so as to minimize
intrusion through sensitive areas and provide direct and short-distance accesses to the Network.
• Use Intelligent Transportation Systems to improve traffic flow and travel time reliability.
4.3.1.2 Truck routes and restrictions
Figure 4-14 presents The City of Calgary’s 2017 Truck Route Map.54 The map depicts current and
future truck routes, current and future dangerous goods routes and restricted truck routes. It also shows
areas that have time-of-day restrictions as well as other areas in the southeast and northeast industrial
areas that are unrestricted. The map also depicts the locations of traffic circles, structural clearance
restrictions and bridge weight / load restrictions.55
4.3.1.3 Transit infrastructure
Figure 4-15 is a map of the existing and planned higher-order transit network. The plot superimposes
the network onto a map of selected land uses, including employee-intensive industrial areas.
4.3.1.4 Network usage
Figure 4-16 plots truck volumes, expressed as a percentage of total daily volumes, overlaid on a map of
industrial land uses. It can be seen that the road sections with the greatest percentage of truck traffic
largely coincide with the largest concentrations of industrial lands in southeast and northeast Calgary.
In addition, the plot also shows the importance of the Stoney Trail ring road as a connector among
these concentrations of activity. The importance of Calgary’s external connections also can be seen. A
caution is noted, in that these plots represent the role of trucks proportionally relative to other traffic and
not in absolute terms – meaning that some roads and highways might carry greater volumes of trucks,
but these represent lower (e.g., on Deerfoot Trail) or higher (e.g., in northwest Calgary) percentages.
Nonetheless, these plots visualize the importance of the road and highway network that serves
Calgary’s industrial areas.
Trucks are the dominant mode for moving goods in Calgary, as they are generally in cities across North
America and elsewhere. It is recognized that goods are also carried on other urban modes such as
bicycles, on foot, taxis, private carriers using passenger vehicles and, more recently, on-demand
53 Section 3.4, Calgary Transportation Plan.
54 Note that this is a low-resolution version of The City’s official Truck Route Map, which is the version that should
be used for navigation purposes. It can be downloaded at http://www.calgary.ca/Transportation/Roads/Pages/Truck-and-dangerous-goods/Truck-route-map.aspx.
55 Source: https://www.calgary.ca/Transportation/Roads/Documents/Truck-and-dangerous-goods/calgary-truck-
routes-map.pdf?noredirect=1.

66 January 24, 2018 The Calgary Goods Movement Strategy Prepared by Watt Consulting Group Ltd. for The City of Calgary
services such as Uber Freight and drones. However, there are no publicly available data on the use of
these modes for goods movement. Nonetheless, the Strategy will take these modes into account.
4.3.1.5 Truck flows
ATRI GPS data can also be used to show truck volumes by corridor. Since the GPS data represent a
sample rather than all trucks on the road, the GPS data provide an indicator of relative rather than
absolute volumes. They can show where trucks operate, and whether there are more or less trucks
operating on a given road, relative to another road of similar type.

67 January 24, 2018 The Calgary Goods Movement Strategy Prepared by Watt Consulting Group Ltd. for The City of Calgary
Figure 4-14: City of Calgary Truck Route Map - 2017

68 January 24, 2018 The Calgary Goods Movement Strategy Prepared by Watt Consulting Group Ltd. for The City of Calgary
Source: Calgary Transportation Plan. Map amended July 2013.
Figure 4-15: Primary Transit Network (CTP, as amended 2013)

69 January 24, 2018 The Calgary Goods Movement Strategy Prepared by Watt Consulting Group Ltd. for The City of Calgary
Figure 4-16: Industrial land use and truck activity

70 January 24, 2018 The Calgary Goods Movement Strategy Prepared by Watt Consulting Group Ltd. for The City of Calgary
The primary advantages of the GPS data are recentness and coverage. First, the data can be used to
compare truck activity on any roadway irrespective of functional classification,56 in a clear and
consistent manner. By comparison, whereas manual or automatic truck counts can be expensive to
conduct in a widespread manner and often may suffer from comparison problems such as different
methodologies, different collection times and vehicle classification issues including challenges
associated with properly classifying buses, school buses and RVs. Second, as described in the Section
4.2.5, the data are from four representative two-week periods from 2016.
ATRI’s truck GPS “pings” were linked to a detailed road network. The roads selected for analysis
included arterial roads and higher, as well as some collector roads in specific areas identified as freight
clusters. The absolute number of pings was translated into relative volumes using a methodology that
takes into account the likelihood of a truck pinging on each segment (a function of truck travel speed
and the length of the segment). Due to the the algorithm that is used to convert truck GPS “pings” into
truck volumes, there is some some variability in estimated volumes between adjacent segments.
As shown in Figure 4-17, the northeast quadrant of Stoney Trail experiences some of the highest truck
volumes. This finding is in line with expectations given that it connects the industrial areas in southeast
Calgary to Highway 2 leading to Edmonton, as well as connecting the CN and CP intermodal terminals
to distribution centres to the north of Calgary. The rest of Stoney Trail, as well as Deerfoot Trail, are
also busy truck corridors.
Highway 2 appears to be the busiest truck entry point to Calgary from the north and the south of the
city. From the east, Highway 22X, Glenmore Trail and Highway 1 appear to be well-used entry points,
and there is truck traffic from the CN intermodal in Conrich coming in along Township Road 250 /
McKnight Boulevard N.E. This last route is not included in Calgary’s Primary Goods Movement
Network.
It is also worth noting that the busiest truck entry point to downtown Calgary appears to be Memorial
Drive, which also is not included in Calgary’s Primary Goods Movement Network. (No corridors are
currently identified into downtown within Calgary’s Goods Movement Network.)
4.3.1.6 Truck trip origins and destinations
Figure 4-18 shows the destination of truck trips originating in the Calgary Region.57 Overall, most truck
traffic is headed north (36%), followed by south (27%), west (22%) and east (15%). The map displays,
for each direction, the breakdown of destinations within the direction. (The distribution of trips within
56 One limitation with these data is that on some larger roads (with a divided median) the sample truck volumes
are summed for each direction, rather than for the total for both directions. As most of the busiest roads in Calgary used by trucks are divided, this limitation does not alter the usefulness of these data as an indicator of truck activity. However, it may slightly inflate the truck activity on smaller undivided roads relative to larger divided roads.
57 It should be noted that the GPS data do not allow for differentiation between loaded and empty trips; therefore
the map is more an indicator of truck activity between regions rather than specifically the destinations of loaded trucks heading outbound from Calgary (in other words, the data also include the backhauls of trucks delivering to Calgary).
71 January 24, 2018 The Calgary Goods Movement Strategy Prepared by Watt Consulting Group Ltd. for The City of Calgary
each cardinal direction sums to 100%). The Edmonton area is the single most dominant destination, at
19% of all truck trips originating in the Calgary Region.58 Other important destinations are southern
Alberta (18% of all truck trips), British Columbia (17%) and central Alberta (15%).
58 Calculated as the product of 36% (the percent of trips that are northbound) and 53% (the Edmonton area’s
share of northbound trips).
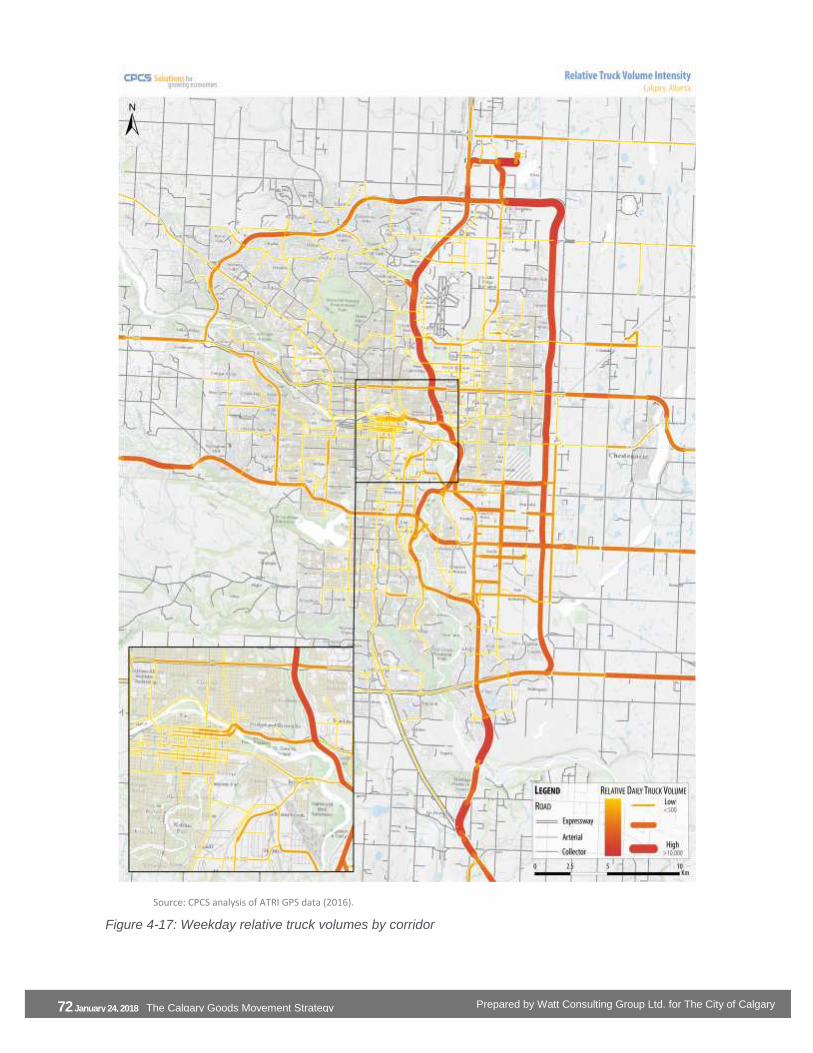
72 January 24, 2018 The Calgary Goods Movement Strategy Prepared by Watt Consulting Group Ltd. for The City of Calgary
Source: CPCS analysis of ATRI GPS data (2016).
Figure 4-17: Weekday relative truck volumes by corridor

73 January 24, 2018 The Calgary Goods Movement Strategy Prepared by Watt Consulting Group Ltd. for The City of Calgary
Source: CPCS analysis of ATRI GPS data (2016).
Figure 4-18: Truck trip ends from Calgary Region

74 January 24, 2018 The Calgary Goods Movement Strategy Prepared by Watt Consulting Group Ltd. for The City of Calgary
4.3.1.7 Trends in truck volumes
4.3.1.7.1 Historical truck trip growth
From 1999 to 2012, The City of Calgary collected truck counts crossing designated screenlines
throughout the city.59 Newer data are not available; nonetheless, these counts are indicative of
historical trends. Although the absolute value of these counts is not equal to the number of truck trips,
year-over-year change can be used to illustrate truck trip growth. To this end, Figure 4-19 summarizes
the change in medium and heavy truck counts in Calgary between 2001 and 2012, as compared to
population growth.60,61 Though there was a spike in trucks counted in 2006, which may be partially
explained by different counting methods, overall truck counts have grown approximately in line with
population and employment growth, between 2001 and 2012.
Figure 4-20 shows the average number of medium and heavy trucks crossing all screenlines taken
together throughout the city, compared to those trucks that cross the city boundary screenline. Between
2001 and 2012, the number of trucks crossing the city boundary screenline is comparable to the
citywide average truck-count growth. Again, although newer counts are not available, the trends are
informative. This growth in truck counts is higher than the growth of Calgary’s population, but lower
than the employment growth in the city.
59 Screenlines are imaginary lines that cross roads, highways and C-Train lines at strategic locations. Traffic
counts are taken at these locations in each direction – for example, summarizing the traffic, by type of vehicle, that crosses each Bow River bridge in each direction, or across the city boundary in each direction. These counts are used to monitor changes in volume or mode. The truck growth rates shown in the figure reflect the aggregate of all screenlines, as explained further in the next footnote.
60 Not every screenline is counted every year. However, counts were conducted for all screenlines in 2001, 2006
and 2012, and so the figure shows only the counts for these years. Note also that the locations where counts were conducted on some roads might have varied among the three years. Note also that a similar counting method was used (i.e. a combination of automatic and manual counts), which ensures consistency among the counts from year to year. However, it was also noted that using automatic counts often identifies larger passenger vehicles as medium trucks, and it is possible that the calculated growth rate in trucks could be influenced by passenger vehicle counts.
61 There are three vehicle types, based on the Calgary truck bylaw, and ease of count classification (field data
collection):
Light: 4 tires, suitable for private use (passenger autos, pickup trucks, vans, SUVs);
Medium: 6 tires, restricted to truck routes (Single units); and
Heavy: 8 or more tires, restricted to truck routes (articulated vehicles, including tractor units without
trailer).
The City of Calgary, Transportation Department. 2006. 2001 Regional Transportation Model: Commercial Vehicle Model Description Report

75 January 24, 2018 The Calgary Goods Movement Strategy Prepared by Watt Consulting Group Ltd. for The City of Calgary
Source: CPCS analysis of City of Calgary data.
Figure 4-19: Historical truck counts, population and employment change in the city of Calgary and surrounding region
Source: CPCS analysis of City of Calgary data.
Figure 4-20: Truck trip growth in City and surrounding region
Figure 4-21 summarizes the growth in truck counts by type of truck. It also shows the growth of trucks
observed at the Calgary boundary as compared to the average growth across all screenlines
throughout the city. From 2001 to 2012, medium and heavy trucks saw a similar overall average growth
rate. However, the heavy trucks crossing the screenline increased at a higher rate than the citywide
average.
80
100
120
140
160
180
200
2001 2003 2005 2007 2009 2011 2013 2015
Tru
ck t
rip
gro
wth
(2001 =
100)
Medium + heavy total
Total population
Total employment
80
100
120
140
160
180
200
2001 2003 2005 2007 2009 2011 2013 2015
Tru
ck t
rip
gro
wth
(2001 =
100)
Medium + heavy total
Medium + heavy total Calgaryboundary only
Calgary population
Surrounding region population
Calgary employment
Surrounding region employment

76 January 24, 2018 The Calgary Goods Movement Strategy Prepared by Watt Consulting Group Ltd. for The City of Calgary
Source: CPCS analysis of City of Calgary data.
Figure 4-21: Truck trip growth by type of truck
4.3.1.7.2 Future truck trip growth
Figure 4-22 shows truck trip forecasts compared to population and employment growth for Calgary,
including the surrounding region. Between 2015 and 2039, truck trips are expected to grow approximately
in line with population and employment growth in Calgary, similar to what was observed in the historical
truck counts.
Source: CPCS analysis of City of Calgary forecasts.
Figure 4-22: Truck trip, population and employment forecasts (2015-2039)
80
100
120
140
160
180
200
2001 2003 2005 2007 2009 2011 2013 2015
Tru
ck t
rip
gro
wth
(2001 =
100) Medium total
Medium Calgary boundary only
Heavy total
Heavy Calgary boundary total
80
90
100
110
120
130
140
150
160
170
180
2015 2019 2023 2027 2031 2035 2039
Fo
rec
as
ted
gro
wth
(2
01
5 =
10
0)
Population
Employment
Truck trips

77 January 24, 2018 The Calgary Goods Movement Strategy Prepared by Watt Consulting Group Ltd. for The City of Calgary
Figure 4-23 shows The City of Calgary’s forecasts for truck trips, population and employment, for
Calgary and the surrounding region separately. Population and employment in the surrounding region
of Calgary is expected to increase at a quicker rate than in Calgary itself. By 2039, the surrounding
region’s population and employment are expected to be 19% and 13% of the total metropolitan area
population and employment, up from 17% and 10%, respectively, in 2015.
Truck trips originating outside of Calgary are expected to increase at a slower rate than those originating in Calgary itself. However, they are still expected to grow by over 40% between 2015 and 2039.62 Truck trips between Calgary and the surrounding region are expected to grow fastest overall. This is consistent with the expected population and employment growth in the surrounding region.
4.3.1.8 Volumes of Goods Transported by Trucks
The Transport Canada Trucking Commodity Origin and Destination (TCOD) survey also provides
insights into the volume and type of goods moving in, out, and around Calgary.
In 2015, there was 7.2 million tonnes of goods moving by truck around the Calgary CMA. The survey
reports a decline from 12.9 million tonnes in 2011. However, as the TCOD survey only captures a
sample of truck carriers in any given year, so some variability from year-to-year is expected particularly
when studying an urban area.
In 2015, 17 million tonnes of goods were shipped to Calgary. Most of these goods arrived from Alberta,
followed by from BC, the US (Transborder) and Ontario (Figure 4-24). In 2015, the volume of goods
originating in Calgary (8 million tonnes) was less than half the volume destined to Calgary. Likewise,
most of these goods were destined to other areas in Alberta.
Source: Consultant analysis of City of Calgary forecasts.
Figure 4-23: Truck trip, population and employment forecasts, Calgary and surrounding region (2015-2039)
62 This calibration was based on information from 2000, which may not be representative of the current
transportation and logistics activity outside of Calgary.
40
60
80
100
120
140
160
180
200
220
2015 2020 2025 2030 2035
Fo
recaste
d g
row
th (
2015
=
100)
Calgary population
Surrounding regionpopulation
Calgary employment
Surrounding regionemployment
Calgary-originated truck trips
Surrounding region-originatedtruck trips
Inter-Calgary and surroundingregion trips

78 January 24, 2018 The Calgary Goods Movement Strategy Prepared by Watt Consulting Group Ltd. for The City of Calgary
Figure 4-25 shows the tonnages of the top 10 commodities moving to and from Calgary by weight. The
largest proportion of goods moving to and from Calgary is general freight. In 2015, there was a spike in
shipments of mineral and oil products to Calgary, suggesting that potentially a pipeline was shut down
or had its flow reduced. This increase could also explain the spike in shipments from the rest of Alberta
to Calgary in 2015.
4.3.1.9 Travel times and delay
The ATRI data can also be used to map travel speed and delay. Each GPS ping is associated with a
spot speed, the values of which can be aggregated and averaged over the study time periods (including
by time of day).
Figure 4-26 shows the average weekday truck travel speed by corridor (average over the entire day).
Notably, truck travel speeds are highest on Stoney Trail, Deerfoot Trail and the Trans-Canada
Highway. Speeds are slowest in downtown Calgary as well as on specific short segments around the
region (such as near the Conrich terminal).
Source: CPCS analysis Transport Canada TCOD survey.
Source: CPCS analysis Transport Canada TCOD survey.
Figure 4-24: Volume of goods (in millions of tonnes) by truck travelling to (left) and from (right) Calgary, by origin and destination, respectively
0 2 4 6 8 10 12
B.C., Yukon,N.W.T.
Alberta
Saskatchewan
Manitoba, Nunavut
Ontario
Quebec
Atlantic Provinces
Transborder
2011
2012
2013
2014
2015
0 2 4 6 8 10 12
B.C., Yukon,N.W.T.
Alberta
Saskatchewan
Manitoba, Nunavut
Ontario
Quebec
Atlantic Provinces
Transborder
2011
2012
2013
2014
2015

79 January 24, 2018 The Calgary Goods Movement Strategy Prepared by Watt Consulting Group Ltd. for The City of Calgary
Note: n.e.c. means not elsewhere classified. Source: CPCS analysis Transport Canada TCOD survey.
Note: n.e.c. means not elsewhere classified. Source: CPCS analysis Transport Canada TCOD survey.
Figure 4-25: Volume of goods (in millions of tonnes) by truck travelling to (left) and from (right) Calgary, by commodity type. Top 10 by weight shown.
0 2 4 6
Miscellaneous transportedproducts
Metallic ores, coal, crudeand refined petroleum
Prepared foodstuffs n.e.c.and fats and oils
Gravel and crushed stone
Non-metallic mineralproducts
Agricultural productsexcept live animals,
cereal grains, and forageproducts
Wood products
Non-metallic mineralsn.e.c.
Meat, fish, seafood, andpreparations
Articles of base metal
2011
2012
2013
2014
2015
0 2 4 6
Miscellaneoustransported products
Prepared foodstuffs n.e.c.and fats and oils
Metallic ores, coal, crudeand refined petroleum
Articles of base metal
Wood products
Waste and scrap
Gravel and crushed stone
Meat, fish, seafood, andpreparations
Fertilizers and fertilizermaterials
Non-metallic mineralproducts
2011
2012
2013
2014
2015

80 January 24, 2018 The Calgary Goods Movement Strategy Prepared by Watt Consulting Group Ltd. for The City of Calgary
Source: CPCS analysis of ATRI GPS data (2016).
Figure 4-26: Average weekday truck travel speed by corridor

81 January 24, 2018 The Calgary Goods Movement Strategy Prepared by Watt Consulting Group Ltd. for The City of Calgary
Figure 4-27 examines the speed performance of each corridor in the peak periods, defined as between
6-9 a.m. and 4-7 p.m. The map shows the travel time index (TTI), which is defined as the ratio of the
free-flow truck speed to actual peak truck speed. Specifically, the free-flow truck speed is defined as
the average overnight speed, and the peak speed is defined as the average speed in the worst hour
from among the six peak hours as defined.63
The Peak TTI is a measure of the gap between peak performance and free-flow performance, with a
higher TTI value indicating worse performance in the peak. The metric is not weighted for the number
of trucks on the road. In addition, since the TTI is calculated separately for each road segment, a 25
kph peak speed (for example) is penalized much more on a road with a free-flow speed of 60 kph than
on a road with a free-flow speed of 40 kph.
In general, Stoney Trail has a lower TTI; i.e., nearly free flow speeds can be maintained in the peak. By
contrast, many sections of Deerfoot Trail have a TTI exceeding 1.5, including from 64 Avenue N.E. to
Memorial Drive and from Glenmore Trail S.E. to 130 Avenue S.E. Various sections of Glenmore Trail S
also have TTIs exceeding 1.5.64
Truck delay is defined as the time difference between free-flow and actual travel times, for a specific
segment, multiplied by the number of trucks affected. Since the volumes are defined on a relative rather
than absolute basis, delay is necessarily evaluated on the same basis (high/low rather than absolute
values).
Figure 4-28 shows the truck delay across all hours of the day, which distributed similarly to the truck
delay in the peak period.
Some of the most significant delay bottlenecks are:
• On Deerfoot Trail north of the Trans-Canada Highway, speeds drop below 30 kph in the
northbound direction between 4:00 and 6:00 P.M., compared to a free-flow speed of almost 60
kph.
• Glenmore Trail is very slow in the a.m. peak westbound approaching Ogden Road S.E., likely due
to road construction in this area.
• Deerfoot Trail is subject to heavy truck delay northbound between 130 Avenue S.E. and Anderson
Road S.E. (particularly between 7:00 and 9:00 A.M.) and southbound from 11 Street S.E. to
Anderson Road S.E. (between 3:00 and 6:00 P.M.).
• Many of the streets in downtown Calgary are subject to significant truck delay, although speeds
are generally fairly low to begin with.
63 For certain segments where there are deemed to be too few observations to reliably determine an average
speed for each peak hour, the average of all peak hours is used instead, so as to mitigate the influence of anomalies.
64 1.5 is the factor generally used by the US Federal Highway Administration for reliability-related metrics as
indicative of a roadway not being reliable. “Federal Register: National Performance Management Measures.” (2017)

82 January 24, 2018 The Calgary Goods Movement Strategy Prepared by Watt Consulting Group Ltd. for The City of Calgary
The locations of delay on Deerfoot Trail and Glenmore Trail are in line with congestion points most
frequently identified by stakeholders.
Source: CPCS analysis of ATRI GPS data (2016).
Figure 4-27: Peak truck travel time index by corridor
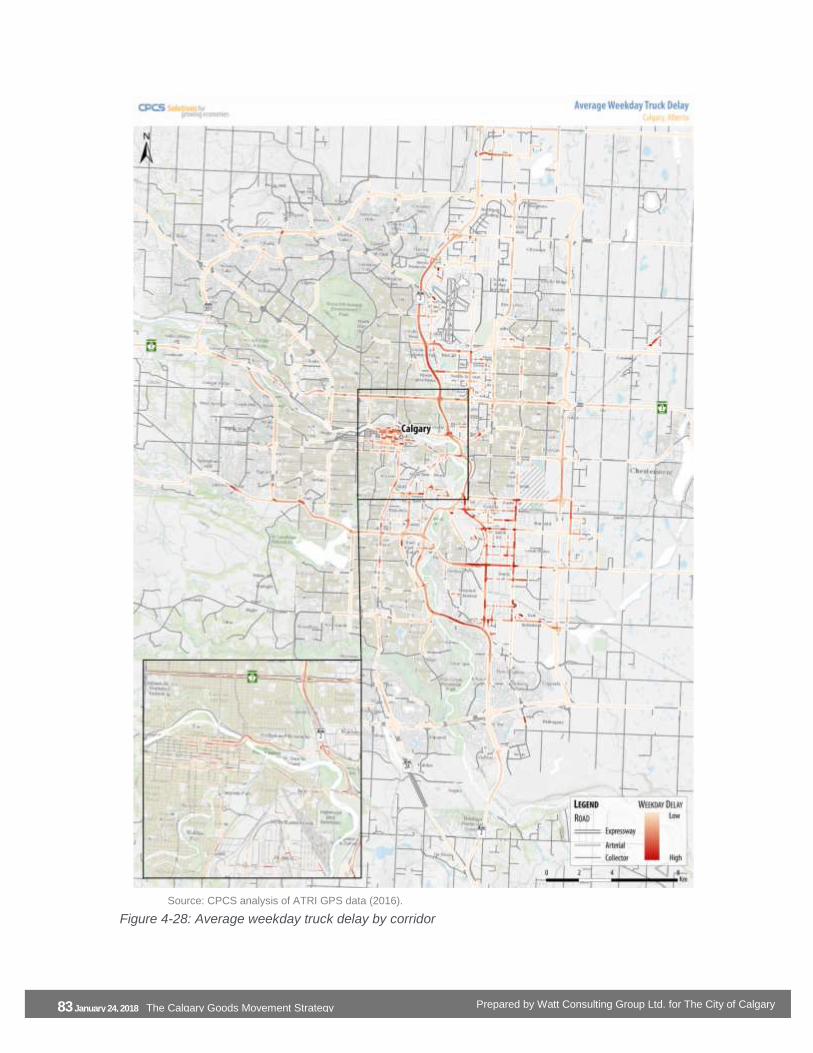
83 January 24, 2018 The Calgary Goods Movement Strategy Prepared by Watt Consulting Group Ltd. for The City of Calgary
Source: CPCS analysis of ATRI GPS data (2016).
Figure 4-28: Average weekday truck delay by corridor

84 January 24, 2018 The Calgary Goods Movement Strategy Prepared by Watt Consulting Group Ltd. for The City of Calgary
Source: CPCS analysis of ATRI GPS data (2016).
Figure 4-29: Average truck travel speed on select segments of Deerfoot Trail
Figure 4-29 examines the travel speeds on select segments of Deerfoot Trail, showing how truck
speeds are distributed throughout the day. Northbound Deerfoot north of Highway 1 experiences lower
travel speeds during the evening peak period only - otherwise, travel speeds of nearly 100 kph are
maintained throughout the day. By contrast, northbound Deerfoot between Anderson Road and Barlow
Trail experiences lower truck speeds throughout the day.
4.3.2 Rail
Rail freight play an important role in supporting the goods movement industry in Calgary, as well as
bringing consumer products from North America and around the world to consumers in Calgary. This
section describes the rail infrastructure in Calgary and how it connects to the national and continental
rail network.
4.3.2.1 Rail corridors in Calgary
Calgary is served by two Class 1 railways, Canadian National Railway (CN) and Canadian Pacific
Railway (CP), as shown in Figure 4-30.
CN’s east-west mainline runs through Edmonton between the Canadian West Coast (Prince Rupert
and Vancouver) and Eastern Canada, the United States Midwest and the United States Gulf Coast. As
a result, CN serves Calgary from a line that
connects to the mainline through Edmonton. It also has a short branch line northeast of Calgary serving
various customers in the area. This short branch line no longer connects with Saskatoon. CN’s main
yard in Calgary, Sarcee Yard, is located off 50 Avenue S.E., although its intermodal facility is located
outside the Calgary city limits in Conrich.
0
20
40
60
80
100
120
0 1 2 3 4 5 6 7 8 9 10 11 12 13 14 15 16 17 18 19 20 21 22 23
Avera
ge T
ravel S
peed (
KP
H)
Hour of Day
Northbound Deerfoot Trail between Barlow Trail and Anderson Rd in Southeast Calgary
Northbound Deerfoot Trail between Trans-Canada Hwy and McKnight Blvd in Northeast Calgary

85 January 24, 2018 The Calgary Goods Movement Strategy Prepared by Watt Consulting Group Ltd. for The City of Calgary
CP serves Calgary primarily via its east-west mainline between Vancouver and Eastern Canada, the
United States Midwest and the United States East Coast. It also has a line running north to Edmonton,
which connects with CP’s North Line from Winnipeg at Wetaskiwin.
This line can therefore be used as an alternative to CP’s mainline for eastbound traffic from Calgary
and vice-versa. 65
` Source: CPCS
Figure 4-30: Calgary’s multimodal transportation system

86 January 24, 2018 The Calgary Goods Movement Strategy Prepared by Watt Consulting Group Ltd. for The City of Calgary
CP also has a line running south to Lethbridge and the United States border, where it interchanges with
American Class I carriers Burlington Northern Santa Fe (BNSF) and Union Pacific (UP). CP
interchanges with these American Class I carriers at Coutts, Alberta and at Kingsgate, British
Columbia, respectively. CP has several yards in Calgary including Alyth (southeast of downtown
Calgary), Ogden (in the southeast) and Keith Yard (in the northwest).
All corridors are primarily single track with sidings. As a rule of thumb, these lines can have a capacity
of between 16 and 30 trains per day, depending on the sophistication of their signalling system.65
Railways undertake capacity capital expenditures to expand network capacity by themselves, such as
adding passing track or enhancing the sophistication of its signalling system. In 2016, CP invested
$150 million in capacity improvements network wide66 and CN invested $300 million “on initiatives to
support growth and drive productivity” network wide.67
CN and CP serve intermodal terminals (section 4.3.2.2), transload facilities (section 4.3.2.3) and
automotive compounds (section 4.3.2.4) in and around Calgary. Intermodal terminals are key freight
hubs where containers carrying goods can seamlessly be loaded to and from trucks and trains, without
having to move the goods from one container to another. At transload facilities, bulk/break-bulk/project
cargo can be loaded between trucks and rail cars. Automotive compounds allow finished vehicles to be
unloaded from rail cars and delivered to dealerships.
The key difference between intermodal terminals and transload facilities and automotive compounds is
in how goods are handled. Intermodal terminals do not handle goods directly. The container stays
sealed as it moves from truck to train or vice versa. At transload facilities and automotive compounds,
goods are handled directly as they are moved between rail cars and trucks.
Not having to handle the goods directly is advantageous for a few reasons. One reason is that by not
handling the goods, the potential for damage or leakage is minimized. Another reason is that the
process of moving the goods from one mode of transportation to another is faster, thereby minimizing
the overall journey time from shipper to receiver.
Intermodal transportation is not suitable for all types of goods. Bulk commodities are often less time-
sensitive and less sensitive to damage while being transferred, which eliminates the need to pay a
premium for intermodal services. Some shippers may also wish to transload goods to take advantage
of higher capacities offered by truck trailers. For example, typically the contents of five 40-foot
intermodal containers can fit into four 53-foot truck trailers. As a result, by transloading, the number of
truck trips required to deliver goods to their final destination can be reduced from five to four.
65 The number of trains per day can exceed these levels if traffic is entirely composed of a single train type, rather
than a mix of bulk, manifest and intermodal trains. Bulk trains, hauling commodities such as potash and wheat, are typically slower and less tightly scheduled, whereas manifest and intermodal trains, hauling general freight and containers, respectively, are typically quicker and more tightly scheduled. Cambridge Systematics. 2007. National Rail Freight Infrastructure Capacity and Investment Study.
66 CP. Annual Report 2016.
67 CN. Annual Report 2016.

87 January 24, 2018 The Calgary Goods Movement Strategy Prepared by Watt Consulting Group Ltd. for The City of Calgary
Businesses that buy or sell finished or semi-finished goods often prefer to be located close to
intermodal terminals to minimize their truck transportation costs and shipment transit times. Even in the
case where products are imported from overseas, the last mile truck transportation costs can be a
significant portion of the total freight bill. This is because per-kilometre, truck transportation costs much
more than ocean or rail transportation. Furthermore, due to urban congestion, long truck trips between
shipper facilities and intermodal terminals can add a significant amount of time and transit time
variability to the total journey time.68 Being located close to intermodal terminals helps to minimize both
of these concerns.
4.3.2.2 Intermodal terminals
Both CN and CP have intermodal terminals located in Calgary that allow containers to be transferred
between truck and rail (Table 4-2). In 2013, CN opened the Calgary Logistics Park in Conrich, replacing
its Calgary Intermodal Terminal.69 It has 170 acres of fully serviced and zoned warehouse distribution
sites (three million square feet of new warehouse space), with the possibility of future expansion of 200
acres. CP’s intermodal terminal in Calgary is located in the city’s southeast, with access off of 52 Street
S.E.
Table 4-2: Calgary intermodal facilities
Location
CN 250050 Lantz Way
Conrich, Alberta T1Z 0A8
Northwest Township Road 250/Range
Road 283
CP 33 Dufferin Place SE
Calgary, Alberta T2C 4M2
4.3.2.3 Other transload facilities
CN and CP serve six other transload facilities in Calgary, as listed in Table 4-3. These facilities allow
break-bulk (goods that must be loaded individually, such as steel coils, or are in individual crates or
bales that must be loaded individually) and dry and liquid bulk cargo (e.g., grains and petroleum
products) to be transloaded between truck and rail. These facilities are concentrated around CN and
CP’s yards in Calgary’s southeast.
4.3.2.4 Automotive Compounds
Both CN and CP have automotive compounds to handle finished vehicles. CP’s terminal is located at
its Ogden Yard off Ogden Dale Road SE. CN’s facility is located adjacent to its Sarcee Yard, along 50
Avenue S.E.
68 See also the discussion on total logistics costs in Section 6.3.3.
69 CN. 2013. CN opens new intermodal terminal at Calgary Logistics Park. Press Release.

88 January 24, 2018 The Calgary Goods Movement Strategy Prepared by Watt Consulting Group Ltd. for The City of Calgary
4.3.2.5 Freight rail traffic
Because rail infrastructure is owned by private companies (CN and CP), there is less of a role for The
City of Calgary with respect to investments in new capacity to enable goods movement. However, rail
traffic impacts adjoining areas in terms of noise, vibration, safety and delaying road traffic at grade
crossings, among other impacts.70 Minimizing these impacts to the broader public is an important
consideration in terms of allowing for continued movement of goods by rail. Rail infrastructure can also
have a direct impact on goods movement by road (e.g., delaying trucks at grade crossings or limiting
access to sites). Finally, most rail traffic necessitates truck movements for first and last mile access to
shippers. As such, it is important that trucks have good access to intermodal terminals and that they are
able to move quickly and efficiently between those terminals and customer facilities (e.g., distribution
centres and manufacturing sites).
70 In 2015, 45 out of 46 fatalities on federally regulated railways occurred due to at-grade crossings (15) or
trespassers (30). Source: Transportation Safety Board of Canada. Statistical Summary - Railway Occurrences 2015 - Data tables.
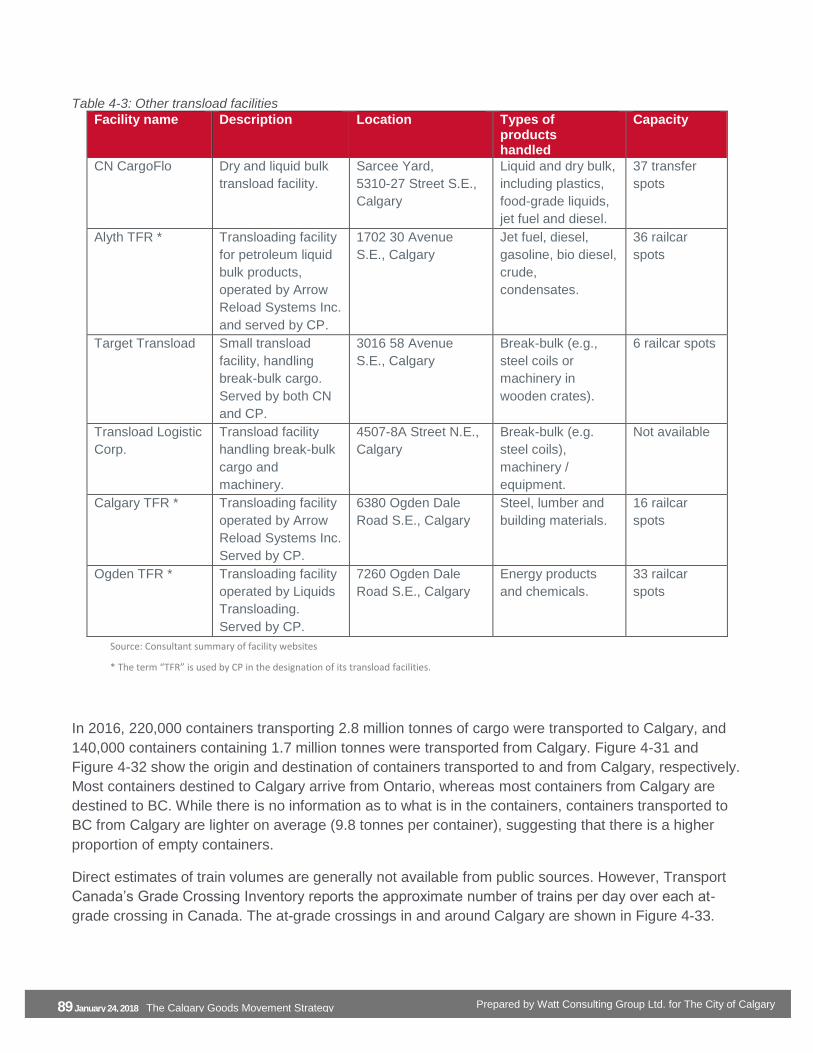
89 January 24, 2018 The Calgary Goods Movement Strategy Prepared by Watt Consulting Group Ltd. for The City of Calgary
Table 4-3: Other transload facilities
Facility name Description Location Types of products handled
Capacity
CN CargoFlo Dry and liquid bulk
transload facility.
Sarcee Yard,
5310-27 Street S.E.,
Calgary
Liquid and dry bulk,
including plastics,
food-grade liquids,
jet fuel and diesel.
37 transfer
spots
Alyth TFR * Transloading facility
for petroleum liquid
bulk products,
operated by Arrow
Reload Systems Inc.
and served by CP.
1702 30 Avenue
S.E., Calgary
Jet fuel, diesel,
gasoline, bio diesel,
crude,
condensates.
36 railcar
spots
Target Transload Small transload
facility, handling
break-bulk cargo.
Served by both CN
and CP.
3016 58 Avenue
S.E., Calgary
Break-bulk (e.g.,
steel coils or
machinery in
wooden crates).
6 railcar spots
Transload Logistic
Corp.
Transload facility
handling break-bulk
cargo and
machinery.
4507-8A Street N.E.,
Calgary
Break-bulk (e.g.
steel coils),
machinery /
equipment.
Not available
Calgary TFR * Transloading facility
operated by Arrow
Reload Systems Inc.
Served by CP.
6380 Ogden Dale
Road S.E., Calgary
Steel, lumber and
building materials.
16 railcar
spots
Ogden TFR * Transloading facility
operated by Liquids
Transloading.
Served by CP.
7260 Ogden Dale
Road S.E., Calgary
Energy products
and chemicals.
33 railcar
spots
Source: Consultant summary of facility websites
* The term “TFR” is used by CP in the designation of its transload facilities.
In 2016, 220,000 containers transporting 2.8 million tonnes of cargo were transported to Calgary, and
140,000 containers containing 1.7 million tonnes were transported from Calgary. Figure 4-31 and
Figure 4-32 show the origin and destination of containers transported to and from Calgary, respectively.
Most containers destined to Calgary arrive from Ontario, whereas most containers from Calgary are
destined to BC. While there is no information as to what is in the containers, containers transported to
BC from Calgary are lighter on average (9.8 tonnes per container), suggesting that there is a higher
proportion of empty containers.
Direct estimates of train volumes are generally not available from public sources. However, Transport
Canada’s Grade Crossing Inventory reports the approximate number of trains per day over each at-
grade crossing in Canada. The at-grade crossings in and around Calgary are shown in Figure 4-33.

90 January 24, 2018 The Calgary Goods Movement Strategy Prepared by Watt Consulting Group Ltd. for The City of Calgary
The Inventory reports were used to estimate the approximate number of freight trains that operate on
each corridor on each corridor. These are also shown in Figure 4-33.
Most at-grade crossings are located in southeast Calgary, where there are numerous spurs in the area.
CP’s mainline in southeast Calgary, running between Calgary and eastern Canada and the United
States Midwest, carries the largest number of freight trains in Calgary, with more than 25 freight trains
per day. The line between Calgary and Vancouver has the second highest levels. These volumes are
lower than, but are approaching, the potential capacity of a single-track line. CN’s rail line in southeast
Calgary has lower traffic levels, between five and 10 trains per day.71
Source: CPCS analysis of Transport Canada data.
Figure 4-31 Origin of containers to Calgary transported by rail
Source: CPCS analysis of Transport Canada data.
Figure 4-32 Destination of containers from Calgary transported by rail
71 Though the line between Calgary and Edmonton reports between five and 10 trains per day, the traffic levels in
Calgary may be lower now due to the opening of CN’s intermodal terminal in Rocky View County.
0.0
4.0
8.0
12.0
16.0
20.0
24.0
0
20,000
40,000
60,000
80,000
100,000
120,000
British Columbia Ontario Quebec U.S. Midwest U.S. South
Tonnes p
er
conta
iner
Num
ber
of
conta
iners
Containers (left)
Average weight per container(right)
0.0
4.0
8.0
12.0
16.0
20.0
24.0
0
20,000
40,000
60,000
80,000
100,000
120,000
British Columbia Ontario Quebec U.S. Midwest U.S. South
Tonnes p
er
conta
iner
Num
ber
of
conta
iners
Containers (left)
Average weight per container(right)

91 January 24, 2018 The Calgary Goods Movement Strategy Prepared by Watt Consulting Group Ltd. for The City of Calgary
Note: Where a single corridor had multiple values of freight rail traffic, the largest value was selected for display. Notably, there was some discrepancy between at-grade crossings along CN’s line between Calgary and its intermodal terminal in Rocky View County. Source: CPCS analysis of Transport Canada Grade Crossing Inventory
Figure 4-33 Railroad at-grade crossings and train volumes in Calgary
92 January 24, 2018 The Calgary Goods Movement Strategy Prepared by Watt Consulting Group Ltd. for The City of Calgary
4.3.3 Air
The Calgary International Airport (YYC) is Canada’s fourth busiest airport. It is served by major air
cargo and courier services including CargoJet, DHL, FedEx, Purolator and UPS. A $2 billion expansion
to add a new 14,000 foot runway and additional industrial warehousing space has increased the YYC’s
ability to handle cargo growth from both belly and freighter service.72 The YYC Global Logistics Park,
which occupies over 330 acres of land, is accessible by shippers and receivers in the area from
Deerfoot Trail and from Airport Trail N.E. YYC operates 24/7 and cargo can be transported from YYC to
anywhere in the world within 48 hours.73 A list of cargo facilities at YYC is provided in Appendix 8.2
Shippers in Calgary who buy and sell high-value, time-sensitive products across North America and
around the world will often take advantage of air cargo services to meet their needs. For example,
online retailers may use air cargo for inbound transportation to fulfillment centres for high-value, time-
sensitive consumer products. Cold storage distribution centres that replenish local grocery stores may
use air cargo for fresh food products with short shelf lives. Cold storage distribution centres that source
local fresh food products may also use air cargo to reach domestic and international customers.
Because YYC is a 24/7 airport through which cargo can be transported to virtually anywhere in the
world, its presence provides a significant advantage, both to businesses that make extensive use of air
cargo as well as those who may need to ship by air in emergency situations. The value of an air cargo
hub is generated both through the number of destinations it can reach as well as the frequency of
departures and arrivals. YYC has non-stop flights to 68 cities. Many more cities can be reached with a
single connecting flight.
Approximately 135,000 tonnes of air cargo are handled at YYC each year.74 Although this may sound
small, given that most of these commodities are high-value, air cargo’s share of total freight to and from
Calgary by value is much higher than its share by volume.
According to the Canadian International Merchandise Trade Database, approximately $2.1 billion worth
of products was exported internationally via the Calgary International Airport by air in 2016; that is, the
airport was recorded as the port of export. Approximately $1.2 billion of the exports by value originated
in Alberta.
The top ten export categories are shown in Figure 4-34. The largest export by value is diamonds,
representing $0.8 billion in 2016. There are also significant exports related to aircraft and aircraft
components. For example, other significant exports include turbo-propellers, aircrafts and services
(e.g., “repairs”), which may relate to WestJet and Air Canada’s hubs in Calgary. There are also several
animal and food products within the top ten list. To further illustrate the importance of air cargo to
72 Belly service refers to cargo that is carried in the belly of passenger aircraft that fly on regularly scheduled
routes. Freighter service refers to cargo that is carried in cargo-only aircraft, usually on regularly scheduled routes.
73 Calgary Airport Authority, YYC Global Logistics Park.
74 Calgary Airport Authority, Cargo Statistics.

93 January 24, 2018 The Calgary Goods Movement Strategy Prepared by Watt Consulting Group Ltd. for The City of Calgary
Calgary consumers, it is interesting to note that $1.7 million in hockey sticks was imported through the
Calgary International Airport in 2016, or approximately 25,000 sticks.75
Source: CPCS Analysis of Canada International Merchandise Trade Database.
Figure 4-34: Top Ten exports via the Calgary International Airport, by value
In terms of imports, in 2016 the Calgary International Airport was the point of clearance for $2.9 billion
worth of products delivered by air. The top ten import categories are shown in Figure 4-35. The largest
two import categories are Aircrafts and Nuclear Reactors, boilers, machinery and mechanical
appliances.76 At least $0.7 billion of these imports relate to aircrafts. As noted above, these likely relate
to airline operations in Calgary. However, there are also other significant imports of mechanical and
electrical machinery (notably cell phones and other networking equipment); optical, medical,
photographic, scientific and technical instruments; pearls, precious stones or metals, coins and jewelry
(notably jewelry); pharmaceutical products (notably medication for animals); articles of iron or steel;
miscellaneous chemical preparations (notably for medical diagnoses); and woven clothing and articles
of apparel. In 2016, each of these product categories had at least $20 million in value cleared in
Calgary.
Otherwise, precise air cargo data, in terms of commodities and origin-destination flows, are generally
lacking in Canada. However, as the majority of air cargo moves in the belly of passenger aircraft, a
good indication of the frequency and capacity of air cargo shipments is the number of annual
passenger flights. The numbers of flights are shown in the next several figures, expressed as itinerant
aircraft movements.77 Figure 4-36 shows the annual itinerant aircraft movements among large
75 Canada International Merchandise Trade Database.
76 The second category includes parts of turbo-jets and turbo-propellers.
77 At airports whose flights are controlled by control towers, such as Calgary’s, an itinerant movement is one in
which the aircraft proceeds to or arrives at another location, or where aircraft leave the airport but return without
0 250 500 750 1,000
Pearls, precious stones or metals, coins and jewelry
Nuclear reactors, boilers, machinary, and mechanical…
Electrical or electornic machinery and equipment
Optical, medical, photographic, scientific and technical…
Aircracts and spacecrafts
Special classification provisions - non-commercial
Meat and edible meat offal
Oil seeds, oleaginous fruits, industrial or medicinal plants,…
Pharmaceutical products
Products of animal origin not else classified
Value of exports ($ millions)

94 January 24, 2018 The Calgary Goods Movement Strategy Prepared by Watt Consulting Group Ltd. for The City of Calgary
Canadian airports in 2015.With nearly 250,000 itinerant aircraft movements in 2015, it can be seen that
YYC is the third-busiest airport in Canada.
Source: CPCS Analysis of Canada International Merchandise Trade Database.
Figure 4-35: Top Ten imports via the Calgary International Airport, by value
Source: CPCS Analysis of CANSIM Table 401-0028
Figure 4-36: Total annual itinerant aircraft movements at Canadian airports, 2015
landing at another airport. Source: www23.statcan.gc.ca/imdb-bmdi/document/2715_D1_T9_V1-eng.htm. Note that general aviation and military flights are not included in tallies of itinerant movements.
0 250 500 750 1,000
Aircrafts and spacecrafts
Nuclear reactors, boilers, machinery, and…
Electrical or electronic machinery and equipment
Optical, medical, photographic, scientific and…
Pearls, precious stones or metals, coins and jewelry
Special classification provisions - commercial
Pharmaceutical products
Articles of iron or steel
Miscellaneous chemical preparations
Woven clothing and rticles of apparel
Value of imports ($ millions)
0
50
100
150
200
250
300
350
400
450
500
Toronto Vancouver Calgary Montreal Edmonton Ottawa Winnipeg TorontoIsland
Victoria
Thousands

95 January 24, 2018 The Calgary Goods Movement Strategy Prepared by Watt Consulting Group Ltd. for The City of Calgary
YYC is also the third-busiest airport in Canada in terms of the number of itinerant movements on its
busiest day. For example, on its busiest day in September 2016, YYC saw nearly 800 itinerant aircraft
movements (see Figure 4-37). This volume is far greater than any other Western Canadian airports,
other than Vancouver. During
its busiest hours of operation, YYC has reached 70 itinerant movements per hour.
With its new cargo facilities now completed, YYC’s advantage to local shippers can only be expected to
increase.
Source: CPCS Analysis of CANSIM Table 401-0007
Figure 4-37: Peak day aircraft itinerant movements at Canadian airports, September 2016
4.3.4 Pipelines
Liquid product and natural gas pipelines operate in and through the city of Calgary. For example, ATCO
Pipelines owns and operates natural gas transmission pipelines that deliver natural gas from producers
to customers in Calgary. These pipelines largely follow the major highway corridors in Calgary. Figure
4-38 below shows existing high pressure natural gas pipelines (yellow), as well as proposed high
pressure pipelines (blue) and pipelines proposed to be removed from high pressure service (red).
Trans-Northern owns and operates the Alberta Products Pipe Line, the main source of delivery for
refined petroleum products in southern Alberta. This pipeline carries refined fuel products from
refineries in the Edmonton area to distribution terminals in Calgary, including terminals at YYC – see
Figure 4-39. This pipeline carries approximately 48,000 barrels of refined fuel products per day.78
78 Trans-Northern, Our Pipelines.
0
200
400
600
800
1000
1200
1400
1600

96 January 24, 2018 The Calgary Goods Movement Strategy Prepared by Watt Consulting Group Ltd. for The City of Calgary
Source: ATCO Pipelines
Figure 4-38: ATCO’s natural gas pipelines in Calgary

97 January 24, 2018 The Calgary Goods Movement Strategy Prepared by Watt Consulting Group Ltd. for The City of Calgary
Source: Trans-Northern Pipelines
Figure 4-39: Trans-Northern’s Alberta Products Pipe Line through Calgary

98 January 24, 2018 The Calgary Goods Movement Strategy Prepared by Watt Consulting Group Ltd. for The City of Calgary
5 State of goods movement data
5.1 Inventory of data
This chapter provides a brief inventory of the existing data that are available for and relevant to goods
movement in Calgary. Table 5-1 lists the data sources. The table provides a brief description of the
data, how the data are being used today, who owns the data, how they are collected and how the data
could be applied to the GMS. Note that the focus is on the relationship of these data to the Strategy,
and so other applications are not necessarily tabulated. Note also that the use of some sources are
explained more fully in other chapters of this report, as referenced in the table.
It can be seen that a wide variety of sources are available to The City. Most of these are data that
already are developed by, hence available to, The City. Other public agencies –i.e., the Government of
Alberta and Transport Canada - already have supplied selected tabulations of the data for the Strategy.
GPS truck trip traces are proving to be a key data source for the Strategy and for goods movement
strategies elsewhere: However, these data must be purchased or licensed from private vendors.
Nonetheless, the growing quantity and spatial/temporal coverage of GPS data are making them
increasingly important sources for transportation analyses.
Note that detailed breakdowns of airfreight in terms of origins and destinations are not available. That
is, the origin and destination and multi-modal movement of a cargo shipment that moves through YYC
is not known. Some origin-destination data on rail container tonnages are available, as discussed in
Section 4.3.2.5, although specific information on the commodities carried and intermodal movements
are not available. The railways, air carriers and couriers maintain this information. However, these and
other details, such as actual itineraries, are not made available, except as reported already in the
previous chapter.
5.2 Data needs
In the early 2000s, The City of Calgary, The City of Edmonton, Alberta Transportation and the
University of Calgary pioneered the development of sophisticated truck forecasting models for Calgary
and Edmonton. These models were based on then-new surveys of establishments, which quantified the
trucking activity generated by individual businesses. The surveys gathered information about the
commodities generated by each surveyed establishment, along with a trip diary that captured the daily
itinerary of one or more vehicles from the establishment’s trucking fleet. These urban surveys were
complemented by roadside truck origin-destination surveys that were conducted at cordons
surrounding the two cities. These surveys captured inter-urban trucking activity.79
The truck models developed from these surveys have been in place since the early 2000s. Although
they have been applied to transportation planning studies since then, neither the surveys nor the
models have been updated in the interim. Staff of The City’s Forecasting Division have indicated an
79 These initiatives have been well documented elsewhere. See, for example, Hunt, J.D., K. Stefan, A.T.
Brownlee, J.D.P. McMillan, A. Farhan, K. Tsang, D. Atkins, and M. Ishani, A Commercial Movement Modelling Strategy for Alberta’s Major Cities, Transportation Association of Canada, 2004. The City of Calgary’s model is described in The City of Calgary, 2001 Regional Transportation Model: Commercial Vehicle Model Description Report, 2006.

99 January 24, 2018 The Calgary Goods Movement Strategy Prepared by Watt Consulting Group Ltd. for The City of Calgary
interest in updating the surveys and the models; however, neither is a high priority currently, given other
needs. In the meantime, an external roadside truck survey was conducted in June and July 2017. It
gathered up-to-date information on truck activity to inform the Strategy. The survey findings are
reported separately.80
80 External Truck Origin/Destination Survey Summary Report, prepared for The City of Calgary, November 2017.

Table 5-1: Inventory of goods movement data
Data type Description Ownership / source Collection method Application to the Strategy
Screenline and
cordon classification
counts81
Counts of vehicles at strategic
locations around the city, classifying
vehicles by type and also counting
their occupants. Cyclists and
pedestrians also are counted. A
cordon is an imaginary line around an
area of interest, such as the
Downtown. A screenline is an
imaginary line that cuts through the
entire city – for example, the Bow
River serves as a screenline, and
traffic is counted on all crossings in
each direction.
Transportation Data,
Transportation
Planning, The City of
Calgary
Manual and automatic
counts, with counts
conducted approximately
every 5 years and, at the
Downtown Cordon, every
year.
Provides estimates of the growth
in vehicles by type in different
parts of Calgary. Trucks are
categorized as light, medium
and heavy, according to the
number of tires and
differentiating between single
unit vehicles and multiple unit
vehicles. See also Section
4.3.1.7.
Intersection turning
movement counts82
6-hour counts of traffic entering and
exiting individual intersections,
accounting for all allowable turning
movements. Some distinction by
vehicle class, including trucks.
Transportation Data,
Transportation
Planning, The City of
Calgary
Manual counts. Provides estimates of total daily
traffic throughout Calgary, and
how these volumes change over
time. Basis for calculating
percent truck volumes on
individual streets, along with
automatic and permanent
counts. See also Section
4.3.1.4.
81 Source: The City of Calgary, Mobility Monitor, Carpooling and vehicle occupancy in Calgary, Issue 21, January 2008.
82 Source: The City of Calgary, Transportation Data (http://www.calgary.ca/Transportation/TP/Pages/Planning/Transportation-Data/Transportation-
Data.aspx); 2016 Percent Truck Downtown map, February 2017 and 2016 Percent Truck City Wide map, 2017.

Table 5-1: Inventory of goods movement data
Data type Description Ownership / source Collection method Application to the Strategy
Automatic and
permanent counts83
24-hour counts of traffic along
individual road sections. Some newer
stations distinguish vehicle classes,
including trucks, and collect data on
travel speeds.
Transportation Data,
Transportation
Planning, The City of
Calgary
Automatic (temporary) and
permanent counting
stations.
Provides estimates of total daily
traffic throughout Calgary, and
how these volumes change over
time. Basis for calculating
percent truck volumes on
individual streets, along with
intersection counts. See also
Section 4.3.1.4.
GPS truck trip
traces
GPS traces of truck locations and time,
hence these data can yield information
on itineraries (also known as tours),
stops, routes used, travel times,
speeds, delays and the location of
delays.
ATRI and commercial
GPS fleet
management vendors.
Data must be
purchased or licensed
from the vendor, and
can be subjected to
restrictions of use.
Data derived from GPS
units that are built into or
installed in vehicles. Note
that not all fleets subscribe
to these services, although
data are robust. Data are
available 24/7/365 over
several years. Note that
these are not true origin-
destination data (see
Section 5.2); rather, they
show the intensity of truck
activity.
Used to profile truck flows, travel
patterns and speeds. See also
Sections 4.3.1.5, 4.3.1.6, and
4.3.1.8.
83 Source: The City of Calgary, Transportation Data and Transportation Data products and services; 2016 Percent Truck Downtown Map and 2016
Percent Truck City Wide map, 2017.

Table 5-1: Inventory of goods movement data
Data type Description Ownership / source Collection method Application to the Strategy
Grade Crossing
Inventory Reports84
Location of at-grade rail crossings and
frequency of freight and passenger
trains. Used to assess the need for
safety improvements, such as grade-
separated crossings.
Transport Canada Not known. Updated
annually.
Used to profile the frequency of
freight trains on rail lines in and
around Calgary, as well as the
location of at-grade rail
crossings. See also Section
4.3.2.5.
Accident statistics85 Annual tabulations of accidents that
involve trucks.
The City of Calgary Calgary Police Service
accident records, compiled
by The City of Calgary.
Could be used in future stages
to assess trends and identify
accident-prone areas.
TRAVIS Permit
Listing Report86
Lists over-weight and over-dimension
permits issued by type, commodity
carried and frequency (single or multi-
use permits). Report is issued
annually; however, data can be
tabulated for any period.
Government of
Alberta
Summary of permits in the
TRAVIS database.
Could be used in future stages
as part of the assessment of
over-weight and over-dimension
routes.
84 See Grade Crossings Inventory, Transport Canada,, https://www.tc.gc.ca/eng/railsafety/railsafety-1000.html
85 Information provided by The City of Calgary, March 2017.
86 Government of Alberta, TRAVIS Permit Listing Report By Start Date For City of Calgary, January 1 – December 31, 2016. Report prepared March 8,
2017.
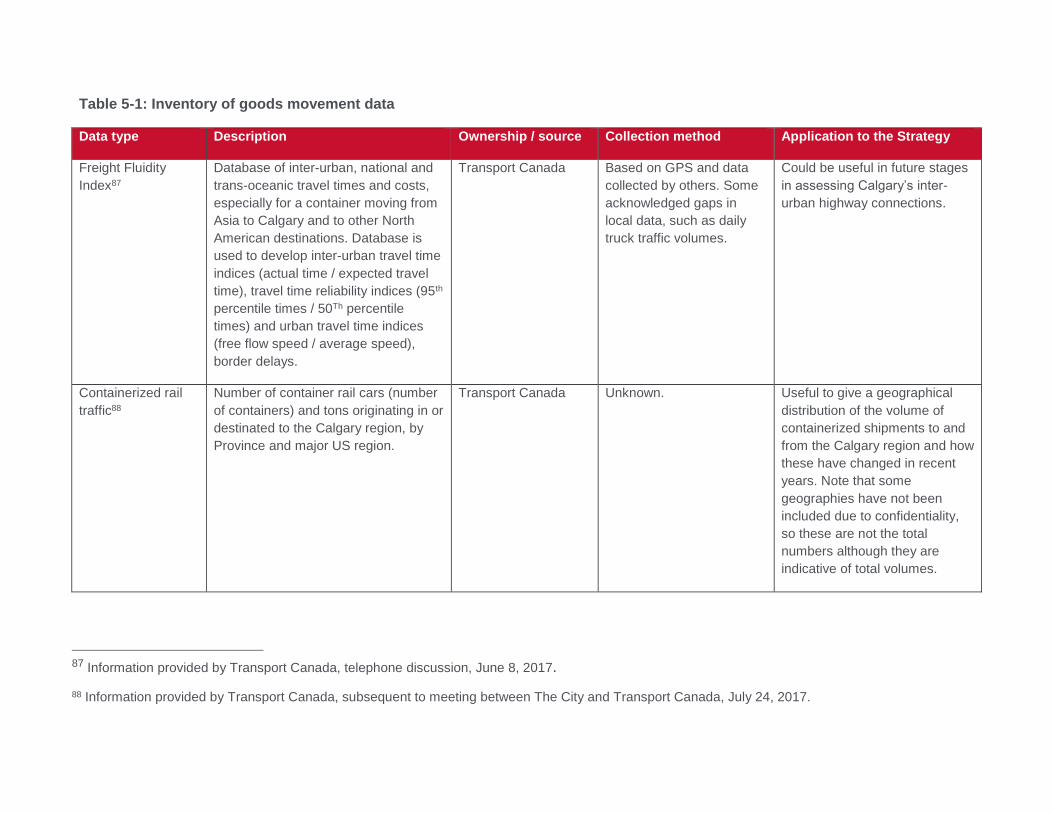
Table 5-1: Inventory of goods movement data
Data type Description Ownership / source Collection method Application to the Strategy
Freight Fluidity
Index87
Database of inter-urban, national and
trans-oceanic travel times and costs,
especially for a container moving from
Asia to Calgary and to other North
American destinations. Database is
used to develop inter-urban travel time
indices (actual time / expected travel
time), travel time reliability indices (95th
percentile times / 50Th percentile
times) and urban travel time indices
(free flow speed / average speed),
border delays.
Transport Canada Based on GPS and data
collected by others. Some
acknowledged gaps in
local data, such as daily
truck traffic volumes.
Could be useful in future stages
in assessing Calgary’s inter-
urban highway connections.
Containerized rail
traffic88
Number of container rail cars (number
of containers) and tons originating in or
destinated to the Calgary region, by
Province and major US region.
Transport Canada Unknown. Useful to give a geographical
distribution of the volume of
containerized shipments to and
from the Calgary region and how
these have changed in recent
years. Note that some
geographies have not been
included due to confidentiality,
so these are not the total
numbers although they are
indicative of total volumes.
87 Information provided by Transport Canada, telephone discussion, June 8, 2017.
88 Information provided by Transport Canada, subsequent to meeting between The City and Transport Canada, July 24, 2017.

Table 5-1: Inventory of goods movement data
Data type Description Ownership / source Collection method Application to the Strategy
Trade data imports
and exports89
Database of road-base imports and
exports between Alberta and other
countries. Annual tonnages provided
by commodity type and by value.
Statistics Canada Unknown. Limited. No further geographical
breakdown is available below
the Provincial (Alberta) level.
Routing is not clear, nor is the
port of entry/exit or the use of
multiple modes.
National Roadside
Survey (NRS)90
Occasional series of truck origin-
destination data and other
characteristics of long-haul trucking,
captured at Canada-US border
crossings.
Transport Canada Roadside interview survey
of a sample of drivers.
Limited. Can provide aggregate
information on cross-border
truck and commodity flows.
However, note that the NRS was
last collected in 2006-2007, and
the origins and destinations
cannot be broken down
geographically for the Calgary
region.
Border crossing
truck volumes91
Quarterly summaries of total two-way
truck traffic at each Canada-US border
crossing.
Transport Canada Unknown Limited. No information on
contents, origin or destination.
89 Information provided by Transport Canada, subsequent to meeting between The City and Transport Canada, July 24, 2017. See https://www.statcan.gc.ca/eng/trade/data.
90 Information provided by Transport Canada, subsequent to meeting between The City and Transport Canada, July 24, 2017.
91 Information provided by Transport Canada, subsequent to meeting between The City and Transport Canada, July 24, 2017.

Table 5-1: Inventory of goods movement data
Data type Description Ownership / source Collection method Application to the Strategy
Border crossing
truck and rail
volumes92
Monthly summaries of outbound truck
and rail traffic at each Canada-US
border crossing. Total container trucks,
broken out by full truck containers and
empty truck containers, total number of
freight trains, number of full rail
containers and number of empty rail
containers are available. However,
these counts are available only for
outbound (that is, entry into the US).
Bureau of
Transportation
Statistics, US
Department of
Transportation
Unknown Limited. No information on
contents, origin or destination.
Data available for outbound
only.
Trucking
Commodity Origin
and Destination
Survey (TCOD)93
Annual summary of tonnage moved by
truck within the Calgary Region (no
further breakdown) and between the
Calgary Region and other
origins/destinations at the Provincial
level or to/from the US.
Statistics Canada Companies are asked to
report electronically, via in-
person visits by Statistics
Canada interviewers or via
a telephone interview.
Limited. TCOD is sampled from
trucking establishments that
have at least $1.3m in annual
revenues. Can provide high-
level summary of annual
changes in tonnage by
origin/destination. Can also
provide high-level summary of
annual changes by commodity
tonnages, but not by
origin/destination.
92 For more information, see: https://www.bts.gov/content/border-crossingentry-data.
93 Information provided by Transport Canada, subsequent to meeting between The City and Transport Canada, July 24, 2017. See also http://www23.statcan.gc.ca/imdb/p2SV.pl?Function=getSurvey&SDDS=2741.

106 January 24, 2018 The Calgary Goods Movement Strategy Prepared by Watt Consulting Group Ltd. for The City of Calgary
6 The economic importance of goods
movement in Calgary
6.1 Defining the economic importance of goods movement in Calgary
6.1.1 Introduction
The goods movement industry in Calgary, and in Alberta more broadly, is an important driver of the
city’s and province’s economic prosperity. As an important Western Canadian distribution hub, Calgary
is home to many transportation and logistics carriers and facilities who help to ensure that goods flow to
and from Calgary, Western Canada and beyond quickly and efficiently. This activity generates income
for businesses in Calgary as well as employment for Calgarians.
To illustrate this importance, in 2016 Statistics Canada produced an estimate of inter-regional trade
flows in Canada, by truck and rail, entitled: “Domestic regional trade flows in Canada: Experimental
estimates from the new Surface Transportation File, 2004 to 2012,”). In the latest year for which the
data were available (2012), which is based on a three-year moving average, Statistics Canada
estimates that there was $10 billion in goods moving from Calgary to other regions of Canada by truck
and rail, and that there was $13 billion in goods moving to Calgary by truck and rail.94
This section quantifies the economic impact of the goods movement industry in Calgary in terms of its
contribution to the city’s gross domestic product (GDP) and employment. These economic impacts
include the GDP that is directly generated by the sector and the workers who are directly employed by
the sector, as well as the GDP and employment that is supported by the sector through its demand for
materials and services from other sectors.
These economic impacts are distinct from the economic benefits generated by the industry (as
described in the following section), particularly the benefits that transportation carriers and logistics
companies provide to their customers (shippers) and their customers’ customers (who are often
customers or the general public more broadly). Among these benefits are increasing the availability of a
wider range of goods and helping to make those goods available at the lowest possible cost. These
benefits are of great importance, but are also more difficult to quantify.
Before estimating the economic impacts of the goods movement industry in Calgary, the geographic
scope and goods movement industries must be defined and described.
6.1.2 Geographic scope
For the purpose of estimating the economic impacts of the goods movement industry at the regional
level, Statistics Canada’s definition of the Calgary census metropolitan area (CMA) boundaries was
used to determine the geographic scope for the Calgary Region (“the Region”). The Calgary CMA
94 These estimates exclude flows by air, for which there are no government-collected data sources. These
estimates also exclude intra-Calgary flows.

107 January 24, 2018 The Calgary Goods Movement Strategy Prepared by Watt Consulting Group Ltd. for The City of Calgary
includes the Census Subdivisions of Calgary, Airdrie, Rocky View County, Cochrane, Chestermere,
Crossfield, Sarcee 145, Irricana and Beiseker. This geography was chosen due to the way in which the
necessary underlying data are organized.
6.1.3 Defining the goods movement industry
The “goods movement industry” is not conveniently defined by a single NAICS industry code. Broadly
speaking, transportation and logistics activity includes the movement of people and goods, as well as
the coordination and planning related to that activity. Specifically with respect to goods movement,
logistics involves the planning and coordination of that movement from primary and secondary
producers through to consumers. Within this process is an array of activities, such as packaging,
storage and coordinating the handoff of goods between multiple modes of transportation.
Transportation, with the exception of private or in-house truck transportation, is well defined and
classified within the NAICS. For the most part, transportation activity falls within the Transportation and
Warehousing sector (NAICS codes 48 and 49). Within this sector exist the following subsectors:
• Air Transportation (481)
• Rail Transportation (482)
• Water Transportation (483)
• Truck Transportation (484)
• Transit and Ground Passenger Transportation (485)
• Pipeline Transportation (486)
• Scenic and Sightseeing Transportation (487)
• Support Activities for Transportation (488)
• Postal Services (491)
• Couriers and Messengers (492)
• Warehousing and Storage (493)95
As indicated by the titles of the various subsectors, most transportation activity falls within this sector.
Many companies, for example in the retail, construction or oil and gas industries, own and operate their
own fleets of trucks. This in-house trucking activity is not captured in the Truck Transportation
subsector.
The logistics component of the goods movement industry is more difficult to isolate within NAICS. This
is because logistics activity is conducted by many different companies in different NAICS sectors or
subsectors. For example, Support Activity for Transportation (NAICS code 488) includes the logistics
functions of freight forwarding and custom brokerage, while Warehousing and Storage (493) includes
the storage of goods. However, other logistics activity falls under the Wholesale Trade (41) NAICS
sector. The Wholesale Trade sector also includes activity that generally falls outside of the sphere of
logistics, such as marketing and sales activity. Particularly when the Wholesale Trade sector is grouped
with the Retail Trade sector (44-45), as it often is for data that are available at smaller geographic
scales, a large portion of the activity is unrelated to logistics. In cases where Wholesale and Retail
95 Industry Canada, Transportation and Warehousing Definition.

108 January 24, 2018 The Calgary Goods Movement Strategy Prepared by Watt Consulting Group Ltd. for The City of Calgary
Trade are grouped together, relative employment shares were used to estimate the portion of GDP that
is attributable to Wholesale Trade only.
6.1.3.1 Classification of distribution centres
Distribution centres are important components of logistics supply chains. As such, the activity that
occurs in and is generated by distribution centres should be included in the assessment of the
economic impact of the goods movement industry. However, it is not completely clear into which NAICS
sector distribution centres fall.
In 2009, the Economic Classification Policy Committee (ECPC) recognized that distribution centres
were not clearly classified in the 2007 NAICS definitions and initiated discussion and solicited
comments in collaboration with representatives from Canada and Mexico. An agreement was
eventually affirmed at a trilateral steering committee that distribution centres generally be classified to
Warehousing and Storage. It was recommended that the term “distribution centre” not be used, and
rather a description of the activities usually conducted by distribution centres instead be included. This
recommendation was made due to the fact that the term “distribution centre” can take on a wide variety
of meanings in common usage.96
Because the term “distribution centre” is not actually used in the industry definitions, the reality is that
such facilities may fall within Warehousing and Storage or within Wholesale Trade, depending on the
specific type of activity that is conducted within those facilities. Due to this fact and the fact that other
logistics activities also fall into the Wholesale Trade NAICS sector as noted above, Wholesale Trade is
included in the definition of the broader goods movement industry.
6.1.3.2 Treatment of in-house trucking activity
For the purpose of defining the economic impacts of the goods movement industry, NAICS sectors 41
and 48-49 are included. This definition will overestimate the economic impact of the industry because
the Transportation and Warehousing sector in particular includes some subsectors that are exclusively
passenger-oriented. However, a large portion of transportation and logistics activity is missing from this
definition because it does not capture in-house trucking activity.
This missing portion is very likely to represent a larger portion of economic activity and employment
than the non-goods movement portion that is included in the definition. This is because both the for-hire
and in-house trucking industries are very large. A direct estimate of the size of the in-house trucking
industry (in terms of total GDP) is not available. However, the relative share of truck driver employment
provides some indication of its size. Of the roughly 280,000 truck drivers in Canada, about 125,000
(nearly 45%) of those drivers are in subsectors other than the truck transportation subsector (NAICS
484).97 Assuming that the GDP per truck driver is similar for both for-hire and in-house trucking, the
total GDP of in-house trucking in Canada would be approximately $15 billion.
96 United States Census Bureau, Economic Classification Policy Committee Recommendations for Classification
of Distribution Centers. (2010).
97 According to data from the 2011 National Household Survey.

109 January 24, 2018 The Calgary Goods Movement Strategy Prepared by Watt Consulting Group Ltd. for The City of Calgary
6.1.4 Defining economic impacts
The estimate of economic impact of the goods movement industry in Calgary includes the total direct,
indirect and induced impacts where:
• Direct impacts are the value added (GDP), labour income, tax revenue and employment directly
generated by the goods movement industry. For example, the labour income earned by truck
drivers employed in the truck transportation sector is direct labour income of the goods movement
industry.
• Indirect impacts are the value added, labour income, tax revenue and employment that are
generated by sectors that supply goods movement industries. For example, operating a
distribution centre generates demand for intermediate goods such as energy. The labour income
earned by employees involved in supplying those intermediate goods is indirect labour income
supported by the goods movement industry.
• Induced impacts are value added, labour income, tax revenue and employment generated as a
result of employees of the goods movement sector purchasing goods and services for personal
consumption. For example, truck drivers use their income to purchase goods and services from
various other industries. The income earned by employees in those industries is induced income
supported by the goods movement activity.
The indirect and induced impacts were first generated at the provincial level, based on the input-output
structure of the provincial economy, as estimated through Statistics Canada’s provincial Input-Output
tables. These impacts were then estimated at the city level through the use of economic multipliers that
have been calculated from The City’s economic model for the Calgary Region. Because The City’s
economic model does not produce multipliers for induced impacts, the ratio of induced to indirect
impacts at the provincial level was used to estimate the induced impacts at the city level.
6.1.5 Direct GDP and employment
6.1.5.1 Direct GDP
The Calgary CMA’s total GDP was approximately $115 billion ($ 2007) in 2015. At the two-digit NAICS
level, the primary and utilities sector and the finance, insurance and real estate sector were the two
largest sectors by GDP.
The transportation and warehousing sector accounted for 4% of GDP, while the wholesale and retail
trade sector accounted for a further 8% of the total (see Figure 6-1).
As noted in section 6.1, much of the retail portion of wholesale and retail trade sector in particular is
unrelated to transportation and logistics activity. In order to estimate the portion of wholesale and retail
trade GDP in the Calgary CMA that is directly attributable to wholesale trade only, the relative
employment and productivity levels were analyzed in wholesale trade and retail trade.

110 January 24, 2018 The Calgary Goods Movement Strategy Prepared by Watt Consulting Group Ltd. for The City of Calgary
Source: CPCS Analysis of Data from the Conference Board of Canada
Note: Total may not equal to 100% due to rounding
Figure 6-1: Share of GDP by sector in the Calgary CMA, 2015
6.1.5.2 Direct employment
As of 2015, approximately 800,000 people were employed in the Calgary CMA. Nearly 50,000 (6%)
people were employed in the transportation and warehousing sector, with a further 118,000 (15%)
people employed in the wholesale and retail trade sectors (see Figure 6-2).
As above, data from the LFS were used to differentiate between employment in the wholesale trade
sector and employment in retail trade. From these data it is estimated that total direct employment in
the goods movement industry (transportation and warehousing plus wholesale trade) is approximately
80,000 jobs, or just 10% of all jobs in Calgary. Collectively, employees in these jobs earned over $5
billion ($ 2007) in labour income in 2015.
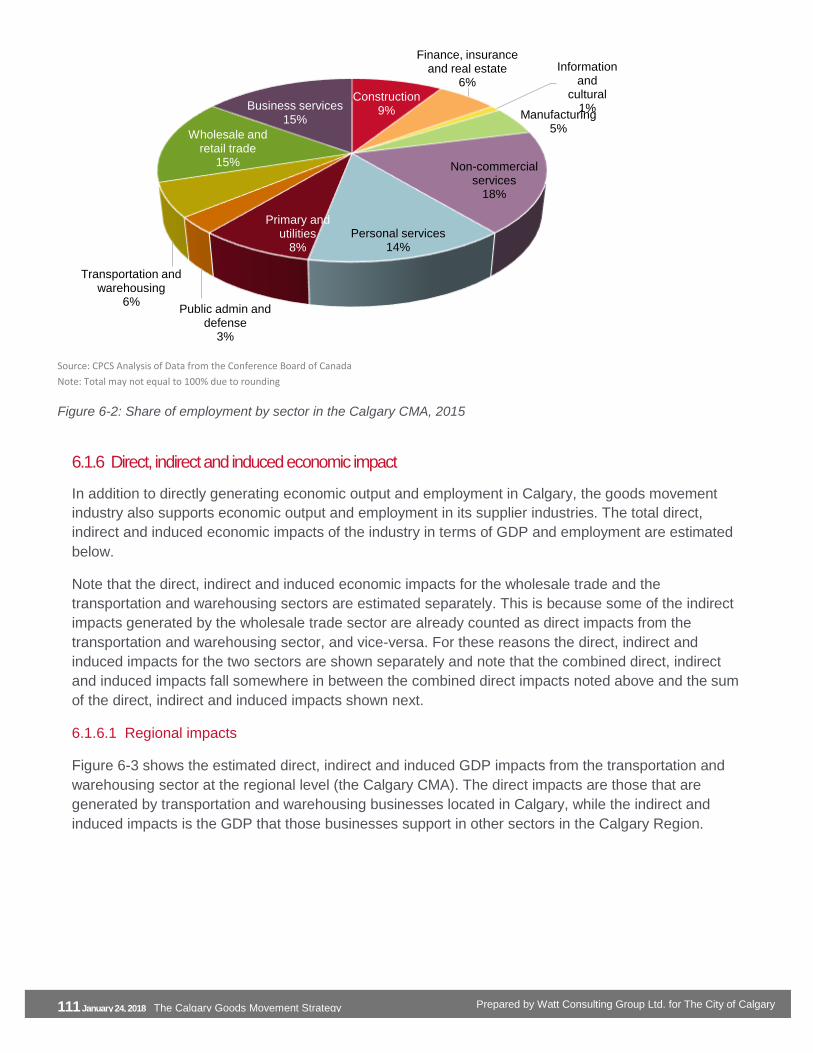
111 January 24, 2018 The Calgary Goods Movement Strategy Prepared by Watt Consulting Group Ltd. for The City of Calgary
Source: CPCS Analysis of Data from the Conference Board of Canada
Note: Total may not equal to 100% due to rounding
Figure 6-2: Share of employment by sector in the Calgary CMA, 2015
6.1.6 Direct, indirect and induced economic impact
In addition to directly generating economic output and employment in Calgary, the goods movement
industry also supports economic output and employment in its supplier industries. The total direct,
indirect and induced economic impacts of the industry in terms of GDP and employment are estimated
below.
Note that the direct, indirect and induced economic impacts for the wholesale trade and the
transportation and warehousing sectors are estimated separately. This is because some of the indirect
impacts generated by the wholesale trade sector are already counted as direct impacts from the
transportation and warehousing sector, and vice-versa. For these reasons the direct, indirect and
induced impacts for the two sectors are shown separately and note that the combined direct, indirect
and induced impacts fall somewhere in between the combined direct impacts noted above and the sum
of the direct, indirect and induced impacts shown next.
6.1.6.1 Regional impacts
Figure 6-3 shows the estimated direct, indirect and induced GDP impacts from the transportation and
warehousing sector at the regional level (the Calgary CMA). The direct impacts are those that are
generated by transportation and warehousing businesses located in Calgary, while the indirect and
induced impacts is the GDP that those businesses support in other sectors in the Calgary Region.
Construction9%
Finance, insurance and real estate
6%
Information and
cultural1%
Manufacturing5%
Non-commercial services
18%
Personal services14%
Primary and utilities
8%
Public admin and defense
3%
Transportation and warehousing
6%
Wholesale and retail trade
15%
Business services15%

112 January 24, 2018 The Calgary Goods Movement Strategy Prepared by Watt Consulting Group Ltd. for The City of Calgary
Source: CPCS Analysis
Figure 6-3 Calgary transportation and warehousing sector GDP impacts (2007 $ million)
In total, when adding the indirect and induced GDP impacts to the sector’s direct GDP impacts in
Calgary, total supported GDP increases from $5.2 billion to $8.8 billion ($ 2007).
Figure 6-4 shows the provincial GDP impacts from Calgary’s wholesale trade sector.
Source: CPCS Analysis
Figure 6-4: Calgary wholesale trade GDP impacts (2007 $ million)
When adding the indirect and induced GDP impacts to the sector’s direct GDP impacts in Calgary, total
supported GDP increases to $5.7 billion ($ 2007).
5,2362,288
1,290
Direct GDP Indirect GDP Induced GDP
3,6091,021
1,079
Direct GDP Indirect GDP Induced GDP
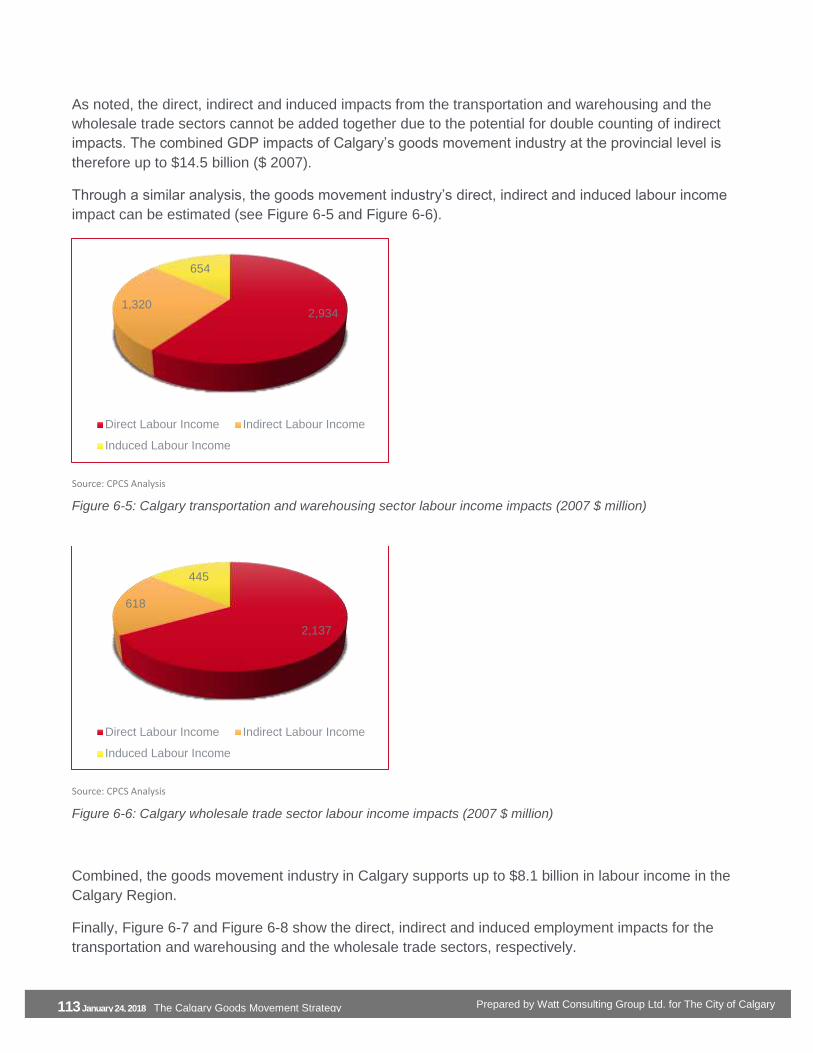
113 January 24, 2018 The Calgary Goods Movement Strategy Prepared by Watt Consulting Group Ltd. for The City of Calgary
As noted, the direct, indirect and induced impacts from the transportation and warehousing and the
wholesale trade sectors cannot be added together due to the potential for double counting of indirect
impacts. The combined GDP impacts of Calgary’s goods movement industry at the provincial level is
therefore up to $14.5 billion ($ 2007).
Through a similar analysis, the goods movement industry’s direct, indirect and induced labour income
impact can be estimated (see Figure 6-5 and Figure 6-6).
Source: CPCS Analysis
Figure 6-5: Calgary transportation and warehousing sector labour income impacts (2007 $ million)
Source: CPCS Analysis
Figure 6-6: Calgary wholesale trade sector labour income impacts (2007 $ million)
Combined, the goods movement industry in Calgary supports up to $8.1 billion in labour income in the
Calgary Region.
Finally, Figure 6-7 and Figure 6-8 show the direct, indirect and induced employment impacts for the
transportation and warehousing and the wholesale trade sectors, respectively.
2,9341,320
654
Direct Labour Income Indirect Labour Income
Induced Labour Income
2,137
618
445
Direct Labour Income Indirect Labour Income
Induced Labour Income

114 January 24, 2018 The Calgary Goods Movement Strategy Prepared by Watt Consulting Group Ltd. for The City of Calgary
In total, Calgary’s goods movement industry supports up to 134 thousand jobs in the Region.
Source: CPCS Analysis
Figure 6-7: Calgary transportation and warehousing sector regional employment impacts (thousands of jobs)
Source: CPCS Analysis
Figure 6-8: Calgary wholesale trade sector regional employment impacts (thousands of jobs)
6.1.7 Summary of Calgary’s goods movement industry economic impacts
The energy industry is known to be an important source of employment and prosperity for Calgary, and
for Alberta more broadly. However, as demonstrated by the above analysis, the goods movement
industry is also a significant generator of employment and prosperity for Calgary.
The goods movement industry’s contribution to Calgary’s GDP may not be as large as the energy
industry’s contribution, assuming that the bulk of the primary and utilities sector’s direct GDP as shown
in Figure 6-1 is attributable to the energy sector. However, its contribution to jobs in the Calgary Region
4921
14
Direct Employment Indirect Employment
Induced Employment
3111
9
Direct Employment Indirect Employment
Induced Employment
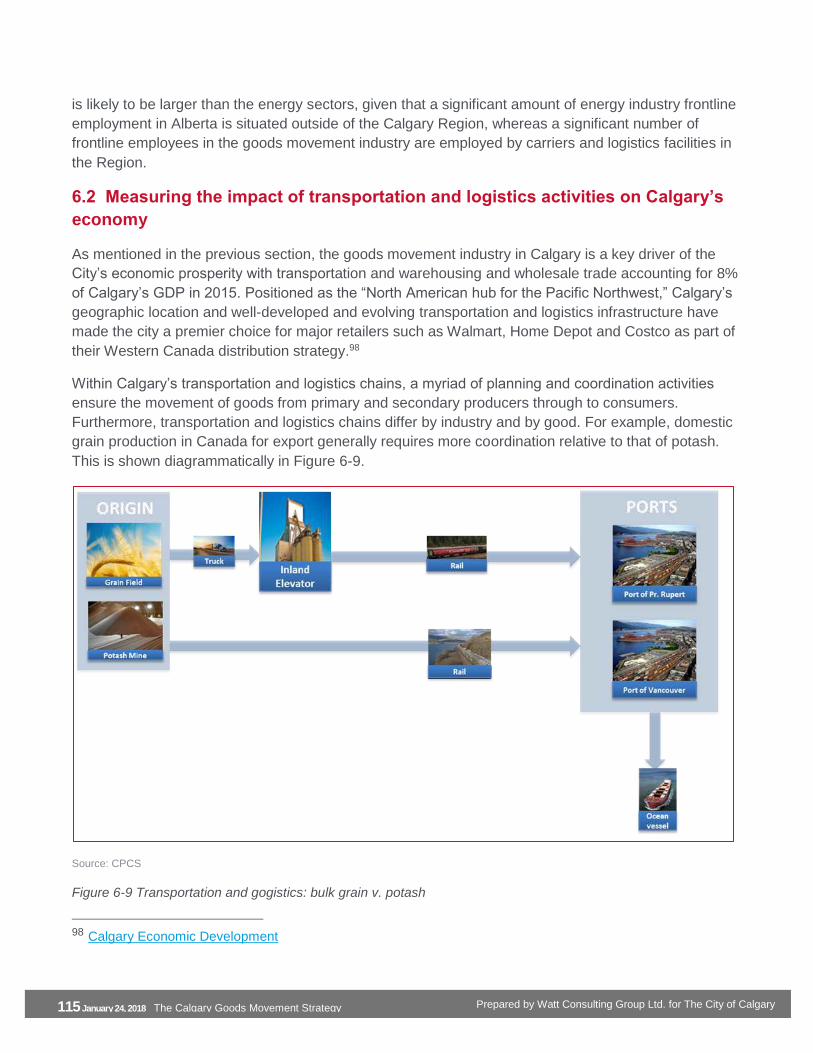
115 January 24, 2018 The Calgary Goods Movement Strategy Prepared by Watt Consulting Group Ltd. for The City of Calgary
is likely to be larger than the energy sectors, given that a significant amount of energy industry frontline
employment in Alberta is situated outside of the Calgary Region, whereas a significant number of
frontline employees in the goods movement industry are employed by carriers and logistics facilities in
the Region.
6.2 Measuring the impact of transportation and logistics activities on Calgary’s
economy
As mentioned in the previous section, the goods movement industry in Calgary is a key driver of the
City’s economic prosperity with transportation and warehousing and wholesale trade accounting for 8%
of Calgary’s GDP in 2015. Positioned as the “North American hub for the Pacific Northwest,” Calgary’s
geographic location and well-developed and evolving transportation and logistics infrastructure have
made the city a premier choice for major retailers such as Walmart, Home Depot and Costco as part of
their Western Canada distribution strategy.98
Within Calgary’s transportation and logistics chains, a myriad of planning and coordination activities
ensure the movement of goods from primary and secondary producers through to consumers.
Furthermore, transportation and logistics chains differ by industry and by good. For example, domestic
grain production in Canada for export generally requires more coordination relative to that of potash.
This is shown diagrammatically in Figure 6-9.
Source: CPCS
Figure 6-9 Transportation and gogistics: bulk grain v. potash
98 Calgary Economic Development
116 January 24, 2018 The Calgary Goods Movement Strategy Prepared by Watt Consulting Group Ltd. for The City of Calgary
Thus, the more reliable a region’s transportation and logistics system are in terms of efficiency and
agility, the more society can benefit from the greater availability of a wider range of goods at the lowest
possible cost.99
So how have Calgarians benefited in terms of transportation and logistics system efficiency and agility?
While it is difficult to quantify at a city level, a national level analysis can provide some insights.
At a national level, Figure 6-10 summarizes the number of types of merchandise imports and exports
with a value of over C$1.5 billion sorted by the North American Product Classification System
(NAPCS).100 It should also be noted that Figure 6-10 is expressed on a balance of payments basis101
and is seasonally adjusted.
While the number of types of exported merchandise classified by NAPCS has remained relatively flat
between 1988 and 2016, there is a marked increase (approximately 45%) in the number of types of
imported merchandise exceeding the same threshold and for the same time period.
Thus, based on Figure 6-10, it can be inferred that on a national level and over time, Canadians have
benefited from the greater availability of a wider range of goods. The increased efficiency and agility of
Canada’s transportation and logistics chains have contributed to this greater availability of a wider
range of goods. Without increasing transportation capacity and more efficient transportation and
logistics systems, these goods would not have been able to reach their domestic destinations.
99 Efficiency is defined as the ability to move goods from origin to destination at the lowest possible cost. Agility is
defined as responsiveness, flexibility and quickness.
100 The North American Product Classification System is a classification that organizes goods and services
throughout the economy in a systematic fashion.
101 Balance of payments basis means providing a systematic summary of economic transactions of an economy
with the rest of the world.

117 January 24, 2018 The Calgary Goods Movement Strategy Prepared by Watt Consulting Group Ltd. for The City of Calgary
Source: CPCS Analysis of CANSIM Data Table 228-0059
Figure 6-10: Number of types of merchandise classified by NAPCS that were imported and exported nationally with a value of over C$1.5 billion on a balance of payment basis (and seasonally adjusted)
6.3 Transportation and logistics costs
In an increasingly globalized world where nations, provinces/states and cities compete among each
other and internationally to attract business activity, jobs and economic growth, understanding a
region's transportation and logistics advantages and disadvantages is useful.
Among individual companies (in economic terms, often referred to as ‘the firm level’), understanding
these advantages and disadvantages helps those firms minimize transportation and logistics costs. It
helps them extend the reach of their products, or extend the reach of their sourcing. Extending the
reach of their products enables these firms to grow their business, beyond what would be possible if
they were constrained to a more local market. Extending the reach of their sourcing allows firms to find
more competitively priced or higher quality inputs to their own products.
Understanding regional transportation and logistics costs helps firms anticipate the potential impacts of
changes in technologies, infrastructure improvements or policies on their costs and the competitiveness
of their products.
For policy-makers, understanding transportation and logistics chains and how they enhance or inhibit
business activity helps them evaluate their own policies that affect their regions’ transportation and
logistics advantages and disadvantages. For example, customs processes, packaging and labeling
requirements and investment in and the use of public infrastructure are among the factors that affect
transportation and logistics efficiency that are within or partially within the control of the public sector.
6.3.1 Transportation and logistics costs as the level of individual firms
When moving goods along transportation and logistics chains, firms are faced with a variety of choices
and trade-offs as they seek to minimize related costs while maintaining or exceeding end-user
satisfaction. The most obvious trade-off is the choice of transport mode (faster and more expensive or
51 51 51 51 51 51 51 51 50 50 50 50 50 51 51 51 51 51 51 52 52 52 52 52 53 53 52 52 52
58 58 57 5862 62
6668 68
7477 76 76
8179
82 82 8284
86 8784 85 85 85 85
87 86 85
# o
f M
erc
handis
e b
ased o
n
NA
PC
S
Export Import

118 January 24, 2018 The Calgary Goods Movement Strategy Prepared by Watt Consulting Group Ltd. for The City of Calgary
slower and less expensive) and inventory costs (smaller inventory and lower cost or larger inventory
and more cost). The optimal choice seeks to minimize the sum of transportation and inventory costs.
(See Text Box – Canada’s northern grocery retail system – a story of trade-offs for a practical example
of trade-offs between transport mode and inventory costs.)
A number of other choices and trade-offs are possible, such as between packaging and transportation,
packaging and product shrinkage (due to product damage while in transit, for example), order
frequency and inventory levels, etc. Moreover, trade-offs can exist during the inter-firm or intra-firm
movement of goods.
Firms often attempt to minimize the sum of the logistics costs either implicitly as a result of past
business practices or explicitly through logistics cost modeling. These models include both
transportation and logistics costs, with key components summarized in Figure 6-11.
Source: The Conference Board of Canada
Figure 6-11: Key components of a logistics cost model
Per Figure 6-11, inventory and transportation costs are primary components of the total logistics cost
model. Inventory costs can occur at several stages of product movement and can vary for different
reasons. For example, in the first process in Figure 6-11, inventory carrying costs occur as a result of
the minimum economic order quantity (EOQ).102 Subsequently, inventory costs are generated while
products are in-transit. The longer that a product is in inventory, the higher the opportunity costs and
depreciation of that product.
102 The minimum EOQ is the quantity of inventory that is ordered that minimizes total ordering and holding costs.
For example, a firm may require a pallet of a given product each week to satisfy its demand each week. However, per unit it may be much less costly to ship the product one container load at a time, meaning that a container load is the EOQ. If 20 pallets can fit into one container, the firm will have on hand an average of 10 pallets of inventory at any given time. In this case the inventory costs due to the EOQ is equal to the holding cost of 10 pallets on an ongoing basis.
119 January 24, 2018 The Calgary Goods Movement Strategy Prepared by Watt Consulting Group Ltd. for The City of Calgary
Finally, when transportation and logistics chains are unreliable, resulting in high degrees of variability
with respect to transit times, firms may need to hold more inventory at any given time in order to ensure
that production processes are not interrupted and/or consumer demand is fulfilled when required.
Though direct transportation costs are shown as a single item in Figure 6-11, they too can be broken
down in many ways, such as by freight bills for outsourced transportation services and costs incurred
internally for in-house transportation services.
The above costs, along with administrative costs such as order processing costs, make up the total
transportation and logistics costs at the level of individual firms.

120 January 24, 2018 The Calgary Goods Movement Strategy Prepared by Watt Consulting Group Ltd. for The City of Calgary
Canada’s northern grocery retail system – a story of trade-offs
In April 2011, the Government of Canada introduced the Nutrition North Canada (NNC) program, a retailer-based subsidy designed to reduce the cost to northern consumers of perishable, nutritious foods. The program supports the shipment, sale and consumption of perishable, nutritious food in 103 isolated communities across northern Saskatchewan, Manitoba, Ontario, Quebec and Labrador, as well as eligible communities in Northwest Territories, Yukon and Nunavut. Perishable foods can be fresh, frozen, refrigerated or have a shelf life of less than one year and must be shipped by air in order to be eligible under the NNC program.
It should be noted that the NNC program is structured to serve communities in the north that lack year-round surface transportation (i.e., no permanent road, rail or marine access). Naturally, these communities tend to be located in the remote areas of Canada and a greater distance from southern commercial centers where grocery resupply activities originate.
In fall 2014, the Government of Canada commissioned the Enrg Research Group to provide an analysis of the grocery retail system in northern Canada, giving consideration to the NNC program and to provide recommendations on the economics of providing perishable, nutritious food to the north.
Access to the full study can be found on the Government of Canada's website. For brevity, key conclusions as it relates to transportation and logistics chains are summarized below.
Transportation
Relative to southern retail outlets, the prices of groceries in the north are much higher. The higher prices are purely the effect of transportation. One major differentiating element is that retailers in the north are responsible for the transportation of their product and merchandise to their store, unlike most southern grocery retailers. In the south, suppliers typically assume the cost of transporting their product to the retailer for sale. Thus, not only is transportation to northern locations costly, but it is an additional cost borne directly by northern retailers whereas it is not generally an explicit cost line item for southern retailers.
The number of times a certain good is handled or ‘touched’ also impacts total transport and logistics costs for northern grocery retailers. In general, the more that a good is handled, the more the costs increase. Handling for southern retailers typically involves three ‘touches’ whereas, grocery retail goods destined for Igloolik, Nunavut or Lac Brochet, Manitoba are subject to 11 and nine ‘touches’, respectively.
Bricks and Mortar
Maintaining a physical retail presence in remote northern communities is significantly more costly than maintaining a retail presence in a southern community. Practically, initial construction costs in the north are higher and require significant logistical planning. Whereas upfront costs of a building investment in the south are about C$86 per square foot, it ranges between C$100 and C$155 per square foot in the north.
Warehousing requirements and related costs are also much greater in northern communities than in the south. Unlike southern retail operations that benefit from ‘just in time delivery’ of grocery retail goods, northern retailers must maintain a much greater amount of stock in the community and thus, require more warehousing space. In addition to upfront costs, warehouses must be properly maintained for product storage and a significant amount of space must be heated to prevent products from freezing. Such undertakings naturally increase the operating
costs of running a grocery retail business in the north.
Whereas a ratio of one square foot of warehousing space to six square feet of retailing space is typical for southern retailers, in the north, the ratio is typically one square foot of warehousing space for every one to three square feet of retailing space.
Relative to southern grocery retailers, geographic and climate limitations in the north limit the degree to which northern retailers can increase the use of reliable transportation in order to minimize inventory costs. Taking the modes of transportation as fixed then, the only trade-offs that northern retailers can engage in is between lowering warehousing needs at the expense of decreased availability of goods for their customers.
Although it is an extreme example, the impact of transportation costs on product prices in the north provides a
clear example of the importance of transportation and logistics efficiency for product prices and availability. While
the differences in transportation and logistics cost and efficiency are smaller between urban areas in the south,
differences certainly do exist and have corresponding impacts on product prices and availability in those areas.

121 January 24, 2018 The Calgary Goods Movement Strategy Prepared by Watt Consulting Group Ltd. for The City of Calgary
6.3.2 The economics of logistics
Section 6.2 noted that efficient and agile transportation and logistics chains benefit society by making a
wider variety of goods available at the lowest possible cost. Using a concrete example, this section
demonstrates the impact of reduced reliability in transportation and logistics chains on total logistics
costs and, more broadly, on consumer prices.
Figure 6-12 below illustrates the core components of firm-level logistics costs. This concept was initially
defined by Baumol and Vinod in 1970103 and further updated by other researchers such as Tyworth who
added sourcing decisions to the mix.104 The model and its concepts are elaborated in the example
below (Section 6.3.2.1). Baumol originally defined the model,105 where:
TAC Total annual cost
Q Order quantity
D Annual demand
v Unit price of the goods
w Holding cost expressed as a
percentage
A Unit cost of an order
t Time in days for transport
T Per unit transportation cost
S Safety stock
and,
1 Inventory carrying cost due to the
minimum EOQ
2 Order processing costs
3 In-transit carrying costs, including
the cost of capital and depreciation
while in transit
4 Direct transportation costs
5 Standing inventory costs as a result
of decreased reliability in
transportation and logistics
103 Baumol and Vinod, “An inventory Theoretic Model.”
104 Tyworth, “The Inventory Theoretic Approach.”
105 Adapted from Brady, Swan and Young, “Adopting Baumol’s inventory Theoretic,”4.

122 January 24, 2018 The Calgary Goods Movement Strategy Prepared by Watt Consulting Group Ltd. for The City of Calgary
𝑇𝐴𝐶 = (𝑄 ∗ 𝑣 ∗𝑤
2) + 𝐴 ∗ (
𝐷
𝑄) + (
𝑡
365∗ (𝐷 ∗ 𝑣 ∗ 𝑤) + (𝑇 ∗ 𝐷) + (𝑆 ∗ 𝑣 ∗ 𝑤)
Figure 6-12: Total logistics cost modelling at the firm level
6.3.2.1 Logistics costs – the strawberry example
Though Calgary, and more generally Alberta, are not a major production area of strawberries, farmers
do grow and market this fruit which is planted a year before an August harvest. As strawberries are
highly perishable, transportation and logistics can play a key role in getting them to market on time.
A numerical example of transporting strawberries from the farm to the retailer illustrates how decreased
reliability in transport and logistics chains impact total logistics costs. However, it is important to first
explain several concepts in the build-up to the example.
Total logistics costs are a component of the ‘total landed cost’ - that is, the total price of a product paid
by the end user (in this case, the price paid for one pound of strawberries). Figure 6-13 provides an
illustrative breakdown of the total landed cost of a strawberry ($3.99/lb).
The transportation and logistics cost component ($0.45) is described in Table 6-1 and in more detail
below.
1 2 3 4 5
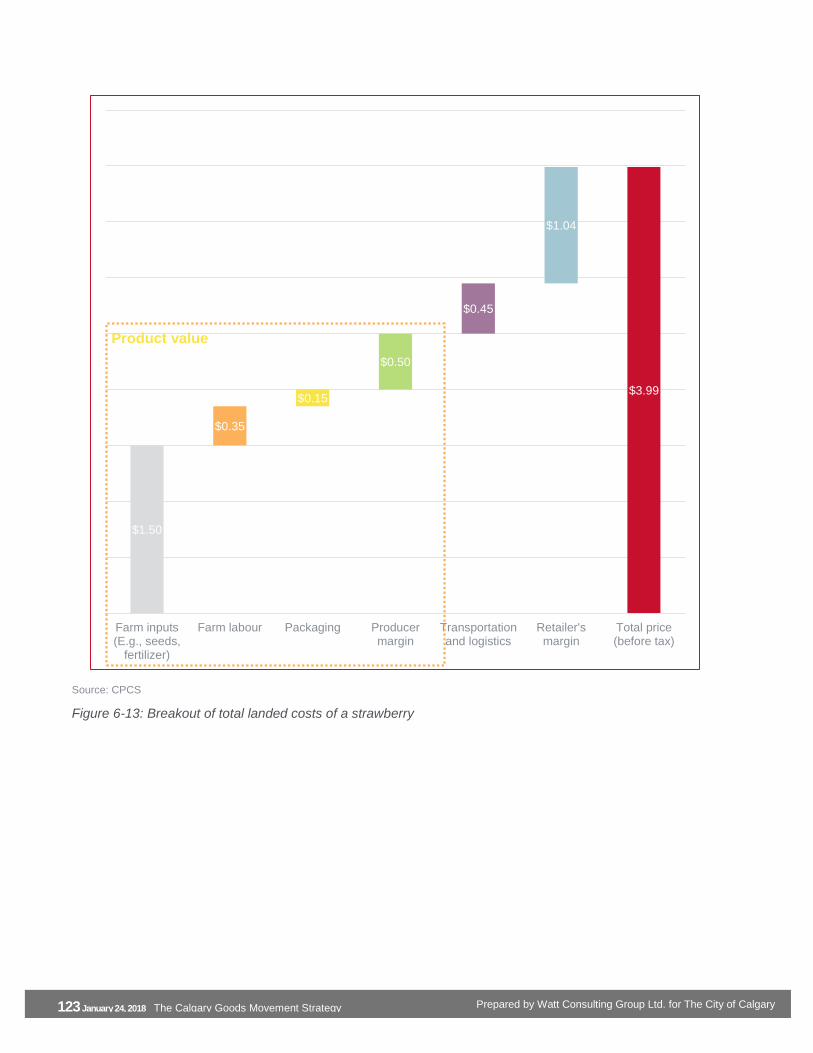
123 January 24, 2018 The Calgary Goods Movement Strategy Prepared by Watt Consulting Group Ltd. for The City of Calgary
Source: CPCS
Figure 6-13: Breakout of total landed costs of a strawberry
$1.50
$3.99
$0.35
$0.15
$0.50
$0.45
$1.04
Farm inputs(E.g., seeds,
fertilizer)
Farm labour Packaging Producermargin
Transportationand logistics
Retailer'smargin
Total price(before tax)
Product value

124 January 24, 2018 The Calgary Goods Movement Strategy Prepared by Watt Consulting Group Ltd. for The City of Calgary
Table 6-1: Product attributes in the example case
Product Attributes
Product value (per lb) $2.50
Cost of capital rate 10%
Rate of obsolescence Hyperbolic function
Customer service level (days) 0.5
1. Customer service level in this example is a function of transit time variability (in days) which is further explained below Source: CPCS
6.3.2.2 Product value
The product value is measured at the start of its journey from producer to customer. In Figure 6-13 the
cost inputs captured inside the dotted orange box reflect the product value that, in the example, equals
$2.50. In the total logistics cost model in Figure 6-12, it is the unit price of the goods (v) which is used to
calculate inventory carrying costs due to minimum EOQ, in-transit carrying costs and standing inventory
costs.
6.3.2.3 Cost of capital
Reflected as the holding cost expressed as a percentage (w) in Figure 6-12, the cost of capital in the
above example reflects the retailer’s financing cost. While in transit or in storage, strawberries do not
create any value for the retailer. However, the retailer must purchase the stock for sale using debt,
equity, internal funds or some combination of the three. The cost of capital impacts total logistics costs
namely carrying costs due to minimum EOQ, in-transit carrying costs and standing inventory costs per
Figure 6-12.
6.3.2.4 Rate of obsolescence
The rate of obsolescence refers to how quickly a product depreciates in value. Obsolescence can occur
for a number of reasons including physical wear and in the case of strawberries, perishability.
Under ideal cooling temperatures, strawberries can last up to 14 days106 with the rate of obsolescence
increasing as strawberries reach day 14. Thus, a hyperbolic rate of depreciation is used to apportion
total logistics costs due to obsolescence as it captures the increased rate of obsolescence as
strawberries reach their typical 14-day shelf life.
This increased rate of obsolescence is further captured in Figure 6-14, which provides an illustration of
the rate of obsolescence for strawberries over a 14-day period. It should be noted that 14 days is ideal
(under cooling temperatures at 0⁰ C) but can be shorter (e.g., three to eight days) under warmer
conditions.
106 USDA - Strawberry Information Fact Sheet

125 January 24, 2018 The Calgary Goods Movement Strategy Prepared by Watt Consulting Group Ltd. for The City of Calgary
The rate of obsolescence can be captured in the holding cost expressed as a percentage (w) in Figure
6-12. In this example, the logistics costs associated with the rate of obsolescence are calculated
separately, to illustrate the substantive impact of transit time variability for goods like strawberries that
exhibit hyperbolic rates of depreciation and have a short shelf life.
6.3.2.5 Customer service level
Customer service level refers to the retailer’s target of how often a product is in stock when a customer
is looking to purchase it. In the above example, variability in demand is held as constant given that the
example is isolating the impact of transit time variability. Volatile and uncertain demand also causes
inventory costs, but these inventory costs are not caused by transportation and logistics reliability or
efficiency.
The target customer service level reflects a balance of the costs or consequences of not having the
product in stock when a customer wants it and the incremental transportation and logistics costs
associated with higher customer service levels. Travellers consider analogous trade-offs when they
allow for longer times to travel to an airport to catch their flight (see Text Box – Catching your
flight – customer services level analogy).
For example, if a product has close substitutes, customers may be happy to choose a substitute
product if their first choice is not in stock. In this case the cost to the retailer of not having stocking is
low. On the other hand, if a product does not have substitutes and running out of stock means that the
customer seeks to purchase the product from a competitor, then the retailer may set a higher customer
service level. This is especially the case if the constant unavailability of a product results in customers
permanently switching to other retailers for future purchases. How high or low the customer service
level is set in either of these cases is also influenced by the transportation and logistics costs that are
incurred by meeting that customer service level.

126 January 24, 2018 The Calgary Goods Movement Strategy Prepared by Watt Consulting Group Ltd. for The City of Calgary
Source: CPCS
Figure 6-14: Remaining value of strawberries over a 14-day product life
In addition, a transit time variability of half a day
(per Figure 6-14) is set initially. This transit time
variability reflects the fact that travel times will
be variable and unpredictable due to factors
such as urban congestion.
As transit time variability increases, the retailer
will hold more safety stock, increase order lead
time, or a combination of both which increases
total logistics costs. In Section 6.3.4, changes
to transit time and transit time variability and its
impact on total logistics costs are explained.
0%
10%
20%
30%
40%
50%
60%
70%
80%
90%
100%
0.5 1
1.5 2
2.5 3
3.5 4
4.5 5
5.5 6
6.5 7
7.5 8
8.5 9
9.5 10
10
.5 11
11
.5 12
12
.5 13
13
.5 14
Rem
ain
ing
Valu
e
Days
14 day product life, beta = 0.8
Catching your flight – customer service level analogy
Just as retailers set customer service levels based in part on the consequences of not having a product in stock when a customer wants it, travellers also target on-time performance based in part on the consequences of being late.
For example, individuals travelling to the airport to catch a flight will typically target a very high level of on-time performance due to the consequences of missing a flight.
A typical trip to the airport may take an hour. However, traffic conditions may make the trip shorter or longer on other days. As a result, whether it’s done explicitly or implicitly, travellers build a buffer time into their trip to the airport. While the average trip may take an hour, travellers may add extra time due to transit time variability.
The added buffer time allows a given traveller to arrive at the airport on time very close to 100% of the time. This is analogous to a retailer adding an extra half a day of lead time for shipments to ensure that products are available to its customers close to 100% of the time.

127 January 24, 2018 The Calgary Goods Movement Strategy Prepared by Watt Consulting Group Ltd. for The City of Calgary
6.3.3 Total logistics costs
Using the attributes listed in Table 6-2, as well as the truck service level, costing and annual strawberry
demand assumptions below, the total logistics costs can be calculated.
Table 6-2: Annual demand and truck level of service and costing assumptions
Assumptions
Annual demand (lb) 12,000
Unit cost of the order 0.25
Unit price of the good (v) ($) 3.99
Per unit transportation cost (T) ($) 0.25
Transit time (days) 1
Transit time variability (days) 0.5 Source: CPCS
Figure 6-15 and Figure 6-16 summarize the costs of each component of total logistics costs per annum
and per pound of strawberries sold during the year, respectively, per the equation in Figure 6-12. Note
that in-transit carrying costs come in two forms: in-transit carrying costs due to financing and in-transit
carrying costs due to obsolescence.
Source: CPCS
Figure 6-15: Total annual logistics costs
$3000
$60 $13
$1122 $1200
$7
$5402
(1) Inventorycarrying cost
due to EOQ ($)
(2) Orderprocessing
Cost ($)
(3) In-transitcarrying cost
(cost of capital)($)
(3) In-transitcarrying cost
(obsolescence)($)
(4) Directtransportation
costs
(5) Standinginventory costsfrom increased
transportvariability ($)
Total logisticscosts ($)

128 January 24, 2018 The Calgary Goods Movement Strategy Prepared by Watt Consulting Group Ltd. for The City of Calgary
Source: CPCS
Figure 6-16: Total annual logistics costs per pound of strawberries sold
As evidenced in the figures above, apart from (1) inventory carrying costs due to EOQ, (3) in-transit
carrying cost (obsolescence) forms a significant portion of total logistics costs. This is because of the
high rate of obsolescence that strawberries exhibit.
6.3.4 Implications of unreliability
Taking the above analysis and illustrative cost estimates as the base case, decreased transportation
reliability can have two impacts to total logistics costs, namely through (1) increased transit time (one
day in the base case) and (2) transit time variability (half a day in the base case).
Table 6-3 provides indicative scenarios in order to illustrate the impact of decreased transportation
reliability. These are hypothetical scenarios. They represent different combinations of transit time and
transit time variability.
Table 6-3: Transportation reliability scenarios
Scenario Transit Time
(days)
Transit time
variability (days)
Base case 1 0.5
Scenario one 1.5 0.5
Scenario two 1.5 1
Scenario three 2 1
Scenario four 2 1.5
$0.250
$0.005 $0.001
$0.094 $0.100
$0.001
$0.450
(1) Inventorycarrying cost
due to EOQ ($)
(2) Orderprocessing
Cost ($)
(3) In-transitcarrying cost
(cost of capital)($)
(3) In-transitcarrying cost
(obsolescence)($)
(4) Directtransportation
costs
(5) Standinginventory costsfrom increased
transportvariability ($)
Total logisticscosts ($)

129 January 24, 2018 The Calgary Goods Movement Strategy Prepared by Watt Consulting Group Ltd. for The City of Calgary
Updated transit times and transit time variability in scenarios one to four were inputted into the logistics
cost model (Figure 6-17) while holding other attributes and assumptions as constant.
Going from the base case scenario through to scenario four, Figure 6-17 summarizes the resulting
impacts to total logistics costs (by components) as transit time and/or transit time variability increase.
Notably, there is a marked increase in (3) transit carrying cost, both as a function of the cost of capital
and obsolescence, and in (5) standing inventory costs from increased transport variability.
Source: CPCS
Figure 6-17: Total annual logistics costs by scenario
$3000 $3000 $3000 $3000 $3000
$60$60
$60$60 $60
$13 $20 $20 $26 $26
$1122
$1545
$1995
$2477
$2992
$1200
$1200 $1200 $1200 $1200
$7 $7 $13 $13 $20
$5402
$5831
$6288
$6776
$7298
Base case Scenario one Scenario two Scenario three Scenario four
(1) Inventory carrying cost due to EOQ ($)
(2) Order processing cost ($)
(3) In-transit carrying cost (cost of capital) ($)
(3) In-transit carrying cost (obsolescence) ($)
(4) Direct transportation costs
(5) Standing inventory costs from increased transport variability ($)
Total logistics costs ($)

130 January 24, 2018 The Calgary Goods Movement Strategy Prepared by Watt Consulting Group Ltd. for The City of Calgary
$3.99 $4.03 $4.06 $4.10 $4.15
Assuming that in each of these scenarios that the additional costs are passed on to the consumer,
Figure 6-18 shows how the final price of strawberries increases from $3.99.
Source: CPCS
Figure 6-18: Impact of unreliability on the price of strawberries
The net impact is that an increase in average transit times or decrease in transit time reliability adds
costs to the final product price. The impact might seem small (an increase of approximately 4% from
the base case to scenario four). If the same factors that increased transit times and reliability in the
examples presented, other consumer goods will also see price increases. The increases in transit times
and decreases in reliability would then have broad impacts for consumer price inflation in the affected
areas.
$1.50 $1.50 $1.50 $1.50 $1.50
$0.35 $0.35 $0.35 $0.35 $0.35
$0.15 $0.15 $0.15 $0.15 $0.15
$0.50 $0.50 $0.50 $0.50 $0.50
$1.04 $1.04 $1.04 $1.04 $1.04
$0.45 $0.49 $0.52 $0.56 $0.61
$0.00
$0.50
$1.00
$1.50
$2.00
$2.50
$3.00
$3.50
$4.00
$4.50
0 Scenario one Scenario two Scenario three Scenario four
Farm inputs (E.g., seeds, fertilizer) Farm labour
Packaging Producer's margin
Retailer's margin Transportation and logistics costs

131 January 24, 2018 The Calgary Goods Movement Strategy Prepared by Watt Consulting Group Ltd. for The City of Calgary
6.3.5 Summary of transportation and logistics costs
The discussion above provided examples of how transportation reliability impacts total logistics costs.
To the extent that retailers can pass increased logistics costs due to decreased transportation reliability
onto consumers, urban areas will face higher priced goods, although the extent to which retailers can
do this depends, in part, on the elasticity of demand for the related good. Consumers may elect to
consume the same product at higher prices or find cheaper substitutes. In either case, there is a loss in
consumer utility.107
Generally, although specific impacts related to any given product, shipper or location will vary, the key
takeaway that is true in all cases is that when transit times are longer or less reliable, the final price of
goods will be higher or the variety of goods that are available in a given geographic area will decrease.
By living in a rapidly growing urban area with strong transportation links, Calgarians have benefited
from transportation and logistics efficiencies and the more competitive product prices and a greater
variety of goods that are available to them. This can be seen in the many vibrant areas in the city where
new and different retail establishments and restaurants have proliferated. To continue to have access
to these products and continue their rate of proliferation, it is important that The City continue to enable
the conditions that are within its control to further enhance transportation and logistics efficiency in and
around Calgary. Of particular importance is the need to help minimize first and last mile (or kilometre)
travel times and improve travel time reliability – that is, improving the first and last stage of delivery from
the manufacturer to the warehouse and from the distribution centre to the purchaser’s residence.
107 Customer utility is an economic term that is used to describe the total satisfaction that is derived from
consuming goods and services.

132 January 24, 2018 The Calgary Goods Movement Strategy Prepared by Watt Consulting Group Ltd. for The City of Calgary
7 Snapshot: what we’ve heard so far A short survey was distributed to participants at the three February 2017 project launch meetings.108
The survey asked respondents to select the five most important issues from a list. The findings are
summarized in Table 7-1, which lists the issues in the order in which they presented, along with the
number of times they were cited. The three most important issues are highlighted in yellow, with the
next most important issues highlighted in grey.
Table 7-1: Summary of key issues – project launch survey
Which of the following are the most important goods movement issues in or around Calgary
today? Pick the Top 5 issues and rank them, 1 = most important.
13 Congestion on provincial highways, in or around Calgary
21 Congestion on other roads, in or around Calgary
1 Inadequate road access to rail terminals or to the airport
4 Inadequate road access to shippers / receivers
2 Inadequate intercity connectivity (road, rail or air)
3 Need for improved / additional transportation links (where?)
• Glenmore (east) / Highway interchange east of Calgary
3 Supply of zoned and serviced employment and industrial lands
6 Inconsistent truck route regulations / designations
11 Changing logistics, retailing and/or distribution patterns (e.g., e-commerce)
17 Conflicts with other traffic, including transit, pedestrians and cyclists
9 Trucks moving through residential neighbourhoods or other sensitive areas
10 Traffic signal timing / coordination on arterials
12 Inadequate space for truck loading / parking, on-street or off-street
5 Operating costs for goods movement
2 Reducing greenhouse gas (GHG) emissions / air pollutants
9 Keeping up with emerging technologies and/or regulatory standards
5 Bottlenecks (where?)
• Country Hills and 112 Avenue
• NB Deerfoot to WB 16 Avenue
• Major Arteries
• Deerfoot and Anderson
• Deerfoot and Glenmore
2 Other (please describe)
• Urban sprawl – residential & industrial in the region / idle time at warehouse
• Access points (52 Street and Glenmore Trail)
The most important issues are congestion on roads and on provincial highways in and around Calgary and
conflicts with other road users. Other important issues included inadequate loading and parking space for
108 See Section 1.5.1 for further information.

133 January 24, 2018 The Calgary Goods Movement Strategy Prepared by Watt Consulting Group Ltd. for The City of Calgary
trucks, changing logistics, retailing and distribution patterns, traffic signal timing and coordination on
arterials, trucks moving through residential or other sensitive areas and keeping up with emerging
technologies and regulatory standards. Respondents also identified bottlenecks at various locations,
including three along Deerfoot Trail. Taken
together, this early snapshot suggests that most of the issues of importance are local and solutions can be
proposed through the Strategy.
Respondents were given an opportunity to provide additional comments regarding the Strategy. These
comments are summarized in Table 7-2. In contrast to the issues, several respondents looked at long-range
considerations. Overall, participants at the project launch meetings welcomed the GMS and looked forward
to continuing collaboration with The City.
Table 7-2: Additional comments – project launch survey
Please add any comments about the Goods Movement Strategy in the space below.
• Importance of connecting regional strategies for transportation land use and economic development to those of The City of Calgary
• Need to take into account future technologies & how that will impact roads • Need to reconsider road bylaws in industrial areas for example shared driveways limited all turns
access • Right turns in & out for trucks into industrial areas • Industrial areas don’t require “complete streets” i.e., sidewalks on both sides of road • I can assist in engagement from industry. • So many important topics, we look forward to meeting in the future. Logistics and goods
movement are key to Calgary and the province. Great start! Look forward to working with you! • Goods Movement Strategy needs to be regional and long term vision should include surrounding
communities • Look into future not fix only the current as the challenge will always be “catch up” • Difficult to undertake study without in depth collaboration with the Calgary Regional Partnership.
Source: Summary prepared by The City of Calgary
•

134 January 24, 2018 The Calgary Goods Movement Strategy Prepared by Watt Consulting Group Ltd. for The City of Calgary
8 Appendices
8.1 Appendix A – Visions for goods movement strategy
Table A-1 summarizes how several other jurisdictions have described their vision for goods movement,
further to the discussion in Section 2.2.2. The examples are drawn from other jurisdictions in Canada, the
United States and overseas. The figure also describes what each example potentially contributes to the
definition of a goods movement vision for the GMS.109
Table A-1: Vision Statements from other jurisdictions
Source Potential Vision elements Relevance to the GMS
Edmonton Goods Movement Strategy, 2014.110
“The Edmonton region is a major manufacturing, logistics and distribution centre and a hub for the oil and gas industry in Alberta. … It is vital to the economy that commercial transportation moves efficiently through the city and region. Efficiency means the provision of a road network that connects all major goods-generating activity centres and intermodal terminals with each other and with the major highway system directly, safely and with minimal delays, minimizing truck intrusions through sensitive areas.”
Recent example of a goods movement strategy in Alberta. Adds connectivity and avoidance of sensitive areas.
Vancouver Moving the Economy, A Regional Goods Movement Strategy for Metro Vancouver (draft), 2015111
“As a region, we maintain our global position as one of the best places in the world to live and do business because we deliver goods and services efficiently and reliably in a way that meets the needs of our growing economy and protects the environment, public health and safety, and the livability of our neighbourhoods.“
Relates efficiency and reliability of goods movement to quality of life, the environment, public health and safety.
Edmonton Goods Movement Strategy, 2014.112
“The Edmonton region is a major manufacturing, logistics and
Recent example of a goods movement strategy in Alberta.
109 Material excerpted from Backgrounder on Goods Movement, prepared by the consultant team for the Metrolinx
Legislated Review of the Regional Transportation Plan, Toronto, July 2016.
110 Edmonton Goods Movement Strategy, City of Edmonton, June 2014.
111 Moving the Economy, A Regional Goods Movement Strategy for Metro Vancouver, draft, TransLink, New
Westminster, BC, January 2015. (Draft. Not for public release.)
112 Edmonton Goods Movement Strategy, City of Edmonton, June 2014.

135 January 24, 2018 The Calgary Goods Movement Strategy Prepared by Watt Consulting Group Ltd. for The City of Calgary
distribution centre and a hub for the oil and gas industry in Alberta. … It is vital to the economy that commercial transportation moves efficiently through the city and region. Efficiency means the provision of a road network that connects all major goods-generating activity centres and intermodal terminals with each other and with the major highway system directly, safely and with minimal delays, minimizing truck intrusions through sensitive areas.”
Adds connectivity and avoidance of sensitive areas.
Edmonton Goods Movement Strategy, 2014.113
“The Edmonton region is a major manufacturing, logistics and distribution centre and a hub for the oil and gas industry in Alberta. … It is vital to the economy that commercial transportation moves efficiently through the city and region. Efficiency means the provision of a road network that connects all major goods-generating activity centres and intermodal terminals with each other and with the major highway system directly, safely and with minimal delays, minimizing truck intrusions through sensitive areas.”
Recent example of a goods movement strategy in Alberta. Adds connectivity and avoidance of sensitive areas.
Vancouver Moving the Economy, A Regional Goods Movement Strategy for Metro Vancouver (draft), 2015114
“As a region, we maintain our global position as one of the best places in the world to live and do business because we deliver goods and services efficiently and reliably in a way that meets the needs of our growing economy and protects the environment, public health and safety, and the livability of our neighbourhoods.“
Relates efficiency and reliability of goods movement to quality of life, the environment, public health and safety.
Peel Long Range Transportation Plan UpdateI, 2012.115
“Peel Region will have a safe, convenient, efficient, mulit-modal, sustainable and integrated transportation system that supports a vibrant economy,
Vision from Canada’s largest freight hub, adding in additional network attributes (multi-modal, safety, convenience and efficiency) and identifies natural
113 Edmonton Goods Movement Strategy, City of Edmonton, June 2014.
114 Moving the Economy, A Regional Goods Movement Strategy for Metro Vancouver, draft, TransLink, New
Westminster, BC, January 2015. (Draft. Not for public release.)
115 Peel Long Range Transportation Plan Update 2012, Final Draft, Region of Peel, Brampton, 2012.

136 January 24, 2018 The Calgary Goods Movement Strategy Prepared by Watt Consulting Group Ltd. for The City of Calgary
respects the natural and urban environment, meets the diverse needs of residents and contributes to a higher quality of life.”
and urban environments distinctly. Adds community attributes (vibrancy, diversity).
Hamilton Goods Movement Study, 2005116
Short Term – 1-5 years (selected) “All land use planning decisions adequately consider direct and indirect impact on the ability for businesses to move goods and acknowledge the critical importance of supporting and promoting industry as the major generator of employment in Hamilton.” “Programs to prepare the workforce to respond to existing and future job opportunities in goods movement and related fields are being implemented by governments, educators and industry working together.” Medium Term – 5-10 years (selected) “Industries that rely on just-in-time delivery are moving to Hamilton to take advantage of the availability of 24 hour operations at air, marine and intermodal facilities, placing Hamilton at an advantage compared to its neighbours. Sufficiently large employment lands are assembled, serviced and ready for these new industries comprising a variety of economic clusters.” Long Term – 10-15 years (selected) “Hamilton is benefiting to full advantage from its transportation network and strategic location which enable goods movement providers, industry and businesses exploit the many cost and time effective transportation modes available while minimizing energy costs and supporting environmental goals.”
Vision from neighbouring city, specific to goods movement. Brings in relationship with land use and labour force, and adds network attributes (seamless, integrated). Builds on locational and infrastructure attributes. Unique in that it evolves the vision over time. The vision and the goods movement component of Hamilton’s Transportation Master Plan were reviewed as part of the TMP update. The review did not result in broad changes in direction.
Halton Goods Movement Strategy, 2015117
“The goods movement strategy will support a network that is safe,
Recent example of a goods movement strategy. Focuses on
116 Excerpted from Hamilton Goods Movement Study, Final Report – Executive Summary, City of Hamilton, Hamilton,
June 2005.
117 Halton Goods Movement Strategy, Final Study Report (draft), Halton Region, January 2015. (Draft final. Not for
public release.)

137 January 24, 2018 The Calgary Goods Movement Strategy Prepared by Watt Consulting Group Ltd. for The City of Calgary
economical, reliable, efficient, and environmentally sustainable. “Within Halton, goods movement is widely recognized as an essential contributor to the economic, social, and environmental well-being of residents and businesses. “
the transportation network. Links operational, economic and sustainability concepts, as well as recognizing the interests of public and private sector perspectives.
Southern California, On the Move, Southern California Delivers the Goods, 2012.118
“A world-class, coordinated Southern California goods movement system that accommodates growth in the throughput of freight to the region and nation in ways that support the region’s economic vitality, attainment of clean air standards, and the quality of life for our communities.”
Recognizes role of trans-shipment (port) activities in local economy. Links goods movement to air quality, as well as to economic and community vitality.
Philadelphia – Camden, Connections 2040, 2013 and 2020 Freight Vision, no date119
Connections 2040 (TMP) Connections 2040 envisions a seamless multi-modal passenger and freight system that is safe; convenient; sufficient in its capacity; attractive and affordable to its users; accessible and equitable for all citizens and visitors to locations throughout the region; and incorporates sound growth management, urban revitalization and environmental and economic competitiveness planning principles. 2020 Freight Vision (selected) “In the Delaware Valley, the region boasts the nation's finest goods movement system without qualification. Freight speeds efficiently and safely to ultimate destinations by plane, railroad, ship, and truck. Facilities form a cohesive whole and connections between different modes of transportation are seamless. Freight and passenger transportation needs are skillfully meshed together. Philadelphia is synonymous with intermodalism and is the recurring subject of international scrutiny and inquiry.
Example of a large American metropolitan area that has long-established goods movement planning program. Long-range plan adds network attributes (sufficiency in capacity, attractiveness, affordability, equitable accessibility). Freight Vision is widely cited as an America prototype. Adds network attributes (network cohesion, meshing with passenger network). Further defines labour needs (talented, skilled). Notes that deliberate actions are required to achieve the vision, as well as cooperation between the public and private sectors.
118 On the Move, Southern California Delivers the Goods, Final Report, Southern California Association of
Governments, Los Angeles, December 2012.
119 Connections 2040 Plan for Greater Philadelphia, Delaware Valley Regional Planning Commission, Philadelphia,
July 2013; and 2020 Freight Vision, Delaware Valley Regional Planning Commission, Philadelphia, Pennsylvania, no date.

138 January 24, 2018 The Calgary Goods Movement Strategy Prepared by Watt Consulting Group Ltd. for The City of Calgary
“The region's status as a freight mecca is not accidental. Public and private sector cooperation is unparalleled. Investment in physical and procedural improvements, while judicious, is sufficient and expedient. The available labor pool is talented, highly skilled, and dedicated.”
Chicago GO TO 2040120 “The increased investment in our freight system called for in GO TO 2040 will improve economic competitiveness by reducing travel delays and pollution and by improving safety. The private sector will fund some improvements through the normal course of business, but public investment is needed to promote economic growth as well as residents’ health, safety, and welfare.”
Adds economic competitiveness as a key outcome of an improved freight system.
Columbus, Ohio 2012-2035 Metropolitan Transportation Plan, 2013 update121
“Vision [for the MTP’s freight program]: Economic development will be advanced through freight transportation infrastructure, investment and policies. The planning process will place emphasis on economic development. Transportation policies, regulations and projects will support the needs of the global supply chain. The freight network is recognized as the cornerstone of efforts to foster a flourishing regional economy.”
Identifies economic development as the desired focus. Directly links improvements in the goods movement network to support this.
Portland, Oregon Central City Sustainable Freight Strategy, 2012122
“Increase efficient movement of goods while supporting a green economy with family wage jobs and sustaining Portland’s status as a healthy, thriving community.”
Ties efficiency in goods movement to Portland’s sustainability objectives and to the types of jobs it wants in its core areas (‘green economy’). Adds community attributes (healthy, thriving).
Houston-Galveston Area Council Regional Goods Movement Plan, 2013123
“The vision for the goods movement system in the [Houston-Galveston] region is to be a connected, multi-modal, world-class system that enhances the region’s economic vitality while supporting the mobility and livability needs of its citizens.”
Recent example of large American metropolitan area that has global connections (in this case, through the Port of Galveston).
120 GO TO 2040 Comprehensive Regional Plan, Chicago Metropolitan Agency for Planning, Chicago, October 2010.
121 2012-2035 Metropolitan Transportation Plan, Mid-Ohio Regional Planning Commission, Columbus, Ohio, 9 May
2013 update and amendment.
122 City of Portland Central City Sustainable Freight Strategy, Report and Recommendations, City of Portland,
Portland, Oregon, October 2012.
123 Regional Goods Movement Plan, Final Report, Houston-Galveston Area Council, Houston, Texas, June 2013.

139 January 24, 2018 The Calgary Goods Movement Strategy Prepared by Watt Consulting Group Ltd. for The City of Calgary
Auckland Regional Freight Strategy, 2006124
“Freight movement is recognised as an essential contributor to the economic, social and cultural well-being of all Aucklanders, and is facilitated by a transport system where:
• People and goods are able to move when necessary
• Transport supports vibrant town centres
• Streets are important civic spaces
• Getting around by all modes is integrated, safe and effective
• People have choices which enable them to participate in society
The environment and human health are protected.”
Explicitly states importance of goods movement to the overall wellbeing of residents. Recognizes role of transportation in developing town centres and of roads as part of the urban fabric. Recognizes need for choices.
8.2 Appendix B – YYC air cargo facilities
This appendix describes the air cargo facilities at Calgary International Airport. 125 Additional information
regarding the airport can be found in Section 4.3.3.
Equipment and Services
• Main deck loader capability to 60,000 lbs.
• Crane accessibility
• On-site Canadian Food Inspection Agency and veterinary services
• 24/7 Canada Customs operations
• Third-party service providers (cargo/ramp handlers)
• Code F runway capability
• Dedicated de-icing and in-ground fuelling
McCall North Trade Park (Apron II)
• 142,687 sq. ft. airside warehouse space
• 27,997 sq. ft. airside office space
• Airside/groundside access
• Airside perishable facilities (cooler and freezer)
• On-site freight forwarding and brokerage
• 500,000 sq. ft. dedicated cargo apron
• Nose tethers and tail stands
• In-ground fuelling
• Quick turn-around platform
124 Auckland Regional Freight Strategy, Auckland Regional Council, Auckland, New Zealand, December 2006.
125 Calgary International Airport, Facilities & Equipment.

140 January 24, 2018 The Calgary Goods Movement Strategy Prepared by Watt Consulting Group Ltd. for The City of Calgary
• On-site crate building operations
• 20 ft./10 ft. ground level scales
• Airside Ground Support Equipment and Unit Load Device storage area
Deerfoot South Trade Park (Apron VII)
• 512,800 sq. ft. airside warehouse space
• 36,200 sq. ft. airside office space
• 500,000 sq. ft. dedicated cargo apron
• Designated for integration with freight forwarding
• Current tenants include FedEx, Purolator and UPS
• Nose tethers
Deerfoot North Trade Park (Apron IX)
• 125,000 sq. ft. of warehouse space
• 28,000 sq. ft. of office space
• Easy airside and highway access
• 24/7 Canada Customs service
• Airside Ground Support Equipment and Unit Load Device storage
• Apron expansion: 519,897 sq. ft.
• 98,089 sq. ft. additional airside warehouse, adjacent to Apron IX
• 50,000 sq. ft. additional office space, adjacent to Apron IX
Specialized Cargo Facility (on Apron IX)
• Total area of 30,000 sq. ft.
• Canada Border Services Agency and Canadian Food Inspection Agency offices on-site
• 12 stables and 21 kennels
• Two custom loading corrals
• Load Master room
• Dog run
• Two 20 ft. by 10 ft. floor scales
• Radiant heating and drainage
Air Service Cargo Partners
• WestJet: largest hub operation in Canada with belly-hold network
• Air Canada: hub operation – domestic and international – with belly-hold network
• International belly-hold opportunities: British Airways, KLM, American, Delta and United
• Alberta Gateway for DHL, FedEx, Purolator and UPS
• Cargojet operations – scheduled nationwide freighter network
• Scheduled international freighter service to both Europe and Asia
o Cargolux: Three-weekly B747 - 8-F flights
o Cathay Pacific Cargo: Two-weekly B747 - 8-F flights
• Heavy lift and charter operators
Cargo Area Overview

141 January 24, 2018 The Calgary Goods Movement Strategy Prepared by Watt Consulting Group Ltd. for The City of Calgary
Cargo Apron
• 1,685,000 sq. ft. dedicated cargo apron area
• An additional 519,897 sq. ft. on Apron IX under construction
Cargo Facilities with Airside Access
• Total: 729,871 sq. ft.
• Apron II: 175,871 sq. ft.
• Apron VII: 429,000 sq. ft.
• Apron IX: 125,000 sq. ft. (additional space under construction: 98,089 sq. ft.)